Bracing Requirements of Cold-Formed Steel Cee-Studs .../media/Files/SMDI/Construction/CFSD -...
193
Bracing Requirements of Cold-Formed Steel Cee- Studs Subjected to Axial Compression RESEARCH REPORT RP04-1 DECEMBER 2004 REVISION 2006 research report American Iron and Steel Institute Commit t ee on Specifications for the Design of Cold-Formed Steel Structural Members
Transcript of Bracing Requirements of Cold-Formed Steel Cee-Studs .../media/Files/SMDI/Construction/CFSD -...

re
sear
ch re
port
Committee on Specif ications
for the Design of Cold-Formed
Steel Structural Members
American Iron and Steel Institute
Bracing Requirements of Cold-Formed Steel Cee-Studs Subjected to Axial Compression
R E S E A R C H R E P O R T R P 0 4 - 1 D E C E M B E R 2 0 0 4 R E V I S I O N 2 0 0 6

The material contained herein has been developed by researchers based on their research findings. The material has also been reviewed by the American Iron and Steel Institute Committee on Specifications for the Design of Cold-Formed Steel Structural Members. The Committee acknowledges and is grateful for the contributions of such researchers.
The material herein is for general information only. The information in it should not be used without first securing competent advice with respect to its suitability for any given application. The publication of the information is not intended as a representation or warranty on the part of the American Iron and Steel Institute, or of any other person named herein, that the information is suitable for any general or particular use or of freedom from infringement of any patent or patents. Anyone making use of the information assumes all liability arising from such use.
Copyright 2004 American Iron and Steel Institute Revised Edition Copyright 2006 American Iron and Steel Institute
BRACING REQUIREMENTS OF COLD-FORMED STEEL CEE-STUDS SUBJECTED TO AXIAL COMPRESSION
Project # 4910 4504 847 12
Perry S. Green Thomas Sputo
Viswanath Urala
A REPORT PRESENTED TO THE AMERICAN IRON AND STEEL INSTITUTE AND THE
STEEL STUD MANUFACTURERS ASSOCIATION
December 2004

ii
ACKNOWLEDGMENTS
This research was funded by the American Iron and Steel Institute (AISI) and the
Steel Stud Manufacturers Association (SSMA). Test specimens materials were donated
by SteelCon and Dietrich Industries. This research was conducted at the Structures
Testing Laboratory, University of Florida, Gainesville, FL.
iii
TABLE OF CONTENTS Page ACKNOWLEDGMENTS .................................................................................................. ii
LIST OF TABLES............................................................................................................. vi
LIST OF FIGURES ......................................................................................................... viii
EXECUTIVE SUMMARY ............................................................................................. xiv
CHAPTER 1 INTRODUCTION ........................................................................................................1
1.1 General...............................................................................................................1 1.2 Objectives of Research ......................................................................................1 1.3 Scope of Research..............................................................................................3
2 LITERATURE REVIEW .............................................................................................6
2.1 General...............................................................................................................6 2.2 Buckling of Columns .........................................................................................7
2.2.1 Elastic Buckling ........................................................................................7 2.2.2 Inelastic Buckling .....................................................................................8 2.2.3 Local Buckling and Distortional Buckling ...............................................9
2.3 Bracing Stiffness and Strength.........................................................................11 2.3.1 Column with Concentric Axial Load and an Immovable Point Support at
Mid-height........................................................................................................12 2.3.2 Column with Concentric Axial Load and an Elastic Lateral Support at
Mid-height........................................................................................................13 2.4 Long Column Tests..........................................................................................19 2.4 AISC-LRFD Specification...............................................................................20 2.5 AISI Specification for Cold-Formed Steel ......................................................22
3 DESCRIPTION OF EXPERIMENTAL STUDY ......................................................33
3.1 Introduction......................................................................................................33 3.2 Objectives of Experimental Tests ....................................................................34 3.3 Material Properties of Test Specimens ............................................................34 3.4 As-Built Dimensions of the Test Specimens ...................................................35 3.5 Measured Geometric Imperfections of the Test Specimens ............................36

iv
3.5.1 Global Imperfections ..............................................................................36 3.5.2 Cross-Sectional Imperfections ................................................................37
3.6 Test Setup and Test Procedure for Single Column Axial Load Tests .............38 3.6.1 Test Specimens of Single Column Axial Load Tests .............................38 3.6.2 Test Frame for Single Column Axial Load Tests ...................................38 3.6.3 Instrumentation for Single Column Axial Load Tests............................39 3.6.4 Test Procedure of Single Column Axial Load Tests ..............................39
3.7 Test Setup and Test Procedure for Bridging Tests ..........................................40 3.7.1 Test Specimens of Bridging Tests ..........................................................40
3.7.1.1 Screwed-Screwed (SS) Connection: .............................................41 3.7.1.2 Welded-Welded (WW) Connection: .............................................41 3.7.1.3 Direct-Welded (DW) Connection: ................................................41
3.7.2 Test Fixture for Bridging Tests...............................................................42 3.7.3 Instrumentation .......................................................................................43 3.7.4 Out-of-Plane Loading Test Procedure ....................................................44 3.7.5 In-Plane Loading Test Procedure............................................................44
4 EXPERIMENTAL RESULTS AND EVALUATION...............................................61
4.1 Single Column Axial Load Test Results..........................................................61 4.1.1 Bracing Strength and Stiffness................................................................62 4.1.2 Evaluation of Experimental Observations ..............................................64
4.1.2.1 Effect of brace stiffness on axial load capacity.............................68 4.1.2.2 Effect of brace stiffness on buckling type and mode ....................71 4.1.2.3 Effect of cross-sectional dimensions of cee-studs.........................72 4.1.2.4 Effect of experimental load on the brace stiffness and strength ...73 4.1.2.5 Effect of brace stiffness on lateral displacement...........................74 4.1.2.6 Effect of brace stiffness on effective length of columns ...............74 4.1.2.7 Effect of brace strength on axial capacity .....................................75 4.1.2.8 Other effects ..................................................................................75
4.2 Bridging Test Results.......................................................................................77 4.2.1 Bridging Connection Strength and Stiffness...........................................77 4.2.2 Observations of the Out-of-Plane Experimental Tests ...........................79 4.2.3 Observations of the In-Plane Experimental Tests...................................80 4.2.4 Observed Bridging Connection Failures.................................................82
4.2.4.1 SS type connection ........................................................................82 4.2.4.2 WW type connection.....................................................................82 4.2.4.3 DW type connection......................................................................83
4.3 Separation of Brace Forces in Flexural and Torsional Components ...............83 4.4 Summary of Experimental Observations .........................................................85
5 ANALYTICAL EVALUATION..............................................................................147
5.1 Analytical Load Capacity of Unbraced and Fully Braced Studs ...................147 5.2 Analytical Bridging Connection Stiffness of a Flexible Bracing ..................149
5.2.1 Initial Flexural Stiffness of the Bracing Connection ............................149 5.2.1.1 SS type connection ......................................................................151
v
5.2.1.2 WW type connection...................................................................152 5.2.1.3 DW type connection....................................................................152
5.2.2 Initial Torsional Stiffness of the Bracing Connection ..........................153 5.3 Total Stiffness of the Bridging Connection ...................................................154
5.3.1 Initial Flexural Stiffness........................................................................154 5.3.2 Initial Torsional Stiffness......................................................................155
6 CONCLUSIONS AND DESIGN RECOMMENDATIONS ...................................168
6.1 General Conclusions and Recommendations.................................................168 6.2 Design Recommendations .............................................................................171
LIST OF REFERENCES.................................................................................................173

vi
LIST OF TABLES
Table page 3.1 As-built Material Properties from the Tension Coupon Tests .................................46
3.2 As-Built Cross-Sectional Dimensions of Test Specimens .......................................47
3.3 Initial Geometric Imperfections ...............................................................................50
3.4 Average As-Built Geometric Dimensions of Each Stud Series ...............................51
3.5 Average As-Built Geometric Dimensions of Each Stud Series ..............................51
4.1 Proposed Test Matrix for the Single Column Axial Load Tests ..............................88
4.2 Actual Test Matrix of the Single Column Axial Load Tests....................................89
4.3 Nominal Properties of the Test Specimens Using AISIWIN Program ...................90
4.4 Average As-built Properties of the Test Specimens Using AISIWIN Program.......91
4.5 Calculated Brace Stiffness and Total Brace Stiffness of the Test Specimens..........92
4.6 Summary of Experimental Test Results for Test Specimens ...................................94
4.7 Required Brace Stiffness Based on Pmax ..................................................................95
4.8 Effective Length Factors Based on Pmax...................................................................96
4.9 Measured Values of Brace Force and Mid-height Displacement at Pmax.................97
4.10 Calculated Values of Brace Force and Mid-height Displacement at Pmax .............100
4.11 Proposed Test Matrix for Bridging Connection Tests ...........................................102
4.12 Bridging Test Results for Out-of-Plane Loading ...................................................103
4.13 Initial Torsional Stiffness of the Lower Bound Values of Out-of-Plane Tests ......104
4.14 Bridging Test Results for In-Plane Loading ..........................................................106
4.15 Initial Flexural Stiffness of the In-Plane Tests......................................................107

vii
4.16 Experimental Initial Stiffness of the In-Plane Load Tests .....................................109
4.17 Experimental Initial Stiffness of the Out-of-Plane Load Tests ..............................109
4.18 Maximum Flexural and Corresponding Torsional Brace Force.............................110
4.19 Maximum Torsional and Corresponding Flexural Brace Force.............................111
5.1 Axial Load Capacities of Test Specimens Using AISI (1999) MathCAD Worksheets .............................................................................................................157
5.2 Comparison of Initial Flexural Stiffness of the In-Plane Tests ..............................158
5.3 Comparison of Initial Torsional Stiffness of the In-Plane Tests ............................159
5.4 Total Flexural Stiffness of the Bridging Connections............................................160
5.5 Calculated Brace Stiffness and Total Brace Stiffness of the Test Specimens........162
5.6 Total Torsional Stiffness of the Bridging Connections..........................................164

viii
LIST OF FIGURES
Figure page 2.1 Reduced Modulus Theory (Figure 1-21, Chajes 1974)............................................26
2.2 Imperfect Column with Immovable Mid-height Bracing ........................................26
2.3 Imperfect Column with Elastic Mid-height Bracing................................................27
2.4 Critical Loads for Elastically Supported Columns...................................................27
2.5 Effect of Bracing Stiffness .......................................................................................28
2.6 Pcr/Pe versus βL/Pe for a Discrete Bracing ...............................................................29
2.7 Effect of Lateral restraint location on Brace behavior .............................................29
2.8 Bracing Connection Clips ........................................................................................30
2.9 Wall Assembly test setup .........................................................................................30
2.10 Types of Bracing (a) Relative Bracing and (b) Nodal Bracing................................31
2.11 Effect of Initial Out-of-Plumbness ...........................................................................31
2.12 Effective Length Factors for Concentrically Loaded Columns ...............................32
3.1 Dimensions of a Typical Tension Coupon...............................................................52
3.2 Offset Method for Determining Yield Stress ...........................................................52
3.3 Autographic Diagram Method for Determining Yield Stress ..................................53
3.4 Typical Cross-Section of a Cee-Stud .......................................................................53
3.5 Connection of Cee-Stud and Track (a) at Top, (b) at Bottom..................................54
3.6 Plan View of Single Column Axial Test Setup in the Riehle Universal Testing Machine ......................................................................................54
3.7 Schematic Mid-height Bracing and Instrumentation Locations on Test Specimens.........................................................................................................55

ix
3.8 Close-up View of the Location of Brace-Wires and Instrumentation at Mid-height of the Cee-Stud......................................................................................55
3.9 Types of Bridging Connections................................................................................56
3.10 Top View of the SS Type Bridging Connection ......................................................56
3.11 Elevation Views of Bridging Connection Test Setup ................................................57
3.12 Schematic Plan View of Bridging Connection Tests ...............................................58
3.13 Overall View of the Out-of-Plane Bridging Tests....................................................59
3.14 Overall View of the In-Plane Bridging Tests...........................................................59
3.15 Out-of-Plane Loading Test Instrumentation.............................................................60
3.16 In-plane Loading Test Instrumentatio ......................................................................60
4.1 Typical Bracing for the Single Column Axial Load Tests.....................................112
4.2 Axial Load vs. Axial Shortening for the Stud 362S125-33 with Varying Brace Stiffness .........................................................................................112
4.3 Axial Load vs. Axial Shortening for the Stud 362S162-43 with Varying Brace Stiffness .........................................................................................113
4.4 Axial Load vs. Axial Shortening for the Stud 362S162-68 with Varying Brace Stiffness .........................................................................................113
4.5 Axial Load vs. Axial Shortening for the Stud 600S125-33 with Varying Brace Stiffness .........................................................................................114
4.6 Axial Load vs. Axial Shortening for the Stud 600S162-43 with Varying Brace Stiffness .........................................................................................114
4.7 Axial Load vs. Axial Shortening for the Stud 600S162-97 with Varying Brace Stiffness .........................................................................................115
4.8 Axial Load vs. Axial Shortening for the Stud 800S162-43 with Varying Brace Stiffness .........................................................................................115
4.9 Axial Load vs. Axial Shortening for the Stud 800S162-97 with Varying Brace Stiffness .........................................................................................116
4.10 Schematic Diagram Showing the Various Buckling Shapes and Buckling Modes Observed in the Experimental Testing .......................................116
4.11 Comparison of Studs 362S125-33-0 and 600S125-33-0........................................117

x
4.12 Comparison of Studs 362S125-33-100 (1.7x) and 600S125-33-060 (1.3x) ..........117
4.13 Comparison of Studs 362S125-33-200 (6.2x) and 600S125-33-200 (7.4x) ..........118
4.14 Comparison of Studs 362S162-43-0, 600S162-43-0 and 800S162-43-0...............118
4.15 Comparison of Studs 362S162-43-200 (1.2x), 600S162-43-250 (1.6x) and 800S162-43-150 (1.3x) ..........................................................................................119
4.16 Comparison of Studs 362S162-43-400 (2.5x), 600S162-43-500 (3.4x) and 800S162-43-300 (2.3x) ..........................................................................................119
4.17 Comparison of Studs 600S162-97-0 and 800S162-97-0........................................120
4.18 Comparison of Studs 600S162-97-1000 (1.7x) and 800S162-97-1000 (2.1x) ......120
4.19 Comparison of Studs 600S162-97-1500 (2.7x) and 800S162-97-2100 (4.3x) ......121
4.20 Comparison of Studs 362S125-33-0, 362S162-43-0 and 362S162-68-0...............121
4.21 Comparison of Studs 362S125-33-100 (1.7x), 362S162-43-200 (1.2x) and 362S162-68-500 (1.8x) ..........................................................................................122
4.22 Comparison of Studs 362S125-33-400 (6.2x), 362S162-43-800 (5.4x) and 362S162-68-1000 (3.3x) ........................................................................................122
4.23 Comparison of Studs 600S125-33-0, 600S162-43-0 and 600S162-97-0...............123
4.24 Comparison of Studs 600S125-33-30 (0.2x), 600S162-43-75 (0.6x) and 600S162-97-160 (0.3x) ..........................................................................................123
4.25 Comparison of Studs 600S125-33-60 (1.3x), 600S162-43-250 (1.6x) and 600S162-97-1000 (1.7x) ........................................................................................124
4.26 Comparison of Studs 600S125-33-200 (7.4x), 600S162-43-500 (3.4x) and 600S162-97-1500 (2.7x) ........................................................................................124
4.27 Comparison of Studs 800S162-43-0 and 800S162-97-0........................................125
4.28 Comparison of Studs 800S162-43-150(1.3x) and 800S162-97-500 (1.2x) ...........125
4.29 Comparison of Studs 800S162-43-300 (2.3x) and 800S162-97-2100 (4.3x) ........126
4.30 Experimental Load vs. Target Brace Stiffness for 362 Series of Lipped Cee Studs ...................................................................................................126
4.31 Experimental Load vs. Target Brace Stiffness for 600 Series of Lipped Cee Studs ...................................................................................................127

xi
4.32 Experimental Load vs. Target Brace Stiffness for 800 Series of Lipped Cee Studs ...................................................................................................127
4.33 Total Brace Stiffness vs. Weak Axis Lateral Displacement for the 362 Series of Lipped Cee-Studs .............................................................................128
4.34 Total Brace Stiffness vs. Weak Axis Lateral Displacement for the 600 Series of Lipped Cee Studs ....................................................................................128
4.35 Total Brace Stiffness vs. Target Brace Stiffness for the 800 Series Lipped Cee Studs ...................................................................................................129
4.36 Effective Length Factor vs. Total Brace Stiffness for 362S-125-33 Series of Lipped Cee Studs ...................................................................................................129
4.37 Effective Length Factor vs. Total Brace Stiffness for 362S-162-43 Series of Lipped Cee Studs ...................................................................................................130
4.38 Effective Length Factor vs. Total Brace Stiffness for 362S-162-68 Series of Lipped Cee Studs ...................................................................................................130
4.39 Effective Length Factor vs. Total Brace Stiffness for 600S-125-33 Series of Lipped Cee Studs ...................................................................................................131
4.40 Effective Length Factor vs. Total Brace Stiffness for 600S-162-43 Series of Lipped Cee Studs ...................................................................................................131
4.41 Effective Length Factor vs. Total Brace Stiffness for 600S-162-97 Series of Lipped Cee Studs ...................................................................................................132
4.42 Effective Length Factor vs. Total Brace Stiffness for 800S-162-43 Series of Lipped Cee Studs ...................................................................................................132
4.43 Effective Length Factor vs. Total Brace Stiffness for 800S-162-97 Series of Lipped Cee Studs ...................................................................................................133
4.44 Location of Linear Potentiometers on the Bridging Connection ...........................133
4.45 Plot of Applied Load vs. Calculated Rotation at the Center-line of the Web for the 362S Series of Studs...........................................................................134
4.46 Plot of Applied Load vs. Calculated Rotation at the Center-line of the Web for the 600S Series of Studs...........................................................................134
4.47 Plot of Applied Load vs. Calculated Rotation at the Center-line of the Web for the 800S Series of Studs with SS Connection..........................................135
4.48 Plot of Applied Load vs. Calculated Rotation at the Center-line of the Web for the 362S Series of Studs with WW Connection ......................................135

xii
4.49 Plot of Applied Load vs. Calculated Rotation at the Center-line of the Web for the 600S Series of Studs with WW Connection ......................................136
4.50 Plot of Applied Load vs. Calculated Rotation at the Center-line of the Web for the 800S Series of Studs with WW Connection ......................................136
4.51 Plot of Applied Load vs. Calculated Rotation at the Center-line of the Web for the 362S Series of Studs with DW Connection .......................................137
4.52 Plot of Applied Load vs. Calculated Rotation at the Center-line of the Web for the 600S Series of Studs with DW Connection .......................................137
4.54 Plot of Applied Load vs. Calculated Rotation at the Center-line of the Web for the 362S Series of Studs...........................................................................139
4.55 Plot of Applied Load vs. Calculated Rotation at the Center-line of the Web for the 600S Series of Studs...........................................................................139
4.56 Plot of Applied Load vs. Calculated Rotation at the Center-line of the Web for the 800S Series of Studs...........................................................................140
4.57 Plot of Applied Load vs. Calculated Rotation at the Center-line of the Web for the 362S Series of Studs...........................................................................140
4.58 Plot of Applied Load vs. Calculated Rotation at the Center-line of the Web for the 600S Series of Studs...........................................................................141
4.59 Plot of Applied Load vs. Calculated Rotation at the Center-line of the Web for the 800S Series of Studs...........................................................................141
4.60 Plot of Applied Load vs. Calculated Rotation at the Center-line of the Web for the 362S Series of Studs...........................................................................142
4.61 Plot of Applied Load vs. Calculated Rotation at the Center-line of the Web for the 600S Series of Studs...........................................................................142
4.62 Plot of Applied Load vs. Calculated Rotation at the Center-line of the Web for the 800S Series of Studs...........................................................................143
4.63 Plot of Initial Torsional Stiffness vs. Effective Flat-width to Thickness Ratio for the Out-of-Plane loading Tests on SS-type Connection ........143
4.64 Plot of Initial Torsional Stiffness vs. Effective Flat-width to Thickness Ratio for the Out-of-Plane loading Tests on WW-type Connection .....144
4.65 Plot of Initial Torsional Stiffness vs. Effective Flat-width to Thickness Ratio for the Out-of-Plane loading Tests on DW-type Connection......144

xiii
4.66 Plot of Initial Flexural Stiffness vs. Effective Flat-width to Thickness Ratio for the In-Plane loading Tests on SS-type Connection ...............145
4.67 Plot of Initial Flexural Stiffness vs. Effective Flat-width to Thickness Ratio for the In-Plane loading Tests on WW-type Connection ............145
4.68 Plot of Initial Flexural Stiffness vs. Effective Flat-width to Thickness Ratio for the In-Plane loading Tests on DW-type Connection .............146
4.69 Brace Forces as a Resultant of Flexural and Torsional Components.....................146
5.1 Flexural Stiffness of the SS Type Connection .......................................................166
5.2 Flexural Stiffness of the WW Type Connection ....................................................166
5.3 Flexural Stiffness of the DW Type Connection .....................................................167
5.4 Torsional Stiffness of the SS Type Connection .....................................................167

xiv
EXECUTIVE SUMMARY
BRACING REQUIREMENTS OF COLD-FORMED STEEL CEE-STUDS SUBJECTED TO AXIAL COMPRESSION
August 2004
An experimental testing program was carried out on single axially loaded cold-
formed lipped cee-studs to determine the required flexural and torsional bracing strength
and stiffness requirements of the stud. Conventional bridging or nodal bracing has been
simulated in the experiments using monofilament steel wires attached to the stud flanges
at mid-height. A range of brace stiffness was simulated in the testing frame by using
various diameters and lengths of monofilament wire. The brace stiffness that was
achieved ranged from less than 30 lbs/in. to greater than 4000 lbs/in. Brace strength was
determined from the cross-sectional area of the steel wire and its experimentally
determined yield strength. The axial load, individual brace forces, axial shortening, and
in-plane (weak-axis) and out-of-plane (strong-axis) lateral displacements were measured
in each test. The required bracing stiffness was experimentally determined by varying
the brace stiffness for a given stud size and was based on the ability of the stud to develop
its nominal axial compressive capacity as predicted by the 1996 AISI Cold-Formed Steel
Specification including Supplement No. 1. The experimental results were compared to

xv
existing nodal bracing models, analytical prediction models, and the current column
bracing provisions that are part of the 1999 AISC-LRFD Specification for Structural
Steel Buildings.
Experimental testing has also been carried out on typical industry bridging
configuration to measure bridging assembly strength and stiffness relationships for
bridging subjected to in-plane and out-of-plane loadings. Load versus displacement
measurements have been compiled for these assemblies for various stud web depths,
flange widths, and thicknesses with the goal of categorizing strength and stiffness for
these various bridging assemblies.

1
CHAPTER 1 INTRODUCTION
The drive to create more cost effective cold-formed steel structural systems, and the
current move to designing axially loaded wall stud systems using an “all-steel” approach,
has required an alternative to the sheathing braced design. This has resulted in wall stud
systems that are more sensitive to global stability limit states than previous designs.
Ensuring global stability of axially loaded steel studs requires that the bracing system
possess adequate stiffness and strength to develop the predicted axial strength.
1.1 General
Cold-formed steel has been widely used in structural and non-structural wall
construction for more than 60 years, and may be found in many residential, commercial
and industrial facilities being built today. The lightweight property of cold-formed steel
makes it easier and economical to transport and install than other construction materials
such as masonry or hot-rolled steel. Other advantages include – resistance to pest attack,
rapid construction, long service life and efficiently recyclable. Cold-formed steel
sections can be used in most parts of a building, including roofs, trusses, frames etc.
1.2 Objectives of Research
Current North American structural steel design practice using the 3rd Edition of the
American Institute of Steel Construction- Load and Resistance Factor Design
Specification (AISC 1999) prescribes nodal bracing strength and stiffness requirements,
based on a model developed by Winter (1960) and modified by Yura (1995). However,
the most recent cold-formed steel design specification, the North American Specification

2
by the American Iron and Steel Institute (AISI 2001a) does not contain provisions for
determining nodal brace strength and stiffness requirements for axially loaded
compression members. This research program was conducted to experimentally
determine rational requirements for nodal bracing strength and stiffness demand of lipped
cee-studs by conducting single column axial compression tests, and bridging strength and
stiffness tests. The experimental results were used to formulate a rational methodology to
be incorporated into the AISI Specification provisions for design purposes.
The objectives of this research included to determine:
1. the minimum bracing strength and stiffness required for cold-formed steel members subjected to axial loading;
2. the stiffness and strength of typical industry bridging systems;
3. the effective length factors based on unbraced length;
4. the effect of slenderness ratio on the buckling behavior of the cold-formed steel members;
5. the limit state or the governing buckling mode of cold-formed steel members;
6. the effect of support fixity on global buckling of cold-formed steel members.
The strength and stiffness required for bracing hot-rolled steel sections has been
investigated by numerous researchers (Winter 1960, Yura 1995) based on experimental
testing, analytical studies and feasible design considerations. Research has been
conducted on the buckling phenomena of cold-formed steel subjected to axial
compression by many researchers including Winter (1959), Miller (1990), Kwon and
Hancock (1991), Miller and Pekoz (1994), Young and Rasmussen (1999), Schafer
(2000), and Beshara and LaBoube (2001). The current research has been directed
towards establishing the strength and stiffness requirements of the bracing and bridging
requirements for cold-formed steel lipped cee-studs.

3
1.3 Scope of Research
The scope of this research is limited to determining the strength and stiffness
requirements for cold-formed steel lipped cee-studs subjected to axial compression. The
lipped cee-studs were tested to determine their axial load capacity in a manner consistent
with a typical field installation. With this as a basis, the scope of the single column axial
tests was:
1. Standard lipped cee-studs that are widely used in structural and non-structural wall assemblies were tested. The section nominal web depths were 3.625, 6.00, and 8.00 inches, the nominal thickness were 33, 43, 68 and 97 mil. The flange width of the 33 mil studs was 1.25 inches and the flange width of the other studs was 1.625 inches (1 mil = 1/1000 inches).
2. The lipped cee-studs were mounted in industry standard shallow track and attached with #10 self-drilling screws. The lengths of the cee-studs were 8 foot for all the single column tests.
3. The number of nodal brace points was limited to one, at the mid-height of the lipped cee-stud.
4. The support fixity was limited to a shallow track 1.25 inch deep and 12 inches long, attached to the stud with one self-drilling screws on each flange. The track was loosely fixed to the loading plates with two bolts.
5. The simulated bridging used in the single column axial load tests was comprised of high strength steel wires attached to the each flange on both sides of the web. Four wires were used to brace the cee-stud so that for any global buckling at least two brace wires would be effective.
The steel stud industry has employed the use of several typical bridging details for
a number of years. The strength of typical bridging has been studied and previously
reported (Beshara and LaBoube 2001). However, there is little published information
available regarding as-constructed bracing demand. Based on previous testing, and
because of the relatively low bracing force required to brace steel studs, bridging strength
does not appear to be a significant concern. The most apparent criteria for the bridging

4
are the strength and stiffness of the connection of the bridging to the stud and the stiffness
of the total bridging system. The scope of this experimental program involved:
• The bridging tests were limited to three types of typical industry bridging connections, namely screwed-screwed, welded-welded and direct-welded. In the first two types, a standard clip angle was used to secure the channel bridging to the web of the cee-stud. In the third type, the channel bridging was directly welded to the web punchout.
• The bridging was tested for its in-plane strength and out-of-plane torsional stiffness for all the stud sizes used in the single column axial tests. The load was applied with an actuator attached to the bridging at a distance away from the bridging to stud connection to avoid localized effects of load application.
While the stiffness required to develop the strength of the member will vary
depending on whether the member is under axial compression or flexural loading, the
actual physical stiffness of the bridging system is independent of the type of loading.
Therefore, the stiffness of the bridging system (flexural or torsional stiffness) may be
considered independently of the loading.
A general test procedure was developed such that the results of this research may
be extended to other types of stud cross-sections, to determine the requirements of any
type of bridging. Conventional bridging or nodal bracing was simulated in the single
column axial load tests using steel wires attached to the stud flanges at mid-height. A
range of brace stiffness, from less than 30 lbs/in. to greater than 4000 lbs/in., was
simulated in the testing frame by using various diameters and lengths of high strength
steel wire. Brace strength was determined from the cross-sectional area of the steel wire
and the experimentally determined yield strength. The axial load, individual brace
forces, axial shortening, and in-plane (weak axis) and out-of-plane (strong axis) lateral
displacements at mid-height of the cee-stud were measured in each test.

5
The required bracing stiffness was experimentally determined by varying the brace
stiffness for a given stud size and was based on the ability of the stud to develop the
nominal axial compressive capacity as predicted by the provisions of AISI Cold-Formed
Steel Specification (AISI 1996) including Supplement No. 1 (AISI 1999). The
experimental results were compared to existing nodal bracing models, analytical
prediction models, and the current column bracing provisions that are part of the 1999
AISC-LRFD Specification for Structural Steel Buildings (AISC 1999).

6
CHAPTER 2 LITERATURE REVIEW
2.1 General
The use of cold-formed steel in building construction dates back to the 1850s, but
cold-formed steel was not widely used until the 1940’s (Yu 1991). It is used in
constructing walls, slab-decks, beams, columns, storage-racks, and is typically found in
small to medium rise structures. This wide application of cold-formed steel in building
construction has required a comprehensive understanding of its behavior. The increased
use of cold-formed steel as an alternative building material necessitated, in 1946, the first
“Specification for the Design of Light Gage Steel Structural Members”. Since then, there
have been several revisions to the specification as well as design manuals with aids
issued by American Iron and Steel Institute (AISI). In 1991, Load and Resistance Factor
Design (LRFD) was introduced into the cold-formed steel specification. Today, the
current specification edition is the North American Specification for Design of Cold-
Formed Steel Structural Members (AISI 2001a).
While considerable research effort has been directed at the problem of bracing hot-
rolled structural steel columns, little published information exists specifically addressing
the bracing requirements for cold-formed steel columns. This chapter includes a
comprehensive review of relevant work done in the field relating cold-formed steel
members on – lateral beam bracing, sheathed bracing of wall studs, local and distortional
buckling on channel sections, and eccentric loading on wall stud assemblies. Several

7
analytical models formulated by past researchers to determine the bracing strength and
stiffness requirements for axially loaded compression members are also reviewed.
2.2 Buckling of Columns
The global buckling of columns has been studied since the 18th century. Even
today, in spite of numerous investigations in past decades, research in this specialized
field has by no means produced a complete understanding. Based on length and
slenderness ratios, columns can be classified as long, intermediate and short. The
slenderness ratio is a function of the ratio of effective length of the column and the radius
of gyration of the column cross-section.
2.2.1 Elastic Buckling
The history of column theory dates back to 1744 when the Swiss mathematician
Leonard Euler published the equation for the critical load or the buckling load of an
axially loaded prismatic column, assuming that the material is linear and elastic. It is
given by
(2.1)L
IEπP
2
2
e =
where E = Elastic modulus
I = Moment of inertia about the axis orthogonal to buckling plane
L = Unbraced length of the column
This equation is valid for loads acting through the centroidal axis on a perfectly
straight column whose ends are perfectly pinned. In practice, it is impossible to realize
such conditions, hence the equation serves as an upper bound solution to the buckling
problem.
8
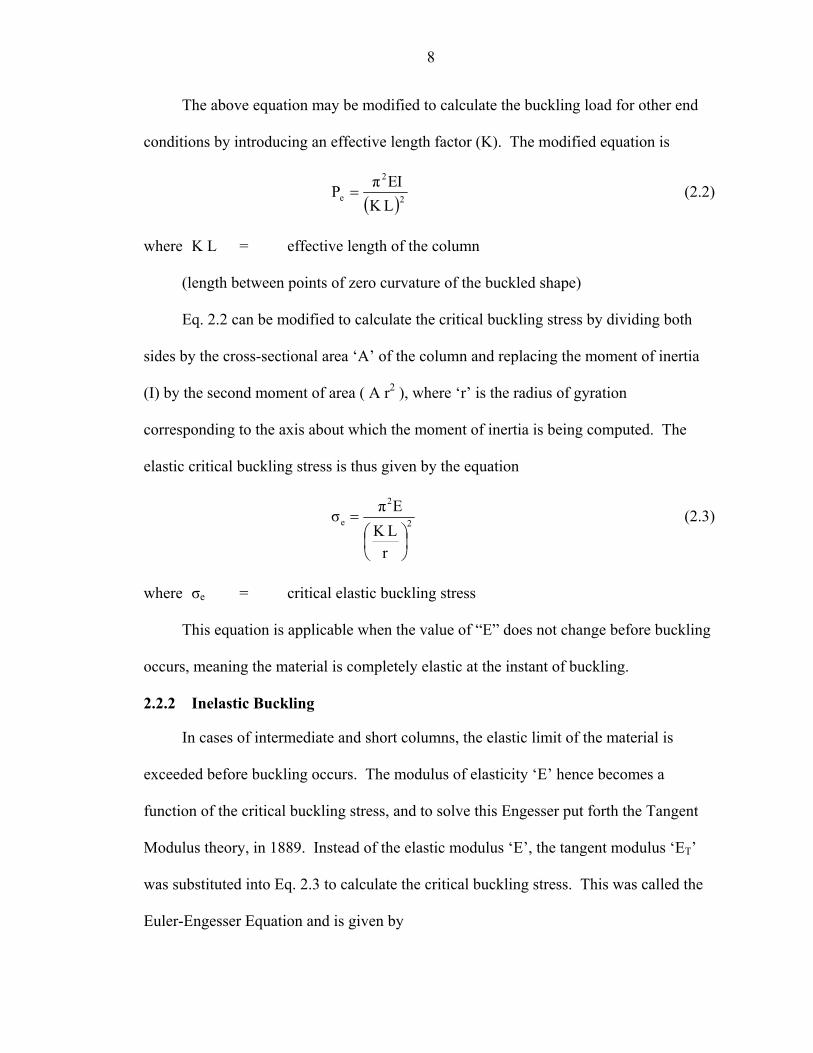
The above equation may be modified to calculate the buckling load for other end
conditions by introducing an effective length factor (K). The modified equation is
( )(2.2)
LKIEπP 2
2
e =
where K L = effective length of the column
(length between points of zero curvature of the buckled shape)
Eq. 2.2 can be modified to calculate the critical buckling stress by dividing both
sides by the cross-sectional area ‘A’ of the column and replacing the moment of inertia
(I) by the second moment of area ( A r2 ), where ‘r’ is the radius of gyration
corresponding to the axis about which the moment of inertia is being computed. The
elastic critical buckling stress is thus given by the equation
(2.3)
rLKEπσ 2
2
e
⎟⎠⎞
⎜⎝⎛
=
where σe = critical elastic buckling stress
This equation is applicable when the value of “E” does not change before buckling
occurs, meaning the material is completely elastic at the instant of buckling.
2.2.2 Inelastic Buckling
In cases of intermediate and short columns, the elastic limit of the material is
exceeded before buckling occurs. The modulus of elasticity ‘E’ hence becomes a
function of the critical buckling stress, and to solve this Engesser put forth the Tangent
Modulus theory, in 1889. Instead of the elastic modulus ‘E’, the tangent modulus ‘ET’
was substituted into Eq. 2.3 to calculate the critical buckling stress. This was called the
Euler-Engesser Equation and is given by

9
(2.4)
rLK Eπσ 2
T2
e
⎟⎠⎞
⎜⎝⎛
=
However, Considère recognized that an axially loaded column stressed beyond the
proportional limit starts to bend, and the stresses on the concave side increase according
to the compressive stress-strain curve of the material, whereas the stresses on the convex
side decrease proportionally to the strain. In 1895, Engesser formulated the Double
Modulus theory of buckling, with use of a reduced modulus ‘ER’ in place of the tangent
modulus in the Euler-Engesser Equation (see Figure 2.). The reduced modulus is given
by
(2.5)I
IEIEE 2T1
R+
=
where I1, I2, represent the moment of inertia of the cross-sectional areas separated by the
neutral axis as shown in Figure 2.1.
2.2.3 Local Buckling and Distortional Buckling
In calculating the strengths of elastic and inelastic columns, the stability criteria are
based on the column as a whole. Other than prismatic sections, columns are made up of
plate elements, which are subjected to compressive stresses when the column is loaded.
The effect of these compressive stresses on slender plate elements may cause them to
buckle locally, which leads to a part of the cross-section to reach its critical buckling
stress and become ineffective in carrying the applied load. In local buckling, the
instability arises due to a change of cross-sectional shape in a localized region and does
not directly alter the overall configuration of the member as a whole (Shanley 1957).

10
Local buckling of individual compression elements can be calculated by two
different approaches to facilitate design – one based on an effective width criterion, the
other based on an average or reduced stress criterion. For each approach, the degree of
the edge restraint influences the behavior. The cross-section elements are classified as
edge-stiffened or unstiffened. An unstiffened compression element is one that is
stiffened at only one edge parallel to the direction of applied stress. A stiffened
compression element is stiffened at both edges parallel to the direction of applied stress
(Galambos 1998). The effective width of locally buckled elements is given by
( ) (2.6)λ0.22/λ1bbe
−=
where be = Effective width
b = Flat width of plate element
λ = (σe/σcr)1/2
σe = Maximum elastic stress
σcr = Plate buckling stress defined by
(2.7)bt
)ν12(1Ekπσ
2
2
2
cr ⎟⎠⎞
⎜⎝⎛
−=
E = Elastic modulus of material
k = Plate-buckling coefficient
(k = 4 for stiffened elements, k = 0.425 for unstiffened elements)
t = Plate thickness
ν = Poisson’s ratio
Distortional buckling, also called as “stiffener buckling” by Desmond, Pekoz and
Winter in 1981, or “local-torsional buckling” by Sridharan in 1982, is a mode

11
characterized by rotation of the flanges at the flange/web junction in members with edge
stiffened elements. Formulae for computing the elastic distortional buckling stress were
provided by Lau and Hancock (1987). Strength tests of cold-formed channel sections,
undergoing distortional buckling, were investigated by Kwon and Hancock (1991). The
distortional mode of buckling occurs at longer half-wavelengths than local buckling and
involves element displacements of the edge or intermediate stiffeners forming the section
or of complete flanges (Galambos 1998). A historical review of distortional buckling
was compiled by Schafer and Hancock (Schafer 2000). Distortional buckling of cold-
formed steel columns was investigated by Schafer (2000) for a project sponsored by
AISI. The investigation compares the design methods using the effective width approach
and the direct strength approach and states design recommendations for AISI
Specification. Teng (2002) extended the axially loaded column investigations by Lau
and Hancock (1987) and examined distortional buckling of beam-columns.
2.3 Bracing Stiffness and Strength
Zuk (1956) analytically derived the magnitudes of brace forces by solving the basic
second order differential equation of equilibrium assuming elastic behavior of the
compression member. It was determined by Zuk that the lateral force is a direct function
of the initial crookedness and the critical buckling load. Eight different cases were
considered with discrete or continuous lateral bracing on laterally loaded flexural
members, axially loaded compression members and eccentrically loaded compression
members, all with either fixed or pinned support conditions. Out of these eight cases, the
first two are relevant to the present investigation and are summarized below

12
2.3.1 Column with Concentric Axial Load and an Immovable Point Support at Mid-height
In Figure 2.2 (Zuk 1956), the centroidal axis of the column is shown as a straight
line passing through the top and bottom pin ends. The initial crookedness is defined by
the following
)8.2(Lxsinay 0 ⎟
⎠⎞
⎜⎝⎛=
where a = Maximum amplitude at the center and is represented by a dashed
line in the figure.
Due to the brace at mid-height, the column assumes a buckled shape as shown by
the continuous line, and is defined as a function of ‘y1’ and ‘y2’ in the upper and lower
halves of the column respectively. The curves ‘y1’ and ‘y2’ represent the additional
displacements due to the applied load ‘P’. When the applied compressive load on the
column, with a fully effective brace, reaches the critical elastic buckling load, given by
)a9.2(L
B4πP 2
12
cr =
the maximum brace force, ‘Fmax’, is calculated from the second order differential
equation of equilibrium, which reduces to
)b9.2(L3
aB64 πF 3
12
max =
where B1 = Flexural rigidity = E I
L = Length of column from the top pin end to the bottom pin end
a = Amplitude of initial crookedness

13
It can be seen here that an initial crookedness of L/1000, shows that Fmax is 0.53%
of the critical buckling load ‘Pcr’. As mentioned earlier, the equation for the brace force
is a direct function of the initial crookedness of the column.
2.3.2 Column with Concentric Axial Load and an Elastic Lateral Support at Mid-height
This case is the same as that derived by Winter (1947) and was included by Zuk for
purpose of comparison. Winter analytically determined that for a concentrically loaded
pin-ended column with mid-height elastic bracing, the brace force is about 2% of the
critical load, ‘Pcr’.
Winter (1960) published the results of a simple analytical model to calculate the
required bracing stiffness and strength for both beams and columns. It was found that
both bracing strength and stiffness contribute to the critical buckling load of a
compression member. Both forms of bracing, discrete and continuous, were considered
in Winter’s investigation. For an axially loaded column (see Figure 2.3 (Winter 1960)), a
nodal brace at mid-height can increase its axial load capacity only if the brace is stiff
enough to restrain the column from flexural buckling or flexural-torsional buckling. For
a column with mid-height bracing, Winter considered that the unsupported length of the
column to be half the overall length of the column. There is a minimum stiffness
requirement to effectively brace a member laterally and this is defined as the ideal
stiffness, and such bracing is called “full bracing”. If an axially loaded column has an
initial crookedness ‘do’, the required strength of the lateral brace increases with the
magnitude of the imperfection, but the stiffness demand does not likewise increase. For
the column with mid-height bracing shown in Figure 2.3 (Winter 1960), Winter obtained
the required bracing stiffness as given by the equation

14
(2.10a)1d
dLP2k oe
req ⎟⎠⎞
⎜⎝⎛ +=
where L = Unbraced length of the column
Pe = Euler’s critical buckling load for a column of length, L
do = Amplitude of initial crookedness
d = Additional displacement due to buckling
For an ideal column, do = 0, the above equation reduces to
(2.10b)LP2k e
ideal =
and the strength of the bracing is given by
( ) (2.11)ddLP2S o
ereq +=
Winter also developed the required stiffness and strength for two, three and four
symmetric brace points along the length of a column. It was recommended to take the
value of do = 1/500 or 1/1000 and that of d = L/250 or L/500, depending on the type of
cross-section (e.g. wide flange). This is because ‘d’ is the displacement at incipient
failure and under design loads it would be less than half of the above values. Figure 2.4
(Winter 1960) shows the critical loads for elastically supported columns.
Plaut (1993) mathematically derived relations for elastic translational springs at
arbitrary points along the length of a column with a pin support at the base and with
either a pin support or a brace at the top of the column. Both perfect and imperfect
columns were considered and the effect of span length, bracing stiffness and initial
imperfection were determined. Plaut stated that for imperfect columns the deflections
and the bracing forces tend to increase with the applied load.
If P = P∞ then,

15
(2.12)ddη1kk o
id ⎟⎠⎞
⎜⎝⎛ +=
where for this case 22
id LEI16πk =
For P < P∞, and for a range of do/d
)13.2(ddη1
LP4k o ⎟
⎠⎞
⎜⎝⎛ +=
where L = Length of column
P = Non-dimensional axial load as a fraction of P∞
P∞ = Dimensional axial load for an infinitely stiff brace
do = Initial deflection at location of the brace
d = Additional deflection at location of the brace due to buckling
η = Dimensionless parameter
When η = 1.41, it gives the upper bound to the required stiffness. Figure 2.5(a),
(b), (c) (Plaut 1993) shows the effect of bracing stiffness on the deflection ratio (do/d),
load ratio (P/ P∞), and bracing force to axial load ratio (F1/P), respectively.
Yura (1995) focused on simplicity and easy formulations for the bracing strength
and stiffness required for bracing compression members. Relative, discrete, continuous,
and lean-on bracing systems were considered in this work. Yura concluded that simply
satisfying the strength requirement of 2% of applied compressive load might be
detrimental if the bracing is too flexible to restrain displacement. Stiffness of the
bridging also affects the behavior of the compression member. It was observed from
column tests that the larger the stiffness of the bracing, the smaller was the measured

16
brace force. Yura proposed the ideal nodal brace stiffness, βideal, for an axially loaded
column to be
[ ] )14.2(L
Pn24βb
nideal
−=
and the required brace strength, assuming an initial out-of-straightness of L/ 500 to be
)15.2(P02.0P nbrace =
where Lb = Unbraced length
Pbrace = Minimum required brace strength
Pn = Nominal axial capacity when the assumed brace stiffness is greater
than or equal to βideal
n = Number of equally spaced intermediate brace locations
βideal = Minimum required brace stiffness
Yura made the following recommendations for design
1. The brace stiffness should be equal to twice the ideal requirement to limit displacement; and
2. The brace strength should be 1% of the nominal capacity of the compression member at the ideal bracing
Figure 2.6 (Yura 1995) shows a plot of Pcr/Pe versus βL/Pe for several discrete
bracing systems. The recommendations made by Yura were later incorporated into the
American Institute of Steel Construction- Load and Resistance Factor Design
Specification (AISC 1999).
Helwig and Yura (1999) conducted a finite element investigation of torsional
buckling behavior of columns with lateral bracing located at different points on the cross-
section. Their paper describes that many column-bracing details employed in steel
construction do not prevent twist, and subsequently torsional buckling may control the

17
column capacity. Equations were developed for strength and stiffness requirements of
bracing to control torsional buckling of doubly-symmetric sections. Connection details
for torsional bracing were described and presented. For a doubly-symmetric section, the
torsional buckling capacity of a compression member can be computed using Eq. 2.16
(Timoshenko and Gere 1961).
(2.16)rr
JG)4/d(PP 2
y2x
2ey
T +
+=
When the locations of intermediate lateral restraint are offset from the centroid of
the cross-section, the torsional buckling capacity is given by Eq. 2.17 when the offset lies
in the plane of the web, and Eq. 2.18 when the offset lies along the strong axis.
(2.17)rra
JG]a)4/d[(PP 2
y2x
2
22ey
T ++
++=
(2.18)rrb
JG]b)I/I()4/d[(PP 2
y2x
2
2yx
2ey
T ++
++=
where G = Shear modulus
Ix = Strong axis moment of inertia
Iy = Weak axis moment of inertia
J = Torsional constant
Pey = Elastic flexural buckling load, based on a column length
between points of zero twist (Eq. 2.19)
a, b = Distances to an axis away from centroidal axis
d = Distance between flange centroids
rx, ry = Strong-axis and weak-axis radii of gyration
18
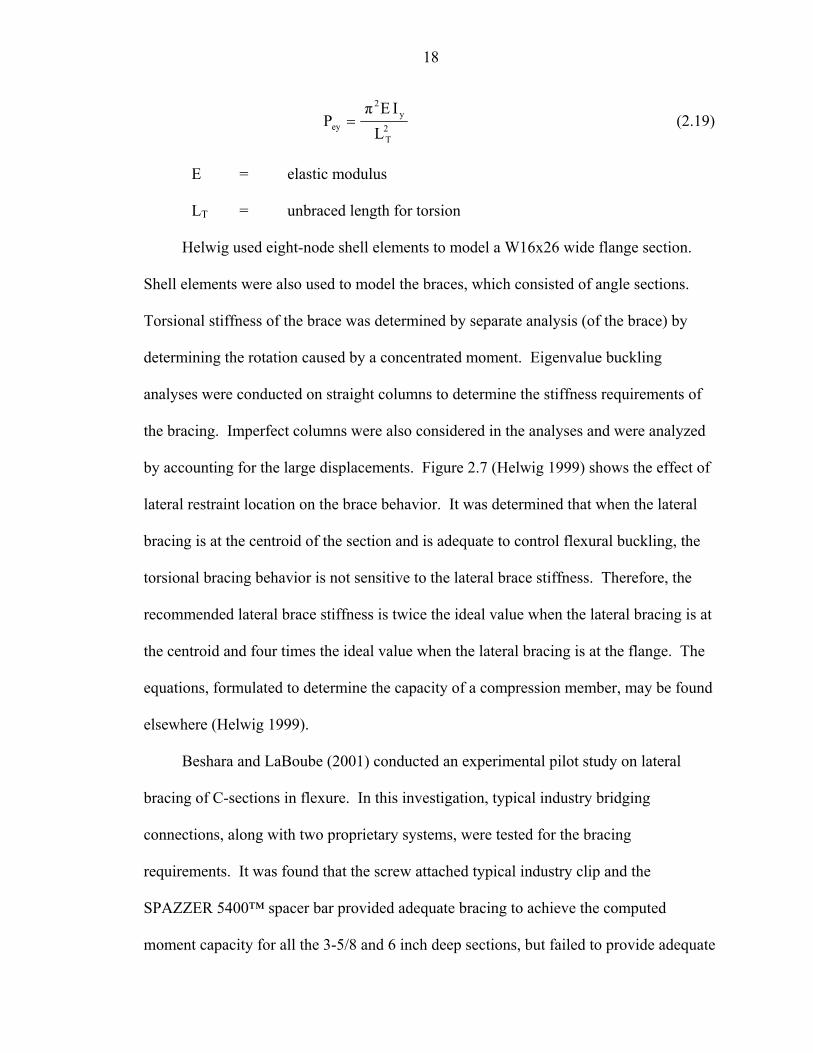
(2.19)L
IEπP 2
T
y2
ey =
E = elastic modulus
LT = unbraced length for torsion
Helwig used eight-node shell elements to model a W16x26 wide flange section.
Shell elements were also used to model the braces, which consisted of angle sections.
Torsional stiffness of the brace was determined by separate analysis (of the brace) by
determining the rotation caused by a concentrated moment. Eigenvalue buckling
analyses were conducted on straight columns to determine the stiffness requirements of
the bracing. Imperfect columns were also considered in the analyses and were analyzed
by accounting for the large displacements. Figure 2.7 (Helwig 1999) shows the effect of
lateral restraint location on the brace behavior. It was determined that when the lateral
bracing is at the centroid of the section and is adequate to control flexural buckling, the
torsional bracing behavior is not sensitive to the lateral brace stiffness. Therefore, the
recommended lateral brace stiffness is twice the ideal value when the lateral bracing is at
the centroid and four times the ideal value when the lateral bracing is at the flange. The
equations, formulated to determine the capacity of a compression member, may be found
elsewhere (Helwig 1999).
Beshara and LaBoube (2001) conducted an experimental pilot study on lateral
bracing of C-sections in flexure. In this investigation, typical industry bridging
connections, along with two proprietary systems, were tested for the bracing
requirements. It was found that the screw attached typical industry clip and the
SPAZZER 5400™ spacer bar provided adequate bracing to achieve the computed
moment capacity for all the 3-5/8 and 6 inch deep sections, but failed to provide adequate

19
bracing for the 8 inch deep sections. The STEEL Network BridgeClip™ provided
adequate bracing to achieve the computed moment capacity for all the 3-5/8 and 6 inch
18 gauge sections, but failed to provide adequate bracing for the 6 inch-16 gauge and
8inch sections. Overall, it was found that the typical industry clip provided the highest
resistance against rotation followed by the SPAZZER 5400™ and the STEEL Network
BridgeClip™. Figure 2.8 (Beshara and LaBoube 2001) shows the three connections
tested in the investigation. The observed failure was classified broadly as torsional-
flexural buckling and individual tests indicate the actual mechanism of failure.
2.4 Long Column Tests
Miller (1990) conducted a series of tests on cold-formed steel cee studs at Cornell
University. Individual column tests with a length of 8 foot were performed on studs with
depths of 3-5/8 and 6 inch. Load was applied to the studs both concentrically and
eccentrically with either pin end or fixed end conditions. Several of the studs were tested
with one or more perforations in the web. Geometric imperfections were measured and
considered when the experimental results were compared to the analytical results. No
bridging or bracing was installed as part of the test set-up.
Additionally, Miller conducted wall assembly axial tests on 8 foot members spaced
(typically) at 24 inch on-center and having depths of 3-5/8 and 6 inch (see Figure 2.9
(Miller 1990)). Bracing was applied to the wall members in one of three forms:
continuous flat straps screwed to both flanges, continuous channel bridging installed
through web perforations, and gypsum sheathing screwed to one of the flanges of the
members. As in the individual long column tests, end conditions of the studs were either
pin-ended or fixed. Miller noted that the use of flat strap bracing and channel bridging
resulted in similar ultimate axial loads, while the presence of mid-height bridging

20
increased the load carrying capacity by at least 25% for 6 inch members and by at least
60% for 3-5/8” members, over those tested without any bridging or bracing.
Miller (1993) presented the results of effectiveness of the bracing for imperforated
two stud wall assembly tests. The investigation found that for 6 inch, 20 gage studs, the
predicted capacities were about 20% higher than the experimental results, where the
predicted capacity was based on the AISI Specification’s Cold-Formed Steel Design,
(AISI 1986). This was because the AISI Specification considered the load to act through
the centroid. When Miller calculated the effect of eccentric load acting through the gross
centroids it was found that the predicted loads were conservative in most cases.
Individual long column and flat-ended stud tests were also conducted. The flat-ended
studs were fitted with short tracks on both the ends, prior to testing.
The effective length factors for the wall studs with and without mid-height bracing
were determined for flexure and torsion, and the recommended values by Miller (1993)
are
• Unbraced: Kx = Ky = Kt = 0.65
• Braced at mid-height: Kx = 0.65, Ky = Kt = 0.4
2.4 AISC-LRFD Specification
The AISC-LRFD Specification, 3rd Edition (AISC 1999) contains provisions for the
stability bracing of structural steel members and frames, in Chapter C3. There are two
general types of bracing – relative bracing and nodal bracing. The relative brace system
shown in Figure 2.10(a) (Figure C-C3.1, AISC 1999) consists of a diagonal and a strut
that control the movement at one end of the unbraced length, A, with respect to the other
end of the unbraced length, B. A nodal brace controls the movement only at the

21
particular brace point, as shown in Figure 2.10(b) (Figure C-C3.1, AISC 1999), without
interaction with adjacent brace points.
The minimum bracing requirements as given in the AISC-LRFD Specification
(AISC 1999), Chapter C3-3, for nodal bracing, are as follows
Required brace strength
(2.20)P01.0P ubr =
Brace stiffness:
(2.21)LφP8
βb
ubr =
where Pu = Required compressive strength of the column
Lb = Distance between braces
φ = 0.75
Recall that Winter (1958) recommended that the brace stiffness for frames,
columns, beams be equal to twice the critical stiffness and this same recommendation has
been adopted by the AISC-LRFD Specification (1999). The φ = 0.75 specified for all
brace stiffness requirements is consistent with the implied resistance factor for the Euler
column buckling. i.e. 0.877 x φc = 0.75. The initial displacement also known as initial
out-of-plumbness, ∆o, for the relative or nodal bracing is defined with respect to the
distance between adjacent braces, as shown in Figure 2.11 (Figure C-C3.3, AISC 1999).
The brace strength recommendations for frames, columns, and beam lateral bracing are
based on an assumed ∆o = 0.002L, where L is the distance between adjacent brace points.
The flexibility or ability of a brace connection to slip should be considered in the
evaluation of the actual bracing system stiffness, βact, as follows

22
(2.22)β
1β
1β1
braceconnact
+=
where βconn = Stiffness of the Connection
βbrace = Stiffness of the brace
2.5 AISI Specification for Cold-Formed Steel
In case of concentrically loaded compression members, there are three limit states
namely, (1) yielding, (2) overall column buckling (flexural, torsional, flexural-torsional
buckling), and (3) local buckling of individual elements.
Flexural buckling occurs in a slender, axially loaded column about the either of the
principal axes. The critical elastic buckling stress for a column is given by Eq. 2.3, which
is discussed earlier. The Commentary on North American Specification for Design of
Cold-Formed Steel (AISI 2001b) gives the equation for critical inelastic buckling stress
as
( ) ( )23.2F4F
1FFecr
yycr ⎟⎟
⎠
⎞⎜⎜⎝
⎛−=
where E = Elastic modulus of steel
Fy = Yield stress of the material
(Fcr)e = Critical elastic buckling stress, given by Eq. 2.24
( )( )
( )24.2r/KL
EπF 2
2
ecr ⎟⎟⎠
⎞⎜⎜⎝
⎛=
K L = Effective length of column
r = Minimum radius of gyration
In the above equation, the critical buckling stress is directly proportional to the
yield strength of the steel. For cold-formed steel compression members with large width-

23
to-thickness ratios, local buckling of individual component plates may occur before the
applied load reaches the nominal axial strength determined by Eq. 4.4 (Section C4, AISI
2001) for locally stable columns, which is given as
( )25.2FAP crgn =
where Ag = Full cross-sectional area of the compression member
Fcr = Critical buckling stress, either elastic or inelastic
The interaction effect of the local and overall column buckling may result in a
reduction of the overall column strength. In order to reflect the effect of local buckling
on the reduction of column strength, the nominal axial strength is determined by the
critical buckling stress and the effective area, Ae, instead of the full sectional area. The
nominal axial strength of cold-formed steel compression members can be determined by
the following equation
( )26.2FAP cren =
where Ae = Effective area at Fcr
Fcr = Critical buckling stress, either elastic or inelastic
However, Eq. 2.26 is limited to its applicability in case of singly symmetric or
point symmetric sections. The design equations for calculating the inelastic and elastic
flexural buckling stresses have been changed to those used in AISC-LRFD Specification
(AISC 1999). The AISI Specification (2001a) gives the equations for critical buckling
stress as
For λc ≤ 1.5 ( )27.2F658.0F yn
2cλ ⎟
⎠⎞
⎜⎝⎛=

24
For λc > 1.5 ( )28.2Fλ877.0F yn 2
c ⎥⎥⎦
⎤
⎢⎢⎣
⎡=
where Fn = Nominal flexural buckling stress
λc = ey F/F
Fe = Elastic flexural buckling stress calculated using Eq. 2.24
Consequently, the nominal axial compressive strength is given by
( )29.2FAP nen =
The effective length factor, K, accounts for influence of restraint against rotation
and translation at the ends of a column on its load carrying capacity. For concentrically
loaded compression members, the recommended values of effective length factors are
given in Figure 2.12 (AISI 1996).
For inelastic buckling, the critical torsional buckling stress is calculated according
to Eqs. 2.27 and 2.28 by using σt instead of Fe in calculation of λc. In certain cold-formed
steel cross-sections, the design strength is limited by the torsional buckling of columns.
For relatively short members the elastic torsional buckling stress is given by, σt,
calculated as follows
( )( )30.2
LKCEπ
JGrA
1σ 2tt
w2
ot
⎥⎥⎦
⎤
⎢⎢⎣
⎡+=
where A = Full cross-sectional area
Cw = Torsional warping constant
G = Shear modulus
J = Saint Venant’s torsion constant of the cross-section
Kt Lt = Effective length of twisting

25
ro = Polar radius of gyration of the cross-section about the shear center
In case of flexural-torsional buckling of a column, the column undergoes flexural
buckling about one of the principal axes, with simultaneous torsional buckling about the
shear center. This limit state is to be checked only when there is a chance of flexural-
torsional buckling to occur. The governing elastic flexural-torsional buckling stress of a
column is given by
( ) ( ) ( )31.2σσβ4σσσσβ2
1F tex2
textexe ⎥⎦⎤
⎢⎣⎡ −+−+=
where σex = π2 E / (Kx Lx / rx)2 is the flexural buckling stress about the x-axis
σt = torsional buckling stress
β = 1-(xo/ro)2
The flexural-torsional buckling stress is always lower than the Euler stress σex for
flexural buckling about the axis of axis of symmetry. For inelastic buckling, the torsional
buckling stress is given by Eq. 2.27.

26
Figure 2.1 Reduced Modulus Theory (Figure 1-21, Chajes 1974)
Figure 2.2 Imperfect Column with Immovable Mid-height Bracing

27
Figure 2.3 Imperfect Column with Elastic Mid-height Bracing
Figure 2.4 Critical Loads for Elastically Supported Columns

28
(a) Effect of Bracing Stiffness on Deflection Ratio do/d
(b) Effect of Bracing Stiffness on Load Ratio P/P∞
(c) Effect of Bracing Stiffness on Bracing Force as Percentage of Axial Load for given Load Ratio P/P∞
Figure 2.5 Effect of Bracing Stiffness

29
Figure 2.6 Pcr/Pe versus βL/Pe for a Discrete Bracing
Figure 2.7 Effect of Lateral restraint location on Brace behavior

30
Figure 2.8 Bracing Connection Clips
Figure 2.9 Wall Assembly test setup

31
Figure 2.10 Types of Bracing (a) Relative Bracing and (b) Nodal Bracing
Figure 2.11 Effect of Initial Out-of-Plumbness

32
Figure 2.12 Effective Length Factors for Concentrically Loaded Columns

33
CHAPTER 3 DESCRIPTION OF EXPERIMENTAL STUDY
The purpose of this chapter is to give a brief description of the objectives of the
experimental program, the material properties and measured as-built geometry of the test
specimens, the test setups, and the test procedures employed in the project. The
experimental program consisted of two phases of testing:
• Phase-I: Axial Compression Tests
• Phase-II: Bridging Tests
3.1 Introduction
Phase-I of the experimental program consisted of examining the behavior of single
axially loaded cee-studs, with and without mid-height bracing (or bridging). In Phase-II,
typical industry bridging was examined for its strength and stiffness by in-plane and out-
of-plane loading. Description of the test setups and the test procedures are given in
Sections 3.6 and 3.7. Three types of typical industry bridging were tested:
• Type-1: Screwed-Screwed (SS), where the bridging channel and clip angle are screwed to each other and to the web of the cee-stud.
• Type-2: Welded-Welded (WW), where the bridging channel and clip angle is fillet welded to each other and to the web of the cee-stud.
• Type-3: Direct-Welded (DW), where the bridging channel is directly welded to the web of the cee-stud.
The stud specimens tested had nominal web depths of 3.625, 6.00, and 8.00 inches
with specified thicknesses ranging from 33 mils to 97 mils. The 33 mil, 43 mil, and 68
mil studs were manufactured by Steel Construction Systems, Orlando, FL and the 97 mil
34
studs were manufactured at the Wildwood, FL plant of Dietrich Metal Framing Inc.,
Pittsburgh, PA. The mechanical properties of the stud material used to fabricate the test
specimens were determined by tension coupon tests. The as-built dimensions and
geometric imperfections of the fabricated test specimens were recorded and this data was
utilized in the calculation of the resistance properties of each specimen.
3.2 Objectives of Experimental Tests
The main objectives of the experimental study are summarized as follows: • To investigate the behavior of cold-formed steel cee-studs with and without mid-
height lateral bracing by testing a range of studs, subjected to axial compression while providing different bracing stiffnesses and strengths
• To investigate the strength and stiffness of the lateral bridging over the same range of studs subjected to in-plane and out-of-plane loading
• To provide the experimental data for determining the minimum bracing requirements of cold-formed steel cee-studs subjected to axial compression
3.3 Material Properties of Test Specimens
A series of standard 2 inch gage length ASTM tension tests were performed on
coupons cut from the web material of the cee-studs. The dimensions of a typical tension
coupon are shown in Figure 3.1. The nomenclature used to identify the group of cee-stud
to which the coupon belonged was represented as:
TC DDDS FFF-TT
where TC = Tension coupon
DDD = Overall stud depth
(362 = 3.62 inch, 600 = 6.00 inch, and 800= 8.00 inch)
S = Lipped stud section
FFF = Flange width (125 = 1.25 inch, 162 = 1.62 inch)
TT = Nominal sheet thickness (mils, 1 mil = 0.001 inch)

35
The tension tests were performed in accordance with ASTM E8-01e2 (ASTM
2001) on a 60 Kip capacity Tinius-Olsen testing machine. The applied load was
measured through a load cell and the gage elongation of each coupon was measured using
two extensometers, one fixed on the front and the other on the back of the tension
coupon. The applied load and the corresponding elongation data was used to plot the
stress-strain relationship. From the stress-strain plot, the yield and ultimate stresses were
determined as per ASTM E8-01e2 (ASTM 2001). The elastic modulus of the material
was not determined by testing and was assumed to be equal to 29500 ksi (AISI 1996).
For each cee-stud section, a minimum of three tests were performed. The average values
of yield and ultimate stresses were calculated based on either the 0.2% offset method for
a continuously yielding material or the autographic diagram method for materials
exhibiting discontinuous yielding. Figure 3.2 shows the 0.2% offset method for
determination of the yield stress, and Figure 3.3 shows the autographic diagram method
for determination of the yield stress. The tension coupon test results are summarized in
Table 3.1.
3.4 As-Built Dimensions of the Test Specimens
For the single axial load tests, 8 foot long cee-studs were cut from the as-delivered
20.5 foot long members. For the bridging tests, short 3.5 foot stubs were cut from the
20.5 foot long members. For the purposes of this study, each tested stud was identified
using a modified Steel Stud Manufacturers Association (SSMA) nomenclature:
DDD S FFF-TT-KKKK
where DDD = Overall stud depth
(362 = 3.62 inch; 600 = 6.00 inch; 800 = 8.00 inch)
S = Lipped stud section

36
FFF = Flange width (125 = 1.25 inch; 162 = 1.62 inch)
TT = Nominal steel thickness (mils; 1 mil = 0.001 inch)
KKK = Axial stiffness of one brace wire in pounds per inch
For each specimen, the cross-section dimensions were measured at three locations
along the length of each 8 foot stud with a digital micrometer and tabulated in Table 3.2.
The tables provide the stud designation and corresponding brace stiffness used in the
testing along with the measured dimensions A through F and thicknesses ‘ta’ through ‘te’
(see Figure 3.4) for each test specimen. The (+) and (-) symbols denote the direction of
camber and sweep of the stud. The camber and sweep were measured as described in
Section 3.5.1.
3.5 Measured Geometric Imperfections of the Test Specimens
The geometric imperfections of a stud can be categorized as a global imperfection
and/or a local imperfection as described in Sections 3.5.1 and 3.5.2.
3.5.1 Global Imperfections
The bow/sweep and camber of the studs were measured with a digital micrometer
to a least count of 0.005 inch. A nylon monofilament line was stretched from one end to
the other end of a stud and then was clamped tight. The out-of-straightness of each flat
surface of a stud was measured at mid-height. The distance from the string to the surface
of the stud was the initial global imperfection for the stud and tabulated in Table 3.3. The
measured out-of-straightness of each stud was found to be within the permissible values
as stated, which is 1/32 inches per foot for both bow and camber. The permissible values
are found in the Standard Specifications for Load Bearing Steel Studs ASTM C955-01
(ASTM 2001) and for Nonstructural Steel Framing Members ASTM C645-00 (ASTM
2000). The measured cambers were negligible in all the tested specimens except for the

37
600S162-43 series where it ranged from 0.0 to a maximum of 0.065 inches, or L/1500.
The sweep measurements were more significant as these might directly influence the
axial behavior of the cee-studs during testing. The measured sweep ranged from 0.0 to
0.04 inches, or L/2400 for the 362S162-43 and 600S162-43 series; from 0.0 to 0.075
inches, or L/1300 for the 600S162-97 series; and from 0.0 to 0.14 inches, or L/700 for the
362S162-68 series. No geometric imperfection measurements were made of the
800S162-97 series studs. In a few studs there was an initial twist over its length but it
would disappear when the bottom end was plumbed with the top end while setting up for
a compression test. A note was made of the initial twist, but the degree of twist was not
measured.
3.5.2 Cross-Sectional Imperfections
The as-built out-to-out measurements of the cross-section of a stud showed that it
was neither symmetric nor of uniform thickness. Also, the intersecting corners of the
flange-lip and the web-flange junctions were typically right angular. However, the cross-
section was considered to be mono-symmetric and of uniform thickness for calculation
purposes. It was observed that in some of the studs the punchout were offset from the
web centerline by as much as 1/8 inch, and this was documented along with the test data.
The average cross-sectional measurements of each of the test specimen series are given in
Tables 3.4 and 3.5. In order to calculate the gross cross-section area, the radius of the
bend was taken as the maximum of 3/32 inches or two times the base-metal thickness,
based on the SSMA Manual (SSMA 2001). The studs were fabricated from galvanized
coated steel. The base metal thickness was calculated by subtracting a thickness of two
mils from the average of the measured values of thickness.

38
3.6 Test Setup and Test Procedure for Single Column Axial Load Tests
A total of 37 studs were tested in this phase of the experimental study. Each stud
was tested in a 400 Kip, screw driven Riehle Universal Testing Machine. The test setup
and test procedure for the single column axial load tests is described below.
3.6.1 Test Specimens of Single Column Axial Load Tests
To simulate actual field installation conditions, each stud was mounted in standard
track of type “T DDD 125-43” (where T = track, DDD = depth of stud, 1-1/4 inch flange,
43 mil thickness). Figure 3.5 shows a stud attached to the track with a single #10 self-
drilling screw on each flange. The track was then mounted to end bearing plates with
two 0.150 inch diameter bolts to simulate attachment to a concrete support or other
structural member using 0.144 inch diameter drive pins. Figure 3.5(a) shows the top of
the stud attached to the end bearing plate being held in position against the movable
crosshead of the Riehle Universal Testing Machine. Figure 3.5(b) shows the bottom of
the stud attached to the other end bearing plate that sits just above another plate holding a
150 Kip axial load cell in place and resting on the fixed platen of the testing machine.
3.6.2 Test Frame for Single Column Axial Load Tests
An adjustable frame attached to the Riehle testing machine was used to hold the
flexural-torsional bracing system in place. Figure 3.6 is an overall view of the test frame
and its accompanying instrumentation. The mid-height lateral bracing was simulated
using steel wires of varying diameters and lengths. As indicated in the figure, the wires
were attached to the corners of the flanges of the test specimens using #10 screws. The
brace wires terminated at the S-Beam load cells, which were used to measure the tension
force in the brace wires during the testing.

39
3.6.3 Instrumentation for Single Column Axial Load Tests
Five load cells and six linear potentiometers were used to measure the loads and
displacements for each single axial compression test for the braced stud specimens.
Figure 3.7 shows the locations of the instruments mounted on the test frame. Four S-
Beam load cells (Load Cells 1, 2, 3, 4) were used to measure the brace forces in the brace
wires. A 150 kip capacity load cell (Load Cell 5) was used to measure the axial load at
the base of the stud. The minor axis lateral displacement of a stud was measured by a
complementary set of four linear potentiometers (LINEAR POTS 1, 2, 3, 4) positioned
directly adjacent to the individual brace wires that made up the lateral bracing system.
The major axis lateral displacement was measured at mid-height, by a single linear
potentiometer (LINEAR POT 5) located along the minor axis attached to the south flange
of a stud. Axial shortening of a stud was measured along the north flange of the test
specimen parallel to the longitudinal axis of a stud (LINEAR POT 6). Figure 3.8 shows a
close-up view of the stud cross-section at mid-height that shows the attachment points of
the bracing wires to their corresponding load cells: A-NE BRACE (BF-1), B-SE BRACE
(BF-2), C-NW BRACE (BF-3), and D-SW BRACE (BF-4).
3.6.4 Test Procedure of Single Column Axial Load Tests
Each cee-stud was fixed in the Riehle Universal Testing Machine with the tracks
bolted to the top crosshead and bottom base plate and was plumbed along both the strong
and weak axis prior to testing. The measuring instruments, described in Section 3.6.2
were connected to an electronic data acquisition system to collect and display the run-
time data. The tests were conducted under displacement control since the Riehle is a
mechanically screw-driven testing machine, which allowed the studs to be loaded at a
rate of approximately 5 to 20 lbs/sec to ensure a static response to the applied load.

40
Initially, each stud was loaded up to an axial load of 200 lbs to 500 lbs then unloaded. At
this time all the instrumentation was checked and balanced. This preliminary loading and
unloading cycle also ensured proper seating of the specimen in the Riehle UTM. During
the continued loading, the buckling behavior of the stud was observed and photographs
were taken at notable points and at certain load levels. Failure was considered to have
occurred when the stud could no longer carry additional load or significant axial or cross-
sectional deformation of the stud was observed and recorded. The stud was then
unloaded and the test was then terminated.
3.7 Test Setup and Test Procedure for Bridging Tests
A total of 54 specimens were tested in this phase of the experimental study to
evaluate the strength and stiffness of typical industry bridging. The tests were conducted
on 3.5 foot long cee-stud sections. As previously stated, three types of typical industry
bridging were tested. The specimens were divided into two groups based on the direction
of loading namely, in-plane loading and out-of-plane loading. Twenty-eight specimens
were tested in the out-of-plane loading group while twenty-six specimens were tested in
the in-plane loading group.
3.7.1 Test Specimens of Bridging Tests
The 3.5 foot long cee-stud sections were cut from the 20.5 foot long studs such that
the elevation to the center of the web punchout was maintained at 23 inches. The test
specimens were identified using a modified SSMA nomenclature:
DDD S FFF-TT-N CC
where DDD = Overall stud depth
(362 = 3.62 inch; 600 = 6.00 inch; 800 = 8.00 inch)
S = Lipped stud section

41
FFF = Flange width (125 = 1.25 inch; 162 = 1.62 inch)
TT = Nominal steel thickness (mils; 1 mil = 0.001 inch)
N = Number of the test specimen in each series of stud
CC = Bridging connection type (SS, WW, DW)
Figure 3.9(a) through (c) show the types of bridging connections tested and they
are described below:
3.7.1.1 Screwed-Screwed (SS) Connection: The clip angle was first screwed to
the bridging channel with two #10 self-drilling screws, as shown in Figure 3.9(a) and
Figure 3.10. Position of the screws on the clip angle was marked and then it was
centered on the centerline of the web at a height of 23 inches from the bottom. The clip
angle was then screwed to the web of the stud. This connection type was called Screwed-
Screwed (SS).
3.7.1.2 Welded-Welded (WW) Connection: The bridging channel was welded
at its flange-web junction to the clip, as shown in Figure 3.9(b). The clip angle was then
positioned along the centerline of the web and fillet welded on the edges of the in-line
leg. The bridging channel was slid through the punch out and then fillet welded to the
outstanding leg of the clip angle. The welding specifications used were – Metal alloy:
ER7056, Heat: 1026o F, Gas shielding: Argon-CO2 (75%-25%). This connection type
was called Welded-Welded (WW).
3.7.1.3 Direct-Welded (DW) Connection: The bridging channel was slid
through the web punchout and then the flanges were welded to the web of the stud, as
shown in Figure 3.9(c). The weld specification used was same as in Type-2 connection.
This connection type was called Direct Welded (DW).
42
3.7.2 Test Fixture for Bridging Tests
The test fixture used to secure the specimens for the bridging tests is shown in
Figure 3.11(a). Figure 3.12(a) and (b) are schematic plan views of the test fixture
positioned for the out-of-plane and in-plane bridging tests, respectively, while Figure
3.13 and Figure 3.14 show an overall view of each experimental test setup. The fixture
consists of a Specimen Mounting Frame (see Figure 3.11(a)) and an Actuator Armature
(see Figure 3.11b). The load was applied to the bridging channel by a manually operated
screw-driven actuator, fixed to the Actuator Armature (see Figure 3.11 through Figure
3.14). The Specimen Mounting Frame was used to secure the cee-stud in place and to
isolate the web portion of the specimen (see Figure 3.11(a)). One end of the actuator was
connected to an S-beam load cell, and the other end was connected to the vertical channel
of the Actuator Armature by a 3/4 inch diameter SAE Grade 5 bolt. The Actuator
Armature was bolted to the web of C8x11.5. The channel section was welded to top
flange of a W8x24 whose bottom flange was bolted to the test fixture base plate. A plate-
coupler was introduced between the bridging and the S-beam load cell at Point A (see
Figure 3.11 and Figure 3.12), that allowed the load to be transmitted to the bridging
channel through the plate-coupler by a 3/8 inch diameter SAE Grade 8 bolt. The joint
between the actuator and the vertical channel of the Actuator Armature was free to rotate
horizontally, while the joint between the plate-coupler and the bridging channel was free
to rotate vertically. All members and connections were checked prior to the
commencement of any testing to verify that the limit state of the loading system would be
at the bridging connection and not at any of the components of the test fixture. A shear
test was performed on the 3/8 inch diameter bolt, the design strength of the plate coupler
was calculated based on its as-built measurements, and the weld strength used to fabricate

43
the plate-coupler was checked. For the out-of-plane load tests, a 500 lb load cell was
used and for the in-plane load tests, a 10 Kip load cell was used. This change was
necessary since the strength predictions for the in-plane tests were found to be beyond the
safe working range of the 500 lb load cell.
3.7.3 Instrumentation
The instruments used for the out-of-plane loading tests are shown in Figure 3.15
and for the in-plane loading tests in Figure 3.16. For both the loading conditions, three
linear string type potentiometers were used to capture the spatial movement of Point A on
the bridging where it is connected to the load actuator, each measuring the X, Y and Z
displacements, respectively. Five linear potentiometers located as shown in Figure 4.44
were used to measure the displacement of the bridging connection and the stud web, two
on the front side (LP-1, LP-2), two on the back side (LP-3, LP-4), and an additional one
on the back side (LP-5) located approximately one foot above the location of the bridging
connection to the stud web. For the SS type connection, LP-1 and LP-2 were attached to
the screw heads to measure the pullout of the screws, while LP-3 and LP-4 were attached
on the back to measure the movement of the web plate just below the screws. The
measurements recorded by LP-5 showed that at locations removed from the connection
the web is unaffected by the loading. For the WW type connection, LP-1 and LP-2 were
attached at relatively the same location as in SS type connection, but to measure the
horizontal movement of the vertical leg of the clip angle. For the DW type connection,
LP-1 and LP-2 were attached at relatively the same location as in SS type connection, but
to measure the horizontal movement of the stud web.

44
3.7.4 Out-of-Plane Loading Test Procedure
The specimen mounting-frame and the Actuator Armature were aligned and
anchored to the floor (see Figure 3.11). In this setup, the Actuator Armature was placed
perpendicular to the centerline of the bridging channel, with the armature centerline
passing through Point A. The test specimen was placed in the specimen mounting-frame
and aligned horizontally and vertically. Figure 3.13 shows an overall view of the
specimen in the test fixture, and Figure 3.15(a) shows a view of the connection between
the bridging channel and the actuator. The specimen was secured on the front and on the
back by four rigid hot-rolled steel members, to isolate the web for testing. To maintain
the same spatial position of Point A for all the tests, it was triangulated and the locations
of the linear string type potentiometers were adjusted to achieve an orthogonal coordinate
system to a reasonable accuracy of 0.10 inch. The actuator arm was rotated at
approximately 20 to 25 cycles per minute, manually. As the load-displacement curve
started to soften and the connection started to loose its rigidity. The connection
eventually failed when it could not carry the applied load, by attaining any of the failure
states described in Chapter 4.
3.7.5 In-Plane Loading Test Procedure
The specimen mounting-frame and the Actuator Armature were placed in line with
the bridging channel of the stud specimen and anchored to the floor (see Figure 3.12).
The test specimen was placed in the specimen mounting-frame and aligned horizontally
and vertically. The specimen was then secured on the front and on the back by four rigid
hot-rolled steel members, to isolate the web for testing. Figure 3.13 shows the overall
view of a specimen in the test fixture, and shows a view of the connection between the

45
bridging channel and the load actuator. The actuator arm was turned at approximately
one-half a revolution per second until the bridging failed.

46
Table 3.1 As-built Material Properties from the Tension Coupon Tests
Specimen ID Yield Stress (0.2% offset)
Upper Yield Stress
Lower Yield Stress
Ultimate Stress
TC D S B t ID Ksi ksi ksi ksi TC 362 S 125 33 1 - 47.26 46.40 54.68 TC 362 S 125 33 2 48.51 49.17 48.59 55.88 TC 362 S 125 33 3 48.55 49.17 49.40 55.89
Average 48.53 48.53 48.13 55.48 TC 362 S 162 43 2 46.65 46.90 46.43 57.62 TC 362 S 162 43 3 46.73 46.84 46.13 57.64 TC 362 S 162 43 4 47.98 48.31 47.22 58.60 TC 362 S 162 43 5 46.80 47.83 47.25 58.94
Average 47.04 47.47 46.76 58.20 TC 362 S 162 68 2 50.12 51.91 51.72 66.62 TC 362 S 162 68 3 51.75 51.78 51.24 67.34 TC 362 S 162 68 4 54.15 54.35 53.96 69.43
Average 52.01 52.68 52.30 67.80 TC 600 S 125 33 1 23.82 - - 45.22 TC 600 S 125 33 3 26.97 - - 45.56 TC 600 S 125 33 5 26.73 - - 44.93 TC 600 S 125 33 7 18.61 - - 35.70 TC 600 S 125 33 8 - - - 36.88
Average 24.03 - - 45.24 TC 600 S 162 43 2 45.12 45.48 44.06 53.03 TC 600 S 162 43 3 46.65 47.49 48.37 55.65 TC 600 S 162 43 4 46.75 47.28 45.86 55.65 TC 600 S 162 43 5 46.43 47.79 47.16 55.18
Average 46.24 47.01 46.36 54.88 TC 600 S 162 43 3a 50.27 50.81 50.63 59.21 TC 600 S 162 43 4a 50.34 51.58 51.24 59.56
Average 50.30 51.19 50.94 59.38 TC 600 S 162 97 3a 60.40 60.70 59.23 70.38 TC 600 S 162 97 3b 61.10 62.05 59.31 70.28 TC 600 S 162 97 4 59.10 59.87 58.30 69.96
Average 60.20 60.87 58.94 70.21 TC 800 S 162 43 1 - 40.65 40.20 55.03 TC 800 S 162 43 3 - 40.50 40.20 54.47 TC 800 S 162 43 4 - 40.88 40.30 55.20
Average - 40.68 40.23 54.90 TC 800 S 162 97 1 42.12 45.62 44.39 66.79 TC 800 S 162 97 3 43.32 44.55 44.51 68.00 TC 800 S 162 97 4 42.06 47.01 46.56 67.69
Average 42.50 45.73 45.15 67.49

47
Table 3.2 As-Built Cross-Sectional Dimensions of Test Specimens Average As-Built Measurements
Lip Flange Web Flange Lip Web Lip Flange Web Flange Lip Stud Designation Target Brace
Stiffness A B C D E F ta tb tc td te D S B t ID lbs/in. in. in. in. in. in. in. in. in. in. in. in.
362 S 125 33 1 200 0.252 1.317 3.613 1.259 0.209 3.589 0.033 0.039 0.034 0.034 0.032 362 S 125 33 2 400 0.252 1.316 3.613 1.258 0.205 3.584 0.036 0.035 0.033 0.035 0.032 362 S 125 33 3 100 0.251 1.321 3.616 1.258 0.206 3.603 0.036 0.036 0.034 0.036 0.034 362 S 125 33 4 100 0.253 1.318 3.616 1.259 0.208 3.593 0.034 0.035 0.033 0.035 0.032 362 S 125 33 5 0 0.251 1.319 3.612 1.256 0.203 3.589 0.031 0.036 0.034 0.035 0.032 362 S 125 33 6 100 0.250 1.318 3.612 1.256 0.204 3.597 0.032 0.035 0.034 0.035 0.031 362 S 125 33 0.252 1.318 3.613 1.258 0.206 3.590 0.033 0.036 0.034 0.035 0.032
362 S 162 43 1 0 0.541 1.637 3.562 1.603 0.531 3.547 0.044 0.042 0.042 0.042 0.044 362 S 162 43 2 200 0.530 1.606 3.563 1.642 0.538 3.541 0.045 0.043 0.043 0.043 0.043 362 S 162 43 3 800 0.536 1.640 3.563 1.607 0.534 3.540 0.044 0.042 0.042 0.043 0.044 362 S 162 43 4 400 0.528 1.602 3.569 1.639 0.538 3.541 0.042 0.042 0.042 0.042 0.042 362 S 162 43 0.534 1.621 3.564 1.623 0.535 3.542 0.044 0.042 0.042 0.043 0.043
362 S 162 68 2 1000 0.526 1.628 3.642 1.706 0.539 3.631 0.0717 0.070 0.070 0.070 0.072 362 S 162 68 3 500 0.546 1.701 3.638 1.629 0.524 3.633 0.074 0.070 0.070 0.070 0.072 362 S 162 68 4 750 0.542 1.705 3.635 1.630 0.536 3.635 --- 0.069 0.069 0.069 0.069 362 S 162 68 5 0 0.543 1.703 3.636 1.629 0.523 3.634 0.076 0.068 0.068 0.068 0.073 362 S 162 68 0.540 1.684 3.638 1.649 0.530 3.633 0.074 0.069 0.069 0.069 0.071
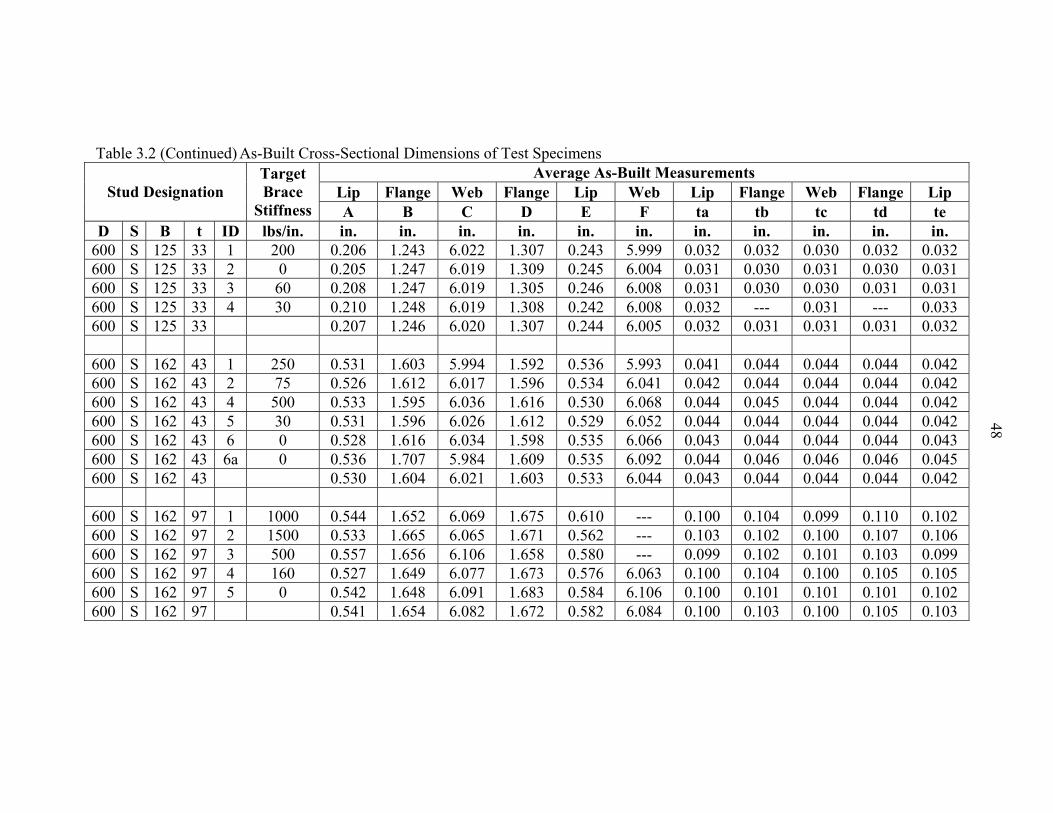
48
Table 3.2 (Continued) As-Built Cross-Sectional Dimensions of Test Specimens Average As-Built Measurements
Lip Flange Web Flange Lip Web Lip Flange Web Flange Lip Stud Designation Target Brace
Stiffness A B C D E F ta tb tc td te D S B t ID lbs/in. in. in. in. in. in. in. in. in. in. in. in.
600 S 125 33 1 200 0.206 1.243 6.022 1.307 0.243 5.999 0.032 0.032 0.030 0.032 0.032 600 S 125 33 2 0 0.205 1.247 6.019 1.309 0.245 6.004 0.031 0.030 0.031 0.030 0.031 600 S 125 33 3 60 0.208 1.247 6.019 1.305 0.246 6.008 0.031 0.030 0.030 0.031 0.031 600 S 125 33 4 30 0.210 1.248 6.019 1.308 0.242 6.008 0.032 --- 0.031 --- 0.033 600 S 125 33 0.207 1.246 6.020 1.307 0.244 6.005 0.032 0.031 0.031 0.031 0.032
600 S 162 43 1 250 0.531 1.603 5.994 1.592 0.536 5.993 0.041 0.044 0.044 0.044 0.042 600 S 162 43 2 75 0.526 1.612 6.017 1.596 0.534 6.041 0.042 0.044 0.044 0.044 0.042 600 S 162 43 4 500 0.533 1.595 6.036 1.616 0.530 6.068 0.044 0.045 0.044 0.044 0.042 600 S 162 43 5 30 0.531 1.596 6.026 1.612 0.529 6.052 0.044 0.044 0.044 0.044 0.042 600 S 162 43 6 0 0.528 1.616 6.034 1.598 0.535 6.066 0.043 0.044 0.044 0.044 0.043 600 S 162 43 6a 0 0.536 1.707 5.984 1.609 0.535 6.092 0.044 0.046 0.046 0.046 0.045 600 S 162 43 0.530 1.604 6.021 1.603 0.533 6.044 0.043 0.044 0.044 0.044 0.042
600 S 162 97 1 1000 0.544 1.652 6.069 1.675 0.610 --- 0.100 0.104 0.099 0.110 0.102 600 S 162 97 2 1500 0.533 1.665 6.065 1.671 0.562 --- 0.103 0.102 0.100 0.107 0.106 600 S 162 97 3 500 0.557 1.656 6.106 1.658 0.580 --- 0.099 0.102 0.101 0.103 0.099 600 S 162 97 4 160 0.527 1.649 6.077 1.673 0.576 6.063 0.100 0.104 0.100 0.105 0.105 600 S 162 97 5 0 0.542 1.648 6.091 1.683 0.584 6.106 0.100 0.101 0.101 0.101 0.102 600 S 162 97 0.541 1.654 6.082 1.672 0.582 6.084 0.100 0.103 0.100 0.105 0.103

49
Table 3.2 (Continued) As-Built Cross-Sectional Dimensions of Test Specimens Average As-Built Measurements
Lip Flange Web Flange Lip Web Lip Flange Web Flange Lip Stud Designation Target Brace
Stiffness A B C D E F ta tb tc td te D S B t ID lbs/in. in. in. in. in. in. in. in. in. in. in. in.
800 S 162 43 2 75 0.537 1.597 7.912 1.604 0.530 --- 0.042 0.043 0.043 0.043 0.042800 S 162 43 3 150 0.535 1.598 7.925 1.605 0.533 --- 0.042 0.043 0.043 0.043 0.043800 S 162 43 4 0 0.533 1.597 7.929 1.608 0.532 0.043 0.043 0.043 0.043 0.043800 S 162 43 5 300 0.528 1.606 7.920 1.597 0.532 --- 0.042 0.043 0.044 0.044 0.041800 S 162 43 0.533 1.599 7.921 1.603 0.532 --- 0.042 0.043 0.043 0.043 0.042
800 S 162 97 1 1000 0.562 1.631 8.053 1.670 0.659 --- 0.101 0.102 0.102 0.103 0.103800 S 162 97 2 500 0.651 1.649 8.048 1.647 0.561 --- 0.102 0.103 0.103 0.103 0.102800 S 162 97 3 0 0.553 1.629 8.041 1.650 0.661 --- 0.101 0.103 0.104 0.103 0.103800 S 162 97 4 2100 0.656 1.647 8.033 1.632 0.556 --- 0.100 0.105 0.103 0.104 0.101800 S 162 97 0.605 1.639 8.044 1.650 0.609 --- 0.101 0.103 0.103 0.103 0.102

50
Table 3.3 Initial Geometric Imperfections Initial Imperfection
Camber Sweep Stud Designation Target Brace
Stiffness B D C D S B t ID lbs/in. in. in. in.
362 S 125 33 1 200 0 0 0 362 S 125 33 2 400 0 0 0 362 S 125 33 3 100 0 0 0 362 S 125 33 4 100 0 0 0 362 S 125 33 5 0 0 0 0 362 S 125 33 6 100 0 0 0 362 S 162 43 1 0 0 0 0 362 S 162 43 2 200 0 0 0 362 S 162 43 3 800 0 0 0.01 362 S 162 43 4 400 0.01 0.02 0 362 S 162 68 2 1000 0 0 -0.187 362 S 162 68 3 500 0 0 -0.155 362 S 162 68 4 750 0 0 0.14 362 S 162 68 5 0 0 0 0.1 600 S 125 33 1 200 0 0 0.1 600 S 125 33 2 0 0 0.07 0.13 600 S 125 33 3 60 0 0 0.12 600 S 125 33 4 30 0 0 0.075 600 S 162 43 1 250 0 0 0.04 600 S 162 43 2 75 0 0 0.03 600 S 162 43 4 500 0.055 0.045 0 600 S 162 43 5 30 0.055 0.053 0 600 S 162 43 6 0 0.065 0.065 0 600 S 162 43 6a 0 0 0 -0.036 600 S 162 97 1 1000 --- --- --- 600 S 162 97 2 1500 --- --- --- 600 S 162 97 3 500 --- --- --- 600 S 162 97 4 160 0 0 0.075 600 S 162 97 5 0 0 0 0.015 800 S 162 43 2 75 0 0 0.09 800 S 162 43 3 150 0 0 0.11 800 S 162 43 4 0 0 0 0.11 800 S 162 43 5 300 0 0.12 0 800 S 162 97 1 1000 --- --- --- 800 S 162 97 2 500 --- --- --- 800 S 162 97 3 0 --- --- --- 800 S 162 97 4 2100 0 0 0.12

51
Table 3.4 Average As-Built Geometric Dimensions of Each Stud Series Clear O/O Dimensions Average Width
Lip Flange Web Flange Lip Web Lip Flange Stud Designation A B C D E F
D S B t in. in. in. in. in. in. in. in. 362 S 125 33 0.2515 1.3175 3.6131 1.2577 0.2058 3.5904 0.2287 1.2876 362 S 162 43 0.5335 1.6212 3.5643 1.6229 0.5352 3.5423 0.5344 1.6220 362 S 162 68 0.5396 1.6842 3.6377 1.6485 0.5304 3.6329 0.5350 1.6664 600 S 125 33 0.2071 1.2462 6.0197 1.3073 0.2439 6.0045 0.2255 1.2768 600 S 162 43 0.5298 1.6042 6.0213 1.6028 0.5328 6.0439 0.5313 1.6035 600 S 162 43a 0.5363 1.7070 5.9842 1.6092 0.5352 6.0920 0.5358 1.6581 600 S 162 97 0.5405 1.6539 6.0816 1.6717 0.5824 6.0843 0.5615 1.6628 800 S 162 43 0.5330 1.5994 7.9213 1.6033 0.5316 --- 0.5323 1.6014 800 S 162 97 0.6053 1.6388 8.0436 1.6498 0.6091 --- 0.6072 1.6443
Table 3.5 Average As-Built Geometric Dimensions of Each Stud Series
Thickness
Lip Flange Web Flange Lip
Radius of
Bend
Base Metal
Thickness
Internal Radius Stud Designation
ta tb tc td te tavg
R tnet Rint D S B t in. in. in. in. in. in. in. in. in.
362 S 125 33 0.0333 0.0360 0.0336 0.0348 0.0318 0.0339 0.0938 0.0319 0.07781 362 S 162 43 0.0437 0.0424 0.0425 0.0425 0.0432 0.0429 0.0938 0.0409 0.07332 362 S 162 68 0.0735 0.0691 0.0691 0.0693 0.0714 0.0705 0.1409 0.0685 0.10669 600 S 125 33 0.0316 0.0307 0.0307 0.0308 0.0315 0.0310 0.0938 0.0290 0.07923 600 S 162 43 0.0427 0.0441 0.0442 0.0443 0.0423 0.0435 0.0938 0.0415 0.07299 600 S 162 43a 0.0442 0.0458 0.0460 0.0460 0.0447 0.0453 0.0938 0.0433 0.07209 600 S 162 97 0.1002 0.1027 0.1004 0.1053 0.1028 0.1023 0.2045 0.1003 0.15440 800 S 162 43 0.0421 0.0431 0.0431 0.0430 0.0422 0.0427 0.0938 0.0407 0.07340 800 S 162 97 0.1008 0.1031 0.1029 0.1031 0.1021 0.1024 0.2048 0.1004 0.15458
Note: Radius of Bend = max [(2 tavg) , 3/32"], Clark’s tables. Internal Radii = (Radius of Bend - tnet /2) Base Metal Thickness = [tavg – 2 mils for galvanizing]

52
Dimensions inches A Length of reduced section, min 2 1/4 B Length of grip section, min 2 C Width of grip section, min 2 D Diameter of hole for pin, min 1/2 E Edge distance from pin, approximate 1 1/2 F Distance from hole to fillet, min 1/2 G Gage Length 2.000 ± 0.005 L Overall Length 8 T Thickness 5/8 R Radius of fillet, min 1/2 W Width 0.500 ± 0.010
Figure 3.1 Dimensions of a Typical Tension Coupon
Figure 3.2 Offset Method for Determining Yield Stress

53
Figure 3.3 Autographic Diagram Method for Determining Yield Stress
Figure 3.4 Typical Cross-Section of a Cee-Stud

54
Figure 3.5 Connection of Cee-Stud and Track (a) at Top, (b) at Bottom
Figure 3.6 Plan View of Single Column Axial Test Setup in the Riehle Universal Testing
Machine
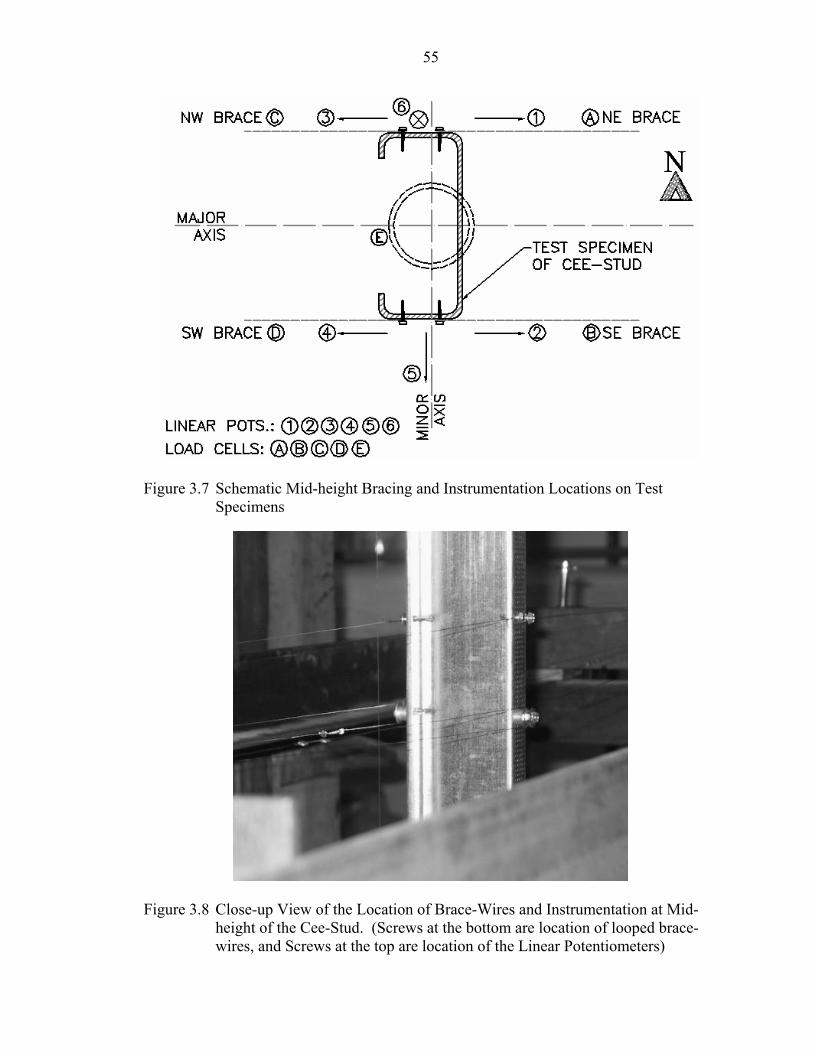
55
Figure 3.7 Schematic Mid-height Bracing and Instrumentation Locations on Test Specimens
Figure 3.8 Close-up View of the Location of Brace-Wires and Instrumentation at Mid-height of the Cee-Stud. (Screws at the bottom are location of looped brace-wires, and Screws at the top are location of the Linear Potentiometers)
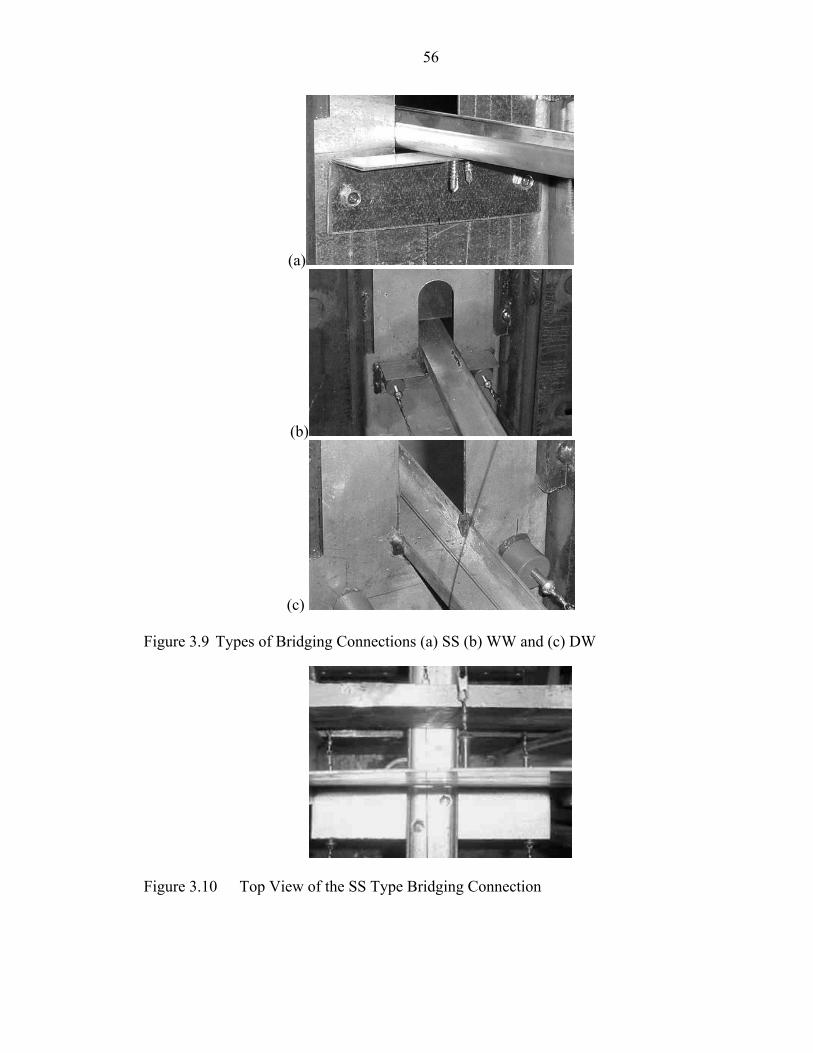
56
(a)
(b)
(c)
Figure 3.9 Types of Bridging Connections (a) SS (b) WW and (c) DW
Figure 3.10 Top View of the SS Type Bridging Connection
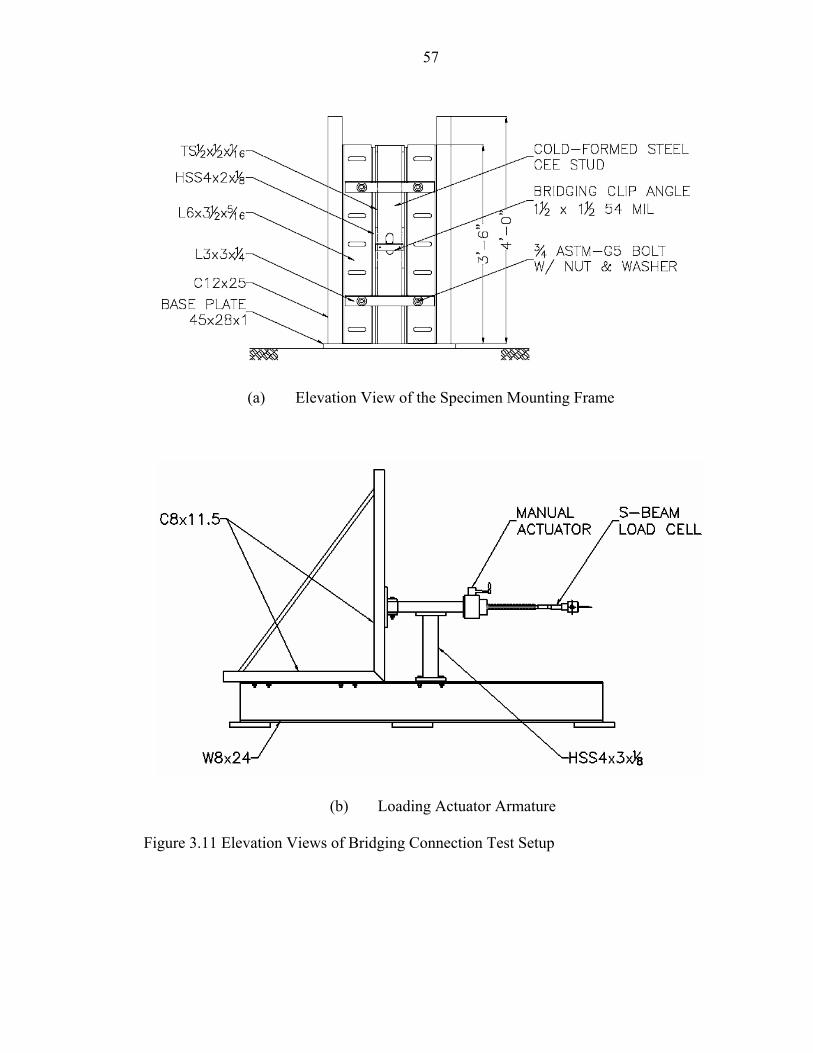
57
(a) Elevation View of the Specimen Mounting Frame
(b) Loading Actuator Armature
Figure 3.11 Elevation Views of Bridging Connection Test Setup

58
(a)
(b)
Figure 3.12 Schematic Plan View of the (a) Out-of-Plane Bridging Test (b) In-Plane Bridging Test

59
Figure 3.13 Overall View of the Out-of-Plane Bridging Tests
Figure 3.14 Overall View of the In-Plane Bridging Tests

60
Figure 3.15 Out-of-Plane Loading Test Instrumentation on the (a) Front (b) Back
(a)
(b)
Figure 3.16 In-plane Loading Test Instrumentation on the (a) Front (b) Back

61
CHAPTER 4 EXPERIMENTAL RESULTS AND EVALUATION
Experimental tests on single column specimens and bridging specimens were
performed as per the test protocols described in Chapter 3. The individual test reports for the
single column tests and the bridging test results can be found in Urala (2004). This chapter is
divided into four sections, the first section deals with the results of the single column axial
tests and discusses the effect of brace stiffness and strength on the load carrying capacity,
mid-height lateral displacement and effective length of the braced columns. The second
section deals with the axial pullout strength and torsional stiffness of the three bridging
connections for eight series of cee-studs. The third section deals with the relationship
between the flexible bracing and the bridging strength and stiffness. The fourth section
summarizes the experimental evaluation.
4.1 Single Column Axial Load Test Results
In the single column axial load tests a total of 37 studs were tested based on the
following parameters:
• Cross-sections o 362S125-33, 362S162-43, 362S162-68
o 600S125-33, 600S162-43, 600S162-97
o 800S162-43, 800S162-97
• Unbraced Test Specimens versus Braced Test Specimens • Bracing Stiffness
o Under-Braced – less than ideal bracing
o Ideally-Braced – equal to ideal bracing
o Over-Braced – greater than ideal bracing
62
Table 4.1 provides the proposed test matrix for the 8’-0” long single column axially
loaded cee-stud specimens. Due to certain experimental limitations, the actual test matrix is
as given in Table 4.2, where the numbers in the table represent the number of tests conducted
at that brace stiffness. The specific reasons for the changes from the proposed test matrix
compared to the actual test matrix are described in the course of this chapter.
4.1.1 Bracing Strength and Stiffness
Eight groups of cee-studs were tested with a total of 37 test specimens. The AISIWIN
software program (AISIWIN 2000) was used to determine the nominal properties of the eight
groups of test specimens, with appropriate nominal values of material yield and ultimate
stress. Table 4.3 gives the ultimate and unfactored capacities of each of the stud groups. The
target brace stiffness, for single nodal bracing (n=1), was calculated using Eq. 2.14, as
recommended by Yura (1995), where the unbraced length of the column was taken as the
distance between the support and the point of bracing (Lb = 48.0 inches). The target bracing
stiffness is also tabulated and provided in Table 4.3.
The measured geometric dimensions and the results of the material tension coupon
tests for each group of cee-studs were then used to recalculate the ideal brace stiffness using
AISIWIN (2002). Table 4.4 gives the values of the required ideal bracing stiffness for each
of the studs. The single column axial load tests were conducted on cee-stud specimens with
varying brace stiffnesses, which were lesser than, equal to, or greater than the ideal brace
stiffness. As discussed earlier, at least one cee-stud per series was tested without any lateral
(or torsional) bracing.
The cee-studs were braced with four steel wires attached at mid-height of the member
to the flanges, as shown in Figure 4.1. By varying the length and diameter of the brace wires
the brace stiffness was varied from one test specimen to the other. The brace strength was

63
calculated as the product of the cross-sectional area of the wire and its nominal tensile
strength. The actual brace stiffness (kbr) was calculated as the average value of the brace
stiffnesses of all four wires. The brace stiffness of each wire was calculated using Eq.4.1a.
)a1.4(LAEk
brbr =
where: A = Cross-sectional area of the wire
E = Elastic Modulus of steel wire= 29,000,000 psi.
Lbr = Length of brace wire
At any time during the test only two brace wires, out of the four, were effective in
bracing the stud. If the stud buckled in a flexural mode, the two brace wires on the same side
of the web were effective, whereas if the stud buckled in a torsional mode, the two diagonally
opposite brace wires were effective in bracing the stud. Therefore, the total brace stiffness
was taken as twice the average stiffness of the four brace wires, and is given in Table 4.5.
The ratio of the total brace stiffness provided to the required ideal brace stiffness, (βprovided/
βrequired) is defined as the brace-factor. The brace-factor for each of the 37 test specimens is
listed in Table 4.5, which was used to categorize the cee-studs as: under-braced, ideally-
braced or over-braced (i.e. brace-factor <1.0, =1.0, or >1.0).
The column effective length factors were taken from Table C-C4-1 of the Commentary
to the North American Specification for Cold-Formed Steel (AISI 2000). For flexural
buckling about the weak axis the effective length factor was taken as Ky=1.0 for the unbraced
studs and Ky=0.5 for the braced studs. This effective length factor was assumed to be the
same for all three categories of braced studs. For flexural buckling about the strong axis, it
was considered that the track offered near full base fixity, and hence the effective length
64
factor was taken as Kx=0.5. Since the top and bottom supports prevented the stud from
twisting, and the effective length factor was taken as KT=0.5.
4.1.2 Evaluation of Experimental Observations
The evaluation of the experiments provided below will be based on a review of the test
parameters such as the effect of cee-stud dimensions, the brace stiffness and the brace
strength. The experimental results are compared to analytically calculated values of axial
load capacity and the expected brace forces based on the measured lateral displacements.
The effect of brace stiffness on the axial load capacity has been studied and the graphically
illustrated in Figure 4.2 to 4.9 and has been discussed in this section. Figure 4.10 gives the
buckling modes and shapes of the experimental observations, which is explained later in this
chapter.
While keeping the brace-factor constant between two or more studs, the following
parametric studies were performed based on the cross-section dimensions:
• Web depth, keeping the brace-factor relatively the same.
Comparing 362S125-33 and 600S125-33 (Figures 4.11 to 4.13)
Comparing 362S162-43, 600S162-43 and 800S162-43 (Figures 4.14 to 4.16)
Comparing 600S162-97 and 800S162-97 (Figures 4.17 to 4.19)
• Thickness, keeping the brace-factor relatively the same:
a. Comparing 362S125-33, 362S162-43 and 362S125-68 (Figures 4.20 to 4.22)
b. Comparing 600S125-33, 600S162-43 and 600S162-97 (Figures 4.23 to 4.26)
c. Comparing 800S162-43 and 800S162-97 (Figures 4.27 to 4.29)
Figures 4.11 through 4.29 have been normalized with respect to the analytical values of
axial load and the corresponding axial shortening using the average as-built properties of
each stud group obtained from AISIWIN (2002). The effect of different material properties
65
has been considered in the above normalization by including it in the AISIWIN program.
With increasing web depth and flange width, the slenderness ratio of the web and flange plate
elements increases. This leads to a loss of elastic stiffness in the web and hence the load
carrying capacity of the studs decreases and is evident in the comparisons described above.
Figures 4.11 to 4.13 indicate that the 600S125-33 studs have undergone nearly twice the
axial deformation compared to the 362S125-33 studs, for nearly the same brace factor. Both,
the unbraced 362S and 600S studs have attained almost a normalized load of 1.35 times than
the analytical prediction, but their normalized axial deformations at the maximum load being
1.6 and 4.6, respectively. In Figure 4.12, the 362S and 600S studs with a brace factor of 1.7x
and 1.3x, have attained nearly 1.0 and 1.4 times the analytical prediction for a mid-height
braced stud, respectively. Comparing the 362S and 600S studs in Figure 4.13, with brace
factors 6.2x and 7.4x, respectively, shows that the normalized axial shortening being 1.25
and 3.3 at normalized axial loads of 1.25 and 1.15, respectively.
Figures 4.14, 4.15 and 4.16 show the comparison of the 362S, 600S and 800S studs for
the same plate thickness of 43 mils. The 362S, 600S and the 800S unbraced studs recorded a
normalized axial load of 2.6, 1.4 and 2.0 at corresponding normalized axial shortening of 2.6,
3.0 and 3.8, respectively. Comparing the 362S (1.2x), 600S (1.6x) and 800S (1.3x) studs in
Figure 4.15 shows that normalized axial loads are 1.4, 1.05 and 0.85 for corresponding
normalized axial shortening of 1.75, 2.2 and 2.1 respectively. In the 800S162-43-150 stud
the buckling mode was distortional hence the experimental maximum load was less than the
analytical value. When the brace factor was greater than 2.0, as in the case of 362S (2.5x),
600S (3.4x) and 800S (2.3x) studs, the normalized axial loads were 1.35, 1.0 and 1.0 with
corresponding normalized axial shortening being 1.8, 2.0 and 1.0, respectively. It can be

66
observed from all the three figures that the 362S studs not only have the highest elastic
stiffness but also have the highest load enhancement. In Figure 4.16, due to strong axis
buckling of the 800S162-43-300 stud, the axial shortening was neutralized by the elongation
in the north flange. However, the slope of latter part of the plot shows that this stud had an
elastic stiffness that was less than the stiffness of the other two studs that are in the
comparison.
The comparison of the 600S and 800S studs with a plate thickness of 97 mils with
varying brace stiffness is shown in Figures 4.17 to 4.19. It can be observed that the 800S
(0x, 2.1x, and 4.3x) studs have lesser elastic stiffness and the maximum normalized axial
loads attained are 2.5, 1.1, and 1.1 at corresponding normalized axial shortening of 2.5, 2.7,
and 2.15, respectively. On the other hand, the 600S (0x, 1.7x, and 2.7x) studs have higher
elastic stiffness and the normalized axial loads attained are 2.8, 1.2 and 1.25 at corresponding
normalized axial shortenings of 1.4, 1.65, and 1.05. Since the 800S studs have a higher web-
depth to thickness ratio for a given thickness than the 600S studs, this results in a lesser
elastic stiffness.
Figures 4.20 to 4.22 (362S), Figures 4.23 to 4.26 (600S), and Figures 4.27 to 4.29
(800S) show the comparison of studs with constant web-depth while varying the thicknesses.
The brace-factors are maintained approximately the same in these comparisons.
Figure 4.20 compares the 362S unbraced studs with 33, 43 and 68 mil thicknesses.
The failure modes were first mode flexural-torsional for all the three studs, where as the
maximum normalized axial loads were 1.25, 2.6 and 1.5 at corresponding normalized axial
shortenings of 1.3, 2.6 and 6.6, respectively. For the 362S braced studs (see Figure 4.21) of
thicknesses 33 mils, 43 mils and 68 mil, with respective brace factors of 1.7x, 1.2x, and 1.8x,

67
the maximum normalized axial load were 1.0, 1.4 and 1.35 at corresponding normalized axial
shortenings of 0.7, 1.75, and 1.7, respectively. In Figure 4.22, the studs had respective brace
factors of 6.2x, 5.4x, and 3.3x with maximum normalized axial loads of 1.25, 1.25, and 1.5,
at corresponding normalized axial shortenings of 1.2, 1.6, and 2.3, respectively.
Figure 4.23 compares the 600S studs with thicknesses of 33, 43 and 97 mils. For the
unbraced studs the maximum normalized axial loads were 1.3, 1.45, and 2.85, at
corresponding normalized axial shortenings of 4.1, 3.0, and 1.5, respectively. For the braced
studs (see Figure 4.24) with respective brace factors of 0.2x, 0.6x, and 0.3x, the maximum
normalized axial loads were 1.05, 0.85, and 1.2, at corresponding normalized axial
shortenings of 3.4, 2.0, and 1.05, respectively. In Figure 4.25, the 600S studs with brace
factors 1.3x, 1.6x, and 1.7x were compared, and the maximum normalized axial loads were
1.25, 1.05, and 1.25, at corresponding normalized axial shortenings of 3.1, 2.2, and 1.6,
respectively. In Figure 4.26, the 600S studs with brace factors 7.4x, 3.4x, and 2.7x were
compared, and the maximum normalized axial loads were 1.2, 1.05, and 1.25, at
corresponding normalized axial shortenings of 3.3, 2.1, and 1.35, respectively.
For the 800S studs with 43 and 97 mil thicknesses shown in Figure 4.27, with no
bracing, the normalized axial load reached maximum values of 2.0 and 2.5 at corresponding
normalized axial shortenings of 3.6 and 2.5, respectively. For the braced studs with 1.3x and
1.2x, respective brace factors, the maximum normalized axial load was 0.85 and 1.05 at
corresponding normalized axial shortenings of 2.1 and 1.4, respectively. Both, the 800S162-
43-150 and 800S162-97-500 studs failed in distortional buckling mode. The distortional
buckling prevented the stud to reach the analytically calculated fully braced capacity, in spite
of the brace factor being greater than ideal bracing. When the 800S studs with respective

68
brace factors of 2.3x and 4.3x were compared (see Figure 4.29), the maximum normalized
axial loads were 1.0 and 1.1 at corresponding normalized axial shortenings of 0.95 and 2.15,
respectively.
4.1.2.1 Effect of brace stiffness on axial load capacity
It can be observed from the combined plots of each series of the studs that there is a
considerable enhancement in the load carrying capacity of a braced stud in comparison to an
unbraced stud. Figures 4.2 to 4.9 indicate that for brace stiffnesses higher than the ideal
bracing requirement, the experimental maximum loads attained remain unchanged. Table 4.6
gives both, the experimental maximum load and the percentage increase in the axial load,
which clearly indicates the load enhancement.
Figure 4.2 to 4.9 also show that the initial elastic stiffness (k) line, which was
calculated using:
)b1.4(L
EAk g=
where: Ag = Gross cross-sectional area of the cee-stud
E = Young’s Modulus = 29,500,000 psi
L = Length of an unbraced stud = 8’-0”
The 362S125-33 studs failed by flexural-torsional buckling with flexural buckling
occurring about the weak and strong axes and torsional buckling occurring about the shear
center. Due to the strong axis flexural buckling, the north flange was elongating and the
south flange was shortening, this in combination with the torsional buckling influenced the
axial shortening and the studs hence exhibited unanticipated behavior. Beyond the ultimate
capacity, these studs seem to lose load gradually. Figure 4.2 shows the plot of axial load
versus axial shortening of the 362S125-33 series studs.

69
It can be observed from Figure 4.3 that the load-deformation behavior of 362S162-43
studs have the same slope as that of the initial elastic stiffness line up to an axial load of
approximately 5200 lbs at which the unbraced stud failed. Beyond this load, the plot
indicates that the braced studs begin to lose stiffness, and on reaching the ultimate load the
failure is instantaneous.
In the case of 362S162-68 series studs, the load-deformation behavior, shown in Figure
4.4, seem to have an initial stiffness that is almost comparable to the initial elastic stiffness
up to their ultimate capacities. There is a substantial increase in the ultimate load capacity of
the braced studs over the unbraced stud and the studs failed instantaneously on reaching the
ultimate load.
The 600S125-33 and 600S162-43 series studs had lower stiffness than the calculated
initial elastic stiffness, which can be observed in Figures 4.5 and 4.6. In the 600S125-33
series, the under-braced stud failed by first mode flexural buckling and all the others failed
by distortional buckling. In the 600S162-43 series, the unbraced stud failed in first mode
flexure, and the remaining studs failed by distortional buckling. In both the series,
distortional buckling seems to affect the elastic stiffness in comparison to the 362S series of
studs that failed by global buckling. The load-deformation behavior of the 600S162-97
series of studs, shown in Figure 4.7, seems to have the same slope as the initial elastic
stiffness line, and braced studs seem to have almost the same ultimate loads.
The 800S162-43 series of studs did not exhibit a very high load enhancement in spite
of them being either ideally-braced or over-braced. Due to certain limitations in the
experimental setup, two of the studs exhibited strong axis buckling that caused stretching of
their north flange, which affected the measured axial shortening. When the axial load

70
reached a value that was critical to weak axis buckling, the stud exhibited weak axis buckling
and the slope of the load-deformation plot changed sharply, which is shown in Figure 4.8.
The slope of the remaining plot indicates that the studs had lesser stiffness than the initial
elastic stiffness. The ultimate capacities of these studs were comparable to the calculated
axial capacities. This indicates that the top and bottom supports do not have any partial
restraint and the supports act like a pinned connection. This clearly indicates the requirement
of an independent study on the affect of support conditions on the buckling of the cee-studs.
In the case of 800S162-97 stud group, the ultimate capacities of the braced studs are
slightly greater than that of the unbraced stud. Figure 4.9 shows that the cee-studs have a
lower elastic stiffness than the initial elastic stiffness.
The results of the experimental tests are tabulated in Table 4.6 which gives the
maximum experimental load measured, observed failure modes and percentage increase in
the axial capacity of the braced stud over the unbraced stud. It was generally observed that
the maximum experimental loads are higher than the predicted capacities from AISIWIN
(2002). For all the unbraced studs the predicted axial load capacity with nominal cross-
section properties and nominal yield strength, in the AISIWIN (2002) program, was less than
the measured maximum experimental loads. This is because the AISIWIN (2002) program
considers a perfect pin-ended support condition for both flexural and torsional buckling. In
the experimental investigation, the cee-studs were seated in standard track at both ends that
provided end-conditions of partial fixity for weak axis flexural buckling and near full fixity
for both strong axis flexural buckling and torsional buckling. These end restraints led to
higher axial load capacities for the studs that failed by global buckling, i.e. flexural, flexural-
torsional or torsional buckling. The 600S125-33, 600S162-43 series of studs failed by a

71
distortional buckling limit state at axial loads lower than those predicted by AISIWIN (2002)
for a perfectly pin-ended column. This necessitates the consideration of distortional buckling
as a possible controlling and critical limit state for certain stud geometries. AISIWIN does
not consider the distortional buckling limit state while predicting the axial capacity of cold-
formed lipped cee studs.
The enhancement in the load carrying capacity of a stud is directly related to the type
of buckling failure that occurred. The percentage enhancement in the experimental load for
the braced studs compared to an unbraced stud, within the same series, is given in Table 4.6.
The braced studs of the 362S125-33 series attained nearly 140% more load capacity than the
unbraced stud, and the buckling was mainly global second mode flexural-torsional buckling.
The braced studs of the 362S162-43, 362S162-68 series showed a load increase of about
35% and 115%, respectively. Though the 600S125-33 and 600S162-43 series studs failed by
distortional buckling, they exhibited an average load increase of 87%, and 34%, respectively
and the 600S162-97 showed an average load increase of about 38%. The 800S series studs,
both 43 and 97 mils, showed only a slight load enhancement as their experimental maximum
capacities were in the range of the predicted axial capacities from AISIWIN. As discussed
earlier, this indicates that the partial support fixity has reduced with increasing column depth.
4.1.2.2 Effect of brace stiffness on buckling type and mode
Figure 4.10 is a schematic diagram of the observed buckling shapes and modes of the
test specimens. The abbreviations in Table 4.6 and Figure 4.10 represent: F = Flexural
Buckling, T = Torsional Buckling and the digit in brackets represents the number of half-sine
waves or the order of buckling mode. This figure does not include the distortional buckling
mode, which may or may not be associated with the global buckling modes.
72
It was observed that with an increase in the brace stiffness the test specimens failed
after attaining a higher order buckling mode. In some cases, under-braced studs failed at
loads higher than the over-braced studs. However, in the former, the failure has been sudden
and in the latter, the failure has been gradual. With increasing brace stiffness, the 362S studs
exhibited flexural-torsional buckling changing from first mode to second mode. The
600S125-33 and the 600S162-43 studs failed by distortional buckling irrespective of the
bracing stiffness. With increasing bracing stiffness, the 600S162-97 studs failed by flexural
and/or flexural-torsional buckling. The 43 mil 800S studs failed by first mode flexural which
changed to second mode flexural buckling with increasing bracing stiffness, however
distortional buckling was also observed in one of the stud. In the 97 mil 800S studs, the
nothing definite can be stated in terms of failure since distortional mode controlled two of the
studs and only one stud failed by first mode torsional buckling. Among the 33, 43 and 68 mil
studs, irrespective of the total depth of the stud, local elastic buckling waves were observed
in the web and distortional buckling waves were observed in the flanges. The local elastic
buckling is related to the flat-widths to thickness ratio of the web and the flanges. The reader
is advised to refer to Urala (2004) for photographs of the buckling modes for various studs.
4.1.2.3 Effect of cross-sectional dimensions of cee-studs
The 33, 43 and 68 mils studs underwent elastic local and distortional buckling at loads
in the range of 10 to 25% of their ultimate capacities. On the other hand, the 97 mil studs did
not show the same elastic local buckling. However local buckling was observed near the
punchout, at axial deformations beyond those corresponding to the ultimate capacities and
was inelastic permanent deformations. The two types of inelastic local buckling generally
observed in the 600S162-97 and the 800S162-97 series were local yielding of the lip-flange
junction and local distortion around the web-punchouts. The sensitivity of the member to

73
local buckling depends upon its width-to-thickness ratio (Gotluru 2000). It has been
experimentally shown by Young and Rasmussen (1999) that local buckling does not induce
overall bending of fixed-fixed singly symmetric columns, as it does for pin-ended singly
symmetric columns. In the current research, the cee-studs were supported by the track at the
top and bottom, and the degree of fixity offered by the track has to be ascertained. In a later
section in this chapter, the effective length factor for each of the cee-studs is determined
based on the analytical value of the load capacity that corresponds to the maximum
experimental load achieved for each of the test specimens.
4.1.2.4 Effect of experimental load on the brace stiffness and strength
As discussed earlier, most of the unbraced studs failed at loads higher than the
AISIWIN predicted capacities. The higher capacities for the studs necessitated recalculating
the ideal brace stiffness as per Eq. 2.14. Table 4.7 gives the required ideal brace stiffness
based on these higher load capacities of the unbraced studs. The higher load capacity would
require a higher demand on the lateral bracing as given in Table 4.7. This higher demand on
the bracing stiffness renders some of the braced cee-studs to fall into the category of under-
braced cee-studs since the provided brace stiffness is now less than the new ideal bracing
requirement. The bracing strength however remained satisfactory since the brace wires were
capable of carrying the increased brace force.
It was observed in the plots of experimental load versus target brace stiffness in
Figures 4.3 to 4.9 that by increasing the brace stiffness there is a gradual increase in the axial
capacity of the stud. Figures 4.30 to 4.32 show an increase in capacity of the columns with a
corresponding increase in target brace stiffness. The axial load carrying capacity for the
362S125-33 studs increased by 162%, for the 362S162-43 studs increased by 25.0% and for
the 362S162-68 studs it increased by 129.0% while varying the brace stiffness from an

74
unbraced stud to an over braced stud. It can also be observed in the figure that there is not
much of an increase in the load carrying capacity from an ideally braced stud to an over
braced stud. There was a similar increase in the 600S series of studs, for the 33, 43 and 97
mil thicknesses, with respective increases of 32%, 37%, and 40.0%. It must be made note of
here that all the 33 and 43 mil studs failed by distortional buckling and that a few of them
had lesser experimental maximum loads (see Table 4.6) compared to the analytical prediction
of a mid-height braced stud. In the case of the 800S studs with 43 and 97 mils, there is a
respective increase of 19.0% and 35% in the axial load carrying capacity.
4.1.2.5 Effect of brace stiffness on lateral displacement
For any group of cee-studs, the mid-height lateral displacement of the weak axis
decreased with increasing brace stiffness, as reported by Yura (1995), which was adopted by
the latest edition of the AISC-LRFD Specification (AISC 1999). The plots of axial load
versus mid-height strong axis lateral displacement and weak axis lateral displacement for all
the cee-studs are given in the individual test reports provided in Urala (2004). Figs 4.33 to
4.35 plot the actual total bracing stiffness versus the mid-height weak axis lateral
displacement for the 362S, 600S, and 800S series of studs. These plots show that with
increasing brace stiffness, the mid-height lateral displacement of the weak axis decreases. In
all the series of studs, there was a decrease in the mid-height lateral displacement by more
than 75% from an unbraced stud to an over braced stud.
4.1.2.6 Effect of brace stiffness on effective length of columns
Table 4.8 gives the effect of total brace stiffness and the effective length factors for the
cee-studs. The effective length factors were determined using a MathCAD worksheet
developed by Chen (1996) for the AISI Committee on Specifications for the Design of Cold-
Formed Steel Structural Members. The effective length factors Kx, Ky and Kt were varied to

75
arrive at a predicted load close to the experimental load capacity of each of the eight foot
long 37 cee-studs. It can be observed in Figures 4.36 to 4.43 that by increasing the total
bracing stiffness, the effective length factor of the columns decrease. The effective length
cannot be less than 0.25, hence the plots have been truncated below the limiting value of
0.25. For a column with fully fixed ends, the effective length factor is 0.5, and for such a
column with fully effective mid-height bracing, the effective length factor reduces to 0.25.
For most of the over-braced studs, the effective length factor was 0.25 in strong axis flexural
buckling and torsional buckling. For weak axis buckling, the effective length factor is 0.5,
assuming there is no partial rigidity at the supports.
4.1.2.7 Effect of brace strength on axial capacity
The brace strength, which is dependent upon the cross-sectional area of the wire and its
yield stress, does not affect the buckling of the single axial column specimens because the
brace forces that were generated during the testing were often less than the capacities of the
brace wires. However, the yield strength of the brace wires does affect the behavior of the
stud only when the brace forces reach the yield load of the brace wires. In some preliminary
tests, outside the scope of the test matrix, it was observed that mild steel brace wires did not
provide enough brace strength. When the brace force in the mild steel wire reached its yield
capacity, the brace wire stretched at a constant brace force until failure, causing a non-linear
lateral displacement. It was then decided to conduct the tests with high-strength steel wires.
The steel wire had a tendency to coil and to keep it straight, a threshold brace force of
approximately 2 lbs was applied to each of the four braces prior to testing.
4.1.2.8 Other effects
Among other effects are effects due to geometric imperfections, mechanical properties
of the stud material, track resistance and bearing ends of the stud. The measured geometric

76
imperfections of the test specimens are listed in Table 3.3. As per Winter (1960), the effect
of initial imperfection is to increase the brace force, thus necessitating higher brace stiffness.
It is stated that the stiffness required to attain “full bracing” in an imperfect column (see Eq.
2.3) exceeds that required for the ideal column (see Eq. 2.4), the more so the larger the
imperfection ‘do’. Hence, the required brace stiffness is given by:
( ) ( )2.41d/dββ oidealreq +×=
where βideal = ideal brace stiffness for perfect column
do = measured imperfection in the stud
d = deformation of the brace at the maximum brace force
The total measured brace forces at the maximum axial load for all the studs are
tabulated in Table 4.9. The measured weak axis lateral displacement at the maximum axial
load for all the studs is tabulated in Table 4.10. It is observed that the calculated brace forces
based on the measured displacements, given in Table 4.10, are higher than the corresponding
values of the measured brace forces, given in Table 4.9. This is because of the initial seating,
slipping of brace wires at the loops. However compared to the global effects and at full
capacities, these initial limitations are negligible. Yura (1995) had proposed that the required
brace strength to be 2.0% of the nominal axial capacity of the column, as discussed earlier in
Chapter 2. Table 4.9 gives the measured brace forces as a percentage of the ultimate load. It
is observed that the percentage of measured brace forces ranges from as low as 0.08% to as
high as 1.34% of the ultimate capacity of the cee-studs.

77
4.2 Bridging Test Results
4.2.1 Bridging Connection Strength and Stiffness
In the bridging connection strength and stiffness tests, three types of typical industry
bridging connection specimens were fabricated and tested. The connection types and
specimen details are described under Section 3.7.1 of this report. A total number of 54
specimens were tested, with 28 specimens subjected to out-of-plane loading and 26
specimens subjected to in-plane loading. In the out-of-plane loading, the load was applied
parallel to the web at a distance of 11 inches away on the bridging channel (see Figure 3.13).
In the in-plane loading tests, the load was applied perpendicular to the web at a distance of 11
inches away on the bridging channel (see Figure 3.14). Both the test protocols are described
in Section 3.7.5 of this report. The proposed test matrix is given in Table 4.11. The results
of all the experimental tests are presented in Urala (2004), which is divided into two sections,
with the results of the out-of-plane loading tests in one section and the results of the in-plane
loading tests in another section. The data collected from the out-of-plane loading tests was
used to plot (see Figures 3.11b, 3.12a, 3.15, and 4.44, for visualization):
• the applied load versus the X-direction displacement of Point A;
• the applied load versus the left screw displacement bearing on the adjacent web plate, and
• the applied load versus the right screw pull out displacement from the adjacent web plate.
The data collected from the in-plane load tests were used to generate three plots (see
Figures 3.11b, 3.12b, 3.16 and 4.44 for visualization):
• the plot of the applied load versus the Y-direction displacement of Point A,
• the plot of the applied load versus the left screw bearing displacement on the adjacent web plate, and
78
• the plot of the applied load versus the right screw pull out displacement from the adjacent web plate.
Under both the series of tests, the ultimate load capacity of the connection was taken as
the load at which there was a complete failure or at which there was sufficient deformation in
the test specimen. Sufficient deformation was considered to have occurred when the
measured deformation in the bridging tests, when compared to the single column axially
loaded studs tests, would result in influencing the global limit states of the single column
axially loaded studs. The torsional stiffness of the connection was calculated as a secant ratio
defines as ratio of ultimate load to the rotation of the connection and the flexural stiffness
was calculated as the ratio of the ultimate load to the measured in-plane displacement. The
rotation angle for the torsional stiffness was the angle between the initial center-line and the
final center-line of the bridging channel. The X-direction displacement was used to calculate
the change in angle as the inverse tangent of ratio of the measured displacement and the
distance to Point A from the web of stud.
For the out-of-plane load tests, the right side displacement measured by LP-2 was used
in calculating the torsional stiffness of the bridging. For the in-plane load tests, the average
of the displacements measured by LP-1 and LP-2 (see Figure 4.44) was used to calculate the
flexural stiffness of the bridging. The observed failure modes of the bridging systems are
described later in this chapter.
As described in Chapter 3, the displacements of the clip angle and/or the web were
measured using two linear potentiometers, LP-1 and LP-2, attached to the web as shown in
Figure 4.44 and the displacements of the back of the web were measured using two linear
potentiometers, LP-3 and LP-4. These measurements were common to both out-of-plane and
in-plane loading directions and are given in Tables 4.12 and 4.14. Spatial displacement of

79
Point A was measured, the purpose of which is described in Chapter 3. The experimental
observations for each connection type and the failure mode are described in the following
two sections.
4.2.2 Observations of the Out-of-Plane Experimental Tests
The observations of the out-of-plane loading tests for the three types of connections are
as follows:
• SS type connection (Figure 3.9a): With the application of the out-of-plane load on the bridging channel, the eccentricity of the load created a moment on the connection. The center of rotation of the moment was at the center-line of the stud causing the right screw to pull out and the left-half of the clip-angle to bear against the web plate of the stud. The load capacity of the SS type connection increased with increasing thickness of the web as and is shown in the plots of applied load versus rotation about the center-line of the web in Figures 4.45 to 4.47. The clip-angles failed by forming multiple yield-lines. The increase in plate thickness resulted in proportional increase in the contact area of the screw and the stud causing the increase in pull out capacity.
• WW type connection (Figure 3.9b): On application of the out-of-plane load, the right half of the clip angle started to pull on the stud web, developing tension in the weld, with the left half bearing on the web. In all the tests with WW type connections, failure occurred at the connection of the clip angle to the stud web. The observed failure types are described in a subsequent section in this chapter. The plot of the applied load versus the rotation about the center-line of the web is shown in Figures 4.48 through 4.50.
• DW type connection (Figure 3.9c): In this connection type, the flange of the bridging channel was welded to the stud web at the punchout. This connection failed mainly by tearing of the weld. The plot of the applied load versus the rotation about the center-line of the web is shown in Figures 4.51 through 4.53. It can be seen from these plots, that the initial connection stiffness is not dependent upon the depth of the stud. The effect of the varying web thickness on the connection stiffness cannot be determined, since only one thickness per depth of stud was tested with the DW type connection.
The maximum loads attained and corresponding displacements measured by LP-1 are
given in Table 4.12. The values of displacement given in the table were measured on the
front and on the back, to the right half of the centerline of the web. The final torsional
stiffness of the connection was calculated as a ratio of the maximum load to the
corresponding X-direction displacement at Point A. The initial torsional stiffness was

80
calculated as the initial slope of the load versus rotation plots shown in Figures 4.45 through
4.53. Table 4.13 gives the initial torsional stiffness of the out-of-plane loading tests, at 10%
of the maximum load, calculated as the ratio of the load to the corresponding rotation. It was
observed that within this load range, the initial slope of the plot was linear. For the three
connection types, the plots of torsional stiffness versus the flat-width to thickness ratio are
given in Figures 4.63 through 4.65. It can be observed in Figure 4.63 that for all the three
groups of studs, the slope of the trend line is nearly equal and with the increase in the flat-
width to thickness ratio the stiffness of the connection drops. However, in Figure 4.64 for
the WW-type connection, the stiffness increases with increase in the depth of stud, whereas
the same trend is not true for the DW connection (see Figure 4.65). The DW connection has
the least torsional stiffness, followed by SS type and the maximum torsional stiffness is
observed in the WW type connection.
4.2.3 Observations of the In-Plane Experimental Tests
The observations of the in-plane loading tests for three types of connections were as
follows:
• SS type connection (see Figure 3.9a): With the application of the in-plane load, the screws began to pull out. It was observed that when the clip angle deformed by forming the yield-lines between the two screws attached to the web, there was tilting of the screws. This tilting of the screw caused an increase in the pull out capacity and hence an increase in both the connection strength and stiffness. However, at this load the connection had undergone sufficient deformation and hence failure was considered to have occurred at the load at which this stiffening effect was observed in the plot of the applied load versus the X-axis displacement. The plots of the applied load versus Y-direction displacement for the three groups of stud are shown in Figures 4.54 to 4.56.
• WW type connection (see Figure 3.9b): On application of the in-plane load, the load was transferred from the bridging channel to the clip angle and finally to the stud web through the connecting welds. In all the tests with WW type connection, the failure occurred at the connection of the clip angle to the stud web, either at the weld or the base metal. The plot of applied load versus Y-Direction displacement is given in Figures 4.57 to 4.59.
81
• DW type connection (see Figure 3.9c): In this connection type, the flanges of the bridging channel were welded to the web at the punchout. In this case too, the load path was from the bridging channel to the stud web across these small lengths of weld between the channel flanges. This type of connection was very strong due to the high stiffness of the stud webs and the capacity of the welds. The plot of applied load versus Y-Direction displacement is given in Figures 4.60 to 4.62.
The maximum load and the corresponding displacement of the connection measured on
the front of the web by LP-1 and LP-2 are given in Table 4.14. The displacement values in
the table were measured on the left and right sides on the front of the web. The final flexural
stiffness of the connection was calculated as a ratio of the maximum load to the
corresponding average displacements measured by LP-1 and LP-2. The initial flexural
stiffness was calculated as the initial slope of the load versus displacement plots in Figures
4.54 through 4.62. Table 4.15 gives the initial flexural stiffness at 10% of the maximum
load, calculated as the ratio of the load to the corresponding Y-displacement. The 10% of the
maximum load was taken since it was found that the plot of the load versus displacement was
initially linear within this load range.
The plots of flexural stiffness versus the flat-width to thickness ratio are given in
Figures 4.66 through 4.68 for each connection type. In Figures 4.67 and 4.68 it can be
observed that flexural stiffness decreases with an increase in the depth of the stud for both
WW type and DW type connections. It can be observed that the slopes of the linear fit trend
lines in Figure 4.66 are not the same for the three groups of studs and with the increasing
flat-width to thickness ratio, the flexural stiffness decreases. With increasing web thickness
and for a constant web depth, the flexural stiffness of the SS type connection increases for a
selected series of cee-stud. For a given thickness the flexural stiffness decreases with the
increase in web depth. On comparing the three connection types, the SS type has the least
flexural stiffness, followed by the WW type with highest being for the DW type connection.

82
4.2.4 Observed Bridging Connection Failures
The observed failure types in the out-of-plane loading tests and the in-plane loading
tests for each of the three types of bridging connection are described below. The figures
showing the failure types are given in Urala (2004), and the failure types for each test
specimen are given in Tables 4.12 and 4.14.
4.2.4.1 SS type connection
• Single screw pull out without distortion of the clip angle: This occurred when the clip angle separated from the web plate without any bending deformation or cross-sectional distortion.
• Single screw pull out with either deformation or distortion of the clip angle: The clip angle separated from the web plate by either bending deformation or by distorting. The bending deformation of the clip occurred in the out-of-plane tests, where the clip angle behaved as a cantilever beam subjected to a point load at the right screw, with the fixity at the left screw. For the in-plane tests, the cross-section distortion occurred when the clip angle formed a yield line in the angle leg connected to the stud web, at the level of the screws.
• Tensile failure of the screw connecting the clip angle to the stud web: The axial tension in the screws attached to the web exceeded the axial tension capacity of the screw, resulting in a sudden failure. These screws failed in the neck region.
• Shear failure of screw connecting the bridging channel to the clip angle: The failure of the connection occurred when the screw capacity in single shear of the screws attaching the clip angle to the bridging channel was exceeded.
4.2.4.2 WW type connection
• Weld failure without angle distortion: In this case, tearing of the weld material between the angle and the cee-stud was observed. Connection failure occurred when the weld strength was exceeded. This was the anticipated mode of failure.
• Angle tear along the leg welded to the cee-stud: In this case, the tearing strength of the clip angle was exceeded, whereas the weld remained intact. In a few specimens, the weld thickness was greater than the design weld, and in few other specimens there was a weld return at the root of the clip angle.
• Weld separation between the clip angle and the cee-stud: The weld remained intact and stripped off with the clip angle, which indicates poor weld penetration.

83
4.2.4.3 DW type connection
• Tearing of weld between the bridging channel and the cee-stud: This occurred when the load on the weld exceeded the weld strength and there was a good weld between the connected elements.
• Tearing of cee-stud web around the weld material: This occurred when there was complete weld penetration and there was block tear out of the web plate.
• Weld separation between the bridging channel and the cee-stud: The weld remained intact and stripped off with the bridging channel, which indicates poor weld penetration.
The summary of results for the out-of-plane load tests and in-plane load tests, giving
the initial torsional stiffness and initial flexural stiffness are given in Table 4.16 and 4.17,
respectively. The initial stiffnesses have been arranged based on the web depth and on the
thickness of the cross-section. This table represents the same data discussed previously and
is provided for convenience purposes.
4.3 Separation of Brace Forces in Flexural and Torsional Components
The brace forces BF-1, BF-2, BF-3 and BF-4 were measured using load cells A, B, C,
D (as shown in Figure 3.6) and are plotted against the axial load for all 36 stud tests, which
are presented in Urala (2004). The axially loaded braced cee-studs buckled either in flexural,
torsional or flexural-torsional buckling. Due to the aforementioned configuration of the
brace wires, the center of torsional buckling shifted from the shear center to the centroid of
the brace forces. Flexural buckling of the stud resulted in brace forces in two brace wires on
the same side of the minor axis of the stud cross-section. Torsional buckling resulted in
brace forces in the brace wires that were on the diagonally opposite corners of the stud cross-
section. In the case of flexural-torsional buckling there were both flexural and torsional
brace forces.
84
The total brace force was a resultant of the flexural and the torsional components,
which can be resolved as shown in Figure 4.69. The measured brace forces in the brace
wires were the resultant brace force due to global buckling. At any axial load level, the
measured brace force was separated into two components, namely flexural and torsional
brace force components. The flexural brace force component is the brace force in the two
brace wires as shown in Figure 4.69(b), which have the same magnitude and direction. The
torsional brace force component is the brace force in the two brace wires as shown in Figure
4.69(c), which have the same magnitude but opposite directions. The maximum magnitude
of the flexural brace force component, the corresponding torsional brace force component
and the corresponding axial load are given in Table 4.18. Similarly, the maximum
magnitude of the torsional brace force component, the corresponding flexural component and
the corresponding axial load are given in Table 4.19. In most specimens, the above
maximum values did not occur at the same axial load, and depended upon the buckling shape
and mode at the maximum axial load. The sum of maximum flexural brace force component
and the corresponding torsional brace force component was compared to the sum of
maximum torsional brace force component and the corresponding flexural brace force
component. The greater of the two values was considered as the total maximum brace force.
The brace forces as a percentage of the axial load was computed and is given in Tables
4.18 and 4.19, and the magnitude of the brace factors are given in Table 4.5 for comparison.
It is observed that from an under-braced stud to an over-braced stud in the 362S125-33,
362S162-43, 600S162-97 and 800S162-43 series, the total maximum brace force increased
with the increase in the brace factor. In the case of 600S125-33 and 600S162-43 series of
studs, the observed failure was mainly due to distortional buckling, resulting in brace forces
85
that did not bear any relation to the brace factor. In the case of the 362S162-68 and
800S162-97 series, the provided brace factors were greater than the ideal requirement and
hence the total maximum brace forces are almost the same.
4.4 Summary of Experimental Observations
The axial capacities of the cee-studs were determined by the AISIWIN (2002) program
by considering the nominal cross-section dimensions and nominal yield stress of 33 ksi. and
of 50 ksi. These values were used to calculate the ideal brace stiffness. The test matrix given
in Table 4.1 was proposed for target bracing stiffnesses less than, equal to and more than the
ideal bracing stiffness, and the studs being categorized as being – under-braced, ideally-
braced or over-braced. The nominal values from AISIWIN and the average as-built values of
test specimen geometry and the material yield and ultimate strength are given in Tables 4.3
and 4.2B, respectively. The target brace stiffness, the total brace stiffness and the brace-
factor was determined for each stud, which is given in Table 4.5. The single column axial
load tests on the unbraced cee-studs showed that the predicted axial capacities were lower
than the experimental maximum loads. Since the required bracing stiffness and strength are
functions of the axial capacity, they increase with an increase in the axial capacity. This
required recalculation of the brace stiffness and modification of the test matrix as given in
Table 4.2. The required brace stiffnesses and the brace-factors were determined as given in
Table 4.7.
The observed failure types were broadly classified as global or local. Figure 4.10
shows the global buckling types (flexural, torsional and flexural-torsional) and modes (first
and second). The local buckling types were elastic plate buckling and distortional buckling.
Table 4.6 gives the buckling type and mode for each stud at failure. The bracing was not
designed to prevent flexural buckling about the strong axis. The elastic waves in the web

86
owing to local elastic plate buckling were observed in the 33, 43, 68 mils cee-studs at loads
as low as 10% of the ultimate capacity. The elastic waves had a half wavelength equal to
width of the web. In addition to the elastic waves, the 600S series (33, 43 mils) and the 800S
series (43 mils) exhibited distortional buckling in the flanges with a half wavelength of about
18 inches. The 600S series studs with a plate thickness of 33 and 43 mils, failed by
distortional buckling of the flanges. The strength prediction using AISIWIN (2002) does not
consider the effect of distortional buckling, and in the case of the stud 600S125-43 with total
brace stiffness of 148 lbs/in, the analytical value was greater than the experimental maximum
load. The 600S and 800S series of studs with a plate thickness of 97 mils exhibited local
inelastic plate buckling at loads beyond the ultimate capacity. These studs failed by global
buckling in first mode, which indicates that the brace stiffness was inadequate to force the
stud to buckle in a higher mode. This may be attributed to the decrease in the resistance
offered by the end track supports. For a given stud thickness, the ratios of strong axis to
weak axis moment of inertias of the 800S and the 600S studs is higher than that of the 362S
studs, which bears direct relation to the buckling shape. The resistance offered by the end
tracks is lesser for studs that buckled in flexural modes than that offered to the studs that
buckled in torsional modes.
Enhancement in the load carrying capacity of the cee-studs with increase in the bracing
stiffness is observed in Figures 4.2 to 4.9 and in Figures 4.30 to 4.32. The mid-height lateral
displacement of the weak axis decreases with increasing brace stiffness, and is shown in
Figures 4.33 to 4.35, and the average of the measured value (north & south flange) as a factor
of L/250, is given in Table 4.9. The column effective length factors also decrease with
increasing brace stiffness and is shown in Figures 4.36 to 4.43. Table 4.9 gives the total

87
measured brace force as a percentage of the ultimate load, which ranged from 0.08% to
1.34%.
In the bridging connection tests, for both out-of-plane loading and in-plane loading
tests, the maximum load attained, corresponding displacements are given in Table 4.12 and
4.14, respectively. The initial flexural stiffness and the initial torsional stiffness were
computed at 10% of the applied load and the corresponding displacement. These are given in
Tables 4.13 and 4.15, respectively. Figures 4.63 through 4.68 give the initial torsional
stiffness of each of the tested specimen. The summary of calculated initial stiffnesses from
the bridging connection tests are given in Tables 4.16 and 4.17 for the in-plane and out-of-
plane load tests.

88
Table 4.1 Proposed Test Matrix for the Single Column Axial Load Tests Stud
Designation Total Bracing Stiffness of
Braced Studs Series
D S B t
Unbraced Studs
< βideal ≈ βideal > βideal
1 362 S 125 33 X X X X
2 362 S 162 43 X X X X
3 362 S 162 68 X X X X
4 600 S 125 33 X X X X
5 600 S 162 43 X X X X
6 600 S 162 97 X X X X
7 800 S 162 43 X X X X
8 800 S 162 97 X X X X
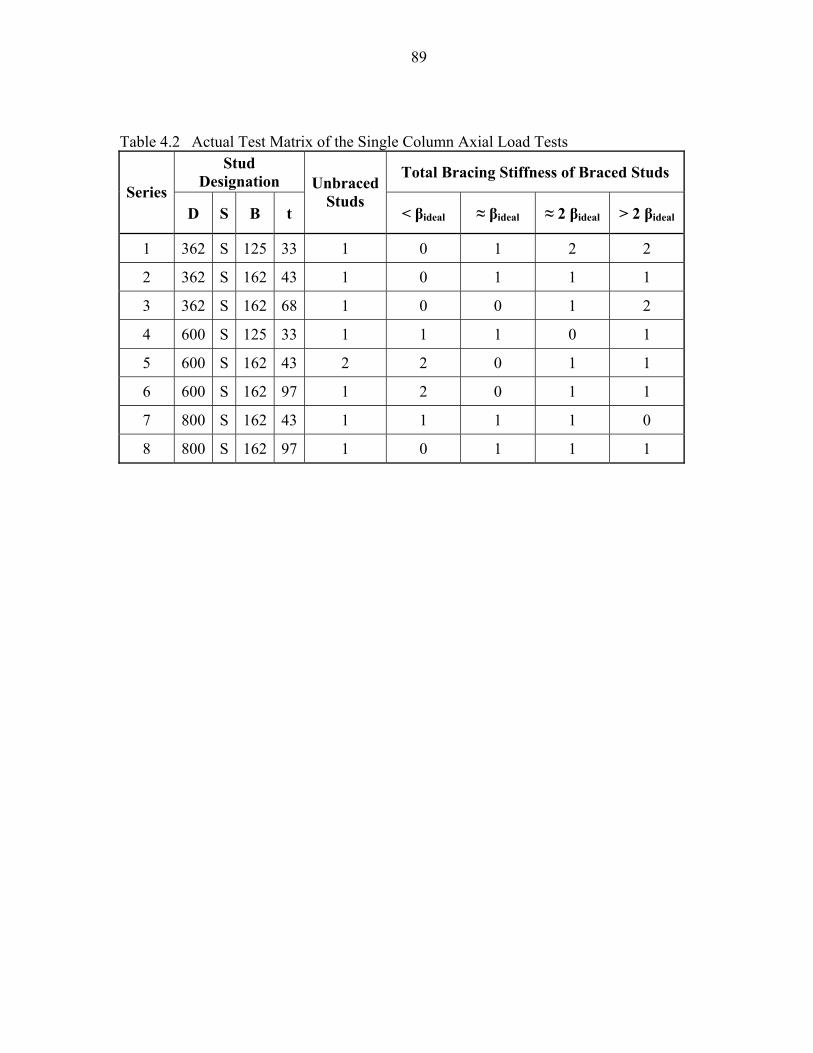
89
Table 4.2 Actual Test Matrix of the Single Column Axial Load Tests Stud
Designation Total Bracing Stiffness of Braced Studs Series
D S B t
Unbraced Studs
< βideal ≈ βideal ≈ 2 βideal > 2 βideal
1 362 S 125 33 1 0 1 2 2
2 362 S 162 43 1 0 1 1 1
3 362 S 162 68 1 0 0 1 2
4 600 S 125 33 1 1 1 0 1
5 600 S 162 43 2 2 0 1 1
6 600 S 162 97 1 2 0 1 1
7 800 S 162 43 1 1 1 1 0
8 800 S 162 97 1 0 1 1 1
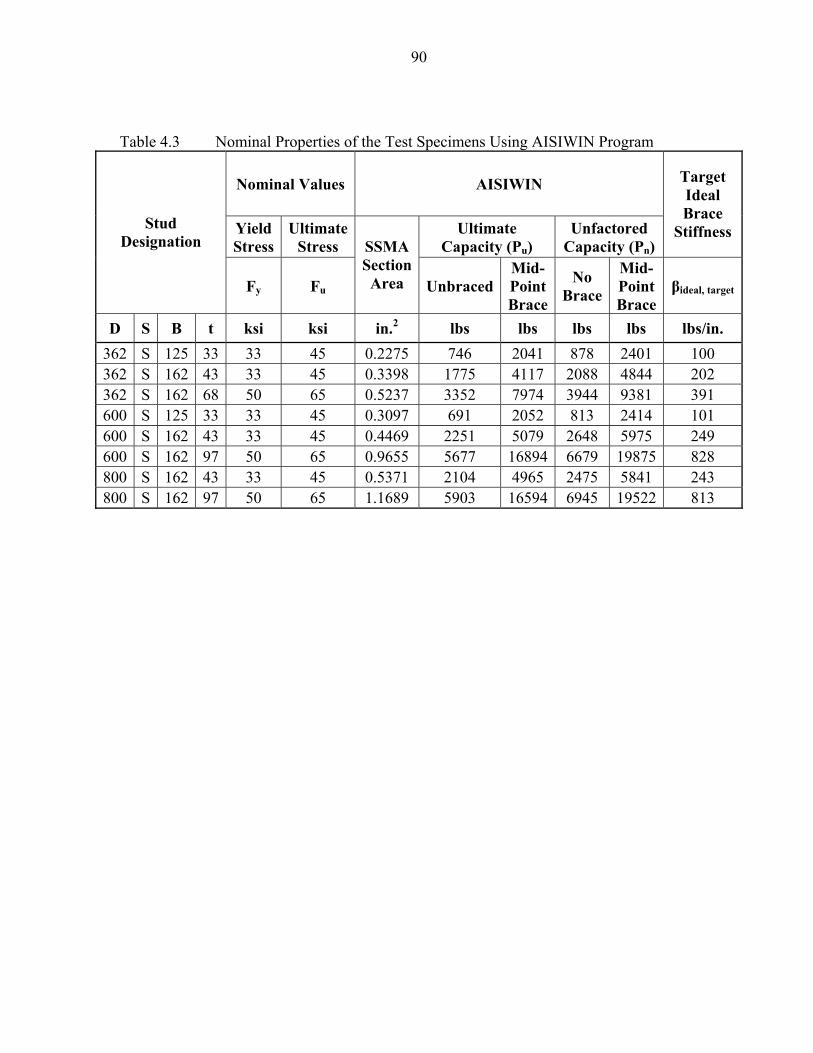
90
Table 4.3 Nominal Properties of the Test Specimens Using AISIWIN Program
Nominal Values AISIWIN
Yield Stress
Ultimate Stress
Ultimate Capacity (Pu)
Unfactored Capacity (Pn)
Target Ideal Brace
Stiffness Stud Designation
Fy Fu
SSMA Section Area Unbraced
Mid-Point Brace
No Brace
Mid-Point Brace
βideal, target
D S B t ksi ksi in.2 lbs lbs lbs lbs lbs/in. 362 S 125 33 33 45 0.2275 746 2041 878 2401 100 362 S 162 43 33 45 0.3398 1775 4117 2088 4844 202 362 S 162 68 50 65 0.5237 3352 7974 3944 9381 391 600 S 125 33 33 45 0.3097 691 2052 813 2414 101 600 S 162 43 33 45 0.4469 2251 5079 2648 5975 249 600 S 162 97 50 65 0.9655 5677 16894 6679 19875 828 800 S 162 43 33 45 0.5371 2104 4965 2475 5841 243 800 S 162 97 50 65 1.1689 5903 16594 6945 19522 813

91
Table 4.4 Average As-built Properties of the Test Specimens Using AISIWIN Program
Tension Coupon Test Results AISIWIN
Yield Stress
Ultimate Stress
As-Built Ultimate Capacity (Pu)
As-Built Unfactored
Capacity (Pn)
Required Ideal Brace
Stiffness Stud Designation
Fy Fu
As-Built
Section Area Unbraced
Mid-Point Brace
No Brace
Mid-Point Brace
βideal
D S B t ksi ksi in.2 lbs lbs lbs lbs lbs/in. 362 S 125 33 48.53 55.48 0.2028 704 1978 828 2327 97 362 S 162 43 47.04 58.20 0.3089 1688 4411 1986 5189 216 362 S 162 68 52.01 67.80 0.5154 3515 8448 4135 9939 414 600 S 125 33 24.03 45.24 0.2537 592 1548 696 1821 76 600 S 162 43 46.24 54.88 0.4135 2156 5832 2536 6861 286 600 S 162 43a 50.30 59.38 0.4346 2465 6721 2900 7907 329 600 S 162 97 60.20 70.21 0.9807 6277 19888 7385 23398 975 800 S 162 43 40.23 54.90 0.4829 1967 5180 2314 6094 254 800 S 162 97 42.50 67.49 1.1843 6686 17989 7866 21164 882
AISIWIN program was used to calculate the As-Built values of the test specimens Ideal Brace Stiffness was obtained using Yura's Bracing Equation 2.14 (Yura 1995) Design factor used in calculating the Unfactored Capacity is 0.85

92
Table 4.5 Calculated Brace Stiffness and Total Brace Stiffness of the Test Specimens Brace Factor Wire
Total Brace
Stiffness
Ideal Brace
Stiffness βprovidedStud Designation
Target Brace
Stiffness Dia. Area L Nos.
Actual Stiffness per Wire
AISIWIN Unfactored
Load Pn βprovided βideal
D S B t ID lbs/in. in. in.2 in. lbs/in. lbs lbs/in. lbs/in. βideal 362 S 125 33 1 200 0.016 0.000201 56.50 2 206 2327 413 97 4.3 362 S 125 33 2 400 0.016 0.000201 30.50 2 382 2327 765 97 7.9 362 S 125 33 3 100 0.016 0.000201 60.75 1 96 2327 192 97 2.0 362 S 125 33 4 100 0.016 0.000201 60.75 1 96 2327 192 97 2.0 362 S 125 33 5 0 0 0.000000 0 0 0 828 Not Braced 362 S 125 33 6 100 0.016 0.000201 58.00 1 101 2327 201 99 1.9 362 S 162 43 1 0 1986 Not Braced 362 S 162 43 2 200 0.024 0.000452 70.75 1 185 5189 371 216 1.7 362 S 162 43 3 800 0.024 0.000452 35.50 2 739 5189 1478 216 6.8 362 S 162 43 4 400 0.024 0.000452 35.75 1 367 5189 734 216 3.4 362 S 162 68 2 1000 0.033 0.000855 24.25 1 1023 9939 2046 414 4.9 362 S 162 68 3 500 0.033 0.000855 48.50 1 511 9939 1023 414 2.5 362 S 162 68 4 750 0.033 0.000855 32.25 1 769 9939 1538 414 3.7 362 S 162 68 5 0 0 4135 Not Braced

93
Table 4.5 (Continued) Calculated Brace Stiffness and Total Brace Stiffness of the Test Specimens Brace Factor Wire
Total Brace
Stiffness
Ideal Brace
Stiffness βprovidedStud Designation
Target Brace
Stiffness Dia. Area L Nos.
Actual Stiffness per Wire
AISIWIN Unfactored
Load Pn βprovided βideal
D S B t ID lbs/in. in. in.2 in. lbs/in. lbs lbs/in. lbs/in. βideal 600 S 125 33 1 200 0.016 0.000201 29.00 1 201 1821 402 76 5.3 600 S 125 33 2 0 0 696 Not Braced 600 S 125 33 3 60 0.01 0.000079 37.00 1 62 1821 123 76 1.6 600 S 125 33 4 30 0.01 0.000079 75.00 1 30 1821 61 76 0.8 600 S 162 43 1 250 0.024 0.000452 52.75 1 249 6861 497 286 1.7 600 S 162 43 2 75 0.016 0.000201 79.00 1 74 6861 148 286 0.5 600 S 162 43 4 500 0.024 0.000452 26.50 1 495 6861 990 286 3.5 600 S 162 43 5 30 0.01 0.000079 75.25 1 30 6861 61 286 0.2 600 S 162 43 6 0 0 2536 Not Braced 600 S 162 43 6a 0 0 2900 Not Braced 600 S 162 97 1 1000 0.0625 0.003068 86.00 1 1035 23398 2069 975 2.1 600 S 162 97 2 1500 0.0625 0.003068 53.00 1 1679 23398 3357 975 3.4 600 S 162 97 3 500 0.0348 0.000951 53.00 1 520 23398 1041 975 1.1 600 S 162 97 4 160 0.024 0.000452 81.00 1 162 23398 324 975 0.3 600 S 162 97 5 0 0 7385 Not Braced 800 S 162 43 2 75 0.016 0.000201 78.25 1 75 6094 149 254 0.6 800 S 162 43 3 150 0.016 0.000201 39.00 1 150 6094 299 254 1.2 800 S 162 43 4 0 0 2314 Not Braced 800 S 162 43 5 300 0.016 0.000201 38.75 2 301 6094 602 254 2.4 800 S 162 97 1 1000 0.0625 0.003068 85.00 1 1047 21164 2093 882 2.4 800 S 162 97 2 500 0.0348 0.000951 53.00 1 520 21164 1041 882 1.2 800 S 162 97 3 0 0 7866 Not Braced 800 S 162 97 4 2100 0.0475 0.001772 24.50 1 2098 21164 4195 882 4.8

94
Table 4.6 Summary of Experimental Test Results for Test Specimens Axial Capacity
Analytical Stud Designation
Target Brace
Stiffness No Brace
Mid-Pt Brace
Experimental Load
Observed Failure Mode
Increase in Pmax of Braced
over Unbraced
Studs D B t ID lbs/in. Pn (lbs) Pn (lbs) Pmax (lbs) %
362 S 125 33 5 0 828 - 1127 F[1] - T[1] 0.00 362 S 125 33 3 100 - 2327 2749 F[2] - T[2] 143.80 362 S 125 33 4 100 - 2327 2306 F[2] - T[2] 104.51 362 S 125 33 6 100 2327 2399 Distortional 112.79 362 S 125 33 1 200 - 2327 3012 F[2] 167.17 362 S 125 33 2 400 - 2327 2959 F[2] - T[2] 162.47 362 S 162 43 1 0 1986 - 5223 T[1] - F[1] 0.00 362 S 162 43 2 200 - 5189 7268 F[1] - T[2] 39.15 362 S 162 43 4 400 - 5189 7029 F[1] - T[2] 34.58 362 S 162 43 3 800 - 5189 6557 T[2] 25.54 362 S 162 68 5 0 4135 - 6451 F[1] - T[1] 0.00 362 S 162 68 3 500 - 9939 13384 T[1] - F[1] 107.47 362 S 162 68 4 750 - 9939 14029 T[2] 117.47 362 S 162 68 2 1000 - 9939 14792 T[2] 129.30 600 S 125 33 2 0 696 - 984 Distortional 0.00 600 S 125 33 4 30 - 1821 1951 F[1] 98.27 600 S 125 33 3 60 - 1821 2271 Distortional 130.79 600 S 125 33 1 200 - 1821 1302 Distortional 32.32 600 S 162 43 6 0 2536 - 5144 Distortional 0.00 600 S 162 43 6a 0 2900 - 4258 F[1] 0.00 600 S 162 43 5 30 - 6861 7163 Distortional 39.25 600 S 162 43 2 75 - 6861 6052 Distortional 17.65 600 S 162 43 1 250 - 6861 7308 Distortional 42.07 600 S 162 43 4 500 - 6861 7075 Distortional 37.54 600 S 162 97 5 0 7385 - 21029 F[1] 0.00 600 S 162 97 4 160 - 23398 28306 F[1] - T[1] 34.60 600 S 162 97 3 500 - 23398 30085 F[1] - T[1] 43.06 600 S 162 97 1 1000 - 23398 28553 T[1] 35.78 600 S 162 97 2 1500 - 23398 29472 T[1] 40.15 800 S 162 43 4 0 2314 - 4591 F[1] 0.00 800 S 162 43 2 75 - 6094 4306 F[1] -6.21 800 S 162 43 3 150 - 6094 5333 Distortional 16.16 800 S 162 43 5 300 - 6094 6213 F[2] 35.33 800 S 162 97 3 0 7866 - 19703 F[1] 0.00 800 S 162 97 2 500 - 21164 21626 Distortional 9.76 800 S 162 97 1 1000 - 21164 23811 Distortional 20.85 800 S 162 97 4 2100 - 21164 23537 T[1] 19.46

95
Table 4.7 Required Brace Stiffness Based on Pmax Total Brace
Stiffness
Brace Factor
AISIWIN Unfactored
Load
Experimental Load
Required Total
Stiffness
Brace Factor Stud Designation
βprovided βprovided Pn Pmax βrequired βprovided
D S B t ID lbs/in. βideal lbs lbs lbs/in. βrequired
362 S 125 33 5 0 - 828 1127 - - 362 S 162 43 1 0 - 1986 5223 - - 362 S 162 68 5 0 - 4135 6451 - - 600 S 125 33 2 0 - 696 984 - - 600 S 162 43 6 0 - 2536 5144 - - 600 S 162 43 6a 0 - 2900 4258 - - 600 S 162 97 5 0 - 7385 21029 - - 800 S 162 43 4 0 - 2314 4591 - - 800 S 162 97 3 0 - 7866 19703 - - 600 S 125 33 4 61 0.8 1821 1951 81 0.7 600 S 162 43 5 61 0.2 6861 7163 298 0.2 600 S 162 43 2 148 0.5 6861 6052 252 0.6 600 S 162 97 4 324 0.3 23398 28306 1179 0.3 800 S 162 43 2 149 0.6 6094 4306 179 0.8 600 S 125 33 3 123 1.6 1821 2271 95 1.3 600 S 162 97 3 1041 1.1 23398 30085 1254 0.8 800 S 162 43 3 299 1.2 6094 5333 222 1.3 800 S 162 97 2 1041 1.2 21164 21626 901 1.2 362 S 125 33 3 192 2.0 2327 2749 115 1.7 362 S 125 33 4 192 2.0 2327 2306 96 2.0 362 S 125 33 6 201 1.9 2327 2399 100 2.0 362 S 162 43 2 371 1.7 5189 7268 303 1.2 362 S 162 68 3 1023 2.5 9939 13384 558 1.8 600 S 162 43 1 497 1.7 6861 7308 305 1.6 600 S 162 97 1 2069 2.1 23398 28553 1190 1.7 800 S 162 43 5 602 2.4 6094 6213 259 2.3 800 S 162 97 1 2093 2.4 21164 23811 992 2.1 362 S 125 33 1 413 4.3 2327 3012 126 3.3 362 S 125 33 2 765 7.9 2327 2959 123 6.2 362 S 162 43 4 734 3.4 5189 7029 293 2.5 362 S 162 43 3 1478 6.8 5189 6557 273 5.4 362 S 162 68 4 1538 3.7 9939 14029 585 2.6 362 S 162 68 2 2046 4.9 9939 14792 616 3.3 600 S 125 33 1 402 5.3 1821 1302 54 7.4 600 S 162 43 4 990 3.5 6861 7075 295 3.4 600 S 162 97 2 3357 3.4 23398 29472 1228 2.7 800 S 162 97 4 4195 4.8 21164 23537 981 4.3

96
Table 4.8 Effective Length Factors Based on Pmax Total Brace
Stiffness
Effective Length Factors based on Pmax Stud Designation
βprovided Kx Ky Kt Pmax
D S B t ID lbs/in.
Observed Failure Mode
lbs 362 S 125 33 5 0 F[1] - T[1] 0.50 0.67 0.64 1127 362 S 125 33 3 192 F[2] - T[2] 0.50 0.25 0.25 2749 362 S 125 33 4 192 F[2] - T[2] 0.50 0.36 0.34 2306 362 S 125 33 6 201 Distortional 0.50 0.33 0.31 2399 362 S 125 33 1 413 F[2] 0.50 0.25 0.25 3012 362 S 125 33 2 765 F[2] - T[2] 0.50 0.25 0.25 2959 362 S 162 43 1 0 T[1] - F[1] 0.50 0.52 0.43 5223 362 S 162 43 2 371 F[1] - T[2] 0.50 0.25 0.25 7268 362 S 162 43 4 734 F[1] - T[2] 0.50 0.25 0.25 7029 362 S 162 43 3 1478 T[2] 0.50 0.25 0.25 6557 362 S 162 68 5 0 F[1] - T[1] 0.50 0.69 0.62 6451 362 S 162 68 3 1023 T[1] - F[1] 0.50 0.25 0.25 13384 362 S 162 68 4 1538 T[2] 0.50 0.25 0.25 14029 362 S 162 68 2 2046 T[2] 0.50 0.25 0.25 14792 600 S 125 33 2 0 Distortional 0.50 0.80 0.96 984 600 S 125 33 4 61 F[1] 0.50 0.45 0.52 1951 600 S 125 33 3 123 Distortional 0.50 0.32 0.37 2271 600 S 125 33 1 402 Distortional 0.50 0.68 0.80 1302 600 S 162 43 6 0 Distortional 0.50 0.65 0.70 5144 600 S 162 43 6a 0 F[1] 0.50 0.80 0.85 4258 600 S 162 43 5 61 Distortional 0.50 0.47 0.49 7163 600 S 162 43 2 148 Distortional 0.50 0.57 0.60 6052 600 S 162 43 1 497 Distortional 0.50 0.46 0.47 7308 600 S 162 43 4 990 Distortional 0.50 0.48 0.50 7075 600 S 162 97 5 0 F[1] 0.50 0.54 0.65 21029 600 S 162 97 4 324 F[1] - T[1] 0.50 0.39 0.45 28306 600 S 162 97 3 1041 F[1] - T[1] 0.50 0.35 0.40 30085 600 S 162 97 1 2069 T[1] 0.50 0.39 0.44 28553 600 S 162 97 2 3357 T[1] 0.50 0.37 0.41 29472 800 S 162 43 4 0 F[1] 0.50 0.66 0.77 4591 800 S 162 43 2 149 F[1] 0.50 0.69 0.80 4306 800 S 162 43 3 299 Distortional 0.50 0.58 0.67 5333 800 S 162 43 5 602 F[2] 0.50 0.48 0.56 6213 800 S 162 97 3 0 F[1] 0.50 0.52 0.66 19703 800 S 162 97 2 1041 Distortional 0.50 0.46 0.58 21626 800 S 162 97 1 2093 Distortional 0.50 0.39 0.48 23811 800 S 162 97 4 4195 T[1] 0.50 0.40 0.49 23537

97
Table 4.9 Measured Values of Brace Force and Mid-height Displacement at Pmax Measured Values at Pmax Experimental
Load Brace Force Weak Axis Displacement, ∆W Stud Designation
Target Brace
Stiffness Pmax
Measured Initial Bow
Pbr N-Flange S-Flange Average
Pbr as % of Pmax
Average ∆W in
terms of L/250
D S B t ID lbs/in. lbs in. lbs in. in. in. % 362 S 125 33 5 0 1127 0.000 - 0.4065 0.8289 0.618 - 1.61 362 S 125 33 3 100 2749 0.000 9.55 0.0835 0.0661 0.075 0.35 0.19 362 S 125 33 4 100 2306 0.000 22.41 0.1577 0.0006 0.079 0.97 0.21 362 S 125 33 6 100 2399 0.000 14.47 0.0099 0.1561 0.083 0.60 0.22 362 S 125 33 1 200 3012 0.000 10.55 0.0173 0.0451 0.031 0.35 0.08 362 S 125 33 2 400 2959 0.000 32.43 0.0906 0.1925 0.142 1.10 0.37 362 S 162 43 1 0 5223 0.000 - 0.8281 0.0845 0.456 - 1.19 362 S 162 43 2 200 7268 0.000 19.37 0.1007 0.0411 0.071 0.27 0.18 362 S 162 43 4 400 7029 0.000 39.07 0.0815 0.0324 0.057 0.56 0.15 362 S 162 43 3 800 6557 0.010 34.67 0.0852 -0.0246 0.055 0.53 0.08 362 S 162 68 5 0 6451 0.100 - 2.8548 -0.2529 1.554 - 3.39 362 S 162 68 3 500 13384 -0.155 159.31 0.4032 -0.0366 0.220 1.19 0.48 362 S 162 68 4 750 14029 0.140 131.92 0.1315 0.0118 0.072 0.94 0.19 362 S 162 68 2 1000 14792 -0.187 144.26 0.0644 0.1814 0.123 0.98 0.32

98
98
Table 4.9 (Continued) Measured Values of Brace Force and Mid-height Displacement at Pmax Measured Values at Pmax Experimental
Load Brace Force Weak Axis Displacement, ∆W Stud Designation
Target Brace
Stiffness Pmax
Measured Initial Bow
Pbr N-Flange S-Flange Average
Pbr as % of Pmax
Average ∆W in
terms of L/250
D S B t ID lbs/in. lbs in. lbs in. in. in. % 600 S 125 33 2 0 984 0.130 - 0.7034 0.2548 0.479 - 1.25 600 S 125 33 4 30 1951 0.075 25.05 0.6312 0.2406 0.436 1.28 1.14 600 S 125 33 3 60 2271 0.120 11.86 -0.1936 -0.0529 0.123 0.52 -0.32 600 S 125 33 1 200 1302 0.100 1.10 -0.0146 -0.0208 0.018 0.08 -0.05 600 S 162 43 6 0 5144 0.015 - 0.3305 0.2255 0.278 - 0.72 600 S 162 43 6a 0 4258 0.090 - -1.0398 -0.9219 0.981 - -2.55 600 S 162 43 5 30 7163 0.075 15.51 0.0298 -0.4001 0.215 0.22 -0.48 600 S 162 43 2 75 6052 - 57.49 1.0127 0.0393 0.526 0.95 1.37 600 S 162 43 1 250 7308 - 7.43 -0.0378 -0.0064 0.022 0.10 -0.06 600 S 162 43 4 500 7075 - 14.85 0.0238 0.0102 0.017 0.21 0.04 600 S 162 97 5 0 21029 - - -0.1614 -0.9538 0.558 - -1.45 600 S 162 97 4 160 28306 - 45.23 0.0961 -0.1869 0.142 0.16 -0.12 600 S 162 97 3 500 30085 0.000 137.53 -0.3179 0.0125 0.165 0.46 -0.40 600 S 162 97 1 1000 28553 0.110 171.51 -0.3955 -0.0472 0.221 0.60 -0.58 600 S 162 97 2 1500 29472 0.110 154.42 -0.0220 -0.2422 0.132 0.52 -0.34

99
Table 4.9 (Continued) Measured Values of Brace Force and Mid-height Displacement at Pmax Measured Values at Pmax Experimental
Load Brace Force Weak Axis Displacement Stud Designation
Target Brace
Stiffness Pmax
Measured Initial Bow
Pbr N-
Flange S-
Flange Average
Pbr as Percentage
of Pmax
Average ∆w in
terms of L/250
D S B t ID lbs/in. lbs in. lbs in. in. in. % 800 S 162 43 4 0 4591 0.000 - -0.4082 -0.8840 0.646 - -1.68 800 S 162 43 2 75 4306 - 24.69 -0.0027 0.4608 0.232 0.57 0.60 800 S 162 43 3 150 5333 0.120 71.52 0.3110 -0.2260 0.269 1.34 0.11 800 S 162 43 5 300 6213 0.000 16.81 -0.0482 -0.0811 0.065 0.27 -0.17 800 S 162 97 3 0 19703 0.000 - 0.4080 0.3385 0.373 - 0.97 800 S 162 97 2 500 21626 0.000 85.60 0.1250 0.2550 0.190 0.40 0.49 800 S 162 97 1 1000 23811 0.000 115.45 0.2014 0.1889 0.195 0.48 0.51 800 S 162 97 4 2100 23537 0.000 69.64 0.2314 0.0723 0.152 0.30 0.40

100
Table 4.10 Calculated Values of Brace Force and Mid-height Displacement at Pmax
Experimental Load
Measured Weak Axis Displacement at Pmax
Calculated Brace Force for Measured Weak Axis
Displacement Stud Designation
Target Brace
Stiffness Pmax
Measured Initial Bow
N-Flange S-Flange N-Flange S-Flange Total
Pbr as % of Pmax
D S B t ID lbs/in. lbs in. in. in. lbs lbs lbs % 362 S 125 33 5 0 1127 0.000 0.4065 0.8289 - - 362 S 125 33 3 100 2749 0.000 0.0835 0.0661 9.6 7.6 17.1 0.62 362 S 125 33 4 100 2306 0.000 0.1577 0.0006 15.2 0.1 15.2 0.66 362 S 125 33 6 100 2399 0.000 0.0099 0.1561 1.0 15.6 16.6 0.69 362 S 125 33 1 200 3012 0.000 0.0173 0.0451 2.2 5.7 7.8 0.26 362 S 125 33 2 400 2959 0.000 0.0906 0.1925 11.2 23.7 34.9 1.18 362 S 162 43 1 0 5223 0.000 0.8281 0.0845 - - 362 S 162 43 2 200 7268 0.000 0.1007 0.0411 30.5 12.5 43.0 0.59 362 S 162 43 4 400 7029 0.000 0.0815 0.0324 23.9 9.5 33.4 0.47 362 S 162 43 3 800 6557 0.010 0.0852 -0.0246 26.0 4.0 30.0 0.46 362 S 162 68 5 0 6451 0.100 2.8548 -0.2529 - - 362 S 162 68 3 500 13384 -0.155 0.4032 -0.0366 138.4 106.9 245.3 1.83 362 S 162 68 4 750 14029 0.140 0.1315 0.0118 158.7 88.8 247.5 1.76 362 S 162 68 2 1000 14792 -0.187 0.0644 0.1814 75.6 3.5 79.0 0.53 600 S 125 33 2 0 984 0.130 0.7034 0.2548 - - 600 S 125 33 4 30 1951 0.075 0.6312 0.2406 57.4 25.7 83.1 4.26 600 S 125 33 3 60 2271 0.120 -0.1936 -0.0529 7.0 6.3 13.3 0.59 600 S 125 33 1 200 1302 0.100 -0.0146 -0.0208 4.6 4.3 8.9 0.69

101
Table 4.10 (Continued) Calculated Values of Brace Force and Mid-height Displacement at Pmax
Experimental Load
Measured Weak Axis Displacement
at Pmax
Calculated Brace Force for Measured Weak Axis
Displacement Stud Designation Target Brace
Stiffness Pmax
Measured Initial Bow N-
Flange S-
Flange N-
Flange S-
Flange Total
Pbr as % of Pmax
D S B t ID lbs/in. lbs in. in. in. lbs lbs lbs % 600 S 162 43 6 0 5144 0.000 0.3305 0.2255 - - 600 S 162 43 6a 0 4258 -0.036 -1.0398 -0.9219 - - 600 S 162 43 5 30 7163 0.000 0.0298 -0.4001 8.9 119.4 128.3 1.79 600 S 162 43 2 75 6052 0.030 1.0127 0.0393 262.9 17.5 280.4 4.63 600 S 162 43 1 250 7308 0.040 -0.0378 -0.0064 0.7 10.2 10.9 0.15 600 S 162 43 4 500 7075 0.000 0.0238 0.0102 7.0 3.0 10.0 0.14 600 S 162 97 5 0 21029 0.015 -0.1614 -0.9538 - - 600 S 162 97 4 160 28306 0.075 0.0961 -0.1869 201.8 220.4 422.2 1.49 600 S 162 97 3 500 30085 - -0.3179 0.0125 398.6 15.7 414.3 1.38 600 S 162 97 1 1000 28553 - -0.3955 -0.0472 470.5 56.1 526.6 1.84 600 S 162 97 2 1500 29472 - -0.0220 -0.2422 27.0 297.4 324.4 1.10 800 S 162 43 4 0 4591 0.110 -0.4082 -0.8840 - - 800 S 162 43 2 75 4306 0.090 -0.0027 0.4608 15.7 82.7 98.3 2.28 800 S 162 43 3 150 5333 0.110 0.3110 -0.2260 93.5 25.8 119.3 2.24 800 S 162 43 5 300 6213 0.000 -0.0482 -0.0811 12.5 21.0 33.5 0.54 800 S 162 97 3 0 19703 - 0.4080 0.3385 - - 800 S 162 97 2 500 21626 - 0.1250 0.2550 112.6 229.8 342.4 1.58 800 S 162 97 1 1000 23811 - 0.2014 0.1889 199.8 187.4 387.2 1.63 800 S 162 97 4 2100 23537 0.120 0.2314 0.0723 344.6 188.5 533.2 2.27

102
Table 4.11 Proposed Test Matrix for Bridging Connection Tests Stud Designation Number of Tests Specimen
Type D S B t N C Out-of-Plane In-Plane
1 362 S 125 33 1 SS 2 2
2 362 S 162 43 1 SS 2 2
3 362 S 162 68 1 SS 2 2
4 362 S 162 68 1 WW 2 2
5 362 S 162 68 1 DW 2 2
6 600 S 125 33 1 SS 2 2
7 600 S 162 43 1 SS 2 2
8 600 S 162 97 3 SS 2 2
9 600 S 162 97 1 WW 2 2
10 600 S 162 97 1 DW 2 2
11 800 S 162 43 1 SS 2 2
12 800 S 162 97 1 SS 2 2
13 800 S 162 97 1 WW 2 2
14 800 S 162 97 1 DW 2 2
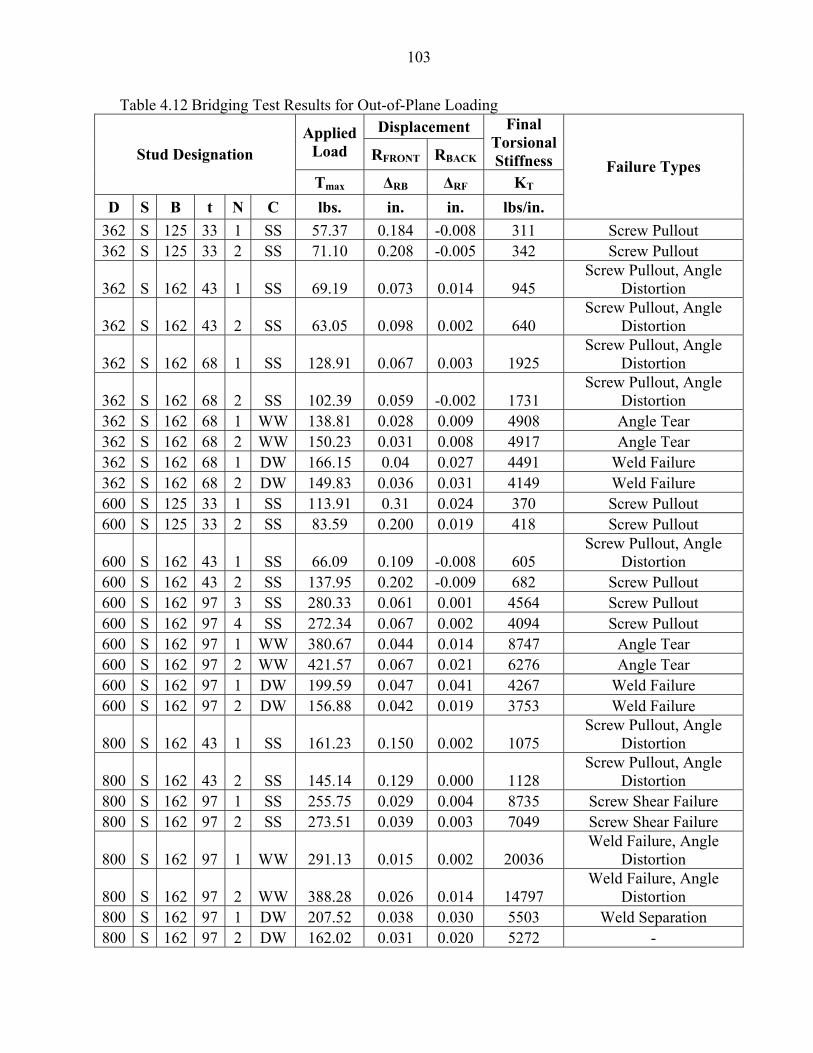
103
Table 4.12 Bridging Test Results for Out-of-Plane Loading Displacement Applied
Load RFRONT RBACK
Final Torsional Stiffness Stud Designation
Tmax ∆RB ∆RF KT D S B t N C lbs. in. in. lbs/in.
Failure Types
362 S 125 33 1 SS 57.37 0.184 -0.008 311 Screw Pullout 362 S 125 33 2 SS 71.10 0.208 -0.005 342 Screw Pullout
362 S 162 43 1 SS 69.19 0.073 0.014 945 Screw Pullout, Angle
Distortion
362 S 162 43 2 SS 63.05 0.098 0.002 640 Screw Pullout, Angle
Distortion
362 S 162 68 1 SS 128.91 0.067 0.003 1925 Screw Pullout, Angle
Distortion
362 S 162 68 2 SS 102.39 0.059 -0.002 1731 Screw Pullout, Angle
Distortion 362 S 162 68 1 WW 138.81 0.028 0.009 4908 Angle Tear 362 S 162 68 2 WW 150.23 0.031 0.008 4917 Angle Tear 362 S 162 68 1 DW 166.15 0.04 0.027 4491 Weld Failure 362 S 162 68 2 DW 149.83 0.036 0.031 4149 Weld Failure 600 S 125 33 1 SS 113.91 0.31 0.024 370 Screw Pullout 600 S 125 33 2 SS 83.59 0.200 0.019 418 Screw Pullout
600 S 162 43 1 SS 66.09 0.109 -0.008 605 Screw Pullout, Angle
Distortion 600 S 162 43 2 SS 137.95 0.202 -0.009 682 Screw Pullout 600 S 162 97 3 SS 280.33 0.061 0.001 4564 Screw Pullout 600 S 162 97 4 SS 272.34 0.067 0.002 4094 Screw Pullout 600 S 162 97 1 WW 380.67 0.044 0.014 8747 Angle Tear 600 S 162 97 2 WW 421.57 0.067 0.021 6276 Angle Tear 600 S 162 97 1 DW 199.59 0.047 0.041 4267 Weld Failure 600 S 162 97 2 DW 156.88 0.042 0.019 3753 Weld Failure
800 S 162 43 1 SS 161.23 0.150 0.002 1075 Screw Pullout, Angle
Distortion
800 S 162 43 2 SS 145.14 0.129 0.000 1128 Screw Pullout, Angle
Distortion 800 S 162 97 1 SS 255.75 0.029 0.004 8735 Screw Shear Failure 800 S 162 97 2 SS 273.51 0.039 0.003 7049 Screw Shear Failure
800 S 162 97 1 WW 291.13 0.015 0.002 20036 Weld Failure, Angle
Distortion
800 S 162 97 2 WW 388.28 0.026 0.014 14797 Weld Failure, Angle
Distortion 800 S 162 97 1 DW 207.52 0.038 0.030 5503 Weld Separation 800 S 162 97 2 DW 162.02 0.031 0.020 5272 -
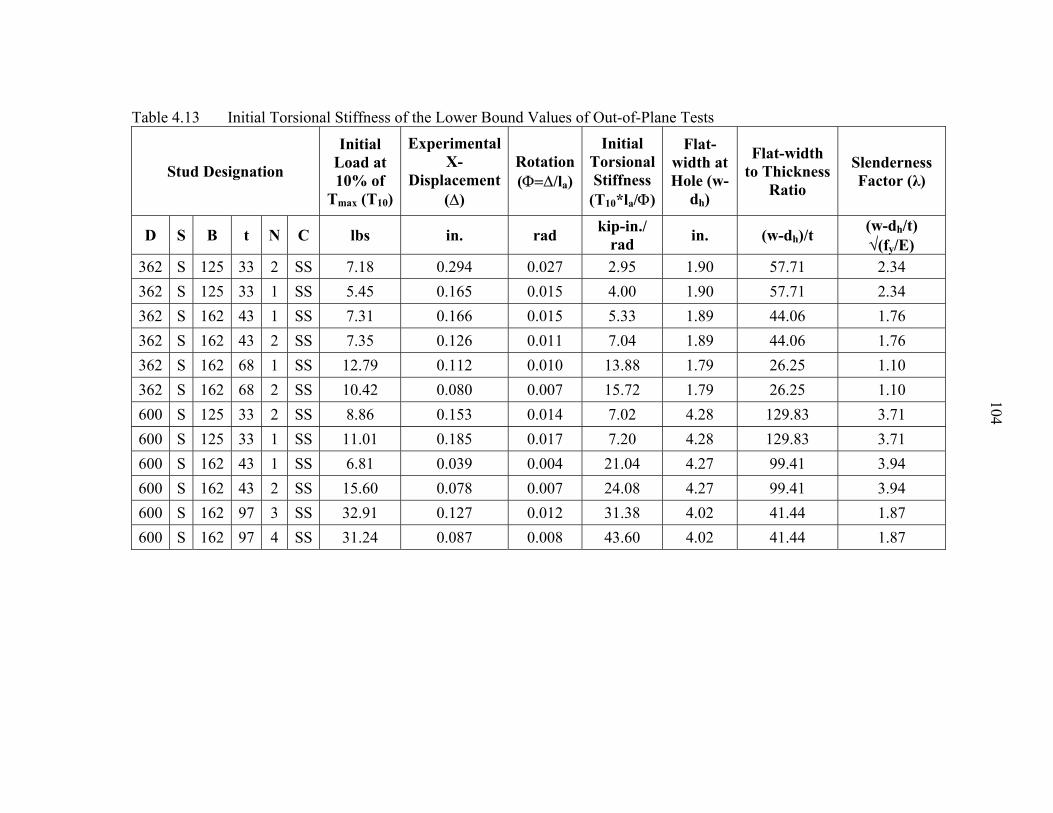
104
Table 4.13 Initial Torsional Stiffness of the Lower Bound Values of Out-of-Plane Tests
Stud Designation
Initial Load at 10% of
Tmax (T10)
Experimental X-
Displacement (∆)
Rotation (Φ=∆/la)
Initial Torsional Stiffness
(T10*la/Φ)
Flat-width at Hole (w-
dh)
Flat-width to Thickness
Ratio
Slenderness Factor (λ)
D S B t N C lbs in. rad kip-in./ rad in. (w-dh)/t (w-dh/t)
√(fy/E) 362 S 125 33 2 SS 7.18 0.294 0.027 2.95 1.90 57.71 2.34 362 S 125 33 1 SS 5.45 0.165 0.015 4.00 1.90 57.71 2.34 362 S 162 43 1 SS 7.31 0.166 0.015 5.33 1.89 44.06 1.76 362 S 162 43 2 SS 7.35 0.126 0.011 7.04 1.89 44.06 1.76 362 S 162 68 1 SS 12.79 0.112 0.010 13.88 1.79 26.25 1.10 362 S 162 68 2 SS 10.42 0.080 0.007 15.72 1.79 26.25 1.10 600 S 125 33 2 SS 8.86 0.153 0.014 7.02 4.28 129.83 3.71 600 S 125 33 1 SS 11.01 0.185 0.017 7.20 4.28 129.83 3.71 600 S 162 43 1 SS 6.81 0.039 0.004 21.04 4.27 99.41 3.94 600 S 162 43 2 SS 15.60 0.078 0.007 24.08 4.27 99.41 3.94 600 S 162 97 3 SS 32.91 0.127 0.012 31.38 4.02 41.44 1.87 600 S 162 97 4 SS 31.24 0.087 0.008 43.60 4.02 41.44 1.87

105
Table 4.13 (Continued) Initial Torsional Stiffness of the Lower Bound Values from the Out-of-Plane Tests
Stud Designation
Initial Load at 10% of
Tmax (T10)
Experimental X-
Displacement (∆)
Rotation (Φ=∆/la)
Initial Torsional Stiffness
(T10*la/Φ)
Flat-width at
Hole (w-dh)
Flat-width to
Thickness Ratio
Slenderness Factor (λ)
D S B t N C lbs in. rad kip-in./rad in. (w-dh)/t (w-dh/t)
√(fy/E) 800 S 162 43 2 SS 13.22 0.031 0.003 51.41 6.27 145.92 5.39 800 S 162 43 1 SS 31.77 0.064 0.006 60.32 6.27 145.92 5.39 800 S 162 97 2 SS 28.30 0.049 0.004 70.32 6.02 62.06 2.36 800 S 162 97 1 SS 29.99 0.046 0.004 78.95 6.02 62.06 2.36 362 S 162 68 1 WW 11.03 0.018 0.002 75.79 1.79 26.25 1.06 362 S 162 68 2 WW 13.51 0.016 0.001 99.27 1.79 26.25 1.06 600 S 162 97 2 WW 49.88 0.031 0.003 197.38 4.02 41.44 1.68 600 S 162 97 1 WW 41.71 0.024 0.002 211.10 4.02 41.44 1.68 800 S 162 97 2 WW 132.07 0.068 0.006 236.61 6.02 62.06 2.52 800 S 162 97 1 WW 144.52 0.056 0.005 314.45 6.02 62.06 2.52 362 S 162 68 2 DW 21.84 0.091 0.008 28.89 2.06 30.25 1.23 362 S 162 68 1 DW 21.40 0.080 0.007 32.40 2.06 30.25 1.23 600 S 162 97 2 DW 21.67 0.100 0.009 26.31 4.41 45.44 1.84 600 S 162 97 1 DW 22.02 0.100 0.009 26.72 4.41 45.44 1.84 800 S 162 97 2 DW 14.12 0.095 0.009 18.04 6.41 66.06 2.68 800 S 162 97 1 DW 21.26 0.093 0.008 27.58 6.41 66.06 2.68
Note: Elastic Modulus = 29500.0 ksi Lever Arm for Moment = 11.0 in. Width of punchout = 1.5 in.

106
Table 4.14 Bridging Test Results for In-Plane Loading Displacement ofApplied
Load LFRONT RFRONT
Flexural StiffnessStud Designation
Fmax ∆LF ∆RF KF D S B t N C lbs in. in. lbs/in.
Failure Type
362 S 125 33 3 SS 391.94 0.219 0.229 1752 Screw Pullout 362 S 125 33 4 SS 431.48 0.321 0.174 1743 Screw Pullout
362 S 162 43 3 SS 545.56 0.130 0.088 5005 Screw Pullout, Angle Distortion
362 S 162 43 4 SS 448.67 0.100 0.089 4755 Screw Pullout, Angle Distortion
362 S 162 68 3 SS 937.28 0.087 0.092 10496 Angle Distortion
362 S 162 68 4 SS 889.78 0.092 0.054 12225 Angle Distortion, Screw Tension
362 S 162 68 3 WW 1503.76 0.118 0.127 12263 Weld Failure 362 S 162 68 4 WW 1462.17 0.121 0.127 11817 Angle Tear
362 S 162 68 3 DW 3064.03 0.31 0.307 9883 Block Shear Rupture of Web
362 S 162 68 4 DW 2642.63 0.349 0.401 7054 Block Shear Rupture of Web
600 S 125 33 3 SS 425.80 0.29 0.223 1658 Screw Pullout 600 S 125 33 4 SS 302.94 0.174 0.186 1684 Screw Pullout 600 S 162 43 4 SS 640.80 0.131 0.125 5001 Screw Pullout 600 S 162 43 5 SS 587.06 0.214 0.381 5001 Screw Pullout
600 S 162 97 1 SS 1514.38 0.131 0.147 10902 Angle Distortion, Screw Tension
600 S 162 97 2 SS 1172.38 0.105 0.130 9996 Angle Distortion, Screw Tension
600 S 162 97 3 WW 1169.53 0.163 0.200 6444 Weld Failure 600 S 162 97 4 WW 1653.71 0.212 0.230 7477 Angle Tear 600 S 162 97 3 DW - - - - - 600 S 162 97 4 DW 3159.07 0.469 0.464 6772 - 800 S 162 43 3 SS 275.60 0.073 0.093 3307 Screw Pullout 800 S 162 43 4 SS 522.66 0.137 0.151 3632 Screw Tension 800 S 162 97 3 SS 1402.04 0.064 0.030 29965 Screw Tension 800 S 162 97 4 SS 1719.25 0.221 0.427 5303 Screw Tension 800 S 162 97 3 WW 1238.18 0.143 0.148 8493 Angle Tear 800 S 162 97 4 WW 1101.97 0.151 0.111 8417 Angle Tear 800 S 162 97 3 DW 2908.04 0.526 0.553 5390 Weld Failure 800 S 162 97 4 DW - - - - -
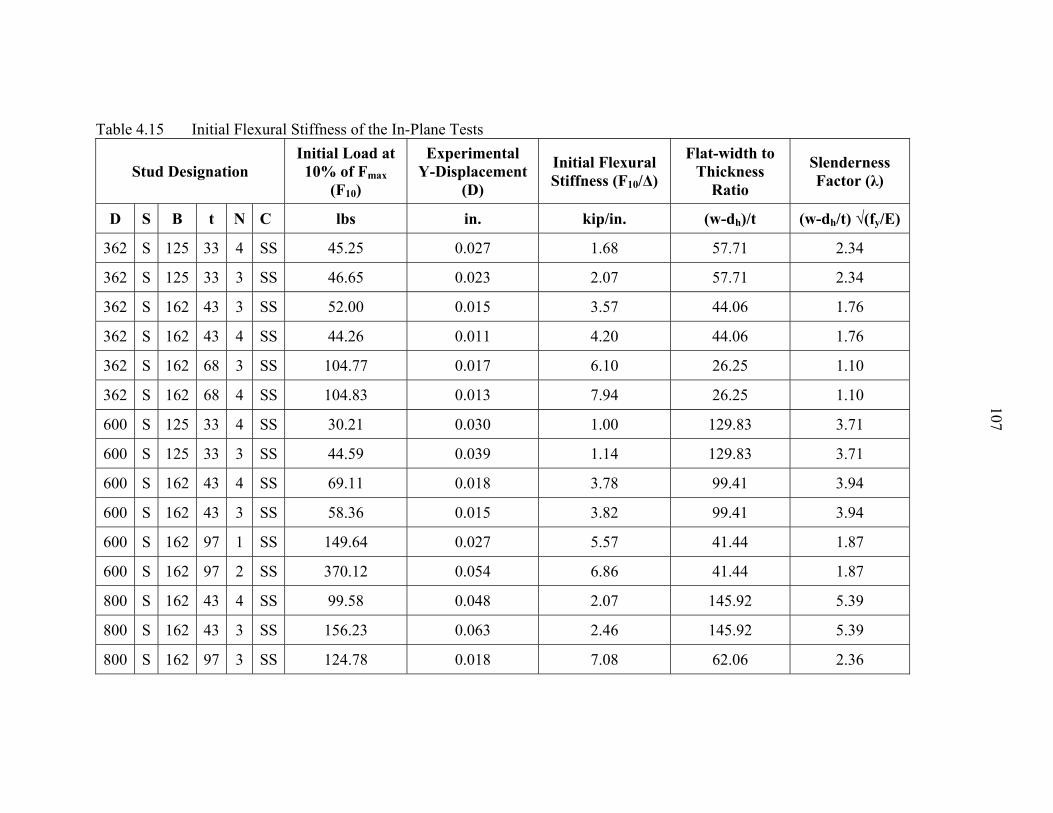
107
Table 4.15 Initial Flexural Stiffness of the In-Plane Tests
Stud Designation Initial Load at 10% of Fmax
(F10)
Experimental Y-Displacement
(D)
Initial Flexural Stiffness (F10/∆)
Flat-width to Thickness
Ratio
Slenderness Factor (λ)
D S B t N C lbs in. kip/in. (w-dh)/t (w-dh/t) √(fy/E)
362 S 125 33 4 SS 45.25 0.027 1.68 57.71 2.34
362 S 125 33 3 SS 46.65 0.023 2.07 57.71 2.34
362 S 162 43 3 SS 52.00 0.015 3.57 44.06 1.76
362 S 162 43 4 SS 44.26 0.011 4.20 44.06 1.76
362 S 162 68 3 SS 104.77 0.017 6.10 26.25 1.10
362 S 162 68 4 SS 104.83 0.013 7.94 26.25 1.10
600 S 125 33 4 SS 30.21 0.030 1.00 129.83 3.71
600 S 125 33 3 SS 44.59 0.039 1.14 129.83 3.71
600 S 162 43 4 SS 69.11 0.018 3.78 99.41 3.94
600 S 162 43 3 SS 58.36 0.015 3.82 99.41 3.94
600 S 162 97 1 SS 149.64 0.027 5.57 41.44 1.87
600 S 162 97 2 SS 370.12 0.054 6.86 41.44 1.87
800 S 162 43 4 SS 99.58 0.048 2.07 145.92 5.39
800 S 162 43 3 SS 156.23 0.063 2.46 145.92 5.39
800 S 162 97 3 SS 124.78 0.018 7.08 62.06 2.36

108
108
Table 4.15 (Continued) Initial Flexural Stiffness of the In-Plane Tests
Stud Designation Initial Load at 10% of Fmax (F10)
Experimental Y-Displacement
(D)
Initial Flexural Stiffness (F10/∆)
Flat-width to Thickness
Ratio
Slenderness Factor (λ)
D S B t N C lbs in. kip/in. (w-dh)/t (w-dh/t) √(fy/E)
800 S 162 97 4 SS 172.05 0.058 2.95 62.06 2.36
362 S 162 68 4 WW 137.82 0.005 30.42 26.25 1.06
362 S 162 68 3 WW 183.14 0.004 40.79 26.25 1.06
600 S 162 97 3 WW 109.88 0.007 16.52 41.44 1.68
600 S 162 97 4 WW 95.25 0.006 15.24 41.44 1.68
800 S 162 97 4 WW 114.06 0.011 10.51 62.06 2.52
800 S 162 97 3 WW 178.58 0.009 19.67 62.06 2.52
362 S 162 68 3 DW 378.77 0.008 45.36 30.25 1.23
362 S 162 68 4 DW 206.19 0.004 50.41 30.25 1.23
600 S 162 97 3 DW 363.78 0.044 8.26 45.44 1.84
600 S 162 97 4 DW - -
800 S 162 97 3 DW 364.75 0.152 2.40 66.06 2.68
800 S 162 97 4 DW - - Note: Elastic Modulus = 29500.0 ksi.
Lever Arm for Moment = 11.0 in. Width of punchout = 1.5 in.
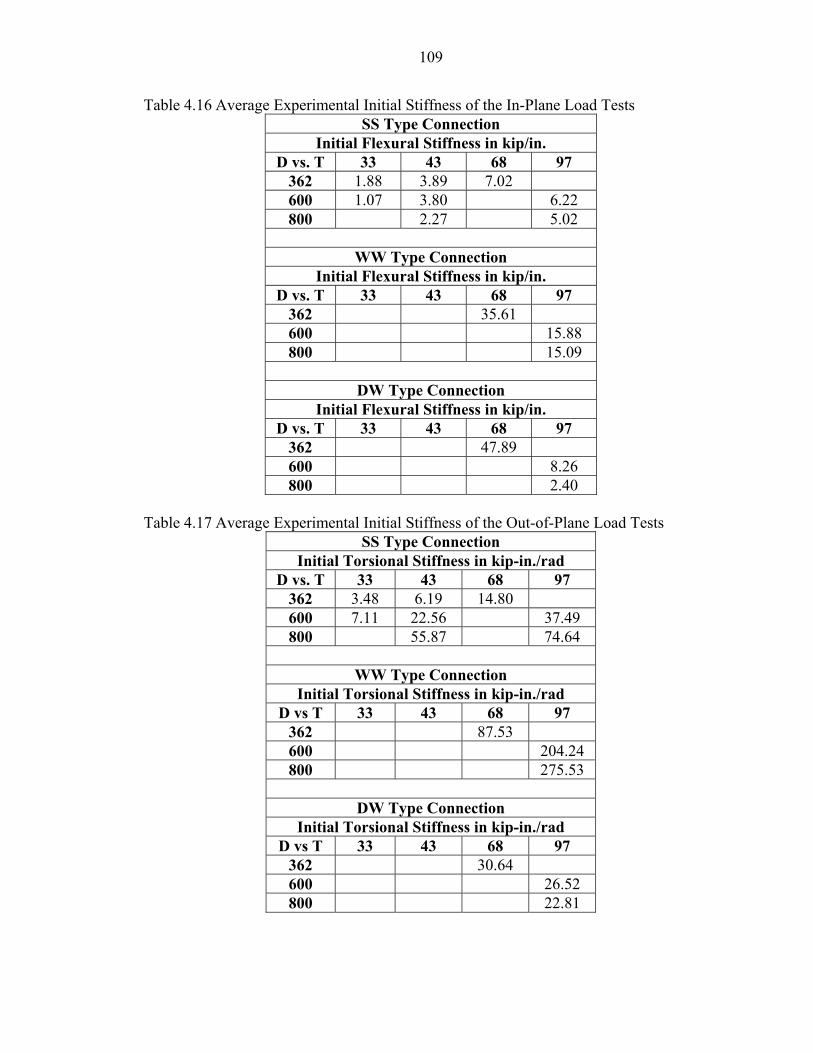
109
Table 4.16 Average Experimental Initial Stiffness of the In-Plane Load Tests SS Type Connection
Initial Flexural Stiffness in kip/in. D vs. T 33 43 68 97
362 1.88 3.89 7.02 600 1.07 3.80 6.22 800 2.27 5.02
WW Type Connection
Initial Flexural Stiffness in kip/in. D vs. T 33 43 68 97
362 35.61 600 15.88 800 15.09
DW Type Connection
Initial Flexural Stiffness in kip/in. D vs. T 33 43 68 97
362 47.89 600 8.26 800 2.40
Table 4.17 Average Experimental Initial Stiffness of the Out-of-Plane Load Tests
SS Type Connection Initial Torsional Stiffness in kip-in./rad
D vs. T 33 43 68 97 362 3.48 6.19 14.80 600 7.11 22.56 37.49 800 55.87 74.64
WW Type Connection
Initial Torsional Stiffness in kip-in./rad D vs T 33 43 68 97
362 87.53 600 204.24 800 275.53
DW Type Connection
Initial Torsional Stiffness in kip-in./rad D vs T 33 43 68 97
362 30.64 600 26.52 800 22.81

110
Table 4.18 Maximum Flexural and Corresponding Torsional Brace Force Brace Force
Stud Designation Target Brace
StiffnessMaximum Flexural
Corr. Torsional
Corr. Axial Load
Flexural BF as
% of P D S B t ID lbs/in. lbs lbs lbs %
362 S 125 33 3 100 5.92 0.44 1866.86 0.32 362 S 125 33 4 100 11.28 2.42 2299.90 0.49 362 S 125 33 6 100 7.23 7.22 2398.96 0.30 362 S 125 33 1 200 5.28 1.78 3012.17 0.18 362 S 125 33 2 400 16.22 2.15 2959.05 0.55
362 S 162 43 2 200 13.31 3.09 6190.00 0.22 362 S 162 43 4 400 25.53 4.59 5197.30 0.49 362 S 162 43 3 800 18.97 7.23 4466.38 0.42
362 S 162 68 3 500 79.65 76.57 13384.46 0.60 362 S 162 68 4 750 67.63 49.63 13787.71 0.49 362 S 162 68 2 1000 73.35 50.17 14596.98 0.50
600 S 125 33 4 30 12.53 6.50 1951.03 0.64 600 S 125 33 3 60 6.86 4.77 2241.37 0.31 600 S 125 33 1 200 1.47 0.65 823.73 0.18
600 S 162 43 5 30 7.75 6.77 7163.83 0.11 600 S 162 43 2 75 28.74 27.45 6052.34 0.47 600 S 162 43 1 250 5.05 0.61 1310.44 0.39 600 S 162 43 4 500 10.78 3.74 4231.99 0.25
600 S 162 97 4 160 22.61 12.37 28306.23 0.08 600 S 162 97 3 500 68.77 62.12 30085.90 0.23 600 S 162 97 1 1000 85.76 45.83 28553.51 0.30 600 S 162 97 2 1500 77.21 48.38 29472.16 0.26
800 S 162 43 2 75 12.35 10.36 4306.04 0.29 800 S 162 43 3 150 35.76 9.92 5333.03 0.67 800 S 162 43 5 300 21.42 12.67 3917.25 0.55
800 S 162 97 2 500 37.05 16.85 21626.00 0.17 800 S 162 97 1 1000 53.18 2.34 23811.17 0.22 800 S 162 97 4 2100 34.82 25.29 23537.15 0.15

111
Table 4.19 Maximum Torsional and Corresponding Flexural Brace Force Brace Force
Stud Designation Target Brace
StiffnessCorr.
FlexuralMaximum Torsional
Corr. Axial Load
Torsional BF as %
of P D S B t ID lbs/in. lbs lbs lbs %
362 S 125 33 3 100 4.78 2.67 2748.51 0.10 362 S 125 33 4 100 7.48 5.53 2066.30 0.27 362 S 125 33 6 100 7.23 7.22 2398.96 0.30 362 S 125 33 1 200 5.28 1.78 3012.17 0.06 362 S 125 33 2 400 12.86 2.37 2940.58 0.08
362 S 162 43 2 200 9.69 5.77 7268.46 0.08 362 S 162 43 4 400 19.53 16.96 7029.71 0.24 362 S 162 43 3 800 13.50 14.53 6338.90 0.23
362 S 162 68 3 500 79.65 76.57 13384.46 0.57 362 S 162 68 4 750 65.96 59.11 14029.50 0.42 362 S 162 68 2 1000 72.13 54.23 14792.16 0.37
600 S 125 33 4 30 12.53 6.50 1951.03 0.33 600 S 125 33 3 60 6.85 4.77 2249.36 0.21 600 S 125 33 1 200 1.11 1.15 1566.29 0.07
600 S 162 43 5 30 7.75 6.77 7163.83 0.09 600 S 162 43 2 75 28.74 27.45 6052.34 0.45 600 S 162 43 1 250 3.37 3.96 7079.07 0.06 600 S 162 43 4 500 9.86 3.86 3954.20 0.10
600 S 162 97 4 160 22.61 12.37 28306.23 0.04 600 S 162 97 3 500 68.77 62.12 30085.90 0.21 600 S 162 97 1 1000 84.46 45.87 28549.18 0.16 600 S 162 97 2 1500 77.21 48.38 29472.16 0.16
800 S 162 43 2 75 12.35 10.36 4306.04 0.24 800 S 162 43 3 150 35.76 9.92 5333.03 0.19 800 S 162 43 5 300 21.10 12.84 4001.41 0.32
800 S 162 97 2 500 28.81 19.10 20549.82 0.09 800 S 162 97 1 1000 20.66 14.66 19679.07 0.07 800 S 162 97 4 2100 34.82 25.29 23537.15 0.11

112
Figure 4.1 Typical Bracing for the Single Column Axial Load Tests
Figure 4.2 Axial Load vs. Axial Shortening for the Stud 362S125-33 with Varying Brace
Stiffness

113
Figure 4.3 Axial Load vs. Axial Shortening for the Stud 362S162-43 with Varying Brace
Stiffness
Figure 4.4 Axial Load vs. Axial Shortening for the Stud 362S162-68 with Varying Brace
Stiffness

114
Figure 4.5 Axial Load vs. Axial Shortening for the Stud 600S125-33 with Varying Brace
Stiffness
Figure 4.6 Axial Load vs. Axial Shortening for the Stud 600S162-43 with Varying Brace
Stiffness

115
Figure 4.7 Axial Load vs. Axial Shortening for the Stud 600S162-97 with Varying Brace
Stiffness
Figure 4.8 Axial Load vs. Axial Shortening for the Stud 800S162-43 with Varying Brace
Stiffness

116
Figure 4.9 Axial Load vs. Axial Shortening for the Stud 800S162-97 with Varying Brace
Stiffness
Figure 4.10 Schematic Diagram Showing the Various Buckling Shapes and Buckling
Modes Observed in the Experimental Testing

117
Figure 4.11 Comparison of Studs 362S125-33-0 and 600S125-33-0
Figure 4.12 Comparison of Studs 362S125-33-100 (1.7x) and 600S125-33-060 (1.3x)

118
Figure 4.13 Comparison of Studs 362S125-33-200 (6.2x) and 600S125-33-200 (7.4x)
Figure 4.14 Comparison of Studs 362S162-43-0, 600S162-43-0 and 800S162-43-0

119
Figure 4.15 Comparison of Studs 362S162-43-200 (1.2x), 600S162-43-250 (1.6x) and
800S162-43-150 (1.3x)
Figure 4.16 Comparison of Studs 362S162-43-400 (2.5x), 600S162-43-500 (3.4x) and
800S162-43-300 (2.3x)

120
Figure 4.17 Comparison of Studs 600S162-97-0 and 800S162-97-0
Figure 4.18 Comparison of Studs 600S162-97-1000 (1.7x) and 800S162-97-1000
(2.1x)

121
Figure 4.19 Comparison of Studs 600S162-97-1500 (2.7x) and 800S162-97-2100
(4.3x)
Figure 4.20 Comparison of Studs 362S125-33-0, 362S162-43-0 and 362S162-68-0
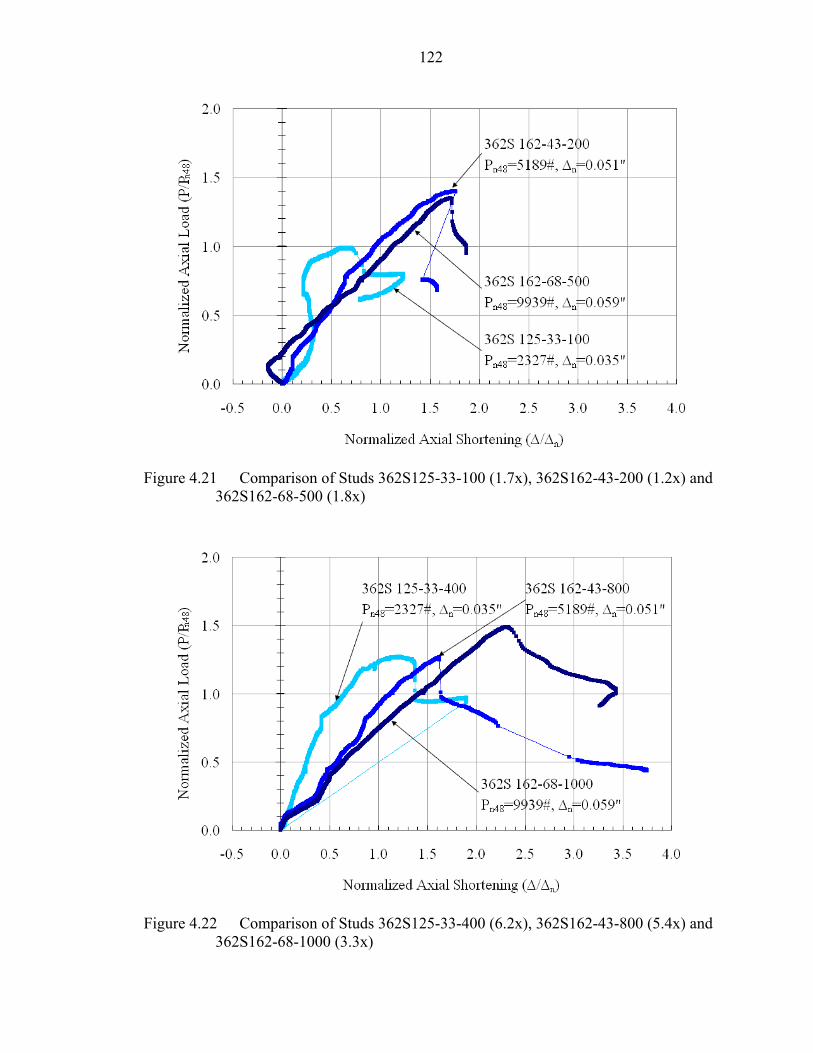
122
Figure 4.21 Comparison of Studs 362S125-33-100 (1.7x), 362S162-43-200 (1.2x) and
362S162-68-500 (1.8x)
Figure 4.22 Comparison of Studs 362S125-33-400 (6.2x), 362S162-43-800 (5.4x) and
362S162-68-1000 (3.3x)

123
Figure 4.23 Comparison of Studs 600S125-33-0, 600S162-43-0 and 600S162-97-0
Figure 4.24 Comparison of Studs 600S125-33-30 (0.2x), 600S162-43-75 (0.6x) and
600S162-97-160 (0.3x)

124
Figure 4.25 Comparison of Studs 600S125-33-60 (1.3x), 600S162-43-250 (1.6x) and
600S162-97-1000 (1.7x)
Figure 4.26 Comparison of Studs 600S125-33-200 (7.4x), 600S162-43-500 (3.4x) and
600S162-97-1500 (2.7x)

125
Figure 4.27 Comparison of Studs 800S162-43-0 and 800S162-97-0
Figure 4.28 Comparison of Studs 800S162-43-150(1.3x) and 800S162-97-500 (1.2x)

126
Figure 4.29 Comparison of Studs 800S162-43-300 (2.3x) and 800S162-97-2100 (4.3x)
Figure 4.30 Experimental Load vs. Target Brace Stiffness for 362 Series of Lipped
Cee Studs

127
Figure 4.31 Experimental Load vs. Target Brace Stiffness for 600 Series of Lipped
Cee Studs
Figure 4.32 Experimental Load vs. Target Brace Stiffness for 800 Series of Lipped
Cee Studs

128
Figure 4.33 Total Brace Stiffness vs. Weak Axis Lateral Displacement for the 362
Series of Lipped Cee-Studs
Figure 4.34 Total Brace Stiffness vs. Weak Axis Lateral Displacement for the 600
Series of Lipped Cee Studs

129
Figure 4.35 Total Brace Stiffness vs. Target Brace Stiffness for the 800 Series Lipped
Cee Studs
Figure 4.36 Effective Length Factor vs. Total Brace Stiffness for 362S-125-33 Series
of Lipped Cee Studs

130
Figure 4.37 Effective Length Factor vs. Total Brace Stiffness for 362S-162-43 Series
of Lipped Cee Studs
Figure 4.38 Effective Length Factor vs. Total Brace Stiffness for 362S-162-68 Series
of Lipped Cee Studs

131
Figure 4.39 Effective Length Factor vs. Total Brace Stiffness for 600S-125-33 Series
of Lipped Cee Studs
Figure 4.40 Effective Length Factor vs. Total Brace Stiffness for 600S-162-43 Series
of Lipped Cee Studs

132
Figure 4.41 Effective Length Factor vs. Total Brace Stiffness for 600S-162-97 Series
of Lipped Cee Studs
Figure 4.42 Effective Length Factor vs. Total Brace Stiffness for 800S-162-43 Series
of Lipped Cee Studs

133
Figure 4.43 Effective Length Factor vs. Total Brace Stiffness for 800S-162-97 Series
of Lipped Cee Studs
Figure 4.44 Location of Linear Potentiometers on the Bridging Connection
LP-1LP-2
LP-3LP-4
LP-5

134
Figure 4.45 Plot of Applied Load vs. Calculated Rotation at the Center-line of the Web
for the 362S Series of Studs with SS Connection.
Figure 4.46 Plot of Applied Load vs. Calculated Rotation at the Center-line of the Web
for the 600S Series of Studs with SS Connection.

135
Figure 4.47 Plot of Applied Load vs. Calculated Rotation at the Center-line of the Web
for the 800S Series of Studs with SS Connection.
Figure 4.48 Plot of Applied Load vs. Calculated Rotation at the Center-line of the Web
for the 362S Series of Studs with WW Connection

136
Figure 4.49 Plot of Applied Load vs. Calculated Rotation at the Center-line of the Web
for the 600S Series of Studs with WW Connection
Figure 4.50 Plot of Applied Load vs. Calculated Rotation at the Center-line of the Web
for the 800S Series of Studs with WW Connection

137
Figure 4.51 Plot of Applied Load vs. Calculated Rotation at the Center-line of the Web
for the 362S Series of Studs with DW Connection
Figure 4.52 Plot of Applied Load vs. Calculated Rotation at the Center-line of the Web
for the 600S Series of Studs with DW Connection

138
Figure 4.53 Plot of Applied Load vs. Calculated Rotation at the Center-line of the Web for the 800S Series of Studs with DW Connection
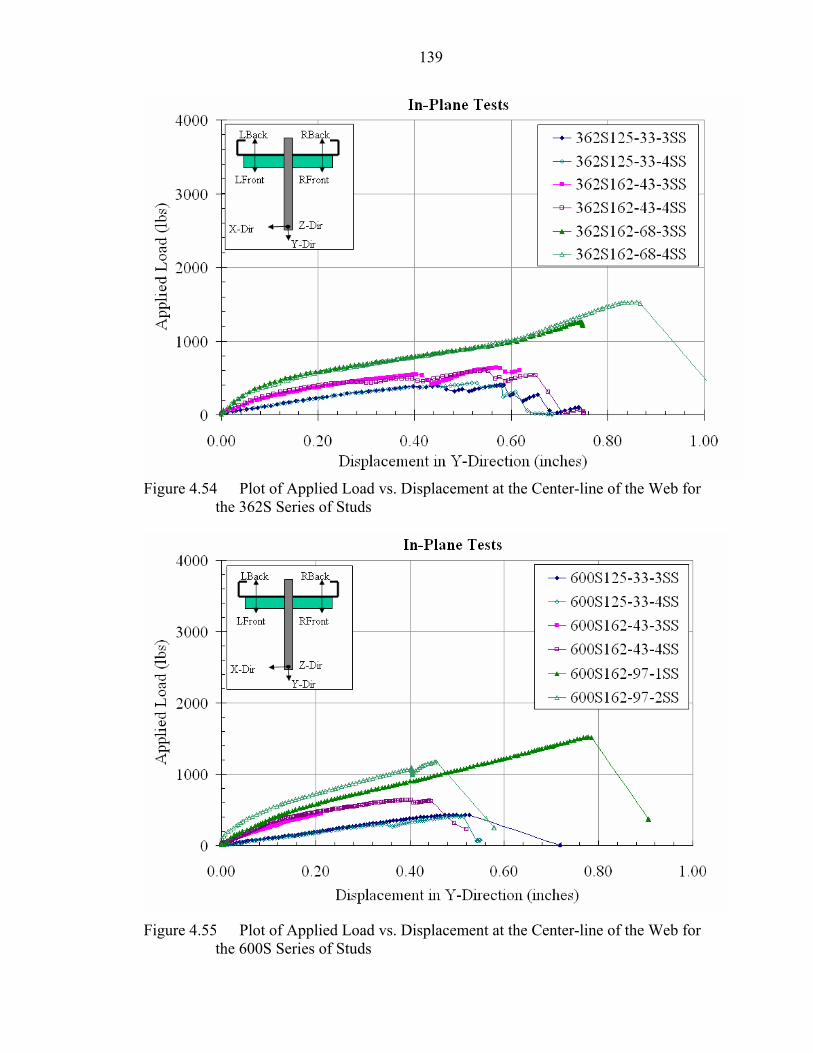
139
Figure 4.54 Plot of Applied Load vs. Displacement at the Center-line of the Web for
the 362S Series of Studs
Figure 4.55 Plot of Applied Load vs. Displacement at the Center-line of the Web for
the 600S Series of Studs

140
Figure 4.56 Plot of Applied Load vs. Displacement at the Center-line of the Web for
the 800S Series of Studs
Figure 4.57 Plot of Applied Load vs. Displacement at the Center-line of the Web for
the 362S Series of Studs

141
Figure 4.58 Plot of Applied Load vs. Displacement at the Center-line of the Web for
the 600S Series of Studs
Figure 4.59 Plot of Applied Load vs. Displacement at the Center-line of the Web for
the 800S Series of Studs

142
Figure 4.60 Plot of Applied Load vs. Displacement at the Center-line of the Web for
the 362S Series of Studs
Figure 4.61 Plot of Applied Load vs. Displacement at the Center-line of the Web for
the 600S Series of Studs

143
Figure 4.62 Plot of Applied Load vs. Displacement at the Center-line of the Web for
the 800S Series of Studs
Figure 4.63 Plot of Initial Torsional Stiffness vs. Effective Flat-width to Thickness
Ratio for the Out-of-Plane loading Tests on SS-type Connection

144
Figure 4.64 Plot of Initial Torsional Stiffness vs. Effective Flat-width to Thickness
Ratio for the Out-of-Plane loading Tests on WW-type Connection
Figure 4.65 Plot of Initial Torsional Stiffness vs. Effective Flat-width to Thickness
Ratio for the Out-of-Plane loading Tests on DW-type Connection

145
Figure 4.66 Plot of Initial Flexural Stiffness vs. Effective Flat-width to Thickness
Ratio for the In-Plane loading Tests on SS-type Connection
Figure 4.67 Plot of Initial Flexural Stiffness vs. Effective Flat-width to Thickness
Ratio for the In-Plane loading Tests on WW-type Connection

146
Figure 4.68 Plot of Initial Flexural Stiffness vs. Effective Flat-width to Thickness
Ratio for the In-Plane loading Tests on DW-type Connection
(a) Total Brace Force (b) Flexural Components (c) Torsional Components
Figure 4.69 Brace Forces as a Resultant of Flexural and Torsional Components

147
CHAPTER 5 ANALYTICAL EVALUATION
This chapter discusses the analytical methods used to determine the axial load
capacity of the cee-stud, initial flexural stiffness and initial torsional stiffness of the
bracing connections. The calculations of the total connection stiffness from the
experimental results are also presented. The axial capacity was calculated for each stud
cross-section using the experimentally determined mechanical properties of the eight
groups of cee-studs. The flexural and torsional stiffness of the bracing connections were
determined using basic structural mechanics and applying the elastic spring analogy to
the connection components.
5.1 Analytical Load Capacity of Unbraced and Fully Braced Studs
The axial load capacity of braced and unbraced studs was determined using
MathCAD worksheets developed by Chen for AISI (1999). Table 5.1 gives the
calculated axial load capacities based on two different effective length factors. The end
conditions of the stud were considered pinned for weak axis flexural buckling, fixed for
strong axis flexural buckling and fixed for torsional buckling about the shear center. The
reasons for choosing these support conditions and the effects on stud behavior have been
discussed in Chapter 4. The effective length factor for the case of an unbraced stud, for
strong axis flexural buckling, Kx = 0.5, for weak axis flexural buckling, Ky = 1.0 and for
torsional buckling, Kt = 0.5. The effective length factor for the case of a braced stud, for
strong axis flexural buckling, Kx = 0.5, for weak axis flexural buckling, Ky = 0.5 and for
torsional buckling, Kt = 0.25. The MathCAD worksheets accounts for the size of the

148
punchouts and their locations. The axial load capacity is affected by the size of the
punchout, the effect of which is in reduction of the axial load capacity. The effective
cross-sectional area is determined based on the effective width of the web across the
punchout as per Section B2.2, AISI (1999). The critical buckling stress is computed as
the minimum of the strong axis buckling stress, the weak axis buckling stress or the
torsional buckling stress. The axial loads predicted by the AISIWIN (2000) program
whose results are given in Tables 4.3 and 4.4 did not include the effect of punchouts and
hence are greater than the values given in Table 5.1 for the same cross-section of the cee-
stud. It may be observed that in both the analytical determinations of axial load
capacities fall below the actual experimental maximum load. This is because of the
support restraint that is present in the test specimens.
These MathCAD worksheets were used to compare the results obtained from
AISIWIN (2000). It can be observed that AISIWIN gives a higher prediction of the axial
load capacity than the MathCAD worksheets results. It must be noted here that, using
both these analytical methods, the axial capacity was far conservative due to which the
brace stiffness and demand happens to be less than the experimentally required value.
This leads to a bracing requirement that is unconservative for all practical purposes. The
reason being that the support conditions in the standard industry practice, using standard
tracks, offers far more rigidity than the ideal cases of pinned ends. The two analytical
methods used to determine the axial load capacities of the cee-studs though have the
option of specifying the effective lengths, it is a judgment call by the practicing engineer
to safely choose the effective lengths.

149
5.2 Analytical Bridging Connection Stiffness of a Flexible Bracing
The experimental values of initial connection stiffness have been determined in
Chapter 4. Referring back to Table 4.13, the initial torsional stiffness at 10% of the
maximum load is calculated as the ratio of the applied load to the corresponding rotation
of the web. It was observed that within this load range, the initial slopes of the plots were
nearly linear. Similarly, Table 4.15 gives the initial flexural stiffness at 10% of the
maximum load, calculated as the ratio of the applied load to the corresponding Y-
displacement of Point A, the point of application of the load on the channel bridging,
measured by a string potentiometer.
The total actual stiffness of the bridging system is calculated using Eq. 2.22, as
described in Chapter 2. The total actual stiffness is the reciprocal of the sum of
reciprocals of the connection stiffness and the brace stiffness, because the bridging
connection is in series with the bracing system. The bridging connection is comprised of
several connecting elements that are in series with one another and their equivalent
connection stiffness determination is given in Urala (2004). The total connection
stiffness was determined from both the experimental results of the bridging tests and the
analytical models developed for each connection type. The comparisons of the calculated
experimental stiffness with calculated analytical stiffness are presented in Tables 5.2 and
5.3 for the initial flexural stiffness and the initial torsional stiffness, respectively.
5.2.1 Initial Flexural Stiffness of the Bracing Connection
The following assumptions were made in finding the analytical value of initial
flexural stiffness:
• The bridging channel was considered to be under tension due to the applied load and the deformation was computed using the following equation:

150
( )1.5EA
LP
=∆
• The clip angle acts as a beam supported at two points, subjected to two point loads. The moment of inertia of the angle was taken about its horizontal leg. For the SS type connection, the angle was considered to be simply-supported between the screws, and for the WW type connection, the angle was considered to be fixed at the welds. The MathCAD worksheet for this calculation is given in Urala (2004) and provides the calculations for this analytical determination.
• The web was considered as a rectangular plate with either simple or fixed edges at the boundaries. The plate was considered to be subjected to concentrated loads at the location of the screws or the welds. The plate buckling equation (Roark 1985) for a rectangular plate subjected to a concentrated load is given as:
( ) ( )2.5tEba1C
P 32µ−=
∆
where C = Support fixity coefficient of the steel plate
E = Elastic modulus of cold-formed steel
P = Applied load
a, b = Dimensions of the rectangular plate
t = Thickness of the rectangular plate
∆ = Displacement due to applied load, P
µ = Poisson’s ratio of steel, 0.3
The effective width of the web plate was calculated as per Section B2.2, AISI
(1999) which is as follows:
when λ > 0.673
( )a3.5w
d8.022.01wb h⎥⎦⎤
⎢⎣⎡ −
λ−
λ=
when λ ≤ 0.673 or
( )b3.5dwb h−=

151
where dh = Diameter of the elongated circular punchout
The slenderness factor is calculated using the relation
)4.5(Ef
tw
k052.1 y=λ
where k = Plate buckling coefficient
= 24.0 for simply-supported edges
= 40.8 for fixed-fixed edges
The effect of the length of the punchout was considered to be negligible since the
web is assumed to be infinite in that direction while the predominant flexural
displacement was along the shorter span direction between the flanges of the cee-stud
cross-section. In all the cases, the stiffness and deformation of the screws or the welds
was calculated and found that these components had little effect on the overall connection
stiffness, and hence they were later neglected for simplicity.
The flexural stiffness values are plotted in Figures 5.1, 5.2 and 5.3 against the
slenderness factor of the stud web, determined using Eq. 5.4 for the three connection
types (SS, WW and DW), respectively. The plots contain four different data sets
representing the following cases of initial flexural stiffness for the in-plane loading tests:
• Experimental lower bound values (LBV)
• Experimental upper bound values (UBV)
• Analytical value for a rectangular plate with four simply-supported edges
• Analytical value for a rectangular plate with four fixed edges
5.2.1.1 SS type connection
It can be observed that in Figure 5.1 and Table 5.2 for the SS Type connection the
analytical calculation of the initial flexural stiffness increases exponentially with decrease

152
in the web slenderness factor (λ). It can also be observed that the analytical flexural
stiffness values for the rectangular plate with either fixed edges or simply-supported
edges form the upper and lower bounds to the experimental values of the initial flexural
stiffness for the SS Type connection. For the eight groups of studs in the experimental
program, the slenderness factor varied from 0.43 to 1.43 and the experimental initial
flexural stiffness varied from 7.94 to 1.00 kip/in., respectively. The analytical flexural
stiffness for the lower slenderness factors show a greater difference for the type of
support condition than the higher slenderness factors that show almost equal values for
the different types of support conditions.
5.2.1.2 WW type connection
The analytical initial flexural stiffness values, shown in Figure 5.2 for the WW
Type connection, decrease linearly with increasing web slenderness factor (λ). It was
clearly observed that the analytical flexural stiffness values for a rectangular plate with
either fixed edges or simply-supported edges form the upper and lower bounds to the
experimental values of the initial flexural stiffness for the WW Type connection. For the
three groups of studs in the experimental program, the slenderness varied from 0.43 to
0.63 and the corresponding experimental initial flexural stiffness varied from 40.8 to 10.5
kip/in, respectively.
5.2.1.3 DW type connection
The analytical initial flexural stiffness values shown in Figure 5.3 for the DW Type
connection, decrease linearly with increasing web slenderness factor (λ). Except for one
value of experimental stiffness, the analytical values form the upper and lower bound
values to the experimental initial flexural stiffness values. For the three groups of studs
in the experimental program, the slenderness varied from 0.43 to 0.63 and the

153
corresponding experimental initial flexural stiffness varied from 50.4 to 2.4 kip/in.,
respectively.
From the above three figures, it can be generalized that the analytical determination
of initial flexural stiffness values is close enough to the values determined from the
experimental results.
5.2.2 Initial Torsional Stiffness of the Bracing Connection
The following assumptions were made in determining the initial torsional stiffness
of the bracing connection:
• The bridging channel was considered to be rigid enough not to deform under the influence of the applied out-of-plane load. This assumption was verified and found to be true since all the torsional deformation was occurring at the stud web.
• The clip angles in case of the SS and WW Type connections were considered to be initially rigid compared to the stiffness of the web.
• The web was considered as a rectangular plate with fixed edges. The plate was considered to be subjected to two point loads. The first point load was a direct pull at the location of the screw or the weld. The second point load was the resultant of the bearing pressure of the clip angle on the web. For simplicity, the two point loads were considered to be of equal magnitude and equidistant from the vertical centerline of the web.
The initial torsional stiffness values determined using Eq. 5.4 are plotted in Figure
5.4 against the web slenderness factor for the SS Type connection. The plot contains four
different data sets representing the following cases of initial torsional stiffness for the
out-of-plane loading tests:
• Experimental lower bound values (LBV)
• Experimental upper bound values (UBV)
• Analytical value for a rectangular plate with four fixed edges
With calculations based on above assumptions the results obtained for the
analytical initial torsional stiffness of the SS Type connection is not accurate or even in

154
the same range as that of the values determined from the experimental tests and can be
observed in Figure 5.4 and Table 5.3. This requires a further study and more exact model
of the connection has to be developed. There are several factors contributing to the
torsional stiffness and the flexural stiffness of the clip angle and the bracing channel has
to be converted to an equivalent torsional stiffness. The bearing of the clip angle is
causes uniformly varying load on the web which has a resultant that is not at the same
distance as the location of the connection point load. This causes an unsymmetrical load
distribution about the vertical centerline of the web. This uniformly varying load is also
affected by the presence of the web punchout causing a trapezoidal load on the loaded
portion of the web. Based on some of the experimental observations during the test, the
clip angle has been the controlling critically stiff element and hence its stiffness is
important in calculating the initial torsional stiffness of the connection. Further analysis
is required to assess the initial torsional stiffness analytically.
5.3 Total Stiffness of the Bridging Connection
The determination of the total stiffness of the bridging system has been discussed in
detail in Chapter 4. The initial stiffness of the bridging connection is determined
experimentally at an applied load of 10% of the maximum load attained during the
bracing tests and is explained in Section 4.2 of this report.
5.3.1 Initial Flexural Stiffness
The determination of the total flexural stiffness of the bridging connection has been
discussed in Chapter 2 and is given by Eq. 2.2, which is given as:
)22.2(111
braceconnact β+
β=
β

155
For each cee-stud any of the three connection types can be used to secure the mid-
height bracing. The stiffness of each connection type is given in Table 4.16 which is
based on two test results per stud and connection type. Table 5.4 gives the total
equivalent flexural stiffness of the bridging connection for each of the 37 axially loaded
studs. It is assumed that the bridging connection remains elastic when the axially loaded
cee-stud has reached its full capacity. This is evident by the fact that the connection
stiffness is greater than the brace stiffness. However the total actual stiffness is slightly
lower than the total brace stiffness. This is because the connection itself undergoes
deformations under the applied load. The connection stiffness given in Table 5.4 is
obtained as the average value from the two tests for each stud and connection type.
5.3.2 Initial Torsional Stiffness
The determination of the total torsional stiffness of the bridging connection has
been discussed in Chapter 2 and is given by Eq. 2.2, as given above. For each cee-stud
any of the three connection types can be used to secure the mid-height bracing. The
torsional stiffness of the brace wire is determined assuming that the torsional buckling
occurs about the centroid of the gross-section rather than the shear center. This is
because the brace wires restrain the stud from strong axis displacement. If the force in
the brace wire is P, the deformation of the brace is ∆, then the stiffness of the brace wire
is given by:
( )5.5L
EAP=
∆
If the cross-section rotates by an angle θ, then for small angular deformations,
( )6.52/D
∆=θ

156
Substituting Eq. 5.5 in 5.6, we get the torsional stiffness of the bracing as:
( )7.52
DEALP=
θ
where A = Area of cross-section of brace wire
E = Elastic modulus of steel wire = 29,000,000 psi.
D = Distance between the brace wires = depth of the cee-stud
L = Length of brace wire
P = Force in the brace wire
Table 5.5 gives the calculated values of torsional stiffness of the brace wire. Table
5.6 gives the total equivalent torsional stiffness of the bridging connection for each of the
36 axially loaded studs. The values of the experimental initial torsional stiffness for two
test specimens per stud cross section and connection type has been previously given in
Table 4.17 and the average value of those two is given in Table 5.6

157
Table 5.1 Axial Load Capacities of Test Specimens Using AISI (1999) MathCAD Worksheets Tension Coupon
Test Results AISI (1999) MathCAD worksheets
Yield Stress
Ultimate. Stress
As-Built Ultimate Capacity (Pu)
As-Built Unfactored
Capacity (Pn)
Required Ideal Brace
Stiffness Stud Designation
Fy Fu
As-Built
Section Area Unbraced
Mid-Point Brace
No Brace
Mid-Point Brace
βideal
D S B t ksi ksi in.2 lbs lbs lbs lbs lbs/in.
362 S 125 33 48.53 55.48 0.2028 429 1587 505 1867 78
362 S 162 43 47.04 58.20 0.3089 2221 6968 2613 8197 342
362 S 162 68 52.01 67.80 0.5154 3713 11549 4369 13587 566
600 S 125 33 24.03 45.24 0.2537 587 1542 690 1814 76
600 S 162 43 46.24 54.88 0.4135 2156 5832 2536 6862 286
600 S 162 43a 50.30 59.38 0.4346 2461 6715 2895 7900 329
600 S 162 97 60.20 70.21 0.9807 6287 19904 7396 23417 976
800 S 162 43 40.23 54.90 0.4829 1967 5156 2314 6066 253
800 S 162 97 42.50 67.49 1.1841 6694 17468 7876 20550 856 As-Built sectional properties were based on the experimentally measured dimensions Ideal Brace Stiffness was obtained using Yura's Bracing Equation 2.14 (Yura 1995) Design factor used in calculating the Unfactored Capacity was 0.85

158
Table 5.2 Comparison of Initial Flexural Stiffness of the In-Plane Tests
Stud Designation Slenderness Factor Initial Stiffness Analytical Stiffness
D S B t C λ Lower Upper Simple Fixed
kip/in. kip/in. kip/in. kip/in.
362 S 125 33 SS 0.8984 1.68 2.07 0.65 1.34
362 S 162 43 SS 0.6768 3.57 4.20 1.45 2.97
362 S 162 68 SS 0.4343 6.10 7.94 6.25 12.64
600 S 125 33 SS 1.0733 1.00 1.14 0.17 0.35
600 S 162 43 SS 1.1406 3.79 3.82 0.38 0.78
600 S 162 97 SS 0.5493 5.57 6.86 4.78 9.62
800 S 162 43 SS 1.4328 2.07 2.46 0.19 0.39
800 S 162 97 SS 0.6296 2.95 7.08 2.34 4.71
362 S 162 68 WW 0.4343 30.42 40.79 25.82 49.78
600 S 162 97 WW 0.5493 15.24 16.52 14.13 27.63
800 S 162 97 WW 0.6296 10.51 19.67 7.29 14.40
362 S 162 68 DW 0.4343 45.36 50.41 15.70 31.09
600 S 162 97 DW 0.5493 8.26 8.26 7.55 15.25
800 S 162 97 DW 0.6296 2.40 2.40 3.23 6.60

159
Table 5.3 Comparison of Initial Torsional Stiffness of the In-Plane Tests
Stud Designation Slenderness Factor Initial Stiffness Analytical Stiffness
D S B t C λ Lower Upper Simple Fixed
kip-in./rad kip-in./rad kip-in./rad kip-in./rad
362 S 125 33 SS 0.8984 2.96 4.00 - 0.51
362 S 162 43 SS 0.6768 5.33 7.04 - 1.12
362 S 162 68 SS 0.4343 13.88 15.72 - 4.13
600 S 125 33 SS 1.0733 7.02 7.20 - 0.62
600 S 162 43 SS 1.1406 21.04 24.08 - 1.37
600 S 162 97 SS 0.5493 31.38 43.60 - 14.25
800 S 162 43 SS 1.4328 51.41 60.32 - 1.73
800 S 162 97 SS 0.6296 70.32 78.95 - 18.44
362 S 162 68 WW 0.4343 75.79 99.27 - -
600 S 162 97 WW 0.5493 197.37 211.10 - -
800 S 162 97 WW 0.6296 236.61 314.45 - -
362 S 162 68 DW 0.4343 28.89 32.40 - -
600 S 162 97 DW 0.5493 26.31 26.72 - -
800 S 162 97 DW 0.6296 18.04 27.58 - -

160
Table 5.4 Total Flexural Stiffness of the Bridging Connections Total Brace
Stiffness
Experimental Initial Flexural Stiffness of the Bridging Connection
Total Flexural Stiffness of the Bridging Connection Stud Designation
βprovided SS Type WW Type DW Type SS Type WW Type DW Type D S B t ID lbs/in. lbs/in. lbs/in. lbs/in. lbs/in. lbs/in. lbs/in.
362 S 125 33 5 0 0 362 S 125 33 3 192 1875 174 362 S 125 33 4 192 1875 174 362 S 125 33 6 201 1875 182 362 S 125 33 1 413 1875 338 362 S 125 33 2 765 1875 543 362 S 162 43 1 0 0 362 S 162 43 2 371 3885 339 362 S 162 43 4 734 3885 617 362 S 162 43 3 1478 3885 1071 362 S 162 68 5 0 0 362 S 162 68 3 1023 7020 35605 47885 893 994 1001 362 S 162 68 4 1538 7020 35605 47885 1262 1475 1490 362 S 162 68 2 2046 7020 35605 47885 1584 1935 1962 600 S 125 33 2 0 600 S 125 33 4 61 1070 57 600 S 125 33 3 123 1070 110 600 S 125 33 1 402 1070 292

161
Table 5.4 (Continued) Total Flexural Stiffness of the Bridging Connections Total Brace
Stiffness
Experimental Initial Flexural Stiffness of the Bridging Connection
Total Flexural Stiffness of the Bridging Connection Stud Designation
βprovided SS Type WW Type DW Type SS Type WW Type DW Type D S B t ID lbs/in. lbs/in. lbs/in. lbs/in. lbs/in. lbs/in. lbs/in.
600 S 162 43 6 0 600 S 162 43 6a 0 600 S 162 43 5 61 3800 60 600 S 162 43 2 148 3800 142 600 S 162 43 1 497 3800 440 600 S 162 43 4 990 3800 785 600 S 162 97 5 0 600 S 162 97 4 324 6215 15880 8260 308 317 312 600 S 162 97 3 1041 6215 15880 8260 892 977 924 600 S 162 97 1 2069 6215 15880 8260 1552 1831 1655 600 S 162 97 2 3357 6215 15880 8260 2180 2771 2387 800 S 162 43 4 0 800 S 162 43 2 149 2265 140 800 S 162 43 3 299 2265 264 800 S 162 43 5 602 2265 476 800 S 162 97 3 0 800 S 162 97 2 1041 5015 15090 2400 862 974 726 800 S 162 97 1 2093 5015 15090 2400 1477 1838 1118 800 S 162 97 4 4195 5015 15090 2400 2284 3283 1527

162
Table 5.5 Calculated Brace Stiffness and Total Brace Stiffness of the Test Specimens Wire
Stud Designation Target Brace
Stiffness
As-Built Depth of
Stud Dia. Area L Nos. Torsional Stiffness of
Wire
D S B t ID lbs/in. in. in. in.2 in. lbs-in./rad 362 S 125 33 5 0 3.613 - - - - 0 362 S 125 33 3 100 3.613 0.016 0.000201 60.75 1 11 362 S 125 33 4 100 3.613 0.016 0.000201 60.75 1 11 362 S 125 33 6 100 3.613 0.016 0.000201 58 1 11 362 S 125 33 1 200 3.613 0.016 0.000201 56.5 2 21 362 S 125 33 2 400 3.613 0.016 0.000201 30.5 2 21 362 S 162 43 1 0 3.564 - - - - 0 362 S 162 43 2 200 3.564 0.024 0.000452 70.75 1 23 362 S 162 43 4 400 3.564 0.024 0.000452 35.75 1 23 362 S 162 43 3 800 3.564 0.024 0.000452 35.5 2 47 362 S 162 68 5 0 3.638 - - - - 0 362 S 162 68 3 500 3.638 0.033 0.000855 48.5 1 45 362 S 162 68 4 750 3.638 0.033 0.000855 32.25 1 45 362 S 162 68 2 1000 3.638 0.033 0.000855 24.25 1 45 600 S 125 33 2 0 6.020 - - - - 0 600 S 125 33 4 30 6.020 0.01 0.000079 75 1 7 600 S 125 33 3 60 6.020 0.01 0.000079 37 1 7 600 S 125 33 1 200 6.020 0.016 0.000201 29 1 18

163
Table 5.5 (Continued) Calculated Brace Stiffness and Total Brace Stiffness of the Test Specimens Wire
Stud Designation Target Brace Stiffness
As-Built Depth of Stud Dia. Area L Nos.
Torsional Stiffness of Wire
D S B t ID lbs/in. in. in. in.2 in. lbs-in./rad 600 S 162 43 6 0 6.021 - 0 600 S 162 43 6a 0 5.984 - 0 600 S 162 43 5 30 6.021 0.01 0.000079 75.25 1 7 600 S 162 43 2 75 6.021 0.016 0.000201 79 1 18 600 S 162 43 1 250 6.021 0.024 0.000452 52.75 1 39 600 S 162 43 4 500 6.021 0.024 0.000452 26.5 1 39 600 S 162 97 5 0 6.082 - 0 600 S 162 97 4 160 6.082 0.024 0.000452 81 1 40 600 S 162 97 3 500 6.082 0.0348 0.000951 53 1 84 600 S 162 97 1 1000 6.082 0.0625 0.003068 86 1 271 600 S 162 97 2 1500 6.082 0.0625 0.003068 53 1 271 800 S 162 43 4 0 7.921 - 0 800 S 162 43 2 75 7.921 0.016 0.000201 78.25 1 23 800 S 162 43 3 150 7.921 0.016 0.000201 39 1 23 800 S 162 43 5 300 7.921 0.016 0.000201 38.75 2 46 800 S 162 97 3 0 8.044 - 0 800 S 162 97 2 500 8.044 0.0348 0.000951 53 1 111 800 S 162 97 1 1000 8.044 0.0625 0.003068 85 1 358 800 S 162 97 4 2100 8.044 0.0475 0.001772 24.5 1 207

164
Table 5.6 Total Torsional Stiffness of the Bridging Connections Experimental Initial Flexural Stiffness
of the Bridging Connection Total Flexural Stiffness of the
Bridging Connection Stud Designation Torsional
Stiffness of the Brace SS Type WW Type DW Type SS Type WW Type DW Type
D S B t ID lbs-in./rad lbs-in./rad lbs-in./rad lbs-in./rad lbs-in./rad lbs-in./rad lbs-in./rad 362 S 125 33 5 0 0 362 S 125 33 3 11 3475 11 362 S 125 33 4 11 3475 11 362 S 125 33 6 11 3475 11 362 S 125 33 1 21 3475 21 362 S 125 33 2 21 3475 21 362 S 162 43 1 0 0 362 S 162 43 2 23 6185 23 362 S 162 43 4 23 6185 23 362 S 162 43 3 47 6185 46 362 S 162 68 5 0 0 362 S 162 68 3 45 14800 87530 30645 45 45 45 362 S 162 68 4 45 14800 87530 30645 45 45 45 362 S 162 68 2 45 14800 87530 30645 45 45 45 600 S 125 33 2 0 0 600 S 125 33 4 7 7110 7 600 S 125 33 3 7 7110 7 600 S 125 33 1 18 7110 18
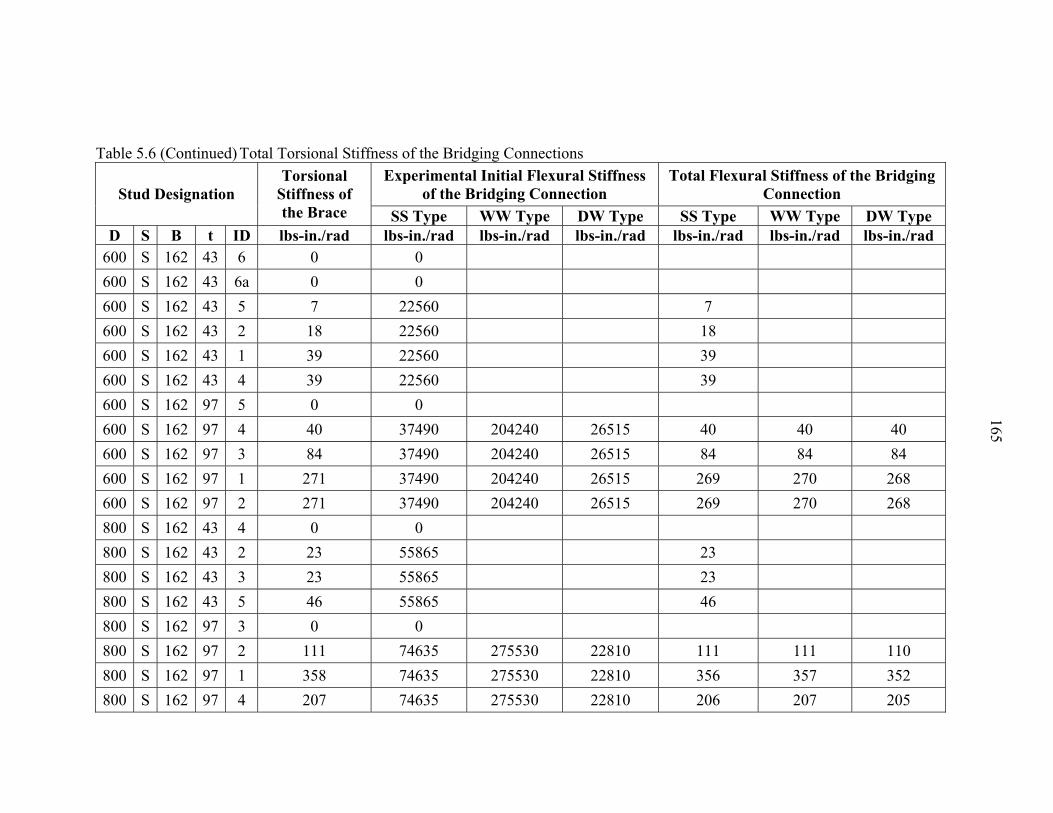
165
Table 5.6 (Continued) Total Torsional Stiffness of the Bridging Connections Experimental Initial Flexural Stiffness
of the Bridging Connection Total Flexural Stiffness of the Bridging
Connection Stud Designation Torsional
Stiffness of the Brace SS Type WW Type DW Type SS Type WW Type DW Type
D S B t ID lbs-in./rad lbs-in./rad lbs-in./rad lbs-in./rad lbs-in./rad lbs-in./rad lbs-in./rad 600 S 162 43 6 0 0 600 S 162 43 6a 0 0 600 S 162 43 5 7 22560 7 600 S 162 43 2 18 22560 18 600 S 162 43 1 39 22560 39 600 S 162 43 4 39 22560 39 600 S 162 97 5 0 0 600 S 162 97 4 40 37490 204240 26515 40 40 40 600 S 162 97 3 84 37490 204240 26515 84 84 84 600 S 162 97 1 271 37490 204240 26515 269 270 268 600 S 162 97 2 271 37490 204240 26515 269 270 268 800 S 162 43 4 0 0 800 S 162 43 2 23 55865 23 800 S 162 43 3 23 55865 23 800 S 162 43 5 46 55865 46 800 S 162 97 3 0 0 800 S 162 97 2 111 74635 275530 22810 111 111 110 800 S 162 97 1 358 74635 275530 22810 356 357 352 800 S 162 97 4 207 74635 275530 22810 206 207 205

166
Figure 5.1 Flexural Stiffness of the SS Type Connection
Figure 5.2 Flexural Stiffness of the WW Type Connection
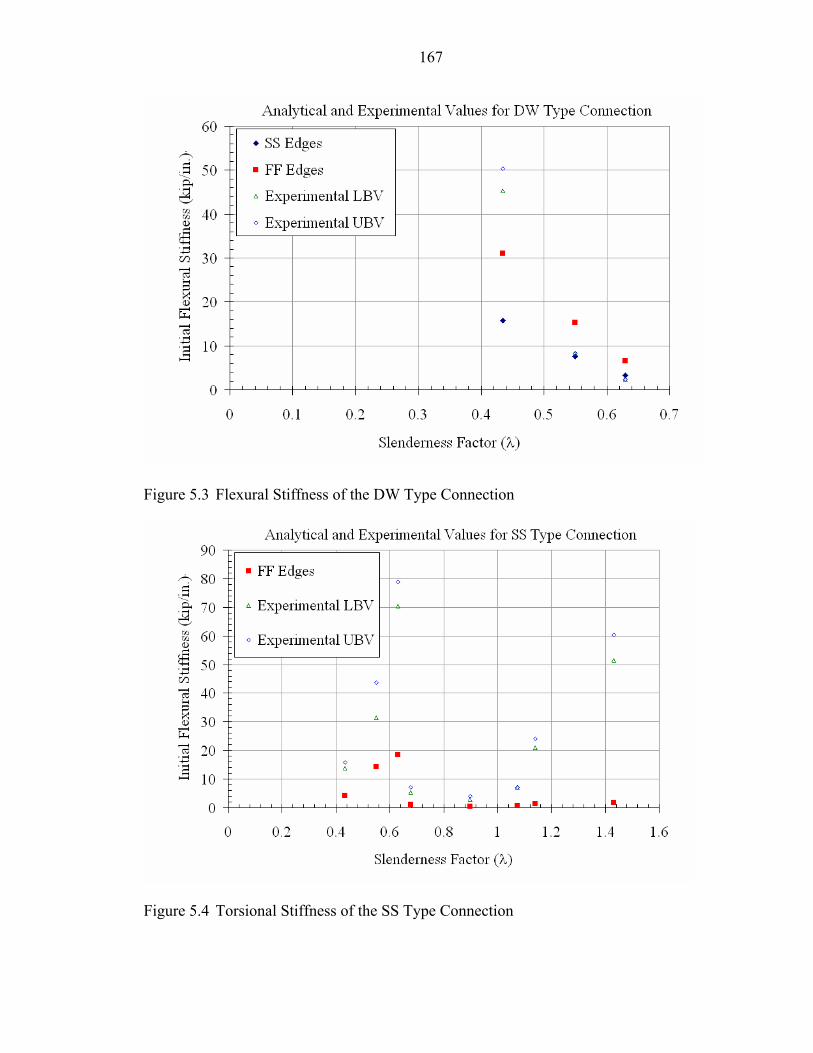
167
Figure 5.3 Flexural Stiffness of the DW Type Connection
Figure 5.4 Torsional Stiffness of the SS Type Connection

168
CHAPTER 6 CONCLUSIONS AND DESIGN RECOMMENDATIONS
The current provisions of the North American Cold-Formed Steel Specification do
not specify the minimum requirements of the bracing strength and stiffness for structural
wall stud assembly systems. These load bearing steel studs can also be used as stand-
alone columns. The current provisions of the AISC-LRFD Specification (AISC 1999)
have been discussed in Section 2.5 for hot-rolled steel members, but there are no
equivalent provisions in the current North American Cold-Formed Steel Specification
(2001). An experimental investigation was conducted at the Structures Laboratory,
Department of Civil and Coastal Engineering, University of Florida, Gainesville, to
ascertain the bracing strength and stiffness requirements for single column axially loaded
cee-studs with mid-height lateral bracing about the weak axis. The experimental results
and analytical evaluations of this investigation have been provided in Chapters 3, 4 and 5.
This chapter describes the proposed minimum bracing requirements based on the
experimental results and analytical calculation that were performed. In addition, a
standard test procedure for determining the bracing connection strength and stiffness has
been developed.
6.1 General Conclusions and Recommendations
The following observations can be made based on the results of this research
through its experimental investigation and analytical evaluation:
1. The compressive axial load capacity of a cold-formed cee-stud predicted by the current provisions of the AISI Specification (1999), under-predicts the axial capacity owing to ideal support conditions that are non-existent in general practice.

169
The bracing strength and stiffness is directly proportional to the axial load capacity leading to under-prediction of the actual ideal bracing requirement.
2. The mounting of the cee-stud in industry standard track offers partial base fixity and causes a reduction in the effective length of the compression member, leading to higher axial load capacity of the cee-stud. This, in turn, leads to higher demand on the mid-height lateral bracing for flexural and torsional buckling. The fixity factor varies for each stud cross-section and a separate study is recommended to ascertain these values.
3. The depth of the track and its connection type may affect the axial load capacity of the stud and hence a separate study is recommended to determine the effect of different track geometry on the support fixity.
4. The support fixities are different for different buckling modes that the mono-symmetric cee-stud section is subjected to and hence the same effective length factors cannot be used for all the different buckling modes.
5. Based on the type of mid-height bracing, the stud is either forced into flexural buckling or flexural-torsional buckling even if the unbraced stud predominantly would fail by torsional buckling. This adversely affects the performance of the stud in a wall-stud panel system. The critical buckling stresses for each of the buckling modes has to be evaluated and the axial capacity needs to be determined based on the application of the stud.
6. The critical buckling stress, using the provisions in the AISI Specification (1999), is a minimum of weak axis flexural buckling stress, strong axis buckling stress and torsional buckling stress. The bracing required to ideally brace the cee-stud must be meet the demands not only in flexural buckling but also in torsional buckling due to the any of the limiting critical buckling stress states.
7. The initial flexural stiffness of the three industry standard bracing connections has been predicted from basic structural mechanics. Based on the fixity of a rectangular web plate, two cases were developed that form the upper and lower bounds to the experimental results. A similar procedure to determine the initial torsional stiffness was also undertaken. Additional work is required to develop a provision for torsional stiffness.
8. The stiffness and strength of the mid-height lateral bracing was drastically affected by the higher axial capacities in the experiments. The tests showed more than a 50% increase in the axial capacity of the unbraced cee-stud due to non-ideal support conditions. This led to non conservative prediction of the ideal bracing requirement for the eight groups of cee-studs that were evaluated in the investigation. Thus, bracing strength and stiffness of a few studs, which were classified as over braced, were actually under braced in the experiments.

170
9. The braced studs reached axial capacities greater than the unbraced studs and exhibited higher stiffness. The brace factor hence must be increased by a certain multiplier to account for this increased demand.
10. With increasing the brace stiffness for a particular cee-stud cross-section, the mid-height lateral displacement decreased, however, the axial capacities remained nearly the same.
11. The braced studs that failed by distortional buckling did not attain their predicted axial capacity since the critical buckling stress due to distortional buckling mode is less than that for the global buckling modes. It is necessary to consider distortional buckling as one of the limiting critical buckling modes for certain ranges of effective web depth-to-thickness ratios.
12. The effect of the size, shape and location of the web punchouts is critical for an analytical axial load capacity prediction. In the experiments, it was observed that maximum deformation occurred in the vicinity of the punchouts at close to ultimate loads. This surely indicates that even a better prediction of the axial load considering the support fixity will be affected by the punchouts, and hence a separate study is required to determine these effects.
13. Three standard industry bracing connections were tested for their strength and initial stiffness. The SS Type and the WW Type performed equally well in both the out-of-plane load tests and in-plane load tests. The WW Type had definitely higher stiffness when compared to the SS Type connection. The DW Type connection performed extremely well in the in-plane tests. Based on the stud cross-section and its usage, a suitable connection type should be chosen for the purpose of mid-height lateral bracing of the cee-stud.
14. It was observed that in the WW Type and DW Type tests, the connections failed due to poor performance of the weld. However, this may not be a very critical requirement due to the reasons mentioned below.
15. In all the bracing connection tests the analytical evaluation of the connection stiffness showed that the bracing stiffness is controlled by the stiffness of the stud web and the effects of other components are negligible.
16. Comparison of the experimental values of brace stiffness to the connection stiffness shows that the brace stiffness values are much lesser than the connection stiffness. Since the two spring stiffnesses are in series, the contribution of the connection stiffness to the total system stiffness is negligible due to the magnitude of values. The total system stiffness is slightly less than the brace stiffness. A suitable stiffness reduction factor may be used based on the connection type to simplify the calculations.
17. Initial geometric imperfections in the studs affect their axial load capacity and hence the maximum allowable imperfections must be as per the ASTM C645-00

171
(2000) for non-structural steel studs and ASTM C955-01 (2001) for structural steel studs.
6.2 Design Recommendations
This section gives the minimum requirements of the mid-height lateral bracing for
the cold-formed lipped cee-studs subjected to compressive axial loading. The equations
given below are as per Yura’s (1995) recommendations. It must be made note of here
that the out-of-straightness of the stud was taken at ∆o = L / 384.
The ideal brace stiffness is given by:
[ ] )14.2(L
Pn24βb
nideal brace,
−=
The required brace stiffness is at least:
)1.6(β2β ideal brace,required brace, =
The ideal brace strength is given by:
)2.6(P004.0P nideal brace, =
The minimum required brace strength is at least:
)3.6(P01.0P nrequired brace, =
where Lb = Unbraced length, or distance between the braces, inches.
Pbrace, ideal = Ideal bracing of the cee-stud, kips.
Pbrace, required = Minimum required brace strength, kips.
Pn = Nominal axial capacity when the assumed brace stiffness
is greater than or equal to βideal, kips.
n = Number of equally spaced intermediate brace locations
βbrace, ideal = Ideal brace stiffness
βbrace, required = Minimum required brace stiffness

172
The flexibility or ability of a brace connection to slip should be considered in the
evaluation of the actual bracing system stiffness, βact, as follows:
(2.22)β
1β
1β1
braceconnact
+=
where βconn = Stiffness of the connection
βbrace = Stiffness of the brace
The flexural stiffness and torsional stiffness have to be determined separately and then
the connection system employed in bracing the cee-stud must be checked for the above
minimum requirements. The unit for the initial flexural stiffness is (kip/in.) and that of
the initial torsional stiffness is (kip-in./rad).

173
LIST OF REFERENCES
American Institute of Steel Construction (AISC), 1999, Load and Resistance Factor Design Specification for Structural Steel Buildings, Third Edition, American Institute of Steel Construction, Chicago, IL.
American Iron and Steel Institute (AISI), 1996, Specification for the Design of Cold-Formed Steel Structural Members, American Iron and Steel Institute, Washington, D.C.
American Iron and Steel Institute (AISI), 1999, Specification for the Design of Cold-Formed Steel Structural Members Supplement No.-1, American Iron and Steel Institute, Washington, D.C.
American Iron and Steel Institute (AISI), 2001a, North American Specification for the Design of Cold-Formed Steel Structural Members – Code and Commentary, AISI, Washington, D.C.
American Iron and Steel Institute (AISI), 2001b, Commentary on North American Specification for the Design of Cold-Formed Steel Structural Members – Code and Commentary, AISI, Washington, D.C.
AISIWIN (Demo) V5.0, 2002, Devco Software, Inc. 245, NE Conifer, P.O. Box 1211, Corvallis, OR.
American Society for Testing Materials (ASTM), 2000, Standard Specification for Nonstructural Steel Framing Members, ASTM C645-00, American Society for Testing and Materials, Philadelphia, PA.
American Society for Testing Materials (ASTM), 2001 a, Standard Test Methods for Tension Testing of Metallic Materials, ASTM E8-01e2, American Society for Testing and Materials, Philadelphia, PA.
American Society for Testing Materials (ASTM), 2001 b, Standard Specification for Load-Bearing (Transverse and Axial) Steel Studs, Runners (Tracks), and Bracing or Bridging for Screw Application of Gypsum Panel Products and Metal Plaster Bases, ASTM C955-01, American Society for Testing and Materials, Philadelphia, PA.
Beshara, B., LaBoube, R.A., 2001, “Pilot Study: Lateral Braced C-Sections Under Bending”, Thin Walled Structures, Vol. 39, p 827-839.
174
Bleich, F., 1952, Buckling Strength of Metal Structures, McGraw-Hill, New York, NY.
Chajes, A., 1974, Principles of Structural Stability, Prentice-Hall, New Jersey, NJ.
Galambos, T.V., 1998, Guide to Stability Design Criteria for Metal Structures, Fifth Edition, John Wiley & Sons, New York.
Helwig, T.A., Yura, J.A., 1999, “Torsional Bracing of Columns”, Journal of Structural Engineering, Vol. 125, No. 5, p 547-555.
Kwon, Y.B., Hancock, G.J., 1991, “Strength Tests of Cold-Formed Channel Sections Undergoing Local and Distortional Buckling”, Research Report No. R640, School of Civil and Mining Engineering, University of Sydney, Australia.
Kavanagh, K.T., Ellifritt, D.S., 1993, “Bracing of Cold-Formed Channels Not Attached to Deck or Sheeting”, Bracing for Stability, Structural Stability Research Council, Bethlehem, PA.
Miller, T.H., 1990, “Behavior of Cold-Formed Steel Wall Stud Assemblies Subject to Eccentric Axial Loads”, Ph.D. Thesis, Cornell University, Ithaca, N.Y.
Miller, T.H., Pekoz, T., 1994, “Behavior of Gypsum-Sheathed Cold-Formed Steel Wall Studs”, Journal of Structural Engineering, Vol. 120, No. 5, p 1644-1650.
Plaut, R.H., 1993, “Requirements for Lateral Bracing of Columns with Two Spans”, Journal of Structural Engineering, Vol. 119, No. 10, p 2913-2931.
Shanley, F.R., 1947, “Inelastic Column Theory”, Journal of the Aeronautical Sciences, Vol. 14, No. 5, p 261-268.
Shanley, F.R., 1957, Strength of Materials, McGraw-Hill, New York.
Schafer, B.W., 2000, “Distortional Buckling of Cold-Formed Steel Columns”, Final Report to the American Iron and Steel Institute, Washington, D.C.
Steel Studs Manufacturers Association (SSMA), 2001, Product Technical Information, Steel Studs Manufacturers Association, ICBO ER-4943P, Chicago, IL.
Urala, V., 2004, “Bracing Requirements of Cold-Formed Steel Cee-Studs Subjected to Axial Compression”, Masters Thesis, University of Florida, Gainesville, FL.
Winter, G., 1959, “Cold-Formed, Light-Gage Steel Construction”, Journal of Structural Engineering, Vol. 85, No. ST 9, p 151-171.
Winter, G., 1960, “Lateral Bracing of Columns and Beams”, Transactions of the American Society of Civil Engineers, Vol. 125, p 807-845.
Young, B., Rasmussen, K.J.R., 1999, “Behavior of Cold-Formed Singly Symmetric Columns”, Thin Walled Structures, Vol. 33, p 83-102.

175
Young, B., Rasmussen, K.J.R., 2000, “Inelastic Bifurcation of Cold-Formed Singly Symmetric Columns”, Thin Walled Structures, Vol. 36, p 213-230.
Yu, W-W., 1991, Cold-Formed Steel Design, Third Edition, John Wiley and Sons, New York.
Yura, J.A., 1996, “Winter’s Bracing Model Revisited”, Engineering Structures Journal, Elsevier, Vol. 18, No. 10, pp 821-825.
Yura, J.A., 1995, “Bracing for Stability – State of the Art”, Bracing for Stability, Structural Stability Research Council, Bethlehem, Pa.
Zuk, W., (1956), “Lateral Bracing Forces on Beams and Columns”, Journal of Engineering Mechanics, Vol. 82, EM3, p 1032-1 – 1032-16.

1140 Connecticut Avenue, NW
Suite 705
Washington, DC 20036
www.steel.org
Re
sea
rch
Re
po
rt R
P-0
4-1