BPM Performance Manager Express for NetApp Filers v4.1€¦ · · 2015-02-16Installing BMC...
115
BMC Performance Manager Express for NetApp Filers STORAGE MONITORING USER DOCUMENTATION Version 4.1.01 February 2015
Transcript of BPM Performance Manager Express for NetApp Filers v4.1€¦ · · 2015-02-16Installing BMC...
BMC Performance Manager Expressfor NetApp Filers
STORAGE MONITORING
USER DOCUMENTATION
Version 4.1.01
February 2015

Contacting BMC Software
You can access the BMC Software Web site at http://www.bmc.com. From this Web site, you canobtain information about the company, its products, corporate offices, special events, and careeropportunities.
United States and Canada
Address BMC Software, Inc.2101 CityWest Blvd. Houston TX77042-2827
Telephone 1 (713) 918 8800 or 1 (800) 841 2031 (Toll Free)
Copyright 2006 BMC Software, Inc. or licensors, as an unpublished work. All rights reserved.
BMC Software, the BMC Software logos, and all other BMC Software product or service names areregistered trademarks or trademarks of BMC Software, Inc.
All other trademarks belong to their respective companies.
BMC Software considers information included in this documentation to be proprietary andconfidential. Your use of this information is subject to the terms and conditions of the applicableEnd User License Agreement for the product and the proprietary and restricted rights noticesincluded in this documentation.
Restricted Rights Legend
U.S. Government Restricted Rights to Computer Software. UNPUBLISHED -- RIGHTS RESERVEDUNDER THE COPYRIGHT LAWS OF THE UNITED STATES. Use, duplication, or disclosure of any dataand computer software by the U.S. Government is subject to restrictions, as applicable, set forthin FAR Section 52.227-14, DFARS 252.227-7013, DFARS 252.227-7014, DFARS 252.227-7015, andDFARS 252.227-7025, as amended from time to time. Contractor/Manufacturer is BMC Software,Inc., 2101 CityWest Blvd., Houston, TX 77042-2827, USA. Any contract notices should be sent to thisaddress.
2
BM
C P
erfo
rman
ce M
anag
er
Exp
ress
fo
r N
etA
pp F
ilers
Ver
sion
4.1
.01

Customer Support
You can obtain technical support by using the Support page on the BMC Software Web site or bycontacting Customer Support by telephone or e-mail. To expedite your inquiry, please see"Before Contacting BMC Software."
Support Web Site
You can obtain technical support from BMC Software 24 hours a day, 7 days a week at http://www.bmc.com/support_home. From this Web site, you can
Read overviews about support services and programs that BMC Software offers:
Find the most current information about BMC Software products
Search a database for problems similar to yours and possible solutions
Order or download product documentation
Report a problem or ask a question
Subscribe to receive e-mail notices when new product versions are released
Find worldwide BMC Software support center locations and contact information, including e-mail addresses, fax numbers, and telephone numbers
You can also access product documents and search the Knowledge Base for help with an issue athttp://www.sentrysoftware.com
Support by Telephone or E-mail
In the United States and Canada, if you need technical support and do not have access to the Web,call 800 537 1813. Outside the United States and Canada, please contact your local support centerfor assistance. To find telephone and email contact information for the BMC Software supportcenter that services your location, refer to the Contact Customer Support section of the Supportpage on the BMC Software Web site at http://www.bmc.com/support_home.
Before Contacting BMC Software
Before you contact BMC Software, have the following information available so that CustomerSupport can begin working on your problem immediately:
3
BM
C P
erfo
rman
ce M
anag
er
Exp
ress
fo
r N
etA
pp F
ilers
Ver
sion
4.1
.01
4
BM
C P
erfo
rman
ce M
anag
er
Exp
ress
fo
r N
etA
pp F
ilers
Ver
sion
4.1
.01
Table of Contents.....................................................................................................................................................................................18Installing BMC Performance Manager Express for NetApp Filers
.....................................................................................................................................................................................20Adding BMC Performance Manager Express for NetApp Filers to an Element Profile
.....................................................................................................................................................................................24Adding Application Classes to an Existing Element
.....................................................................................................................................................................................27Deleting Application Classes from an Element
.....................................................................................................................................................................................28Removing NetApp Filers Express from the Portal
.....................................................................................................................................................................................28Deleting Application Classes from an Element Profile
.....................................................................................................................................................................................31Automatically Enabling the Application Classes
.....................................................................................................................................................................................32Creating and Importing an Adapter for a BMC Portal Solution
.....................................................................................................................................................................................39Managing Baselines and Key Performance Indicators
.....................................................................................................................................................................................43Detecting High Processor Utilization
.....................................................................................................................................................................................45Ethernet/Fiber Port Traffic Report
.....................................................................................................................................................................................46Detecting Inode Shortages
.....................................................................................................................................................................................47Detecting Full File Systems
.....................................................................................................................................................................................48Reporting on the Aggregate Space Utilization
.....................................................................................................................................................................................50Inventorying Unused LUNs
.....................................................................................................................................................................................51Verifying the Activity Generated by a LUN
.....................................................................................................................................................................................52Setting Thresholds
.....................................................................................................................................................................................55Reporting
.....................................................................................................................................................................................56Enabling the Debug Mode
.....................................................................................................................................................................................56Disabling Volumes and LUNs Monitoring
.....................................................................................................................................................................................58Troubleshooting Connectivity Issues
.....................................................................................................................................................................................60Aggregate
.....................................................................................................................................................................................62CIFS
.....................................................................................................................................................................................63Cluster
.....................................................................................................................................................................................65Controller
.....................................................................................................................................................................................68Disk
.....................................................................................................................................................................................70Ethernet Port
.....................................................................................................................................................................................72Fan
.....................................................................................................................................................................................73FC Port
.....................................................................................................................................................................................75Filer
.....................................................................................................................................................................................77Host Adapter
.....................................................................................................................................................................................79iSCSI

5
BM
C P
erfo
rman
ce M
anag
er
Exp
ress
fo
r N
etA
pp F
ilers
Ver
sion
4.1
.01
.....................................................................................................................................................................................80iSCSI Port
.....................................................................................................................................................................................81LUN
.....................................................................................................................................................................................83NDMP
.....................................................................................................................................................................................84NFS
.....................................................................................................................................................................................85Node
.....................................................................................................................................................................................88NVRAM
.....................................................................................................................................................................................89Plex
.....................................................................................................................................................................................90Power Supply
.....................................................................................................................................................................................91Processor
.....................................................................................................................................................................................92Qtree
.....................................................................................................................................................................................93Shelf
.....................................................................................................................................................................................94SIS Volume
.....................................................................................................................................................................................95Snapmirror
.....................................................................................................................................................................................96Snapvault
.....................................................................................................................................................................................97Temperature
.....................................................................................................................................................................................98vFiler
.....................................................................................................................................................................................100Voltage
.....................................................................................................................................................................................101Volume
.....................................................................................................................................................................................107vServer
.....................................................................................................................................................................................108Special Note on Application Collection Status

Release Notes for v4.1.01

7
BM
C P
erfo
rman
ce M
anag
er
Exp
ress
fo
r N
etA
pp F
ilers
Ver
sion
4.1
.01
What's New
The Port Count parameter now indicates the number of physical ports.
Changes and Improvements The display name for the containing aggregate has been improved to be more meaningful.
The format of the Initiator Groups parameter has been changed to be more meaningful. Itnow follows this format: Hostname: <hostname> WWN: <WWN>.
Fixed Issues
Ethernet ports were missing when using Data ONTAP 8.2.1 in cluster mode.

Overview

9
BM
C P
erfo
rman
ce M
anag
er
Exp
ress
fo
r N
etA
pp F
ilers
Ver
sion
4.1
.01
BMC Performance Manager Express for NetApp Filers is an agent-less Performance Manager forthe BMC Portal environment which monitors all your NetApp storage assets within a centralizedmanagement console. All the information concerning disk arrays, aggregates, controllers, LUNs,and ports are directly displayed in your BMC Framework.
By monitoring all your NetApp storage devices within a centralized management console, youcan respond quickly to performance problems, easily determine capacity requirements,effectively plan for network expansions or also keep an eye on the critical hardware componentsof NetApp Filers.
BMC Performance Manager Express for NetApp Filers discovers and monitors all the softwareaspects of the array (overall capacity, spare disks, data traffic, oversubscription, etc.), as well asthe hardware aspects of the NetApp disk array (disks, fans, temperature sensors, power supplies,etc.) within the Portal framework through a single solution.
The complete storage monitoring solution architecture is composed of the elementsrepresented in the illustration below:
BMC Performance Manager Express for NetApp Filers – Architecture
Being a Performance Manager specifically designed for BMC Portal, BMC Performance ManagerExpress for NetApp Filers uses the Portal’s web-based interface and features for installing,managing and monitoring your infrastructure.

10
BM
C P
erfo
rman
ce M
anag
er
Exp
ress
fo
r N
etA
pp F
ilers
Ver
sion
4.1
.01
For convenience, the product may be called NetApp Filers Express within the product documentation andonline help.

Supported Platforms

12
BM
C P
erfo
rman
ce M
anag
er
Exp
ress
fo
r N
etA
pp F
ilers
Ver
sion
4.1
.01
BMC Performance Manager Express for NetApp Filers supports:
In 7-mode (traditional mode): All NetApp storage filers with Data ONTAP 7.3.1 or higher.
In C-mode (cluster mode): All NetApp storage filers with Data ONTAP 8.1 or higher.
BMC Proactive Performance Management and BMC ProactiveNet Central MonitoringAdministration 9.0.00 and higher.
Filers from other vendors that have an OEM agreement with NetApp are also supported.

Requirements

14
BM
C P
erfo
rman
ce M
anag
er
Exp
ress
fo
r N
etA
pp F
ilers
Ver
sion
4.1
.01
The computer on which you install BMC Performance Manager Express for NetApp Filers shouldalready have:
1. BMC Performance Manager Portal version 2.5.00
2. Access to an RSM i.e. Remote Service Monitor
The RSM program must be installed on a Windows platform. This can either be same as the serverwhere the Portal is installed or, any other Windows computer on the network.
Once you install BMC Performance Manager Express for NetApp Filers, you can add as manyelements as you require in your monitoring environment.
User Privileges
7-Mode:
To monitor a NetApp storage system in 7-mode, you need to create a user with read-only accessto the DATA ONTAP API. Please copy-paste the following command lines into the NetApp CLI:
1. Create a new role to access the Data ONTAP API used by BMC Performance Manager Expressfor NetApp Filers:
> useradmin role add newrole -a login-http-admin,api-license-list-info,api-system-
get-version,api-perf-object-get-instances,api-aggr-list-info,api-volume-list-
info,api-lun-list-info,api-lun-map-list-info,api-qtree-list,api-system-get-info,api-
storage-adapter-get-adapter-list,api-storage-adapter-get-adapter-info,api-net-config-
get-active,api-fcp-adapter-list-info,api-fcp-adapter-stats-list-info,api-cifs-list-
config,api-iscsi-service-status,api-iscsi-adapter-list-info,api-nfs-status,api-sis-
status,api-snapmirror-get-status,api-snapvault-primary-destinations-list-info,api-
storage-shelf-list-info,api-disk-list-info,api-storage-shelf-environment-list-
info,api-vfiler-list-info,api-
cifs-status,api-vfiler-get-status,api-snapvault-primary-get-relationship-status
2. Create a new group using the previously created role:> useradmin group add newgroup -c "adding group for newuser" -r newrole
3. Create a new user in the previously created group:> useradmin user add newuser -g newgroup
Cluster-Mode:
To monitor a NetApp storage system in Cluster mode, you need to create a user with read-onlyaccess to the DATA ONTAP API. Please copy-paste the following command lines into the NetAppCLI:
>::security >login create -username newuser -application http -authmethod password -role readonly
>::security >login create -username newuser -application ontapi -authmethod password -role readonly

The Product

16
BM
C P
erfo
rman
ce M
anag
er
Exp
ress
fo
r N
etA
pp F
ilers
Ver
sion
4.1
.01
The BMC Performance Manager Express NetApp Filers package
The file required for the installation of BMC Performance Manager Express NetApp Filers is:
BPM-Express-for-NetApp-Filers-<version>.par
The above-mentioned file is valid for installation on Windows, UNIX and Linux.
Please contact your BMC sales representative to purchase the license to use product. The productpackage is to be downloaded from the Sentry Software website on the BMC PerformanceManager Express for NetApp Filers product page. A trial version is available for free from theSentry Software website.
How it Works
Once BMC Performance Manager Express for NetApp Filers is installed in your Portalenvironment:
1. To start up the monitoring, add its corresponding application class to an element or elementprofile. The BMC Performance Manager Express for NetApp Filers application classes arelisted under the Storage category.
2. Fill in Properties and Credentials information and click Next.
3. Set the threshold parameters.
4. Click Finish to validate.
Portal Level
BMC Performance Manager Express for NetApp Filers is an agent-less solution designedspecifically for BMC Portal. Therefore, it uses/shares/offers all the procedures, features andcapabilities offered in the Portal, like Element Profile, Shared credentials, Adding/Editing/Deleting classes etc.
NetApp Filers Express Level
As described above, you need to enter certain information:
Collection interval
HTTP/HTTPS configuration details depending on the device mode.

Installation Guide

18
BM
C P
erfo
rman
ce M
anag
er
Exp
ress
fo
r N
etA
pp F
ilers
Ver
sion
4.1
.01
This chapter explains how to install and run BMC Performance Manager Express for NetAppFilers.
As BMC Performance Manager Express for NetApp Filers is a performance manager specificallydesigned for the BMC© Portal environment, it uses the Portal’s web-based interface and featuresfor installing, managing and monitoring your Information Technology (IT) infrastructure. The fullintegration with BMC® Portal provides a single customizable entry point for data from multiplesources and a single view that enables you to monitor the health and performance of yourinfrastructure.
Installing BMC Performance Managerfor NetApp Filers
Owing to structural changes, an automatic migration from version 3.x.xx of BMC Performance ManagerExpress for NetApp Filers is not possible. Users of version 3.x.xx should remove the PM from allelements and completely uninstall the PM before uploading and installing v4.1.01.
Uploading BMC Performance Manager Express for NetApp Filers toBMC Portal1. Place the BPM-Express-for-NetApp-Filers-<version>.par file in a known location on your file
system. Log in to the Portal with super-administrator credentials.

19 Installing BMC Performance Manager Express forNetApp Filers
BM
C P
erfo
rman
ce M
anag
er
Exp
ress
fo
r N
etA
pp F
ilers
Ver
sion
4.1
.01
2. Click on Portal, then under Tasks click Performance Managers.
3. Click Upload and then click Browse to open a file selection dialog box.
4. Select BMC PM Express for NetApp Filers by Sentry Software <version> and click Open.
5. Click Upload. The Portal uploads the PAR file to the database, and BPM Express NetApp Filersnow appears as BMC Performance Manager Express for NetApp Filers by Sentry Software inthe list of Performance Managers.
6. The word Published next to BMC Performance Manager Express for NetApp Filers in thePerformance Manager list indicates that the product is successfully installed. You are nowready to begin using BMC Performance Manager Express for NetApp Filers.
7. In the Portal Configure tab, verify each monitored filers' properties and thresholds values tomake sure all the necessary settings are properly configured.

20Adding BMC Performance Manager Express forNetApp Filers to an Element Profile
BM
C P
erfo
rman
ce M
anag
er
Exp
ress
fo
r N
etA
pp F
ilers
Ver
sion
4.1
.01
Adding BMC Performance ManagerExpress for NetApp Filers to anElement Profile1. Log in to the Portal with normal user credentials
2. Click Configure > Element Profiles. The Available Profiles page appears. Select the Profile to
which you wish to add the Storage class, and then click Edit.
Selecting a Profile
21 Adding BMC Performance Manager Express forNetApp Filers to an Element Profile
BM
C P
erfo
rman
ce M
anag
er
Exp
ress
fo
r N
etA
pp F
ilers
Ver
sion
4.1
.01
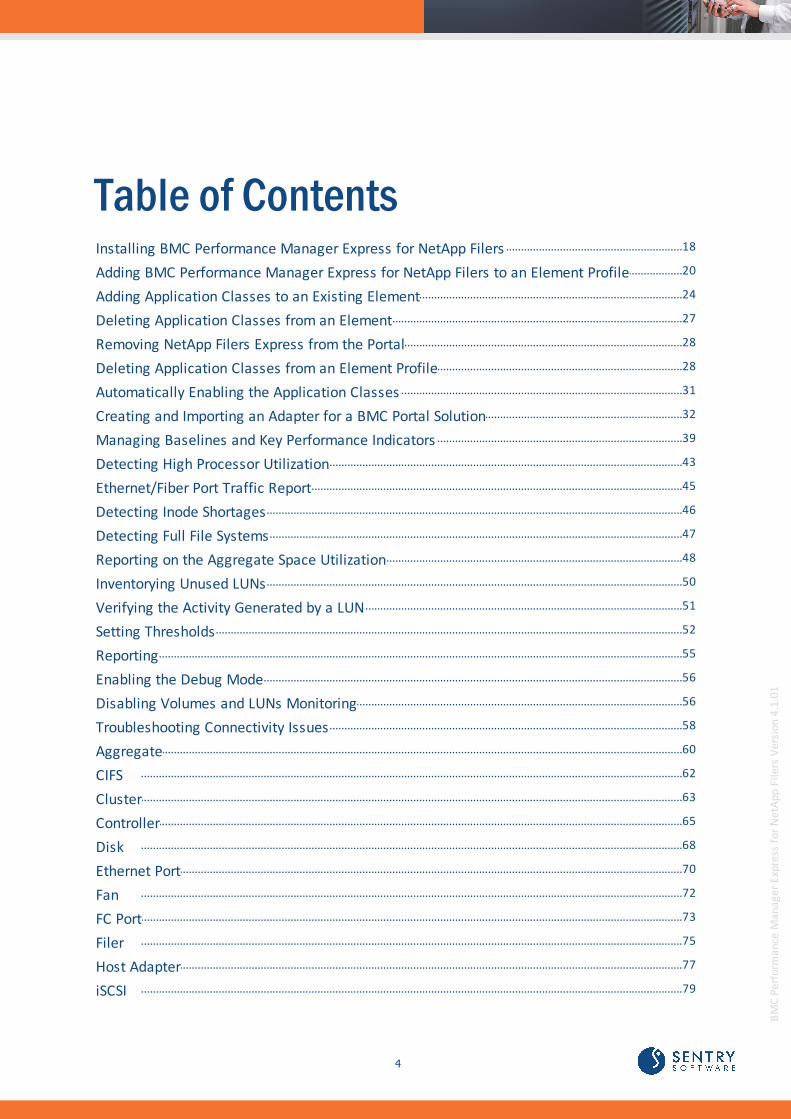
3. The selected Element Profile’s Properties page appears. Go to Application Classes > Add.
Adding Application Classes
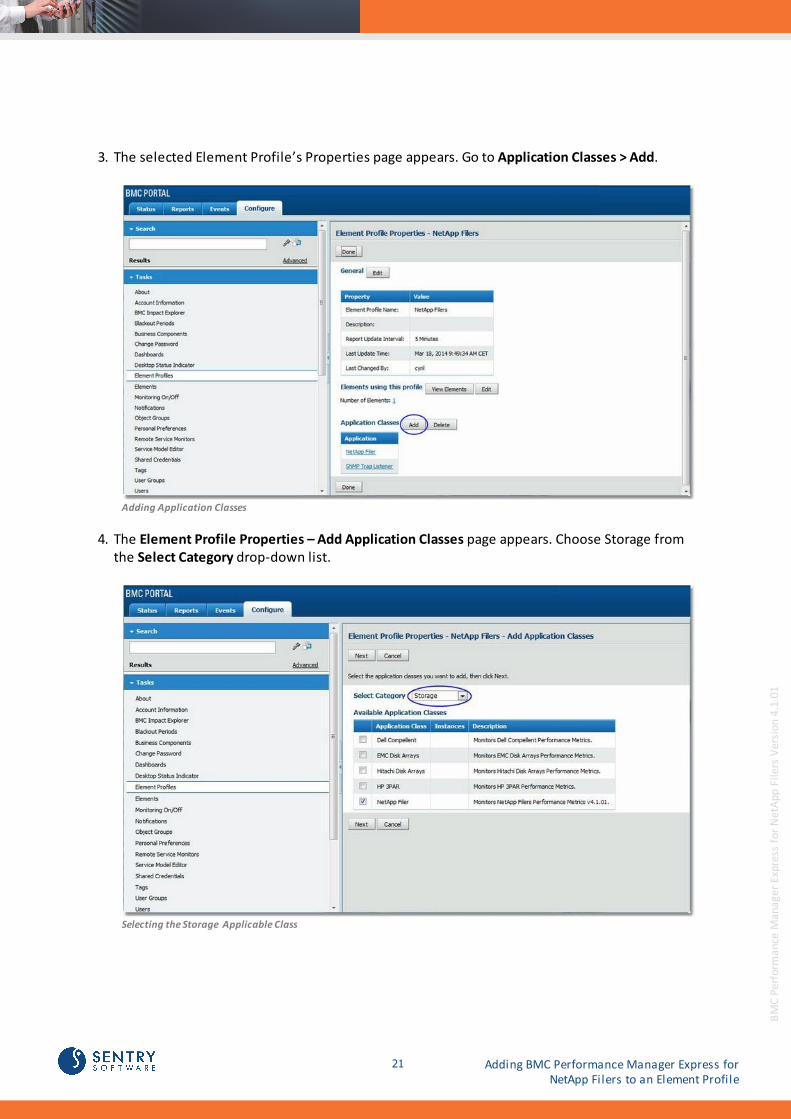
4. The Element Profile Properties – Add Application Classes page appears. Choose Storage fromthe Select Category drop-down list.
Selecting the Storage Applicable Class

22Adding BMC Performance Manager Express forNetApp Filers to an Element Profile
BM
C P
erfo
rman
ce M
anag
er
Exp
ress
fo
r N
etA
pp F
ilers
Ver
sion
4.1
.01
5. When selecting the category Storage from the drop-down list, all the different NetAppapplication classes will be displayed.
6. Select the application class applicable to your system and click Next.
7. On the Properties and Credentials page, enter the information required for monitoringNetApp Filers:
Information required to monitor Windows systems
Input Properties Description
Collection interval Select the collection interval from the drop-down list. Default: 5. Unit:Minutes.
Credentials Enter the username and password used to connect to the NetApp device.
Hostname Enter the hostname or IP address of the NetApp device to be monitored.
Partner Hostname Enter the hostname or IP address of the partner NetApp device to bemonitored.
Port Enter the port number to connect to the NetApp device (default: 443).
Transport Protocol Select between HTTP or HTTPS transport protocols that will be used forconnecting to the NetApp Device.
Mode Select the NetApp Device Mode. (7-Mode or Cluster-Mode)
Disable Volumes Monitoring Select "Yes" to disable the volume class.
Disable LUNs Monitoring Select "Yes" to disable the LUN class.
Debug Mode "Yes" enables the debug mode while "No" disables it. The debug output isstored in a file on the RSM server. The debug file is located at "%RSM_HOME%\RSM(xx)\SEN_NetApp\sen_netapp_debug_hostname.log".
Missing Device Detection By default, the missing device(s) will be detected and monitored. Settingthe option to No will deactivate the detection and the monitoring of themissing device(s).

23 Adding BMC Performance Manager Express forNetApp Filers to an Element Profile
BM
C P
erfo
rman
ce M
anag
er
Exp
ress
fo
r N
etA
pp F
ilers
Ver
sion
4.1
.01
8. After entering the element properties and credentials, you arrive at the final step for addingthe BMC Performance Manager Express for NetApp Filers application class: Thresholds,Properties and Credentials.
9. Thresholds are automatically set by BMC Performance Manager Express for NetApp Filers. Itis recommended to keep the default thresholds (or see the Thresholds section). Click Finish.
10. Click Done to save the changes made. The BMC Performance Manager Express for NetAppFilers application class is now added to all the elements in the selected Element Profile.
Element Profile Properties

24Adding Application Classes to an Existing Element
BM
C P
erfo
rman
ce M
anag
er
Exp
ress
fo
r N
etA
pp F
ilers
Ver
sion
4.1
.01
Adding Application Classes to anExisting Element1. In the Configure tab: Click the Element to which you wish to add the NetApp Filers solution
and the Element Properties page appears. Scroll down to Application Classes > Add. Makesure that the element's platform is defined as <Storage>.
Adding an Application Class
2. On the Properties – <Element> – Add Application Classes page > Select Category > Storage.
3. In the available Application Class list, select the application class applicable to the elementand click Next.
Application Class Properties

25 Adding Application Classes to an Existing Element
BM
C P
erfo
rman
ce M
anag
er
Exp
ress
fo
r N
etA
pp F
ilers
Ver
sion
4.1
.01
4. The Properties and Credentials page appears asking for the information required formonitoring NetApp Filers. Enter the required information.
5. Thresholds are automatically set by BMC Performance Manager Express for NetApp Filers. Itis recommended that you leave the default thresholds as they are. Click Finish. Details onhow to modify thresholds are given in the User Guide.
You can now return to the Status tab to view the monitoring of the element by BMC PerformanceManager Express for NetApp Filers.
Un-installing BPM ExpressNetApp Filers

27
BM
C P
erfo
rman
ce M
anag
er
Exp
ress
fo
r N
etA
pp F
ilers
Ver
sion
4.1
.01
The procedure is the same as for any other Performance Manager on the Portal:
1. Delete all BMC Performance Manager Express for NetApp Filers application classes from allelements
2. Remove BMC Performance Manager Express for NetApp Filers from the PerformanceManager list of the Portal.
The BMC Performance Manager Express for NetApp Filers cannot be un-installed unless all itsapplication classes are removed from each element.
Deleting Application Classes from anElementAn application class can be deleted from an element in two ways, just as it could be addedthrough two routes: through Elements or through Element Profile.
If the element was created directly through Elements:
1. Click in the Configure tab > Properties > click on the element.
2. In the Application classes section > click Delete.
3. The Available Application Classes for Removal page appears.
4. Select the NetApp Filers Express application classes and click Next. It is possible to selectmore than one at a time.
5. A Changes Saved message appears, confirming that the deletion has been done.
Repeat this procedure on all elements to which NetApp Filers Express application classes are added.

28Removing NetApp Filers Express from the Portal
BM
C P
erfo
rman
ce M
anag
er
Exp
ress
fo
r N
etA
pp F
ilers
Ver
sion
4.1
.01
Removing NetApp Filers Express fromthe PortalTo un-install or remove NetApp Filers Express from the Portal, you follow the same steps as forany PM on the Portal.
1. Log in with super-administrator credentials and click on Portal > Performance Managers.
2. Ensure the Performance Managers list shows “0” Elements next to the name: BMC PMExpress for NetApp Filers by Sentry Software.
3. Select BMC PM Express for NetApp Filers by Sentry Software and click Delete.
4. Confirm deletion of the selected Performance Manager by clicking on Delete.
5. A message displaying successful deletion appears.
The BMC PM Express for NetApp Filers by Sentry Software is then completely removed from yourBMC Portal environment.
Deleting Application Classes from anElement ProfileAn application class can be deleted from an element in two ways, just as it could be addedthrough two routes: through Elements or through Element Profile.
If the Element Profile route was used, click on Configure tab > Element Profile > select Profile >Edit.
1. Once in the Element Profile Properties page, scroll down to the Application Classes sectionand click on Delete.
2. On the Available Application Classes for Removal page, select all the BMC PerformanceManager Express for NetApp Filers classes (prefix Studio) and click Next.
3. Confirm the deletion of the selected classes by clicking on Delete.
4. A Changes Saved message pops up confirming the deletion of the application classes fromthis element profile.
The selected application classes will be deleted from all elements that were created using this elementprof ile.

Integrating with BPPM

30
BM
C P
erfo
rman
ce M
anag
er
Exp
ress
fo
r N
etA
pp F
ilers
Ver
sion
4.1
.01
Overview
To integrate a Performance Manager into BMC ProactiveNet, you need to first install andconfigure the solution in BMC Portal, automatically enable the application classes and create aspecific adapter. An adapter for BMC Portal facilitates pulling of performance data from existingBMC Portal solutions into BMC ProactiveNet. Using an Adapter, you can import BMC Portalapplication classes (provided in a Performance Manager – PM) into BMC ProactiveNet. TheAdapter periodically synchronizes the performance data collected by these application classesinto BMC ProactiveNet.
Adapter for BMC PATROL Architecture

31 Automatically Enabling the Application Classes
BM
C P
erfo
rman
ce M
anag
er
Exp
ress
fo
r N
etA
pp F
ilers
Ver
sion
4.1
.01
Automatically Enabling theApplication ClassesTo automatically enable application classes:
1. Uncompress the BPM-Express-for-NetApp-Filers-<version>-PM2BPPM.zip file
2. Copy all the BPM_SENTRYSOFTWARE_NETAPP_SOLUTIONSEN_NAP_MAIN xml files into:<BPPM install dir>\ProactiveNet\pw\pronto\systdata\adapter-defaults
3. Restart the BMC ProactiveNet server
You will then have to create and import an adapter for a BMC Portal PM

32Creating and Importing an Adapter for a BMCPortal Solution
BM
C P
erfo
rman
ce M
anag
er
Exp
ress
fo
r N
etA
pp F
ilers
Ver
sion
4.1
.01
Creating and Importing an Adapter fora BMC Portal Solution
Creating an Adapter for a BMC Portal Solution
1. Open the BMC ProactiveNet Administration Console. The BMC ProactiveNet AdministrationConsole is displayed as shown in the following figure:
Accessing the Administration tab in the Administration Console
33 Creating and Importing an Adapter for a BMCPortal Solution
BM
C P
erfo
rman
ce M
anag
er
Exp
ress
fo
r N
etA
pp F
ilers
Ver
sion
4.1
.01
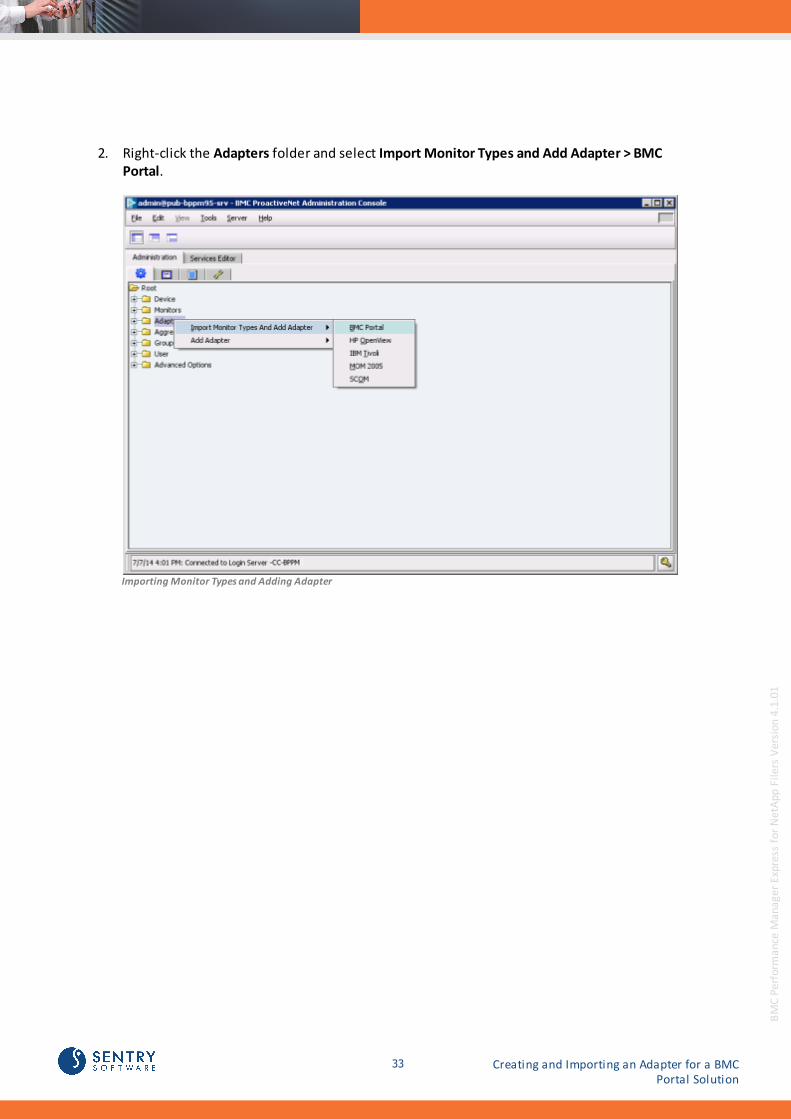
2. Right-click the Adapters folder and select Import Monitor Types and Add Adapter > BMCPortal.
Importing Monitor Types and Adding Adapter

34Creating and Importing an Adapter for a BMCPortal Solution
BM
C P
erfo
rman
ce M
anag
er
Exp
ress
fo
r N
etA
pp F
ilers
Ver
sion
4.1
.01
3. In the Configuration tab, enter the required information:
Setting the connection parameters
In the Instance Name field, enter a name for this instance of the Adapter that will performthe integration of the ‘targeted PM’ into BMC ProactiveNet.
Select the Agent where this instance of the Adapter will be executed
Enter the required information to connect to BMC Portal: BMC Portal Host Name or IPaddress, Port, BMC Portal User Name and Password
To successfully integrate the PM with BMC Proactivenet, the BMC Portal User Account specified musthave at least been used once to log in to BMC Portal and have the NetApp Filers Application Class addedto an existing element.
Enter the required information to connect to BMC Portal Datastore: BMC Portal Datastore
35 Creating and Importing an Adapter for a BMCPortal Solution
BM
C P
erfo
rman
ce M
anag
er
Exp
ress
fo
r N
etA
pp F
ilers
Ver
sion
4.1
.01
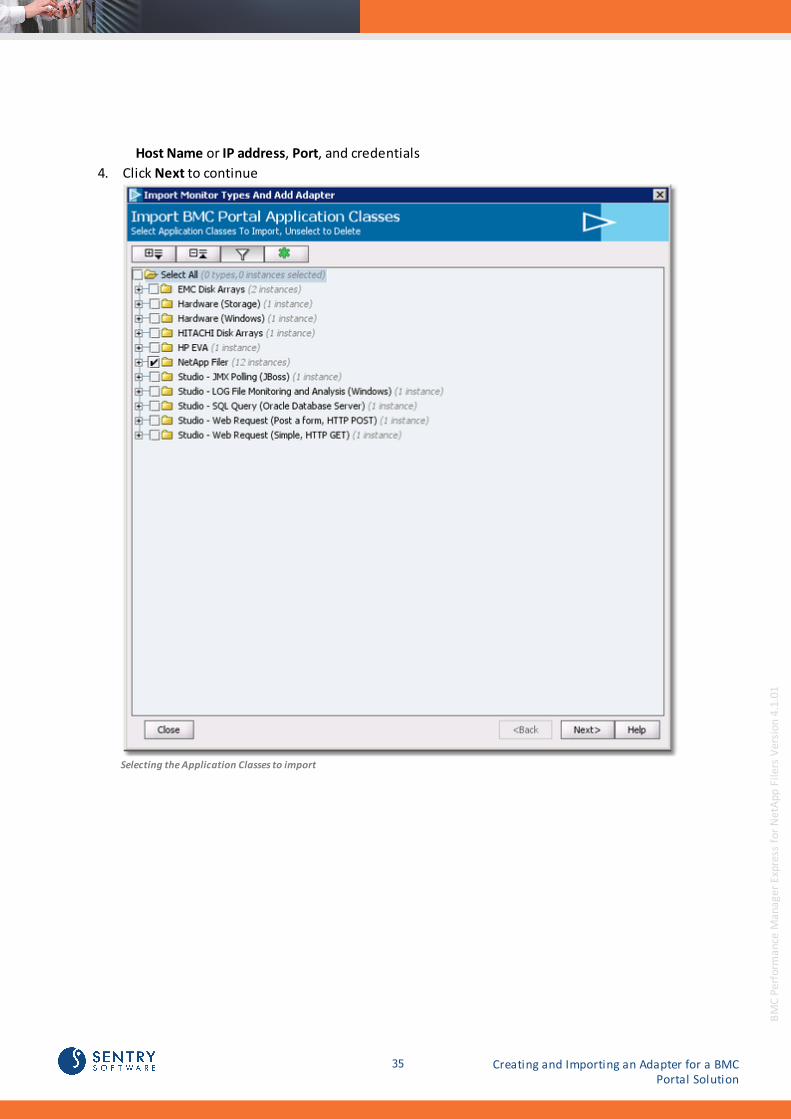
Host Name or IP address, Port, and credentials
4. Click Next to continue
Selecting the Application Classes to import

36Creating and Importing an Adapter for a BMCPortal Solution
BM
C P
erfo
rman
ce M
anag
er
Exp
ress
fo
r N
etA
pp F
ilers
Ver
sion
4.1
.01
5. Select the application class to import and click Next
6. Set the Filter details if needed.
Setting filter details

37 Creating and Importing an Adapter for a BMCPortal Solution
BM
C P
erfo
rman
ce M
anag
er
Exp
ress
fo
r N
etA
pp F
ilers
Ver
sion
4.1
.01
7. Click Next to Continue.
8. Set the Auto-sync poll scheduling, if needed.
Scheduling Auto-sync polls

38Creating and Importing an Adapter for a BMCPortal Solution
BM
C P
erfo
rman
ce M
anag
er
Exp
ress
fo
r N
etA
pp F
ilers
Ver
sion
4.1
.01
9. Click Next to continue. The system displays a summary of your settings, click Finish toconfirm. The Adapter has been added to the Adapters folder of the Administration Console.
Adapter added to the Adapters folder
10. To see the class instances that have been imported by the Adapter, expand the Adaptersfolder, right-click the Adapter and select Details.
We strongly recommend that you create a specific adapter for each PM you need to integrate into BMCProactiveNet to enable the update of a single PM independently.
Once created and imported, the Adapter will be displayed in the Devices folder of the BMCProactiveNet Operations Console.

39 Creating and Importing an Adapter for a BMCPortal Solution
BM
C P
erfo
rman
ce M
anag
er
Exp
ress
fo
r N
etA
pp F
ilers
Ver
sion
4.1
.01
Managing Baselines and KeyPerformance IndicatorsIn order to facilitate the detection of abnormalities on your monitored environment, BMCProactiveNet calculates baselines per parameter (metrics or attributes) based on valuescollected over a specified period of time to determine a normal operating range. When thecollected values for these parameters are out of range, an alert is triggered.
Some parameters are identified by default as Key Performance Indicators and thereforeautomatically included in the base lining calculation.
Managing baselines
The baseline is the expected normal operating range for a metric or attribute of a monitor.
The baseline is calculated by collecting the values for a monitor’s attributes and metrics over aspecified time period and establishing a low baseline value (consisting of the 10th percentile ofall the values for a given time period) and a high baseline value (consisting of the 90th percentileof all the values for a given time period), taking a weighted average of these values over time. Ahigher weight is given to the latest data being factored into the baseline average. The accuracy ofthe baseline improves over time.
Requirements for baseline generation
For baselines to be generated for an attribute, that abnormality threshold means that thethreshold exists and is not suppressed. Additionally, if the Key Performance Indicator (KPI) mode is active, only those attributes thathave an active abnormality threshold and are also KPI attributes will have baselines generatedfor them.
Absolute thresholds (with "outside baseline") or signature thresholds do not satisfy these requirements.
Managing Key Performance Indicators
The KPI attribute of a parameter can be activated or deactivated manually through the BMCProactiveNet Administration Console. In this PM, some parameters or attributes have beendesignated as important indicators of performance (KPIs). We do not recommend that thesedefault settings are modified.

40Managing Baselines and Key PerformanceIndicators
BM
C P
erfo
rman
ce M
anag
er
Exp
ress
fo
r N
etA
pp F
ilers
Ver
sion
4.1
.01
However, advanced users may activate or deactivate KPIs from the BMC ProactiveNetAdministration Console.
To add or remove Key Performance Indicator (KPI) attributes for a monitor type
1. In the Administration Console, from the menu bar, choose Tools > KPI Administration. TheKPI Administration dialog box is displayed.
2. From the Monitor Type list, choose the monitor type for which you want to add or removeKPI attributes. A list of attributes for the selected monitor type is displayed.
3. In the KPI column for the attributes that you want to add or remove as Key PerformanceIndicators:
select the KPI check box to add the corresponding attribute as a KPI
deselect the KPI check box to remove the corresponding attribute from the KPIs for thatmonitor type
For complete and detailed information on this procedure, please refer to the BMC ProactiveNetdocumentation available f rom BMC Web site.
Parameters for which the system by default calculates baselines as well as parametersconsidered as KPIs are respectively identified by the following icons:
Baselining
KPI

User Guide

42
BM
C P
erfo
rman
ce M
anag
er
Exp
ress
fo
r N
etA
pp F
ilers
Ver
sion
4.1
.01
BMC Performance Manager Express for NetApp Filers monitors all of the performance metricsand usage statistics of your NetApp filers (filesystems usage, processor utilization, per protocoltraffic, etc). BMC Performance Manager Express for NetApp Filers also enables BMC Portal tomonitor computer hardware covering all the physical aspect of the NetApp filers (temperatures,CPU, power supplies, etc). It continuously monitors the activity of each filer and is also able tobuild reports on past utilization statistics.
This chapter explains how to use each monitoring tool i.e. a separate application class within the BMC PM Express for NetApp Filers by Sentry Software solution.
BMC Performance Manager Express for NetApp Filers by Sentry Software is a Performance Managerspecifically designed for BMC Portal; consequently, it uses the same common features and procedures ofBMC® Portal. This document assumes that the user knows how to use the Portal and therefore explainsprocedures only related to BMC PM Express for NetApp Filers by Sentry Software, and not on how toadd Elements, Element Profiles etc. Please refer to the BMC Portal documentation for details on how touse the Portal.
43
BM
C P
erfo
rman
ce M
anag
er
Exp
ress
fo
r N
etA
pp F
ilers
Ver
sion
4.1
.01
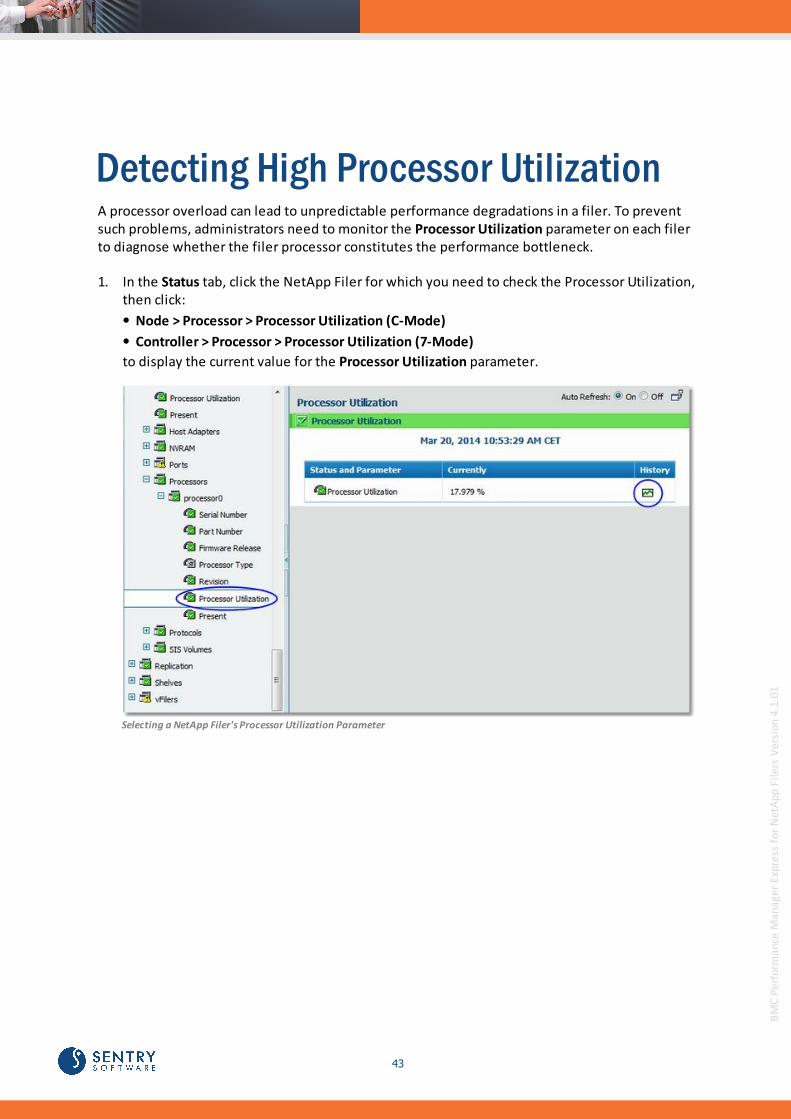
Detecting High Processor UtilizationA processor overload can lead to unpredictable performance degradations in a filer. To preventsuch problems, administrators need to monitor the Processor Utilization parameter on each filerto diagnose whether the filer processor constitutes the performance bottleneck.
1. In the Status tab, click the NetApp Filer for which you need to check the Processor Utilization,then click:
Node > Processor > Processor Utilization (C-Mode)
Controller > Processor > Processor Utilization (7-Mode)
to display the current value for the Processor Utilization parameter.
Selecting a NetApp Filer's Processor Utilization Parameter

44Detecting High Processor Utilization
BM
C P
erfo
rman
ce M
anag
er
Exp
ress
fo
r N
etA
pp F
ilers
Ver
sion
4.1
.01
2. Click the History icon to automatically display a graph that shows the Processor Utilizationvalues collected for a selected parameter during the previous six hours. You can customizethe chart and table to show parameter history for different time periods.
Viewing a NetApp Filer's Processor Utilization as a graph
A processor utilization over 80% means that this processor is overloaded and that it constitutes abottleneck for the filer.
By default, the Processor Utilization parameter will display a warning when reaching 80% and analert when reaching 90 %. You can easily modify these thresholds in the Thresholds page.

45 Detecting High Processor Utilization
BM
C P
erfo
rman
ce M
anag
er
Exp
ress
fo
r N
etA
pp F
ilers
Ver
sion
4.1
.01
Ethernet/Fiber Port Traffic ReportBMC Performance Manager Express for NetApp Filers enables you to generate a report showingusage statistics returned by a specific Ethernet/fiber port. The report shows the total number ofreceived and transmitted bytes for the selected port. It can easily be customized to show thedata that administrators can use to optimize network traffic.
To generate an Ethernet/Fiber Port Traffic Report!:
1. Select the Reports tab
2. Click on the discovered Ethernet/FC instance
3. Select the data you wish to generate a report for: Received or Sent bytes traffic
4. Select the period that you wish the report to cover: number of days or hours
5. Select the interval to apply to the report data: hourly or daily
6. Click Update.
Report – Ethernet/Fiber Port Traffic Report

46Detecting Inode Shortages
BM
C P
erfo
rman
ce M
anag
er
Exp
ress
fo
r N
etA
pp F
ilers
Ver
sion
4.1
.01
Detecting Inode ShortagesOn rare occasions file systems may run out of free inodes. While rare, this can have catastrophicconsequences for the file system's applications and users. To prevent this situation, you canmonitor the Used Inodes Percentage parameter of the Volume class.
1. In Portal, expand the Volumes instances. These instances are available under:
Aggregate > Volume (C-Mode)
Cluster > vServer > Volume (C-Mode)
Filer > Volume (7-Mode)
The current percentage of used inodes for each instance is automatically displayed.
Used Inodes Percentage
2. Click the History icon of the Volume instances to display history charts that shows the datavalues, for these instances, collected for a selected parameter during the previous six hours.You can customize the chart and table to show parameter history for different time periods.
47 Detecting Full File Systems
BM
C P
erfo
rman
ce M
anag
er
Exp
ress
fo
r N
etA
pp F
ilers
Ver
sion
4.1
.01
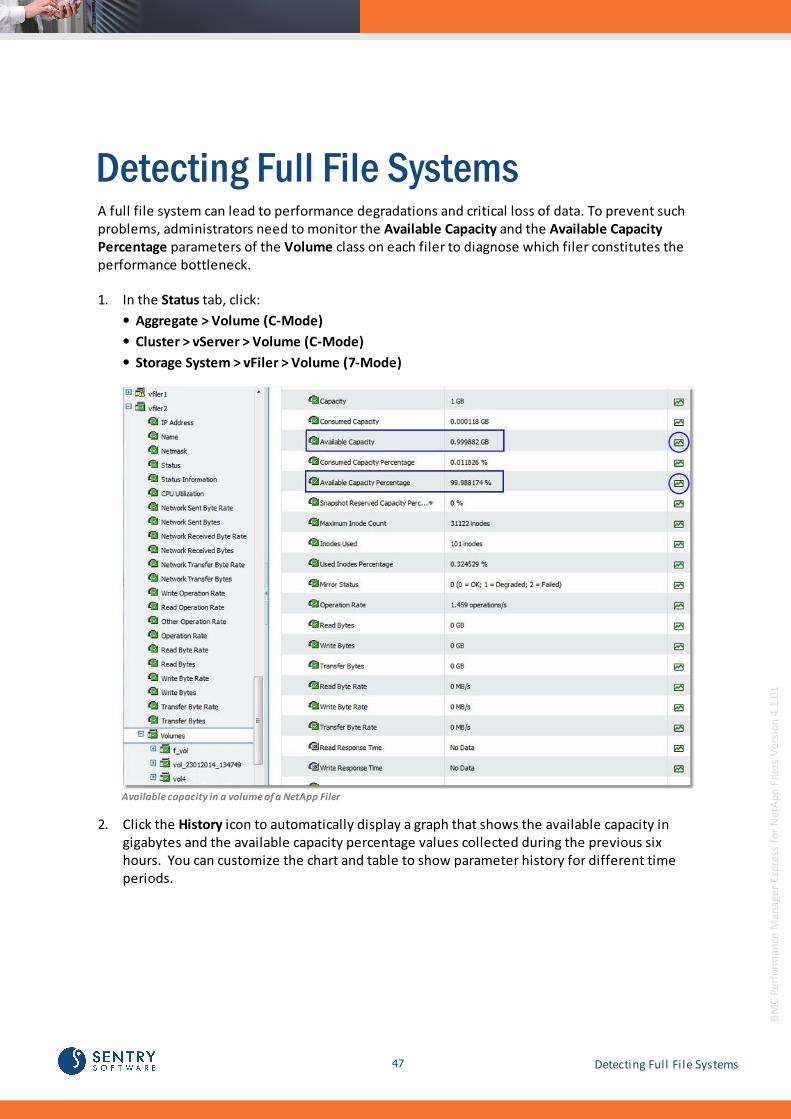
Detecting Full File SystemsA full file system can lead to performance degradations and critical loss of data. To prevent suchproblems, administrators need to monitor the Available Capacity and the Available CapacityPercentage parameters of the Volume class on each filer to diagnose which filer constitutes theperformance bottleneck.
1. In the Status tab, click:
Aggregate > Volume (C-Mode)
Cluster > vServer > Volume (C-Mode)
Storage System > vFiler > Volume (7-Mode)
Available capacity in a volume of a NetApp Filer
2. Click the History icon to automatically display a graph that shows the available capacity ingigabytes and the available capacity percentage values collected during the previous sixhours. You can customize the chart and table to show parameter history for different timeperiods.

48Reporting on the Aggregate Space Utilization
BM
C P
erfo
rman
ce M
anag
er
Exp
ress
fo
r N
etA
pp F
ilers
Ver
sion
4.1
.01
Reporting on the Aggregate SpaceUtilizationAggregates are the equivalent of storage pools, where all of the volumes are created. Runningout of space in an aggregate means that administrators are no longer able to allocate disk spaceto users and servers. Additionally, if the volumes in the aggregate are thinly provisioned (spacereservation at the file level), the inability to automatically extend the capacity of a volume dueto a lack of space in the aggregate will result in applications being denied the right to write,leading to data loss and corruption.Therefore, NetApp administrators need to pay close attention to the evolution of the spaceutilization in their filers and proactively monitor it to make sure such critical situation is avoided.
1. In the Reports tab, select the group containing the NetApp Filers to display the reportsettings panel
Report Settings Panel
49 Reporting on the Aggregate Space Utilization
BM
C P
erfo
rman
ce M
anag
er
Exp
ress
fo
r N
etA
pp F
ilers
Ver
sion
4.1
.01
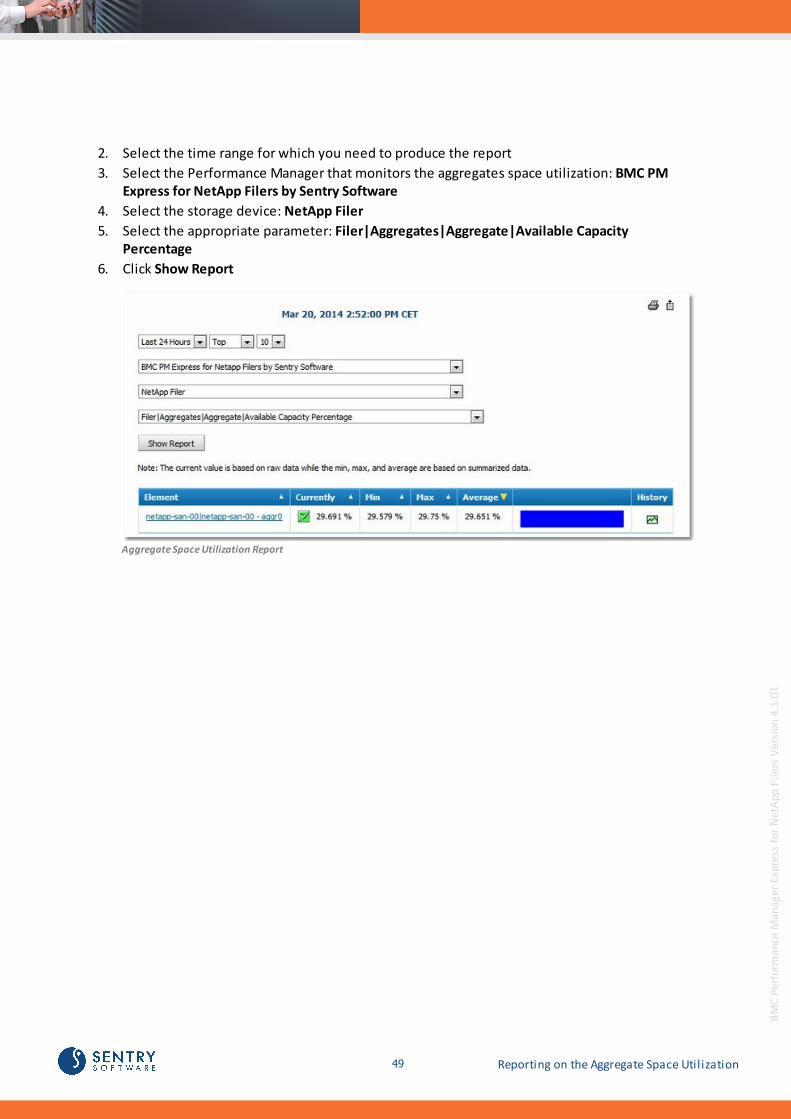
2. Select the time range for which you need to produce the report
3. Select the Performance Manager that monitors the aggregates space utilization: BMC PMExpress for NetApp Filers by Sentry Software
4. Select the storage device: NetApp Filer
5. Select the appropriate parameter: Filer|Aggregates|Aggregate|Available CapacityPercentage
6. Click Show Report
Aggregate Space Utilization Report

50Inventorying Unused LUNs
BM
C P
erfo
rman
ce M
anag
er
Exp
ress
fo
r N
etA
pp F
ilers
Ver
sion
4.1
.01
Inventorying Unused LUNsAs servers get decommissioned without the filers administrator knowing it, LUNs stay idle andunused, and the space allocated for this LUN could be reclaimed for new servers. To keep track ofthe mapping of LUNs in a filer, create a report with the Mapped parameter.
1. In the Reports tab, select the group containing the NetApp Filers to display the reportsettings panel
Report Settings Panel
2. Select the time range for which you need to produce the report
3. Select the Performance Manager that monitors the aggregates space utilization: BMC PMExpress for NetApp Filers by Sentry Software
4. Select the storage device: NetApp Filer
5. Select the appropriate parameter: Filer|Aggregates|Aggregate|LUNS|LUN|Mapped
6. Click Show Report
LUNs Mapping Report

51 Verifying the Activity Generated by a LUN
BM
C P
erfo
rman
ce M
anag
er
Exp
ress
fo
r N
etA
pp F
ilers
Ver
sion
4.1
.01
Verifying the Activity Generated by aLUNIn order to understand the high activity of a filer, it is important to identify the LUNs generatingthe heaviest I/Os. The SAN administrator can then check with the system administrator whetherthe reported activity may be considered a normal behavior.
The Read Byte Rate and Write Byte Rate parameters of the LUN instances expose the datathroughput for each LUN. Use these parameters to report on the total data traffic (per hour or perday) on each LUN in GB.
To make sure that traf f ic is displayed cumulatively per hour, select a time window of at least 12 hours in thegraph window, select at least 7 days to visualize per day cumulative data.
1. In the Status tab, click:
Cluster > vServer > LUN (C-Mode)
Storage System > Aggregate > LUN (7-Mode)
to display the Read/Write Byte Rate parameters.
Selecting a NetApp Filer's LUNs Read/Write Byte Rate Parameter

52Verifying the Activity Generated by a LUN
BM
C P
erfo
rman
ce M
anag
er
Exp
ress
fo
r N
etA
pp F
ilers
Ver
sion
4.1
.01
2. Click the History icon to automatically display a graph that shows the Read/Write Byte Ratevalues collected for a selected parameter during the previous six hours. You can customizethe chart and table to show parameter history for different time periods.
Viewing a NetApp Filer's LUNs Read/Write Byte Rate as a graph
Setting ThresholdsWhenever relevant, BMC Performance Manager Express for NetApp Filers automatically setsthresholds for parameters. If you prefer a more fault-tolerant monitoring, you can modify thethresholds of each parameter through the Configure tab > Edit Thresholds.
1. In the Configure tab, click:
Storage (<platform>) icon > Thresholds, Properties and Credentials > Edit to modify theparameter thresholds of several storage objects of an element
Instance icon > Thresholds, Properties and Credentials > Edit to modify the thresholds of aparticular instance
53 Setting Thresholds
BM
C P
erfo
rman
ce M
anag
er
Exp
ress
fo
r N
etA
pp F
ilers
Ver
sion
4.1
.01
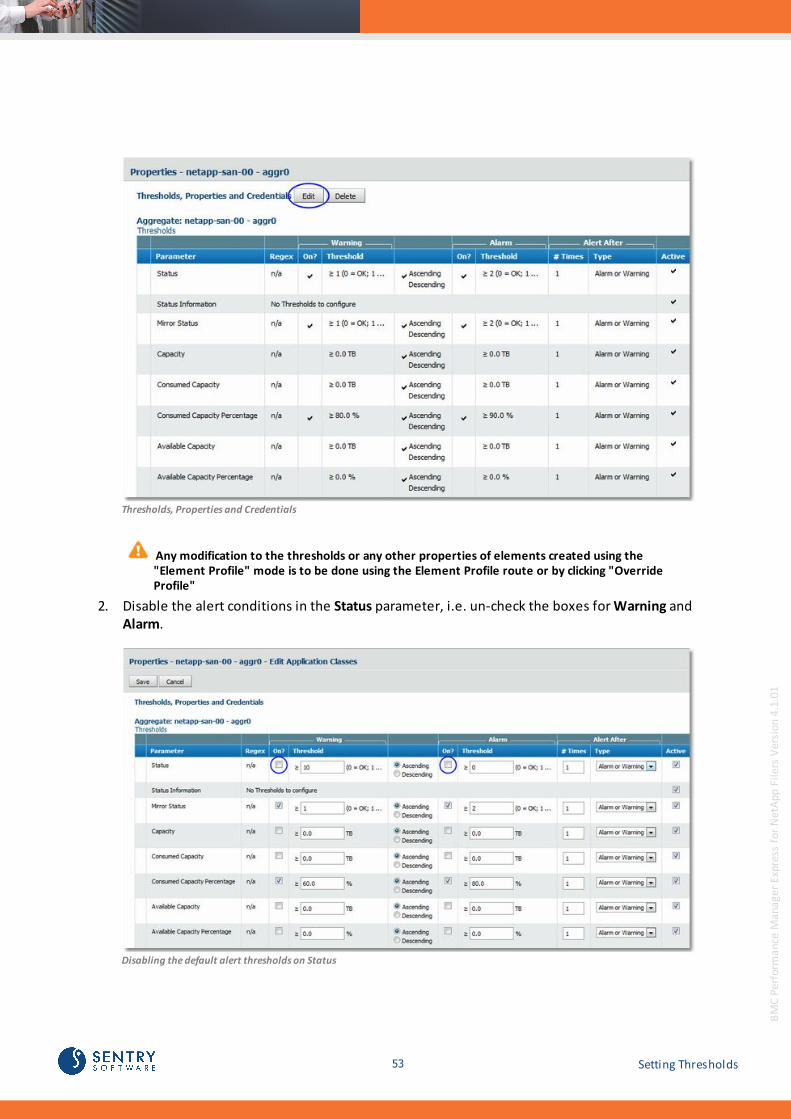
Thresholds, Properties and Credentials
Any modification to the thresholds or any other properties of elements created using the"Element Profile" mode is to be done using the Element Profile route or by clicking "OverrideProfile"
2. Disable the alert conditions in the Status parameter, i.e. un-check the boxes for Warning andAlarm.
Disabling the default alert thresholds on Status

54Setting Thresholds
BM
C P
erfo
rman
ce M
anag
er
Exp
ress
fo
r N
etA
pp F
ilers
Ver
sion
4.1
.01
Disable the alerts on the Status parameter by un-checking the boxes
3. Enable the alert conditions on the parameter by checking the boxes, and manually enter thethreshold values and then click Save.
Modifying threshold values
Manually modify the thresholds on the parameter and activate the alerts
4. The Success, changes have been saved message indicates that the modifications have beenregistered.
Alerts are displayed by the parameter whose thresholds are modified.

55 Setting Thresholds
BM
C P
erfo
rman
ce M
anag
er
Exp
ress
fo
r N
etA
pp F
ilers
Ver
sion
4.1
.01
ReportingParameters for which values are cumulative are generally only representative when consideredfor a specific period of time. Those values are therefore mostly unusable when displayed in the Status tab of the Portal, since they represent a static number of data collected since the lastpolling. The value consequently changes a lot depending on the exact polling period.
A rather more meaningful way to view cumulative-value parameters would be to create a reportto visualize these values on a hourly or daily basis in total (how many gigabytes have beentransmitted each day, for example).
1. Open the Reports tab
2. Select the NetApp Filer for which you want to obtain received and transmitted data values
3. Select 2 in the Number of Charts to Display option
4. Select for the Network Transfer Bytes (GB) parameter for the first chart and Disk TransferBytes (GB) for the second chart
5. Define the period of time for which you want to display the values
6. Click Update
Network and Disk Transfer Bytes Data Report

56Reporting
BM
C P
erfo
rman
ce M
anag
er
Exp
ress
fo
r N
etA
pp F
ilers
Ver
sion
4.1
.01
Enabling the Debug ModeBy default, BMC Performance Manager Express for NetApp Filers sends only the most criticalinformation, warning and error messages to the Application Collection Status parameter. Mostoften, this information is accurate enough to ensure that BMC Performance Manager Express forNetApp Filers is functioning properly. If you encounter an issue and wish to report it to customersupport, you will be asked to enable the Debug Mode and provide the debug output to thesupport team.
1. Open the Configure tab
2. Under Tasks, click Elements
3. Select the Element for which a debug output is required and click Edit.
4. Scroll down to Application Classes > click the Application class for which you want to enablethe debug mode > click Edit.
5. Select Yes from the drop-down Debug Mode list. By default, BPM Express NetApp Filerssends its debug output to: %RSM_HOME%\RSM(xx)\server\rsm\log\sen*_debug.log".
6. Wait for 15 minutes and then disable the debug mode by selecting No.
7. Send the debug file to the support team.
Pay attention to the f ile size -the debug output of BMC Performance Manager Express for NetApp Filerscould be very large if enabled for several days.
Disabling Volumes and LUNsMonitoringBy default, the solution discovers and monitors all volumes and LUNs in the NetApp Filers.Discovering and collecting volumes and LUNs metrics are resource-intensive actions that cancreate extra workload on the targeted system. To limit the number of instances created andtherefore reduce the system resource consumption, administrators can disable the monitoring ofall the volumes and LUNs of a system.

57 Disabling Volumes and LUNs Monitoring
BM
C P
erfo
rman
ce M
anag
er
Exp
ress
fo
r N
etA
pp F
ilers
Ver
sion
4.1
.01
To disable Volumes and LUNs monitoring1. Open the Configure tab
2. Under Tasks, click Elements
3. Select the Element for which you wish to disable volumes and/or LUNs monitoring and clickEdit.
4. Scroll down to Application Classes > click the Application class for which you want to enablethe debug mode > click Edit.
5. Click Thresholds, Properties and Credentials > Edit.
NetApp Filer - Properties

58Disabling Volumes and LUNs Monitoring
BM
C P
erfo
rman
ce M
anag
er
Exp
ress
fo
r N
etA
pp F
ilers
Ver
sion
4.1
.01
6. Select Yes from the Disable Volumes Monitoring and Disable LUNs Monitoring drop-downlists.
NetApp Filer - Disabling Volumes and LUNs monitoring
7. Click Save. The Success, changes have been saved message indicates that the modificationshave been registered.
Troubleshooting Connectivity IssuesBMC Performance Manager Express for NetApp Filers leverages the Data ONTAP API . Becausesome connectivity issues may exist and cause BMC Performance Manager Express for NetAppFilers to fail, it is highly recommended to test the connection to the Data ONTAP API beforecontacting the Sentry Support Team.
To troubleshoot connectivity issues:
1. Download the connection tool required from the Sentry Software Website (Downloadssection of your product). Please note that the connection tool requires Java v1.6 or higher.
2. Run the command java -jar <Connection_Tool_Name.jar> to launch the connection tool.
3. Enter the information required to connect to the system and click Test Connection.
4. Wait for the test to complete. If a connectivity issue is detected, an error message willappear. In this case, the issue encountered does not concern BMC Performance ManagerExpress for NetApp Filers. Check your configuration to diagnose the source of the issue.
5. Click Save As to export the connection test results into a txt file. You can then send thisinformation to the Sentry Support Team.

Reference Guide

60
BM
C P
erfo
rman
ce M
anag
er
Exp
ress
fo
r N
etA
pp F
ilers
Ver
sion
4.1
.01
This chapter provides detailed information regarding BPM Express for NetApp Filers ApplicationClasses.
AggregateParameters
Name Description Unit Default AlertConditions
AvailableCapacityPercentage*
Percentage of capacity not consumed in theaggregate.
Percentage (%) None
AvailableCapacity
Total capacity not consumed in the aggregate. Terabytes (TB) None
Capacity Capacity of the aggregate, i.e. number of bytesthat can be stored in the aggregate.
Bytes None
ChecksumEnabled
Indicates whether checksum is enabled forthe aggregate.
(0 = No; 1 = Yes) None
ConsumedCapacityPercentage
Percentage of the capacity that is actuallyconsumed in the aggregate.
Percentage (%) Warning = 80 to90Alarm > 90
ConsumedCapacity
Number of bytes actually consumed in theaggregate.
Terabytes (TB) None
Disk Count Number of disks in the aggregate. disks None
Mirror Status Overall mirror status of the aggregate. (0 = OK; 1 = Degraded;2 = Failed)
1 = Warning2 = Alarm
OperationRate
Total number of operations per second. operations/s None
Parent Host Name of the parent host. n/a None
RAID Size Current RAID group size. n/a None
ReadOperationRate
Number of read operations per second. operations/s None
Snaplock Indicates whether it is a SnapLock aggregate. (0 = No; 1 = Yes) None
SpaceReservationStatus
Indicates whether the space reservation isenabled or not.
(0 = disabled; 1 =enabled)
None
StatusInformation
Detailed information about the aggregatestatus.
n/a None

61 Aggregate
BM
C P
erfo
rman
ce M
anag
er
Exp
ress
fo
r N
etA
pp F
ilers
Ver
sion
4.1
.01
Name Description Unit Default AlertConditions
Status* Status of the aggregate. (0 = OK; 1 = Degraded;2 = Failed)
1 = Warning2 = Alarm
Total Files Total count of user-visible files. files None
Type Details about the type of aggregate. n/a None
Used Files Number of user-visible files used. files None
VolumeCount
Number of volumes in the aggregate. volumes None
WriteOperationRate
Number of write operations per second. operations/s None
* Parameters marked with an asterisk are used by default when visualizing the corresponding monitor instance inBPPM .
62Aggregate
BM
C P
erfo
rman
ce M
anag
er
Exp
ress
fo
r N
etA
pp F
ilers
Ver
sion
4.1
.01
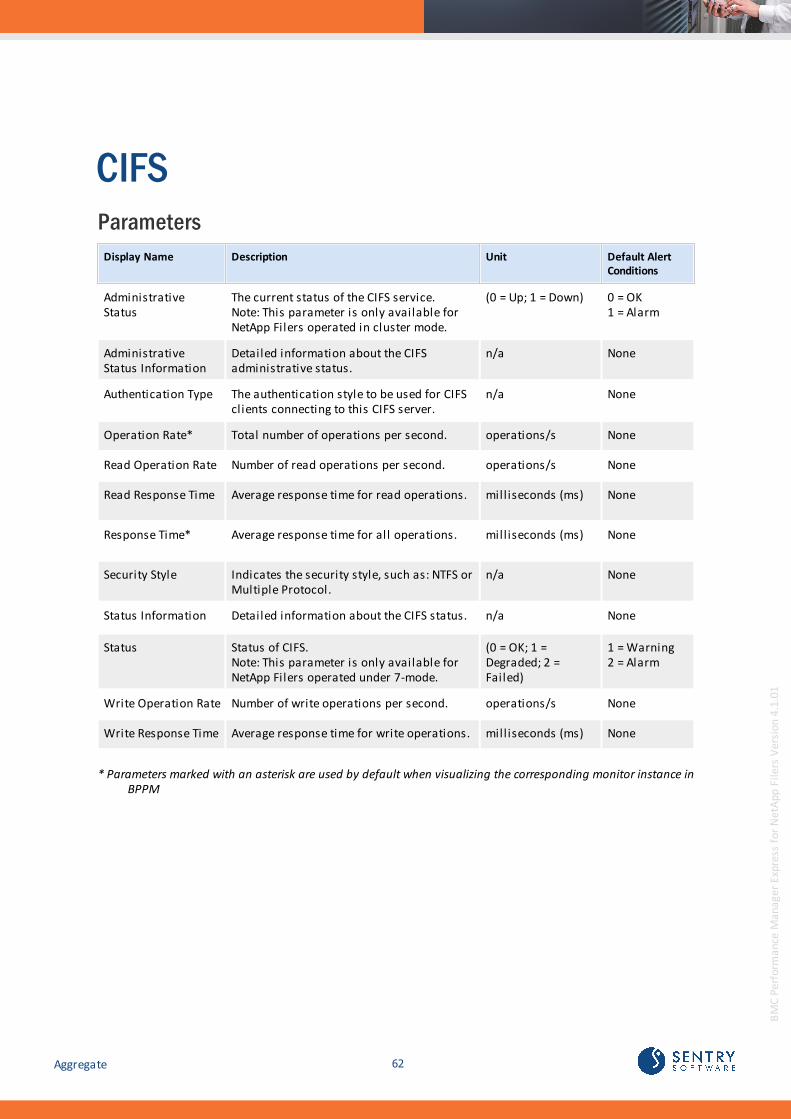
CIFSParameters
Display Name Description Unit Default AlertConditions
AdministrativeStatus
The current status of the CIFS service.Note: This parameter is only available forNetApp Filers operated in cluster mode.
(0 = Up; 1 = Down) 0 = OK1 = Alarm
AdministrativeStatus Information
Detailed information about the CIFSadministrative status.
n/a None
Authentication Type The authentication style to be used for CIFSclients connecting to this CIFS server.
n/a None
Operation Rate* Total number of operations per second. operations/s None
Read Operation Rate Number of read operations per second. operations/s None
Read Response Time Average response time for read operations. milliseconds (ms) None
Response Time* Average response time for all operations. milliseconds (ms) None
Security Style Indicates the security style, such as: NTFS orMultiple Protocol.
n/a None
Status Information Detailed information about the CIFS status. n/a None
Status Status of CIFS.Note: This parameter is only available forNetApp Filers operated under 7-mode.
(0 = OK; 1 =Degraded; 2 =Failed)
1 = Warning2 = Alarm
Write Operation Rate Number of write operations per second. operations/s None
Write Response Time Average response time for write operations. milliseconds (ms) None
* Parameters marked with an asterisk are used by default when visualizing the corresponding monitor instance inBPPM

63 CIFS
BM
C P
erfo
rman
ce M
anag
er
Exp
ress
fo
r N
etA
pp F
ilers
Ver
sion
4.1
.01
ClusterParameters
This Application Class is only available for NetApp Filers operated in cluster mode.
Name Description Unit Default AlertConditions
CIFS Operation Rate Number of CIFS operations per second. operations/s None
Collection Status Status of the collection. Errors reported by thisparameter are only related to BPM ExpressNetApp Filers itself
(0 = OK; 1 =Degraded; 2 =Failed)
1 = Warning2 = Alarm
Collection StatusInformation
Detailed information about the collectionstatus.
n/a None
Disk Transfer ByteRate*
Total bytes read and written per second to thecluster.
Megabytes persecond (MB/s)
None
Disk Transfer Bytes Bytes transferred since the last collect. Gigabytes (GB) None
FCP Operation Rate Number of FCP operations per second. operations/s None
FQDN Meta Token to generate the device ID used byBPPM.
n/a None
HTTP OperationRate
Number of HTTP operations per second. operations/s None
Inactive Licenses List of inactive licenses. n/a None
iSCSI OperationRate
Number of iSCSI operations per second. operations/s None
Network TransferByte Rate*
Total bytes read and written per secondthrough the network.
Megabytes persecond (MB/s)
None
Network TransferBytes
Bytes transferred since the last collect. Gigabytes (GB) None
NFS Operation Rate Number of NFS operations per second. operations/s None
Operation Rate Total number of operations per second. operations/s None
Port Count Number of physical ports in the cluster.
Note: This value can be used to know thenumber of required licenses for the monitoringsystem
ports None
PowerConsumption*
Reports the electricity consumption of thecluster.
Watts None
Spare Disk Count Number of spare disks in the cluster. disks 0= Warning

64Cluster
BM
C P
erfo
rman
ce M
anag
er
Exp
ress
fo
r N
etA
pp F
ilers
Ver
sion
4.1
.01
* Parameters marked with an asterisk are used by default when visualizing the corresponding monitor instance inBPPM
For detailed information about KPI, see Managing Baselines and Key Performance Indicators.

65 Cluster
BM
C P
erfo
rman
ce M
anag
er
Exp
ress
fo
r N
etA
pp F
ilers
Ver
sion
4.1
.01
ControllerParameters
This Application Class is only available for NetApp Filers operated in 7-mode.
Name Description Unit Default AlertConditions
ActiveProcessors
Number of active processors in the system. processors None
CIFS OperationRate
Total number of CIFS operations per second. operations/s None
Disk Read ByteRate
Bytes read per second from the disk since the lastcollect.
Megabytes persecond (MB/s)
None
Disk Read Bytes Bytes read from the disk since the last collect. Gigabytes (GB) None
Disk TransferByte Rate*
Total bytes read and written per second to the disk. Megabytes persecond (MB/s)
None
Disk TransferBytes
Bytes transferred to the disk since the last collect. Gigabytes (GB) None
Disk Write ByteRate
Bytes written per second to the disk since the lastcollect.
Megabytes persecond (MB/s)
None
Disk Write Bytes Bytes written to the disk since the last collect. Gigabytes (GB) None
FCP OperationRate
Total number of FCP operations per second. operations/s None
Host Address Location of the controller in a multi-controllerplatform. Defined by the platform layer. Possiblevalues are A,B,C…
n/a None
Host ID System ID defined by the vendor. n/a None
Hostname Hostname of the system. n/a None
HTTP OperationRate
Total number of HTTP operations per second. operations/s None
iSCSI OperationRate
Total number of iSCSI operations per second. operations/s None
Memory Size Size of the controller's memory. MB None
Model Model name of the controller. n/a None

66Controller
BM
C P
erfo
rman
ce M
anag
er
Exp
ress
fo
r N
etA
pp F
ilers
Ver
sion
4.1
.01
Name Description Unit Default AlertConditions
NetworkReceived ByteRate
Bytes received per second over the network. Megabytes persecond (MB/s)
None
NetworkReceived Bytes
Bytes received since the last collect. Gigabytes (GB) None
Network SentByte Rate
Bytes sent per second over the network. Megabytes persecond (MB/s)
None
Network SentBytes
Bytes sent since the last collect. Gigabytes (GB) None
Network TransferByte Rate*
Total bytes transferred per second (sent and received)over the network.
Megabytes persecond (MB/s)
None
Network TransferBytes
Bytes transferred since the last collect. Gigabytes (GB) None
NFS OperationRate
Total number of NFS operations per second. operations/s None
Number ofProcessors
Number of processors in the device. n/a None
Operation Rate Total number of operations per second. operations/s None
Partner SystemName
Partner's system name. Displayed in a clusterenvironment. Defined in the partner's setup.
n/a None
Present Indicates whether the device is still present or notsince the last discovery. This parameter is updated ateach discovery.
(0 = No; 1 = Yes) 0 = Alarm
ProcessorUtilization
Percentage of utilization of the CPU resource. % None
Read OperationRate
Number of read operations per second. operations/s None
Read ResponseTime
Average response time for read operations. milliseconds(ms)
None
Response Time Average response time for all operations. milliseconds(ms)
None
Serial Number System serial number. n/a None
System Revision Revision ID of the system board. n/a None
Vendor Hardware vendor identifier. n/a None
Write OperationRate
Number of write operations per second. operations/s None
Write ResponseTime
Average response time for write operations. milliseconds(ms)
None

67 Controller
BM
C P
erfo
rman
ce M
anag
er
Exp
ress
fo
r N
etA
pp F
ilers
Ver
sion
4.1
.01
* Parameters marked with an asterisk are used by default when visualizing the corresponding monitor instance inBPPM
For detailed information about Baselining and KPI, see Managing Baselines and Key Performance Indicators.

68Controller
BM
C P
erfo
rman
ce M
anag
er
Exp
ress
fo
r N
etA
pp F
ilers
Ver
sion
4.1
.01
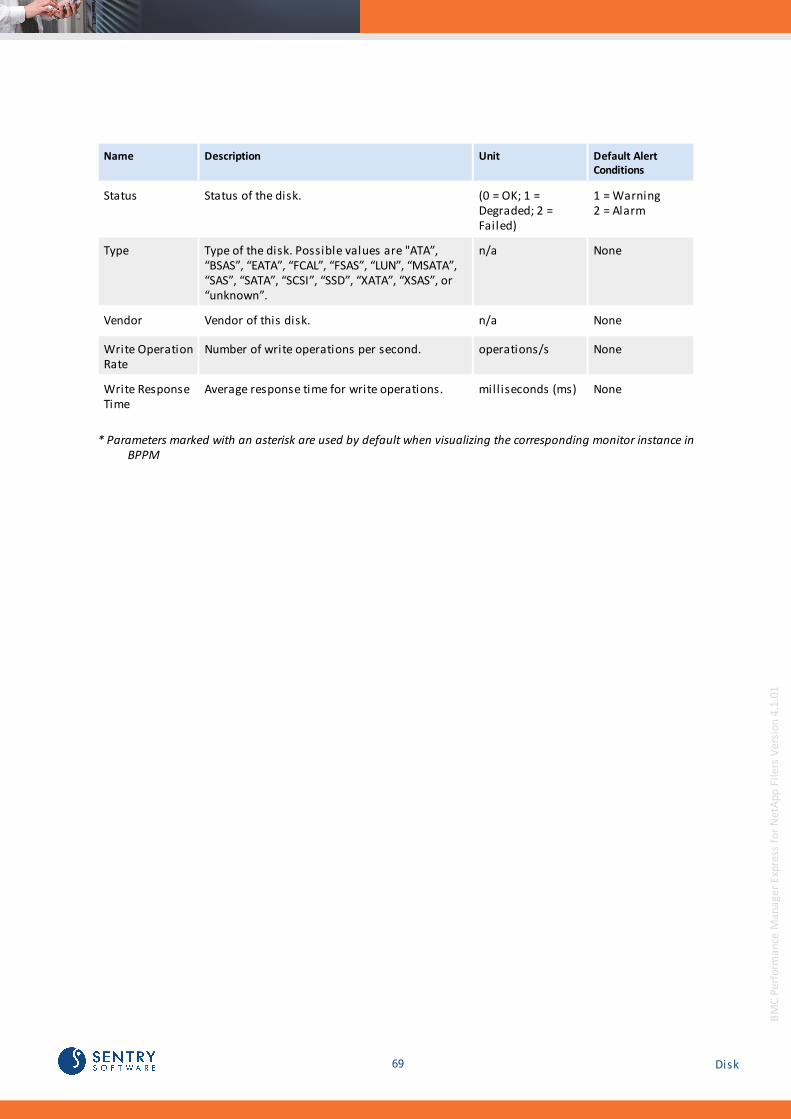
DiskParameters
Name Description Unit Default AlertConditions
Aggregate Aggregate that the disk resides on. n/a None
Bay Disk bay. n/a None
Capacity Disk capacity. Gigabytes (GB) None
Model Model name of the disk. n/a None
Operation Rate* Total number of operations per second. operations/s None
Physical Size Physical disk size. Gigabytes (GB) None
Plex Plex the disk belongs to. n/a None
Pool Pool the disk is in. n/a None
Port Port of the disk. n/a None
Present Indicates whether the device is still present ornot since the last discovery. This parameter isupdated at each discovery.
(0 = No; 1 = Yes) 0 = Alarm
RAID Group RAID group the disk belongs to. n/a None
RAID State RAID state. Possible values are: "partner","broken", "zeroing", "spare", "copy", "pending","reconstructing", "present" and "unknown".
n/a None
RAID Type RAID type. Possible values are: pending, parity,dparity, data, and unowned.
n/a None
Read OperationRate
Number of read operations per second. operations/s None
Read ResponseTime
Average response time for read operations. milliseconds (ms) None
Response Time* Average response time for all operations. milliseconds (ms) None
Serial Number Disk serial number. n/a None
Shelf Disk shelf. n/a None
Speed Rotational speed in revolutions per minute.Possible values are: 5400, 7200, 10000, and15000.
Revolutions perMinute (RPM)
None
StatusInformation
Detailed information about the disk status. n/a None
69 Disk
BM
C P
erfo
rman
ce M
anag
er
Exp
ress
fo
r N
etA
pp F
ilers
Ver
sion
4.1
.01
Name Description Unit Default AlertConditions
Status Status of the disk. (0 = OK; 1 =Degraded; 2 =Failed)
1 = Warning2 = Alarm
Type Type of the disk. Possible values are "ATA”,“BSAS”, “EATA”, “FCAL”, “FSAS”, “LUN”, “MSATA”,“SAS”, “SATA”, “SCSI”, “SSD”, “XATA”, “XSAS”, or“unknown”.
n/a None
Vendor Vendor of this disk. n/a None
Write OperationRate
Number of write operations per second. operations/s None
Write ResponseTime
Average response time for write operations. milliseconds (ms) None
* Parameters marked with an asterisk are used by default when visualizing the corresponding monitor instance inBPPM

70Disk
BM
C P
erfo
rman
ce M
anag
er
Exp
ress
fo
r N
etA
pp F
ilers
Ver
sion
4.1
.01
Ethernet PortParameters
Name Description Unit Default AlertConditions
CollisionsPacket Rate
Number of collisions of packets per seconds. packets/s None
Link Status Current status of the Ethernet port.Note: This parameter is only available for NetAppFilers operated in cluster mode.
(0 = Plugged; 1 =Unplugged)
1 = Warning
MulticastReceived PacketRate
Number of multicast packets received per second. packets/s None
Multicast SentPacket Rate
Number of multicast packets sent per second. packets/s None
MulticastTransfer PacketRate
Total number of multicast packets transferred persecond (sent and received).
packets/s None
Node Name System Node Name. n/a None
Present Indicates whether the device is still present or notsince the last discovery. This parameter is updatedat each discovery.Note: This parameter is only available for NetAppFilers operated in cluster mode.
(0 = No; 1 = Yes) 0 = Alarm
Received ByteRate
Bytes received per second. Megabytes persecond (MB/s)
None
Received Bytes Bytes received since the last collect. Gigabytes (GB) None
Received ErrorRate
Number of errors per second while receivingpackets.
errors/s None
Received PacketDropped Rate
Number of received packets dropped per second. packets/s None
Received PacketRate
Number of packets received per second. packets/s None
Sent Byte Rate Bytes sent per second. Megabytes persecond (MB/s)
None
Sent Bytes Bytes sent since the last collect. Gigabytes (GB) None
Sent Error Rate Number of errors per second while sending packets. errors/s None
Sent Packet Rate Number of packets sent per second. packets/s None

71 Ethernet Port
BM
C P
erfo
rman
ce M
anag
er
Exp
ress
fo
r N
etA
pp F
ilers
Ver
sion
4.1
.01
Transfer ByteRate*
Total bytes transferred per second (sent andreceived).
Megabytes persecond (MB/s)
None
Transfer Bytes Sent and received bytes since the last collect. Gigabytes (GB) None
Transfer ErrorRate
Number of errors per second while transferringpackets.
errors/s None
Transfer PacketRate*
Number of packets transferred per second. packets/s None
* Parameters marked with an asterisk are used by default when visualizing the corresponding monitor instance inBPPM

72Ethernet Port
BM
C P
erfo
rman
ce M
anag
er
Exp
ress
fo
r N
etA
pp F
ilers
Ver
sion
4.1
.01
FanParameters
Name Description Unit Default AlertConditions
Present Indicates whether the device is still present or notsince the last discovery. This parameter is updated ateach discovery.
(0 = No; 1 = Yes) 0 = Alarm
Speed* Speed of the fan. Revolutions perminute (RPM)
None
StatusInformation
Detailed information about the fan status. n/a None
Status* Status of the fan. (0 = OK; 1 =Degraded; 2 =Failed)
1 = Warning2 = Alarm
* Parameters marked with an asterisk are used by default when visualizing the corresponding monitor instance inBPPM

73 Fan
BM
C P
erfo
rman
ce M
anag
er
Exp
ress
fo
r N
etA
pp F
ilers
Ver
sion
4.1
.01
FC PortParameters
Name Description Unit Default AlertConditions
Bandwidth Utilization Percentage used of the available bandwidth. % None
Configured Speed Speed configured for this adapter. Possible values: "auto", "1 Gb/s", "2 Gb/s", "4Gb/s", "8 Gb/s", "10 Gb/s".
Gigabits persecond (Gb/s)
None
Connected InitiatorsCount
Total number of initiators (hosts) connected tothis port (target adapter).
initiators None
CRC Error Rate CRC errors per second. errors/s None
Discarded Frame Rate Number of frames discarded per second. frames/s None
EstablishedConnection
Type of connection established. Possible values: "ptp" or "loop".
n/a None
FCP Protocol ErrorRate
FCP protocol errors per second. errors/s None
Firmware Revision Firmware revision of the adapter. n/a None
Hardware Description Description of the adapter (vendor and model). n/a None
Inbound BandwidthUtilization
Percentage of inbound bandwidth used on theFC link (received bytes).
Percentage (%) None
Link Speed Actual speed of the FC port. Gigabits persecond (Gb/s)
None
Link Status Indicates whether the link is up or down. (0 = Plugged; 1 =Unplugged)
1 = Warning
Operation Rate* Total number of operations per second. operations/s None
Other Operation Rate Total number of other operations per second. operations/s None
Outbound BandwidthUtilization
Percentage of outband bandwidth used on theFC link (sent bytes).
Percentage (%) None
Packet Size FC packet size of adapter. Bytes (B) None
Port Address Host port address of the adapter. n/a None
Present Indicates whether the device is still present ornot since the last discovery. This parameter isupdated at each discovery.
(0 = No; 1 = Yes) 0 = Alarm
Read Operation Rate Number of read operations per second. operations/s None

74FC Port
BM
C P
erfo
rman
ce M
anag
er
Exp
ress
fo
r N
etA
pp F
ilers
Ver
sion
4.1
.01
Name Description Unit Default AlertConditions
Received Byte Rate Bytes received per second. Megabytes persecond (MB/s)
None
Received Bytes Bytes received since the last collect. Gigabytes (GB) None
Revision Revision for the optical transceiver. n/a None
Sent Byte Rate Bytes sent per second. Megabytes persecond (MB/s)
None
Sent Bytes Bytes sent since the last collect. Gigabytes (GB) None
Speed Capabilities FC speed capabilities for the optical transceiver.Possible values: "1", "2", "4", "8" in Gb/s.
Gigabits persecond (Gb/s)
None
StandBy Indicates whether the adapter is on standby. n/a None
Status Information Detailed information about the adapter status. n/a None
Status Status of the FC port. (0 = OK; 1 =Degraded; 2 =Failed)
1 = Warning2 = Alarm
Transfer Byte Rate* Total bytes transferred per second (sent andreceived).
Megabytes persecond (MB/s)
None
Transfer Bytes Sent and received bytes since the last collect. Gigabytes (GB) None
Type Type of the adapter.Possible values: "physical", "local", "standby","partner".
n/a None
Write Operation Rate Number of write operations per second. operations/s None
WWNN FCP World Wide Node Name (WWNN) of theadapter.
n/a None
WWPN FCP World Wide Port Name (WWPN) of theadapter.
n/a None
* Parameters marked with an asterisk are used by default when visualizing the corresponding monitor instance inBPPM

75 FC Port
BM
C P
erfo
rman
ce M
anag
er
Exp
ress
fo
r N
etA
pp F
ilers
Ver
sion
4.1
.01
FilerParameters
This Application Class is only available for NetApp Filers operated in 7-mode.
Name Description Unit Default AlertConditions
CIFS OperationRate
Total number of CIFS operations per second. operations/s None
Collection Status Status of the collection. Errors reported by thisparameter are only related to BPM Express NetAppFilers itself.
0 = OK; 1 =Degraded; 2 =Failed)
1 = Warning2 = Alarm
Collection StatusInformation
Detailed information about the collection status. n/a None
Disk Transfer ByteRate
Total bytes read and written per second to thedisk.
Megabytes persecond (MB/s)
None
Disk TransferBytes
Bytes transferred since the last collect. Gigabytes (GB) None
FCP OperationRate
Total number of FCP operations per second. operations/s None
FQDN Meta Token to generate the device ID used byBPPM.
n/a None
HTTP OperationRate
Total number of HTTP operations per second. operations/s None
Inactive Licenses List of inactive licenses. n/a None
iSCSI OperationRate
Total number of iSCSI operations per second. operations/s None
Network TransferByte Rate*
Total bytes read and written per second throughthe network.
Megabytes persecond (MB/s)
None
Network TransferBytes
Bytes transferred since the last collect. Gigabytes (GB) None
NFS OperationRate
Total number of NFS operations per second. operations/s None
Operation Rate Total number of operations per second. operations/s None
Port Count Number of physical ports in the filer.
Note: This value can be used to know the number ofrequired licenses for the monitoring system
ports None
PowerConsumption*
Reports the electricity consumption of the filer. Watts None

76Filer
BM
C P
erfo
rman
ce M
anag
er
Exp
ress
fo
r N
etA
pp F
ilers
Ver
sion
4.1
.01
Name Description Unit Default AlertConditions
Spare Disk Count Number of spare disks available in the filer. disks 0= Warning
* Parameters marked with an asterisk are used by default when visualizing the corresponding monitor instance inBPPM
For detailed information about KPI, see Managing Baselines and Key Performance Indicators.

77 Filer
BM
C P
erfo
rman
ce M
anag
er
Exp
ress
fo
r N
etA
pp F
ilers
Ver
sion
4.1
.01
Host AdapterParameters
Name Description Unit Default AlertConditions
Bandwidth Maximum link data rate for the Host Adapter. Gigabits persecond (Gb/s)
None
Enabled Indicates whether the adapter is enabled or not. (0 = No; 1 =Yes)
None
FirmwareRevision
Firmware revision of the adapter. n/a None
HardwareRevision
Hardware revision of the adapter. n/a None
Model Model name of the adapter. n/a None
OperationRate*
Total number of operations per second. operations/s None
Present Indicates whether the device is still present or notsince the last discovery. This parameter is updated ateach discovery.
(0 = No; 1 =Yes)
0 = Alarm
Read ByteRate
Bytes read per second from the host adapter since thelast collect.
Megabytesper second(MB/s)
None
Read Bytes Bytes read via Host Adapter since the last collect Gigabytes(GB)
None
ReadOperationRate
Number of read operations per second. operations/s None
Redundant Indicates whether the adapter is dual-attached or not. (0 = No; 1 =Yes)
None
Transfer ByteRate*
Total bytes read and written per second to the hostadapter.
Megabytesper second(MB/s)
None
TransferBytes
Read and written bytes to the host adapter since thelast collect.
Gigabytes(GB)
None
Type Adapter Type. Possible values are "ADT_IF_ATA","ADT_IF_PARALLEL_SCSI", "ADT_IF_SAS", "ADT_IF_FC".
n/a None
Used Indicates whether the adapter is in use or not. (0 = No; 1 =Yes)
None
Write ByteRate
Bytes written per second to the host adapter since thelast collect.
Megabytesper second(MB/s)
None

78Host Adapter
BM
C P
erfo
rman
ce M
anag
er
Exp
ress
fo
r N
etA
pp F
ilers
Ver
sion
4.1
.01
Name Description Unit Default AlertConditions
Write Bytes Bytes written via Host Adapter since the last collect. Gigabytes(GB)
None
WriteOperationRate
Number of write operations per second. operations/s None
WWN World Wide Name of the host adapter. n/a None
* Parameters marked with an asterisk are used by default when visualizing the corresponding monitor instance inBPPM
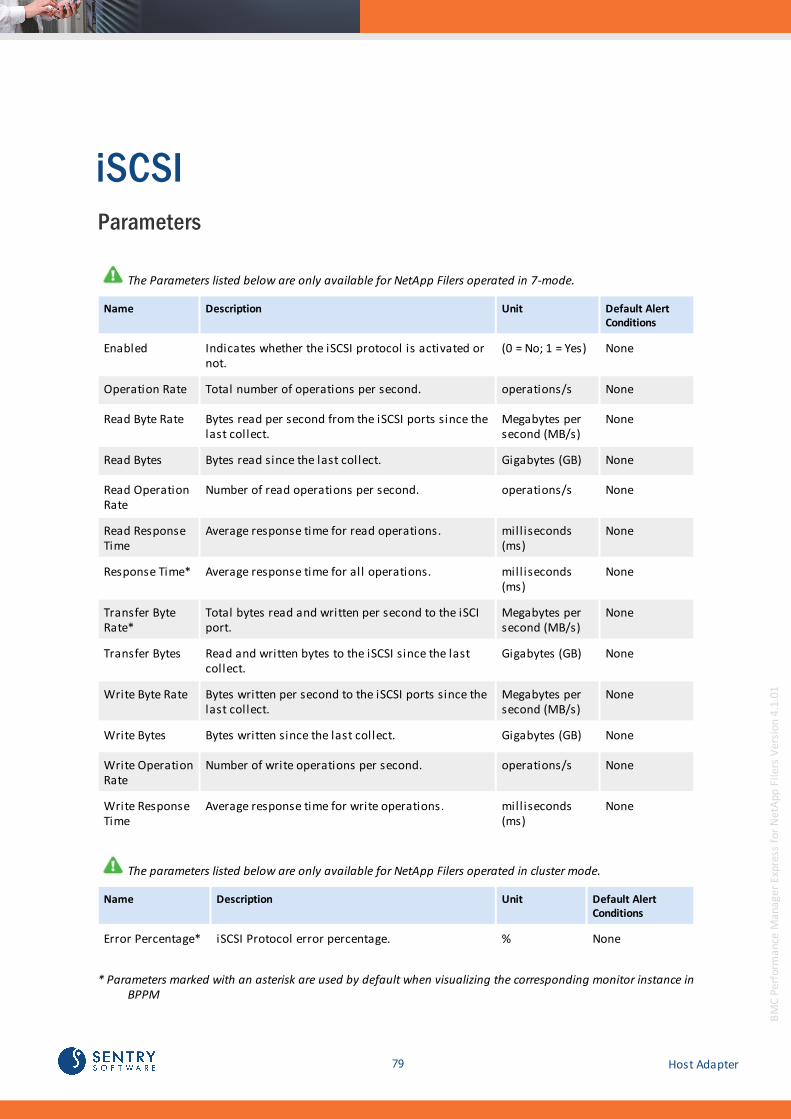
79 Host Adapter
BM
C P
erfo
rman
ce M
anag
er
Exp
ress
fo
r N
etA
pp F
ilers
Ver
sion
4.1
.01
iSCSIParameters
The Parameters listed below are only available for NetApp Filers operated in 7-mode.
Name Description Unit Default AlertConditions
Enabled Indicates whether the iSCSI protocol is activated ornot.
(0 = No; 1 = Yes) None
Operation Rate Total number of operations per second. operations/s None
Read Byte Rate Bytes read per second from the iSCSI ports since thelast collect.
Megabytes persecond (MB/s)
None
Read Bytes Bytes read since the last collect. Gigabytes (GB) None
Read OperationRate
Number of read operations per second. operations/s None
Read ResponseTime
Average response time for read operations. milliseconds(ms)
None
Response Time* Average response time for all operations. milliseconds(ms)
None
Transfer ByteRate*
Total bytes read and written per second to the iSCIport.
Megabytes persecond (MB/s)
None
Transfer Bytes Read and written bytes to the iSCSI since the lastcollect.
Gigabytes (GB) None
Write Byte Rate Bytes written per second to the iSCSI ports since thelast collect.
Megabytes persecond (MB/s)
None
Write Bytes Bytes written since the last collect. Gigabytes (GB) None
Write OperationRate
Number of write operations per second. operations/s None
Write ResponseTime
Average response time for write operations. milliseconds(ms)
None
The parameters listed below are only available for NetApp Filers operated in cluster mode.
Name Description Unit Default AlertConditions
Error Percentage* iSCSI Protocol error percentage. % None
* Parameters marked with an asterisk are used by default when visualizing the corresponding monitor instance inBPPM
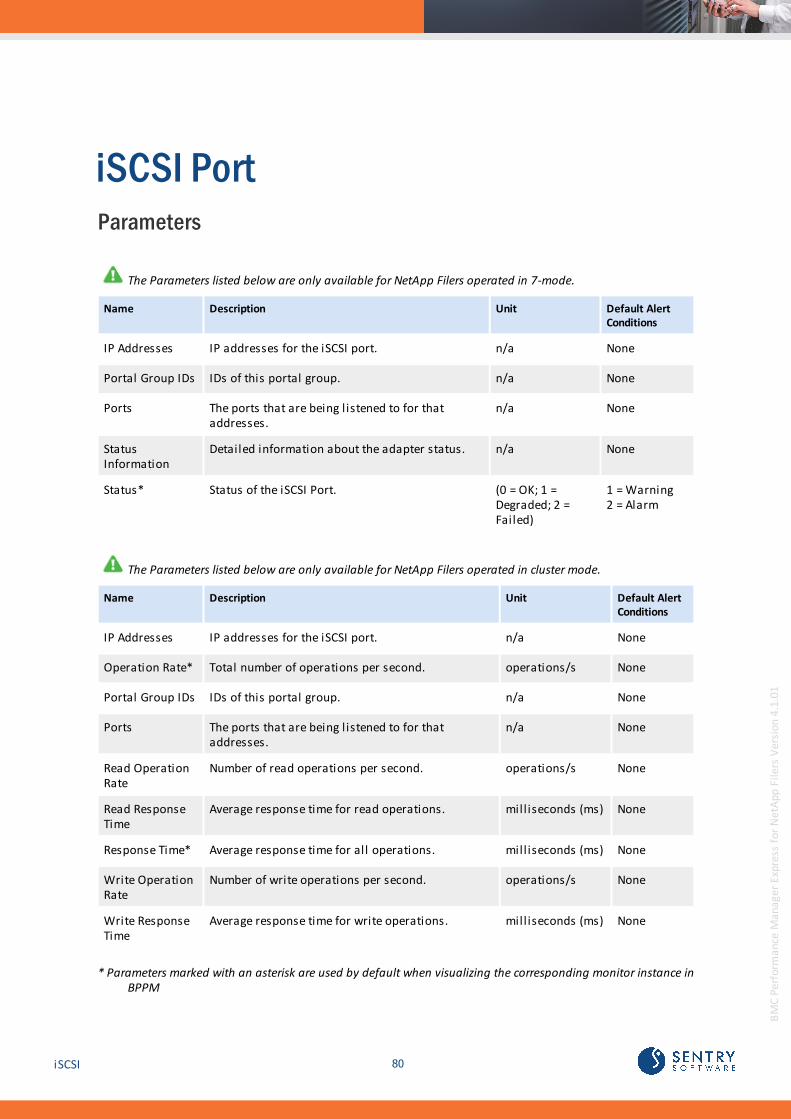
80iSCSI
BM
C P
erfo
rman
ce M
anag
er
Exp
ress
fo
r N
etA
pp F
ilers
Ver
sion
4.1
.01
iSCSI PortParameters
The Parameters listed below are only available for NetApp Filers operated in 7-mode.
Name Description Unit Default AlertConditions
IP Addresses IP addresses for the iSCSI port. n/a None
Portal Group IDs IDs of this portal group. n/a None
Ports The ports that are being listened to for thataddresses.
n/a None
StatusInformation
Detailed information about the adapter status. n/a None
Status* Status of the iSCSI Port. (0 = OK; 1 =Degraded; 2 =Failed)
1 = Warning2 = Alarm
The Parameters listed below are only available for NetApp Filers operated in cluster mode.
Name Description Unit Default AlertConditions
IP Addresses IP addresses for the iSCSI port. n/a None
Operation Rate* Total number of operations per second. operations/s None
Portal Group IDs IDs of this portal group. n/a None
Ports The ports that are being listened to for thataddresses.
n/a None
Read OperationRate
Number of read operations per second. operations/s None
Read ResponseTime
Average response time for read operations. milliseconds (ms) None
Response Time* Average response time for all operations. milliseconds (ms) None
Write OperationRate
Number of write operations per second. operations/s None
Write ResponseTime
Average response time for write operations. milliseconds (ms) None
* Parameters marked with an asterisk are used by default when visualizing the corresponding monitor instance inBPPM

81 iSCSI Port
BM
C P
erfo
rman
ce M
anag
er
Exp
ress
fo
r N
etA
pp F
ilers
Ver
sion
4.1
.01
LUNParameters
Name Description Unit Default AlertConditions
Block Size Disk block size of the LUN in bytes. Bytes (B) None
ConsumedCapacity
Number of bytes actually consumed in the LUN.Note: This Parameter is only available for NetApp Filersoperated in cluster mode.
Gigabytes (GB) None
InitiatorGroups
Name of the initiator groups that the LUN is mapped to,and its corresponding WWN.
n/a None
Mapped Indicates whether the LUN is mapped to any initiators ornot.
(0 = NotMapped; 1 =Mapped)
None
Multi ProtocolType
The image type of the LUN. Possible values are "aix","hpux", "hyper_v", "image", "linux", "netware","openvms", "solaris", "solaris_efi", "vmware","windows", "windows_2008" and "windows_gpt".
n/a None
Online State of the LUN. Possible values are "online" or "offline". (0 = Offline; 1 =Online)
None
Operation Rate Total number of operations per second. operations/s None
OtherOperation Rate
Total number of other operations per second. operations/s None
Read Byte Rate Bytes read per second from the LUN since the last collect. Megabytes persecond (MB/s)
None
Read Bytes Read bytes since the last collect. Gigabytes (GB) None
Read Only Indicates whether the LUN is read only or not. n/a None
Read OperationRate
Number of read operations per second. operations/s None
ResponseTime*
Average response time for all operations. milliseconds(ms)
None
Serial Number Serial number of the LUN. n/a None
Size Size of this LUN in the active FS. Gigabytes (GB) None
SpaceReservationStatus
Space reservation status. (0 = Disabled; 1= Enabled)
None
Time Since LastActivity
Number of days since any activity occurred on the LUN. days None
Transfer ByteRate*
Total bytes read and written per second to the LUN. Megabytes persecond (MB/s)
None

82LUN
BM
C P
erfo
rman
ce M
anag
er
Exp
ress
fo
r N
etA
pp F
ilers
Ver
sion
4.1
.01
Name Description Unit Default AlertConditions
Transfer Bytes Read and written bytes to the LUN since the last collect. Gigabytes (GB) None
Write Byte Rate Bytes written per second to the LUN since the last collect. Megabytes persecond (MB/s)
None
Write Bytes Bytes written since the last collect. Gigabytes (GB) None
WriteOperation Rate
Number of write operations per second. operations/s None
* Parameters marked with an asterisk are used by default when visualizing the corresponding monitor instance inBPPM

83 LUN
BM
C P
erfo
rman
ce M
anag
er
Exp
ress
fo
r N
etA
pp F
ilers
Ver
sion
4.1
.01
NDMPParameters
This Application Class is only available for NetApp Filers operated in 7-mode.
Name Description Unit Default Alert Conditions
Opened Sessions* Total number of NDMPsessions currently opened.Sessions may be runningbackups, restores orneither.
sessions None
* Parameters marked with an asterisk are used by default when visualizing the corresponding monitor instance inBPPM

84NDMP
BM
C P
erfo
rman
ce M
anag
er
Exp
ress
fo
r N
etA
pp F
ilers
Ver
sion
4.1
.01
NFSParameters
Name Description Unit DefaultAlertConditions
Enabled Indicates whether the NFS protocol isactivated or not.
(0 = No; 1 = Yes) None
Operation Rate* Total number of operations per second. operations/s None
Read Operation Rate Number of read operations per second. operations/s None
Read Response Time Average response time for read operations. milliseconds(ms)
None
Response Time* Average response time for all operations. milliseconds(ms)
None
Write Operation Rate Number of write operations per second. operations/s None
Write Response Time Average response time for write operations. milliseconds(ms)
None
* Parameters marked with an asterisk are used by default when visualizing the corresponding monitor instance inBPPM

85 NFS
BM
C P
erfo
rman
ce M
anag
er
Exp
ress
fo
r N
etA
pp F
ilers
Ver
sion
4.1
.01
NodeParameters
This Application Class is only available for NetApp Filers operated in cluster mode.
Name Description Unit Default AlertConditions
Active Processors Number of active processors in the system. processor
None
CIFS Operation Rate Total number of CIFS operations per second. operations/s
None
Disk Read Byte Rate Bytes read per second from the disk since the lastcollect.
Megabytes persecond(MB/s)
None
Disk Read Bytes Bytes read since the last collect. Gigabytes (GB)
None
Disk Transfer Byte Rate*
Total bytes read and written per second to the disk. Megabytes persecond(MB/s)
None
Disk Transfer Bytes Bytes transferred since the last collect. Gigabytes (GB)
None
Disk Write Byte Rate Bytes written per second to the disk since the lastcollect.
Megabytes persecond(MB/s)
None
Disk Write Bytes Bytes written since the last collect. Gigabytes (GB)
None
FCP Operation Rate Total number of FCP operations per second. operations/s
None
HTTP Operation Rate Total number of HTTP operations per second. operations/s
None
iSCSI Operation Rate Total number of iSCSI operations per second. operations/s
None
Memory Size Memory size in megabytes. Megabytes (MB)
None
Model Model name of the Node. n/a None
Network Received ByteRate
Bytes received per second. Megabytes persecond(MB/s)
None

86Node
BM
C P
erfo
rman
ce M
anag
er
Exp
ress
fo
r N
etA
pp F
ilers
Ver
sion
4.1
.01
Name Description Unit Default AlertConditions
Network Received Bytes Bytes received since the last collect. Gigabytes (GB)
None
Network Sent Byte Rate Bytes sent per second. Megabytes persecond(MB/s)
None
Network Sent Bytes Bytes sent since the last collect. Gigabytes (GB)
None
Network Transfer ByteRate*
Total bytes transferred per second (sent andreceived).
Megabytes persecond(MB/s)
None
Network Transfer Bytes Bytes transferred since the last collect. Gigabytes (GB)
None
NFS Operation Rate Total number of NFS operations per second. operations/s
None
Number of Processors Number of processors in the appliance. n/a None
Operation Rate Total number of operations per second. operations/s
None
Present Indicates whether the device is still present or notsince the last discovery. This parameter is updatedat each discovery.
(0 = No; 1= Yes)
0 = Alarm
Processor Utilization Percentage of utilization of the CPU resource. Percentage (%)
None
Read Operation Rate Number of read operations per second. operations/s
None
Read Response Time Average response time for read operations. milliseconds (ms)
None
Response Time Average response time for all operations. milliseconds (ms)
None
Serial Number System serial number. n/a None
System ID System ID defined by the vendor. n/a None
System Revision Revision ID of the system board. n/a None
Uptime Amount of time the system has been up and running. days None
Vendor Hardware vendor identifier. n/a None
Write Operation Rate Number of write operations per second. operations/s
None
Write Response Time Average response time for write operations. milliseconds (ms)
None

87 Node
BM
C P
erfo
rman
ce M
anag
er
Exp
ress
fo
r N
etA
pp F
ilers
Ver
sion
4.1
.01
* Parameters marked with an asterisk are used by default when visualizing the corresponding monitor instance inBPPM
For detailed information about Baselining and KPI, see Managing Baselines and Key Performance Indicators.

88Node
BM
C P
erfo
rman
ce M
anag
er
Exp
ress
fo
r N
etA
pp F
ilers
Ver
sion
4.1
.01
NVRAMParameters
Name Description Unit DefaultAlertConditions
OperationRate*
Total number of operations per second. operations/s None
ResponseTime*
Average response time for all operations.
Note: This parameter is only available for NetApp Filersoperated in cluster mode.
milliseconds(ms)
Warning >30Alarm ≥100
Transfer ByteRate
Total bytes read and written per second to the NVRAM. Megabytes persecond (MB/s)
None
Transfer Bytes Bytes transferred since the last collect. Gigabytes (GB) None
* Parameters marked with an asterisk are used by default when visualizing the corresponding monitor instance inBPPM

89 NVRAM
BM
C P
erfo
rman
ce M
anag
er
Exp
ress
fo
r N
etA
pp F
ilers
Ver
sion
4.1
.01
PlexParameters
Name Description Unit Default Alert Conditions
Status Information Detailed informationabout the plex status.
n/a None
Status* Status of the plex. (0 = OK ; 1 = Degraded2 = Failed)
1 = Warning2 = Alarm
Synchronized Indicates whether the plexis currently synchronizingor not.
(0 = No ; 1 = Yes) None
* Parameters marked with an asterisk are used by default when visualizing the corresponding monitor instance inBPPM
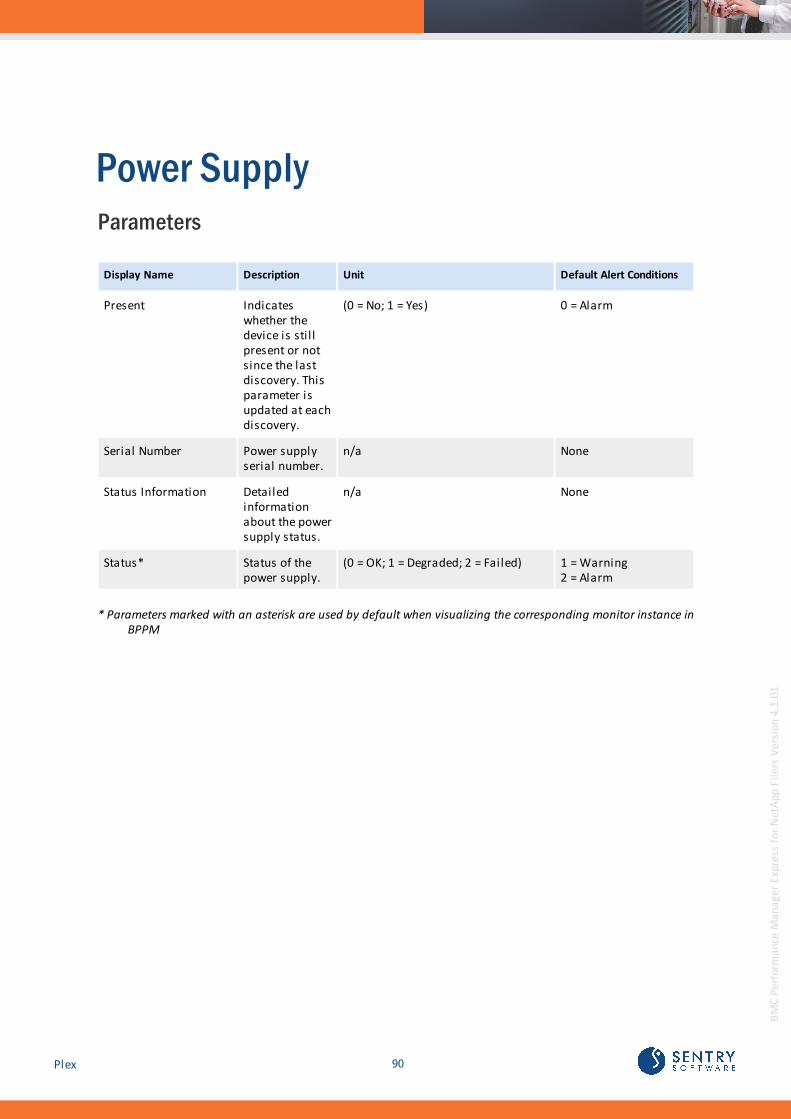
90Plex
BM
C P
erfo
rman
ce M
anag
er
Exp
ress
fo
r N
etA
pp F
ilers
Ver
sion
4.1
.01
Power SupplyParameters
Display Name Description Unit Default Alert Conditions
Present Indicateswhether thedevice is stillpresent or notsince the lastdiscovery. Thisparameter isupdated at eachdiscovery.
(0 = No; 1 = Yes) 0 = Alarm
Serial Number Power supplyserial number.
n/a None
Status Information Detailedinformationabout the powersupply status.
n/a None
Status* Status of thepower supply.
(0 = OK; 1 = Degraded; 2 = Failed) 1 = Warning2 = Alarm
* Parameters marked with an asterisk are used by default when visualizing the corresponding monitor instance inBPPM

91 Power Supply
BM
C P
erfo
rman
ce M
anag
er
Exp
ress
fo
r N
etA
pp F
ilers
Ver
sion
4.1
.01
ProcessorParameters
Name Description Unit Default Alert Conditions
FirmwareRelease
Firmware release number. n/a None
PartNumber
Processor's part number. n/a None
Present Indicates whether the device is stillpresent or not since the last discovery.This parameter is updated at eachdiscovery.
(0 = No; 1 = Yes) 0 = Alarm
ProcessorType
Processor's Type. n/a None
ProcessorUtilization*
Percentage of utilization of the CPUresource.
Percentage (%) Warning > 80Alarm > 90
Revision Processor's part number revision. n/a None
SerialNumber
Processor's serial number. n/a None
* Parameters marked with an asterisk are used by default when visualizing the corresponding monitor instance inBPPM

92Processor
BM
C P
erfo
rman
ce M
anag
er
Exp
ress
fo
r N
etA
pp F
ilers
Ver
sion
4.1
.01
QtreeParameters
Name Description Unit Default Alert Conditions
CIFS Operation Rate* Number of CIFS operations persecond.
operations/s None
NFS Operation Rate* Number of NFS operations persecond.
operations/s None
Operation Rate Total number of operations persecond.
operations/s None
Oplocks Enabled Indicates whether opportunisticlocks are enabled on the qtree ornot.
(0 = No; 1 = Yes) None
Other Operation Rate Number of other operations persecond.
operations/s None
Security Style Security style of the qtree. Possiblevalues are "unix", "ntfs", or"mixed".
n/a None
Type Type of the qtree. Possible valuesare "snapvaulted","snapmirrored", "normal", and"readonly".
n/a None
* Parameters marked with an asterisk are used by default when visualizing the corresponding monitor instance inBPPM

93 Qtree
BM
C P
erfo
rman
ce M
anag
er
Exp
ress
fo
r N
etA
pp F
ilers
Ver
sion
4.1
.01
ShelfParameters
Name Description Unit DefaultAlertConditions
Channel The channel the shelf is attached to. n/a None
Module The shelf module attachment. Possible values are: "a" or "b". n/a None
Present Indicates whether the device is still present or not since the lastdiscovery. This parameter is updated at each discovery.
(0 = No; 1 = Yes) 0 =Alarm
StatusInformation
Detailed information about the shelf status. n/a None
Status* Status of the shelf. (0 = OK; 1 =Degraded; 2 =Failed)
1 =Warning2 =Alarm
Type Type of the shelf module. n/a None
UID Shelf unique identifier that distinguishes it from any other shelfmanufactured.
n/a None
* Parameters marked with an asterisk are used by default when visualizing the corresponding monitor instance inBPPM

94Shelf
BM
C P
erfo
rman
ce M
anag
er
Exp
ress
fo
r N
etA
pp F
ilers
Ver
sion
4.1
.01
SIS VolumeParameters
Name Description Unit DefaultAlertConditions
Dense Files Number of dense files in the SIS volume. files None
Last OperationSize
Data size processed in the last SIS operation. Megabytes(MB)
None
Number Of FilesToo Small
Number of files found that are too small to be deduplicated(compressed).
files None
Progression Progress of the SIS process. n/a None
Saved SpacePercentage*
Percent saving because of deduplication (compressed). % None
Schedule Schedule of the SIS process. n/a None
Shared SavedBlocks
Number of blocks saved by sharing in the SIS volume. blocks None
SIS Duration Time since the last SIS operation has begun. seconds None
Space ConditionLimitation Count
Number of times deduplication could not happen because ofout of space condition.
times None
StatusInformation
Detailed information about the SIS volume status. n/a None
Status* Status of the SIS volume. (0 = OK; 1 =Degraded; 2= Failed)
1 =Warning2 =Alarm
* Parameters marked with an asterisk are used by default when visualizing the corresponding monitor instance inBPPM
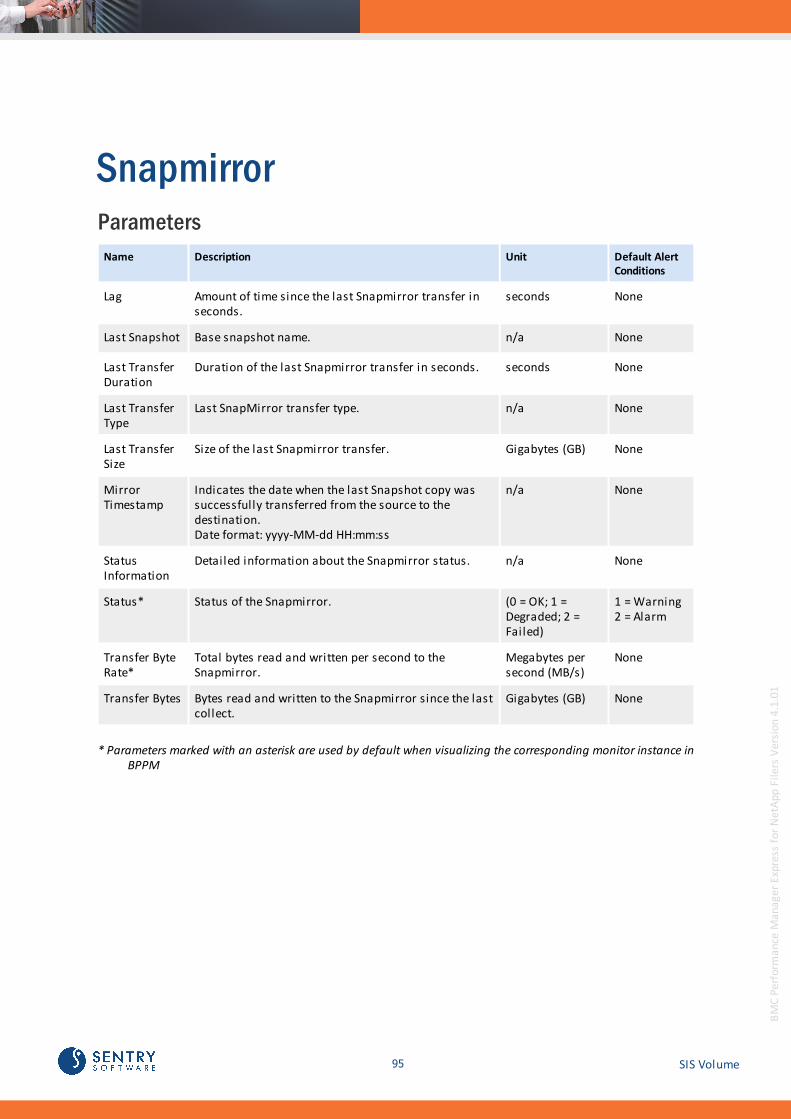
95 SIS Volume
BM
C P
erfo
rman
ce M
anag
er
Exp
ress
fo
r N
etA
pp F
ilers
Ver
sion
4.1
.01
SnapmirrorParameters
Name Description Unit Default AlertConditions
Lag Amount of time since the last Snapmirror transfer inseconds.
seconds None
Last Snapshot Base snapshot name. n/a None
Last TransferDuration
Duration of the last Snapmirror transfer in seconds. seconds None
Last TransferType
Last SnapMirror transfer type. n/a None
Last TransferSize
Size of the last Snapmirror transfer. Gigabytes (GB) None
MirrorTimestamp
Indicates the date when the last Snapshot copy wassuccessfully transferred from the source to thedestination.Date format: yyyy-MM-dd HH:mm:ss
n/a None
StatusInformation
Detailed information about the Snapmirror status. n/a None
Status* Status of the Snapmirror. (0 = OK; 1 =Degraded; 2 =Failed)
1 = Warning2 = Alarm
Transfer ByteRate*
Total bytes read and written per second to theSnapmirror.
Megabytes persecond (MB/s)
None
Transfer Bytes Bytes read and written to the Snapmirror since the lastcollect.
Gigabytes (GB) None
* Parameters marked with an asterisk are used by default when visualizing the corresponding monitor instance inBPPM

96Snapmirror
BM
C P
erfo
rman
ce M
anag
er
Exp
ress
fo
r N
etA
pp F
ilers
Ver
sion
4.1
.01
SnapvaultParameters
This Application Class is only available for NetApp Filers operated in 7-mode.
Name Description Unit Default AlertConditions
Lag Amount of time since the last SnapVault transferin seconds.
seconds None
Last Snapshot Name of the snapshot that the SnapVaultrelationship is based on.
n/a None
Last TransferDuration
Duration of the last vault synchronization. seconds None
Last Transfer Size Size of the transfer for the last vaultsynchronization.
Gigabytes (GB) None
Last TransferType
Last transfer type. n/a None
MirrorTimestamp
Indicates the date when the Snapshot wassuccessfully transferred from the source to thedestination.Date format: yyyy-MM-dd HH:mm:ss
n/a None
StatusInformation
Detailed information about the SnapVault status. n/a None
Status* Status of the Snapvault. (0 = OK; 1 =Degraded; 2 =Failed)
1 = Warning2 = Alarm
Transfer ByteRate*
Total bytes read and written per second to theSnapvault.
Megabytes persecond (MB/s)
None
Transfer Bytes Bytes read and written to the Snapvault since thelast collect.
Gigabytes (GB) None
* Parameters marked with an asterisk are used by default when visualizing the corresponding monitor instance inBPPM

97 Snapvault
BM
C P
erfo
rman
ce M
anag
er
Exp
ress
fo
r N
etA
pp F
ilers
Ver
sion
4.1
.01
TemperatureParameters
Name Description Unit Default AlertConditions
StatusInformation
Detailed information about the temperature status. n/a None
Status Status of the temperature sensor. (0 = OK; 1 =Degraded; 2 =Failed)
1 = Warning2 = Alarm
TemperatureStatusInformation
Temperature Status details. n/a None
TemperatureStatus*
Status of the temperature sensor according to thetemperature thresholds settings.
(0 = OK; 1 =Degraded; 2 =Failed)
1 = Warning2 = Alarm
Temperature*
Current temperature reading in degrees Celsius. degrees Celsius (°C)
None
* Parameters marked with an asterisk are used by default when visualizing the corresponding monitor instance inBPPM

98Temperature
BM
C P
erfo
rman
ce M
anag
er
Exp
ress
fo
r N
etA
pp F
ilers
Ver
sion
4.1
.01
vFilerParameters
This Application Class is only available for NetApp Filers operated in 7-mode.
Name Description Unit Default AlertConditions
CPU Utilization Percentage CPU time used by the vFiler. Percentage(%)
None
IP Address List of IP addresses of the networking resource. n/a None
Name vFiler name. n/a None
Netmask List of netmasks. n/a None
Network ReceivedByte Rate
Bytes received per second over the network. Megabytesper second(MB/s)
None
Network ReceivedBytes
Bytes received since the last collect. Gigabytes(GB)
None
Network Sent ByteRate
Bytes sent per second over the network. Megabytesper second(MB/s)
None
Network Sent Bytes Bytes sent since the last collect. Gigabytes(GB)
None
Network TransferByte Rate
Total bytes transferred per second (sent andreceived) over the network.
Megabytesper second(MB/s)
None
Network TransferBytes
Bytes transferred since the last collect. Gigabytes(GB)
None
Operation Rate* Total number of operations per second operations/s None
Other OperationRate
Total number of other operations per second. operations/s None
Read Byte Rate Bytes read per second by the vFiler. Megabytesper second(MB/s)
None
Read Bytes Bytes read since the last collect. Gigabytes(GB)
None
Read OperationRate
Number of read operations per second. operations/s None
Status Status of the vFiler. (0 = OK; 1 =Degraded; 2= Failed)
1 = Warning2 = Alarm

99 vFiler
BM
C P
erfo
rman
ce M
anag
er
Exp
ress
fo
r N
etA
pp F
ilers
Ver
sion
4.1
.01
Name Description Unit Default AlertConditions
Status Information Detailed information about the Snapmirror status. n/a None
Transfer Byte Rate Total bytes read and written per second by thevFiler.
MB/s None
Transfer Bytes Read and written bytes to the vFiler since the lastcollect.
Gigabytes(GB)
None
Write Byte Rate Bytes written per second by the vFiler. Megabytesper second(MB/s)
None
Write Bytes Bytes written since the last collect. Gigabytes(GB)
None
Write OperationRate
Number of write operations per second. operations/s None
* Parameters marked with an asterisk are used by default when visualizing the corresponding monitor instance inBPPM
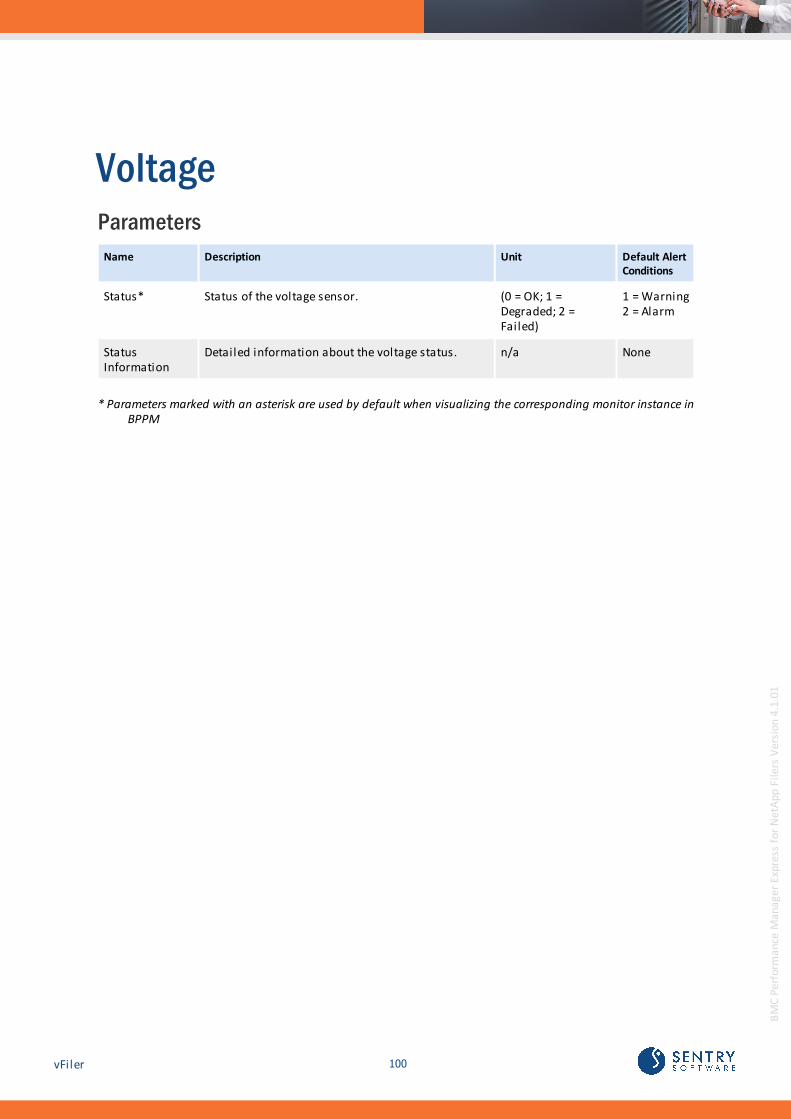
100vFiler
BM
C P
erfo
rman
ce M
anag
er
Exp
ress
fo
r N
etA
pp F
ilers
Ver
sion
4.1
.01
VoltageParameters
Name Description Unit Default AlertConditions
Status* Status of the voltage sensor. (0 = OK; 1 =Degraded; 2 =Failed)
1 = Warning2 = Alarm
StatusInformation
Detailed information about the voltage status. n/a None
* Parameters marked with an asterisk are used by default when visualizing the corresponding monitor instance inBPPM

101 Voltage
BM
C P
erfo
rman
ce M
anag
er
Exp
ress
fo
r N
etA
pp F
ilers
Ver
sion
4.1
.01
VolumeParameters
Name Description Unit Default Alert Conditions
Available CapacityPercentage
Percentage of capacity not consumedin the volume.
Percentage(%)
None
Available Capacity Total capacity not consumed in thevolume.
Gigabytes(GB)
None
Capacity Total usable capacity (in bytes) ofthe volume, excluding WAFL reserveand volume snapshot reserve.
Gigabytes(GB)
None
CIFS Operation Rate Total number of CIFS operations persecond.
operations/s None
CIFS Read Byte Rate Bytes read per second via CIFS fromthe volume.
Megabytesper second(MB/s)
None
CIFS Read Bytes Bytes read via CIFS from the volumesince the last collect.
Gigabytes(GB)
None
CIFS Read OperationRate
Number of read operations persecond.
operations/s None
CIFS Read Response Time Average response time for readoperations.
milliseconds(ms)
Warning = 30 to 100Alarm > 100
CIFS Response Time Average response time for all CIFSoperations.
milliseconds(ms)
Warning = 30 to 100Alarm > 100
CIFS Transfer Byte Rate Total bytes read and written persecond via CIFS to the volume.
Megabytesper second(MB/s)
None
CIFS Transfer Bytes Read and written bytes via CIFS tothe volume since the last collect.
Gigabytes(GB)
None
CIFS Write Byte Rate Bytes written per second via CIFS tothe volume since the last collect.
Megabytesper second(MB/s)
None
CIFS Write Bytes Bytes written via CIFS to the volumesince the last collect.
Gigabytes(GB)
None
CIFS Write OperationRate
Number of write CIFS operations persecond.
operations/s None
CIFS Write ResponseTime
Average response time for CIFS writeoperations
milliseconds(ms)
Warning = 30 to 100Alarm > 100
Compression Indicates the compression status. (0 = No; 1 =Yes)
None
Consumed CapacityPercentage
Percentage of the capacity that isactually consumed in the volume.
Percentage(%)
None

102Volume
BM
C P
erfo
rman
ce M
anag
er
Exp
ress
fo
r N
etA
pp F
ilers
Ver
sion
4.1
.01
Name Description Unit Default Alert Conditions
Consumed Capacity Number of bytes actually consumedin the volume.
Gigabytes(GB)
None
Containing Aggregate The name of the aggregate in whichthe given flexible volume resides.
n/a None
FCP Operation Rate Total number of FCP operations persecond.
operations/s None
FCP Read Byte Rate Bytes read per second via FCP fromthe volume since the last collect.
Megabytesper second(MB/s)
None
FCP Read Bytes Bytes read via FCP from the volumesince the last collect.
Gigabytes(GB)
None
FCP Read Operation Rate Number of FCP read operations persecond.
operations/s None
FCP Read Response Time Average response time for FCP readoperations.
milliseconds(ms)
Warning = 30 to 100Alarm > 100
FCP Response Time Average response time for all FCPoperations.
milliseconds(ms)
Warning = 30 to 100Alarm > 100
FCP Transfer Byte Rate Total bytes read and written persecond via FCP to the volume.
Megabytesper second(MB/s)
None
FCP Transfer Bytes Bytes read and written via FCP to thevolume since the last collect.
Gigabytes(GB)
None
FCP Write Byte Rate Bytes written per second via FCP tothe volume since the last collect.
Megabytesper second(MB/s)
None
FCP Write Bytes Bytes written via FCP to the volumesince the last collect.
Gigabytes(GB)
None
FCP Write OperationRate
Number of write FCP operations persecond.
operations/s None
FCP Write Response Time Average response time for FCP writeoperations.
milliseconds(ms)
Warning = 30 to 100Alarm > 100
FlexCache Read Byte Rate Bytes read per second from theFlexCache since the last collect.
Megabytesper second(MB/s)
None
FlexCache Write ByteRate
Bytes written per second to theFlexCache since the last collect.
Megabytesper second(MB/s)
None
Inodes Used Number of user-visible files (inodes)used. If the volume is restricted oroffline, a value 0 returned.
inodes None
Is Consistent Indicates whether or not there isknown inconsistency in theassociated file system.
(0 = No; 1 =Yes)
None

103 Volume
BM
C P
erfo
rman
ce M
anag
er
Exp
ress
fo
r N
etA
pp F
ilers
Ver
sion
4.1
.01
Name Description Unit Default Alert Conditions
Is Snaplock Indicates whether or not this is aSnapLock volume.
(0 = No; 1 =Yes)
None
iSCSI Operation Rate Total number of block protocoloperations per second.
operations/s None
iSCSI Read Byte Rate Bytes read per second via blockprotocol from the volume since thelast collect.
Megabytesper second(MB/s)
None
iSCSI Read Bytes Bytes read via iSCSI from the volumesince the last collect.
Gigabytes(GB)
None
iSCSI Read OperationRate
Number of block protocol readoperations per second.
operations/s None
iSCSI Read ResponseTime
Average response time for blockprotocol read operations.
milliseconds(ms)
Warning = 30 to 100Alarm > 100
iSCSI Response Time Average response time for all blockprotocol operations.
milliseconds(ms)
Warning = 30 to 100Alarm > 100
iSCSI Transfer Byte Rate Total bytes read and written persecond via iSCSI to the volume.
Megabytesper second(MB/s)
None
iSCSI Transfer Bytes Bytes read and written via iSCSI tothe volume since the last collect.
Gigabytes(GB)
None
iSCSI Write Byte Rate Bytes written per second via iSCI tothe volume since the last collect.
Megabytesper second(MB/s)
None
iSCSI Write Bytes Bytes written via iSCSI to the volumesince the last collect.
Gigabytes(GB)
None
iSCSI Write OperationRate
Number of iSCI write operations persecond.
operations/s None
iSCSI Write ResponseTime
Average response time for iSCI writeoperations.
milliseconds(ms)
Warning = 30 to 100Alarm > 100
Maximum Inode Count Maximum number of user-visiblefiles (inodes).
inodes None
Mirror Status Volume's mirror status. (0 = OK; 1 =Degraded; 2 =Failed)
1 = Warning2 = Alarm
NFS Operation Rate Total number of NFS operations persecond.
operations/s None
NFS Read Byte Rate Bytes read per second via NFS fromthe volume since the last collect.
Megabytesper second(MB/s)
None
NFS Read Bytes Bytes read via NFS from the volumesince the last collect.
Gigabytes(GB)
None
NFS Read Operation Rate Number of NFS read operations persecond.
operations/s None

104Volume
BM
C P
erfo
rman
ce M
anag
er
Exp
ress
fo
r N
etA
pp F
ilers
Ver
sion
4.1
.01
Name Description Unit Default Alert Conditions
NFS Read Response Time Average response time for NFS readoperations.
milliseconds(ms)
Warning = 30 to 100Alarm > 100
NFS Response Time Average response time for all NFSoperations.
milliseconds(ms)
Warning = 30 to 100Alarm > 100
NFS Transfer Byte Rate Total bytes read and written persecond via NFS to the volume.
Megabytesper second(MB/s)
None
NFS Transfer Bytes Read and written bytes via NFS to thevolume since the last collect.
Gigabytes(GB)
None
NFS Write Byte Rate Bytes written per second via NFS tothe volume since the last collect.
Megabytesper second(MB/s)
None
NFS Write Bytes Bytes written via NFS to the volumesince the last collect.
Gigabytes(GB)
None
NFS Write OperationRate
Number of write NFS operations persecond.
operations/s None
NFS Write Response Time Average response time for NFS writeoperations.
milliseconds(ms)
Warning = 30 to 100Alarm > 100
Operation Rate Total number of operations persecond.
operations/s None
Owning vFiler Name of the vFiler which owns thisvolume.
n/a None
Quota Status Quota state and percent initialized.100% means that quotas are on, 0%means quotas are off, and anywherein between means that quotas areinitializing.
n/a None
Read Byte Rate Bytes read per second from thevolume since the last collect.
Megabytesper second(MB/s)
None
Read Bytes Bytes read from the volume since thelast collect.
Gigabytes(GB)
None
Read Operation Rate Number of read operations persecond.
operations/s None
Read Response Time Average response time for readoperations.
milliseconds(ms)
Warning = 30 to 100Alarm > 100
Response Time* Average response time for alloperations.
milliseconds(ms)
Warning = 30 to 100Alarm > 100
SAN Operation Rate Total number of SAN operations persecond
operations/s None
SAN Read Byte Rate Bytes read per second from the SANsince the last collect.
Megabytesper second(MB/s)
None

105 Volume
BM
C P
erfo
rman
ce M
anag
er
Exp
ress
fo
r N
etA
pp F
ilers
Ver
sion
4.1
.01
Name Description Unit Default Alert Conditions
SAN Read Bytes Bytes read via SAN from the volumesince the last collect.
Gigabytes(GB)
None
SAN Read Operation Rate Number of SAN read operations persecond.
operations/s None
SAN Read Response Time Average response time for SAN readoperations.
milliseconds(ms)
Warning = 30 to 100Alarm > 100
SAN Response Time Average response time for all SANoperations.
milliseconds(ms)
Warning = 30 to 100Alarm > 100
SAN Transfer Byte Rate Total bytes read and written persecond via SAN to the volume.
Megabytesper second(MB/s)
None
SAN Transfer Bytes Read and written bytes via SAN to thevolume since the last collect.
Gigabytes(GB)
None
SAN Write Byte Rate Bytes written per second via SAN tothe volume since the last collect.
Megabytesper second(MB/s)
None
SAN Write Bytes Bytes written via SAN to the volumesince the last collect.
Gigabytes(GB)
None
SAN Write OperationRate
Number of SAN write operations persecond.
operations/s None
SAN Write ResponseTime
Average response time for SAN writeoperations.
milliseconds(ms)
Warning = 30 to 100Alarm > 100
Size Total size of the volume includingSnapshot reserve.
n/a None
Snapshot ReservedCapacity Percentage
Percentage of disk space that hasbeen set aside as reserved forsnapshot usage.
Percentage(%)
None
Status Information Detailed information about thevolume status.
n/a None
Status Status of the volume. (0 = OK; 1 =Degraded; 2 =Failed)
1 = Warning2 = Alarm
Transfer Byte Rate* Total bytes read and written persecond to the volume.
Megabytesper second(MB/s)
None
Transfer Bytes Read and written bytes to the volumesince the last collect.
Gigabytes(GB)
None
Type The type of the volume. Possiblevalues are "Flexible" or"Traditional".
n/a None
Used Inodes Percentage Percentage of user-visible files(inodes) used.
Percentage(%)
None

106Volume
BM
C P
erfo
rman
ce M
anag
er
Exp
ress
fo
r N
etA
pp F
ilers
Ver
sion
4.1
.01
Name Description Unit Default Alert Conditions
UUID Universal unique identifier (UUID)for the volume.
n/a None
Write Byte Rate Bytes written per second to thevolume since the last collect.
Megabytesper second(MB/s)
None
Write Bytes Bytes written to the volume since thelast collect.
Gigabytes(GB)
None
Write Operation Rate Number of write operations persecond.
operations/s None
Write Response Time Average response time for writeoperations.
milliseconds(ms)
Warning = 30 to 100Alarm > 100
* Parameters marked with an asterisk are used by default when visualizing the corresponding monitor instance inBPPM

107 Volume
BM
C P
erfo
rman
ce M
anag
er
Exp
ress
fo
r N
etA
pp F
ilers
Ver
sion
4.1
.01
vServerParameters
This Application Class is only available for NetApp Filers operated in cluster mode.
Name Description Unit DefaultAlertConditions
AllowedProtocols
Allowed protocols for the currentvServer.
n/a None
DisallowedProtocols
Disallowed protocols for thecurrent vServer.
n/a None
StatusInformation
Detailed information about theVirtual Server status.
n/a None
Status* Status of the vServer. (0 = OK; 1 = Degraded; 2 = Failed) 1 =Warning2 = Alarm
* Parameters marked with an asterisk are used by default when visualizing the corresponding monitor instance inBPPM

108vServer
BM
C P
erfo
rman
ce M
anag
er
Exp
ress
fo
r N
etA
pp F
ilers
Ver
sion
4.1
.01
Special Note on ApplicationCollection StatusThis Boolean parameter shows the status of the application and its ability to collect data. A valueof False means that the RSM cannot communicate with or collect information for the applicationclass on the element.

109
BM
C P
erfo
rman
ce M
anag
er
Exp
ress
fo
r N
etA
pp F
ilers
Ver
sion
4.1
.01
Index
- A -Abnormalities 39
Action
Configure 24
Detection 43, 46, 47
Inventory 50
Report 48
Verification 51Adapter
Add 32
Create 32Alarm 52
Alert conditions 52
Application Classes 31
Add 20, 24
Aggregate 46, 60
CIFS 62
Cluster 63
Controller 65
Delete 27
Disk 68
Ethernet Port 70
Fan 72
FC Port 73
Filer 75
Host Adapter 77
ISCSI 79
ISCSI Port 80
LUN 81
NDMP 83
NFS 84
Node 85
NVRAM 88
Plex 89
Power Supply 90
Processor 91
Qtree 92
Remove 28
Shelf 93
SIS Volume 94
Snapmirror 95
Snapvault 96
Temperature 97
vFiler 98
Voltage 100
Volume 46, 47, 101
vServer 107
- B -Baselines
BMC ProactiveNet Performance Management 39
Generation 39
Manage 39
Requirements 39BMC
ProactiveNet Performance Management 32BMC ProactiveNet Performance Management
Abnormalities 39
Baselines 39
Key Performance Indicators 39
KPI 39
- C -Category 20
Changes and Improvements 7
Chart
Customize 46, 51Collection Status 63, 75
Collection Status Information 63, 75
Connectivity
Issues 58Credentials 24
- D -Data
Received 55
Transmitted 55Debug Mode
Enable 56
List 56Devices
Controller 43
Processor 43Disable
LUNs Monitoring 56

110
BM
C P
erfo
rman
ce M
anag
er
Exp
ress
fo
r N
etA
pp F
ilers
Ver
sion
4.1
.01
Disable
Volumes Monitoring 56
- E -Element Profiles
Properties 20Ethernet/Fiber Port
Report 45
Traffic 45
- F -Files
.par 18Fixed Issues 7
- G -Generate
Baselines 39Getting Started 14
- H -How it works 16
- I -Install / Un-install 24
Add 20
BMC Performance Manager for NetApp Filers 18, 20
Delete 27, 28
Introduction 18
Remove 27, 28
Upload 18Integration Service Agent 32
Introduction 42
Issues
Aggregate Space Utilization 48
Bottleneck 43, 47
Connectivity 58
Full File Systems 47
Inode Shortages 46
LUN activity 51
Overload 43
Troubleshooting 58
Unused LUN 50
- K -Key Performance Indicators
BMC ProactiveNet Performance Management 39
Manage 39KPI
BMC ProactiveNet Performance Management 39
Manage 39
- L -LUNs 51
Disable Monitoring 56
- M -Manage
Baselines 39
Key Performance Indicators 39
KPI 39Monitor Type 32
- N -NetApp Filers Express Level 16
- O -Operating Systems
Linux 16
UNIX 16
Windows 16Overview 9
- P -Package 16
Parameters
Active Processors 65, 85
Administrative Status 62
Administrative Status Information 62

111
BM
C P
erfo
rman
ce M
anag
er
Exp
ress
fo
r N
etA
pp F
ilers
Ver
sion
4.1
.01
Parameters
Aggregate 68
Aggregates 48
Allowed Protocols 107
Application Collection Status 108
Authentication Type 62
Available Capac 101
Available Capacity 47, 60
Available Capacity Percentage 47, 48, 60,101
Bandwidth 77
Bandwidth Utilization 73
Bay 68
Block Size 81
Capacity 60, 68, 101
Channel 93
Checksum Enabled 60
CIFS Operation Rate 63, 65, 75, 85, 92,101
CIFS Read Byte Rate 101
CIFS Read Bytes 101
CIFS Read Operation Rate 101
CIFS Read Response Time 101
CIFS Response Time 101
CIFS Transfer Byte Rate 101
CIFS Transfer Bytes 101
CIFS Write Byte Rate 101
CIFS Write Bytes 101
CIFS Write Operation Rate 101
CIFS Write Response Time 101
Collisions Packet Rate 70
Compression 101
Configured Speed 73
Connected Initiators Count 73
Consumed Capacity 60, 81, 101
Consumed Capacity Percentage 60, 101
Containing Aggregate 101
CPU Utilization 98
CRC Error Rate 73
Dense Files 94
Disallowed Protocols 107
Discarded Frame Rate 73
Disk Count 60
Disk Read Byte Rate 65, 85
Disk Read Bytes 65, 85
Disk Transfer Byte Rate 63, 65, 75, 85
Disk Transfer Bytes 63, 65, 75, 85
Disk Write Byte Rate 65, 85
Disk Write Bytes 65, 85
Enabled 77, 79, 84
Error Percentage 79
Established Connection 73
FCP Operation Rate 63, 65, 75, 85, 101
FCP Protocol Error Rate 73
FCP Read Byte Rate 101
FCP Read Bytes 101
FCP Read Operation Rate 101
FCP Read Response Time 101
FCP Response Time 101
FCP Transfer Byte Rate 101
FCP Transfer Bytes 101
FCP Write Byte Rate 101
FCP Write Bytes 101
FCP Write Operation Rate 101
FCP Write Response Time 101
File System 48
Firmware Release 91
Firmware Revision 73, 77
Flex Cache Read Byte Rate 101
Flex Cache Write Byte Rate 101
FQDN 63, 75
Hardware Description 73
Hardware Revision 77
Host Address 65
Host ID 65
Hostname 65
HTTP Operation Rate 63, 65, 75, 85
Inactive Licenses 63, 75
Inbound Bandwidth Utilization 73
Initiator Groups 81
Inodes Used 101
IP Address 98
IP Addresses 80
Is Consistent 101
Is Snaplock 101
iSCSI Operation Rate 63, 65, 75, 85, 101
iSCSI Read Byte Rate 101
iSCSI Read Bytes 101
iSCSI Read Operation Rate 101
iSCSI Read Response Time 101
iSCSI Response Time 101
iSCSI Transfer Byte Rate 101
iSCSI Transfer Bytes 101
iSCSI Write Bytes 101
iSCSI Write Operation Rate 101
iSCSI Write Response Time 101
Lag 95, 96
Last Operation Size 94

112
BM
C P
erfo
rman
ce M
anag
er
Exp
ress
fo
r N
etA
pp F
ilers
Ver
sion
4.1
.01
Parameters
Last Snapshot 95, 96
Last Transfer Duration 95, 96
Last Transfer Size 95, 96
Last Transfer Type 95, 96
Link Speed 73
Link Status 70, 73
LUNs 50
Mapped 50, 81
Maximum Inode Count 101
Memory Size 65, 85
Mirror Status 60, 101
Mirror Timestamp 95, 96
MirrorStatus 101
Model 65, 68, 77, 85
Module 93
Multi Protocol Type 81
Multicast Received Packet Rate 70
Multicast Sent Packet Rate 70
Multicast Transfer Packet Rate 70
Name 98
Netmask 98
Network Received Byte Rate 85, 98
Network Received Bytes 65, 85, 98
Network Sent Byte Rate 65, 85, 98
Network Sent Bytes 65, 85, 98
Network Transfer Byte Rate 63, 65, 75, 85,98
Network Transfer Bytes 63, 65, 75, 85, 98
NFS Operation Rate 63, 65, 75, 85, 92, 101
NFS Read Byte Rate 101
NFS Read Bytes 101
NFS Read Operation Rate 101
NFS Read Response Time 101
NFS Response Time 101
NFS Transfer Byte Rate 101
NFS Transfer Bytes 101
NFS Write Byte Rate 101
NFS Write Bytes 101
NFS Write Operation Rate 101
NFS Write Response Time 101
Node Name 70
Number Of Files Too Small 94
Number of Processors 65, 85
Online 81
Opened Sessions 83
Operation Rate 60, 62, 63, 65, 68, 73, 75,77, 79, 80, 81, 84, 85, 88, 92, 98, 101
Oplocks Enabled 92
Other Operation Rate 73, 81, 92, 98
Outbound Bandwidth Utilization 73
Owning vFiler 101
Packet Size 73
Parent Host 60
Part Number 91
Partner System Name 65
Physical Size 68
Plex 68
Pool 68
Port 68
Port Address 73
Port Count 63, 75
Portal Group IDs 80
Ports 80
Power Consumption 63, 75
Present 65, 68, 70, 72, 73, 77, 85, 90, 91,93
Processor Type 91
Processor Utilization 43, 65, 85, 91
Progression 94
Quota Status 101
RAID Group 68
RAID Size 60
RAID State 68
RAID Type 68
Read Byte Rate 51, 77, 79, 81, 98, 101
Read Bytes 77, 79, 81, 98, 101
Read Only 81
Read Operation Rate 60, 62, 65, 68, 73,77, 79, 80, 81, 84, 85, 101
Read Response Time 62, 65, 68, 79, 80,84, 85, 101
Received Byte Rate 70, 73
Received Bytes 70, 73
Received Error Rate 70
Received Packet Dropped Rate 70
Received Packet Rate 70
Redundant 77
Response Time 62, 65, 68, 79, 80, 81, 84,85, 88, 101
Revision 73, 91
SAN Operation Rate 101
SAN Read Byte Rate 101
SAN Read Bytes 101
SAN Read Operation Rate 101
SAN Read Response Time 101
SAN Response Time 101
SAN Transfer Byte Rate 101

113
BM
C P
erfo
rman
ce M
anag
er
Exp
ress
fo
r N
etA
pp F
ilers
Ver
sion
4.1
.01
Parameters
SAN Transfer Bytes 101
SAN Write Byte Rate 101
SAN Write Bytes 101
SAN Write Operation Rate 101
SAN Write Response Time 101
Saved Space Percentage 94
Schedule 94
SCSI Write Byte Rate 101
Security Style 62, 92
Sent Byte Rate 70, 73
Sent Bytes 70, 73
Sent Error Rate 70
Sent Packet Rate 70
Serial Number 65, 68, 81, 85, 90, 91
Shared Saved Blocks 94
Shelf 68
SIS Duration 94
Size 81, 101
Snaplock 60
Snapshot Reserved Capacity Percentage 101
Space Condition Limitation Count 94
Space Reservation Status 60, 81
Spare Disk Count 63, 75
Speed 68, 72
Speed Capabilities 73
StandBy 73
Status 52, 60, 62, 68, 72, 73, 80, 89, 90,93, 94, 95, 96, 97, 98, 100, 101, 107
Status Information 60, 62, 68, 72, 73, 80,89, 90, 93, 94, 95, 96, 97, 98, 100, 101, 107
Synchronized 89
System ID 85
System Revision 65, 85
Temperature 97
Temperature Status 97
Temperature Status Information 97
Time Since Last Activity 81
Total Files 60
Transfer Byte Rate 70, 73, 77, 79, 81, 88,95, 96, 98, 101
Transfer Bytes 70, 73, 77, 79, 81, 88, 95,96, 98, 101
Transfer Error Rate 70
Transfer Packet Rate 70
Type 60, 68, 73, 77, 92, 93, 101
UID 93
Uptime 85
Used 77
Used Files 60
Used Inodes Percentage 46, 101
UUID 101
Vendor 65, 68, 85
Volume Count 60
Write Byte Rate 51, 77, 79, 81, 101
Write Bytes 77, 79, 81, 98, 101
Write Operation Rate 60, 62, 65, 68, 73,77, 79, 80, 81, 84, 85, 98, 101
Write Response Time 62, 65, 68, 79, 80,84, 85, 101
WWN 77
WWNN 73
WWPN 73Performance
Degradation 47
Degradations 43Performance Manager 9, 18
Platforms 12
Windows 14Portal level 16
Properties
Collection interval 20
Credentials 20
Debug Mode 20
Disable LUNs Monitoring 20
Disable Volumes Monitoring 20
Element 24
Hostname 20
IP Address 20
Missing Device Detection 20
Partner Hostname 20
Port 20
Transport Protocol 20
- R -Reference Guide
Introduction 60Release Notes 7
Remote Service Monitor 14
Reporting 55
Ethernet/Fiber Port Traffic 45Requirements 14
RSM 14

114
BM
C P
erfo
rman
ce M
anag
er
Exp
ress
fo
r N
etA
pp F
ilers
Ver
sion
4.1
.01
- S -Storage 20
Support
Debug Mode 56
- T -Threshold 20, 24, 43
Edit 52
Setting 52Troubleshooting
Connectivity Issues 58
- V -Volumes
Disable Monitoring 56
- W -Warning 52
What's new 7

About Sentry Software™Sentry Software, a strategic Technology Alliance Partner of BMC Software, providescomprehensive multi-platform monitoring solutions that enable management of thehardware and software aspects of all servers and SANs and covering up to 100 % ofcustom applications within the BMC ProactiveNet Performance Managementenvironment. Sentry Software also develops adapters for BMC Atrium Orchestrator thatenables IT administrators to automate the execution of common requests and tasks thatoccur in the daily course of IT operations. Combined with BMC’s servers and networkautomation tools, the adapters allow IT administrators to implement provisioning anddecommissioning workflows that cover all layers of their IT infrastructure. Finally, SentrySoftware designs connectors that bring storage capacity metrics into BMC TrueSightCapacity Optimization to ensure IT administrators that their storage infrastructure isproperly sized for their current and future needs.
Like us on Facebook:facebook.com/sentrysoftware
Follow us on Twitter:
twitter.com/sentrysoftware
LEARN MORE
To learn more about our solutions, please visit :www.sentrysoftware.com/solutions
© BMC Software, Inc. All rights reserved.
ABOUT MARKETZONE DIRECT PRODUCTS
The BMC MarketZone Directprogram sells and supportsthird-party products thatcomplement and/or augment BMCsolutions. MarketZone Directproducts are available under BMClicense and support terms.
About BMC Software™BMC Software helps leading companies around the world put technology at the forefrontof business transformation, improving the delivery and consumption of digital services.From mainframe to cloud to mobile, BMC delivers innovative IT management solutionsthat have enabled more than 20,000 customers to leverage complex technology intoextraordinary business performance—increasing their agility and exceeding anythingthey previously thought possible. For more information about BMC Software, visit
www.bmc.com.
Bus ines s thrives when IT runs s marter,fas ter and s tronger. That’s why the mos tdemanding IT organizations in the worldrely on BMC Software acros s dis tributed,mainframe, virtual and cloudenvironments . Recognized as the leader inBus ines s Service Management, BMC offersa comprehens ive approach and unifiedplatform that helps IT organizations cutcos t , reduce ris k and drive bus ines sprofit . For the four fis cal quarters endedSeptember 30,2011, BMC revenue wasapproximately $2.2 billion.
BUSINESS RUNS ON I.T .
I.T . RUNS ON BMC SOFT WARE