Bozzetti - unimi.it · 4 Carlo Bozzetti†, Kaspar R. Daellenbach†, Christoph Hueglin‡, Paola...
35
1 Size-resolved identification, characterization and 1 quantification of primary biological organic aerosol 2 at a European rural site 3 Carlo Bozzetti † , Kaspar R. Daellenbach † , Christoph Hueglin ‡ , Paola Fermo ≠ , Jean Sciare ᴦ , 4 Anneliese Kasper-Giebl ᵹ , Yinon Mazar ᴥ , Gülcin Abbaszade ʭ , Mario El Kazzi ¤ , Raquel Gonzalez ≠ , 5 Timor Shuster-Meiseles , Mira Flasch ᵹ , Robert Wolf † , Adéla Křepelová † , Francesco 6 Canonaco † ,Jurgen Schnelle-Kreis ʭ , Jay G. Slowik † , Ralf Zimmermann ʭ,◊ , Yinon Rudich ᴥ , Urs 7 Baltensperger † , Imad El Haddad †* , and André S. H. Prévôt †* 8 † Laboratory of Atmospheric Chemistry, Paul Scherrer Institute, Villigen 5232, Switzerland 9 ‡ Swiss Federal Laboratories for Materials Science and Technology, EMPA, Dübendorf 8600, 10 Switzerland 11 ≠ Università degli Studi di Milano, Milano 20133, Italy 12 Laboratoire des Sciences du Climat et de l’Environnement, LSCE, CNRS-CEA-UVSQ, Gif- 13 sur-Yvette 91190, France 14 Institute of Chemical Technologies and Analytics, Vienna University of Technology, Wien 15 1060, Austria 16 Department of Earth and Planetary Sciences, Weizmann Institute of Science, 17 Rehovot 76100, Israel 18
Transcript of Bozzetti - unimi.it · 4 Carlo Bozzetti†, Kaspar R. Daellenbach†, Christoph Hueglin‡, Paola...

1
Size-resolved identification, characterization and 1
quantification of primary biological organic aerosol 2
at a European rural site 3
Carlo Bozzetti†, Kaspar R. Daellenbach†, Christoph Hueglin‡, Paola Fermo≠, Jean Sciareᴦ, 4
Anneliese Kasper-Gieblᵹ, Yinon Mazarᴥ, Gülcin Abbaszadeʭ, Mario El Kazzi¤, Raquel Gonzalez≠, 5
Timor Shuster-Meiseles�, Mira Flaschᵹ, Robert Wolf†, Adéla Křepelová†, Francesco 6
Canonaco†,Jurgen Schnelle-Kreisʭ, Jay G. Slowik†, Ralf Zimmermannʭ,◊, Yinon Rudichᴥ, Urs 7
Baltensperger†, Imad El Haddad†*, and André S. H. Prévôt†* 8
† Laboratory of Atmospheric Chemistry, Paul Scherrer Institute, Villigen 5232, Switzerland 9
‡ Swiss Federal Laboratories for Materials Science and Technology, EMPA, Dübendorf 8600, 10
Switzerland 11
≠ Università degli Studi di Milano, Milano 20133, Italy 12
� Laboratoire des Sciences du Climat et de l’Environnement, LSCE, CNRS-CEA-UVSQ, Gif-13
sur-Yvette 91190, France 14
� Institute of Chemical Technologies and Analytics, Vienna University of Technology, Wien 15
1060, Austria 16
� Department of Earth and Planetary Sciences, Weizmann Institute of Science, 17
Rehovot 76100, Israel 18

2
� Helmholtz Zentrum München, German Research Center for Environmental Health (GmbH), 19
Joint Mass Spectrometry Centre, Cooperation Group Comprehensive Molecular Analytics, 20
85764 Neuherberg, Germany 21
¤ Electrochemistry Laboratory, Paul Scherrer Institute, Villigen 5232, Switzerland 22
◊ Analytical Chemistry & Joint Mass Spectrometry Centre, Institute of Chemistry, University of 23
Rostock, 18051 Rostock, Germany 24
E-mail: [email protected], [email protected] 25
Abstract 26
Primary biological organic aerosols (PBOA) represent a major component of the coarse 27
organic matter (OMCOARSE, aerodynamic diameter >2.5µm). Although this fraction affects human 28
health and climate, its quantification and chemical characterization currently remain elusive. We 29
present the first quantification of the entire PBOACOARSE mass and its main sources by analyzing 30
size-segregated filter samples collected during summer and winter at the rural site of Payerne 31
(Switzerland), representing a continental Europe background environment. The size-segregated 32
water soluble OM was analyzed by a newly developed offline aerosol mass spectrometric 33
technique (AMS). Collected spectra were analyzed by 3-dimensional positive matrix 34
factorization (3D-PMF), showing that PBOA represented the main OMCOARSE source during 35
summer and its contribution to PM10 was comparable to that of secondary organic aerosol. We 36
found substantial cellulose contributions to OMCOARSE, which in combination with gas 37
chromatography mass spectrometry molecular markers quantification, underlined the 38
predominance of plant debris. Quantitative polymerase chain reaction (qPCR) analysis instead 39

3
revealed that the sum of bacterial and fungal spores mass represented only a minor OMCOARSE 40
fraction (<0.1%). X-ray photoelectron spectroscopic (XPS) analysis of C and N binding energies 41
throughout the size fractions revealed an organic N increase in the PM10 compared to PM1 42
consistent with AMS observations. 43
Introduction 44
Primary biological organic aerosol (PBOA) is a major source of coarse aerosol organic matter 45
(OM). The detection of these particles has been the subject of studies for one and a half 46
centuries.1-3 Studies4 have related single PBOA components to adverse health effects,5 and 47
revealed their important role as ice and cloud condensation nuclei.6-10 Emissions of primary 48
biological particles (PBAP) are estimated to be among the largest contributors of pre-industrial 49
organic aerosols,11 therefore a precise estimate of their sources is also important for the 50
development of accurate climate models.4 Nevertheless, PBOA characterization and 51
quantification has received less attention than other types of aerosol sources and processes (e.g. 52
traffic, mineral dust, sulfate, wood combustion and secondary organic aerosol), possibly because 53
of technical limitations hindering the understanding of the sources and composition of this 54
fraction. 55
Traditional analytical techniques for the PBOA characterization include optical microscopy, 56
cultivation of specific viable bacteria, fungi and algae and fluorescence microscopy for the 57
quantification of functionalized or autoflorescent specific components.4 More recent approaches 58
are classified into molecular techniques (e.g. chemical tracers determination, nucleic acids 59
extraction and amplification), optical techniques (fluorescent and Raman spectroscopy), and non-60
optical techniques. Fluorescence techniques are of particular relevance because biological 61

4
materials contain fluorophores.12,13 Non-optical approaches include different types of mass 62
spectrometers; among these, we note the recent use of online-aerosol mass spectrometry (AMS) 63
for the study of the submicron fraction.14-16 64
Despite the vast literature focusing on the quantification of individual PBOA components, the 65
quantification of the total PBOA mass and the main processes by which this fraction enters the 66
atmosphere remains elusive. As a consequence, the International Panel on Climate Change 67
201317 reported the global terrestrial PBOA emission to range between 50 and 1000 Tg/yr, 68
highlighting the large gap in our knowledge about this fraction. Within this fraction, 28 Tg/yr 69
were estimated to comprise fungal spore emissions using arabitol and mannitol as tracers.18 The 70
use of these compounds as specific fungal spores tracers is still subject of discussion in the 71
scientific community19,20 and there is a general indispensable need for the determination of 72
PBOA concentrations and major emission processes through size-resolved field observations 73
against which the global models can be evaluated. 74
In this study, we present the first quantification of the total water-soluble PBOA (WSPBOA) 75
mass using an offline Aerodyne Time-of-Flight Aerosol Mass Spectrometer (ToF-AMS). The 76
analysis was performed on PM1, PM2.5 and PM10 (particulate matter with an aerodynamic 77
diameter < 1, 2.5 and 10 µm) filter samples collected concomitantly at the rural site of Payerne, 78
Switzerland. WSPBOA quantification was achieved by 3-dimensional positive matrix 79
factorization analysis (3D-PMF) of water soluble OA mass spectra, following the recently 80
developed methodology described by Daellenbach.21 In comparison with previous PBOA online 81
AMS observations,14-16 the filter samples water extraction step enabled accessing the 82
WSOMCOARSE fraction. For the characterization of the main PBOA sources, the dataset was 83
complemented with an unprecedented combination of measurements, including enzymatic 84

5
cellulose determination, quantification of bacterial and fungal spore DNA via quantitative 85
polymerase chain reaction (qPCR), and gas chromatography mass spectrometry analysis (GC-86
MS) of organic molecular markers. In this study, we discuss the quantification of the total PBOA 87
mass via 3D-PMF, the quantification of its major components and their possible usage as PBOA 88
tracers including bacteria and fungal spores measured via qPCR, plant debris estimate from n-89
alkanes measurements, and carbohydrates. 90
91
Material and Methods 92
Sample collection. We collected in total 87 24h-integrated aerosol samples (Batch A) on 93
quartz fiber filters at the rural background site of Payerne during June-July 2012 and January-94
February 2013. Batch A included PM1, PM2.5, and PM10 samples collected in parallel using three 95
High-Volume samplers (Digitel DA-80H equipped with PM1, PM2.5 and PM10 size-selective 96
inlets) operating at 500 L min-1. In total 45 samples were collected during summer (15 samples 97
per size fraction), and 42 during winter (14 samples per size fraction). Additionally, PM10 filters 98
were collected every fourth day throughout 2013 following the same procedure (Batch B). In the 99
following, the subscript coarse will denote for a generic aerosol component, the fraction 100
contained between 2.5 and 10 µm. 101
Aerosol characterization. An overview of the auxiliary analytical measurements can be 102
found in Table 1, Table S2, and in the Supplementary Information (SI). In this section only 103
offline-AMS, qPCR, and x-ray photoelectron spectroscopy (XPS) will be discussed in details. 104
Table 1. Supporting measurements 105
Measured variable Batch A Batch B

6
PM Gravimetry All filters -
WSOM mass spectral fingerprint Offline-AMS21 All filters All filters
EC/OC
Thermal Optical Transmittance using a Sunset Lab Analyzer22
(EUSAAR2)23
All filters -
ions Ion Chromatography24 All filters -
WSOC
Water extraction Thermal Decomposition ND-IR
determination using TOC analyzer (SI)
All filters -
Cellulose
Cellulose enzymatic conversion to D-glucose
and photometric determination25
32 filters (9 summer PM10 filters, 4 winter PM10, 5 summer
PM2.5, 9 summer PM1, and 5 summer PM1)
-
molecular markers (Table S2)
In-Situ Derivatization Thermal Desorption Gas
Chromatography Time-of-Flight Mass Spectrometry
(IDTD-GC-MS)26
40 samples (15 summer PM1, 15 summer PM10, 5
winter PM1, 5 winter PM10)
-
C1s, N1s Binding energies
X-Ray Photoelectron Spectroscopy
6 samples (3 summer PM10, 3 summer PM1)
-
bacterial and fungal spore DNA
Quantitative Polymerase Chain Reaction genetic
analysis27,28
58 samples (all summer PM1, PM2.5, and PM10, all winter
PM1 and PM10)
-
Carbohydrates (Table S2)
IC coupled to a Pulsed Amperometric Detector
(IC-PAD)29 All samples -
106
Offline-AMS. The Offline-AMS analysis entails an extraction of two 16 mm diameter punches 107
per sample in 10 mL of ultrapure water (18.2 MΩcm, Total Organic Carbon < 5 ppb) via ultra-108
sonication for 20 min at 30°C. Liquid extracts were subsequently homogenized for 40 s using a 109

7
vortex mixer and then filtered through 0.45 µm nylon membrane syringe filters. Filtered extracts 110
were aerosolized and the generated particles were dried using a silica gel diffusion drier before 111
measurement by HR-ToF-AMS.30 On average 10 mass spectra (60 s each) of the bulk WSOM 112
were collected per extract. Before each sample measurement, 5 blank mass spectra were 113
collected by nebulizing ultrapure water, and their average was subtracted from the corresponding 114
individual sample mass spectra. The signal of field blank samples measured following the same 115
procedure was statistically not different from the ultrapure water mass spectra. 116
XPS. XPS analysis enabled monitoring the binding energies (BE) of C, S and N, providing 117
insight into their oxidation state (typically higher BE are related to higher oxidation numbers), 118
and thereby quantifying the organic N (Norg) mass through the size fractions. The same analysis 119
was conducted on 3 field blanks and on N-containing surrogate standards deposited on blank 120
quartz fiber filters. Tested standards included NaNO3 and (NH4)2SO4 for the characterization of 121
the most abundant forms of inorganic N, while horseradish peroxidase and chloroperoxidase 122
from caldariomyces fumago were used as surrogates for amine and amide containing proteins in 123
PBOA. Signal identification and integration proceeded as follows. The obtained spectra were 124
first aligned with a two-point BE calibration using the Si2p and the O1s peaks deriving from the 125
quartz fiber filters as reference points. We estimated an energy accuracy of 0.3 eV, and an 126
average fitting error of 1.4% by fitting the signals of replicate measurements of standard 127
compounds and blanks and assuming a single Gaussian peak for each atom,. These parameters 128
were then used for the fitting of the blank-subtracted C1s, and N1s signals in environmental 129
samples, which consisted of several peaks from different chemical components. The number of 130
these peaks was determined such that fitting residuals (fraction of signal) equaled the fitting 131
errors determined from the fitting of single compounds. The N1s peak widths were constrained to 132

8
be equal to the one derived from (NH4)2SO4 standard, while the C1s peak width was determined 133
from blank filters. From the analysis of standard (NH4)2SO4 we derived an average N1s/S2p ratio 134
of 0.80±0.02, which was used to estimate the N1s contribution from (NH4)2SO4 (N!"(!"!)!!!!). 135
This contribution was fixed in proportion of that of S2p using the aforementioned N1s/S2p ratio 136
and N1s peak width. This estimate neglected the contribution from organic or non-(NH4)2SO4 137
sulfate. The uncertainty on the N!"(!"!)!!!! area was estimated based on the integration of the 138
S2p peak. N1s fitting sensitivity analysis was performed by varying the N!"(!"!)!!!! peak position 139
and area within our uncertainties. Only fittings of N!"(!"!)!!!!with residuals lower than our 140
errors were retained. 141
qPCR. We performed a qPCR analysis in order to quantify total bacterial and fungal spore DNA. 142
DNA extraction was conducted following the procedure presented in the SI and specific 143
universal primers (Table S3) were selected for total DNA quantification of bacterial and fungal 144
spores. The extracted DNA was amplified using the qPCR technique described in Lang-145
Yona.27,28 The total number of bacterial cells and fungal spores was estimated assuming a DNA 146
content of 4.74·10-3 pg per bacterial cell and 3·10-2 pg per fungal spore respectively, based on the 147
Escherichia coli and Aspergillus fumigatus genome lengths (4,639,221 bp and 29,384,958 bp, 148
respectively).31 Total bacterial mass was estimated for PM1 and PM10 samples assuming as a 149
reference the dry and wet E. coli cell weights (3·10-13 and 1·10-12 g, respectively),32 while total 150
fungal spores mass was based on the A. fumigatus spore weight of 2.9·10-12 g.33 151
152
3D-‐PMF 153
OA mass spectra collected by offline-AMS were analyzed using 3D-PMF to apportion the time-154
dependent size-segregated (PM1, PM2.5, PM10) contributions of the water soluble organic 155
9
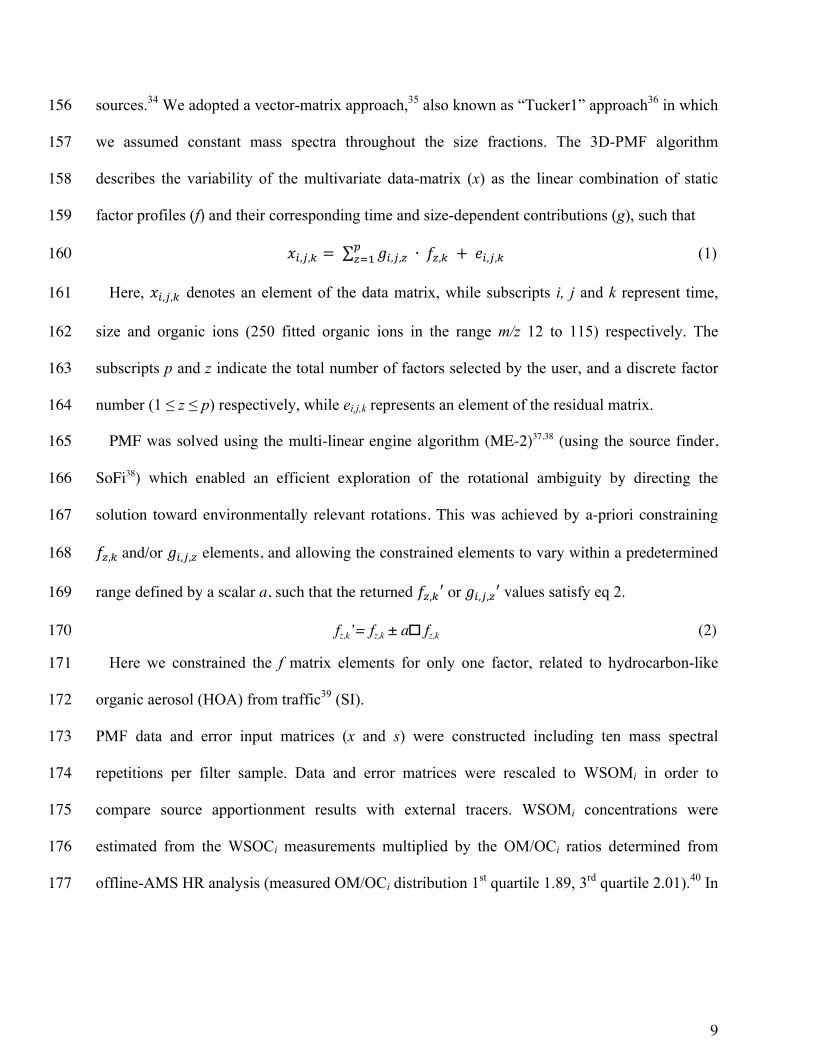
sources.34 We adopted a vector-matrix approach,35 also known as “Tucker1” approach36 in which 156
we assumed constant mass spectra throughout the size fractions. The 3D-PMF algorithm 157
describes the variability of the multivariate data-matrix (x) as the linear combination of static 158
factor profiles (f) and their corresponding time and size-dependent contributions (g), such that 159
𝑥!,!,! = 𝑔!,!,! ∙ 𝑓!,! + 𝑒!,!,!!!!! (1) 160
Here, 𝑥!,!,! denotes an element of the data matrix, while subscripts i, j and k represent time, 161
size and organic ions (250 fitted organic ions in the range m/z 12 to 115) respectively. The 162
subscripts p and z indicate the total number of factors selected by the user, and a discrete factor 163
number (1 ≤ z ≤ p) respectively, while ei,j,k represents an element of the residual matrix. 164
PMF was solved using the multi-linear engine algorithm (ME-2)37,38 (using the source finder, 165
SoFi38) which enabled an efficient exploration of the rotational ambiguity by directing the 166
solution toward environmentally relevant rotations. This was achieved by a-priori constraining 167
𝑓!,! and/or 𝑔!,!,! elements, and allowing the constrained elements to vary within a predetermined 168
range defined by a scalar a, such that the returned 𝑓!,!′ or 𝑔!,!,!′ values satisfy eq 2. 169
fz,k’= fz,k ± a� fz,k (2) 170
Here we constrained the f matrix elements for only one factor, related to hydrocarbon-like 171
organic aerosol (HOA) from traffic39 (SI). 172
PMF data and error input matrices (x and s) were constructed including ten mass spectral 173
repetitions per filter sample. Data and error matrices were rescaled to WSOMi in order to 174
compare source apportionment results with external tracers. WSOMi concentrations were 175
estimated from the WSOCi measurements multiplied by the OM/OCi ratios determined from 176
offline-AMS HR analysis (measured OM/OCi distribution 1st quartile 1.89, 3rd quartile 2.01).40 In 177

10
total, the 3D-PMF input matrices comprised 87 samples corresponding to 29 filters per size 178
fractions. 179
The error matrix elements si,j,k were determined according to eq 3 by propagating the blank 180
standard deviation σi,j,k and the signal error �i,j,k accounting for electronic noise, ion-to-ion 181
variability at the detector, and ion counting statistics.41,42 182
𝑠!,!,! = �!,!,!! + �!,!,!
! (3) 183
The optimization of the 3D-PMF results is thoroughly presented in the SI. Briefly, to improve 184
the factor separation we up-weighted selected variables dividing their corresponding 185
uncertainties by a scalar c (>1).43 The sensitivity of model outputs to c and a-values was assessed 186
and only solutions matching selected criteria were retained (SI). The variability of the results 187
amongst the selected solutions was considered our best estimate of model errors. 188
PMF factor contributions to total OM were estimated after PMF analysis as: 189
ZOAi = !"#$%!!!
(4) 190
Here, [WSZOA] and [ZOA] denote for a generic Z source the concentration of the ambient water 191
soluble organic aerosol and the total organic aerosol respectively, while Rz indicates the recovery 192
efficiency for that source. In total, 5 OA factors were separated including HOA, summer 193
oxygenated OA (S-OOA), winter oxygenated OA (W-OOA), biomass burning OA (BBOA), and 194
primary biological OA (PBOA). The Rz,med determined by Daellenbach21 were applied to all 195
factors except for PBOA, whose recovery was not previously estimated. Accordingly, we shall 196
report hereafter the concentration of WSPBOA and estimate the PBOA water solubility. 197
Source apportionment errors (σS.A.,Z,i) were estimated according to eq 5, which accounts for RZ 198
and rotational uncertainty (σPMF,RZ,i), measurement repeatability (σREP,i), and WSOM uncertainty 199
(σWSOC,i). 200

11
𝜎!.!.,!,! = 𝜎!"#,!",!! + 𝜎!"#,!,!! + 𝑓!,!! ∙ 𝜎!"#$,!! (5) 201
Here fZ denotes the relative contribution of the generic factor Z to WSOM. σWSOM,i includes 202
WSOC blank variability and measurement repeatability. The σPMF,RZ,i term includes the 203
variability of the rescaled PMF solutions and represents our best estimate of recovery errors and 204
rotational ambiguity. The σREP,Z,i term was considered as our best estimate of experimental 205
repeatability/errors and represents the variability of PMF results for the measurements 206
repetitions. 207
208
Results and Discussion 209
PM major components 210
A complete overview of the size-segregated chemical composition of winter and summer PM 211
components is presented in Figure 1a. In the following, average and median values are indicated 212
with the subscripts avg and med, respectively. 213
214

12
Figure 1. 1a) Seasonal PM chemical composition of the different size fractions. The OMi 215 estimate was calculated from OCi measurements multiplied by the corresponding OM/OCi
216 retrieved from offline-AMS HR analysis. 1b) Average seasonal aerosol sources contributions to 217 OM in the different size fractions. White are consistent with our estimate of the water insoluble 218 PBOA fractions (Figure S8). Cellulose in particular represents the 82%avg of water insoluble 219 OMCOARSE. 220 1c) Summer OMCOARSE major components. 1d) WSPBOA high resolution AMS mass spectrum. 221
222
OM represented a major component of PM during summer and winter. While during winter 223
large part of the OM10 (87%) was comprised in the PM2.5 fraction, during summer this fraction 224
represented only 58%. In contrast, during summer secondary inorganic species (SO42-, NH4
+, and 225
NO3-) did not manifest a comparable increase in PMCOARSE (85% of the mass comprised in the 226
PM2.5 fraction) suggesting a small contribution of additional secondary aerosols in the coarse 227
fraction. Overall OMCOARSE accounted for 3 µg m-3avg during summer, and as will be shown in 228
the following, large part of this fraction constituted of PBOA (Figure S13). 229
Similarly to OM, dust likely from resuspension44 was enhanced in the coarse fraction 230
especially during summer. The upper limit for the inorganic dustCOARSE concentration was 231
estimated as the difference between inorganic PM10 and inorganic PM2.5 (PMCOARSE,inorg), and 232
accounted for 31%avg during summer and 5%avg during winter, although this estimate can include 233
small sea salt contributions (SI). The obtained (Ca2+/PM)COARSE,inorg value of 4.2%med (1st quartile 234
3.2%, 3rd quartile 7.7%) was consistent with the ratios reported by Chow45 for 20 different dust 235
profiles (3.5±0.5%), and with values reported by Amato in Zürich.46 As a comparison, the total 236
OMCOARSE concentration represented 36%avg of PMCOARSE (8.4 µg m-3), compared to the 62%avg 237
for dustCOARSE,inorg. 238
239
Size resolved OA source apportionment 240

13
In this section we present the validation of the 3D-PMF factors (HOA, BBOA, W-OOA, S-OOA, 241
and WSPBOA) which enabled the quantification of WSPBOA. Average source apportionment 242
results are presented in Figure 1b and Figure 2. 243
244

14
Figure 2. 3D-PMF source apportionment results. 2a) Size fractional time series of PMF factors, 245 corresponding tracers, and temperature. Error bars represent source apportionment uncertainty. 246 2b) Size fractional increase (PM10/PM1) time series of PMF factors, and corresponding tracers. 247 248
3D-PMF factors were associated to aerosol sources or processes according to mass spectral 249
features, seasonal contributions, size fractional contributions, and correlation with tracers (Figure 250
2). Given the lack of widely accepted methodologies to estimate the uncertainty of PMF results, 251
in this work we considered σS.A.,k,i (Methodology section) as our source apportionment 252
uncertainty, while the statistical significance of the factor contributions for each size fraction was 253
based on our best error estimation (σS.A.,k,i, Table S4). 254
HOA and BBOA contributions represented the only anthropogenic primary sources resolved in 255
Payerne. In particular, HOA correlated with hopanes present in lubricant oils with a R=0.54 (SI). 256
This correlation is also supported by the summer (HOA/EC)med ratio (0.63med) being consistent 257
with other European studies reported by El Haddad and references therein.47 BBOA instead 258
correlated with levoglucosan produced by cellulose pyrolysis (R=0.94). A levoglucosan/BBOC 259
ratio of 0.18med was found, consistent with values reported (Huang and references therein48) for 260
ambient BBOA observations. Both HOA and BBOA showed statistically significant 261
contributions (>3σ) only in the submicron fractions. The seasonal trend of these anthropogenic 262
factors was also significantly different: while the HOA (traffic) contribution was relatively stable 263
and small across the year, BBOA showed a strong seasonality, rising from 6%avg of OM1 during 264
summer to 73%avg during winter. 265
Two OOA factors characterized by high CO2+ contributions were separated according to their 266
different seasonal trends. While W-OOA showed a strong correlation with NO3- (R=0.94), S-267
OOA showed a positive non-linear correlation with temperature, following the behavior of 268
biogenic volatile organic compounds emissions.49 The relative contribution of W-OOA to OM1 269

15
rose from 5%avg during summer to 22%avg during winter, while the S-OOA contribution to OM1 270
decreased from 59%avg during summer to 4%avg during winter. W-OOA was the only factor 271
significantly contributing (within 3σ) to OM in the size range 1-2.5 µm (48%avg of the W-OOA 272
mass in winter), while the W-OOACOARSE contribution was never statistically significant. 273
NH4NO3 behaved similarly with 31%avg of the mass in winter comprised in PM2.5-PM1. During 274
summer instead S-OOA showed a different behavior in the three size fractions: its contribution 275
was significant for PM1, but not in the size range 1-2.5 µm. The overall S-OOA2.5 fraction 276
accounted for 82±2%avg of the mass, while the remaining 18±2%avg was included in OMCOARSE. 277
Considering the sum of both OOA factors, the OOA/NH4+
med ratio for PM1 was 2.1, consistent 278
with values reported by Crippa50 for 25 different European rural stations, suggesting that Payerne 279
can be representative of typical European rural environments. 280
The last PMF factor showed an unusual size fractionation with 96%avg of its mass comprised in 281
the PMCOARSE during summer (0.54±0.02 µg m-3), corresponding to 49% of the WSOMCOARSE 282
(or 19%avg of the OMCOARSE). This factor was ascribed to water soluble primary biological 283
organic aerosol, given its striking mass spectral resemblance to biological carbohydrates and 284
plant debris extracts with high contribution from C2H4O2+, C2H5O2
+ and C3H5O2+ (Figure 1d, S3, 285
S10), its enhancement in OMCOARSE especially during summer, and its correlations with 286
biological aerosol components such as arabitol, mannitol, glucose,19,20,51,52 cellulose, total 287
bacteria, and fungal spores. The detection of such factor was unprecedented in the AMS 288
literature given the limited transmission efficiency of the AMS aerodynamic lens for the coarse 289
fraction53, although Schneider15 proposed the use of some of the PBOA fragments detected here 290
to assess the contribution of PBOA to PM1 from online AMS measurements in the Amazon. 291

16
Also during winter WSPBOA showed a smaller but still significant contribution to the 292
OMCOARSE (30% of WSOMCOARSE or 8% of OMCOARSE) with 68%avg of the mass comprised in the 293
coarse fraction. This result was corroborated by a minor but statistically significant enhancement 294
in the coarse fraction (in comparison with PM2.5) of biological carbohydrates 295
(monosaccharidesBIO: Ʃ(glucose, mannose, arabitol and mannitol)), cellulose, and fungal spores. 296
The chemical characteristics and origin of this fraction will be thoroughly discussed in the 297
following sections. 298
Composition of OMCOARSE. 299
This section presents a detailed characterization of OMCOARSE, of which 91%avg of the mass was 300
ascribed to PBOA. 301
Water soluble and insoluble OMCOARSE. Figure 1c displays the relative chemical composition of 302
OMCOARSE during summer. The major part of OMCOARSE could be ascribed to cellulose 303
(50±20%avg) and WSOMCOARSE (38%avg). Given the low cellulose water solubility, and 304
consequently its negligible contribution to WSOM, the two fractions together accounted for 305
88%avg of the OMCOARSE. Regarding the origin of the WSOMCOARSE fraction, 3D-PMF results 306
revealed that only WSPBOA and WSS-OOA contributed significantly to WSOMCOARSE during 307
summer, explaining respectively 51%avg and 49%avg of the WSOMCOARSE mass. Assuming the 308
water insoluble OMCOARSE fraction not ascribed to S-OOA to be entirely related to PBOA, we 309
calculated a RPBOA lowest estimate of 0.18med (1st quartile 0.15, 3rd quartile 0.25) according to eq 310
S2, S3 and S4. This assumption was corroborated by the high cellulose contributions to the water 311
insoluble OMCOARSE fraction (82%) and by the good correlation of WSPBOA with OMCOARSE-S-312
OOACOARSE (R=0.54), especially considering that the water insoluble OMCOARSE fraction 313
represented 62%avg of the total OMCOARSE. 314

17
Contribution of carbohydrates to PBOA and OMCOARSE. Measured carbohydrates 315
(carbohydratesmeas: Ʃ (monosaccharidesBIO, mannosan, levoglucosan, and galactosan)) 316
represented 3% of OMCOARSE (8% of WSOMCOARSE), of which 93%avg was related to 317
monosaccharidesBIO. This fraction, albeit minor, was highly correlated with PBOA (R=0.73) and 318
cellulose (R=0.85), showing a size fractionation similar to WSPBOA especially during summer 319
with 96%avg of the mass included in the OMCOARSE. A similar behavior was noted in winter, with 320
29%avg of the carbohydratesmeas,COARSE consisting of monosaccharidesBIO, suggesting a minor, but 321
statistically significant contribution of primary biological emissions, consistent with WSPBOA 322
from 3D-PMF results (figure 2). Also other biological components, such as cellulose and fungal 323
spores showed a small but significant contribution in winter (respectively 0.06 µg m-3 and 2�101 324
spores�m-3 detected on the 31st of January 2013 PM10 filter sample). However, the overall 325
correlation of single monosaccharidesBIO with each other and with other PBOA components was 326
relatively poor, indicating a high variability in the molecular composition of the carbohydrates. 327
Such variability highlighted the diversity of biological processes producing these sugars, clearly 328
hindering their use as single tracers for reliably estimating PBOA concentrations in our 329
conditions. 330
By ascribing all the monosaccharidesBIO,COARSE to WSPBOA we estimated a contribution of 331
monosaccharidesBIO to WSPBOA of 15%avg. Consistently, the WSPBOA average mass spectrum 332
(Figure 1d), similarly to BBOA, showed a typical fingerprint deriving from carbohydrate 333
fragmentation15 as evidenced by strong contributions from C2H4O2+, C2H5O2
+ and C3H5O2+ 334
fragments (Figure 1b, S3, S4, S10). We estimated that >89% of the remaining WSPBOA fraction 335
could be related to water soluble polysaccharides (after the subtraction of the 336
monosaccharidesBIO mass spectrum using D-mannitol and D-glucose as surrogates). This 337

18
estimate was based on the non-monosaccharidesBIO-WSPBOA mass spectrum, assuming 338
C2H4O2+, C2H5O2
+ and C3H5O2+ as specific carbohydrates fragmentation tracers15 (Figure S4), 339
and using amylopectin and starch (Figure S10) as surrogates for polysaccharides. This result, 340
together with the high cellulose contribution to OMCOARSE, indicated that the majority of PBOA 341
consisted of carbohydrates. 342
Part of the remaining WSPBOA fraction instead was attributed to Norg. 3D-PMF results 343
showed that WSPBOA explained great part of the variability of minor N-containing fragments 344
(C3H9N+, C3H8N+, C5H12N+), consistent with XPS observations of an increased Norg signal in 345
PMCOARSE. The WSPBOA spectrum as expected showed a higher N/C ratio (0.061) than other 346
factors. Overall both the carbohydrate signature and the increased N/C content were consistent 347
with the interpretation of our factor as WSPBOA. 348
Quantification of OM related to particulate abrasion products from leaf surfaces (OMPAPLS) 349
using n-alkanes. n-alkanes (C18-C39) measured via gas chromatography mass spectrometry 350
(IDTD-GC-MS) showed distinct signatures during the different seasons and particle sizes. While 351
during winter most of the alkane mass was contained within PM1 (90% for alkanes with an odd 352
number of C; 97% for alkanes with an even number of C), during summer only 50%avg and 353
70%avg of the odd and even alkanes were contained within PM1. The summer-time signatures 354
were consistent with Rogge’s54 observations of alkane emissions from OMPAPLS dominated by 355
odd alkanes with the highest contributions from hentriacontane (C31) followed by nonacosane 356
(C29) and tritriacontane (C33) (Figure S9). By contrast, in winter we observed a higher 357
contribution of smaller alkanes (C19-C24), without a clear odd/even predominance pattern, 358
which was consistent with winter urban observations55 possibly related to temperature-driven 359
partitioning of combustion emissions, and consistent with vehicular fuel combustion profiles.47,56 360

19
This was corroborated by a slight increase in the average HOA concentration during winter 361
compared to summer (Figure 2). We estimated the contribution of OMPAPLS by applying a 362
chemical mass balance approach (SI) using the n-alkanes/OMPAPLS ratios reported by Rogge.56,57 363
Assuming either green or dead leaves, and a possible (OM/OC)green,dead leaves range between 1.2 364
and 2.2, the total estimated range for OMPAPLS,COARSE spanned from 0.5 to 1 µg m-3avg, 365
corresponding to 16-32%avg of the OMCOARSE. This result, together with high cellulose 366
contributions, indicated that plant debris was the dominating source of OMCOARSE. 367
Fungal spores. Fungal spores measured by qPCR represented a minor component of OM. During 368
summer, their contribution was above the detection limit only in the coarse fraction, representing 369
just 0.01%avg of the OMCOARSE mass (corresponding to 0.4 ng m-3, or 2·102 spores·m-3). 370
Nevertheless, the measured fungal spore/m3 concentration during summer was consistent with 371
ranges reported in other studies.58 During winter, only one PM10 sample showed concentrations 372
above the detection limits. The summer arabitol/fungal spore (5·102 pg/sporeavg) and 373
mannitol/fungal spore (8·102 pg/sporeavg) ratios were noticeably variable and higher than those 374
reported by Bauer19 (1.2 pg arabitol/fungal spore, 1.7 pg mannitol/fungal spore), suggesting that 375
these compounds are not unique fungal spore tracers, but given the high levels of cellulose and 376
OMPAPLS could be related to plant debris, as already proposed by other studies.20 377
Bacteria. Likewise, total bacterial mass estimated by qPCR represented a minor contributor to 378
OMCOARSE. Assuming dry or wet E. coli cellular weights (SI), the total PM10 bacterial mass 379
during summer was estimated as 1.3±0.7 ng m-3avg or 4±0.2 ng m-3
avg, corresponding to 2·103 380
cells m-3avg. This is consistent with the ranges reported in other studies,58-60 especially 381
considering that low concentrations are commonly observed at remote and rural locations.61 The 382
bacterial size fractionation seasonality was similar to the other biological components: while 383

20
69%avg of the bacterial mass was comprised between the PM10 and PM1 fraction during summer, 384
all bacterial mass (2·103 cells m-3avg) was detected in the submicron fraction during winter. 385
Surface chemical composition from XPS analysis. Another approach to look at the entire 386
aerosol is to study the chemical composition of its surface. This was performed by XPS 387
measurements, which enabled monitoring the evolution of the C1s and N1s BE throughout the 388
different size fractions and thus providing chemical information also about the water insoluble 389
fraction. Although XPS sensitivity was limited to the particle surface (7 nm thickness) and low 390
volatility compounds (XPS technique operates under high vacuum at 10-10 torr), results showed a 391
significant increase of Norg in the PMCOARSE. We resolved both an inorganic and organic N1s 392
peak, with N1s,org occurring at a lower BE (397.7±0.3 eV, Figure 3a) than that of N!"(!"!)!!!! 393
and NaNO3 (400.0±0.8 eV and 407.7±0.4 eV respectively). Likewise, tested Norg surrogates 394
(horseradish peroxidase and chloroperoxidase from caldariomyces fumago) showed the N1s peak 395
occurring at similar BE (398.7±0.3 eV) corroborating our interpretation of the Norg peak position. 396
Overall we observed a substantial increase of the Norg signal in PM10 in comparison to PM1 397
(Figure 3a) reflected by an Norg/C1s ratio increase from 0.022±0.001 in PM1 to 0.027±0.005 in 398
PM10. From the Norg/C1s ratio and from the bulk total C measurements (TC=EC+OC)Sunset, we 399
estimated the Norg,1 and Norg,10 concentrations to be 0.05±0.03 µg m-3avg and 0.13±0.01 µg m-3
avg 400
respectively. This estimate assumed Norg to follow the TC intra-particle concentration gradient. 401
While a crude assumption, this is the best and only methodology providing an estimate of the 402
Norg total mass. 403
Figure 3b displays the C1s peak fitting for a PM1 and a PM10 filter sample. We report an 404
increase of the less oxidized C1s fraction (C1s peak at lower BE) in PM10, which was qualitatively 405
consistent with the odd-alkanes size fractionation. Overall, in all size fractions, the dominant C1s 406

21
contribution did not derive from the most oxidized C1s peak (Figure 3b), but from the 407
intermediate oxidized C peak, which could be related to alcohols, ketones, and aldehydes. This 408
result, although relative only to the surface and to the less volatile fractions, seemed in 409
agreement with other studies.62 410
411
Figure 3. 3a) XPS measurements: N1s peak fitting (PM1 and PM10 sample from 04/07/2012). 3b) 412 XPS measurements: C1s peak fitting (PM1 and PM10 sample from 04/07/2012). 413
414
Yearly estimate of PBOA relative contribution to OM10 415
From 3D-PMF analysis we identified a set of AMS fragments as potential PBOA tracers (figure 416
S4). Among these fragments we selected C2H4O2+ and C2H5O2
+ to estimate the PBOA 417
contribution for the entire year 2013 (batch B) given their relatively high signal to noise, and 418
because they are commonly fitted in HR analysis. Both fragments showed a contribution 419
statistically higher than 0 within 1σ only to the BBOA, PBOA, and HOA factors. However, 420
given the low HOA concentration at the rural site (Figure 2a), and given the low contribution of 421
16000
12000
8000
4000C1s
07/
07/2
012
[cou
nts
s-1]
295290285280
Binding energy [eV]
16000
12000
8000
4000
295290285280
4800
4400
4000
3600
N1s
07/
07/2
012
[cou
nts
s-1]
405400395390
4800
4400
4000
3600
405400395390
1a)
1b)
1c)
1d)
PM1
PM10
PM1
PM10
3a) (NH4)2SO4 NaNO3 Enzymes*
XPS: 3a) and 3b)— blank subtracted signal— organic N1s fitting (fitting sensitivity)**— N1s fitting from (NH4)2SO4 (fitting sensitivity)**— C1s fitting | Reference standards* Horseradish Peroxidase and Chloroperoxidase from C. Fumago** Multiple iterations of the same fit
3b)

22
the two fragments to the HOA profile (0.02 and 0.03% respectively) we neglected the HOA 422
contribution to C2H4O2+ and C2H5O2
+. Therefore the water soluble C2H5O2+ and C2H4O2
+ 423
fractional contribution to WSOM (𝑊𝑆𝑓C2H5O2+
i and 𝑊𝑆𝑓C2H4O2+
i) could be expressed as: 424
𝑊𝑆𝑓C2H5O2+
i = 𝑓C2H5O2+
WSPBOA · !"#$%&!"#$ i + 𝑓C2H5O2
+WSBBOA ·
!"##$%!"#$ i (6) 425
𝑊𝑆𝑓C2H4O2+
i = 𝑓C2H4O2+
WSPBOA · !"#$%&!"#$ i + 𝑓C2H4O2
+WSBBOA ·
!"##$%!"#$ i (7) 426
Where 𝑓C2H5O2+
PBOA, 𝑓C2H4O2+
PBOA, 𝑓C2H5O2+
BBOA, 𝑓C2H4O2+
BBOA denote the C2H5O2+, and 427
C2H4O2+ fractional contributions to the WSPBOA and WSBBOA mass spectra. 428
(WSPBOA/WSOM)i values could be derived by solving the two linear equation system. This 429
approach will be referred to as “60/61 methodology” in the following. We assessed the accuracy 430
of the 60/61 methodology by comparing the (WSPBOA/WSOM)i values obtained from 3D-PMF 431
with the values predicted from the 60/61 methodology for the Batch A PM10 filter samples. 432
During summer the (WSPBOA/WSOM)med,3D-PMF/(WSPBOA/WSOM)med,60/61 methodology ratio was 433
0.98, while during winter 0.85. The winter discrepancy was likely due to non-negligible 434
contributions of W-OOA or other sources to fC2H4O2+ and fC2H5O2
+. However the two 435
methodologies yielded highly correlated time series (R2=0.81) and agreed within 15%, with 436
much better agreement during summer. 437
From the 60/61 methodology we estimated a WSPBOA/WSOMavg of 20% in summer, and 6% in 438
winter. Assuming a RPBOA of 0.18med (SI), the average PBOA contribution to OM10 was estimated 439
as 37%avg, with higher values during summer (60%avg vs. 19%avg in winter). 440
Overall, these results revealed that the contribution of PBOA to OM10, mainly from plant debris, 441
may be as high as SOA contribution during summer in Payerne. While Payerne can be 442
considered as representative of typical European rural environments50 and therefore results here 443
may be extended to other sites, other field observations are indeed required. This work represents 444

23
a benchmark for future field studies providing a methodology for the thorough determination of 445
PBOA mass and origin, and one of the first size-segregated datasets necessary to constrain 446
PBOA in global models. 447
448 449 Figure 4. 2013 yearly WSPBOA10 relative contribution to WSOM10 estimated from the 60/61 450 methodology (Batch B). Red boxes denote WSPBOA relative contribution (median, 1st and 3rd 451 quartiles) to WSOM10 during June-July 2012 and January-February 2013 determined by 3D-PMF 452 analysis (Batch A). The uncertainty relative to measurements repetitions and to the 453 apportionment of fC2H4O2
+ and fC2H5O2+ can be interpreted as a precision estimate, while the 454
sensitivity analysis comparing 3D-PMF and 60/61 methodology results, shows an underestimate 455 of the WSPBOA/WSOM ratio calculated with the 60/61 methodology of 2%med during summer 456 and 15%med during winter. 457 458
ASSOCIATED CONTENT 459
Supporting Information. Detailed methodology descriptions of WSOC, qPCR, XPS, and 460
IDTD-GC-ToF-MS measurements; OMPAPLS determination; source apportionment optimization. 461
This material is available free of charge via the Internet at http://pubs.acs.org. 462
25
20
15
10
5
0
Temperature [°C
]
04.0
1.20
13
21.0
3.20
13
21.0
6.20
13
21.0
9.20
13
22.1
2.20
13
40
30
20
10
0
WSP
BO
A /
WSO
M %
Average daily temperature [°C]-3D-PMF (Batch A): BOXES: WSPBOA / WSOM median, 1
st, 3
rd quartile
-60/61 method (Batch B): estimated WSPBOA/WSOM % estimated WSPBOA / WSOM % error from
f60.02 and 61.03 source apportionment uncertainty and measurements repetitions
20122013

24
AUTHOR INFORMATION 463
Corresponding Author 464
*Address: OFLA/004, 5232 Villigen PSI, Switzerland; Phone: +41 56 310 4202; e-mail: 465
[email protected]. 466
* Address: OFLB/002, 5232 Villigen PSI, Switzerland; Phone: +41 56 310 2785; e-mail: 467
[email protected]. 468
Author Contributions 469
†C.B. wrote the manuscript. †C.B. and †*I.E.H performed the data analysis and source 470
apportionment. †*A.S.H.P., †*I.E.H., †C.B. and †J.G.S. designed the experiment. †C.B. and †A.K. 471
performed the offline-AMS analysis. ≠P.F. and ≠R.G. performed WSOC measurements. �J.S. 472
measured carbohydratesmeas and EC/OC. ‡C.H. collected the samples, and measured ions and 473
EC/OC. �G.A., ʭ,◊R.Z., and �J.S.-K. performed IDTD-GC-ToF-MS measurements. �Y.R., T.S.M. 474
and �Y.M. performed qPCR measurements. ¤M.E.K., C.B. and I.E.H. performed XPS 475
measurements. �A.K.-G. and �M.F. performed cellulose measurements. All authors gave 476
approval to the final version of the manuscript. 477
Funding Sources 478
This work was supported by the Federal Office for the Environment in Switzerland 479
ACKNOWLEDGMENT 480
Carlo Bozzetti acknowledges the Lithuanian–Swiss Cooperation Programme “Research and 481
Development” project AEROLIT (Nr. CH-3-.MM-01/08). Imad El Haddad acknowledges the 482
Swiss National Science Foundation (project number IZERZ0 142146). Yinon Rudich 483

25
acknowledges support from the Israel Science Foundation, grant #913/12 and from the Dollond 484
Foundation. We acknowledge Saurer, M. and Schmid, L. for providing milled oak leaves, and 485
Goldsmith G. R. for the NCBI BLAST research. 486
REFERENCES 487
(1) Pasteur, L. Mémoire sur les corpuscles organises qui existent dans l'atmosphere. Examen 488
de la doctrine des générations spontanées. Ann. Sci. Nat. Zool. 1861, 16, 5–98. 489
(2) Carnelly, T.; Haldane, J. S.; Anderson, A. M. The carbon acid, organic matter, and micro-490
organisms in air, more especially of dwellings and schools. Philos. Transact. R. Soc. Lond. 491
B. 1887, 178, 61–111. 492
(3) Fuzzi, S.; Baltensperger, U.; Carslaw, K.; Decesari, S.; Denier van der Gon, H.; Facchini, 493
M. C.; Fowler, D.; Koren, I.; Langford, B.; Lohmann, U.; Nemitz, E.; Pandis, S.; Riipinen, 494
I.; Rudich, Y.; Schaap, M.; Slowik, J. G.; Spracklen, D. V.; Vignati, E.; Wild, 495
M.; Williams, M.; Gilardoni. S. Particulate matter, air quality and climate: lessons learned 496
and future needs. Atmos. Chem. Phys. 2015, 15, 8217-8299. 497
(4) Després, V. R.; Huffman, J. A.; Burrows, S. M; Hoose, C.; Safatov, A. S.; Buryak, G.; 498
Fröhlich-Nowoisky, J.; Elbert, W.; Andreae, M. O.; Pöschl, U.; Jaenicke, R. Primary 499
biological aerosol particles in the atmosphere: a review. Tellus B. 2012, 64, 15598. 500
(5) Douwes, J.; Thorne, P.; Pearce, N.; Heederik, D. Bioaerosol health effects and exposure 501
assessment: progress and prospects. Ann. Occup. Hyg. 2003, 47, 187–200. 502
26
(6) Hiranuma, N.; Möhler, O.; Yamashita, K.; Tajiri, T.; Saito, A.; Kiselev, A.; Hoffmann, N.; 503
Hoose, C.; Jantsch, E.; Koop, T.; Murakami M. Ice nucleation by cellulose and its 504
potential contribution to ice formation in clouds. Nature Geosci. 2015, 8, 273-277. 505
(7) Hader, J. D.; Wright, T. P.; Petters. M. D. Contribution of pollen to atmospheric ice nuclei 506
concentrations Atmos. Chem. Phys. 2014, 14, 5433-5449. 507
(8) Gurian-Sherman, D.; Lindow., S. E.; Bacterial ice nucleation: significance and molecular 508
basis. FASEB J. 1993,14, 1338-1343. 509
(9) Andreae, M. O.; Rosenfeld, D. Aerosol-cloud-precipitation interactions. Part 1. The nature 510
and sources of cloud-active aerosols. Earth Sci. Rev. 2008, 89, 13–41. 511
(10) Ariya, P. A.; Sun, J., Eltouny, N. A.; Hudson, E. D.; Hayes, C. T; Kos, G. Physical and 512
chemical characterization of bioaerosols–implications for nucleation processes. Int. Rev. 513
Phys. Chem. 2009, 28, 1–32. 514
(11) Andreae, M. O. Aerosols before pollution. Science. 2007, 315, 50-51. 515
(12) Fu, P.; Kawamura, K.; Chen, J.; Qin, M.; Ren., L.; Sun, Y.; Wang, Z.; Barrie, L. A.; 516
Tachibana, E.; Ding, A.; Yamashita, Y. Fluorescent water-soluble organic aerosol in the 517
High Arctic atmosphere. Sci. Rep. 2015, 5, 9845. 518
(13) Pöhlker, C.; Huffman, J. A.; Pöschl U. Autofluorescence of atmospheric bioaerosols - 519
fluorescent biomolecules and potential interferences. Atmos. Meas. Tech., 2012, 5, 37–71. 520
(14) Chen, Q.; Farmer, D. K.; Schneider, J.; Zorn, S. R.; Heald, C. L; Karl, T. G.; Guenther, 521
A.; Allan, J. D.; Robinson, N.; Coe, H.; Kimmel, J. R.; Pauliquevis, T.; Borrmann, S.; 522

27
Pöschl, U.; Andreae, M. O.; Artaxo, P.; Jimenez, J. L.; Martin, S. T. Mass spectral 523
characterization of submicron biogenic organic particles in the Amazon Basin. Geophys. 524
Res. Lett. 2009, 36, L20806. 525
(15) Schneider, J.; Freutel, F.; Zorn, S. R.; Chen, Q.; Farmer, D. K.; J. L. Jimenez, Martin, S. 526
T. Artaxo, P.; Wiedensohler, A.; Borrmann, S. Mass-spectrometric identification of 527
primary biological particle markers: indication for low abundance of primary biological 528
material in the pristine submicron aerosol of Amazonia. Atmos. Chem. Phys. Discuss. 529
2011, 11, 19143–19178. 530
(16) Pöschl, U., Martin, S. T., Sinha, B., Chen, Q., Gunthe, S. S.; Huffman, J. A.; Borrmann, 531
S.; Farmer, D.K.; Garland, R. M.; Helas, G.; Jimenez, J. L.; King, S. M.; Manzi, A.; 532
Mikhailov, E.; Pauliquevis, T.; Petters, M. D.; Prenni, A. J.; Roldin, P.; Rose, D.; 533
Schneider, J.; Su, H.; Zorn, S. R.; Artaxo, P.; Andreae, M. O. Rainforest aerosols as 534
biogenic nuclei of clouds and precipitation in the Amazon. Science. 2010, 329, 1513–1516. 535
(17) IPCC, 2013: Climate Change 2013: The Physical Science Basis. Contribution of Working 536
Group I to the Fifth Assessment Report of the Intergovernmental Panel on Climate Change 537
[Stocker, T.F.; Qin, D.; Plattner, G.-K.; Tignor, M.; Allen, S. K.; Boschung, J.; Nauels, A.; 538
Xia, Y.; Bex, V.; Midgley, P. M. (eds.)]. Cambridge University Press, Cambridge, United 539
Kingdom and New York, NY, USA, 1535 pp. 540
(18) Heald, C. L.; Spracklen D. V. Atmospheric budget of primary biological aerosol particles 541
from fungal spores. Geophys. Res. Lett. 2009, 36, L09806-L09806. 542
28
(19) Bauer, H.; Claeys, M.; Vermeylen, R.; Schueller, E.; Weinke, G.; Berger, A.; Puxbaum, 543
H. Arabitol and mannitol as tracers for the quantification of airborne fungal spores, Atmos. 544
Environ. 2008, 42, 588–593. 545
(20) Burshtein, N.; Lang-Yona, N.; Rudich, Y. Ergosterol, arabitol and mannitol as tracers for 546
biogenic aerosols in the eastern Mediterranean. Atmos. Chem. Phys. 2011, 11, 829–839. 547
(21) Daellenbach, K. R.; Bozzetti, C.; Krepelova, A.; Canonaco, F.; Huang, R.-J.; Wolf, R.; 548
Zotter, P.; Crippa, M.; Slowik, J.; Zhang, Y.; Szidat, S.; Baltensperger, U.; Prévôt, A. S. 549
H.; El Haddad, I. Characterization and source apportionment of organic aerosol using 550
offline aerosol mass spectrometry. Atmos. Meas. Tech. 2016, 9, 23-29. 551
(22) Birch, M. E.; Cary, R. A. Elemental carbon-based method for monitoring occupational 552
exposures to particulate diesel exhaust. Aerosol Sci. and Tech. 1996, 25, 221–241. 553
(23) Cavalli, F.; Viana, M.; Yttri, K. E.; Genberg, J.; Putaud, J. P. Toward a standardised 554
thermal-optical protocol for measuring atmospheric organic and elemental carbon: the 555
EUSAAR protocol. Atmos. Meas. Tech. 2010, 3, 79-89. 556
(24) Piazzalunga, A.; Bernardoni, V.; Fermo, P.; Vecchi, R.Optimisation of analytical 557
procedures for the quantification of ionic and carbonaceous fractions in the atmospheric 558
aerosol and applications to ambient samples.Anal Bioanal Chem. 2013, 405, 1123-32. 559
(25) Kunit, M.; Puxbaum, H. Enzymatic determination of the cellulose content of atmospheric 560
aerosols. Atmos. Environ. 1996, 30, 1233-1236. 561

29
(26) Orasche, J.; Schnelle-Kreis, J.; Abbaszade, G.; Zimmermann, R. Technical Note: In-situ 562
derivatization thermal desorption GC-TOFMS for direct analysis of particle-bound non-563
polar and polar organic species. Atmos. Chem. Phys. 2011, 11, 8977-8993. 564
(27) Lang-Yona, N.; Dannemiller, K.; Yamamoto, N.; Burshtein, N.; Peccia, J.; Yarden, O.; 565
Rudich, Y. Annual distribution of allergenic fungal spores in atmospheric particulate 566
matter in the Eastern Mediterranean; a comparative study between ergosterol and 567
quantitative PCR analysis. Atmos. Chem. Phys. 2012, 12, 2681–2690. 568
(28) Lang-Yona, N.; Lehahn, Y.; Herut, B.; Burshtein, N.; Rudich, Y. Marine aerosol as a 569
possible source for endotoxins in coastal areas. Sci. Total Environ. 2014, 499, 311–318. 570
(29) Yttri, K. E.; Schnelle-Kreis, J.; Maenhaut, W.; Abbaszade, G.; Alves, C.; Bjerke, A.; 571
Bonnier, N.; Bossi, R.; Claeys, M.; Dye, C.; Evtyugina, M.; García-Gacio, D.; Hillamo, R.; 572
Hoffer, A.; Hyder, M.; Iinuma, Y.; Jaffrezo, J.-L.; Kasper-Giebl, A.; Kiss, G.; López-573
Mahia, P. L.; Pio, C.; Piot, C.; Ramirez-Santa-Cruz, C.; Sciare, J.; Teinilä, K.; 574
Vermeylen, R.; Vicente, A.; Zimmermann, R. An intercomparison study of analytical 575
methods used for quantification of levoglucosan in ambient aerosol filter samples, Atmos. 576
Meas. Tech., 2015, 8, 125-147. 577
(30) DeCarlo, P. F.; Kimmel, J. R.; Trimborn, A.; Northway, M. J.; Jayne, J. T.; Aiken, A. C.; 578
Gonin, M.; Fuhrer, K.; Horvath, T.; Docherty, K. S.; Worsnop, D. R.; Jimenez, J. L. Field-579
deployable, high-resolution, time-of-flight aerosol mass spectrometer. Anal. Chem. 2006, 580
78, 8281–8289. 581

30
(31) Hospodsky, D.; Yamamoto, N.; Peccia, J.; Accuracy, precision, and method detection 582
limits of quantitative PCR for airborne bacteria and fungi. Appl. Environ. Microb. 2010, 583
76, 7004-7012. 584
(32) Sundararaj, S.; Guo, A.; Habibi-Nazhad, B.; Rouani, M.; Stothard, P.; Ellison, M.; 585
Wishart, D. S. The CyberCell Database (CCDB): a comprehensive, self-updating, 586
relational database to coordinate and facilitate in silico modeling of Escherichia coli. 587
Nuclei Acid Res. 2004, 32, D263-D265. 588
(33) Crilley, L. R.; Ayoko, G. A.; Morawska, L. Analysis of organic aerosols collected on 589
filters by Aerosol Mass Spectrometry for source identification. Anal. Chim. Acta. 2013, 590
803, 91– 96. 591
(34) Paatero, P.; Tapper, U. Positive matrix factorization - a nonnegative factor model with 592
optimal utilization of error-estimates of data values. Environmetrics 1994, 5, 111-126. 593
(35) Ulbrich, I. M.; Canagaratna, M. R.; Cubison, M. J.; Zhang, Q.; Ng, N. L.; Aiken, A. C.; 594
Jimenez, J. L. Three-dimensional factorization of size-resolved organic aerosol mass 595
spectra from Mexico City. Atmos. Meas. Tech. 2012, 5, 195–224. 596
(36) Tucker, L. R. Some mathematical notes on 3-mode factor analysis. Psychometrika 1966, 597
31, 279–311. 598
(37) Paatero, P.; Hopke, K. Rotational tools for factor analytic models. J. Chemometr. 2009, 599
23, 91–100. 600
(38) Canonaco, F.; Crippa, M.; Slowik, J. G.; Baltensperger, U.; Prévôt, A. S. H. SoFi, an 601
IGOR-based interface for the efficient use of the generalized multilinear engine (ME-2) for 602

31
the source apportionment: ME-2 application to aerosol mass spectrometer data. Atmos. 603
Meas. Tech. 2013, 6, 3649-3661. 604
(39) Mohr, C.; DeCarlo, P. F.; Heringa, M. F.; Chirico, R.; Slowik, J. G.; Richter, R.; Reche, 605
C.; Alastuey, A.; Querol, X.; Seco, R.; Penuelas, J.; Jimenez, J. L.; Crippa, M.; 606
Zimmermann, R.; Baltensperger, U.; Prevot, A. S. H. Identification and quantification of 607
organic aerosol from cooking and other sources in Barcelona using aerosol mass 608
spectrometer data. Atmos. Chem. Phys. 2012, 12, 1649-1665. 609
(40) Aiken, A. C.; DeCarlo, P. F.; Kroll, J. H.; Worsnop, D. R.; Huffmann, J. A.; Docherty, K. 610
S.; Ulbrich, I. M.; Mohr, C.; Kimmel, J. R.; Sueper, D.; Sun, Y.; Zhang, Q.; Trimborn, A.; 611
Northway, M.; Ziemann, P. J.; Canagaratna, M. R.; Onasch, T. B.; Alfarra, M. R.; Prevot, 612
A. S. H.; Dommen, J.; Duplissy, J.; Metzger, A.; Baltensperger, U.; Jimenez J. L. O/C and 613
OM/OC ratios of primary, secondary, and ambient organic aerosols with high-resolution 614
time-of-flight aerosol mass spectrometry. Environ. Sci. Technol., 2008, 42, 4478-4485. 615
(41) Allan, J. D.; Jimenez, J. L.; Williams, P. I.; Alfarra, M. R.; Bower, K. N.; Jayne, J. T.; 616
Coe, H.; Worsnop, D. R. Quantitative sampling using an Aerodyne aerosol mass 617
spectrometer 1. Techniques of data interpretation and error analysis. J. Geophys. Res., 618
2003, 108 (D3), 4090. 619
(42) Ulbrich, I. M.; Canagaratna, M. R.; Zhang, Q.; Worsnop, D. R.; Jimenez, J. L. 620
Interpretation of organic components from positive matrix factorization of aerosol mass 621
spectrometric data. Atmos. Chem. Phys. 2009, 9, 2891-2918. 622
(43) Crippa, M.; Canonaco, F.; Slowik, J. G.; El Haddad, I.; DeCarlo, P. F.; Mohr, C.; 623
Heringa, M. F.; Chirico, R.; Marchand, N.; Temime-Roussel, B.; Abidi, E.; Poulain, 624

32
L.; Wiedensohler, A.; Baltensperger, U.; Prévôt; A. S. H. Primary and secondary organic 625
aerosol origin by combined gas-particle phase source apportionment. Atmos. Chem. Phys. 626
2013, 13, 8411-8426. 627
(44) Barmpadimos, I.; Nufer, M.; Oderbolz, D. C.; Keller, J.; Aksoyoglu, S.; Hueglin, C.; 628
Baltensperger, U.; Prevot A. S. H. The weekly cycle of ambient concentrations and traffic 629
emissions of coarse (PM(10)-PM(2.5)) atmospheric particles, Atmos. Environ. 2011, 45, 630
4580-4590. 631
(45) Chow, J.; Watson, J.; Ashbaugh, L. L.; Magliano, K. L. Similarities and differences in 632
PM10 chemical source profiles for geological dust from the San Joaquin Valley, California. 633
Atmos. Environ. 2003, 37, 1317-1340. 634
(46) Amato, F.; Pandolfia, M; Moreno, T.; Furger, M.; Pey, J.; Alastuey, A.; Bukowiecki, N.; 635
Prevot, A.S.H.; Baltensperger, U.; Querol X. Sources and variability of inhalable road dust 636
particles in three European cities. Atmos. Environ. 2011, 45, 6777-6787. 637
(47) El Haddad, I.; Marchand, N.; Drona, J.; Temime-Roussel, B.; Quivet, E.; Wortham, H.; 638
Jaffrezo, J.-L.; Baduel, C.; Voisin, D.; Besombes, J. L.; Gille, G. Comprehensive primary 639
particulate organic characterization of vehicular exhaust emissions in France. Atmos. 640
Environ. 2009, 43, 6190-6198. 641
(48) Huang, R.-J.; Zhang, Y.; Bozzetti, C.; Ho, K.-F.; Cao, J.; Han, Y.; Dällenbach, K. R.; 642
Slowik, J. G.; Platt, S. M.; Canonaco, F.; Zotter, P.; Wolf, R.; Pieber, S. M.; Bruns, E. A.; 643
Crippa, M.; Ciarelli, G.; Piazzalunga, A.; Schwikowski, M.; Abbaszade, G.; Schnelle-644
Kreis, J.; Zimmermann, R.; An, Z.; Szidat, S.; Baltensperger, U.; El Haddad, I.; Prévôt, A. 645

33
S. H. High secondary aerosol contribution to particulate pollution during haze events in 646
China, Nature. 2014, 514, 218-212. 647
(49) Canonaco, F.; Slowik, J. G.; Baltensperger, U.; Prévôt, A. S. H. Seasonal differences in 648
oxygenated organic aerosol composition: implications for emissions sources and factor 649
analysis. Atmos. Chem. Phys. 2015, 15, 6993-7002. 650
(50) Crippa, M.; Canonaco, F.; Lanz, V. A.; Äijälä, M.; Allan, J. D.; Carbone, S.; Capes, G.; 651
Ceburnis, D.; Dall’Osto, M.; Day, D. A.; DeCarlo, P. F.; Ehn, M.; Eriksson, A.; Freney, E.; 652
Hildebrandt Ruiz, L.; Hillamo, R.; Jimenez, J. L.; Junninen, H.; Kiendler-Scharr, A.; 653
Kortelainen, A.- M.; Kulmala, M.; Laaksonen, A.; Mensah, A. A.; Mohr, C.; Nemitz, E.; 654
O’Dowd, C.; Ovadnevaite, J.; Pandis, S. N.; Petäjä, T.; Poulain, L.; Saarikoski, S.; Sellegri, 655
K.; Swietlicki, E.; Tiitta, P.; Worsnop, D. R.; Baltensperger, U.; Prévôt, A. S. H. Organic 656
aerosol components derived from 25 AMS data sets across Europe using a consistent ME-2 657
based source apportionment approach. Atmos. Chem. Phys. 2014, 14, 6159–6176. 658
(51) Medeiros, P. M.; Conte, M. H.; Weber, J. C.; Simoneit, B. R. T. Sugars as source 659
indicators of biogenic organic carbon in aerosols collected above the Howland 660
Experimental Forest, Maine. Atmos. Environ. 2006, 40, 1694-1705. 661
(52) Jia, Y.; Clements, A. L.; Fraser, M. P. Saccharide composition in atmospheric particulate 662
matter in the southwest US and estimates of source contributions. J. Aerosol Sci. 2010, 41, 663
62-73. 664
(53) Williams, L. R.; Gonzalez, L. A.; Peck, J.; Trimborn, D.; McInnis, J.; Farrar, M. R.; 665
Moore, K. D.; Jayne, J. T.; Robinson, W. A.; Lewis, D. K.; Onasch, T. B.; Canagaratna, M. 666
R.; Trimborn, A.; Timko, M. T.; Magoon, G.; Deng, R.; Tang, D.; de la Rosa Blanco, E.; 667

34
Prévôt, A. S. H.; Smith, K. A.; Worsnop D. Characterization of an aerodynamic lens for 668
transmitting particles greater than 1 micrometer in diameter into the Aerodyne aerosol mass 669
spectrometer. Atmos. Meas. Tech. 2013, 6, 3271–3280. 670
(54) Rogge, W. F.; Hildemann, L. M.; Mazurek, M. A.; Cass, G. R; Simoneit, B. R. T. 671
Sources of fine organic aerosol. 4. Particulate abrasion products from leaf surfaces of urban 672
plants, Environ. Sci. Technol., 1993, 27 (13), 2700–2711. 673
(55) Kotianová, P.; Puxbaum, H.; Bauer, H.; Caseiro, A.; Marrb, I. L.; Čìk, G.; Temporal 674
patterns of n-alkanes at traffic exposed and suburban sites in Vienna. Atmos. Environ. 675
2008, 42, 2993–3005. 676
(56) Rogge, W. F.; Hildemann, L. M.; Mazurek, M.,A.; Caw, G. R. Sources of Fine Organic 677
Aerosol. 2. Noncatalyst and Catalyst-Equipped Automobiles and Heavy-Duty Diesel 678
Trucks. Environ. Sci. Technol. 1993, 27, 636-651. 679
(57) Hildemann, L. M.; Mazurek, M. A.; Cass, G. R.; Simoneit, B. R. Quantitative 680
characterization of urban sources of organic aerosol by high-resolution gas-681
chromatography, Environ. Sci. Technol. 1991, 25, 1311-1325. 682
(58) Borodulin, A.; Safatov, A.; Belan, B.; Panchenko, M. Measurement errors in determining 683
tropospheric bioaerosol concentrations in the southern region of Western Siberia. Dokl. 684
Biol. Sci. 2005, 403, 260–262. 685
(59) Vlodavets, V.; Mats, L. The influence of meteorological factors on the microflora of the 686
atmospheric air in Moscow. J. Microbiol. 1958, 59, 539–544. 687

35
(60) Pady, S.; Kelly, C. Aerobiological studies of fungi and bacteria over the Atlantic Ocean. 688
Can. J. Botany. 1954, 32, 202–212. 689
(61) Burrows, S. M.; Elbert, W.; Lawrence, M. G.; Pöschl, U. Bacteria in the global 690
atmosphere–Part 1: Review and synthesis of literature data for different ecosystems. 691
Atmos. Chem. Phys. 2009, 9, 9281–9297. 692
(62) El Haddad, I.; D'Anna, B.; Temime-Roussel, B.; Nicolas, M.; Boreave, A.; Favez, O.; 693
Voisin, D.; Sciare, J.; George, C.; Jaffrezo, J.-L. ; Wortham, H.; Marchand, N. 694
Towards a better understanding of the origins, chemical composition and aging of 695
oxygenated organic aerosols: case study of a Mediterranean industrialized environment, 696
Marseille. Atmos. Chem. Phys. 2013, 13, 7875-7894. 697
698
699
Graphical TOC Entry 700
701
10080604020
0
%
17.6 7.2 3
PM10 OM10 PBOA
PBOA: cellulose monosaccarides bacteria WS-polysaccarides fungal spores unidentified
PM10:
NO3-
SO42-
OM NH4
+
EC DustCOARSE unidentified
T concentration in µgm-3
OM10: HOA BBOA S-OOA PBOA W-OOA