Bousfield et al, J Glycomics Lipidomics 2014, 4:4 Journal ... · 4 4 1124 215363 esearch Article...
16
Volume 4 • Issue 4 • 1000124 J Glycomics Lipidomics ISSN: 2153-0637 JGL, an open access journal Research Article Open Access Bousfield et al, J Glycomics Lipidomics 2014, 4:4 DOI: 10.4172/2153-0637.1000125 Macro and Micro Heterogeneity in Pituitary and Urinary Follicle-Stimulating Hormone Glycosylation Bousfield GR 1* , Butnev AY 1 , Rueda-Santos MA 1 , Brown A 1 , Smalter Hall A 2 and Harvey DJ 3 1 Department of Biological Sciences, Wichita State University, Wichita, KS67260, 2Molecular Graphics and Modeling Laboratory, University of Kansas, Lawrence, KS 66045, USA 3 Department of Biochemistry, Oxford University, , Oxford OX1 3QU, UK” after USA Introduction Glycosylation macroheterogeneity, the presence or absence of one or more glycans at known glycosylation sites, and microheterogeneity, the structural heterogeneity of glycans attached to the same site, provide the basis for most glycoprotein structural heterogeneity [1]. For the glycoprotein hormones, luteinizing hormone (LH), follicle-stimulating hormone (FSH), thyroid-stimulating hormone (TSH), and chorionic gonadotropin (CG), microheterogeneity resulting from populations of 2-30 glycans decorating three or four N-glycosylation sites [2-7] has been the focus of attention for the last several decades [8-13]. Charge-based fractionation procedures, including zone electrophoresis, isoelectric focusing, and chromatofocusing, typically produce 17-35 FSH isoform preparations that exhibit similar immunological, but different biological activities, suggesting functional significance for microheterogeneity [11]. Changes in hFSH isoform abundance as a function of cycle stage and with increasing age support the concept of physiological regulation of hFSH glycosylation [14-22]. In the female, estrogen appears to play a major role in modulating FSH isoform abundance in a variety of mammalian systems [18,19,23- 25]. GnRH and activin-A have also been reported to impact FSH glycosylation based on altered isoform patterns [24,26,27]. Differing hFSH isoform patterns in pituitary extracts, serum samples, and urinary protein samples suggest non-equivalence of the FSH populations present in each of these physiological compartments [11]. Because isoform patterns are assumed to reflect underlying differences in glycosylation, the foregoing suggests that only serum- derived gonadotropin glycosylation patterns are physiologically relevant. However, there are several problems with this conclusion. First, separation systems are inadequate to resolve the large number of potential isoforms that exist in any of these physiological compartments. For example, glycosylation site-specific analysis of a highly purified hFSH preparation identified 11 major glycans at hFSHα Asn52, 2 at αAsn78, 4 at hFSHβ Asn7, and 11 at βAsn24. As a result, as many as 968 glycosylation variants may exist in this hFSH preparation [6,28]. Chromatofocusing, the procedure used to demonstrate different FSH isoform patterns in pituitary, serum and urine [11], separated this preparation into only seven isoform fractions [28]. In principle, each fraction could possess an average of 140 isoforms. Glycopeptide mass spectrometry of each isoform fraction revealed that the glycan populations were very similar, regardless of isoelectric point. Moreover, there was little evidence for the anticipated enrichment of larger, more negatively charged glycans in isoform preparations exhibiting lower isoelectric points [28]. Second, apparent isoelectric point fails to predict underlying glycan structures. For example, partially sialylated tri- or tetra-antennary glycans have the same charge as fully sialylated, biantennary glycans. ird, even highly sensitive analytical techniques, such as mass spectrometry cannot characterize serum hFSH glycans because of the limited amount of hormone and the extremely heterogeneous nature of the glycan population associated with it. us, glycosylation must be evaluated in more abundant pituitary or urinary hFSH preparations. In the present study, we quantitatively compared macro- and microheterogeneity of pituitary and urinary hFSH glycosylation. Our working hypothesis is that the only way for pituitary hFSH to reach the *Corresponding author: Bousfield GR, Department of Biological Sciences, Wichita State University, 1845 Fairmount, Wichita, KS 67260-0026,USA, Tel: 316-978-6088; Fax: 316-978-3772; E-mail: [email protected] Received: Octomber 01, 2014; Accepted: October 27, 2014; Published: October 29, 2014 Citation: Bousfield GR, Butnev VY, Rueda-Santos MA, Brown A, Smalter Hall A, et al (2014) Macroand Micro Heterogeneity in Pituitary and Urinary FollicleStimulating Hormone Glycosylation. J Glycomics Lipidomics 4: 125. doi: 10.4172/2153- 0637.1000125 Copyright: © 2014 Bousfield GR, et al. This is an open-access article distributed under the terms of the Creative Commons Attribution License, which permits unrestricted use, distribution, and reproduction in any medium, provided the original author and source are credited. Abstract FSH glycosylation macroheterogeneity in pituitary and urinary hFSH samples was evaluated by Western blotting. Microheterogeneity in two highly purified urinary and pituitary hFSH preparations was evaluated by nano-electrospray mass spectrometry of peptide-N-glycanase-released oligosaccharides. An age-related loss of hypo-glycosylated hFSH in individual female pituitaries was indicated by progressively reduced abundance of hFSH21 relative to hFSH24. Urinary hFSH was evaluated as a potentially non-invasive indicator of glycoform abundance, as the only way for pituitary FSH to reach the urine is through the blood. Both highly purified and crude postmenopausal urinary hFSH preparations possessed the same amount of hFSH21 as postmenopausal pituitary gland FSH. Considerable microheterogeneity was encountered in both pituitary and urinary hFSH glycan populations, as 84 pituitary hFSH glycan ions were observed as compared with 68 urinary hFSH glycans. The biggest quantitative differences between the two populations were reduced abundance of bisecting GlcNAc-containing and fucosylated glycans, along with sulfated glycans in the urinary hFSH glycan population. The relative abundance of sialic acid and glycan antenna did not rationalize the retarded electrophoretic mobilities of the urinary hFSHb21- and a-subunit bands relative to the corresponding pituitary hFSH bands, as the most abundant glycans in the former possessed only 2 more branches and the same sialic content as in the latter. Site-specific glycosylation information will probably be necessary. Journal of Glycomics & Lipidomics
Transcript of Bousfield et al, J Glycomics Lipidomics 2014, 4:4 Journal ... · 4 4 1124 215363 esearch Article...

Volume 4 • Issue 4 • 1000124J Glycomics LipidomicsISSN: 2153-0637 JGL, an open access journal
Research Article Open Access
Bousfield et al, J Glycomics Lipidomics 2014, 4:4 DOI: 10.4172/2153-0637.1000125
Macro and Micro Heterogeneity in Pituitary and Urinary Follicle-Stimulating Hormone GlycosylationBousfield GR1*, Butnev AY1, Rueda-Santos MA1, Brown A1, Smalter Hall A2 and Harvey DJ3
1Department of Biological Sciences, Wichita State University, Wichita, KS67260, 2Molecular Graphics and Modeling Laboratory, University of Kansas, Lawrence, KS 66045, USA3Department of Biochemistry, Oxford University, , Oxford OX1 3QU, UK” after USA
IntroductionGlycosylation macroheterogeneity, the presence or absence of one
or more glycans at known glycosylation sites, and microheterogeneity, the structural heterogeneity of glycans attached to the same site, provide the basis for most glycoprotein structural heterogeneity [1]. For the glycoprotein hormones, luteinizing hormone (LH), follicle-stimulating hormone (FSH), thyroid-stimulating hormone (TSH), and chorionic gonadotropin (CG), microheterogeneity resulting from populations of 2-30 glycans decorating three or four N-glycosylation sites [2-7] has been the focus of attention for the last several decades [8-13].
Charge-based fractionation procedures, including zone electrophoresis, isoelectric focusing, and chromatofocusing, typically produce 17-35 FSH isoform preparations that exhibit similar immunological, but different biological activities, suggesting functional significance for microheterogeneity [11]. Changes in hFSH isoform abundance as a function of cycle stage and with increasing age support the concept of physiological regulation of hFSH glycosylation [14-22]. In the female, estrogen appears to play a major role in modulating FSH isoform abundance in a variety of mammalian systems [18,19,23-25]. GnRH and activin-A have also been reported to impact FSH glycosylation based on altered isoform patterns [24,26,27].
Differing hFSH isoform patterns in pituitary extracts, serum samples, and urinary protein samples suggest non-equivalence of the FSH populations present in each of these physiological compartments [11]. Because isoform patterns are assumed to reflect underlying differences in glycosylation, the foregoing suggests that only serum-derived gonadotropin glycosylation patterns are physiologically relevant. However, there are several problems with this conclusion.
First, separation systems are inadequate to resolve the large number of potential isoforms that exist in any of these physiological compartments. For example, glycosylation site-specific analysis of a highly purified hFSH preparation identified 11 major glycans at hFSHα Asn52, 2 at αAsn78, 4 at hFSHβ Asn7, and 11 at βAsn24. As a result, as
many as 968 glycosylation variants may exist in this hFSH preparation [6,28]. Chromatofocusing, the procedure used to demonstrate different FSH isoform patterns in pituitary, serum and urine [11], separated this preparation into only seven isoform fractions [28]. In principle, each fraction could possess an average of 140 isoforms. Glycopeptide mass spectrometry of each isoform fraction revealed that the glycan populations were very similar, regardless of isoelectric point. Moreover, there was little evidence for the anticipated enrichment of larger, more negatively charged glycans in isoform preparations exhibiting lower isoelectric points [28]. Second, apparent isoelectric point fails to predict underlying glycan structures. For example, partially sialylated tri- or tetra-antennary glycans have the same charge as fully sialylated, biantennary glycans. Third, even highly sensitive analytical techniques, such as mass spectrometry cannot characterize serum hFSH glycans because of the limited amount of hormone and the extremely heterogeneous nature of the glycan population associated with it. Thus, glycosylation must be evaluated in more abundant pituitary or urinary hFSH preparations.
In the present study, we quantitatively compared macro- and microheterogeneity of pituitary and urinary hFSH glycosylation. Our working hypothesis is that the only way for pituitary hFSH to reach the
*Corresponding author: Bousfield GR, Department of Biological Sciences,Wichita State University, 1845 Fairmount, Wichita, KS 67260-0026,USA, Tel:316-978-6088; Fax: 316-978-3772; E-mail: [email protected]
Received: Octomber 01, 2014; Accepted: October 27, 2014; Published: October 29, 2014
Citation: Bousfield GR, Butnev VY, Rueda-Santos MA, Brown A, Smalter Hall A, et al (2014) Macroand Micro Heterogeneity in Pituitary and Urinary FollicleStimulating Hormone Glycosylation. J Glycomics Lipidomics 4: 125. doi: 10.4172/2153-0637.1000125
Copyright: © 2014 Bousfield GR, et al. This is an open-access article distributed under the terms of the Creative Commons Attribution License, which permits unrestricted use, distribution, and reproduction in any medium, provided the original author and source are credited.
AbstractFSH glycosylation macroheterogeneity in pituitary and urinary hFSH samples was evaluated by Western blotting.
Microheterogeneity in two highly purified urinary and pituitary hFSH preparations was evaluated by nano-electrospray mass spectrometry of peptide-N-glycanase-released oligosaccharides. An age-related loss of hypo-glycosylated hFSH in individual female pituitaries was indicated by progressively reduced abundance of hFSH21 relative to hFSH24. Urinary hFSH was evaluated as a potentially non-invasive indicator of glycoform abundance, as the only way for pituitary FSH to reach the urine is through the blood. Both highly purified and crude postmenopausal urinary hFSH preparations possessed the same amount of hFSH21 as postmenopausal pituitary gland FSH. Considerable microheterogeneity was encountered in both pituitary and urinary hFSH glycan populations, as 84 pituitary hFSH glycan ions were observed as compared with 68 urinary hFSH glycans. The biggest quantitative differences between the two populations were reduced abundance of bisecting GlcNAc-containing and fucosylated glycans, along with sulfated glycans in the urinary hFSH glycan population. The relative abundance of sialic acid and glycan antenna did not rationalize the retarded electrophoretic mobilities of the urinary hFSHb21- and a-subunit bands relative to the corresponding pituitary hFSH bands, as the most abundant glycans in the former possessed only 2 more branches and the same sialic content as in the latter. Site-specific glycosylation information will probably be necessary.
Journal of Glycomics & Lipidomics

Citation: Bousfield GR, Butnev VY, Rueda-Santos MA, Brown A, Hall V, et al (2014) Macroand Micro Heterogeneity in Pituitary and Urinary FollicleStimulating Hormone Glycosylation. J Glycomics Lipidomics 4: 125. doi: 10.4172/2153-0637.1000125
Page 2 of 16
Volume 4 • Issue 4 • 1000124J Glycomics LipidomicsISSN: 2153-0637 JGL, an open access journal
urine is through the blood. Accordingly, analysis of hFSH glycosylation in the pituitary and urinary samples will shed light on serum hFSH glycosylation.
Materials and MethodsHormones and designations
Hormone preparations
The hFSH preparations AFP4161B, AFP7220, AFP5720, and AFP7298A were obtained from the National Hormone and Pituitary Program, NIDDK, and Dr. A.F. Parlow. The activity of AFP7298A is 8560 IU/mg (documentation provided by Dr. Parlow). Pergonal was purchased from Serono (Randolph, MA) [29]. Highly purified urinary hFSH was purchased from ProSpec (Rehovot, Israel).
FSH glycoform preparation designations
FSH glycoforms are identified by altered electrophoretic mobility of hormone-specific FSHβ bands due to loss of one or more N-glycans. Four hFSHβ variants exhibit relative molecular weights of 24,000, 21,000, 18,000, and 15,000 in Western blotting experiments [30]. The Mr 24,000 band represents fully-glycosylated hFSHβ possessing both N-glycans and is designated hFSHβ24. The Mr 21,000 hFSHβ band, or hFSHβ21, appears to possess one complex N-glycan at Asn7 [31]. The Mr 18,000 hFSHβ band, hFSHβ18, also appears to possess one N-glycan at Asn24. The Mr 15,000 band, hFSHβ15, appears after PNGaseF digestion, is present in E. coli-expressed hFSHβ, and probably represents the non-glycosylated hFSHβ peptide. FSH glycoforms are identified by the FSHβ variant present, thus hFSH24, hFSH21, hFSH18, or hFSH15. Since most hFSH preparations possess two hFSHβ variants, the more abundant form will be indicated first, followed by the less abundant form. Thus, human pituitary and urinary hFSH are designated hFSH24/21.
Human pituitary glands
Human pituitary glands were obtained at autopsy from 21-81 year-old women, by the National Disease Research Interchange, Philadelphia, PA, the Cooperative Human Tissue Network-Western Division, Nashville, TN, and by Dr. Naomi Rance, University of Arizona School of Medicine, Tuscon, AZ [32]. As Dr. Rance collected most of the pituitary glands several years before we initiated these studies, uterine histology was available for only 10 of the women (Table 1). FSH was isolated from a 55 year-old male pituitary gland for the tandem gel filtration experiments.
FSH heterodimer isolation from individual human pituitary glands
Frozen, individual human pituitary glands were acetone-dried, then extracted in 0.02 M sodium phosphate buffer, pH 7.0, protease inhibitors, and hFSH captured using immobilized, anti-FSHβ monoclonal antibody 46.3H6.B7 as described previously [32]. An additional 20 min elution with 0.1 M sodium phosphate, 0.3 M sodium chloride, pH 7.0, was used to eliminate nonspecifically adsorbed human growth hormone [32]. Bound protein eluted with 0.1 M glycine-HCl, pH 2.7, containing 0.5 M NaCl, was collected in an Amicon Ultra-4, 10,000 MW cutoff, ultrafiltration cartridge containing 400 µl 1 M Tris-HCl, pH 9.5, and concentrated to 100-150 µL by centrifugation at 5,000 rpm in a Sorvall RC-3B plus centrifuge using a S/A400 fixed angle rotor for 20 min at 4°C. The concentrated bound fraction and two 25 µL washes with 0.2 M ammonium bicarbonate were pooled in a 500 µL microfuge tube and the entire sample fractionated by
gel filtration chromatography using a 10 X 300 mm GE Healthcare (Piscataway, NJ) Superdex 75 column using a flow rate of 0.4 mL/min for 70 min. The mobile phase was 0.2 M ammonium bicarbonate and the chromatogram was developed at the same flow rate with a Waters (Milford, MA) model 600 HPLC pump. UV absorbance was measured at 210 nm using a Waters model 484 tunable wavelength absorbance monitor. The HPLC system was controlled with the Waters Empower instrument control, data acquisition software running on a Dell (Round Rock, TX) Dimension 8250 computer. Fractions were collected by hand in 12 × 75 mm polypropylene tubes and protein recovered by evaporation in a Thermo Savant Speed Vac. Dried samples were resuspended in 300 µL water and evaporated to dryness two more times prior to Western blot analysis.
Tandem superdex 75 gel filtration
Two 10 X 300 mm Superdex 75 columns were coupled in series and equilibrated with 0.2 M ammonium bicarbonate containing 20% acetonitrile at a flow rate of 0.4 mL/min, as previously described [30]. One µg samples of pituitary hFSH were injected and each chromatogram developed for 140 min. Peak areas were used to determine hFSH21 relative abundance.
SDS-PAGE and Western blotting
FSH glycoform abundance was determined by Western blot analysis of reduced samples of individual pituitary and urinary hFSH preparations [33]. Primary antibodies included anti-hFSHβ monoclonal antibody RFSH20 (binds native free and heterodimeric, as well as reduced hFSHβ) and anti-αsubunit monoclonal antibody HT13 (binds native free and heterodimeric, as well as reduced α-subunit from FSH, LH, TSH, and hCG), as previously described [33]. Bound secondary antibody-HRP complexes were detected by chemiluminescence using a Bio-Rad (Hercules, CA) VersaDoc™ Model 4000 imaging system. Band intensities were measured using the Bio-Rad Quantity One (version 4.5.1) software package running on an Apple (Cupertino, CA) Macintosh G4 computer. The coefficients of variation for the relative abundance of each hFSHβ band, based on analysis of triplicate 1-2 µg hFSH samples characterized on the same blot, were 1.5-2.4%.Glycoform abundance measurements were identical for 1 and 2 µgsamples, differed significantly for 0.5 µg samples, and saturated thedetection system above 2 µg. All measurements were performed on 1-2 µg hFSH samples, when possible.
Postmenopausal urinary hFSH glycoform analysis
Pergonal postmenopausal urinary gonadotropin preparations representing three different batches were fractionated on the same 10 X 300 mm Superdex 75 column using identical chromatographic conditions employed for individual pituitary hFSH period samples FSH heterodimer isolation from individual human pituitary glands
Fractions corresponding to aggregated hFSH, hFSH heterodimer, and hFSHβ subunit were collected by hand using start and stop times derived from individual pituitary hFSH fractionation, as co-eluting urinary protein contaminants prevented FSH detection using UV absorbance (data not shown). Glycoform abundance was determined for each column fraction by Western blotting, as described above.
Individual urinary sample hfsh glycoform analysis
Daily, 350-400 mL first-void human urine samples were precipitated overnight with 80% ethanol at 4°C. The precipitates were recovered by centrifugation at 7300 x g in the HL-4 rotor of a Sorvall RC-3 refrigerated centrifuge at 4°C. The pellets were resuspended with four

Citation: Bousfield GR, Butnev VY, Rueda-Santos MA, Brown A, Hall V, et al (2014) Macroand Micro Heterogeneity in Pituitary and Urinary FollicleStimulating Hormone Glycosylation. J Glycomics Lipidomics 4: 125. doi: 10.4172/2153-0637.1000125
Page 3 of 16
Volume 4 • Issue 4 • 1000124J Glycomics LipidomicsISSN: 2153-0637 JGL, an open access journal
10-mL aliquots of 0.02 M sodium phosphate buffer, pH 7.0. Insoluble material was removed by centrifugation at 7300 x g for 20 min using a H/SA-400 rotor in a Sorvall RC-3B plus refrigerated centrifuge. FSH was purified by immunoaffinity and gel filtration chromatography as in FSH heterodimer isolation from individual human pituitary glands. Glycoform abundance was measured by Western blotting as in SDS-PAGE and Western blotting.
Statistical analysis
Hypo-glycosylated hFSH glycoform abundance data for pituitary FSH samples from three Western blots, three 1 µg injections monitored at 210 nm, and three 1 µg injections monitored at 280 nm, were averaged because they represented repeated measures on the same individuals. The average values were analyzed by one-way ANOVA followed by the Tukey means separation test using Prism 5 for Mac OS X (GraphPad Software, Inc., San Diego, CA). Hypo-glycosylated hFSH relative abundance percentage data were subjected to arcsine transformation prior to ANOVA to meet the parametric test condition of a normal distribution [34]. The same software package was used to test the correlation between hFSHβ21 band density and age. Each individual pituitary FSH preparation was analyzed in triplicate or quadruplicate and the mean ± SD values plotted against age.
Mass spectrometry procedures
Glycan preparation methods
PNGaseF-released pituitary and urinary hFSH24/21 glycan samples [30] were dissolved in 5 µL water. One µL of each sample was cleaned with a Nafion 117 membrane [35] and examined by negative ion nano-electrospray mass spectrometry (MS and MS/MS modes). A further 2 µL of each sample was desialylated with Arthrobacter ureafaciens sialidase, the glycans were cleaned with a Nafion membrane, and examined by mass spectrometry.
Nano-electrospray mass spectrometry
Nano-electrospray mass spectrometry was performed with a Waters quadrupole-time-of-flight (Q-TOF) Ultima Global instrument in negative ion mode. Samples in 1:1 (v:v) methanol:water containing 0.5 mM ammonium phosphate were infused through Proxeonnanospray capillaries (Proxeon Biosystems, Odense, Denmark). The ion source conditions were: temperature, 120°C; nitrogen flow 50 L/hr; infusion needle potential, 1.1 kV; cone voltage 100 V; RF-1 voltage 180 V. Spectra (2 sec. scans) were acquired with a digitization rate of 4 GHz. For MS/MS data acquisition (collision-induced decomposition, CID), the parent ion was selected at low resolution (about 5 m/z mass window) to allow transmission of isotope peaks and fragmented with argon at a pressure (recorded on the instrument’s pressure gauge) of 0.5 mBar. The voltage on the collision cell was adjusted with mass and charge to give an even distribution of fragment ions across the mass scale and spectra were accumulated until a satisfactory signal:noise ratio had been obtained. Typical values were 80-120 V. Other voltages were as recommended by the manufacturer. Instrument control, data acquisition and processing were performed with MassLynx software Version 4.0.
Spectral interpretation
The mass of the glycans gave the composition in terms of the constituent isobaric monosaccharides. Structural details were obtained by fragmentation. Negative ion collision-induced decomposition (CID) spectra of neutral N-glycans provide much more structural detail than the more commonly used positive ion spectra and were used for all samples. Major ions define features such as the branching
pattern, the location of fucose residues and the presence or absence of bisecting GlcNAc. Full details have been published [36-39]. The glycans were stabilized for negative ion work by adduction with a low mass anion, phosphate in this case, because phosphate always appears to be present in glycan samples obtained by release from glycoproteins, even after extensive clean-up. The anion does not affect the CID spectra because it is lost in the first fragmentation event. The corresponding spectra of acidic (sialylated and sulfated) glycans, which ionize as [M-H]- ions and do not form adducts, are not so informative because of preferential loss of the acidic protons during fragmentation. Therefore, the analytical method that was adopted was to perform structural analysis on the desialylated glycans and then to use the spectra of the native glycans to determine the sialylation state of each compound. Consequently, in the composition tables below, the glycans are listed in order of their neutral masses with the number and masses of the acidic groups in the columns following the neutral structure. Time did not permit fragmentation of all compounds in every sample but enough data were collected to assign structures to most glycans. Glycans for which CID spectra were obtained are indicated in Tables 1 and 2.
Quantitative mass spectrometry data
Quantitative data were obtained for pituitary and urinary hFSH glycans by adding the peak heights of all isotopes for each compound and expressing the result as a percentage of the total ion count. Although this method gives an approximate indication of the amounts of each glycan it will not be totally accurate for a number of reasons. (a) Compounds ionize in different states ([M-H]- and [M-2H]2- for acidic glycans and [M+H3PO4]- for the neutral compounds) and the relative ionization efficiency for production of each ion is unknown, (b) Some ions contain isomeric and isobaric structures and it is sometimes not possible to determine the contribution of each to the ion current. In some cases, however, this can be estimated from the fragmentation spectra. Amounts are cited to the second decimal place: this is to define the dynamic range, not the accuracy. The quantitative data are listed in Tables 1 and 2.
ResultsSeparation of pituitary hFSH glycoforms by Superdex 75 gel filtration
FSH24/21 was isolated from a single male pituitary gland by immunoaffinity chromatography and single-column Superdex 75 gel filtration. As expected, the hFSH heterodimer emerged in a single peak (Figure 1A). When three 1-µg samples of this preparation were subjected to FSHβ Western blot analysis, both the expected FSHβ21 and FSHβ24 bands were detected (Figure 1A inset, lane 2). FSHβ21 abundance was 35.6% ± 1.9% (mean ± SD). Dual Superdex 75 column chromatography of triplicate, 1-µg samples produced an average hypo-glycosylated hFSH21 abundance of 36.4% ± 1.6% based on 210 nm absorbance (Figure 1B). Chromatograms for three additional 1µg samples, monitored at 280 nm, indicated hFSH21 abundance averaged 36.4% ± 3.5% at 280 nm (Figure 1C). One-way ANOVA indicated no significant difference between the glycoform abundance estimates (p > 0.05). This experiment provided an independent confirmation of glycoform abundance results obtained by 1:10,000-diluted, RFSH20 primary antibody, Western blotting of 1-µg hFSH24/21 samples.
Glycoform abundance in individual human pituitaries
FSH glycoform abundance was measured by Western blotting in 15 individual human pituitaries derived from women aged 21-81. Most of these hFSH preparations possessed both FSHβ21 and FSHβ24 bands.

Citation: Bousfield GR, Butnev VY, Rueda-Santos MA, Brown A, Hall V, et al (2014) Macroand Micro Heterogeneity in Pituitary and Urinary FollicleStimulating Hormone Glycosylation. J Glycomics Lipidomics 4: 125. doi: 10.4172/2153-0637.1000125
Page 4 of 16
Volume 4 • Issue 4 • 1000124J Glycomics LipidomicsISSN: 2153-0637 JGL, an open access journal
Neutral compounds
Structure5
Acidic compoundsm/z([M+H2PO4]-(Ion type a)2 Composition %3/
Frag4
m/z Acidic groupsIon2 Frag.4 %2 Structure6
Found Calc. Hex HexNAc dHex Found Calc. Neu5Ac SO3H
1007.3 1007.3 3 2 0 0.11 1 - - - - - - - -1153.4 1153.4 3 2 1 0.18 2 - - - - - - - -
-,1372.5 1372.5 4 3 0 + 3,4 1565.5 1565.5 1 0 b + 0.76 -- 1413.5 3 4 0 - 5 1606.6 1606.6 1 0 b - 0.21 -
-,1518.5 1518.5 4 3 1 - 6,7 1711.6 1711.6 1 0 b + 0.62 53,54-,1575.6 1575.5 4 4 0 - 8,9 1768.6 1768.6 1 0 b + 0.22 55,56-,1721.6 1721.6 4 4 1 + 10,11 1914.7 1914.6 1 0 b + 0.26 -
-,1737.7 1737.6 5 4 0 + 12
1930.7 1930.7 1 0 b + 0.35 571004.8 1004.8 1 1 c - 0.25 -1110.4 1110.4
2 0c - 9.25 -
2221.8 2221.7 b - 0.12 -
-,1778.7 1778.6 4 5 0 + 13,14,15
1760.6,
1760.71760.6 0 1 b - 0.18 -,+
1971.7 1971.7 1 0 b + 0.48
58
α2→6-Neu5Ac on
Gal1025.3 1025.3 1 - c - 2.05 -1130.9 1130.9 2 0 c - 6.57 -2263.7 2262.7 b - 0.05 -
- 1819.6 3 6 0 - 16
940.2,
940.3940.3 0 2 c - 0.23 -
1045.8 1045.8 1 1 c - 0.29 -
-,1883.7 1883.6 5 4 1 + 172076.7 2076.7 1 0 b + 0.34 591183.4 1183.4 2 0 c - 7.66 -
-,1924.7 1924.6 4 5 1 + 18,19,20
1906.6,
1906.71906.6 0 1 b + T -
1098.3 1098.4 1 1 c - 1.08 -
2117.4 2117.7 1 0 b - T
60
α2→6-Neu5Ac on
Gal1203.9 1203.9 2 0 c - 0.62 -
-,1940.7 1940.7 5 5 0 + 212133.8 2133.7 1 0 b + 0.19 61
1211.9 1211.92 0
c - 4.44 -2424.9 2424.8 b - 0.04
- 1965.7 3 6 1 - 22 1013.3 1013.3 0 2 c - 0.16 -
- 2029.7 5 4 2 - (23,24) 1256.4 1256.4 2 0 c - 0.28 -
-,2086.8 2086.7 5 5 1 + 252279.8 2279.7 1 0 b + 0.16 621284.9 1284.9 2 0 c - 4.72 -
-,2102.8 2102.7 6 5 0 + 26
2295.8 2295.8 1 0 b + 0.03 631292.9 1292.9
2 0c - 4.44 -
2586.7 2586.8 b - T -1438.5 1438.5 3 0 c - 6.48 -

Citation: Bousfield GR, Butnev VY, Rueda-Santos MA, Brown A, Hall V, et al (2014) Macroand Micro Heterogeneity in Pituitary and Urinary FollicleStimulating Hormone Glycosylation. J Glycomics Lipidomics 4: 125. doi: 10.4172/2153-0637.1000125
Page 5 of 16
Volume 4 • Issue 4 • 1000124J Glycomics LipidomicsISSN: 2153-0637 JGL, an open access journal
- 2127.7 4 6 1 - (28)7 2117.4 2117.7 1 0 b - 0.50 -
-,2143.8 2143.7 5 6 0 + 28,29,30
-,2125.8 2125.7 1 b +2336.8 2336.8 1 0 b + 0.05 -1207.9 1207.9 1 1 c - 0.87 -1313.4 1313.5 2 0 c - 3.12 -1353.4 1353.4 2 1 c - 0.84 -1459.0 1458.9 3 0 c - 1.42 -
-,2248.8 2248.8 6 5 1 + 31,32
2441.8 2441.6 1 0 b - 0.03 -1260.4 1260.4 1 1 c - 0.33 -1366.0 1366.0 2 0 c - 4.39 -1511.5 1511.5 3 0 c - 4.45 -
-,2289.8 2289.8 5 6 1 - 33,342482.8 2482.9 1 0 b - 0.01 -1386.5 1386.4 2 0 c - 0.75 -
-,2305.9 2305.8 6 6 0 + 352498.9 2498.9 1 0 b + 0.02 -1394.5 1394.5 2 0 c - 3.76 -1540.0 1540.0 3 0 c - 5.48 -
- 2394.8 6 5 2 - 36 2587.7 2587.9 1 0 b - 0.01 -
-,2451.8 2451.9 6 6 1 + 37,382644.8 2644.8 1 0 b + 0.01 641467.5 1467.5 2 0 c - 2.81 -1613.1 1613.0 3 0 c - 2.51 -
-,2467.7 2467.8 7 6 0 + 39,401475.5 1475.5 2 0 c - 0.50 -1621.1 1621.0 3 0 c - 1.18 -1766.6 1766.6 4 0 c - 0.57 -
- 2508.9 6 7 0 - (41)71536.0 1536.0 2 1 c - 0.18 -1641.6 1641.6 3 0 c - 0.31 -
-,2613.7 2613.9 7 6 1 + 43,44
1548.6 1548.5 2 0 c - 1.30 -1694.1 1694.1 3 0 c - 2.72 -1839.7 1839.6 4 0 c - 2.57 -1985.2 1985.2 5 0 c - 0.23 -
-,2654.8 2654.9 6 7 1 - (45)7 1569.0 1569.1 2 0 c + 0.23 α2→6-Neu5Ac
-,2670.7 2670.9 7 7 0 - (46)471577.1 1577.1 2 0 c - 0.37 -1722.6 1722.6 3 0 c - 0.71 -1868.1 1868.2 4 0 c - 0.27 -
-,2816.6 2817.0 7 7 1 + 481650.1 1650.1 2 0 c - 0.58 -1795.6 1795.6 3 0 c - 1.06 -1941.2 1941.2 4 0 c - 0.81 -
- 2833.0 8 7 0 - 49?1658.1 1658.1 2 0 c - 0.21 -1803.6 1803.6 3 0 c - 0.21 -1949.2 1949.2 4 0 c - 0.11 -
-,2978.9 2979.1 8 7 1 - 50
1731.1 1731.0 2 0 c - 0.20 -
1876.7 1876.7 3 0 c - 0.24 -
2022.2 2022.2 4 0 c - 0.58 -
2167.7 2167.7 5 0 c - 0.10 -
-,3182.1 3182.1 8 8 1 - 511832.7 1832.7 2 0 c - 0.12 -1978.2 1978.2 3 0 c - 0.21 -
-,3344.1 3344.1 9 8 1 -
(52)
Probably tetra-antennary with two N-acetyl-lactosamine extensions
2059.2 2059.2 3 0 c - 0.08 -
2204.8 2204.8 4 0 c - 0.06 -
(1) Compounds are listed in order of increasing mass of the neutral glycans. The masses for the acidic glycans that were found in the sample are listed after the neutral structures. Most compounds were not found as neutral structures in the intact glycan sample (as indicated by the dash in Column 1), but were found in the desialylated sample. Ions found in both samples are indicated as bold type. Where found values differed, both are reported. The same convention was followed in column 8.(2) Ions: a = [M+H2PO4]
-, b = [M-H]-, c = [M-2H]2-.(3) % of total identified glycans. T = trace.(4) + = confirmed by fragmentation.(5) The number corresponds to structures in Figure 6.(6) As confirmed by fragmentation and shown in Figure 6.(7) Agalactose residue has been replaced by GalNAc.
Table 1: Masses and compositions of the intact and Arthrobacter ureafacienssialidase-treatedN-glycans found in pituitary hFSH1

Citation: Bousfield GR, Butnev VY, Rueda-Santos MA, Brown A, Hall V, et al (2014) Macroand Micro Heterogeneity in Pituitary and Urinary FollicleStimulating Hormone Glycosylation. J Glycomics Lipidomics 4: 125. doi: 10.4172/2153-0637.1000125
Page 6 of 16
Volume 4 • Issue 4 • 1000124J Glycomics LipidomicsISSN: 2153-0637 JGL, an open access journal
Neutral compounds Structure5 Acidic compoundsm/z Composition
Ion2 Frag.3 %4m/z
Neu5Ac SO3H Ion2 Frag.3 %4
Found Calc. Hex HNAc dHex Found Calc.-,1372.4 1372.5 4 3 0 a - - 3,4 1565.5 1565.5 1 0 b - 0.231518.5 1518.5 4 3 1 a - 1.10 6,7 1711.6 1711.6 1 - b - 0.171575.5 1575.5 4 4 0 a 0.11 8,9 - - - - - -
-,1721.4 1721.6 4 4 1 a - 10,11 1914.6 1914.7 1 0 b - 0.09
1737.5
1737.41737.6 5 4 0 a - 0.20 12
-,1719.4 1719.5 0 1 b - -1930.6 1930.7 1 0 b + 1.561004.8 1004.8 1 1 c - 0.412221.7 2221.8 2 0 b + 0.571110.3 1110.4 2 0 c - 8.82
1778.6 1778.6 4 5 0 a - 0.12 13,14,15
1760.5 1760.6 0 1 b - 0.161971.7 1971.7 1 0 b + 0.671025.3 1025.3 1 1 c + 0.822262.7 2262.8 2 0 b - 0.091130.8 1130.9 2 0 c + 3.97
- 1819.6 3 6 0 a - - 161045.8 1045.8 1 1 c - 0.14940.3 940.3 0 2 c - 0.06
1883.5
1883.61883.6 5 4 1 a - 0.22 17
-,1865.6 1865.6 0 1 b + -2076.7 2076.7 1 0 b + 1.351077.8 1077.8 1 1 c - 0.392367.7 2367.8 1 0 b + 0.141183.3 1183.4 2 0 c + 8.61
1924.6 1924.6 4 5 1 a - 0.06 20
2117.7 2117.8 1 0 b + 0.181906.6 1906.6 0 1 b + 0.081098.3 1098.4 1 1 c - 0.451203.9 1203.9 2 0 c - 0.47
1940.6 1940.7 5 5 0 a - 0.11 21
-,1922.6 1922.6 0 1 b -2133.7 2133.8 1 0 b + 0.671211.9 1211.9 2 0 c + 4.032424.7 2424.9 2 0 b - 0.07
2086.7 2086.7 5 5 1 a - 0.12 252279.7 2279.8 1 0 b + 0.371284.9 1284.9 2 0 c + 2.75
2102.7 2102.76 5 0
a - 0.0526
2295.7 2295.8 1 0 b + 0.362586.8 2586.8 2 0 b + 0.07
-,1099.8 1099.9 c -1292.9 1292.9 2 0 c + 8.151438.4 1438.5 3 0 c + 5.08
-,2143.7 2143.7 5 6 0 a - - 28,29,30
2336.7 2336.8 1 0 b - 0.081207.9 1207.9 1 1 c - 0.531313.4 1313.5 2 0 c + 1.681458.9 1459.0 3 0 c - 0.60
-,2125.6 2125.7 1 b + -
2248.7 2248.86 5 1
a - 0.0532
2441.6 2441.6 1 0 b + 0.281260.4 1260.4 1 1 c - 0.351365.9 1366.0 2 0 c + 6.521405.9 1406.0 2 1 c - 0.291511.5 1511.5 3 0 c + 3.06
-,1172.8 1172.9 c - -,2230.7 2230.7 0 1 b - -
-,2289.7 2289.8 5 6 1 a - - 33,342482.9 2482.9 1 0 b - 0.041280.9 1280.9 c 1 1 - 0.361386.4 1386.5 2 0 c - 0.47
2305.7 2305.86 6 0
a - 0.0335
2498.8 2498.9 1 0 b + 0.161394.4 1394.5 2 0 c + 4.741540.0 1540.0 3 0 c + 2.61
-,1201.4 1201.4 c - - 2287.6 2287.8 0 1 b - -
-,2451.6 2451.96 6 1
a - -37
2644.8 2644.8 1 0 b - 0.071467.5 1467.5 2 0 c - 2.47
-,1274.4 1274.4 c - - 1613.0 1613.0 3 0 c + 0.98
-,2467.6 2467.87 6 0
a - -39,40
1475.5 1475.5 2 0 c - 5.101621.0 1621.0 3 0 c + 1.05
-,1282.3 1282.4 c - - 1766.6 1766.6 4 0 c - 0.23
Citation: Bousfield GR, Butnev VY, Rueda-Santos MA, Brown A, Hall V, et al (2014) Macroand Micro Heterogeneity in Pituitary and Urinary FollicleStimulating Hormone Glycosylation. J Glycomics Lipidomics 4: 125. doi: 10.4172/2153-0637.1000125
Page 7 of 16
Volume 4 • Issue 4 • 1000124J Glycomics LipidomicsISSN: 2153-0637 JGL, an open access journal
-,2613.6 2613.9
7 6 1a + -
42,43
1548.5 1548.5 2 0 c + 8.441588.5 1588.5 2 1 c - 0.161694.1 1694.1 3 0 c + 2.84
-,1355.4 1355.4 c - - 1839.6 1839.6 4 0 c - 0.76-,2670.7 2670.9
7 7 0a - -
46,471577.0 1577.0 2 0 c - 0.07
-,1383.9 1383.9 c - - 1722.6 1722.6 3 0 c - 0.36-,2816? 2817.0
7 7 1a + -
481650.1 1650.1 2 0 c - 0.73
-,1456.9 1457.0 c - - 1795.6 1795.6 3 0 c + 0.50- 2833.0
8 7 0a - -
491658.1 1658.1 2 0 c - 0.09
-,1464.9 1465.0 c - - 1803.6 1803.6 3 0 c - 0.13
-,2978.? 2979.18 7 1
a - -(50)
1731.0 1731.0 2 0 c - 0.301876.7 1876.7 3 0 c - 0.33
-,1538.0 1538.0 c - - 2022.2 2022.2 4 0 c - 0.29- 3182.1 8 8 1 a - - 51 1832.7 1832.7 2 0 c - 0.05
- 3344.1 9 8 1 a - -
(52)
Probably tetra-antennary with one fucose and two N-acetyl-lactosamine extensions
2059.2 2059.2 3 0 c - 0.14
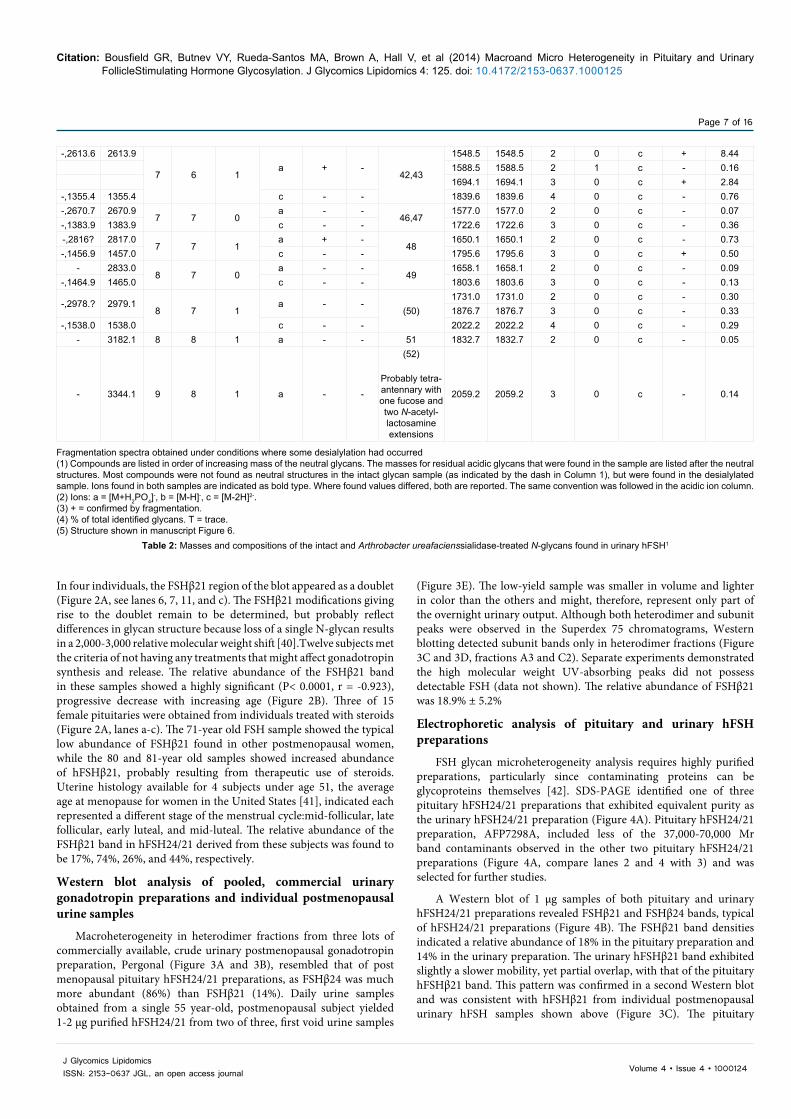
Fragmentation spectra obtained under conditions where some desialylation had occurred(1) Compounds are listed in order of increasing mass of the neutral glycans. The masses for residual acidic glycans that were found in the sample are listed after the neutral structures. Most compounds were not found as neutral structures in the intact glycan sample (as indicated by the dash in Column 1), but were found in the desialylated sample. Ions found in both samples are indicated as bold type. Where found values differed, both are reported. The same convention was followed in the acidic ion column.(2) Ions: a = [M+H2PO4]
-, b = [M-H]-, c = [M-2H]2-.(3) + = confirmed by fragmentation.(4) % of total identified glycans. T = trace.(5) Structure shown in manuscript Figure 6.
Table 2: Masses and compositions of the intact and Arthrobacter ureafacienssialidase-treated N-glycans found in urinary hFSH1
In four individuals, the FSHβ21 region of the blot appeared as a doublet (Figure 2A, see lanes 6, 7, 11, and c). The FSHβ21 modifications giving rise to the doublet remain to be determined, but probably reflect differences in glycan structure because loss of a single N-glycan results in a 2,000-3,000 relative molecular weight shift [40].Twelve subjects met the criteria of not having any treatments that might affect gonadotropin synthesis and release. The relative abundance of the FSHβ21 band in these samples showed a highly significant (P< 0.0001, r = -0.923), progressive decrease with increasing age (Figure 2B). Three of 15 female pituitaries were obtained from individuals treated with steroids (Figure 2A, lanes a-c). The 71-year old FSH sample showed the typical low abundance of FSHβ21 found in other postmenopausal women, while the 80 and 81-year old samples showed increased abundance of hFSHβ21, probably resulting from therapeutic use of steroids. Uterine histology available for 4 subjects under age 51, the average age at menopause for women in the United States [41], indicated each represented a different stage of the menstrual cycle:mid-follicular, late follicular, early luteal, and mid-luteal. The relative abundance of the FSHβ21 band in hFSH24/21 derived from these subjects was found to be 17%, 74%, 26%, and 44%, respectively.
Western blot analysis of pooled, commercial urinary gonadotropin preparations and individual postmenopausal urine samples
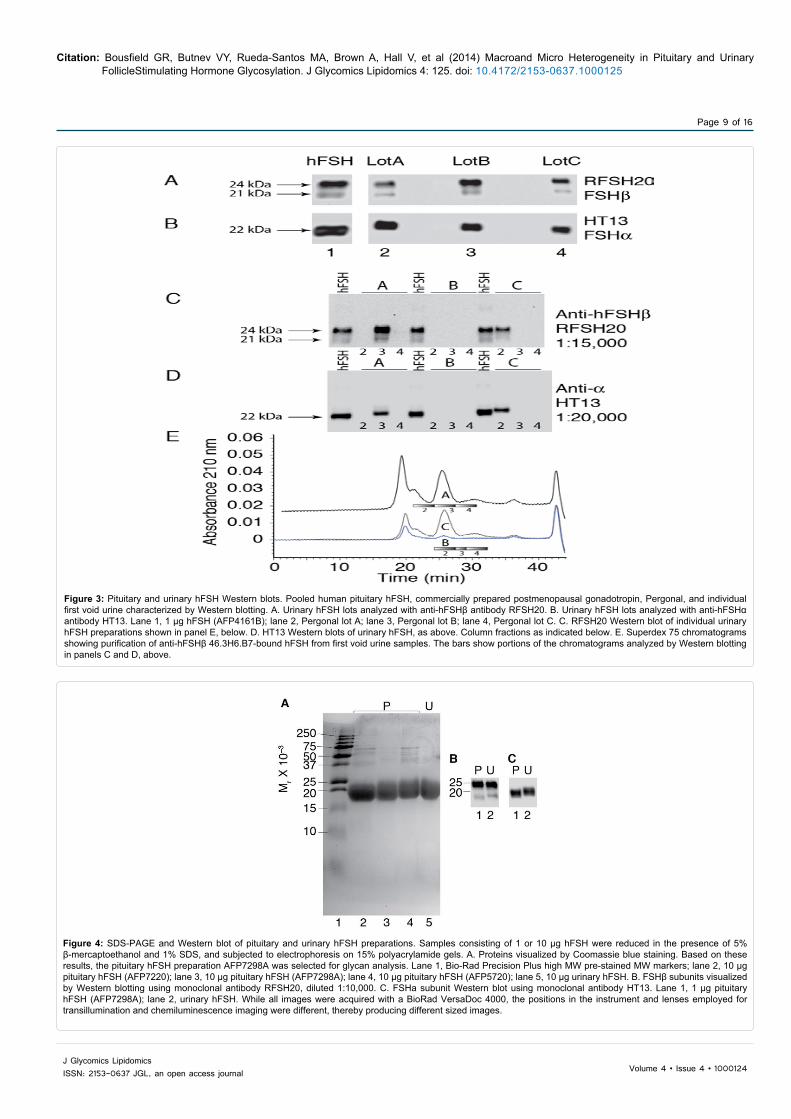
Macroheterogeneity in heterodimer fractions from three lots of commercially available, crude urinary postmenopausal gonadotropin preparation, Pergonal (Figure 3A and 3B), resembled that of post menopausal pituitary hFSH24/21 preparations, as FSHβ24 was much more abundant (86%) than FSHβ21 (14%). Daily urine samples obtained from a single 55 year-old, postmenopausal subject yielded 1-2 µg purified hFSH24/21 from two of three, first void urine samples
(Figure 3E). The low-yield sample was smaller in volume and lighter in color than the others and might, therefore, represent only part of the overnight urinary output. Although both heterodimer and subunit peaks were observed in the Superdex 75 chromatograms, Western blotting detected subunit bands only in heterodimer fractions (Figure 3C and 3D, fractions A3 and C2). Separate experiments demonstrated the high molecular weight UV-absorbing peaks did not possess detectable FSH (data not shown). The relative abundance of FSHβ21 was 18.9% ± 5.2%
Electrophoretic analysis of pituitary and urinary hFSH preparations
FSH glycan microheterogeneity analysis requires highly purified preparations, particularly since contaminating proteins can be glycoproteins themselves [42]. SDS-PAGE identified one of three pituitary hFSH24/21 preparations that exhibited equivalent purity as the urinary hFSH24/21 preparation (Figure 4A). Pituitary hFSH24/21 preparation, AFP7298A, included less of the 37,000-70,000 Mr band contaminants observed in the other two pituitary hFSH24/21 preparations (Figure 4A, compare lanes 2 and 4 with 3) and was selected for further studies.
A Western blot of 1 µg samples of both pituitary and urinary hFSH24/21 preparations revealed FSHβ21 and FSHβ24 bands, typical of hFSH24/21 preparations (Figure 4B). The FSHβ21 band densities indicated a relative abundance of 18% in the pituitary preparation and 14% in the urinary preparation. The urinary hFSHβ21 band exhibited slightly a slower mobility, yet partial overlap, with that of the pituitary hFSHβ21 band. This pattern was confirmed in a second Western blot and was consistent with hFSHβ21 from individual postmenopausal urinary hFSH samples shown above (Figure 3C). The pituitary

Citation: Bousfield GR, Butnev VY, Rueda-Santos MA, Brown A, Hall V, et al (2014) Macroand Micro Heterogeneity in Pituitary and Urinary FollicleStimulating Hormone Glycosylation. J Glycomics Lipidomics 4: 125. doi: 10.4172/2153-0637.1000125
Page 8 of 16
Volume 4 • Issue 4 • 1000124J Glycomics LipidomicsISSN: 2153-0637 JGL, an open access journal
Figure 1: Determination of FSH glycoform content of pituitary hFSH21 by Western blot and dual tandem Superdex 75 gel filtration. A. Isolation of hFSH immunopurified from a 55 year old male pituitary by Superdex 75 gel filtration using a single, 10 X 300 mm column. Inset. Representative Western blot using anti-hFSHβ antibody, RFSH20, performed in triplicate. B. Representative chromatogram measuring glycoform abundance using two Superdex 75 columns combined in series and monitoring the effluent at 210 nm. C. Representative chromatogram measuring FSH glycoform abundance on the same columns, monitoring absorbance at 280 nm. The percentages in each panel indicate the mean of three determinations of the partially glycosylated hFSH21 variant relative abundance.
Figure 2: Relative abundance of hFSH21 in pituitaries of 12 women as a function of age. A. Collage of representative Western blots from each individual. Lanes 1-12 were included in the correlation analysis. Lanes a-c were excluded due to steroid treatment, which appeared to increase the abundance of the hFSHβ21 band in 2 of 3 cases. B. Plot of average (±Std. Dev.) relative abundance of the hFSHβ21 band determined by Western blots for three or four 1-µg samples of each hFSH preparation. A highly significant negative correlation was associated with increasing age.
hFSHα band migrated a bit faster than the urinary hFSHα band while maintaining considerable overlap with the latter (Figure 4C). This was also consistent with the individual urinary sample hFSHα bands in Figure 3D.
Comparison of pituitary and urinary hFSH glycans
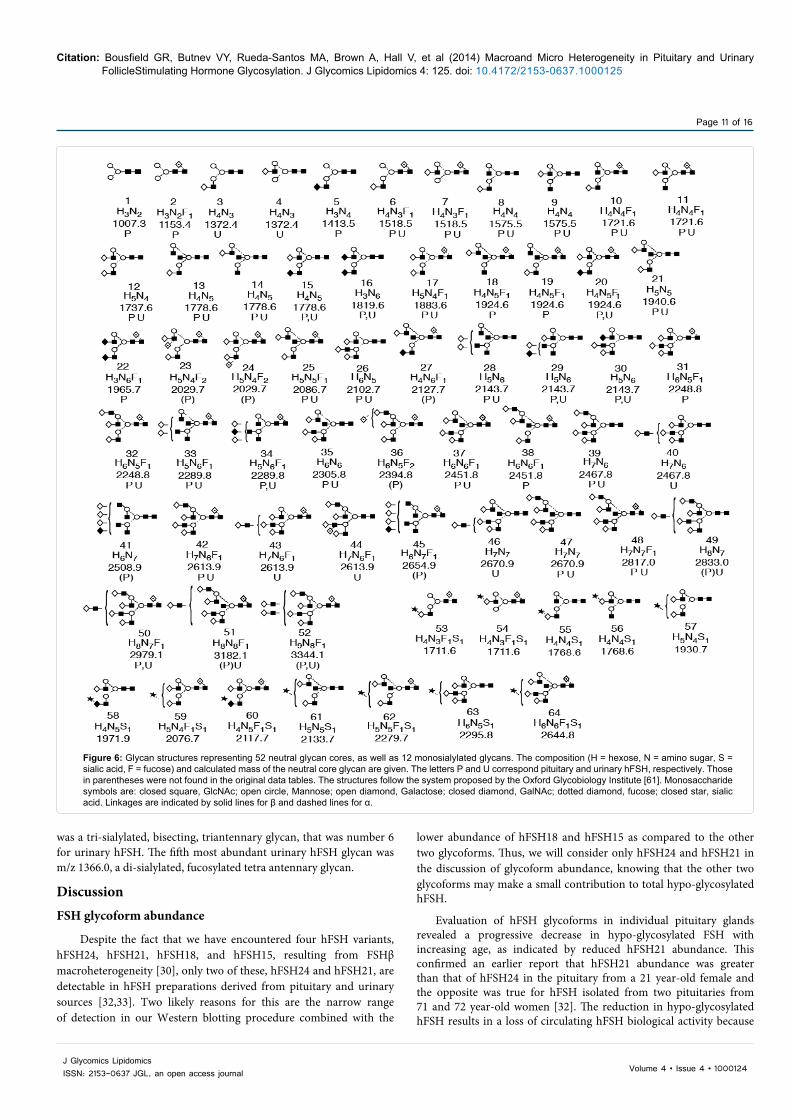
PNGaseF-released, intact N-glycans from pituitary and urinary hFSH24/21 were characterized by negative ion nano-electrospray mass spectrometry (Figure 5) and the resulting mass spectra used to make quantitative comparisons between the intact and desialylated glycan populations associated with pituitary (Table 1) and urinary (Table 2) hFSH. Desialylated glycan spectra were used to define the neutral core structures by MS/MS procedures. We identified 84 ions corresponding to potential pituitary hFSH24/21 glycans and 68 ions corresponding to potential urinary hFSH24/21 glycans (Tables 1 and 2). Structures of the core glycans and selected sialylated glycans are shown in Figure 6 and revealed considerable structural heterogeneity in the 52 glycan core structures that were consistent with the 34 neutral glycan ions. Fourteen of 84 pituitary and 30 of 68 urinary hFSH24/21 glycans were confirmed by fragmentation of neutral glycan ions. Comparing the two populations, a total of 95 glycan ions were detected, of which 63 glycan ions were common to both spectra. The abundance of glycan ions common to both spectra accounted for 95% of the pituitary and 94% of the urinary hFSH24/21 glycans. Qualitatively, the pituitary glycan spectrum lacked 17 ions detected in urinary hFSH24/21 glycans, while the latter lacked 16 glycan ions detected in the former, however, these were all low in abundance.
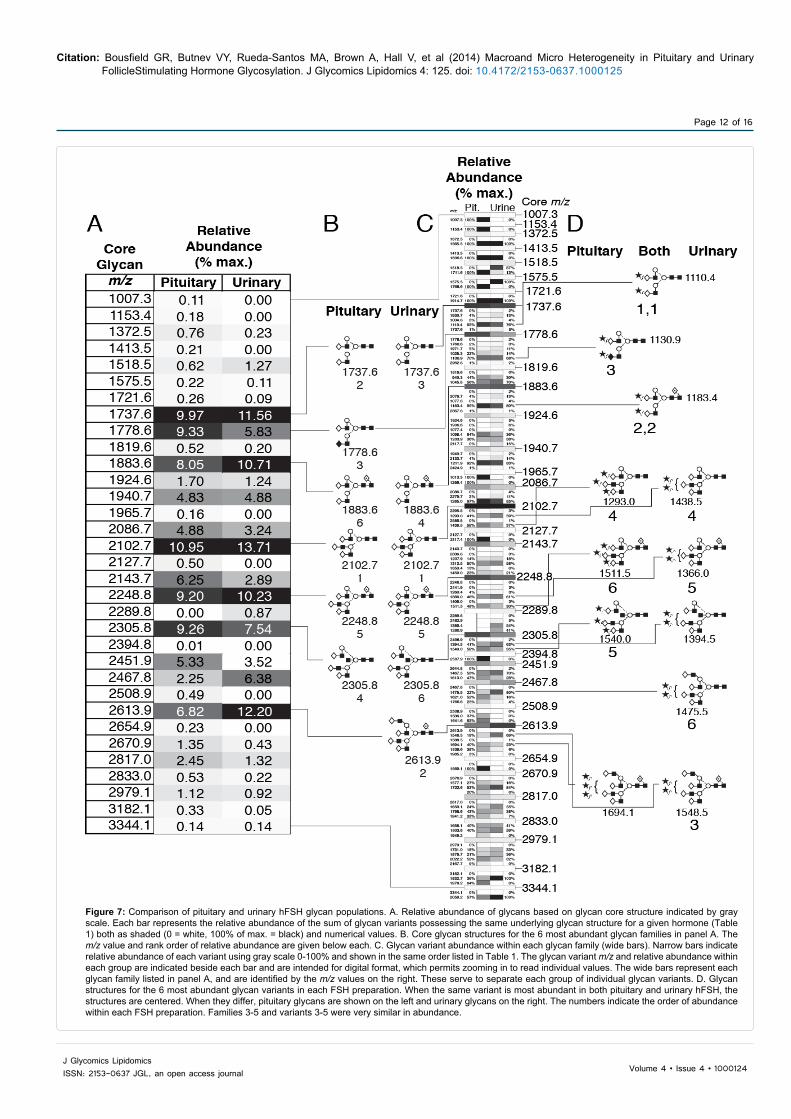
Relative abundance data for urinary and pituitary hFSH24/21 glycans are compared in Figure 7. Based on shared neutral glycan core structure, the most abundant family in both hFSH preparations was m/z 2102.7, which represented triantennary glycans. The second most abundant family in pituitary hFSH was m/z 1737.6, which was biantennary and was also the third most abundant family in urinary hFSH. The second most abundant urinary hFSH glycan family was m/z 2613.9, which was a core-fucosylated tetra antennary glycan. The third most abundant glycan in pituitary hFSH was m/z 1778.6, which was a biantennary glycan possessing a GalNAc residue instead of Gal in one of the branches. The fourth most abundant pituitary hFSH glycan was m/z 2305.8, which was a triantennary glycan possessing a bisecting GlcNAc residue and the fifth most abundant was m/z 2248.8 a fucosylated triantennar yglycan, which was also the fifth most abundant family in urinary hFSH. For urinary hFSH the fourth most abundant glycan family was m/z 1883.4 a fucosylated biantennary glycan that was 6th most abundant in pituitary hFSH.
When the most abundant glycan variants were compared (Figure 7D), a somewhat different pattern emerged. The most abundant glycan variant in both pituitary and urinary hFSH was m/z 1110.4, which was a di-sialylated, biantennary glycan from the m/z 1737.6 family that was second and third most abundant in pituitary and urinary hFSH, respectively. The next most abundant glycan variant was m/z 1183.4, which was another disialylated, biantennary glycan possessing core fucose. This was a member of the m/z 1883.6 glycan family that was ranked 6th in pituitary and 4th in urinary hFSH glycan abundance. The 3rd most abundant glycans differed, as pituitary hFSH was m/z1130.4, a disialylated, biantennary glycan with GalNAc instead of Gal in one branch from the m/z 1737.6 glycan family, while urinary hFSH was a di-sialylated, fucosylated tetra antennary glycan from the m/z 2613.9 family. The fourth most abundant glycan variants for both pituitary and urinary hFSH were members of the m/z 2102.7 family, however, the pituitary hFSH variant, m/z 1293.0, possessed three sialic acid residues, while the urinary variant, m/z 1438.5, possessed only two. The fifth most abundant variant in pituitary hFSH was m/z 1540.0, which
Citation: Bousfield GR, Butnev VY, Rueda-Santos MA, Brown A, Hall V, et al (2014) Macroand Micro Heterogeneity in Pituitary and Urinary FollicleStimulating Hormone Glycosylation. J Glycomics Lipidomics 4: 125. doi: 10.4172/2153-0637.1000125
Page 9 of 16
Volume 4 • Issue 4 • 1000124J Glycomics LipidomicsISSN: 2153-0637 JGL, an open access journal
Figure 3: Pituitary and urinary hFSH Western blots. Pooled human pituitary hFSH, commercially prepared postmenopausal gonadotropin, Pergonal, and individual first void urine characterized by Western blotting. A. Urinary hFSH lots analyzed with anti-hFSHβ antibody RFSH20. B. Urinary hFSH lots analyzed with anti-hFSHα antibody HT13. Lane 1, 1 µg hFSH (AFP4161B); lane 2, Pergonal lot A; lane 3, Pergonal lot B; lane 4, Pergonal lot C. C. RFSH20 Western blot of individual urinary hFSH preparations shown in panel E, below. D. HT13 Western blots of urinary hFSH, as above. Column fractions as indicated below. E. Superdex 75 chromatograms showing purification of anti-hFSHβ 46.3H6.B7-bound hFSH from first void urine samples. The bars show portions of the chromatograms analyzed by Western blotting in panels C and D, above.
Figure 4: SDS-PAGE and Western blot of pituitary and urinary hFSH preparations. Samples consisting of 1 or 10 µg hFSH were reduced in the presence of 5% β-mercaptoethanol and 1% SDS, and subjected to electrophoresis on 15% polyacrylamide gels. A. Proteins visualized by Coomassie blue staining. Based on these results, the pituitary hFSH preparation AFP7298A was selected for glycan analysis. Lane 1, Bio-Rad Precision Plus high MW pre-stained MW markers; lane 2, 10 µg pituitary hFSH (AFP7220); lane 3, 10 µg pituitary hFSH (AFP7298A); lane 4, 10 µg pituitary hFSH (AFP5720); lane 5, 10 µg urinary hFSH. B. FSHβ subunits visualized by Western blotting using monoclonal antibody RFSH20, diluted 1:10,000. C. FSHa subunit Western blot using monoclonal antibody HT13. Lane 1, 1 µg pituitary hFSH (AFP7298A); lane 2, urinary hFSH. While all images were acquired with a BioRad VersaDoc 4000, the positions in the instrument and lenses employed for transillumination and chemiluminescence imaging were different, thereby producing different sized images.

Citation: Bousfield GR, Butnev VY, Rueda-Santos MA, Brown A, Hall V, et al (2014) Macroand Micro Heterogeneity in Pituitary and Urinary FollicleStimulating Hormone Glycosylation. J Glycomics Lipidomics 4: 125. doi: 10.4172/2153-0637.1000125
Page 10 of 16
Volume 4 • Issue 4 • 1000124J Glycomics LipidomicsISSN: 2153-0637 JGL, an open access journal
Figure 5: ESI-mass spectrometry analysis of intact pituitary and urinary hFSH glycans. A. Negative ion ESI spectrum of pituitary hFSH glycans. B. Negative ion ESI spectrum of urinary hFSH oligosaccharides. Neutral and acidic glycan masses along with compositions are listed in Tables 1 and 2.
Citation: Bousfield GR, Butnev VY, Rueda-Santos MA, Brown A, Hall V, et al (2014) Macroand Micro Heterogeneity in Pituitary and Urinary FollicleStimulating Hormone Glycosylation. J Glycomics Lipidomics 4: 125. doi: 10.4172/2153-0637.1000125
Page 11 of 16
Volume 4 • Issue 4 • 1000124J Glycomics LipidomicsISSN: 2153-0637 JGL, an open access journal
Figure 6: Glycan structures representing 52 neutral glycan cores, as well as 12 monosialylated glycans. The composition (H = hexose, N = amino sugar, S = sialic acid, F = fucose) and calculated mass of the neutral core glycan are given. The letters P and U correspond pituitary and urinary hFSH, respectively. Those in parentheses were not found in the original data tables. The structures follow the system proposed by the Oxford Glycobiology Institute [61]. Monosaccharide symbols are: closed square, GlcNAc; open circle, Mannose; open diamond, Galactose; closed diamond, GalNAc; dotted diamond, fucose; closed star, sialic acid. Linkages are indicated by solid lines for β and dashed lines for α.
was a tri-sialylated, bisecting, triantennary glycan, that was number 6 for urinary hFSH. The fifth most abundant urinary hFSH glycan was m/z 1366.0, a di-sialylated, fucosylated tetra antennary glycan.
DiscussionFSH glycoform abundance
Despite the fact that we have encountered four hFSH variants, hFSH24, hFSH21, hFSH18, and hFSH15, resulting from FSHβ macroheterogeneity [30], only two of these, hFSH24 and hFSH21, are detectable in hFSH preparations derived from pituitary and urinary sources [32,33]. Two likely reasons for this are the narrow range of detection in our Western blotting procedure combined with the
lower abundance of hFSH18 and hFSH15 as compared to the other two glycoforms. Thus, we will consider only hFSH24 and hFSH21 in the discussion of glycoform abundance, knowing that the other two glycoforms may make a small contribution to total hypo-glycosylated hFSH.
Evaluation of hFSH glycoforms in individual pituitary glands revealed a progressive decrease in hypo-glycosylated FSH with increasing age, as indicated by reduced hFSH21 abundance. This confirmed an earlier report that hFSH21 abundance was greater than that of hFSH24 in the pituitary from a 21 year-old female and the opposite was true for hFSH isolated from two pituitaries from 71 and 72 year-old women [32]. The reduction in hypo-glycosylated hFSH results in a loss of circulating hFSH biological activity because
Citation: Bousfield GR, Butnev VY, Rueda-Santos MA, Brown A, Hall V, et al (2014) Macroand Micro Heterogeneity in Pituitary and Urinary FollicleStimulating Hormone Glycosylation. J Glycomics Lipidomics 4: 125. doi: 10.4172/2153-0637.1000125
Page 12 of 16
Volume 4 • Issue 4 • 1000124J Glycomics LipidomicsISSN: 2153-0637 JGL, an open access journal
Figure 7: Comparison of pituitary and urinary hFSH glycan populations. A. Relative abundance of glycans based on glycan core structure indicated by gray scale. Each bar represents the relative abundance of the sum of glycan variants possessing the same underlying glycan structure for a given hormone (Table 1) both as shaded (0 = white, 100% of max. = black) and numerical values. B. Core glycan structures for the 6 most abundant glycan families in panel A. The m/z value and rank order of relative abundance are given below each. C. Glycan variant abundance within each glycan family (wide bars). Narrow bars indicate relative abundance of each variant using gray scale 0-100% and shown in the same order listed in Table 1. The glycan variant m/z and relative abundance within each group are indicated beside each bar and are intended for digital format, which permits zooming in to read individual values. The wide bars represent each glycan family listed in panel A, and are identified by the m/z values on the right. These serve to separate each group of individual glycan variants. D. Glycan structures for the 6 most abundant glycan variants in each FSH preparation. When the same variant is most abundant in both pituitary and urinary hFSH, the structures are centered. When they differ, pituitary glycans are shown on the left and urinary glycans on the right. The numbers indicate the order of abundance within each FSH preparation. Families 3-5 and variants 3-5 were very similar in abundance.
Citation: Bousfield GR, Butnev VY, Rueda-Santos MA, Brown A, Hall V, et al (2014) Macroand Micro Heterogeneity in Pituitary and Urinary FollicleStimulating Hormone Glycosylation. J Glycomics Lipidomics 4: 125. doi: 10.4172/2153-0637.1000125
Page 13 of 16
Volume 4 • Issue 4 • 1000124J Glycomics LipidomicsISSN: 2153-0637 JGL, an open access journal
hypo-glycosylated hFSH glycoforms have been shown to exhibit a 10-fold greater affinity for the FSH receptor, occupy 2-fold more FSH receptor sites, associate with the FSH receptor more rapidly, and are more active in vivo than hFSH24 [30,31]. The greater activity of hypo-glycosylated hFSH is at least in part due to greater receptor occupancy, consistent with the report that when receptor density was varied the response of target cells was proportional to the amount of FSH bound [43]. Another possible mechanism results from the greater clearance rate shown for recombinant hFSH glycosylation mutants lacking either an Asn7 glycan or an Asn24 glycan [44]. Baenziger has argued that rapid clearance of LH, mediated by sulfated glycan clearance in the liver, is necessary for avoiding desensitization of the LH receptor [45], as has been demonstrated in the pituitary for the GnRH receptor [46]. While episodic stimulation of the gonadotrope by GnRH has been shown to be a critical regulator of gonadotropin synthesis and release [47], superovulation with a long acting FSH analog, equine chorionic gonadotropin (also known as PMSG) suggests episodic gonadotropin patterns in serum are unnecessary. However, a recent study involving transgenic mice expressing a human FSHβ variant that possess the C-terminal heptapeptide sequence normally associated with LHβ, directed the mutant FSH to dense-core, regulated secretory vesicles [48]. The relevant physiological consequence was superovulation of mice at each ovulation producing 6-fold more oocytes than wild type mice. In sheep portal blood episodic release of FSH has been demonstrated on a background of high tonic FSH secretion. It is possible hypoglycosylated hFSH21 and hFSH18 provide an episodic pattern of FSH signals to the human ovary that diminishes with loss of these forms as women age [33]. Indeed, differential patterns of secretion for FSH glycoforms during the human menstrual cycle have been reported recently [20].
The reduced, but intermediate hFSH21 abundance in the pituitaries from 37-41 year-old women suggested hFSH21 abundance might provide a marker for reproductive aging, provided a less invasive method could be found to measure it. As amounts of hFSH needed for these analytical procedures require very large serum volumes during most of the reproductive cycle, urinary samples are the most accessible alternative. Santoro and colleagues [49] used urinary concentrations of hFSH to define daily gonadotropin patterns throughout the menstrual cycle and found they paralleled serum gonadotropin patterns. However, several concerns attend analyzing glycoform abundance in urine samples. Hypo-glycosylated hFSH may represent a biosynthetic intermediate that is not secreted, differential rates of clearance might alter glycoform ratios in urine, and serum hFSH isoform patterns suggest its population of FSH variants differs from those in both pituitary and urinary hFSH.
Hypo-glycosylated hFSH21 is not a biosynthetic intermediate
The concern that hFSH21 represented a biosynthetic intermediate arose from studies of hypo-glycosylated hFSH21/18 isolated from hLH preparations that possessed an unusually high abundance of oligomannoseglycans that resembled those found in the ER and cis-Golgi [30]. However, detailed analysis revealed that complex glycans were attached to the same subunit, indicating travel through the trans-Golgi, and even some of the oligomannose glycans possessed fucose, which is also added in the Golgi. Although hFSH21 was originally identified in pituitary hFSH preparations [32,33], data presented herein show that it is also present in pooled urinary hFSH preparations derived from postmenopausal women, as well as individual first void postmenopausal urine samples. These observations are particularly significant because the only way for a pituitary hFSH glycoform
to reach the urine is through the blood. Therefore, hFSH21 is not a biosynthetic precursor found only in the pituitary, but is also present in serum, where it can contribute to ovarian regulation.
Glycoform clearance does not alter ratios
Another concern with quantifying urinary glycoform abundance was that hFSH21 is cleared from the circulation more rapidly and, therefore, would appear to be more abundant in urine than in either the pituitary or the serum. Less acidic hFSH, which probably was enriched for hypo-glycosylated hFSH, was eliminated from mouse serum more rapidly than more acidic hFSH [15,50]. Studies with recombinant hFSH glycosylation mutants indicated FSHβ-subunit glycans determined serum clearance rates in rats to a much greater extent than α-subunit glycans [44]. A combination of biochemical and transgenic mouse studies have established that hFSH21 lacks only FSHβ Asn7 glycan [31], which was cleared more slowly than hFSH15 [44]. In postmenopausal urinary hFSH24/21 preparations characterized in the present study, the average relative abundance of the hFSHβ21 band was 14-18%, as compared with 17% relative abundance of hFSHβ21 in three postmenopausal pituitary hFSH samples. Thus, kidney clearance did not appreciably alter hFSH21 abundance in urinary samples.
FSH isoforms do not vary significantly in N-glycan populations
A major objection to evaluating glycoform abundance in urinary hFSH samples in order to infer glycosylation of serum hFSH is the concept that pituitary, serum, and urinary hFSH are differentially glycosylated. This concept arose from studies using zone electrophoresis, isoelectric focusing, or chromatofocusing combined with radioimmunoassay to evaluate charge variation in gonadotropins in these three compartments [11]. The different patterns for pituitary, serum, and urinary hFSH isoforms suggested that, as the populations of isoforms in each compartment were significantly different, only serum hFSH isoform patterns were physiologically relevant [11]. However, FSH-derived glycopeptide mass spectrometry demonstrated that hFSH isoforms isolated from purified pituitary hFSH by the widely used chromatofocusing procedure, possessed very similar glycan populations [28]. Glycopeptide MS data indicated almost 1000 unique hFSH isoforms may exist [6,28], if all possible combinations of the glycans identified at each site are found in nature. As charge-based separations produce fewer than 40 isoform fractions [11], each isoform preparation contains a population of different isoforms. Indeed, when 6 isoform fractions, obtained by isoelectric focusing of a purified hFSH preparation, were further fractionated by anion exchange chromatography, each FSH isoform fraction yielded 2-5 subfractions that varied in the number of sialic acids by as many as 3 residues [51-53]. Thus, FSH isoform patterns fail to reflect underlying glycosylation responsible for charge differences and a major objection to extrapolating from pituitary and urinary to serum hFSH appears to be eliminated. Preliminary studies indicate enough hFSH can be obtained noninvasively on a daily basis from 50% of first void urine samples during a typical cycle to permit glycoform analysis by a modified Western blotting procedure (May and Bousfield, unpublished).
Urinary vs. Pituitary hFSH glycosylation microheterogenity
Previously, gonadotropin glycan analysis required 1-10 mg samples [54-56]. Even though FSH glycans were probably derived from samples at the low end of this range, the limited availability of FSH isoforms made it impossible to characterize their glycosylation directly. Nano-electrospray mass spectrometry can perform the same total oligosaccharide population analysis with as little as 10 µg FSH

Citation: Bousfield GR, Butnev VY, Rueda-Santos MA, Brown A, Hall V, et al (2014) Macroand Micro Heterogeneity in Pituitary and Urinary FollicleStimulating Hormone Glycosylation. J Glycomics Lipidomics 4: 125. doi: 10.4172/2153-0637.1000125
Page 14 of 16
Volume 4 • Issue 4 • 1000124J Glycomics LipidomicsISSN: 2153-0637 JGL, an open access journal
[30,57], which permits analysis of scarce FSH variants. As we use hFSH glycans attached to a highly purified pituitary hFSH preparation, AFP7298A (8560 IU/mg), as a baseline for glycoform glycan population comparisons, it is useful to see how the results for this preparation and a highly purified urinary hFSH preparation compare with each other and with previously reported studies involving pituitary hFSH preparations.
In terms of overall glycan type, mass spectrometry indicated both preparations possessed about the same amount of biantennary glycans, with 38.2% for pituitary hFSH and 37.2% for urinary hFSH (Table 3). Alastair Renwick’s laboratory [54] reported more (46%) biantennary glycans in a different pituitary hFSH preparation (>1950 IU/mg) purified in that laboratory, while Jacques Baenziger’s laboratory [55,56] reported a similar value, 36%, for National Hormone and Pituitary Program hFSH preparations (AFP-4822B and NIAMDD-hFSH-2, 3100 & 3925 IU/mg, respectively). For tri-antennary glycans we found the third branch only on the Man-α(1–3)Man antenna (3-branch), with urinary hFSH a little more enriched, 44%, than pituitary hFSH, 41%. A bit more of this variant, 49%, was reported by Baenziger’s laboratory, while considerably less, 30.3%, was reported by Renwick’s laboratory. The reason for the large discrepancy with the latter report was 17.2% triantennary glycans were determined to possess the third branch on the Man-α(1–6)Man antenna (6-branch), based on methylation analysis [54]. Although we were readily able to detect glycan structures possessing the third antenna on the 6-branch in a recombinant hFSH glycan preparation that was evaluated at the same time, they were undetectable in all pituitary and urinary hFSH glycan preparations that we have examined. Tetra-antennary glycans in our study were almost identical in abundance between pituitary and urinary hFSH preparations, 15% vs. 14.8%, respectively, and much higher than either Renwick (5%) or Baenziger (0%) reported. This may be a methodological difference. Complex glycans accounted for >94% of pituitary and urinary glycans in our analysis and that of Renwick, while in the Baenziger report these amounted to only 85%. The latter value reflected the highest reported abundance of neutral oligosaccharides (10%) as compared with 0.3% in pituitary and 2.2% in urinary glycans in our study, and 5% in the Renwick report. Sulfated and sialylated/sulfated glycans were both absent in the Renwick analysis. The pituitary FSH sulfated glycan values we found were similar to those reported by Baenziger (6.5%vs.7%) while the 5% sialylated/sulfated glycans in urinary hFSH were intermediate between 4.9% in our study and 3.9% in Baenziger’s for pituitary hFSH. Fucose was highest in the Renwick report, followed by pituitary hFSH in our study. It was significantly lower in urinary hFSH (23.9%) representing a 44-53% reduction compared with pituitary hFSH in our report and that of Renwick. The Baenziger study did not report fucose abundance. Only a trace amount of antenna fucose was detected in pituitary hFSH in our study, none in urinary hFSH, and none in the other two reports. Bisecting GlcNAc was highest in the Baenziger report, 34%, somewhat lower in our pituitary hFSH, 32.6%, and much lower in the Renwick study and in urinary hFSH, 21% and 23.9%, respectively.
Loss of sulfated glycan-decorated glycoproteins is typically attributed to a sulfated glycan-binding domain at the amino terminus of the liver mannose receptor [45,58]. Therefore, it was somewhat surprising to find sulfated urinary hFSH glycan abundance reduced only 22-40% from pituitary levels while fucosylated glycans were reduced 44-53%. Glycans possessing a bisecting GlcNAc residue were reduced 27-30% in comparison with our pituitary hFSH and Baenziger’s report, but were essentially unchanged from the abundance reported by Renwick. It is possible that location of the glycans in FSH
influences their effects on clearance, as recombinant glycosylation site mutants revealed a significant increase in clearance rate only when the FSHβ subunit sites were eliminated by mutation [44].
Thus, it is reasonable to speculate that surviving sulfated glycans were attached to either one of two α subunit glycosylation sites. Since as many as 4 glycans can be attached to FSH, the disappearance of fucosylated and bisecting GlcNAc-possessing glycans might result from residing on the same FSH molecule as a sulfated glycan. Site-specific glycan population analysis would be needed to test that hypothesis. Glycans that preferentially appeared in the urine were largely tri- and tetra-antennary glycans missing a single sialic acid residue, possibly because this glycan has lower affinity for the liver asialoglycoprotein receptor than glycans with 3 exposed galactosyl residues [59]. Still, it was somewhat surprising that partially sialylated glycans in both groups were more abundant in urinary hFSH, while fully sialylated glycans were more abundant in pituitary hFSH, as if the latter were cleared by another mechanism, such as in the liver, rather than in the kidney. Because sialic acid linked α(2-6) to Gal residues apparently does not block binding to the asialoglycoprotein receptor [60], it is possible that the pituitary-enriched, fully sialylated glycans are enriched for α(2-6)-linked sialic acid, which is found in hFSH glycans [56]. Conclusions regarding clearance mechanisms should be tempered by the knowledge that we are comparing glycans derived from pituitary and urinary hFSH preparations prepared by different laboratories using proprietary procedures. Accordingly, some of the differences in glycan population abundance could be due to unknown differences in purification methods employed by the National Hormone and Pituitary Program and ProSpec.
We previously reported that the most abundant glycan associated with each hFSH glycosylation site differs from the other three [6,28]. In site-specific glycan populations derived from human, ovine, and porcine LH preparations, the most abundant glycan was far more abundant than all the others, suggesting that in a mixture of total LH glycans, the three most abundant glycans represent the most abundant at each site (Bousfield and Harvey, unpublished data). In the case of FSH, the top four glycans could be considered contenders for most abundant at each site. While the first and second most abundant glycan families or variants were obvious, the abundances of the third through fifth were similar, before a drop for the sixth. The high degree of microheterogeneity of FSH glycans most likely reduced the abundance of any one glycan, making it more difficult to define four glycans combined with the FSH polypeptide moieties that would constitute a realistic model for glycosylated FSH. Although glycan microheterogeneity probably produced the reduced electrophoretic mobilities of urinary hFSHβ21 and α-subunit bands, the most abundant glycans did not rationalize the slower mobilities as the top 4 glycan variants predicted 11 antennae total for urinary hFSH glycans as compared with 9 for pituitary hFSH as well as an equal number of sialic acid residues. Site-specific glycan abundance data are probably necessary for this purpose.
ConclusionsAn age-related decrease in hypo-glycosylated hFSH21 abundance
is observed in human pituitary glands. The presence of hFSH21 in urine indicates that it is secreted into the blood, where it can participate in ovarian regulation. Acknowledgements
This work was supported by National Institutes of Health grants P01 AG-029531, G20 RR-031092, and P20 RR-016475. We thank Dr. Naomi Rance, University of Arizona College of Medicine, for providing many of the human pituitary
Citation: Bousfield GR, Butnev VY, Rueda-Santos MA, Brown A, Hall V, et al (2014) Macroand Micro Heterogeneity in Pituitary and Urinary FollicleStimulating Hormone Glycosylation. J Glycomics Lipidomics 4: 125. doi: 10.4172/2153-0637.1000125
Page 15 of 16
Volume 4 • Issue 4 • 1000124J Glycomics LipidomicsISSN: 2153-0637 JGL, an open access journal
glands employed in this study. The late Vinod Singh (Northeastern Hill University, Shillong, India) prepared the antibody affinity columns used extensively in this study.
References
1. Varki A (1993) Biological roles of oligosaccharides: all of the theories are correct. Glycobiology 3: 97-130.
2. Weisshaar G, Hiyama J, Renwick AG (1990) Site-specific N-glycosylation of ovine lutropin. Structural analysis by one- and two-dimensional 1H-NMR spectroscopy. Eur J Biochem 192: 741-751.
3. Weisshaar G, Hiyama J, Renwick AGC (1991) Site-specific N-glycosylation of human chorionic gonadotropin—structural analysis of glycopeptides by one- and two-dimensional 1H NMR spectroscopy. Glycobiology 1: 393-404.
4. Weisshaar G, Hiyama J, Renwick AG, Nimtz M (1991) NMR investigations of the N-linked oligosaccharides at individual glycosylation sites of human lutropin. Eur J Biochem 195: 257-268.
5. Hiyama J, Weisshaar G, Renwick AG (1992) The asparagine-linked oligosaccharides at individual glycosylation sites in human thyrotrophin. Glycobiology 2: 401-409.
6. Dalpathado DS, Irungu JA, Go EP, Butnev VY, Norton K, et al. (2006) Comparative glycomics of the glycoprotein hormone follicle-stimulating hormone (FSH): glycopeptide analysis of isolates from two mammalian species. Biochemistry 45: 8665-8673.
7. Irungu J, Dalpathado DS, Go EP, Jiang H, Ha HV, et al. (2006) Method for characterizing sulfated glycoproteins in a glycosylation site-specific fashion, using ion pairing and tandem mass spectrometry. Anal Chem 78: 1181-1190.
8. Chappel SC, Ulloa-Aguirre A, Coutifaris C (1983) Biosynthesis and secretion of follicle-stimulating hormone. Endocr Rev 4: 179-211.
9. Bousfield GR, Dias JA (2011) Synthesis and secretion of gonadotropins including structure-function correlates. Rev Endocr Metab Disord 12: 289-302.
10. Dias JA (2001) Is there any physiological role for gonadotropin oligosaccharide heterogeneity in humans? II. A biochemical point of view. Hum Reprod 16: 825-830.
11. Ulloa-Aguirre A, Midgley AR Jr, Beitins IZ, Padmanabhan V (1995) Follicle-stimulating isohormones: characterization and physiological relevance. Endocr Rev 16: 765-787.
12. Bogdanov EM, Nansel DD (1978) Biological and immunological distinctions between pituitary and serum LH in the rat. Structure and Function of the Gonadotropins 415-430.
13. Wide L (1981) Electrophoretic and gel chromatographic analyses of follicle-stimulating hormone in human serum. Ups J Med Sci 86: 249-258.
14. Wide L, Hobson BM (1983) Qualitative difference in follicle-stimulating hormone activity in the pituitaries of young women compared to that of men and elderly women. J Clin Endocrinol Metab 56: 371-375.
15. Wide L, Wide M (1984) Higher plasma disappearance rate in the mouse for pituitary follicle-stimulating hormone of young women compared to that of men and elderly women. J Clin Endocrinol Metab 58: 426-429.
16. Wide L (1985) Median charge and charge heterogeneity of human pituitary FSH, LH and TSH. II. Relationship to sex and age. Acta Endocrinol (Copenh) 109: 190-197.
17. Wide L, Bakos O (1993) More basic forms of both human follicle-stimulating hormone and luteinizing hormone in serum at midcycle compared with the follicular or luteal phase. J Clin Endocrinol Metab 76: 885-889.
18. Wide L, Naessén T (1994) 17 beta-oestradiol counteracts the formation of the more acidic isoforms of follicle-stimulating hormone and luteinizing hormone after menopause. Clin Endocrinol (Oxf) 40: 783-789.
19. Phillips DJ, Albertsson-Wikland K, Eriksson K, Wide L (1997) Changes in the isoforms of luteinizing hormone and follicle-stimulating hormone during puberty in normal children. J Clin Endocr Metab 82: 3103-3106.
20. Wide L, Eriksson K (2013) Dynamic changes in glycosylation and glycan composition of serum FSH and LH during natural ovarian stimulation. Ups J Med Sci 118: 153-164.
21. Diaz-Cueto L, Mendez JP, Barrios-de-Tomasi J, Lee JY, Wide L, et al. (1994) Amplitude regulation of episodic release, in vitro biological to immunological ratio, and median charge of human chorionic gonadotropin in pregnancy. J Clin Endocrinol Metab 78: 890-897.
22. Zambrano E, Olivares A, Mendez JP, Guerrero L, Diaz-Cueto L, et al. (1995) Dynamics of basal and gonadotropin-releasing hormone-releasable serum follicle-stimulating hormone charge isoform distribution throughout the human menstrual cycle. J Clin Endocrinol Metab 80: 1647-1656.
23. Galle PC, Ulloa-Aguirre A, Chappel SC (1983) Effects of oestradiol, phenobarbitone and luteinizing hormone releasing hormone upon the isoelectric profile of pituitary follicle-stimulating hormone in ovariectomized hamsters. J Endocrinol 99: 31-39.
24. Ulloa-Aquirre A, Schwall R, Cravioto A, Zambrano E, Damian-Matsumura P (1991) Effects of gonadotrophin-releasing hormone, recombinant activin-A and sex steroids upon the folllicle-stimulating isohormones secreted by rat anterior pituitary cells in culture. J Endocrinol 134: 97-106.
25. Wide L, Naessén T, Eriksson K, Rune C (1996) Time-related effects of a progestogen on the isoforms of serum gonadotrophins in 17 beta-oestradiol treated post-menopausal women. Clin Endocrinol (Oxf) 44: 651-658.
26. Phillips DJ, Wide L (1994) Serum gonadotropin isoforms become more basic after an exogenous challenge of gonadotropin-releasing hormone in children undergoing pubertal development. J Clin Endocrinol Metab 79: 814-819.
27. Wide L, Albertsson-Wikland K, Phillips DJ (1996) More basic isoforms of serum gonadotropins during gonadotropin-releasing hormone agonist therapy in pubertal children. J Clin Endocrinol Metab 81: 216-221.
28. Bousfield GR, Butnev VY, Bidart JM, Dalpathado D, Irungu J, et al. (2008) Chromatofocusing fails to separate hFSH isoforms on the basis of glycan structure. Biochemistry 47: 1708-1720.
29. Findley W, Gibbons W, Bousfield G, Ward D, Besch P (1986) Evaluation of immuno- and bioactivity of human menopausal gonadotropin (HMG): effects on ovulation induction for in vitro fertilization-embryo transfer (IVF). In: 42nd Annual Meeting American Fertility Society. Toronto, Canada.
30. Bousfield GR, Butnev VY, Butnev VY, Hiromasa Y, Harvey DJ, et al. (2014) Hypo-glycosylated human follicle-stimulating hormone (hFSH(21/18)) is much more active in vitro than fully-glycosylated hFSH (hFSH(24)). Mol Cell Endocrinol 382: 989-997.
31. Davis JS, Kumar TR, May JV, Bousfield GR (2014) Naturally occurring folilicle-stimulating hormone glycosylation variants. J. Glycomics Lipidomics 4, e117.
32. Bousfield GR, Butnev VY, Walton WJ, Nguyen VT, Huneidi J, et al. (2007) All-or-none N-glycosylation in primate follicle-stimulating hormone beta-subunits. Mol Cell Endocrinol 260-262: 40-8.
33. Walton WJ, Nguyen VT, Butnev VY, Singh V, Moore WT, et al. (2001) Characterization of human FSH isoforms reveals a nonglycosylated beta-subunit in addition to the conventional glycosylated beta-subunit. J Clin Endocrinol Metab 86: 3675-3685.
34. Zar JH (1996) Biostatistical Analysis. Upper Saddle River, NJ: Prentice Hall.
35. Börnsen KO, Mohr MD, Widmer HM (1995) Ion exchange and purification of carbohydrates on a Nafion(R) membrane as a new sample pretreatment for matrix-assisted laser desorption-ionization mass spectrometry. Rapid Communications in Mass Spectrometry 9: 1031-1034.
36. Harvey DJ (2005) Fragmentation of negative ions from carbohydrates: part 2. Fragmentation of high-mannose N-linked glycans. J Am Soc Mass Spectrom 16: 631-646.
37. Harvey DJ (2005) Fragmentation of negative ions from carbohydrates: Part 1; Use of nitrate and other anionic adducts for the production of negative ion electrospray spectra from N-linked carbohydrates. Journal of the American Society for Mass Spectrometry 16: 622-630.
38. Harvey DJ (2005) Fragmentation of negative ions from carbohydrates: part 3. Fragmentation of hybrid and complex N-linked glycans. J Am Soc Mass Spectrom 16: 647-659.
39. Harvey DJ, Royle L, Radcliffe CM, Rudd PM, Dwek RA (2008) Structural and quantitative analysis of N-linked glycans by matrix-assisted laser desorption ionization and negative ion nanospray mass spectrometry. Anal Biochem 376: 44-60.
40. Butnev VY, Gotschall RR, Butnev VY, Baker VL, Moore WT, Bousfield GR. Hormone-specific inhibitory influence of a-subunit Asn56 oligosaccharide on in vitro subunit association and FSH receptor binding of equine gonadotropins. Biol. Reprod. 1998; 58:458-469.
41. Treloar AE (1981) Menstrual cyclicity and the pre-menopause. Maturitas 3:
Citation: Bousfield GR, Butnev VY, Rueda-Santos MA, Brown A, Hall V, et al (2014) Macroand Micro Heterogeneity in Pituitary and Urinary FollicleStimulating Hormone Glycosylation. J Glycomics Lipidomics 4: 125. doi: 10.4172/2153-0637.1000125
Page 16 of 16
Volume 4 • Issue 4 • 1000124J Glycomics LipidomicsISSN: 2153-0637 JGL, an open access journal
249-264.
42. Gordon WL, Bousfield GR, Ward DN (1989) Comparative binding of FSH to chicken and rat testis. J Endocrinol Invest 12: 383-392.
43. Bhaskaran RS, Ascoli M (2005) The post-endocytotic fate of the gonadotropin receptors is an important determinant of the desensitization of gonadotropin responses. J Mol Endocrinol 34: 447-457.
44. Bishop LA, Nguyen TV, Schofield PR (1995) Both of the beta-subunit carbohydrate residues of follicle-stimulating hormone determine the metabolic clearance rate and in vivo potency. Endocrinology 136: 2635-2640.
45. Fiete D, Srivastava V, Hindsgaul O, Baenziger JU (1991) A hepatic reticuloendothelial cell receptor specific for SO4-4GalNAc beta 1,4GlcNAc beta 1,2Man alpha that mediates rapid clearance of lutropin. Cell 67: 1103-1110.
46. Nakai Y, Plant TM, Hess DL, Keogh EJ, Knobil E (1978) On the sites of the negative and positive feedback actions of estradiol in the control of gonadotropin secretion in the rhesus monkey. Endocrinology 102: 1008-1014.
47. Thompson IR, Kaiser UB (2014) GnRH pulse frequency-dependent differential regulation of LH and FSH gene expression. Mol Cell Endocrinol 385: 28-35.
48. Wang H, Larson M, Jablonka-Shariff A, Pearl CA, Miller WL, et al. (2014) Redirecting intracellular trafficking and the secretion pattern of FSH dramatically enhances ovarian function in mice. Proc Natl Acad Sci U S A 111: 5735-5740.
49. Saketos M, Sharma N, Adel T, Raghuwanshi M, Santoro N (1994) Time-resolved immunofluorometric assay and specimen storage conditions for measuring urinary gonadotropins. Clin Chem 40: 749-753.
50. Wide L (1986) The regulation of metabolic clearance rate of human FSH in mice by variation of the molecular structure of the hormone. Acta Endocrinol (Copenh) 112: 336-344.
51. Stanton PG, Robertson DM, Burgon PG, Schmauk-White B, Hearn MT (1992) Isolation and physicochemical characterization of human follicle-stimulating hormone isoforms. Endocrinology 130: 2820-2832.
52. Stanton PG, Shen Z, Kecorius EA, Burgon PG, Robertson DM, et al. (1995) Application of a sensitive HPLC-based fluorometric assay to determine the
sialic acid content of human gonadotropin isoforms. J Biochem Biophys Methods 30: 37-48.
53. Stanton PG, Burgon PG, Hearn MT, Robertson DM (1996) Structural and functional characterisation of hFSH and hLH isoforms. Mol Cell Endocrinol 125: 133-141.
54. Renwick AG, Mizuochi T, Kochibe N, Kobata A (1987) The asparagine-linked sugar chains of human follicle-stimulating hormone. J Biochem 101: 1209-1221.
55. Green ED, Baenziger JU (1988) Asparagine-linked oligosaccharides on lutropin, follitropin, and thyrotropin: I. structural elucidation of the sulfated and sialylated oligosaccharides on bovine, ovine and human pituitary glycoprotein hormones. J Biol Chem 263: 25-35.
56. Green ED, Baenziger JU (1988) Asparagine-linked oligosaccharides on lutropin, follitropin, and thyrotropin II. distributions of sulfated and sialylated oligosaccharides on bovine, ovine, and human pituitary glycoprotein hormones. J Biol Chem 263: 36-44.
57. Harvey DJ, Royle L, Radcliffe CM, Rudd PM, Dwek RA (2008) Structural and quantitative analysis of N-linked glycans by matrix-assisted laser desorption ionization and negative ion nanospray mass spectrometry. Anal Biochem 376: 44-60.
58. Fiete DJ, Beranek MC, Baenziger JU (1998) A cysteine-rich domain of the “mannose” receptor mediates GalNAc-4-SO4 binding. Proc Natl Acad Sci U S A 95: 2089-2093.
59. Rice KG, Lee YC (1993) Oligosaccharide valency and conformation in determining binding to the asialoglycoprotein receptor of rat hepatocytes. Adv Enzymol Relat Areas Mol Biol 66: 41-83.
60. Steirer LM, Park EI, Townsend RR, Baenziger JU (2009) The asialoglycoprotein receptor regulates levels of plasma glycoproteins terminating with sialic acid alpha2,6-galactose. J Biol Chem 284: 3777-3783.
61. Harvey DJ, Merry AH, Royle L, Campbell MP, Dwek RA, et al. (2009) Proposal for a standard system for drawing structural diagrams of N- and O-linked carbohydrates and related compounds. Proteomics 9: 3796-3801.