Bottelier and Fosler - Can China's Growth Trajectory Be Sustained
24
Centre for Monetary Economics BI Norwegian School of Management Working Paper Series 6/07 CAN CHINA'S GROWTH TRAJECTORY BE SUSTAINED? Pieter Bottelier Gail Fosler December 2007
-
Upload
heterophilous -
Category
Documents
-
view
219 -
download
0
Transcript of Bottelier and Fosler - Can China's Growth Trajectory Be Sustained
8/7/2019 Bottelier and Fosler - Can China's Growth Trajectory Be Sustained
http://slidepdf.com/reader/full/bottelier-and-fosler-can-chinas-growth-trajectory-be-sustained 1/24Centre for Monetary EconomicsBI Norwegian School of Management
Working Paper Series 6/07
CAN CHINA'S GROWTH
TRAJECTORY BE SUSTAINED?
Pieter BottelierGail Fosler
December 2007

8/7/2019 Bottelier and Fosler - Can China's Growth Trajectory Be Sustained
http://slidepdf.com/reader/full/bottelier-and-fosler-can-chinas-growth-trajectory-be-sustained 2/24
Can China’s GrowthTrajectory Be Sustained?
Trusted
Insights for
Business
Worldwide
research report R-1410-07-RR
cit izenship/
sustainabil ity
diversity
economics
ethics
governance
human resources
leadership
market ing
operations
risk management

8/7/2019 Bottelier and Fosler - Can China's Growth Trajectory Be Sustained
http://slidepdf.com/reader/full/bottelier-and-fosler-can-chinas-growth-trajectory-be-sustained 3/24
Online
www.conference-board.org
Phone
customer service at 212 339 0345
The Conference Board creates and disseminates knowledgeabout management and the marketplace to help businessesstrengthen their performance and better serve society.
Working as a global, independent membership organization inthe public interest, we conduct research, convene conferences,make forecasts, assess trends, publish information and analysis,
and bring executives together to learn from one another.The Conference Board is a not-for-profit organization and holds 501 (c) (3) tax-exempt
status in the United States.
about this reportto order research reports
Member Benefitsfree reports Download publications
free of charge. Find this research report at
www.conference-board.org/chinagrowth
go paperless Update your member
preferences to receive reports electronically.
Just log in to your account and click Review
Your Preferences.
personalize your preferences and
get the information you want. Specify your
areas of interest and receive only those
publications relevant to you.
Change yourpreferences at any time and
get the valuable insights you need delivered
right to yourdesktop.
The Conference Board
© 2007 by The Conference Board, Inc.
All rights reserved. Printed in the U.S.A.
ISBN No. 0-8237-0905-1
The Conference Board and the
torch logo are registered trademarksof The Conference Board, Inc.
This report from The Conference Board China Center for Economics and
Business explores the factors that appear to be driving China’s turbo-
charged growth of recent years and the extent to which some internal
imbalances and the trade surplus have created a “fly-wheel” effect that
represents a set of conditions outside of China’s reform era experience.

8/7/2019 Bottelier and Fosler - Can China's Growth Trajectory Be Sustained
http://slidepdf.com/reader/full/bottelier-and-fosler-can-chinas-growth-trajectory-be-sustained 4/24
Can China’s GrowthTrajectory Be Sustained?by Pieter Bottelier and Gail Fosler
contents
5 Key Findings
5 Setting the Context: Overdependence on Exports
6 Findings and Implications
8 The Gathering Storm: Addressing China’s Internal Imbalances
10 The Special Challenge of External Balance
12 Exchange Rate Policy and Foreign Reserves
12 China’s Unique Productivity Story
14 Productivity, Not the Exchange Rate, Is the Main Driver of Competitiveness
15 Productivity Raises Business Profitability
18 China’s Trade Surplus and Globalization
20 If There Is “Over Investment” in Manufacturing, Why Don’t We See
More Evidence of Excess Capacity?
22 Is China’s Turbo-Growth Model Sustainable?

8/7/2019 Bottelier and Fosler - Can China's Growth Trajectory Be Sustained
http://slidepdf.com/reader/full/bottelier-and-fosler-can-chinas-growth-trajectory-be-sustained 5/24
about the conference board
china center for economics and business
about the authors
Our mission is to improve multinational businesses’
knowledge of and participation in China’s growth and
development and to work with the Chinese government,
Chinese and international companies, and academic
institutions in creating strong, empirically based economic
analysis and business research to support policy and
decision-making capabilities.
Pieter Bottelier is Senior Adjunct Professor of China Studies
at Johns Hopkins School of Advanced International Studies
and advisor on China to The Conference Board.
Gail Fosler is President and Chief Economist of The
Conference Board.
the conference board
china center founding members
Founding Members of the China Center are leading
corporations and organizations from our global membership
that have joined as strategic partners to support the
development of high-quality research and empirical analysis
to support strategic decision making in China. Founding
Members serve on the Center’s Advisory Board and attend
regular meetings in Beijing with senior Chinese policy makers
on issues of mutual interest. The Honorable Paul Volcker,
former Chairman of the Board of Governors of the Federal
Reserve System of the United States, and Chen Yuan,
Governor of the China Development Bank, serve as co-chairs
of the Advisory Board.
Founding MembersAgilent Technologies Foundation
Bekaert Group
The Campbell Soup Company
Caterpillar Inc.
China Development Bank
DBS (Development Bank of Singapore)
Deloitte
General Electric Company
PricewaterhouseCoopers, LLP
Reliance Industries, Ltd.
For more information, please contact:
The China Center for Economics and Business
Preparatory Office
7-2-72 Qijiayuan, 9 Jianwai Avenue
Beijing 100600 P.R. China
Tel +86 10 8532 4688
Fax +86 10 8532 5332

8/7/2019 Bottelier and Fosler - Can China's Growth Trajectory Be Sustained
http://slidepdf.com/reader/full/bottelier-and-fosler-can-chinas-growth-trajectory-be-sustained 6/24
The Situation
A unique convergence of factors and
China’s overreliance on an export-
fueled current account surplus for
the maintenance of high economic
growth is creating a serious macro-
economic imbalance that could
eventually have serious adverse
effects on the world economy.
The Government’s Response
China has generally administered the
economy with a gradualist approach
that is proving less and less effective.
The government has initiated
measures to reduce the trade surplus
and promote more consumption-
oriented growth at home.
The Impact on Business
Businesses operating in China can expect
more disruptive policies going forward.
Multinational businesses that have
benefited the most from China’s recent
growth trajectory are likely to face a more
adverse environment, either because of
more rapid RMB appreciation or because
of explicit investment and export controlsthat will slow rapidly growing markets.
Setting the Context: Overdependence on ExportsOver the last three years and for the first time since the start of China’s market
reforms almost 30 years ago, the country’s economy has moved toward a high-
growth, high-investment, high-production, high-liquidity structure that appears
to be self-reinforcing and outside of the normal administrative controls of the
Chinese government.
These high economic growth rates are further associated with, and are potentially
increasingly dependent upon, a sharply rising current account surplus, not just
with the United States, but with the entire world. These changes, in what for
many years was an economy that was relatively responsive to economic policy
adjustments, are potentially worrisome. China has generally administered the
economy with a gradualist approach that is proving less and less effective.
Businesses operating in China can expect more disruptive policies going forward,
including quite possibly faster revaluation of the renminbi (RMB).
Alternatively, China’s trade surplus and increasing global export penetration
may become an international political issue not just in industrial economies but
increasingly in emerging markets. China’s economy is operating in a cycle of
high and rising corporate profits that is becoming increasingly dependent on
high net export growth to satisfy its appetite for economic growth.
Key Findings
Can Ch ina ’s Growth Tra jectory Be Susta ined? The Conference Board

8/7/2019 Bottelier and Fosler - Can China's Growth Trajectory Be Sustained
http://slidepdf.com/reader/full/bottelier-and-fosler-can-chinas-growth-trajectory-be-sustained 7/24
With a net export surplus that is the largest in the world in absolute value terms,
China’s growth trajectory does not appear to be on a sustainable path. The
Chinese government clearly recognizes these risks and has initiated measures
to reduce the trade surplus and promote more consumption-oriented growth
at home, but it is proving difficult to reverse the trend of recent years. In the
often quoted words of Herb Stein, former Chairman of the Council of Economic
Advisors in the Nixon Administration, “that which is unsustainable tends not
to be sustained.” But, in the case of China, given the overwhelming and almost
unique set of conditions that keep its growth dynamic going, there are few
self-adjusting forces at work. In short, although the current situation is not
sustainable, it is likely to continue for the foreseeable future in the absence
of much more aggressive efforts to force change.
This report explores the factors that appear to be driving China’s turbo growth
of recent years and the extent to which some internal imbalances and the trade
surplus have created a “fly-wheel” effect that represents a set of conditions
outside of China’s reform era experience. This fresh perspective shows how
China’s low consumption/GDP ratio, unusually high savings rate, high output
and investment growth since the turn of the century, the apparent recent reversal
of a long-term trend of declining energy intensity, and the sudden steep growth
of China’s trade surplus from the second half of 2004 are all interconnected.
China’s growth has not been fueled by its relatively low wages, but rather by high
productivity growth, particularly in manufacturing, which has raised corporate
profitability to near western industrial country standards in many industries.
Findings and Implications• China’s turbo growth and rapidly expanding trade surplus of recent years are driven by
a number of factors that together have created a kind of “fly-wheel” effect that is hard
to slow and may intensify internal and external economic imbalances for some years.
• Multinational businesses that have benefited the most from China’s recent growth
trajectory are likely to face a more adverse environment going forward, either because
of more rapid RMB appreciation or because of explicit investment and export controls
that will slow rapidly growing markets. A main growth driver is the high and rising
profitability of “corporate China,” which fuels unusually high levels of investment,
especially in manufacturing for export and import substitution.
• Chinese profitability is driven by: (1) strong productivity growth, especially in
manufacturing enterprises, (2) more efficient financial intermediation through thefinancial system, and (3) falling logistics costs due to heavy investment in infrastructure
and the growing efficiency of domestic supply networks.
• As Chinese companies have now surpassed foreign-invested enterprises as the leading
source of growth in exports, domestic companies will not be immune from changes in
the policy environment. However, they will be able to draw on larger productivity gains
than foreign firms in order to offset the effects on the bottom line.
6 C a n C h in a’ s G r o w th T ra j e c to r y B e S u s t ain e d ? The Conference Board
8/7/2019 Bottelier and Fosler - Can China's Growth Trajectory Be Sustained
http://slidepdf.com/reader/full/bottelier-and-fosler-can-chinas-growth-trajectory-be-sustained 8/24
Can Ch ina ’s Growth Tra jectory Be Susta ined? The Conference Board
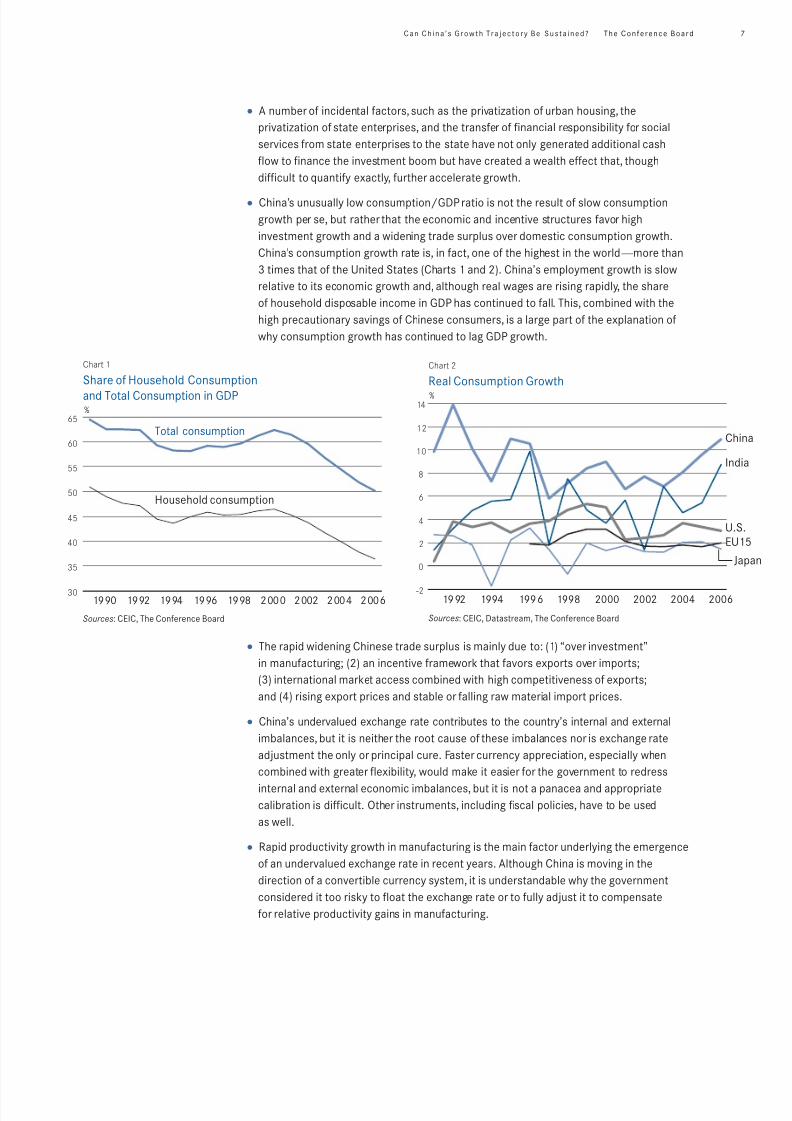
• A number of incidental factors,such as the privatization of urban housing, the
privatization of state enterprises, and the transfer of financial responsibility for social
services from state enterprises to the state have not only generated additional cash
flow to finance the investment boom but have created a wealth effect that, though
difficult to quantify exactly, further accelerate growth.
• China’s unusually low consumption/GDPratio is not the result of slow consumption
growth per se, but rather that the economic and incentive structures favor high
investment growth and a widening trade surplus over domestic consumption growth.
China’s consumption growth rate is, in fact, one of the highest in the world— more than
3 times that of the United States (Charts 1 and 2). China’s employment growth is slow
relative to its economic growth and, although real wages are rising rapidly, the share
of household disposable income in GDP has continued to fall. This, combined with the
high precautionary savings of Chinese consumers, is a large part of the explanation of
why consumption growth has continued to lag GDP growth.
• The rapid widening Chinese trade surplus is mainly due to: (1) “over investment”
in manufacturing; (2) an incentive framework that favors exports over imports;
(3) international market access combined with high competitiveness of exports;
and (4) rising export prices and stable or falling raw material import prices.
• China’s undervalued exchange rate contributes to the country’s internal and external
imbalances, but it is neither the root cause of these imbalances nor is exchange rate
adjustment the only or principal cure. Faster currency appreciation, especially when
combined with greater flexibility, would make it easier for the government to redress
internal and external economic imbalances, but it is not a panacea and appropriate
calibration is difficult. Other instruments, including fiscal policies, have to be used
as well.
• Rapid productivity growth in manufacturing is the main factor underlying the emergence
of an undervalued exchange rate in recent years. Although China is moving in the
direction of a convertible currency system, it is understandable why the government
considered it too risky to float the exchange rate or to fully adjust it to compensate
for relative productivity gains in manufacturing.
Chart 1
Share of Household Consumption
and Total Consumption in GDP
Total consumption
1990 1992 1994 1996 1998 2000 2002 2004 200630
35
40
45
50
55
60
65
Household consumption
%
Sources: CEIC, The Conference Board
Chart 2
Real Consumption Growth%
1992 1994 1996 1998 2000 2002 2004 2006-2
0
2
4
6
8
10
12
14
Chi
Ind
U.S
Ja
EU
Sources: CEIC, Datastream, The Conference Board
8/7/2019 Bottelier and Fosler - Can China's Growth Trajectory Be Sustained
http://slidepdf.com/reader/full/bottelier-and-fosler-can-chinas-growth-trajectory-be-sustained 9/24
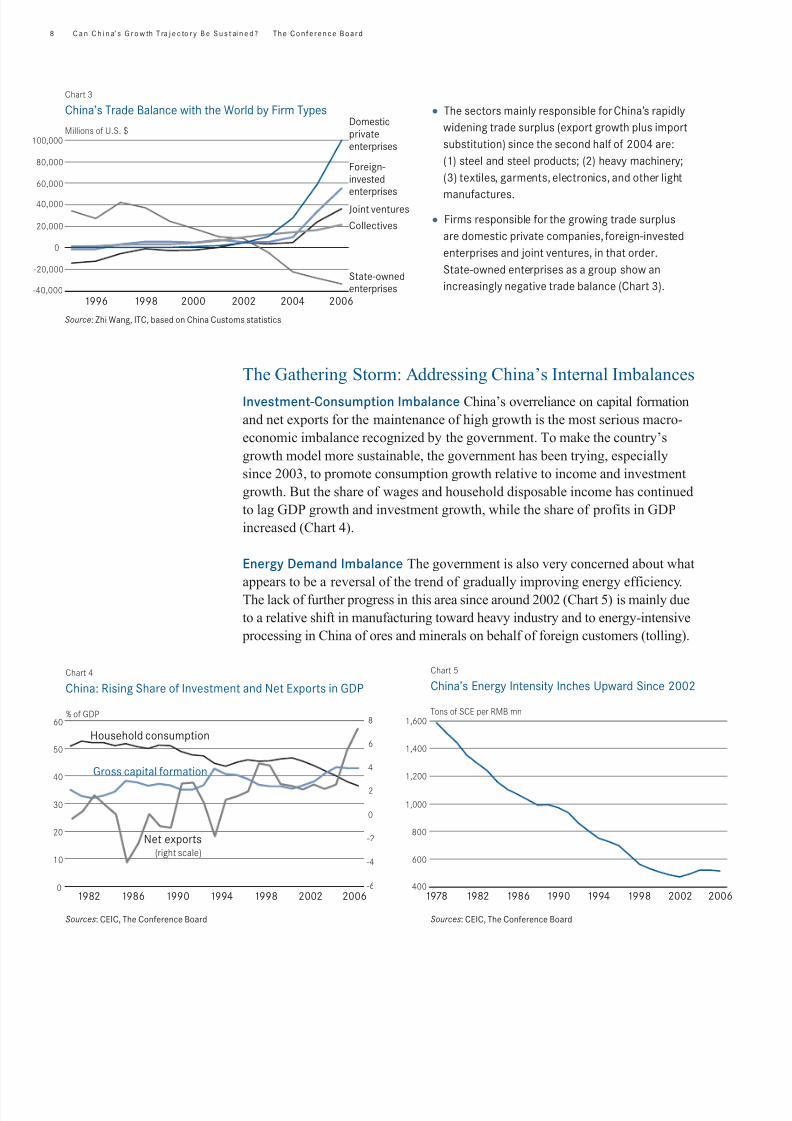
• The sectors mainly responsible forChina’s rapidly
widening trade surplus (export growth plus import
substitution) since the second half of 2004 are:
(1) steel and steel products; (2) heavy machinery;
(3) textiles, garments, electronics, and other light
manufactures.
• Firms responsible for the growing trade surplus
are domestic private companies, foreign-invested
enterprises and joint ventures, in that order.
State-owned enterprises as a group show an
increasingly negative trade balance (Chart 3).
The Gathering Storm: Addressing China’s Internal Imbalances
Investment-Consumption Imbalance China’s overreliance on capital formation
and net exports for the maintenance of high growth is the most serious macro-
economic imbalance recognized by the government. To make the country’s
growth model more sustainable, the government has been trying, especially
since 2003, to promote consumption growth relative to income and investment
growth. But the share of wages and household disposable income has continued
to lag GDP growth and investment growth, while the share of profits in GDP
increased (Chart 4).
Energy Demand Imbalance The government is also very concerned about what
appears to be a reversal of the trend of gradually improving energy efficiency.
The lack of further progress in this area since around 2002 (Chart 5) is mainly due
to a relative shift in manufacturing toward heavy industry and to energy-intensive
processing in China of ores and minerals on behalf of foreign customers (tolling).
8 C a n C h in a’ s G r o w th T ra j e c to r y B e S u s t ain e d ? The Conference Board
Chart 3
China’s Trade Balance with the World by Firm Types
Millions of U.S. $
1996 1998 2000 2002 2004 2006-40,000
-20,000
0
20,000
40,000
60,000
80,000
100,000
State-ownedenterprises
Joint ventures
Foreign-invested
enterprises
Collectives
Domesticprivateenterprises
Source: Zhi Wang, ITC, based on China Customs statistics
Chart 4
China: Rising Share of Investment and Net Exports in GDP
Gross capital formation
Household consumption
% of GDP
1982 1986 1990 1994 1998 2002 20060
10
20
30
40
50
60
-6
-4
-2
0
2
4
6
8
Net exports(right scale)
Sources: CEIC, The Conference Board
Chart 5
China’s Energy Intensity Inches Upward Since 2002
Tons of SCE per RMB mn
Sources: CEIC, The Conference Board
1978 1982 1986 1990 1994 1998 2002 2006400
600
800
1,000
1,200
1,400
1,600

8/7/2019 Bottelier and Fosler - Can China's Growth Trajectory Be Sustained
http://slidepdf.com/reader/full/bottelier-and-fosler-can-chinas-growth-trajectory-be-sustained 10/24
Can Ch ina ’s Growth Tra jectory Be Susta ined? The Conference Board
Social Imbalances Social inequality—
whether measured in terms of the urban/rural
income gap (Chart 6), interpersonal income
distribution, or coastal regions versus interior
ones—is getting worse. The rate at which
inequality is growing would almost certainly
have been greater without the government’s
aggressive efforts to promote investment in
interior provinces and autonomous regions
since the late 1990s, its extensive anti-poverty
projects for low-income counties, and its more
recent efforts to channel additional subsidies to
basic rural education and healthcare.
Growth-Environment Imbalance Environmental degradation is another source
of deep concern to the government and the focus of much international attention. 1
Many of the problems appear to be related to insufficient enforcement of official
laws and regulations, especially at the local level. The incentive framework
facing local officials and economic agents is often inconsistent with the priority
assigned to environmental protection by the central authorities in Beijing.
To address these imbalances in a more systematic and scientific way, the
government of President Hu Jintao and Prime Minister Wen Jiabao launched
a number of new policies and programs in 2003. The government’s top priority
is now defined as the promotion of a “Harmonious Society.” Most of these policies
(including inter alia a higher threshold for personal income tax, elimination
of the agricultural tax, subsidies for rural education and healthcare, and stricter
enforcement of environmental laws) are fairly recent. Not only have these
imbalances not reversed, they appear to have intensified. High output growth,
including export growth, appears to remain at the top of the priority list of both
central and local governments.
Chart 6
Ratio of Average Net Rural Income to Urban Income
Sources: CEIC, The Conference Board
%
1978 1982 1986 1990 1994 1998 2002 200630
35
40
45
50
55
60
1 For specific examples, see Elizabeth C. Economy, “The Great Leap Backward? The Costs of China’s Environmental
Crisis,” Foreign Affairs, September/October 2007, and Joseph Kahn & Jim Yardley, “As China Roars, Pollution
Reaches Deadly Extremes,” New York Times, 26 August 2007.

8/7/2019 Bottelier and Fosler - Can China's Growth Trajectory Be Sustained
http://slidepdf.com/reader/full/bottelier-and-fosler-can-chinas-growth-trajectory-be-sustained 11/24
China’s current account was never more than a few percentage points of GDP in
surplus or in deficit (the last time it was in deficit was 1993), but turned sharply
positive from the second half of 2004. The surplus reached 9.5 percent of GDP
in 2006 when China became the largest surplus economy in absolute terms and
a major contributor to global trade imbalances. During the first half of 2007,
China’s trade surplus, which accounts for the lion’s share of the current account
balance, continued its steep incline. In spite of efforts to slow down export
growth through the reduction or elimination of VAT export rebates on about
36 percent of all exports (by value) from July 2007, China’s external surplus
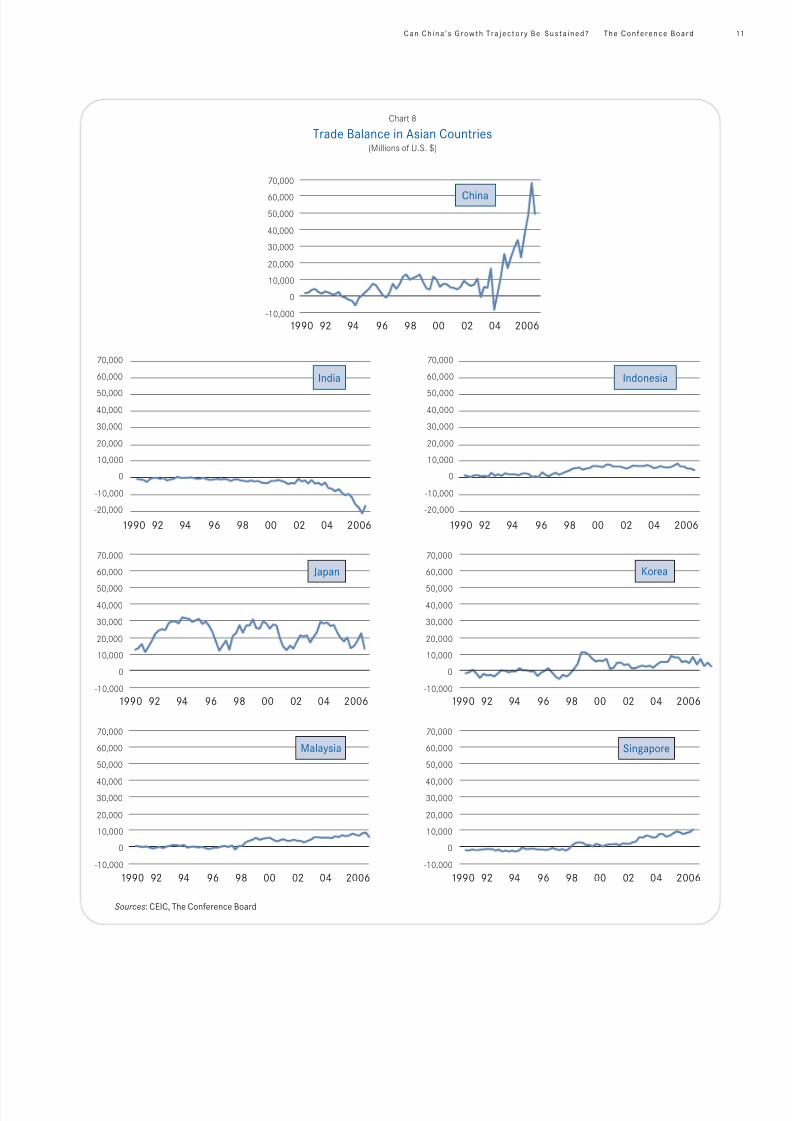
may continue to expand for some time. The United
States has the largest bilateral trade deficit with
China, but Europe is not far behind. East Asia’s
current account surplus (especially that of China
and Japan) and the deficit of the United States are
interrelated and at the core of unprecedented global
trade imbalances (Charts 7 and 8).
The government’s main response to the widening
trade surplus has been to lower or eliminate export
tax rebates2 and to impose export taxes on selected
steel products. Energy-intensive tolling of iron ore,
pig iron, ferroalloys and certain non-ferrous metals
for foreign customers was banned in 2005–2006 to
simultaneously reduce export growth and energy
consumption.
10 Can Ch ina ’s Growth Tra jectory Be Susta ined? The Conference Board
The Special Challengeof External Balance
Chart 7
Current Account Balance as Percent of GDP
Sources: Datastream, IMF, The Conference Board
%
1992 1994 1996 1998 2000 2002 2004 2006-8
-6
-4
-2
0
2
4
6
8
10
China
U.S.
Japan
2 On 1 July 2007the government eliminated VAT rebates on exports of more than 500 products and reduced the rebate
on more than 2,000 others. The exports affected account for about 36 percent of all 2006 commodity exports.
Contrary to expectations based on the effect of these measures, China’s trade surplus continued to widen in the
month of July.
8/7/2019 Bottelier and Fosler - Can China's Growth Trajectory Be Sustained
http://slidepdf.com/reader/full/bottelier-and-fosler-can-chinas-growth-trajectory-be-sustained 12/24
Can Ch ina ’s Growth Tra jectory Be Susta ined? The Conference Board 1
Chart 8
Trade Balance in Asian Countries(Millions of U.S. $)
-10,000
0
10,000
20,000
30,000
40,000
50,000
60,000
70,000
China
1990 92 94 96 98 00 02 04 2006
-20,000
-10,000
0
10,000
20,000
30,000
40,000
50,000
60,000
70,000
Indonesia
1990 92 94 96 98 00 02 04 2006
India
-20,000
-10,000
0
10,000
20,000
30,000
40,000
50,000
60,000
70,000
1990 92 94 96 98 00 02 04 2006
Japan
-10,000
0
10,000
20,000
30,000
40,000
50,000
60,000
70,000
1990 92 94 96 98 00 02 04 2006
Malaysia
-10,000
0
10,000
20,000
30,00040,000
50,000
60,000
70,000
1990 92 94 96 98 00 02 04 2006
Singapore
-10,000
0
10,000
20,000
30,00040,000
50,000
60,000
70,000
1990 92 94 96 98 00 02 04 2006
Sources: CEIC, The Conference Board
-10,000
0
10,000
20,000
30,000
40,000
50,000
60,000
70,000
1990 92 94 96 98 00 02 04 2006
Korea

8/7/2019 Bottelier and Fosler - Can China's Growth Trajectory Be Sustained
http://slidepdf.com/reader/full/bottelier-and-fosler-can-chinas-growth-trajectory-be-sustained 13/24
Exchange Rate Policy and Foreign ReservesThe government remains averse to using nominal exchange rate appreciation
aggressively for fear of triggering unemployment. Between July 2005 (when the
RMB was officially de-linked from the U.S. dollar) and the end of July 2007,
the nominal RMB/USD rate appreciated about
9 percent, but China’s trade-weighted exchange
rate and real effective exchange rate (the trade-
weighted rate adjusted for inflation differences
between trading partners) both slightly
depreciated (Chart 9).3
To slow the growth of foreign exchange reserves—
$1.33 trillion at the end of June 2007—the
government has significantly relaxed controls
on private capital outflows, including access to the
Hong Kong stock exchange, and is promoting
outward investment by state corporations. It is also
starting a large foreign exchange investment fund,
initially valued at some $200 billion, similar to
Singapore’s Government Investment Corporation.
China’s Unique Productivity StoryAn important driver of both China’s economic growth and the growing
competitiveness and profitability of Chinese firms is the country’s extraordinary
productivity growth, especially in manufacturing. While questions remain about
the measurement of China’s year-to-year growth and trade surplus in recent years,
there is little doubt that average annual growth since the start of market reforms
in the late 1970s was extremely high—close to 10 percent. In the first half of the
1980s agriculture was the main source of economic growth. Income distribution
changed in favor of rural areas during that period.
Urban development and manufacturing took over as the main engines of growth
from the mid-1980s. From then on income distribution changed in favor of urban
areas and growth was higher in coastal provinces where most foreign direct invest-
ment and international trade was concentrated. During all of this time, Chinese
productivity was growing, but at more moderate rates than in later years.
12 Can Ch ina ’s Growth Tra jectory Be Susta ined? The Conference Board
3 During the same period (July 2005 – July 2007) the RMB/Yen cross rate appreciated by some 18 percent (because the
Japanese Yen depreciated against the USD). Since the overlap between Japanese and Chinese exports in third markets
is rapidly growing, it is likely that Chinese concerns over Yen depreciation contributed to the extreme caution that
characterized their own exchange rate policy since July 2005.
Chart 9
China’s Nominal Trade-Weighted (NEER), Real Effective
Exchange Rate (REER), and Spot CNY/USD (1995=100)
Source: IMF
7.7
7.8
7.9
8
8.1
8.2
8.3CNY/USD(right scale)
2003 2004 2005 2006 200788
90
92
94
96
98
100
102
REER
NEER

8/7/2019 Bottelier and Fosler - Can China's Growth Trajectory Be Sustained
http://slidepdf.com/reader/full/bottelier-and-fosler-can-chinas-growth-trajectory-be-sustained 14/24
Can Ch ina ’s Growth Tra jectory Be Susta ined? The Conference Board 1
Beginning in the early 1990s, foreign investment and associated technological
and trade development became a major factor; restructuring of the industrial
sector intensified significantly in the mid-1990s. The share of non-state
enterprises in manufacturing output rose from 20 percent in 1990 to well over
50 percent in 2006. China has showed an almost unprecedented willingness
to allow dynamic competition to shape the marketplace and, in particular, to
reshape and restructure state-owned enterprises which paid handsome returns
in terms of productivity gains.
There were also, of course, costs. Employment in state-owned enterprises peaked
in 1995. In spite of continuing output growth, total recorded employment
in manufacturing, including both state and non-state enterprises, fell by an
estimated 18 million jobs between 1995 and 2003, at least 5 times higher
than manufacturing job losses in the United States during the same period.4
The enormous scale and intensity of China’s industrial restructuring since the
mid-1990s is hard to imagine and may not be fully appreciated internationally.
Total employment in China did not fall by much during this period of intense
industrial restructuring, because other parts of the fast-growing economy—
in particular construction, communications, other service sectors and horti-
culture—were able to absorb many of those who had been laid off in
manufacturing. Manufacturing employment, principally in private Chinese
firms and in foreign invested enterprises, started growing again, but very
slowly, from 2004.
China’s industrial restructuring (involving management changes, layoffs, plant
closures, plant resizing, mergers, the privatization of numerous state-owned
enterprises, and pervasive technological upgrading) led to sharply improved
productivity from around the mid-1990s, both in state and in non-state enterprises.
When the restructuring of state-owned enterprises got under way in the mid-
1990s, initial productivity gains were mainly due to the shedding of redundant
labor, but in later years technical/managerial/labor upgrading, combined with
falling logistics costs became more important factors. Since non-state enterprises
are on average more efficient than state enterprises, the rapidly growing share
of private enterprise in total industrial output accelerated average productivity
growth. And, for workers, the new jobs were in growing competitive firms,
many of which could provide rising real wages and some benefits.
4 The estimate of manufacturing job losses is based on the work of Judith Banister, senior advisor to The Conference
Board. Her estimates of manufacturing employment from 1990–2004 will be reflected in a forthcoming article.
The government’s own estimates, which are of similar magnitude, are reflected in China Statistical Yearbook 2006,
tables 5-4 and 5-5.
8/7/2019 Bottelier and Fosler - Can China's Growth Trajectory Be Sustained
http://slidepdf.com/reader/full/bottelier-and-fosler-can-chinas-growth-trajectory-be-sustained 15/24
It is important to realize that the restructuring process has had a huge impact on
the state-owned sector—substantially reducing the number of loss-making firms.
In both state and non-state enterprises, technological upgrading, facilitated by
relatively inexpensive capital, was seen as the only way to stay in business.
Domestic competition became even more intense as a result of China’s member-
ship in the WTO (December 2001) and contributed to falling prices in many
sectors of the modern economy until recently.
Researchers for The Conference Board5 calculate that average annual labor
productivity growth in large- and medium-sized industrial enterprises during
the period 1995–2003 was 20.4 percent, an astonishingly high number by inter-
national standards. This number is consistent with the findings of other empirical
studies undertaken by Chinese researchers at Peking University. Although high
labor productivity growth is not necessarily matched by corresponding improve-
ment in overall production efficiency, there are nonetheless strong indications
of sharply improved competitiveness in numerous Chinese industries since the
mid-1990s.6
Manufacturing productivity growth was reinforced by reforms in China’s financial
sector which led to a more efficient allocation of resources, and by large increases
in government spending on infrastructure, which lowered the cost of logistics for
enterprises.7 Average national labor productivity gains (7.3 percent p.a. between
1995 and 2004 according to official data) were a multiple of those achieved during
the same period in the United States (2.4 percent), the European Union-15
(1.4 percent), Japan (2 percent), and much higher than in India (3.9 percent).
Productivity, Not the Exchange Rate,Is the Main Driver of CompetitivenessChina’s economic success is not in the first place based on low wages or on
an undervalued exchange rate. China has been willing to forgo short-term
employment gains to restructure its enterprises into more efficient, market-
14 Can Ch ina ’s Growth Tra jectory Be Susta ined? The Conference Board
5 Haiyang Deng, John Haltiwanger and Robert McGuckin, China’s Productivity Boom: The Contribution of Restructuring to
Growth and Competitiveness, The Conference Board, Research Report R-1411-07-RR.
6 In mature market economies, labor productivity growth is normally a fairly reliable indicator of improvements in
overall efficiency. In China’s case a special caveat is needed. Because rapid labor productivity growth from the mid-
1990s was associated with a sharp relative increase in the use of capital and a sharp relative decline of the share of
state enterprises in total output, the sources of labor productivity growth are hard to measure. A significant sourcewas undoubtedly the growing share of private enterprise in the economy. There are no official estimates of the
contribution of total factor productivity (TFP). Scholars disagree on the precise numbers, or even the trend. Some
have suggested TFP growth acceleration in China’s industrial sectorsince the mid-1990s (see, for example, Barry
Bosworth and Susan Collins, Accounting forGrowth: Comparing China and India. NBER Working Paper # 12943,
February 2007). Others suggest that the trend has been essentially flat (for example, Dwight Perkins and Thomas
Rawski, Forecasting China’s Economic Growth over the Next Two Decades, chapter for a forthcoming book), or even
declining (for example, Jing Cao, Mun S. Ho, Dale W. Jorgenson, Ren Ruoen and Sun Linlin, Industrial and Aggregate
Measures of Productivity Growth in China, 1982-2000. Harvard University & Beihang University, 2006.
7 The increase in government investment in infrastructure from 1998 was part of a fiscal stimulus program aimed
at avoiding a deep domestic recession following the Asian financial crisis if 1997/98.

8/7/2019 Bottelier and Fosler - Can China's Growth Trajectory Be Sustained
http://slidepdf.com/reader/full/bottelier-and-fosler-can-chinas-growth-trajectory-be-sustained 16/24

8/7/2019 Bottelier and Fosler - Can China's Growth Trajectory Be Sustained
http://slidepdf.com/reader/full/bottelier-and-fosler-can-chinas-growth-trajectory-be-sustained 17/24
parts of the manufacturing sector. With ups and downs, the upward trend in
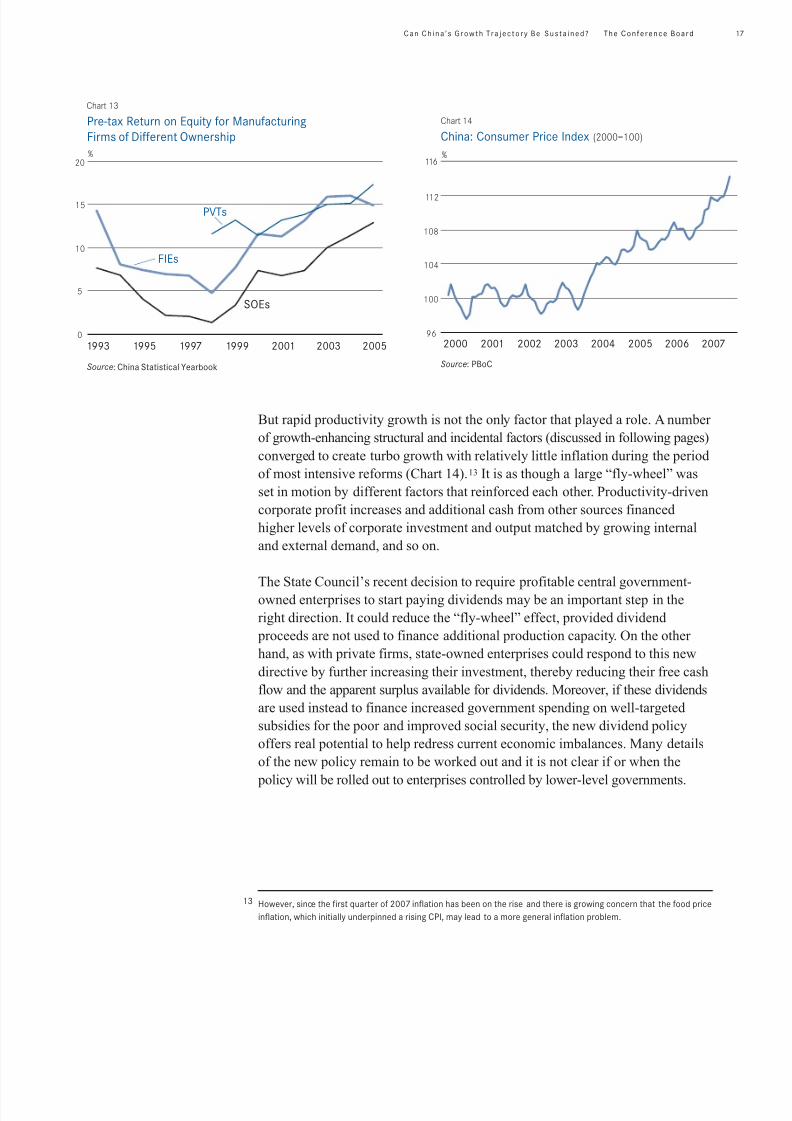
corporate profitability has continued through the present time (Charts 11 and 12).10
Chinese companies have become considerably more profitable in recent years and
in some cases more profitable than their foreign competitors. The improvement in
profitability applies to companies of different ownership, including state-owned
enterprises (SOEs), domestic private enterprises (PVTs), and foreign-invested
enterprises (FIEs) as shown in Chart 13.11 Many manufacturing enterprises were
able to: (1) increase real wages by 10–15 percent per annum since 2000 while
reducing unit labor costs,12 (2) maintain or reduce export prices to gain market
share, at least until 2006, when many Chinese export prices began to rise, and
(3) increase profitability, all at the same time, an otherwise unusual combination
of achievements.
16 Can Ch ina ’s Growth Tra jectory Be Susta ined? The Conference Board
10 A detailed analysis of the profitability of manufacturing enterprises in China is included in: Sean Dougherty,
Richard Herd and Ping He, “Has a private sector emerged in China’s industry? Evidence from a quarter of a million
Chinese firms.” China Economic Review , 18 (2007), pp 309–334.
11 From the late 1990s the rate at which SOE profitability increased is higher than for either foreign-invested ordomestic private enterprises. This may be due to the fact that SOEs enjoyed not only the advantages of privatized
urban housing, but also the gradual shift of responsibility for health and education expenditures from state
enterprises to the state itself and to employees. For a more detailed analysis of this see Feng Lu et al.,
“Profitability of China’s Industrial Firms (1978-2006),”China Economic Journal, 2007(forthcoming).
12 Real wage increases are notoriously hard to measure in China; most sources agree that 10–15 percent p.a. since the
turn of the century, in reporting manufacturing enterprises, is a reasonable estimate. See for example Judith Banister,
“Manufacturing earnings and compensation in China,” Monthly Labor Review , August 2005, and Erin Lett & Judith
Banister,“Labor costs of manufacturing employees in China: an update to 2003-04,” Monthly Labor Review ,
November 2006. See also Bart van Ark,Judith Banister and Catherine Guillemineau, Comparative Advantage of
“Low-Wage” Countries Often Exaggerated . The Conference Board, Executive Action Series, No. 212, October2006.
Chart 11
Return on Capital Has Improved Significantly Since 1998
1994 1996 1998 2000 2002 2004 20060
2
4
6
8
10
12
14
16
Return on equity
Return on assets
Sources: CEIC, The Conference Board
%
Chart 12
5000 Principal Industrial Enterprises:Ratio of Profits to Sales (6-month moving average)
%
1994 1996 1998 2000 2002 2004 20060
2
4
6
8
10
12
Source: PBoC
8/7/2019 Bottelier and Fosler - Can China's Growth Trajectory Be Sustained
http://slidepdf.com/reader/full/bottelier-and-fosler-can-chinas-growth-trajectory-be-sustained 18/24
Can Ch ina ’s Growth Tra jectory Be Susta ined? The Conference Board 1
But rapid productivity growth is not the only factor that played a role. A number
of growth-enhancing structural and incidental factors (discussed in following pages)
converged to create turbo growth with relatively little inflation during the period
of most intensive reforms (Chart 14).13 It is as though a large “fly-wheel” was
set in motion by different factors that reinforced each other. Productivity-driven
corporate profit increases and additional cash from other sources financed
higher levels of corporate investment and output matched by growing internal
and external demand, and so on.
The State Council’s recent decision to require profitable central government-
owned enterprises to start paying dividends may be an important step in the
right direction. It could reduce the “fly-wheel” effect, provided dividend
proceeds are not used to finance additional production capacity. On the other
hand, as with private firms, state-owned enterprises could respond to this new
directive by further increasing their investment, thereby reducing their free cash
flow and the apparent surplus available for dividends. Moreover, if these dividends
are used instead to finance increased government spending on well-targeted
subsidies for the poor and improved social security, the new dividend policy
offers real potential to help redress current economic imbalances. Many details
of the new policy remain to be worked out and it is not clear if or when the
policy will be rolled out to enterprises controlled by lower-level governments.
13 However, since the first quarter of 2007 inflation has been on the rise and there is growing concern that the food price
inflation, which initially underpinned a rising CPI, may lead to a more general inflation problem.
Chart 13
Pre-tax Return on Equity for Manufacturing
Firms of Different Ownership
%
Source: China Statistical Yearbook
1993 1995 1997 1999 2001 2003 20050
5
10
15
20
SOEs
PVTs
FIEs
Chart 14
China: Consumer Price Index (2000=100)
%
Source: PBoC
2000 2001 2002 2003 2004 2005 2006 200796
100
104
108
112
116

8/7/2019 Bottelier and Fosler - Can China's Growth Trajectory Be Sustained
http://slidepdf.com/reader/full/bottelier-and-fosler-can-chinas-growth-trajectory-be-sustained 19/24
From the early 1990s, foreign enterprises accounted for a rapidly growing proportion
of China’s exports, many of which used China as a manufacturing or assembly
platform for export. This generated “processing trade,” which almost automatically
creates its own trade surplus. Chinese companies also contributed to the rapid growth
of “processing trade,” especially in textiles, garments, appliances and electronics.
China became a key link in globally integrated production processes for numerous
products, including advanced technology products. The “internationalization”
of its economy, which started well before China joined the WTO, has contributed
to China’s current trade surplus (Charts 15 and 16).
A “fly-wheel” effect kicked in at the turn of the century…Several factors combined to bring about the resumption of high GDP growth
and even higher investment growth from around the turn of the century and the
development of a large and growing external surplus from the second half of
2004. First, from 2001 investment in manufacturing began to grow much faster
than either GDP or total investment (Chart 17). Second, we also observe that agrowing proportion of corporate investment—currently over 60 percent—is
financed from “self-raised funds,” mostly own capital, corporate profits, and
depreciation (Chart 18). One implication of this unusually high degree of self-
financing is that corporate investment in China has become less sensitive to
possible policy-induced cost increases for intermediated funds (mainly bank
loans and other debt). This helps to explain why the government’s recent efforts
to cool the economy have shown little result. Third, rising corporate profits tend
18 Can Ch ina ’s Growth Tra jectory Be Susta ined? The Conference Board
China’s Trade Surplusand Globalization
Chart 15
Export Growth and Share of Foreign-InvestedEnterprises in Total Exports%
Sources: CEIC, The Conference Board
1994 1996 1998 2000 2002 2004 20060
10
20
30
40
50
60
Exports growth
Share of FIE in total exports
Chart 16
China’s Processing Trade and Normal Trade
Sources: CEIC, The Conference Board
Share in processing exports (right scale)
Share in normal exports (right scale)
0
20,000
40,000
60,000
80,000
100,000
120,000
140,000
160,000
Balance in processing trade Balance in normal trade
1995 96 97 98 99 00 01 02 03 04 05 2006
35
40
45
50
55
60Millions of U.S. $ % Total exports

8/7/2019 Bottelier and Fosler - Can China's Growth Trajectory Be Sustained
http://slidepdf.com/reader/full/bottelier-and-fosler-can-chinas-growth-trajectory-be-sustained 20/24
Can Ch ina ’s Growth Tra jectory Be Susta ined? The Conference Board 1
to make domestic “over-investment” in manufacturing and net-export growth
mutually reinforcing, because Chinese companies typically reinvest after-tax
profits, paying little or no dividend. Higher manufacturing investment yields
higher profits, which yield higher investments, and so on. Obviously, this cycle
cannot continue indefinitely, but it does not yet appear close to burn-out.
…almost all economic trends conspired to foster this “fly-wheel” effectDomestic demand picked up as result of the government’s fiscal stimulus
program and accelerated privatization of urban housing. Both policy measures
were taken in 1998 to avoid a deep recession in the wake of the Asian financial
crisis. Their full effects began to be felt a few years later.
External demand picked up as Japan’s decade of stagnation came to an end at
about the same time that the United States economy recovered from a short
recession in 2001 (following the NASDAQ collapse of 2000). The wave of
liquidity that was created in the United States as a result of anti-recession
monetary policy and the tax cuts of 2001 also stimulated demand for imports
from China. From 2005 European demand for Chinese exports also accelerated
sharply. The European Union has since become China’s largest trading partner.
Strong internal and external demand growth, combined with labor productivity
growth well in excess of real wage increases, led to a reversal of the decline in
return on capital in the late 1990s.
China’s WTO membership (since December 2001) undoubtedly contributed to
foreign investment inflows and business confidence in China. It also facilitated
trade expansion and promoted productivity growth through intensified competi-
tion and other factors.
Chart 17
Manufacturing Investment Is Outpacing Total Investmentand GDP Growth by a Large Margin (1998=100)
Sources: CEIC, The Conference Board
1998 1999 2000 2001 2002 2003 2004 2005 20060
100
200
300
400
500
Real GDP
Total FAI
FAI in manufacturing
Note: We use sum of manufacturing in total capital construction and innovation
as proxy of FAI in manufacturing until 2002 due to the data availability.
Chart 18
Fixed Asset Investment: Source of Funds
Sources: CEIC, The Conference Board
1996 1998 2000 2002 2004 20060
10
20
30
40
50
60
70
State budget
Domestic loan
Foreign capital
Self raised
%
8/7/2019 Bottelier and Fosler - Can China's Growth Trajectory Be Sustained
http://slidepdf.com/reader/full/bottelier-and-fosler-can-chinas-growth-trajectory-be-sustained 21/24
The privatization of urban housing at a fraction of market value created
powerful wealth effects that compounded other positive forces in the economy.14
For example, it promoted labor mobility, which contributed to accelerated
urbanization and productivity growth.
The privatization of urban housing in China created not only wealth effects for
the new owners (usually the prior occupants), but it also generated additional
cash for the previous corporate owners and relieved them of the obligation to
maintain existing houses or build new ones. There is no reliable estimate of the
effect of these two factors on corporate cash-flow or the additional investment
thus financed, but the amount could easily run into tens of billions of U.S. dollar
equivalent per annum since the late 1990s.
The gradual shift in responsibility for the financing of health, education, and
other social services from state enterprises to the state, starting in the mid-
1990s, similarly created additional cash-flow for those enterprises.
The (partial) privatization of numerous Chinese state-owned enterprises since the
mid-1990s, a process that was accelerated in the late 1990s, generated additional cash-
flow for the very corporations that were being privatized; in China (with exception of
10 percent of the proceeds of domestic IPOs that accrue to the National Pension
Fund), privatization proceeds accrue to the company that is being privatized or its
holding company. Except for IPO proceeds, there is no reliable estimate of corporate
privatization proceeds in China, but the amounts are undoubtedly significant.
China’s rapidly improving infrastructure allowed reductions in the cost of
logistics in and between the three largest industrial agglomerations: the Pearl
River Delta, the Ningbo-Shanghai-Suzhou area, and the Beijing-Tianjin corridor.
The SARS epidemic of 2003 was short-lived, but the rapid expansion of bank
credit (designed to counter the sharp economic downturn that followed the
outbreak in the second quarter of that year) continued long thereafter. This
provided significant additional liquidity to the corporate sector, which was
already enjoying improved returns on capital.
If There Is “Over Investment” in Manufacturing,
Why Don’t We See More Evidence of Excess Capacity?As a result of the investment surge since the turn of the century, excess capacity
in several manufacturing industries (e.g., automobiles, steel and other construction
materials) did in fact emerge in 2004 and 2005 and profit margins fell, especially
20 Can Ch ina ’s Growth Tra jectory Be Susta ined? The Conference Board
14 Since 1998 the provision of housing to workers is no longer the responsibility of employers in China. Private home
ownership in urban China is now about 80 percent, higher than in the United States. The accelerated privatization of
urban housing from 1998 stimulated the growth of a huge commercial residential construction, home improvement
and house rental industry. It also promoted the development of a mortgage industry and other financial sector
improvements. Privately owned houses may be used as collateral for bank loans since 1996.
8/7/2019 Bottelier and Fosler - Can China's Growth Trajectory Be Sustained
http://slidepdf.com/reader/full/bottelier-and-fosler-can-chinas-growth-trajectory-be-sustained 22/24
Can Ch ina ’s Growth Tra jectory Be Susta ined? The Conference Board 2
in heavy industry. This caused a great deal of concern on the part of the govern-
ment, which reacted by stepping up infrastructure investment to create additional
domestic demand for construction materials and by encouraging exports generally.
It is believed that many local governments provided additional incentives for
export-oriented industries.15 The strongest effect on China’s trade balance,
however, came not from export growth, but from import substitution, especially
in steel and heavy machinery. By the middle of 2006, practically all visible signs
of excess capacity had disappeared except in stainless steel.16 Profit margins were
up again, inventories as a share of total output were down and capacity utilization
in most industries was back to normal. In the process, China also became a
fairly significant exporter of heavy machinery for the first time, a trend that is
likely to continue in the years ahead.
China’s official and unofficial (local government) incentive framework, including
the exchange rate, was supportive of these developments, but continued high
productivity growth was almost certainly the most important factor. To the
extent domestic demand fell short, China was able to increase exports without
loss of corporate profitability in most cases, because productivity growth was so
high. Moreover, there is some evidence to suggest that export prices tend to be
higher than domestic prices, because competition in China is often even more
intense than in export markets. This is another factor that may be driving net
export growth, but more research on this needed, because the available price
information is mostly anecdotal in nature.
Average corporate profits continued to rise through the first half of 2007.
In this context, it is important to note that the companies responsible for China’s
growing net-exports since 2004 are domestic private enterprises, foreign-invested
enterprises and, to a much smaller extent, collectively owned enterprises. State-
owned companies are still important in China, but their share in total industrial
output continues to fall while their contribution to net exports is becoming
increasingly negative (Chart 3 on page 8). Another point worth noting is that
since 2006, many Chinese exporters have been able to pass on at least some
domestic cost increases to foreign customers. This reversal in the trend is
probably due to the fact that Chinese exporters have increased their market
share in export markets to the point that the largest firms can afford to act as
price leaders. One implication of this is that currency appreciation may become
less effective in slowing export growth. Excess capacity may begin to emerge
again when the domestic economy and/or global growth weakens, as is boundto happen at some point.
15 Local incentives are not necessarily sanctioned by the central government and can take many (often non-transparent)
forms such as, for example, land price reductions, subsidized financing, relaxed environmental controls, etc.
16 Stainless steel producers in China agreed to voluntary production cuts in July 2007in an effort to support the price.

8/7/2019 Bottelier and Fosler - Can China's Growth Trajectory Be Sustained
http://slidepdf.com/reader/full/bottelier-and-fosler-can-chinas-growth-trajectory-be-sustained 23/24
The model of China’s investment, output, and net-export growth since around
the turn of the century is not sustainable. Correcting forces in the form of a
decline in corporate profits due to rising unit labor costs, an appreciating
exchange rate, rising land and utility costs, etc. will undoubtedly kick in
at some point, but for the moment it seems that the cycle of high profits and
high investment is still intensifying. China will probably continue to enjoy
cost advantages in many industries for years. Internal and external imbalances
may grow significantly worse before the current cycle burns out.
Because inflation has remained relatively modest, it is hard to argue that
China’s overall investment rate is too high. However, there is a problem with
the composition of total investment. The worsening of China’s internal and
external economic imbalances suggests that there is too much investment in
manufacturing and too little in social infrastructure (health, education, and
social security), low-cost housing, and environmental clean-up. Additional
measures aimed at slowing investment growth in manufacturing, are needed,
along with measures to reduce the need for pre-cautionary household savings
and promote consumption. Faster exchange rate appreciation, especially if
combined with greater flexibility, could support such measures by reducing net
exports and by shifting the domestic incentive framework in favor of non-
tradables. This would be desirable since most non-tradables are produced in
service industries, which have remained relatively underdeveloped in China, but
offer enormous potential for future employment growth. If current dynamics are
allowed to continue, the trade surplus is likely to balloon, which will intensify
international trade frictions with unpredictable consequences.
22 Can Ch ina ’s Growth Tra jectory Be Susta ined? The Conference Board
Is China’s Turbo-GrowthModel Sustainable?
8/7/2019 Bottelier and Fosler - Can China's Growth Trajectory Be Sustained
http://slidepdf.com/reader/full/bottelier-and-fosler-can-chinas-growth-trajectory-be-sustained 24/24
The Conference Board, Inc.
845Third Avenue
New York, NY 10022-6600
United States
Tel +1 212 759 0900
Fax +1 212 980 7014
www.conference-board.org
The Conference Board Europe
Chaussée de La Hulpe 130, box 11
B-1000 Brussels
Belgium
Tel + 32 2 675 5405
Fax + 32 2 675 0395www.conference-board.org/europe.htm
The Conference Board Asia-Pacific
22/F, Shun Ho Tower
24-30 Ice House Street, Central
Hong Kong, SAR
Tel + 852 2804 1000
Fax + 8522869 1403
www.conference-board.org/ap.htm
The Conference Board of Canada
255 Smyth Road
Authors Pieter Bottelier, Gail Fosler
Editor Charles Mitchell
Design Peter Drubin
Production Andrew Ashwell
related resources from the conference board
The Conference Board Economics Program
Under the direction of Chief Economist and President ofThe Conference Board,
Gail Fosler, the Economics Program is a recognized source of business economic
research and objective indicators, analyses and forecasts— information that helpscompanies monitor and assess economic conditions that directly impact their
markets and industry
Research Expertise
• Business Cycles and Economic Indicators
• Productivity and Technological Change
• Labor Markets and Living Standards
• Exchange Rates and Financial Issues
• International Productivity Comparisons
Recent Publications
Research Reports
China’s Productivity Boom: The Contribution of Restructuring to
Growth and Competitiveness
This report shows that the increased share of activity accounted for by private
firms and the associated restructuring of state-owned firms has dramatically
improved Chinese business efficiency. Research report R-1411-07-RR
Executive Action Reports
Growth in the Middle East Depends on Productivity
Can the Middle East and North African region overcome stagnant productivity
levels and the lack of a large middle class with spending power? February 2007
Is ICT’s Contribution to Productivity Growth Peaking?
This analysis examines whether information technology can continue to boost
productivity growth, among other issues based on this study of productivity and
income trends in 40 countries. January 2007
Competitive Advantage of “Low-Wage” Countries Often Exaggerated
When adjusting wages for productivity, the cost advantage to companies of
“low-wage” countries and regions such as China, India, Mexico, or Central and
Eastern Europe overNorth America and Western Europe is smaller than you think.
October 2006
Periodicals
StraightTalk® by Gail Fosler