
Bothell/East Kenmore - King County
75
Bothell/East Kenmore Area: 038 Residential Revalue for 2015 Assessment Roll Obtained from http://celebratebig.com/pacific-northwest/sammamish-river-trail/index.htm Area 38 is located in the north eastern area of King County and includes portions of the incorporated municipalities of Kenmore, Bothell and Woodinville. It is homogeneous and suburban in nature and has excellent freeway access to Interstate 405 and State Highway 522. There is a small number of waterfront parcels located on the North and South sides of the Sammamish River all within the municipality of Bothell. Major recreational attributes in the area include Wallace Swamp Creek Park, The Park at Bothell Landing, Sammamish River Park, the Burke-Gilman/Sammamish River Trails, Wayne Golf Course, West Hill Park, William Penn Park and various other community parks. Area 38 is located within the highly sought after Northshore School district. In addition, The University of Washington, Bothell Campus and Cascadia Community College are located at the crossroads of Interstate 405 and State Route 522 in Bothell. This area also benefits from the Bothell Central Business District now officially re-named Bothell Landing, This area has been going through a major revitalization and redevelopment project that started in 2010. Department of Assessments Setting values, serving the community, and pursuing excellence 500 Fourth Avenue, ADM-AS 0708 Seattle, WA 98104-2384 OFFICE (206) 296-7300 FAX (206) 296-0595 Email: [email protected] http://www.kingcounty.gov/assessor/
Transcript of Bothell/East Kenmore - King County

Bothell/East Kenmore Area: 038
Residential Revalue for 2015 Assessment Roll
Obtained from http://celebratebig.com/pacific-northwest/sammamish-river-trail/index.htm
Area 38 is located in the north eastern area of King County and includes portions of the incorporated municipalities of Kenmore, Bothell and Woodinville. It is homogeneous and suburban in nature and has excellent freeway access to Interstate 405 and State Highway 522. There is a small number of waterfront parcels located on the North and South sides of the Sammamish River all within the municipality of Bothell. Major recreational attributes in the area include Wallace Swamp Creek Park, The Park at Bothell Landing, Sammamish River Park, the Burke-Gilman/Sammamish River Trails, Wayne Golf Course, West Hill Park, William Penn Park and various other community parks. Area 38 is located within the highly sought after Northshore School district. In addition, The University of Washington, Bothell Campus and Cascadia Community College are located at the crossroads of Interstate 405 and State Route 522 in Bothell. This area also benefits from the Bothell Central Business District now officially re-named Bothell Landing, This area has been going through a major revitalization and redevelopment project that started in 2010.
Department of Assessments Setting values, serving the community, and pursuing excellence
500 Fourth Avenue, ADM-AS 0708 Seattle, WA 98104-2384
OFFICE (206) 296-7300 FAX (206) 296-0595
Email: [email protected] http://www.kingcounty.gov/assessor/

Area 038 Map
Area 038 1
2015 Annual Update Department of Assessments
ll maps in this document are subject to the following disclaimer: The information included on this map has been compiled by King County staff from a variety of sources and is subject to chang e without notice. King County makes no representations or warranties, express or implied, as to accuracy, completeness, timeliness, or rights to the use of such information. King County shall not be liable for any general, special, indirect, incidental, or
consequential damages including, but not limited to, lost revenues or lost profits resulting from the use or misuse of the information contained on this map. Any sale of this map or information on this map is prohibited
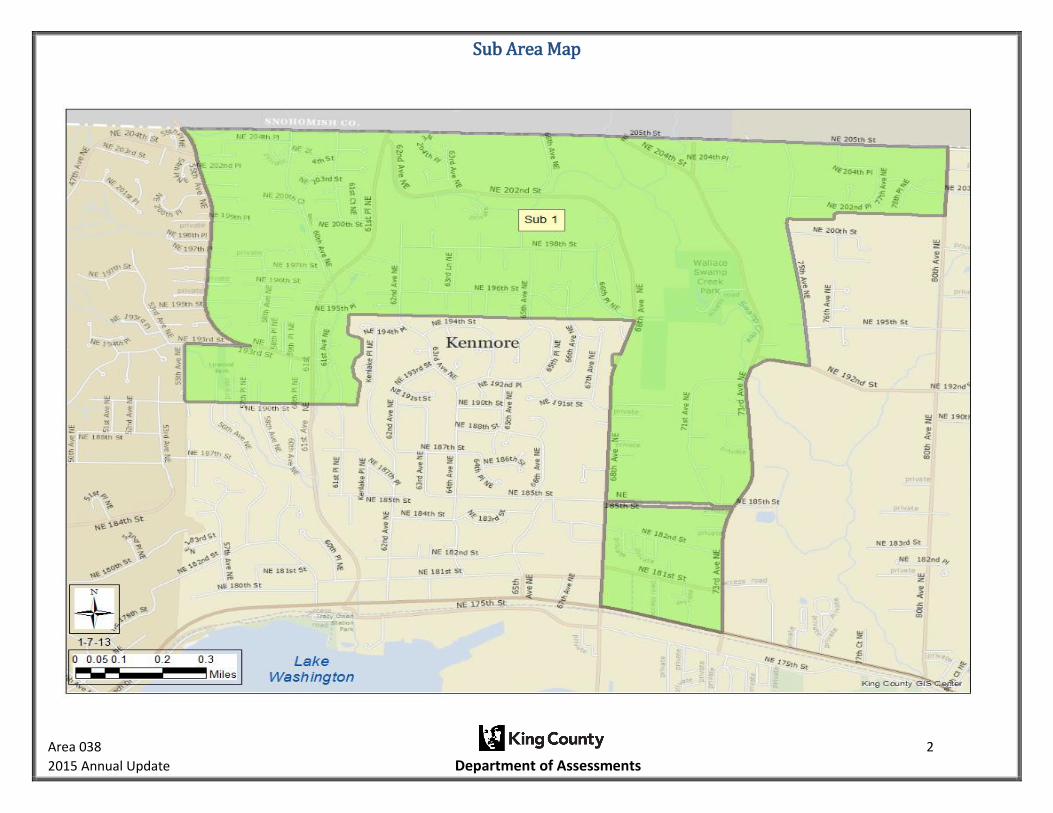
Sub Area Map
Area 038 2
2015 Annual Update Department of Assessments

Sub Area Map
Area 038 3
2015 Annual Update Department of Assessments

Sub Area Map
Area 038 4
2015 Annual Update Department of Assessments

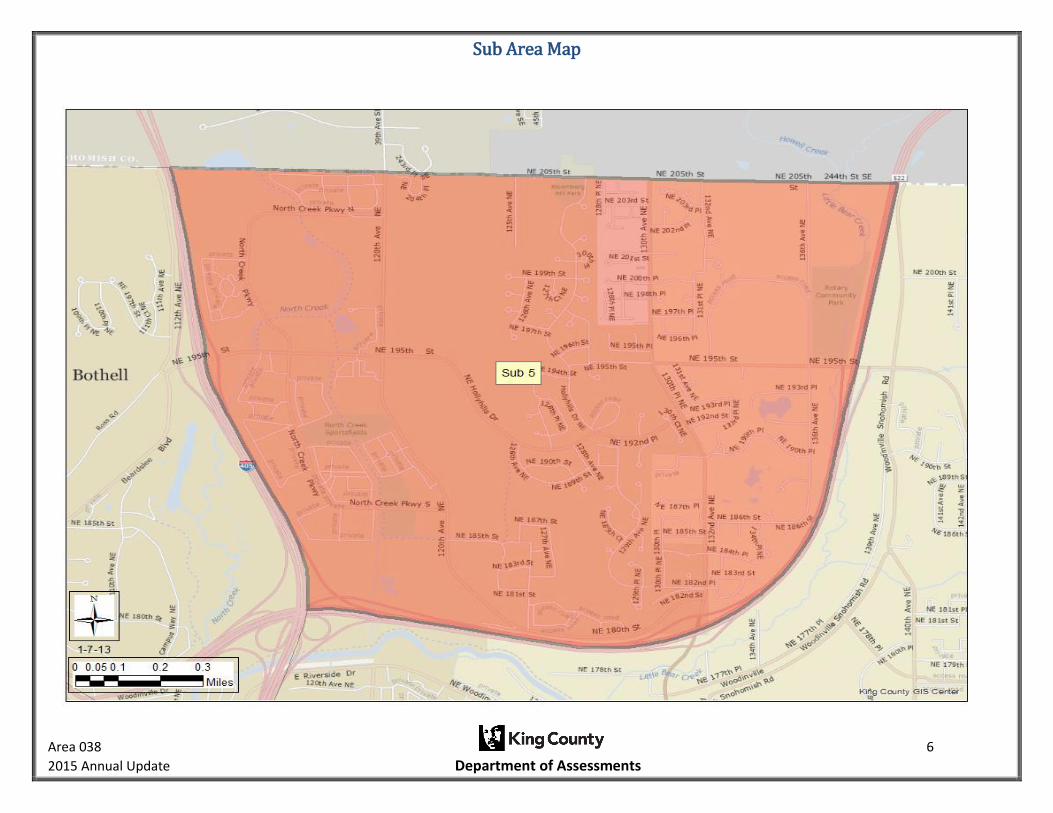
Sub Area Map
Area 038 5
2015 Annual Update Department of Assessments
Sub Area Map
Area 038 6
2015 Annual Update Department of Assessments

Area 038 Neighborhood Map
Area 038 7
2015 Annual Update Department of Assessments

Area 038 Housing Profile
Area 038 8
2015 Annual Update Department of Assessments
Grade 5/ Year Built 1932/ Total Living Area 530
Account Number 011410-0421
Grade 7/ Year Built 1960/ Total Living Area 1,320
Account Number 926940-0010
Grade 9/ Year Built 2006/ Total Living Area 3,100
Account Number 143753-0110
Grade 6/ Year Built 1938/ Total Living Area 1,080
Account Number 012604-9177
Grade 8/ Year Built 2006/ Total Living Area 2,420
Account Number 108865-0010
Grade 10/ Year Built 2007/ Total Living Area 3,200
Account Number 072605-9118

Area 038 Housing Profile
Area 038 9
2015 Annual Update Department of Assessments
Grade 11/ Year Built 2003/ Total Living Area 4,280
Account Number 929510-0110

Area 038 10
2015 Annual Update Department of Assessments
Glossary for Improved Sales
Condition: Relative to Age and Grade
1= Poor Many repairs needed. Showing serious deterioration. 2= Fair Some repairs needed immediately. Much deferred maintenance. 3= Average Depending upon age of improvement; normal amount of upkeep for the age of the home. 4= Good Condition above the norm for the age of the home. Indicates extra attention and care has been taken to maintain. 5= Very Good Excellent maintenance and updating on home. Not a total renovation.
Residential Building Grades
Grades 1 - 3 Falls short of minimum building standards. Normally cabin or inferior structure. Grade 4 Generally older low quality construction. Does not meet code. Grade 5 Lower construction costs and workmanship. Small, simple design. Grade 6 Lowest grade currently meeting building codes. Low quality materials, simple designs. Grade 7 Average grade of construction and design. Commonly seen in plats and older subdivisions. Grade 8 Just above average in construction and design. Usually better materials in both the exterior and interior finishes. Grade 9 Better architectural design, with extra exterior and interior design and quality. Grade 10 Homes of this quality generally have high quality features. Finish work is better, and more design quality is seen in the floor plans and larger square footage. Grade 11 Custom design and higher quality finish work, with added amenities of solid woods, bathroom fixtures and more luxurious options. Grade 12 Custom design and excellent builders. All materials are of the highest quality and all conveniences are present. Grade 13 Generally custom designed and built. Approaching the Mansion level. Large amount of highest quality cabinet work, wood trim and marble; large entries.

Area 038 11
2015 Annual Update Department of Assessments
Executive Summary
Bothell/East Kenmore - Area 038
Annual Update
Characteristics Based Market Adjustment for 2015 Assessment Roll
Previous Physical Inspection: 2014 Number of Improved Sales: 829 Range of Sale Dates: 1/1/2012 – 12/31/2014 Sales were time adjusted to 1/1/2015
Sales - Improved Valuation Change Summary:
Land Improvements Total Mean Sale Price Ratio COD
2014 Value $170,000 $285,800 $455,800
6.41%
2015 Value $193,300 $325,000 $518,300 $547,500 94.3% 5.93%
$ Change +$23,300 +$39,200 +$62,500
% Change +13.7% +13.7% +13.7%
Coefficient of Dispersion (COD) is a measure of the uniformity of the predicted assessed values for properties within this geographic area. The 2015 COD of 5.93% is an improvement from the previous COD of 6.41%. The lower the COD, the more uniform are the predicted assessed values. Assessment standards prescribed by the International Association of Assessing Officers identify that the COD in rural or diverse neighborhoods should be no more than 20%. The resulting COD meets or exceeds the industry assessment standards.
Population - Improved Valuation Change Summary:
Land Improvements Total
2014 Value $173,800 $239,200 $413,000
2015 Value $197,700 $274,400 $472,100
$ Change +$23,900 +$35,200 +$59,100
% Change +13.8% +14.7% +14.3%
Number of one to three unit residences in the population: 6,526
Summary of Findings: The analysis for this area consisted of a general review of applicable characteristics, such
as: grade, age, condition, stories, living area, views, waterfront, lot size, land problems and neighborhoods. The
analysis results showed that several neighborhood-based variables needed to be included in the valuation
formula in order to improve the uniformity of assessments throughout the area. For instance, Neighborhood 2
and Neighborhood 3 and Sub Areas 4 and 5, were generally at a lower assessment level than the rest of the
population. This resulted in more of an upward adjustment. Parcels in Sub Area 2, not including neighborhood 1
were generally at a higher assessment level than the rest of the population. This resulted in less of an upward
adjustment. This annual update valuation model corrects for these strata differences.

Neighborhood 038 Map
Area 038 12
2015 Annual Update Department of Assessments
ll maps in this document are subject to the following disclaimer: The information included on this map has been compiled by King County staff from a variety of sources and is subject to change without notice. King County makes no representations or warranties, express or implied, as to accuracy, completeness, timeliness, or rights
to the use of such information. King County shall not be liable for any general, special, indirect, incidental, or consequential damages including, but not limited to, lost revenues or lost profits resulting from the use or misuse of the information contained on this map. Any sale of this map or information on this map is prohibited
except by written permission of King County.

Area 038 13
2015 Annual Update Department of Assessments
Area 038 - Model Adjustments
1-3 Unit Residences
2015 Total Value = 2014 Total Value + Overall (+/-) Characteristic Adjustments
Standard Area Adjustment # Parcels Adjusted % of Population +11.96% 2,818 43%
Due to truncating the coefficient values used to develop the percentages and further rounding of the
percentages in this table, the results you will obtain are an approximation of adjustment achieved in
production.
The percentages listed in the following table are total adjustments, not additive adjustments.
Model Variable Adj % # Sales # in Pop % Rep
Neighborhood 2 +15.87% 48 348 14%
Neighborhood 3 +20.77% 34 169 20%
Sub Area 2 W/O Neighborhood 1
+6.01% 99 376 26%
Sub Area 4 +17.66% 164 1820 9%
Sub Area 5 +17.89% 146 995 15%
There were no properties that would receive a multiple variable adjustment.
Generally, Neighborhood 2, Neighborhood 3, Sub Area 4 and Sub Area 5 parcels were at a lower
assessment level than the rest of the population, which resulted in more of an upward adjustment
Parcels in Sub area 2 not including Neighborhood 1 were at a higher assessment level than the rest of
the population, which resulted in less of an upward adjustment. This model corrects for these strata
differences.

Area 038 14
2015 Annual Update Department of Assessments
Sample Representation of Population
Year Built or Renovated
Sales Sample
Year Built/Ren Frequency % Sales Sample
1910 0 0.00%
1920 0 0.00%
1930 6 0.72%
1940 2 0.24%
1950 13 1.57%
1960 38 4.58%
1970 99 11.94%
1980 99 11.94%
1990 122 14.72%
2000 104 12.55%
2014 346 41.74%
829
Population
Year Built/Ren Frequency % Population
1910 24 0.37%
1920 30 0.46%
1930 61 0.93%
1940 77 1.18%
1950 158 2.42%
1960 521 7.98%
1970 1,136 17.41%
1980 944 14.47%
1990 1,041 15.95%
2000 871 13.35%
2014 1,663 25.48%
6,526
Sales of new homes built over the last few years are over represented in this sample.
This is a common occurrence due to the fact that most new homes will sell shortly after completion. This
over representation was found to lack statistical significance during the modeling process.
0.00%
5.00%
10.00%
15.00%
20.00%
25.00%
30.00%
35.00%
40.00%
45.00%
1910 1920 1930 1940 1950 1960 1970 1980 1990 2000 2014
Year Built/ Renovate
% Sales Sample
% Population

Area 038 15
2015 Annual Update Department of Assessments
Sales Sample Representation of Population
Above Grade Living Area
Sales Sample
AGLA Frequency % Sales Sample
500 0 0.00%
1,000 19 2.29%
1,500 190 22.92%
2,000 143 17.25%
2,500 219 26.42%
3,000 154 18.58%
3,500 56 6.76%
4,000 45 5.43%
4,500 3 0.36%
5,000 0 0.00%
5,500 0 0.00%
9,000 0 0.00%
829
Population
AGLA Frequency % Population
500 1 0.02%
1,000 234 3.59%
1,500 1,865 28.58%
2,000 1,412 21.64%
2,500 1,437 22.02%
3,000 974 14.92%
3,500 369 5.65%
4,000 179 2.74%
4,500 34 0.52%
5,000 11 0.17%
5,500 4 0.06%
9,000 6 0.09%
6,526
The sales sample frequency distribution follows the population distribution fairly closely with regard to
Above Grade Living Area (AGLA). This distribution is adequate for both accurate analysis and appraisals.
0.00%
5.00%
10.00%
15.00%
20.00%
25.00%
30.00%
35.00%
500 1,000 1,500 2,000 2,500 3,000 3,500 4,000 4,500 5,000 5,500 9,000
Above Grade Living Area
% Sales Sample
% Population

Area 038 16
2015 Annual Update Department of Assessments
Sales Sample Representation of Population
Building Grade
Sales Sample
Grade Frequency % Sales Sample
1 0 0.00%
2 0 0.00%
3 0 0.00%
4 0 0.00%
5 0 0.00%
6 9 1.09%
7 254 30.64%
8 327 39.45%
9 209 25.21%
10 26 3.14%
11 4 0.48%
12 0 0.00%
13 0 0.00%
829
Population
Grade Frequency % Population
1 0 0.00%
2 0 0.00%
3 0 0.00%
4 1 0.02%
5 10 0.15%
6 177 2.71%
7 2,519 38.60%
8 2,345 35.93%
9 1,283 19.66%
10 150 2.30%
11 37 0.57%
12 4 0.06%
13 0 0.00%
6,526
The sales sample frequency distribution follows the population distribution relatively closely with regard
to Building Grades. This distribution is adequate for both accurate analysis and appraisals.
0.00%
5.00%
10.00%
15.00%
20.00%
25.00%
30.00%
35.00%
40.00%
45.00%
1 2 3 4 5 6 7 8 9 10 11 12 13Grade
% Sales Sample
% Population

Area 038 17
2015 Annual Update Department of Assessments
Area 038 Market Value Changes Over Time In a changing market, recognition of a sales trend to adjust a population of sold properties to a common date is required to allow for value differences over time between a range of sales dates and the assessment date. The following chart shows the % time adjustment required for sales to reflect the indicated market value as of the assessment date, January 1, 2015. For example, a sale of $475,000 which occurred on October 1, 2013 would be adjusted by the time trend factor of 1.157, resulting in an adjusted value of $549,000 ($475,000 * 1.157=$549,575) – truncated to the nearest $1000.
SaleDate Adjustment (Factor) Equivalent Percent
1/1/2012 1.376 37.6%
2/1/2012 1.366 36.6%
3/1/2012 1.356 35.6%
4/1/2012 1.345 34.5%
5/1/2012 1.335 33.5%
6/1/2012 1.324 32.4%
7/1/2012 1.314 31.4%
8/1/2012 1.303 30.3%
9/1/2012 1.293 29.3%
10/1/2012 1.282 28.2%
11/1/2012 1.272 27.2%
12/1/2012 1.261 26.1%
1/1/2013 1.251 25.1%
2/1/2013 1.240 24.0%
3/1/2013 1.230 23.0%
4/1/2013 1.220 22.0%
5/1/2013 1.209 20.9%
6/1/2013 1.199 19.9%
7/1/2013 1.189 18.9%
8/1/2013 1.178 17.8%
9/1/2013 1.167 16.7%
10/1/2013 1.157 15.7%
11/1/2013 1.146 14.6%
12/1/2013 1.136 13.6%
1/1/2014 1.125 12.5%
2/1/2014 1.115 11.5%
3/1/2014 1.105 10.5%
4/1/2014 1.094 9.4%
5/1/2014 1.084 8.4%
6/1/2014 1.073 7.3%
7/1/2014 1.063 6.3%
8/1/2014 1.053 5.3%
9/1/2014 1.042 4.2%
10/1/2014 1.032 3.2%
11/1/2014 1.021 2.1%
12/1/2014 1.011 1.1%
1/1/2015 1.000 0.0%

Area 038 18
2015 Annual Update Department of Assessments
The time adjustment formula for Area 038 is: (0.848530573892566 - 0.0286650817786965 * 0.05790108 - 0.0618801251331316 * 0.04101327 - 0.000286481301421421 * SaleDay + 0.047614646309333 * 0.119421 - 0.0411144793422597 * 0.1978287 - 0.0427026673950086 * 0.1761158) / (0.848530573892566 - 0.0286650817786965 * 0.05790108 - 0.0618801251331316 * 0.04101327 + 0.047614646309333 * 0.119421 - 0.0411144793422597 * 0.1978287 - 0.0427026673950086 * 0.1761158) SaleDay = SaleDate - 42005
Area 038 19
2015 Annual Update Department of Assessments
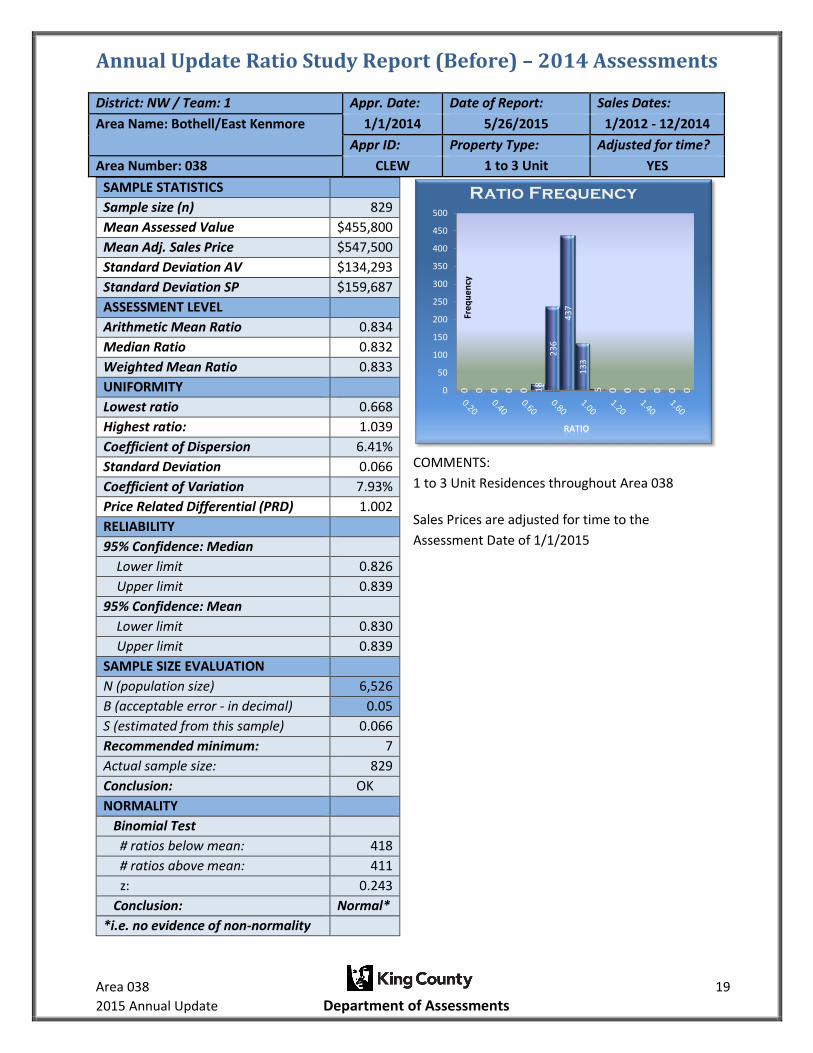
Annual Update Ratio Study Report (Before) – 2014 Assessments
District: NW / Team: 1 Appr. Date: Date of Report: Sales Dates:
Area Name: Bothell/East Kenmore 1/1/2014 5/26/2015 1/2012 - 12/2014
Appr ID: Property Type: Adjusted for time?
Area Number: 038 CLEW 1 to 3 Unit
Residences
YES
SAMPLE STATISTICS
Sample size (n) 829
Mean Assessed Value $455,800
Mean Adj. Sales Price $547,500
Standard Deviation AV $134,293
Standard Deviation SP $159,687
ASSESSMENT LEVEL
Arithmetic Mean Ratio 0.834
Median Ratio 0.832
Weighted Mean Ratio 0.833
UNIFORMITY
Lowest ratio 0.668
Highest ratio: 1.039
Coefficient of Dispersion 6.41%
Standard Deviation 0.066
Coefficient of Variation 7.93%
Price Related Differential (PRD) 1.002
RELIABILITY
95% Confidence: Median
Lower limit 0.826
Upper limit 0.839
95% Confidence: Mean
Lower limit 0.830
Upper limit 0.839
SAMPLE SIZE EVALUATION
N (population size) 6,526
B (acceptable error - in decimal) 0.05
S (estimated from this sample) 0.066
Recommended minimum: 7
Actual sample size: 829
Conclusion: OK
NORMALITY
Binomial Test
# ratios below mean: 418
# ratios above mean: 411
z: 0.243
Conclusion: Normal*
*i.e. no evidence of non-normality
COMMENTS:
1 to 3 Unit Residences throughout Area 038
Sales Prices are adjusted for time to the
Assessment Date of 1/1/2015
0 0 0 0 0 18
23
6
43
7
13
3
5 0 0 0 0 0 00
50
100
150
200
250
300
350
400
450
500
Fre
qu
en
cy
RATIO
Ratio Frequency
Area 038 20
2015 Annual Update Department of Assessments
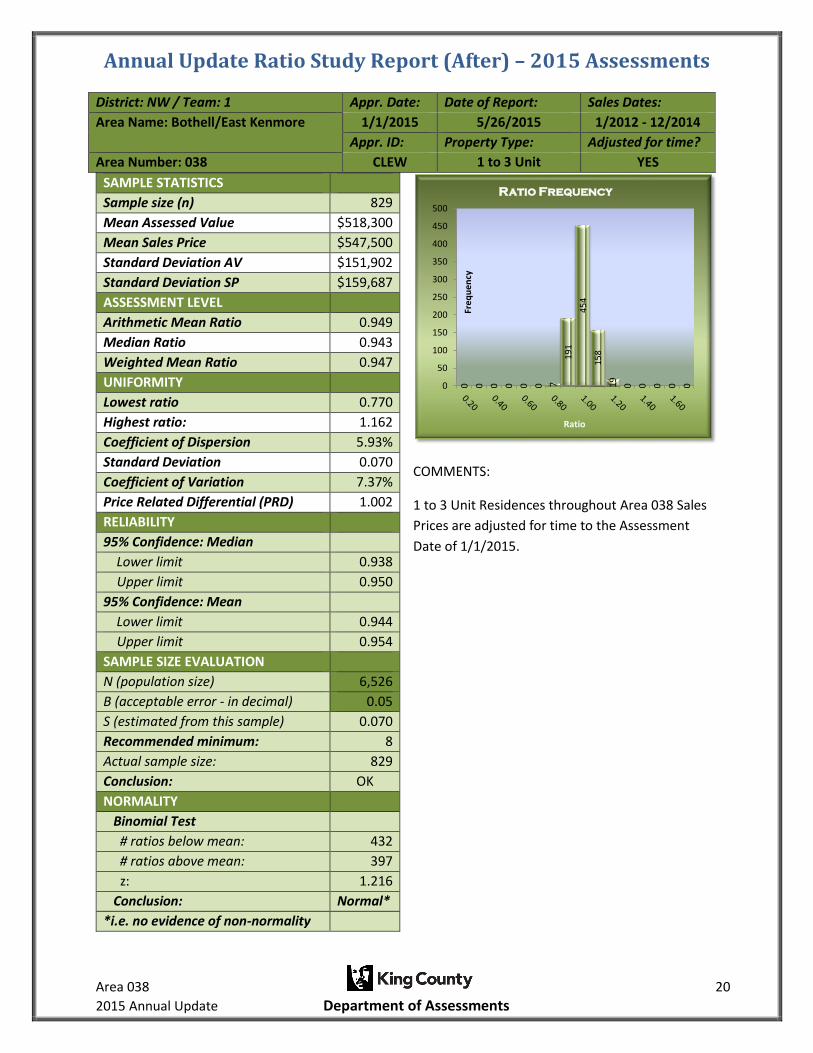
Annual Update Ratio Study Report (After) – 2015 Assessments
District: NW / Team: 1 Appr. Date: Date of Report: Sales Dates:
Area Name: Bothell/East Kenmore 1/1/2015 5/26/2015 1/2012 - 12/2014
Appr. ID: Property Type: Adjusted for time?
Area Number: 038 CLEW 1 to 3 Unit
Residences
YES
SAMPLE STATISTICS
Sample size (n) 829
Mean Assessed Value $518,300
Mean Sales Price $547,500
Standard Deviation AV $151,902
Standard Deviation SP $159,687
ASSESSMENT LEVEL
Arithmetic Mean Ratio 0.949
Median Ratio 0.943
Weighted Mean Ratio 0.947
UNIFORMITY
Lowest ratio 0.770
Highest ratio: 1.162
Coefficient of Dispersion 5.93%
Standard Deviation 0.070
Coefficient of Variation 7.37%
Price Related Differential (PRD) 1.002
RELIABILITY
95% Confidence: Median
Lower limit 0.938
Upper limit 0.950
95% Confidence: Mean
Lower limit 0.944
Upper limit 0.954
SAMPLE SIZE EVALUATION
N (population size) 6,526
B (acceptable error - in decimal) 0.05
S (estimated from this sample) 0.070
Recommended minimum: 8
Actual sample size: 829
Conclusion: OK
NORMALITY
Binomial Test
# ratios below mean: 432
# ratios above mean: 397
z: 1.216
Conclusion: Normal*
*i.e. no evidence of non-normality
COMMENTS:
1 to 3 Unit Residences throughout Area 038 Sales
Prices are adjusted for time to the Assessment
Date of 1/1/2015.
0 0 0 0 0 0 7
19
1
45
4
15
8
19
0 0 0 0 00
50
100
150
200
250
300
350
400
450
500
Fre
qu
en
cy
Ratio
Ratio Frequency

Area 038 21
2015 Annual Update Department of Assessments
Annual Update Process
Effective Date of Appraisal: January 1, 2015 Date of Appraisal Report: May 26, 2015
Sales Screening for Improved Parcel Analysis
In order to ensure that the Assessor’s analysis of sales of improved properties best reflects the market value of the majority of the properties within an area, non-typical properties must be removed so a representative sales sample can be analyzed to determine the new valuation level. The following list illustrates examples of non-typical properties which are removed prior to the beginning of the analysis.
1. Vacant parcels 2. Mobile Home parcels 3. Multi-Parcel or Multi Building parcels 4. New construction where less than a 100% complete house was assessed for 2014 5. Existing residences where the data for 2014 is significantly different than the data for 2015 due
to remodeling 6. Parcels with improvement values, but no characteristics 7. Parcels with either land or improvement values of $25,000 or less posted for the 2014
Assessment Roll 8. Short sales, financial institution re-sales and foreclosure sales verified or appearing to be not at
market 9. Others as identified in the sales removed list
(See the attached Improved Sales Used in this Annual Update Analysis and Improved Sales Removed from this Annual Update Analysis for more detailed information)
Land Update
Based on the 25 usable land sales available in the area, their 2014 Assessment Year assessed values, and supplemented by the value increase in sales of improved parcels, an overall market adjustment was derived. This resulted in an overall +13.8% increase in land assessments in the area for the 2015 Assessment Year. The formula is:
2015 Land Value = 2014 Land Value * 1.140, with the result truncated to the next $1,000.
The formula for the Holly Hills Manufactured Home Community (Major number’s 339540-339547) is:
2015 Land Value = 2014 Land Value * 1.05 with the result truncated to the next $1,000
Improved Parcel Update
The analysis for this area consisted of a general review of applicable characteristics, such as: grade, age,
condition, stories, living area, views, waterfront, lot size, land problems and neighborhoods. The analysis
results showed that several neighborhood-based variables needed to be included in the valuation
formula in order to improve the uniformity of assessments throughout the area. For instance,

Area 038 22
2015 Annual Update Department of Assessments
Neighborhood 2 and Neighborhood 3 and Sub Areas 4 and 5, were generally at a lower assessment level
than the rest of the population. This resulted in more of an upward adjustment. Parcels in Sub Area 2,
not including neighborhood 1 were generally at a higher assessment level than the rest of the
population. This resulted in less of an upward adjustment. This annual update valuation model corrects
for these strata differences.
With the exception of real property mobile home parcels and parcels with “accessory only” improvements, the new recommended values on all improved parcels were based on the analysis of the 829 useable residential sales in the area. Sales used in the valuation model were time adjusted to January 1, 2015. The chosen adjustment model was developed using multiple regression. An explanatory adjustment table is included in this report. The derived adjustment formula is:
2015 Total Value = 2014 Total Value *(1-0.05)/ (0.848530573892566 - 0.0286650817786965 * Nghb2 - 0.0618801251331316 * Nghb3 + 0.047614646309333 * Sub2WONghb1 - 0.0411144793422597 * Sub4 - 0.0427026673950086 * Sub5) The resulting total value is truncated to the next $1,000, then:
2015 Improvements Value = 2015 Total Value minus 2015 Land Value
Mobile Home Update
There were 51 sales of mobile homes within Area 038. Analysis of the mobile homes sales indicated a
value increase of 5%. The adjustment formula is:
2015 Total Value = 2014 Total Value *1.05
2015 Improvements Value=2015 Total Value minus 2015 Land Value
Results
The resulting assessment level is 94.3%. The standard statistical measures of valuation performance are all within the IAAO recommended range of .90 to 1.10. Application of these recommended values for the 2015 assessment year (taxes payable in 2016) results in an average total change from the 2014 assessments of +14.3%. This increase is due partly to market changes over time and the previous assessment levels. Note: Additional information may reside in the Assessor’s Real Property Database, Assessor’s procedures, Revalue Plan, separate studies, and statutes.
Exceptions:
If multiple houses exist on a parcel, the Total % Change indicated by the sales sample is used to arrive at the new total value (Previous Year Land Value + Previous Year Improvement Value) * 1.137.

Area 038 23
2015 Annual Update Department of Assessments
If the site is improved with a house and mobile home, the formula derived from the house is used to arrive at new total value.
If “accessory improvements only”, the Total % Change, as indicated by the sales sample, is used to arrive at a new total value. (Previous Year Land Value + Previous Year Improvement Value) * 1.137.
If adjusted land value falls < $1,000, then land value = $1,000 or previous, whichever is less.
If adjusted improvement value falls < $1,000, then improvement value = $1,000 or previous, whichever is less.
If land value <= $10,000 no adjustment is applied.
If improvements and accessories <= $10,000 no further adjustment applied.
If vacant parcel (no improvement value), the land adjustment applies.
If a parcel is coded “non-perc” (sewer system=3 or 4), there is no change from previous land value.
If a parcel is coded “unbuildable” = 1, there is no change from previous land value.
If a parcel is coded water district private restricted, or public restricted, there is no change from previous land value.
If an improvement is coded “% net condition” or is in “poor” condition, then there is no change from previous improvement value, only the land adjustment applies.
Any properties excluded from the annual up-date process are noted in RealProperty.
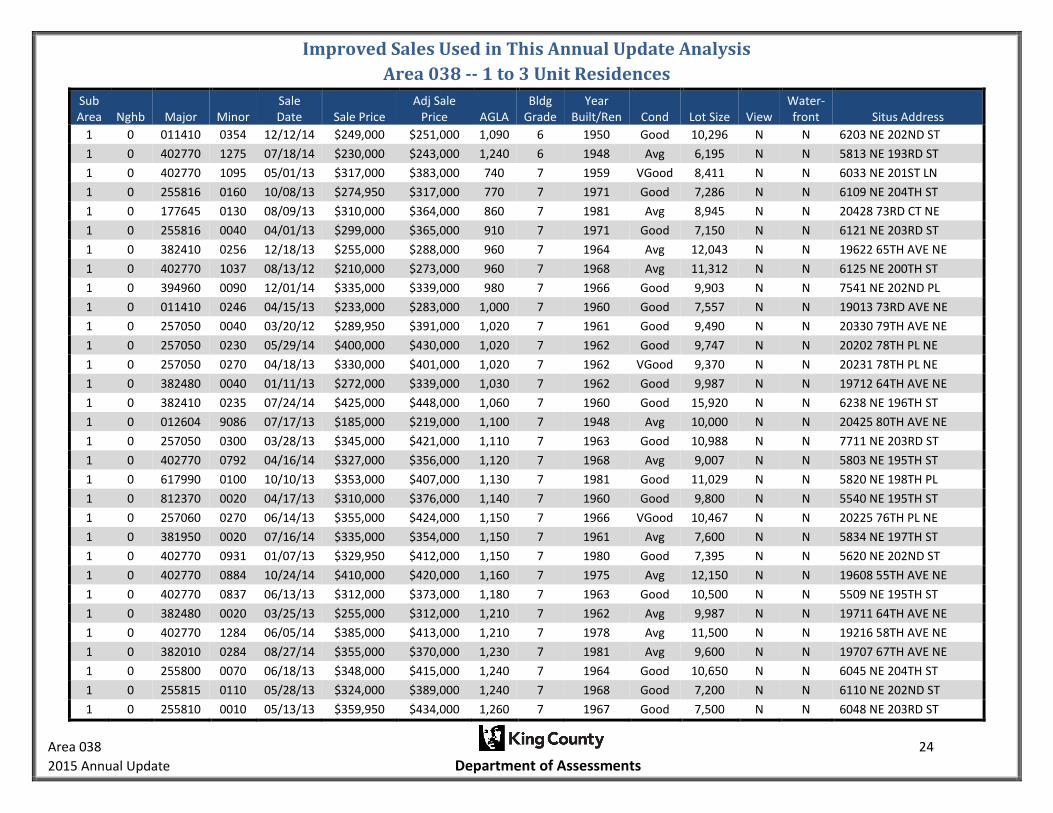
Improved Sales Used in This Annual Update Analysis
Area 038 -- 1 to 3 Unit Residences
Area 038 24
2015 Annual Update Department of Assessments
Sub Area Nghb Major Minor
Sale Date Sale Price
Adj Sale Price AGLA
Bldg Grade
Year Built/Ren Cond Lot Size View
Water- front Situs Address
1 0 011410 0354 12/12/14 $249,000 $251,000 1,090 6 1950 Good 10,296 N N 6203 NE 202ND ST
1 0 402770 1275 07/18/14 $230,000 $243,000 1,240 6 1948 Avg 6,195 N N 5813 NE 193RD ST
1 0 402770 1095 05/01/13 $317,000 $383,000 740 7 1959 VGood 8,411 N N 6033 NE 201ST LN
1 0 255816 0160 10/08/13 $274,950 $317,000 770 7 1971 Good 7,286 N N 6109 NE 204TH ST
1 0 177645 0130 08/09/13 $310,000 $364,000 860 7 1981 Avg 8,945 N N 20428 73RD CT NE
1 0 255816 0040 04/01/13 $299,000 $365,000 910 7 1971 Good 7,150 N N 6121 NE 203RD ST
1 0 382410 0256 12/18/13 $255,000 $288,000 960 7 1964 Avg 12,043 N N 19622 65TH AVE NE
1 0 402770 1037 08/13/12 $210,000 $273,000 960 7 1968 Avg 11,312 N N 6125 NE 200TH ST
1 0 394960 0090 12/01/14 $335,000 $339,000 980 7 1966 Good 9,903 N N 7541 NE 202ND PL
1 0 011410 0246 04/15/13 $233,000 $283,000 1,000 7 1960 Good 7,557 N N 19013 73RD AVE NE
1 0 257050 0040 03/20/12 $289,950 $391,000 1,020 7 1961 Good 9,490 N N 20330 79TH AVE NE
1 0 257050 0230 05/29/14 $400,000 $430,000 1,020 7 1962 Good 9,747 N N 20202 78TH PL NE
1 0 257050 0270 04/18/13 $330,000 $401,000 1,020 7 1962 VGood 9,370 N N 20231 78TH PL NE
1 0 382480 0040 01/11/13 $272,000 $339,000 1,030 7 1962 Good 9,987 N N 19712 64TH AVE NE
1 0 382410 0235 07/24/14 $425,000 $448,000 1,060 7 1960 Good 15,920 N N 6238 NE 196TH ST
1 0 012604 9086 07/17/13 $185,000 $219,000 1,100 7 1948 Avg 10,000 N N 20425 80TH AVE NE
1 0 257050 0300 03/28/13 $345,000 $421,000 1,110 7 1963 Good 10,988 N N 7711 NE 203RD ST
1 0 402770 0792 04/16/14 $327,000 $356,000 1,120 7 1968 Avg 9,007 N N 5803 NE 195TH ST
1 0 617990 0100 10/10/13 $353,000 $407,000 1,130 7 1981 Good 11,029 N N 5820 NE 198TH PL
1 0 812370 0020 04/17/13 $310,000 $376,000 1,140 7 1960 Good 9,800 N N 5540 NE 195TH ST
1 0 257060 0270 06/14/13 $355,000 $424,000 1,150 7 1966 VGood 10,467 N N 20225 76TH PL NE
1 0 381950 0020 07/16/14 $335,000 $354,000 1,150 7 1961 Avg 7,600 N N 5834 NE 197TH ST
1 0 402770 0931 01/07/13 $329,950 $412,000 1,150 7 1980 Good 7,395 N N 5620 NE 202ND ST
1 0 402770 0884 10/24/14 $410,000 $420,000 1,160 7 1975 Avg 12,150 N N 19608 55TH AVE NE
1 0 402770 0837 06/13/13 $312,000 $373,000 1,180 7 1963 Good 10,500 N N 5509 NE 195TH ST
1 0 382480 0020 03/25/13 $255,000 $312,000 1,210 7 1962 Avg 9,987 N N 19711 64TH AVE NE
1 0 402770 1284 06/05/14 $385,000 $413,000 1,210 7 1978 Avg 11,500 N N 19216 58TH AVE NE
1 0 382010 0284 08/27/14 $355,000 $370,000 1,230 7 1981 Avg 9,600 N N 19707 67TH AVE NE
1 0 255800 0070 06/18/13 $348,000 $415,000 1,240 7 1964 Good 10,650 N N 6045 NE 204TH ST
1 0 255815 0110 05/28/13 $324,000 $389,000 1,240 7 1968 Good 7,200 N N 6110 NE 202ND ST
1 0 255810 0010 05/13/13 $359,950 $434,000 1,260 7 1967 Good 7,500 N N 6048 NE 203RD ST

Improved Sales Used in This Annual Update Analysis
Area 038 -- 1 to 3 Unit Residences
Area 038 25
2015 Annual Update Department of Assessments
Sub Area Nghb Major Minor
Sale Date Sale Price
Adj Sale Price AGLA
Bldg Grade
Year Built/Ren Cond Lot Size View
Water- front Situs Address
1 0 255810 0120 05/31/12 $289,000 $383,000 1,260 7 1967 Avg 10,000 N N 20201 60TH PL NE
1 0 381950 0030 04/28/14 $406,500 $441,000 1,260 7 1976 Avg 7,600 N N 5818 NE 197TH ST
1 0 255816 0200 05/02/12 $279,950 $374,000 1,270 7 1973 Good 11,225 N N 6131 NE 204TH ST
1 0 511600 0250 07/07/14 $320,000 $340,000 1,270 7 1950 Avg 11,646 N N 5608 NE 204TH ST
1 0 382410 0015 07/02/12 $260,000 $342,000 1,280 7 1954 VGood 7,802 N N 6226 NE 198TH ST
1 0 382410 0124 03/30/12 $251,000 $338,000 1,300 7 1967 Good 10,850 N N 6237 NE 198TH ST
1 0 402770 0797 03/21/14 $341,000 $374,000 1,300 7 1984 Avg 7,200 N N 19521 61ST AVE NE
1 0 866310 0180 07/20/12 $327,500 $428,000 1,310 7 1991 Good 10,768 N N 6243 NE 204TH PL
1 0 255815 0120 06/26/13 $342,000 $407,000 1,320 7 1968 VGood 7,790 N N 6102 NE 202ND ST
1 0 012604 9194 03/12/12 $394,950 $534,000 1,330 7 1976 VGood 10,125 N N 18903 71ST AVE NE
1 0 255816 0220 12/10/14 $385,000 $388,000 1,330 7 1969 Avg 11,375 N N 6134 NE 204TH ST
1 0 382410 0135 02/05/13 $350,000 $434,000 1,340 7 1966 VGood 8,728 N N 19702 63RD LN NE
1 0 012604 9131 10/29/13 $390,000 $447,000 1,360 7 1960 Good 11,152 N N 7605 NE 205TH ST
1 0 382410 0310 01/18/12 $260,000 $356,000 1,360 7 1974 Avg 9,600 N N 6307 NE 196TH ST
1 0 866310 0050 05/19/14 $446,000 $481,000 1,370 7 1978 VGood 12,687 N N 20402 63RD AVE NE
1 0 012604 9191 09/16/13 $355,000 $413,000 1,380 7 1976 Good 9,991 N N 18919 71ST AVE NE
1 0 617990 0070 03/02/13 $336,000 $413,000 1,380 7 1981 Good 11,011 N N 5836 NE 198TH PL
1 0 382410 0140 03/27/13 $255,000 $311,000 1,420 7 1960 Avg 17,500 N N 6327 NE 198TH ST
1 0 012604 9217 06/04/14 $400,000 $429,000 1,530 7 1986 Avg 10,731 N N 7122 NE 188TH CT
1 0 382410 0291 09/16/14 $452,250 $469,000 1,560 7 1979 Good 10,000 N N 6218 NE 195TH ST
1 0 382410 0291 11/27/12 $369,500 $467,000 1,560 7 1979 Good 10,000 N N 6218 NE 195TH ST
1 0 402770 1297 11/18/14 $370,000 $376,000 1,570 7 1962 Good 18,590 N N 5619 NE 193RD ST
1 0 257060 0100 02/01/13 $340,000 $422,000 1,590 7 1964 VGood 10,326 N N 7649 NE 202ND PL
1 0 382410 0187 03/08/13 $307,000 $377,000 1,630 7 1973 Avg 9,950 N N 19621 65TH AVE NE
1 0 257050 0090 10/07/14 $385,000 $396,000 1,750 7 1961 Good 9,780 N N 20303 79TH AVE NE
1 0 029372 0080 08/01/13 $355,000 $418,000 1,750 7 2003 Avg 3,653 N N 7543 NE 204TH PL
1 0 402770 0838 02/13/14 $444,000 $493,000 1,800 7 1960 VGood 12,000 N N 5523 NE 195TH ST
1 0 402770 0711 11/01/13 $290,000 $332,000 1,810 7 1947 Fair 45,110 N N 20123 60TH AVE NE
1 0 382410 0211 06/26/14 $370,000 $394,000 1,850 7 1961 Good 14,500 N N 6336 NE 196TH ST
1 0 025360 0150 08/26/14 $380,000 $397,000 1,860 7 2000 Avg 3,504 N N 7556 NE 203RD ST
1 0 025360 0160 05/30/14 $384,950 $413,000 1,860 7 2000 Avg 3,690 N N 7552 NE 203RD ST

Improved Sales Used in This Annual Update Analysis
Area 038 -- 1 to 3 Unit Residences
Area 038 26
2015 Annual Update Department of Assessments
Sub Area Nghb Major Minor
Sale Date Sale Price
Adj Sale Price AGLA
Bldg Grade
Year Built/Ren Cond Lot Size View
Water- front Situs Address
1 0 382410 0091 06/04/12 $389,000 $515,000 1,970 7 1978 Good 9,800 N N 6516 NE 198TH ST
1 0 394960 0120 11/20/13 $300,000 $342,000 1,970 7 1966 Avg 10,875 N N 7515 NE 202ND PL
1 0 029372 0180 12/30/14 $415,000 $415,000 1,980 7 2003 Avg 4,274 N N 7538 NE 204TH PL
1 0 011410 0243 01/28/14 $355,000 $396,000 2,020 7 1965 Good 12,870 N N 19037 73RD AVE NE
1 0 255816 0060 04/18/13 $389,200 $472,000 2,080 7 1970 VGood 7,790 N N 6131 NE 203RD ST
1 0 382410 0134 08/17/12 $310,000 $402,000 2,080 7 1967 Good 8,820 N N 19710 63RD LN NE
1 0 029372 0090 07/09/13 $426,585 $506,000 2,170 7 2003 Good 3,653 N N 7547 NE 204TH PL
1 0 029372 0140 06/05/14 $449,950 $482,000 2,170 7 2003 Avg 4,912 N N 7554 NE 204TH PL
1 0 382410 0131 07/16/13 $338,950 $401,000 2,260 7 1966 Good 8,820 N N 6303 NE 198TH ST
1 0 255816 0180 04/07/14 $410,500 $448,000 2,270 7 1971 VGood 7,286 N N 6121 NE 204TH ST
1 0 382010 0215 11/20/13 $368,000 $419,000 1,200 8 1959 Good 10,000 N N 19531 67TH AVE NE
1 0 402770 1202 10/26/14 $399,950 $409,000 1,230 8 1978 Avg 13,860 N N 6156 NE 196TH ST
1 0 402770 1074 10/23/12 $355,000 $453,000 1,250 8 1977 Good 9,663 N N 6055 NE 200TH ST
1 0 511600 0170 12/10/13 $330,000 $374,000 1,300 8 1983 Avg 10,484 N N 5710 NE 204TH PL
1 0 381960 0050 03/29/12 $350,000 $471,000 1,310 8 1978 Good 8,150 N N 19605 61ST AVE NE
1 0 402770 1182 07/22/14 $339,950 $359,000 1,320 8 1959 Avg 11,457 N N 20012 61ST PL NE
1 0 011410 0155 06/27/14 $355,000 $378,000 1,330 8 1985 Avg 10,838 N N 19225 75TH AVE NE
1 0 402770 0812 05/29/14 $452,000 $486,000 1,340 8 1968 Good 10,002 N N 19308 58TH PL NE
1 0 011410 0086 10/22/12 $399,000 $509,000 1,430 8 1979 Good 18,000 N N 7326 NE 202ND PL
1 0 382410 0246 10/21/14 $460,000 $471,000 1,500 8 1979 Avg 9,676 N N 19615 62ND CT NE
1 0 012604 9050 12/30/13 $314,950 $355,000 1,510 8 1979 Avg 11,570 N N 6833 NE 191ST ST
1 0 402770 1326 07/09/14 $470,000 $498,000 1,530 8 1979 Avg 17,199 N N 5504 NE 190TH ST
1 0 382410 0166 11/22/14 $385,000 $390,000 1,540 8 1977 Avg 10,358 N N 19710 64TH PL NE
1 0 382410 0257 08/15/12 $405,000 $526,000 1,650 8 1964 Good 11,806 N N 19646 65TH AVE NE
1 0 011410 0012 03/21/14 $569,999 $626,000 1,670 8 2013 Avg 10,833 N N 7516 NE 203RD ST
1 0 382410 0290 09/03/13 $498,000 $581,000 1,700 8 2002 Good 13,458 N N 6219 NE 196TH ST
1 0 402770 1291 08/20/14 $550,000 $575,000 1,760 8 1974 Good 13,113 N N 19021 57TH PL NE
1 0 402770 1193 05/27/14 $436,000 $469,000 1,890 8 1960 Avg 11,000 N N 6130 NE 197TH ST
1 0 278070 0020 09/10/14 $375,000 $390,000 1,900 8 1978 Avg 9,428 N N 7204 NE 185TH ST
1 0 549810 0020 11/19/13 $418,500 $477,000 1,910 8 2010 Avg 4,463 N N 20326 62ND WAY NE
1 0 278070 0050 11/06/14 $432,000 $440,000 1,920 8 2000 Avg 9,812 N N 18527 73RD AVE NE

Improved Sales Used in This Annual Update Analysis
Area 038 -- 1 to 3 Unit Residences
Area 038 27
2015 Annual Update Department of Assessments
Sub Area Nghb Major Minor
Sale Date Sale Price
Adj Sale Price AGLA
Bldg Grade
Year Built/Ren Cond Lot Size View
Water- front Situs Address
1 0 402770 0846 07/22/14 $531,500 $561,000 1,940 8 2014 Avg 7,551 N N 5513 NE 194TH ST
1 0 012604 9231 05/16/14 $445,000 $480,000 1,970 8 2010 Avg 24,318 N N 18819 71ST AVE NE
1 0 402770 0785 02/11/13 $450,000 $556,000 1,970 8 2003 Avg 14,851 N N 19523 61ST AVE NE
1 0 402770 0844 09/16/14 $509,950 $529,000 1,970 8 2007 Avg 9,153 N N 5514 NE 194TH ST
1 0 402770 0844 04/19/13 $430,000 $522,000 1,970 8 2007 Avg 9,153 N N 5514 NE 194TH ST
1 0 549810 0130 06/20/13 $441,000 $526,000 2,020 8 2010 Avg 4,838 N N 20305 62ND WAY NE
1 0 402770 1185 04/26/13 $435,400 $527,000 2,100 8 2006 Avg 8,431 N N 19722 61ST PL NE
1 0 313730 0070 07/01/13 $449,000 $534,000 2,280 8 2003 Avg 5,196 N N 7546 NE 201ST PL
1 0 401950 0030 10/29/14 $450,000 $460,000 2,280 8 2010 Avg 4,557 N N 5922 NE 199TH ST
1 0 402770 0726 09/08/14 $470,101 $489,000 2,320 8 1986 Avg 7,800 N N 5937 NE 200TH CT
1 0 011410 0355 02/28/13 $465,000 $572,000 2,380 8 2001 Avg 21,722 N N 6231 NE 202ND ST
1 0 414010 0200 08/08/14 $499,000 $524,000 2,410 8 1978 Avg 9,600 N N 19032 61ST PL NE
1 0 382410 0301 01/25/12 $510,000 $698,000 2,410 8 2010 Avg 5,057 N N 6235 NE 196TH ST
1 0 338440 0120 11/27/13 $463,000 $527,000 2,430 8 2010 Avg 4,509 N N 5607 NE 198TH PL
1 0 011410 0165 03/20/13 $452,500 $554,000 2,630 8 1961 VGood 14,775 N N 6819 NE 204TH ST
1 0 011410 0242 03/21/13 $379,900 $465,000 2,760 8 1995 Avg 10,015 N N 19207 73RD AVE NE
1 0 011410 0304 06/14/12 $445,000 $587,000 2,800 8 2003 Avg 21,370 N N 7022 NE 204TH ST
1 0 011410 0304 12/03/14 $515,000 $520,000 2,800 8 2003 Avg 21,370 N N 7022 NE 204TH ST
1 0 382410 0352 05/07/12 $427,500 $570,000 2,870 8 2011 Avg 7,002 Y N 6439 NE 196TH ST
1 0 011410 0358 04/23/14 $535,000 $581,000 2,340 9 1999 Avg 13,470 N N 6209 NE 202ND ST
1 0 086920 0010 08/20/13 $475,000 $556,000 2,410 9 2006 Avg 5,832 N N 6735 NE 201ST PL
1 0 086920 0060 08/23/13 $585,000 $685,000 2,440 9 2007 Avg 5,331 N N 6730 NE 201ST PL
1 0 011410 0090 09/20/13 $500,000 $580,000 2,680 9 2007 Avg 7,727 N N 7431 NE 203RD LN
1 0 011410 0364 04/18/12 $575,000 $770,000 3,660 10 2007 Avg 8,759 N N 6530 NE 202ND ST
2 0 011410 0763 07/28/14 $230,000 $242,000 1,040 6 1941 Avg 15,000 N N 18705 80TH AVE NE
2 1 011410 1540 08/21/14 $415,000 $434,000 1,760 6 1949 Avg 19,210 N N 17516 83RD PL NE
2 1 012604 9208 12/13/13 $325,900 $369,000 1,000 7 2002 Avg 12,375 N N 18711 82ND AVE NE
2 1 096800 0020 08/22/14 $295,000 $308,000 1,060 7 1962 Avg 10,864 N N 8812 NE 203RD PL
2 1 809660 0100 12/15/14 $455,000 $458,000 1,060 7 1968 VGood 9,442 N N 19057 86TH AVE NE
2 1 809660 0100 03/15/14 $459,000 $505,000 1,060 7 1968 VGood 9,442 N N 19057 86TH AVE NE
2 0 381975 0150 12/21/12 $315,000 $395,000 1,090 7 1987 Avg 9,600 N N 19504 76TH AVE NE

Improved Sales Used in This Annual Update Analysis
Area 038 -- 1 to 3 Unit Residences
Area 038 28
2015 Annual Update Department of Assessments
Sub Area Nghb Major Minor
Sale Date Sale Price
Adj Sale Price AGLA
Bldg Grade
Year Built/Ren Cond Lot Size View
Water- front Situs Address
2 1 076500 0060 08/27/14 $342,000 $357,000 1,120 7 1959 Avg 11,200 N N 17823 93RD PL NE
2 1 011410 1426 06/17/14 $375,000 $400,000 1,160 7 1976 Good 22,470 N N 18110 83RD AVE NE
2 1 809650 0100 11/25/13 $280,000 $319,000 1,170 7 1967 Avg 9,719 N N 19072 85TH AVE NE
2 1 076500 0040 10/04/13 $271,313 $314,000 1,180 7 1959 Avg 14,500 N N 17833 93RD PL NE
2 1 011410 1161 08/29/14 $480,000 $501,000 1,220 7 1949 Good 67,269 N N 18015 83RD AVE NE
2 0 660140 0010 09/07/12 $262,800 $339,000 1,220 7 1968 Good 8,977 N N 7918 NE 183RD ST
2 1 011410 1440 12/03/12 $355,000 $448,000 1,230 7 1965 Good 11,499 N N 18012 83RD AVE NE
2 1 952260 0050 03/11/13 $415,000 $509,000 1,280 7 1973 VGood 8,500 N N 9340 NE 176TH ST
2 1 011410 1506 12/04/12 $265,000 $334,000 1,300 7 1997 Avg 5,088 N N 17718 83RD PL NE
2 1 607500 0050 07/16/14 $323,000 $342,000 1,310 7 1967 Good 9,690 N N 17640 86TH AVE NE
2 1 011410 1360 07/25/12 $325,000 $424,000 1,330 7 1978 Avg 73,180 N N 18402 80TH AVE NE
2 1 072605 9078 06/24/13 $337,000 $401,000 1,350 7 1975 Good 9,412 N N 9235 NE 175TH ST
2 0 660140 0030 02/12/13 $245,000 $303,000 1,420 7 1972 Avg 10,458 N N 7902 NE 183RD ST
2 1 011410 1516 05/28/14 $310,000 $333,000 1,430 7 1927 Good 19,901 N N 17616 83RD PL NE
2 0 381975 0020 02/25/14 $385,000 $426,000 1,440 7 1987 VGood 9,600 N N 7608 NE 197TH CT
2 1 098285 0020 09/03/14 $382,000 $398,000 1,450 7 2009 Avg 4,667 N N 8008 NE 183RD ST
2 1 098285 0060 06/03/14 $400,000 $429,000 1,450 7 2009 Avg 4,706 N N 8018 NE 183RD ST
2 1 096800 0120 11/12/14 $395,000 $402,000 1,470 7 1962 Good 10,125 N N 8835 NE 203RD PL
2 1 098285 0010 05/30/14 $365,250 $392,000 1,490 7 2009 Avg 4,522 N N 8006 NE 183RD ST
2 1 012604 9169 08/28/14 $450,000 $469,000 1,540 7 1967 Avg 61,419 N N 8400 NE 190TH ST
2 1 809660 0040 05/15/12 $229,900 $306,000 1,620 7 1968 Avg 9,600 N N 19032 86TH AVE NE
2 1 115690 0010 03/24/12 $300,000 $404,000 1,710 7 2009 Avg 4,553 N N 8140 NE 187TH PL
2 1 098285 0080 06/13/14 $415,500 $444,000 1,750 7 2009 Avg 4,779 N N 8019 NE 183RD ST
2 1 012604 9100 11/04/14 $398,000 $406,000 1,830 7 1954 Avg 27,468 N N 20318 80TH AVE NE
2 1 072605 9485 11/17/14 $496,000 $504,000 2,180 7 2010 Avg 4,533 N N 9440 NE 173RD PL
2 0 602050 0070 07/11/13 $410,500 $486,000 2,320 7 2000 Avg 4,365 N N 19419 77TH PL NE
2 1 926926 0160 02/13/12 $351,500 $479,000 2,460 7 2000 Avg 3,855 N N 9209 NE 173RD PL
2 1 926926 0250 07/11/12 $357,950 $469,000 2,460 7 2000 Avg 5,090 N N 9230 NE 173RD PL
2 1 926926 0300 07/05/13 $397,500 $472,000 2,460 7 2000 Avg 4,013 N N 9214 NE 173RD PL
2 1 926926 0340 01/21/14 $420,000 $470,000 2,460 7 2000 Avg 4,473 N N 17351 92ND PL NE
2 1 926926 0420 11/10/14 $436,000 $444,000 2,640 7 2000 Avg 3,899 N N 17366 92ND PL NE

Improved Sales Used in This Annual Update Analysis
Area 038 -- 1 to 3 Unit Residences
Area 038 29
2015 Annual Update Department of Assessments
Sub Area Nghb Major Minor
Sale Date Sale Price
Adj Sale Price AGLA
Bldg Grade
Year Built/Ren Cond Lot Size View
Water- front Situs Address
2 1 926926 0490 10/10/13 $418,000 $482,000 2,640 7 2001 Avg 3,939 N N 9244 NE 174TH PL
2 1 926926 0010 07/13/12 $400,000 $524,000 2,680 7 1999 Avg 5,425 N N 17427 92ND AVE NE
2 1 926926 0100 12/16/14 $475,000 $478,000 2,680 7 1999 Avg 4,673 N N 17361 92ND AVE NE
2 0 011410 0745 05/06/14 $475,000 $514,000 3,470 7 1924 Avg 117,612 N N 19015 80TH AVE NE
2 1 513000 0090 09/09/14 $374,950 $390,000 1,290 8 1964 Avg 11,562 Y N 18325 83RD PL NE
2 0 011410 0809 03/26/14 $425,000 $466,000 1,350 8 2005 Avg 17,833 N N 7916 NE 179TH LN
2 1 072605 9207 05/02/12 $399,000 $532,000 1,500 8 1962 Good 112,384 N N 17425 91ST AVE NE
2 1 809380 0200 11/18/14 $360,400 $366,000 1,630 8 1987 Avg 11,592 N N 8412 NE 178TH ST
2 0 957806 0820 02/15/12 $334,995 $456,000 1,670 8 2012 Avg 4,670 N N 7746 NE 201ST PL
2 1 809380 0080 02/06/13 $345,000 $427,000 1,690 8 1986 Avg 6,017 Y N 17838 85TH PL NE
2 0 011410 1055 12/23/14 $383,000 $384,000 1,720 8 1993 Avg 10,031 N N 19425 76TH CT NE
2 1 513000 0180 10/01/13 $351,500 $407,000 1,810 8 1964 Good 10,364 N N 8305 NE 183RD ST
2 0 957806 0770 08/29/12 $369,995 $479,000 1,850 8 2012 Avg 4,504 N N 7714 NE 201ST PL
2 0 957806 0790 08/06/12 $369,995 $482,000 1,850 8 2012 Avg 4,504 N N 7726 NE 201ST PL
2 1 370950 0060 06/20/14 $458,000 $489,000 1,870 8 2003 Avg 5,013 N N 8921 NE 176TH ST
2 1 370950 0180 05/27/14 $445,830 $479,000 1,870 8 2003 Avg 5,449 N N 9036 NE 176TH ST
2 1 072605 9061 12/27/13 $420,000 $473,000 1,890 8 1958 Avg 26,187 N N 17823 88TH AVE NE
2 0 011410 1058 01/30/13 $328,050 $407,000 1,910 8 1993 Avg 10,756 N N 19428 76TH CT NE
2 1 012604 9117 07/09/12 $470,000 $616,000 2,000 8 2011 Avg 31,500 N N 18522 82ND AVE NE
2 1 370950 0140 06/23/14 $459,950 $490,000 2,000 8 2003 Avg 6,107 N N 9014 NE 176TH ST
2 0 957806 0660 05/13/14 $502,000 $542,000 2,040 8 2012 Avg 5,616 N N 7613 NE 201ST PL
2 0 957806 0660 05/21/12 $395,470 $525,000 2,040 8 2012 Avg 5,616 N N 7613 NE 201ST PL
2 0 957806 0730 06/18/12 $389,995 $514,000 2,040 8 2012 Avg 4,503 N N 7624 NE 201ST PL
2 0 957806 0760 06/19/12 $393,995 $519,000 2,040 8 2012 Avg 4,504 N N 7708 NE 201ST PL
2 0 957806 0500 02/15/12 $382,000 $520,000 2,050 8 2011 Avg 4,723 N N 7728 NE 200TH ST
2 0 957801 0150 10/08/12 $392,967 $503,000 2,050 8 2012 Avg 4,557 N N 19718 77TH AVE NE
2 0 957801 0230 01/08/13 $424,033 $529,000 2,050 8 2012 Avg 4,625 N N 7617 NE 198TH PL
2 1 029373 0030 04/28/13 $466,750 $565,000 2,100 8 1998 Avg 10,078 N N 9423 NE 175TH ST
2 0 957806 0200 01/06/14 $460,000 $517,000 2,100 8 2009 Avg 4,588 N N 7806 NE 199TH ST
2 1 072605 9288 11/01/12 $361,000 $459,000 2,120 8 1956 Good 20,499 N N 8639 NE 180TH ST
2 1 942790 0110 08/17/12 $380,100 $493,000 2,130 8 2003 Avg 5,911 N N 18020 81ST AVE NE

Improved Sales Used in This Annual Update Analysis
Area 038 -- 1 to 3 Unit Residences
Area 038 30
2015 Annual Update Department of Assessments
Sub Area Nghb Major Minor
Sale Date Sale Price
Adj Sale Price AGLA
Bldg Grade
Year Built/Ren Cond Lot Size View
Water- front Situs Address
2 0 926588 0100 11/20/13 $479,950 $547,000 2,130 8 2013 Avg 5,150 N N 7621 NE 193RD PL
2 1 012604 9051 10/21/13 $440,000 $506,000 2,140 8 2004 Avg 5,741 Y N 18904 82ND AVE NE
2 1 072605 9363 10/04/13 $379,000 $438,000 2,180 8 1964 Avg 17,200 N N 17516 92ND AVE NE
2 1 856495 0300 09/19/14 $450,000 $466,000 2,180 8 2004 Avg 4,226 N N 8505 NE 201ST ST
2 1 856495 0550 12/06/13 $435,000 $493,000 2,180 8 2004 Avg 4,045 N N 8500 NE 202ND WAY
2 1 108865 0060 04/21/14 $478,000 $520,000 2,180 8 2006 Avg 4,507 N N 19825 82ND PL NE
2 1 108865 0170 10/23/14 $469,000 $480,000 2,180 8 2006 Avg 5,880 N N 19916 83RD PL NE
2 1 108865 0220 08/15/13 $440,000 $516,000 2,180 8 2006 Avg 4,497 N N 19834 83RD PL NE
2 0 957806 0090 03/01/13 $418,550 $515,000 2,220 8 2012 Avg 4,562 N N 7725 NE 200TH ST
2 0 957801 0250 03/04/13 $411,718 $506,000 2,220 8 2013 Avg 5,256 N N 7611 NE 198TH PL
2 0 957801 0280 05/11/13 $433,354 $523,000 2,220 8 2013 Avg 4,584 N N 7636 NE 195TH ST
2 0 957801 0330 06/20/13 $516,390 $616,000 2,220 8 2013 Avg 4,613 N N 7639 NE 196TH ST
2 0 957801 0360 02/11/13 $494,080 $611,000 2,220 8 2013 Avg 4,553 N N 7636 NE 196TH ST
2 0 957801 0400 05/14/13 $418,272 $504,000 2,220 8 2013 Avg 4,593 N N 7708 NE 195TH ST
2 0 926588 0180 08/27/13 $434,950 $508,000 2,220 8 2012 Avg 4,566 N N 7732 NE 193RD PL
2 1 952260 0120 10/22/14 $449,000 $460,000 2,230 8 1968 Good 8,440 N N 17523 93RD AVE NE
2 0 957801 0240 12/24/12 $418,661 $525,000 2,250 8 2012 Avg 5,159 N N 7613 NE 198TH PL
2 0 957801 0180 12/24/12 $424,185 $532,000 2,260 8 2012 Avg 5,141 N N 7702 NE 198TH PL
2 0 957801 0260 03/04/13 $438,021 $538,000 2,260 8 2013 Avg 4,863 N N 7609 NE 198TH PL
2 0 957806 0320 08/16/12 $410,285 $533,000 2,270 8 2012 Avg 4,515 N N 7717 NE 199TH ST
2 0 957806 0350 07/18/12 $408,080 $534,000 2,270 8 2012 Avg 6,110 N N 19823 77TH AVE NE
2 0 957806 0380 04/20/12 $414,172 $554,000 2,270 8 2012 Avg 4,545 N N 19907 77TH AVE NE
2 0 957806 0710 04/18/12 $399,995 $536,000 2,270 8 2012 Avg 4,674 N N 7616 NE 201ST PL
2 0 957806 0740 05/12/12 $399,995 $532,000 2,270 8 2012 Avg 4,503 N N 7628 NE 201ST PL
2 0 957806 0800 02/02/12 $399,995 $546,000 2,270 8 2012 Avg 4,504 N N 7732 NE 201ST PL
2 0 957806 0300 08/01/12 $405,062 $528,000 2,275 8 2012 Avg 4,534 N N 7729 NE 199TH ST
2 1 856495 0370 07/29/13 $470,000 $554,000 2,280 8 2004 Avg 7,516 N N 8603 NE 201ST PL
2 0 957806 0370 08/01/12 $410,569 $535,000 2,290 8 2012 Avg 5,105 N N 19901 77TH AVE NE
2 0 957806 0720 05/01/12 $404,995 $541,000 2,290 8 2012 Avg 4,503 N N 7620 NE 201ST PL
2 0 957806 0750 08/03/12 $407,995 $531,000 2,290 8 2012 Avg 4,504 N N 7702 NE 201ST PL
2 0 957806 0780 08/06/12 $404,995 $527,000 2,290 8 2012 Avg 4,504 N N 7720 NE 201ST PL

Improved Sales Used in This Annual Update Analysis
Area 038 -- 1 to 3 Unit Residences
Area 038 31
2015 Annual Update Department of Assessments
Sub Area Nghb Major Minor
Sale Date Sale Price
Adj Sale Price AGLA
Bldg Grade
Year Built/Ren Cond Lot Size View
Water- front Situs Address
2 0 957806 0810 02/16/12 $404,995 $551,000 2,290 8 2012 Avg 4,504 N N 7738 NE 201ST PL
2 0 957801 0050 08/29/12 $426,955 $552,000 2,290 8 2012 Avg 5,225 N N 19818 77TH AVE NE
2 1 029373 0060 11/05/13 $513,000 $587,000 2,300 8 1998 Avg 9,950 N N 9412 NE 174TH PL
2 1 856495 0360 08/01/13 $498,500 $587,000 2,300 8 2004 Avg 4,945 N N 8541 NE 201ST PL
2 0 957801 0310 06/20/13 $510,015 $608,000 2,300 8 2013 Avg 5,813 N N 7649 NE 196TH ST
2 0 957801 0340 07/11/13 $536,455 $636,000 2,300 8 2013 Avg 5,571 N N 7633 NE 196TH ST
2 0 957806 0470 05/08/14 $494,000 $534,000 2,310 8 2011 Avg 4,729 N N 7710 NE 200TH ST
2 0 957801 0350 02/11/13 $494,995 $612,000 2,330 8 2013 Avg 5,792 N N 7634 NE 196TH ST
2 0 957801 0030 10/02/12 $439,598 $564,000 2,340 8 2012 Avg 5,150 N N 19813 77TH AVE NE
2 0 957801 0080 09/07/12 $424,995 $548,000 2,340 8 2012 Avg 5,106 N N 19802 77TH AVE NE
2 0 957801 0110 10/30/12 $436,485 $555,000 2,340 8 2012 Avg 5,675 N N 19810 77TH PL NE
2 0 957801 0170 10/11/12 $426,970 $546,000 2,340 8 2012 Avg 5,704 N N 19706 77TH PL NE
2 0 957801 0200 09/10/12 $431,805 $557,000 2,340 8 2012 Avg 4,554 N N 7633 NE 198TH PL
2 0 957801 0220 12/03/12 $416,995 $526,000 2,340 8 2012 Avg 4,527 N N 7625 NE 198TH PL
2 0 957801 0300 04/02/13 $439,724 $536,000 2,340 8 2013 Avg 4,678 N N 7648 NE 195TH ST
2 0 957801 0390 03/01/13 $431,931 $531,000 2,340 8 2013 Avg 4,522 N N 7709 NE 196TH ST
2 0 957806 0080 02/01/13 $447,995 $556,000 2,360 8 2010 Avg 4,562 N N 7731 NE 200TH ST
2 0 957806 0540 06/14/14 $525,000 $561,000 2,360 8 2008 Avg 4,924 N N 7745 NE 201ST PL
2 1 393850 0020 06/27/13 $415,000 $494,000 2,380 8 1999 Avg 5,060 N N 18925 81ST AVE NE
2 0 957806 0140 06/07/12 $431,586 $571,000 2,380 8 2012 Avg 4,588 N N 7712 NE 199TH ST
2 0 957806 0280 05/09/12 $409,995 $546,000 2,380 8 2012 Avg 4,701 N N 7741 NE 199TH ST
2 0 957806 0310 07/12/12 $414,995 $544,000 2,380 8 2012 Avg 4,534 N N 7723 NE 199TH ST
2 0 957806 0340 07/16/12 $420,650 $550,000 2,380 8 2012 Avg 4,573 N N 7705 NE 199TH ST
2 0 957806 0700 01/07/14 $475,000 $534,000 2,380 8 2012 Avg 4,593 N N 7612 NE 201ST PL
2 0 957806 0700 04/26/12 $409,995 $548,000 2,380 8 2012 Avg 4,593 N N 7612 NE 201ST PL
2 1 108865 0030 05/22/13 $465,000 $559,000 2,420 8 2006 Avg 4,507 N N 19813 82ND PL NE
2 1 108865 0390 11/14/12 $378,000 $479,000 2,420 8 2004 Avg 5,509 N N 19726 82ND PL NE
2 0 957801 0270 05/17/13 $439,713 $529,000 2,430 8 2013 Avg 4,558 N N 7632 NE 195TH ST
2 1 856495 0210 10/14/13 $500,000 $576,000 2,450 8 2003 Avg 4,774 N N 8524 NE 201ST PL
2 1 856495 0390 09/19/14 $525,000 $544,000 2,450 8 2003 Avg 5,280 N N 8615 NE 201ST PL
2 0 381840 0050 05/29/12 $358,100 $475,000 2,450 8 2004 Avg 4,668 N N 7805 NE 198TH ST

Improved Sales Used in This Annual Update Analysis
Area 038 -- 1 to 3 Unit Residences
Area 038 32
2015 Annual Update Department of Assessments
Sub Area Nghb Major Minor
Sale Date Sale Price
Adj Sale Price AGLA
Bldg Grade
Year Built/Ren Cond Lot Size View
Water- front Situs Address
2 1 108865 0350 04/10/14 $502,500 $548,000 2,450 8 2005 Avg 5,829 N N 19721 82ND LN NE
2 0 381840 0060 10/31/14 $495,000 $506,000 2,460 8 2004 Avg 4,862 N N 19736 78TH AVE NE
2 0 381840 0120 08/28/13 $450,000 $526,000 2,460 8 2004 Avg 4,950 N N 19733 78TH AVE NE
2 0 957806 0290 05/14/12 $427,495 $569,000 2,480 8 2012 Avg 4,534 N N 7735 NE 199TH ST
2 0 957806 0330 08/08/12 $441,182 $574,000 2,480 8 2012 Avg 4,529 N N 7711 NE 199TH ST
2 0 957806 0570 06/15/12 $439,995 $580,000 2,480 8 2012 Avg 4,535 N N 7727 NE 201ST PL
2 0 957806 0690 03/02/12 $419,950 $569,000 2,480 8 2011 Avg 4,792 N N 7608 NE 201ST PL
2 0 957801 0020 10/02/12 $430,580 $552,000 2,480 8 2012 Avg 4,634 N N 19807 77TH AVE NE
2 1 012604 9240 12/31/12 $409,000 $512,000 2,550 8 2011 Avg 4,506 N N 20224 81ST PL NE
2 0 957801 0120 10/08/12 $479,906 $614,000 2,590 8 2012 Avg 5,672 N N 19804 77TH AVE NE
2 0 957801 0380 04/20/13 $467,809 $568,000 2,590 8 2013 Avg 4,504 N N 7711 NE 196TH ST
2 0 957806 0230 06/18/14 $535,000 $571,000 2,610 8 2008 Avg 4,595 N N 7818 NE 199TH ST
2 0 957806 0360 06/08/12 $451,283 $596,000 2,650 8 2012 Avg 5,220 N N 19827 77TH AVE NE
2 0 957806 0390 03/11/12 $474,167 $641,000 2,650 8 2012 Avg 4,585 N N 19911 77TH AVE NE
2 0 957806 0440 04/04/14 $540,000 $590,000 2,650 8 2011 Avg 4,735 N N 7626 NE 200TH ST
2 0 957801 0040 09/12/12 $465,179 $600,000 2,650 8 2012 Avg 5,151 N N 19819 77TH AVE NE
2 0 957801 0060 09/10/12 $460,688 $594,000 2,650 8 2012 Avg 5,225 N N 19814 77TH AVE NE
2 0 957801 0320 06/22/13 $538,401 $642,000 2,650 8 2013 Avg 5,982 N N 7641 NE 196TH ST
2 0 957801 0010 03/09/13 $489,995 $602,000 2,660 8 2012 Avg 5,115 N N 19803 77TH AVE NE
2 0 957801 0070 10/08/12 $470,315 $602,000 2,660 8 2012 Avg 4,703 N N 19808 77TH AVE NE
2 0 957801 0210 04/17/13 $475,421 $577,000 2,660 8 2013 Avg 4,561 N N 7629 NE 198TH PL
2 0 957801 0290 03/11/13 $495,758 $608,000 2,660 8 2013 Avg 4,582 N N 7640 NE 195TH ST
2 1 955890 0010 10/06/14 $549,950 $566,000 2,680 8 2001 Avg 5,860 N N 8800 NE 176TH ST
2 1 108865 0270 02/21/13 $455,000 $561,000 2,710 8 2005 Avg 5,596 N N 19726 83RD PL NE
2 1 370950 0110 06/26/12 $435,000 $572,000 2,770 8 1995 Avg 9,913 N N 8920 NE 176TH ST
2 1 856495 0040 04/29/13 $436,500 $528,000 2,810 8 2003 Avg 4,101 N N 20129 84TH PL NE
2 1 856495 0280 10/09/14 $533,000 $548,000 2,810 8 2004 Avg 4,607 N N 20113 85TH AVE NE
2 1 856495 0540 03/27/13 $450,000 $550,000 2,810 8 2004 Avg 4,800 N N 8506 NE 202ND WAY
2 1 856495 0330 02/12/13 $449,000 $555,000 2,830 8 2004 Avg 4,800 N N 8523 NE 201ST ST
2 1 108865 0490 07/02/12 $452,000 $594,000 2,844 8 2005 Avg 5,039 N N 8238 NE 198TH ST
2 0 926588 0010 01/27/14 $567,500 $634,000 2,870 8 2013 Avg 8,847 N N 7921 NE 193RD PL

Improved Sales Used in This Annual Update Analysis
Area 038 -- 1 to 3 Unit Residences
Area 038 33
2015 Annual Update Department of Assessments
Sub Area Nghb Major Minor
Sale Date Sale Price
Adj Sale Price AGLA
Bldg Grade
Year Built/Ren Cond Lot Size View
Water- front Situs Address
2 0 381840 0110 08/26/14 $520,000 $543,000 2,900 8 2004 Avg 4,950 N N 19725 78TH AVE NE
2 0 381840 0080 04/29/13 $405,000 $490,000 2,970 8 2004 Avg 4,895 N N 19724 78TH AVE NE
2 0 381840 0090 01/17/13 $395,000 $492,000 2,970 8 2004 Avg 4,895 N N 19720 78TH AVE NE
2 1 926927 0130 11/25/13 $590,000 $671,000 3,350 8 1994 VGood 9,999 N N 8539 NE 176TH ST
2 0 419180 0080 05/03/13 $465,000 $562,000 2,460 9 2005 Avg 4,778 N N 7924 NE 184TH ST
2 1 770201 0080 10/21/13 $481,000 $553,000 2,500 9 2001 Avg 4,874 N N 7923 NE 182ND PL
2 0 326125 0080 09/25/12 $438,000 $563,000 2,500 9 2006 Avg 4,669 N N 7816 NE 197TH PL
2 0 419180 0050 12/18/13 $500,000 $565,000 2,580 9 2005 Avg 4,960 N N 7909 NE 184TH ST
2 0 770208 0110 02/16/12 $435,500 $593,000 2,620 9 2007 Avg 6,389 N N 7717 NE 196TH ST
2 0 770208 0110 10/16/14 $535,000 $549,000 2,620 9 2007 Avg 6,389 N N 7717 NE 196TH ST
2 1 920255 0140 03/10/14 $555,000 $612,000 2,650 9 2000 Avg 8,125 N N 20313 86TH PL NE
2 1 418830 0160 12/07/12 $550,000 $693,000 2,710 9 2012 Avg 7,415 N N 20230 86TH PL NE
2 1 929550 0110 02/17/14 $590,000 $654,000 2,720 9 1999 Avg 10,470 N N 19213 85TH AVE NE
2 1 012604 9249 08/16/13 $475,000 $557,000 2,730 9 2006 Avg 5,883 N N 19020 81ST AVE NE
2 0 419180 0060 11/26/13 $490,000 $557,000 2,760 9 2005 Avg 4,827 N N 7912 NE 184TH ST
2 1 929550 0120 09/26/13 $555,000 $643,000 2,790 9 2000 Avg 7,200 N N 19209 85TH AVE NE
2 1 418830 0090 06/20/12 $565,000 $744,000 2,810 9 2012 Avg 4,674 N N 20229 86TH PL NE
2 1 418830 0090 08/20/13 $604,000 $707,000 2,810 9 2012 Avg 4,674 N N 20229 86TH PL NE
2 1 062605 9127 11/17/14 $614,000 $623,000 2,830 9 2010 Avg 5,831 N N 20200 86TH PL NE
2 1 062605 9127 04/06/12 $549,000 $738,000 2,830 9 2010 Avg 5,831 N N 20200 86TH PL NE
2 1 770201 0030 05/20/14 $551,000 $594,000 2,830 9 2001 Avg 5,802 N N 7928 NE 182ND PL
2 1 062605 9367 01/03/12 $539,000 $741,000 2,840 9 2010 Avg 5,228 N N 20206 86TH PL NE
2 1 418830 0190 12/10/12 $569,000 $716,000 2,850 9 2012 Avg 6,957 N N 20278 86TH PL NE
2 1 418830 0180 01/25/12 $579,000 $792,000 2,870 9 2012 Avg 7,288 N N 20244 86TH PL NE
2 1 418830 0180 11/12/14 $650,000 $661,000 2,870 9 2012 Avg 7,288 N N 20244 86TH PL NE
2 1 868210 0050 06/19/13 $555,000 $662,000 2,880 9 2012 Avg 5,228 N N 8646 NE 177TH PL
2 1 418830 0100 10/02/12 $565,000 $724,000 2,890 9 2012 Avg 4,556 N N 20223 86TH PL NE
2 1 868210 0040 07/02/13 $574,926 $683,000 2,940 9 2012 Avg 4,289 N N 8638 NE 177TH PL
2 1 868210 0060 05/28/13 $572,022 $687,000 2,940 9 2012 Avg 4,946 N N 8654 NE 177TH PL
2 1 868210 0010 05/10/13 $550,000 $663,000 2,970 9 2012 Avg 5,140 N N 17718 86TH AVE NE
2 0 770208 0150 12/01/14 $515,000 $520,000 2,980 9 2007 Avg 4,502 N N 7904 N 195TH ST

Improved Sales Used in This Annual Update Analysis
Area 038 -- 1 to 3 Unit Residences
Area 038 34
2015 Annual Update Department of Assessments
Sub Area Nghb Major Minor
Sale Date Sale Price
Adj Sale Price AGLA
Bldg Grade
Year Built/Ren Cond Lot Size View
Water- front Situs Address
2 1 062605 9366 03/02/12 $559,000 $758,000 3,000 9 2010 Avg 7,375 N N 20212 86TH PL NE
2 1 868210 0020 07/02/13 $562,656 $669,000 3,010 9 2013 Avg 5,320 N N 17726 86TH AVE NE
2 0 770208 0160 02/16/12 $420,000 $571,000 3,040 9 2007 Avg 4,518 N N 7906 NE 195TH ST
2 1 418830 0130 10/26/12 $562,000 $716,000 3,120 9 2012 Avg 5,694 N N 20205 86TH PL NE
2 1 920255 0080 06/24/13 $453,000 $539,000 3,170 9 2001 Avg 9,561 N N 20347 86TH PL NE
2 1 012604 9238 09/18/13 $531,000 $617,000 3,330 9 2008 Avg 4,524 N N 20219 81ST PL NE
2 1 418830 0150 08/14/12 $609,000 $791,000 3,340 9 2012 Avg 6,064 N N 20224 86TH PL NE
2 1 868210 0080 05/14/13 $629,000 $758,000 2,330 10 2012 Avg 5,133 N N 8622 NE 177TH PL
2 1 501200 0080 11/26/12 $600,000 $758,000 2,960 10 2012 Avg 7,680 Y N 18931 84TH PL NE
2 1 501200 0100 06/17/13 $699,950 $835,000 2,990 10 2012 Avg 6,682 Y N 18919 84TH PL NE
2 1 501200 0150 10/26/12 $675,950 $861,000 3,040 10 2012 Avg 9,959 N N 18942 84TH PL NE
2 1 072605 9481 02/13/13 $696,450 $861,000 3,070 10 2007 Avg 12,379 N N 17518 86TH AVE NE
2 1 501200 0060 04/22/13 $842,622 $1,022,000 3,210 10 2012 Avg 6,827 Y N 18943 84TH PL NE
2 1 929510 0010 07/16/12 $612,000 $801,000 3,260 10 2004 Avg 14,706 Y N 8219 NE 187TH ST
2 1 501200 0170 02/28/12 $675,000 $916,000 3,430 10 2009 Avg 9,147 N N 18954 84TH PL NE
2 1 501200 0110 02/12/13 $734,976 $909,000 3,560 10 2012 Avg 9,416 N N 18918 84TH PL NE
2 1 929510 0100 04/23/14 $640,000 $696,000 3,700 10 2003 Avg 6,360 Y N 8329 NE 187TH WAY
2 1 929510 0180 05/03/13 $662,500 $801,000 3,740 10 2004 Avg 5,582 Y N 8320 NE 187TH ST
2 1 501200 0140 01/07/13 $795,000 $993,000 3,870 10 2012 Avg 9,971 N N 18936 84TH PL NE
2 1 929510 0140 10/29/12 $720,000 $916,000 4,090 10 2004 Avg 6,982 Y N 8332 NE 187TH ST
3 2 563150 0875 12/27/13 $306,000 $345,000 1,020 7 1959 Good 13,318 N N 16416 SIMONDS RD NE
3 2 357860 0046 04/25/14 $320,000 $348,000 1,060 7 1955 Good 25,080 N N 15910 SIMONDS RD NE
3 2 357870 0073 11/10/14 $362,000 $368,000 1,120 7 1989 Avg 9,730 N N 9010 NE 151ST ST
3 3 620420 0590 10/29/14 $410,000 $419,000 1,180 7 1985 VGood 5,763 N N 14521 104TH AVE NE
3 3 620420 0050 07/18/13 $424,000 $501,000 1,240 7 1985 VGood 8,237 N N 14522 104TH AVE NE
3 3 620420 0570 05/13/13 $395,000 $476,000 1,260 7 1988 Good 6,565 N N 14603 104TH AVE NE
3 2 188700 0090 10/21/13 $387,000 $445,000 1,290 7 1969 Good 14,100 N N 8817 NE 161ST PL
3 0 096110 0077 01/15/14 $312,700 $350,000 1,300 7 1987 Avg 9,721 N N 17315 108TH AVE NE
3 2 357860 0178 03/13/13 $439,500 $539,000 1,310 7 2013 Avg 10,800 N N 8629 NE 157TH ST
3 3 620420 0550 06/17/13 $429,950 $513,000 1,340 7 1986 VGood 10,570 N N 14617 104TH AVE NE
3 0 096110 0087 03/20/14 $392,000 $431,000 1,380 7 1986 Good 11,251 N N 10615 NE 175TH ST

Improved Sales Used in This Annual Update Analysis
Area 038 -- 1 to 3 Unit Residences
Area 038 35
2015 Annual Update Department of Assessments
Sub Area Nghb Major Minor
Sale Date Sale Price
Adj Sale Price AGLA
Bldg Grade
Year Built/Ren Cond Lot Size View
Water- front Situs Address
3 2 188700 0100 08/14/14 $485,000 $508,000 1,380 7 1972 Avg 14,100 N N 8807 NE 161ST PL
3 3 620420 0540 06/19/13 $369,500 $441,000 1,440 7 1987 Good 6,282 N N 14623 104TH AVE NE
3 3 620420 0010 12/11/12 $355,000 $447,000 1,460 7 1986 Good 7,518 N N 14502 104TH AVE NE
3 3 620420 0560 07/23/14 $425,000 $449,000 1,540 7 1988 Avg 8,011 N N 14611 104TH AVE NE
3 0 096110 0052 11/19/13 $480,000 $547,000 1,570 7 1957 Good 19,873 Y Y 11128 E RIVERSIDE DR
3 0 082605 9152 11/17/14 $435,000 $442,000 1,670 7 1930 Good 65,340 N N 17509 102ND AVE NE
3 3 620420 0450 07/25/12 $386,500 $505,000 1,760 7 1988 Good 8,456 N N 14815 104TH AVE NE
3 3 620420 0320 09/25/12 $370,000 $475,000 1,890 7 1984 Good 14,442 N N 15015 104TH AVE NE
3 3 620420 0180 06/12/12 $372,777 $492,000 1,920 7 1989 Good 8,223 N N 14808 104TH AVE NE
3 3 620420 0180 07/09/14 $443,000 $470,000 1,920 7 1989 Good 8,223 N N 14808 104TH AVE NE
3 3 620420 0190 03/29/12 $355,000 $478,000 1,970 7 1992 Avg 6,195 N N 14816 104TH AVE NE
3 0 082605 9342 03/11/14 $450,000 $496,000 2,070 7 1992 Avg 6,617 N N 10624 NE 175TH ST
3 3 620420 0140 05/22/12 $393,000 $522,000 2,110 7 1988 VGood 6,364 N N 14710 104TH AVE NE
3 3 620420 0430 12/10/14 $507,500 $511,000 1,380 8 1986 Avg 7,439 Y N 14901 104TH AVE NE
3 3 620400 0040 06/10/14 $608,000 $651,000 1,400 8 1983 Good 9,714 N N 16805 105TH AVE NE
3 0 885400 0360 10/24/12 $382,000 $487,000 1,540 8 1978 Avg 10,151 Y N 16211 VALHALLA DR
3 3 620420 0170 07/09/14 $525,000 $557,000 1,640 8 1985 Avg 6,308 N N 14812 104TH AVE NE
3 0 569050 0050 08/12/14 $535,000 $561,000 1,670 8 1987 Good 45,340 N N 16232 107TH AVE NE
3 3 620420 0340 11/10/14 $521,000 $530,000 1,730 8 1988 Avg 18,250 N N 15003 104TH AVE NE
3 0 885400 0370 06/20/14 $436,500 $466,000 1,790 8 1977 Avg 12,429 N N 16314 VALHALLA DR
3 0 569050 0035 03/20/13 $515,000 $630,000 1,810 8 1987 Good 49,222 N N 16202 107TH AVE NE
3 2 176280 0020 06/25/13 $446,000 $531,000 1,810 8 2004 Good 2,470 Y N 8321 NE 163RD PL
3 0 885410 0250 10/19/12 $385,000 $491,000 1,820 8 1984 Good 11,848 N N 16121 VALHALLA DR
3 0 885410 0290 07/12/12 $352,000 $461,000 1,860 8 1985 Good 12,292 N N 9419 ODIN WAY
3 0 103610 0100 07/02/14 $435,000 $462,000 1,900 8 1993 Avg 7,984 N N 15772 111TH AVE NE
3 2 176280 0070 06/12/12 $320,000 $423,000 1,910 8 2002 Avg 3,047 N N 8233 NE 163RD PL
3 0 103610 0030 05/23/12 $389,800 $517,000 1,940 8 1993 Good 8,475 N N 11106 NE 157TH PL
3 0 182605 9042 09/23/14 $402,000 $416,000 1,970 8 1990 Good 12,205 N N 15415 100TH AVE NE
3 0 103610 0130 08/08/14 $442,000 $464,000 1,980 8 1994 Avg 39,932 N N 15930 111TH AVE NE
3 0 885400 0300 12/16/13 $454,000 $513,000 1,990 8 1966 Good 12,000 N N 9433 VALHALLA WAY
3 2 664102 0160 05/06/14 $513,000 $555,000 2,000 8 1996 Avg 5,684 N N 9035 NE 160TH PL

Improved Sales Used in This Annual Update Analysis
Area 038 -- 1 to 3 Unit Residences
Area 038 36
2015 Annual Update Department of Assessments
Sub Area Nghb Major Minor
Sale Date Sale Price
Adj Sale Price AGLA
Bldg Grade
Year Built/Ren Cond Lot Size View
Water- front Situs Address
3 2 664102 0100 11/06/12 $419,000 $532,000 2,020 8 1996 Good 7,066 N N 9010 NE 160TH PL
3 0 620405 0040 07/11/14 $489,900 $519,000 2,090 8 2006 Avg 4,196 N N 11172 NE 162ND ST
3 0 620405 0160 06/08/14 $540,000 $578,000 2,090 8 2007 Avg 4,369 N N 11171 NE 162ND ST
3 0 885410 0220 12/05/14 $585,000 $590,000 2,240 8 1990 Avg 12,700 N N 16130 VALHALLA DR
3 2 664102 0130 02/07/12 $385,000 $525,000 2,240 8 1996 Good 8,120 N N 9030 NE 160TH PL
3 2 357860 0045 12/16/14 $490,000 $493,000 2,242 8 1995 Avg 37,451 N N 16020 SIMONDS RD NE
3 0 417860 0010 06/01/12 $460,000 $609,000 2,250 8 1994 Good 19,163 N N 11156 NE 160TH PL
3 3 082605 9264 03/27/12 $650,000 $875,000 2,280 8 1994 Good 83,185 N N 16611 107TH PL NE
3 2 020050 0110 05/26/12 $450,000 $597,000 2,350 8 1988 Good 8,832 N N 15002 91ST PL NE
3 0 885400 0070 11/29/12 $494,000 $623,000 2,400 8 1969 Good 11,557 Y N 9406 VALHALLA WAY
3 2 664102 0200 07/30/13 $525,000 $619,000 2,420 8 1996 Good 6,168 N N 9009 NE 160TH PL
3 2 357860 0195 07/18/12 $586,500 $767,000 2,580 8 1993 Good 24,394 N N 15917 88TH AVE NE
3 4 108881 0190 04/10/13 $508,800 $619,000 2,620 8 1996 Good 11,524 N N 9802 NE 155TH ST
3 0 620410 0060 01/03/13 $388,500 $486,000 2,620 8 1987 Avg 8,653 N N 15612 111TH AVE NE
3 3 172605 9023 08/29/13 $805,000 $940,000 2,640 8 1996 Good 179,680 N N 15912 104TH AVE NE
3 0 620405 0140 07/20/12 $413,500 $541,000 2,640 8 2006 Avg 6,557 N N 11163 NE 162ND ST
3 0 620405 0080 05/28/14 $555,000 $597,000 2,650 8 2006 Avg 4,270 N N 11131 NE 162ND ST
3 2 357860 0197 08/05/14 $650,000 $683,000 2,680 8 2014 Avg 4,955 N N 16013 88TH AVE NE
3 0 734050 0140 10/10/13 $427,928 $494,000 2,760 8 2000 Avg 6,534 N N 10603 NE 173RD PL
3 2 664102 0050 06/18/14 $630,000 $673,000 2,807 8 1996 Avg 9,430 N N 8828 NE 160TH PL
3 2 357860 0201 07/31/14 $650,000 $684,000 2,860 8 2004 Avg 5,576 N N 16023 88TH AVE NE
3 3 082605 9323 02/22/13 $529,300 $653,000 2,880 8 1999 Avg 32,371 N N 16700 107TH PL NE
3 2 357860 0050 09/28/12 $536,000 $688,000 3,280 8 2012 Avg 28,188 N N 15746 SIMONDS RD NE
3 2 020050 0120 11/01/13 $455,000 $522,000 1,500 9 1988 Avg 9,094 N N 15008 91ST PL NE
3 4 108970 0140 11/07/14 $565,000 $576,000 1,620 9 1995 Avg 8,512 N N 14815 102ND AVE NE
3 2 020052 0180 06/19/13 $415,000 $495,000 1,800 9 1991 Good 8,040 N N 8909 NE 151ST PL
3 0 885410 0120 11/12/13 $620,000 $708,000 1,840 9 1985 Good 15,108 Y N 9300 ODIN WAY
3 2 020050 0250 10/04/12 $460,000 $589,000 1,930 9 1989 Good 6,346 N N 15001 92ND PL NE
3 0 885410 0080 10/29/12 $600,000 $764,000 1,940 9 2012 Avg 12,993 Y N 9340 ODIN WAY
3 4 108880 0680 08/21/13 $470,000 $550,000 1,970 9 1995 Avg 18,590 N N 10311 NE 156TH PL
3 2 133275 0060 06/06/14 $659,950 $707,000 2,090 9 2013 Avg 6,880 N N 16506 85TH PL NE

Improved Sales Used in This Annual Update Analysis
Area 038 -- 1 to 3 Unit Residences
Area 038 37
2015 Annual Update Department of Assessments
Sub Area Nghb Major Minor
Sale Date Sale Price
Adj Sale Price AGLA
Bldg Grade
Year Built/Ren Cond Lot Size View
Water- front Situs Address
3 2 133275 0050 06/10/14 $659,950 $706,000 2,100 9 2013 Avg 5,874 N N 16508 85TH PL NE
3 2 020050 0700 06/12/14 $531,000 $568,000 2,120 9 1988 Avg 9,736 N N 15102 91ST PL NE
3 2 020050 0030 04/26/12 $385,000 $515,000 2,220 9 1989 Avg 9,691 N N 15001 91ST PL NE
3 2 020051 0150 02/14/13 $435,000 $537,000 2,230 9 1989 Avg 6,782 N N 15601 93RD CT NE
3 4 108880 1190 08/10/12 $585,000 $761,000 2,230 9 1995 Avg 10,325 N N 15211 103RD AVE NE
3 3 172605 9092 03/21/13 $825,000 $1,009,000 2,250 9 1990 Good 162,914 N N 15706 105TH AVE NE
3 2 020052 0070 09/08/13 $530,000 $617,000 2,270 9 1991 Good 7,237 N N 15123 91ST PL NE
3 4 108880 0060 11/05/14 $575,000 $586,000 2,270 9 1990 Avg 9,600 N N 10021 NE 153RD ST
3 4 108970 0010 10/08/14 $540,000 $556,000 2,329 9 1995 Avg 9,436 N N 14932 102ND AVE NE
3 2 020050 0670 03/07/13 $410,800 $505,000 2,340 9 1989 Avg 8,111 N N 9132 NE 151ST ST
3 4 108880 0200 12/04/12 $532,000 $670,000 2,400 9 1990 Avg 9,971 N N 15021 102ND AVE NE
3 4 108880 0660 02/22/12 $535,000 $727,000 2,400 9 1997 Avg 9,610 N N 10203 NE 156TH PL
3 0 320490 0040 02/22/13 $528,275 $651,000 2,400 9 2001 Good 10,973 N N 17127 109TH PL NE
3 4 108880 0050 07/19/12 $502,500 $657,000 2,430 9 1994 Avg 9,600 N N 10017 NE 153RD ST
3 2 020051 0020 07/15/13 $530,000 $627,000 2,470 9 1989 Good 9,825 Y N 15408 93RD PL NE
3 2 020050 0560 06/11/13 $460,000 $550,000 2,510 9 1989 Avg 11,092 Y N 15314 93RD PL NE
3 3 689999 0080 03/25/14 $685,000 $751,000 2,540 9 1989 Good 14,558 Y N 17210 105TH AVE NE
3 3 689999 0080 03/02/12 $532,500 $722,000 2,540 9 1989 Good 14,558 Y N 17210 105TH AVE NE
3 4 108880 0470 10/28/14 $547,500 $560,000 2,550 9 1990 Avg 10,355 N N 15204 103RD AVE NE
3 2 020051 0530 08/27/13 $530,000 $620,000 2,560 9 1989 Good 7,696 N N 15322 92ND PL NE
3 2 020051 0060 12/31/14 $605,000 $605,000 2,570 9 1989 Avg 9,487 Y N 15516 93RD CT NE
3 2 020052 0120 07/01/14 $570,000 $606,000 2,590 9 1991 Avg 8,483 N N 9006 NE 151ST PL
3 2 020050 0610 06/11/14 $571,000 $611,000 2,600 9 1988 Avg 7,465 N N 15201 93RD PL NE
3 4 108880 0130 07/12/12 $575,000 $753,000 2,600 9 1990 Avg 9,600 N N 15209 102ND AVE NE
3 2 020050 0680 07/15/14 $557,500 $590,000 2,620 9 1988 Avg 11,056 N N 9126 NE 151ST ST
3 2 020051 0380 06/26/12 $504,500 $664,000 2,630 9 1989 Good 9,041 N N 15303 92ND PL NE
3 3 172605 9079 12/18/12 $799,950 $1,004,000 2,640 9 1967 VGood 38,745 Y N 16322 104TH AVE NE
3 2 020050 0490 04/29/13 $530,000 $641,000 2,660 9 1989 Avg 8,873 Y N 15108 93RD PL NE
3 2 020052 0080 08/01/14 $595,000 $626,000 2,660 9 1991 Avg 10,637 N N 15121 91ST PL NE
3 2 020050 0450 07/12/13 $460,000 $545,000 2,690 9 1988 Avg 9,870 Y N 15032 93RD PL NE
3 4 108880 0850 05/02/14 $612,500 $664,000 2,730 9 1991 Avg 12,261 N N 15526 101ST PL NE

Improved Sales Used in This Annual Update Analysis
Area 038 -- 1 to 3 Unit Residences
Area 038 38
2015 Annual Update Department of Assessments
Sub Area Nghb Major Minor
Sale Date Sale Price
Adj Sale Price AGLA
Bldg Grade
Year Built/Ren Cond Lot Size View
Water- front Situs Address
3 4 108880 0880 01/07/14 $565,000 $635,000 2,730 9 1991 Avg 9,600 N N 15523 101ST PL NE
3 4 108881 0150 09/19/13 $717,800 $833,000 2,730 9 1990 Good 9,619 N N 15611 100TH PL NE
3 4 108881 0220 06/27/12 $510,000 $671,000 2,750 9 1993 Good 9,600 N N 9907 NE 155TH ST
3 0 443400 0080 06/20/12 $435,000 $573,000 2,810 9 1999 Avg 9,636 N N 17125 111TH AVE NE
3 4 108881 0160 12/24/14 $650,000 $652,000 2,820 9 1990 Avg 10,120 N N 15605 100TH PL NE
3 2 020052 0200 05/08/13 $560,550 $677,000 2,860 9 1991 Good 8,717 N N 8921 NE 151ST PL
3 0 320490 0090 05/17/12 $447,000 $594,000 2,870 9 2000 Avg 9,816 N N 17216 109TH PL NE
3 4 074550 0230 08/19/12 $699,000 $907,000 2,880 9 2009 Avg 10,230 N N 15203 98TH CT NE
3 0 734050 0280 07/05/12 $510,000 $669,000 2,940 9 2000 Avg 7,070 N N 10622 NE 173RD PL
3 4 108880 0530 06/17/13 $610,000 $728,000 2,950 9 1992 Avg 11,446 N N 10330 NE 153RD PL
3 2 664103 0030 03/03/14 $600,000 $663,000 2,950 9 2001 Avg 10,551 N N 9118 NE 160TH PL
3 0 082605 9346 04/29/14 $509,000 $552,000 3,040 9 1999 Avg 49,222 N N 17515 102ND AVE NE
3 4 108880 0770 04/15/13 $698,950 $849,000 3,040 9 1991 Avg 10,171 N N 10212 NE 156TH PL
3 4 108880 0870 07/08/13 $659,950 $783,000 3,040 9 1991 Avg 11,067 N N 15525 101ST PL NE
3 4 108880 0540 04/30/12 $575,000 $768,000 3,080 9 1992 Avg 11,001 N N 10328 NE 153RD PL
3 4 074552 0020 01/09/12 $714,950 $982,000 3,080 9 2012 Avg 10,596 N N 14902 97TH AVE NE
3 4 074552 0090 02/26/12 $727,795 $988,000 3,080 9 2012 Avg 9,970 Y N 14608 97TH AVE NE
3 4 074552 0110 04/09/12 $714,950 $960,000 3,080 9 2012 Avg 10,629 Y N 14520 97TH AVE NE
3 4 108880 0840 03/25/12 $579,950 $781,000 3,100 9 1991 Avg 11,359 N N 15524 101ST PL NE
3 4 108880 0320 07/08/13 $614,950 $729,000 3,230 9 1996 Avg 11,148 N N 10409 NE 151ST PL
3 4 074552 0100 02/16/12 $753,000 $1,024,000 3,240 9 2012 Avg 10,541 N N 14526 97TH AVE NE
3 4 074552 0140 05/02/12 $679,950 $907,000 3,240 9 2012 Avg 12,265 N N 14607 97TH AVE NE
3 2 857380 0050 05/13/13 $620,000 $747,000 3,260 9 2005 Avg 10,565 N N 9021 NE 152ND PL
3 4 074551 0020 09/27/13 $690,000 $799,000 3,270 9 2011 Avg 9,613 N N 14816 99TH PL NE
3 4 345800 0240 12/04/12 $620,000 $781,000 3,280 9 2012 Avg 9,146 N N 15108 101ST PL NE
3 2 020050 0510 06/14/12 $573,000 $756,000 3,330 9 1989 Good 10,913 Y N 15202 93RD PL NE
3 2 563050 0007 05/13/13 $600,000 $723,000 3,350 9 2012 Avg 11,961 N N 14802 SIMONDS RD NE
3 4 074552 0200 02/01/12 $669,950 $915,000 3,370 9 2011 Avg 9,680 N N 14811 97TH AVE NE
3 4 345800 0210 12/27/12 $658,990 $825,000 3,400 9 2012 Avg 9,797 N N 15117 101ST PL NE
3 4 345800 0310 05/20/13 $693,935 $835,000 3,400 9 2012 Avg 9,729 N N 10031 NE 151ST ST
3 3 082605 9175 02/13/13 $655,000 $810,000 3,410 9 2013 Avg 16,296 N N 16522 107TH PL NE

Improved Sales Used in This Annual Update Analysis
Area 038 -- 1 to 3 Unit Residences
Area 038 39
2015 Annual Update Department of Assessments
Sub Area Nghb Major Minor
Sale Date Sale Price
Adj Sale Price AGLA
Bldg Grade
Year Built/Ren Cond Lot Size View
Water- front Situs Address
3 4 074551 0010 03/28/12 $623,450 $839,000 3,410 9 2011 Avg 9,692 N N 14900 99TH PL NE
3 4 074551 0060 03/15/12 $624,950 $844,000 3,410 9 2011 Avg 9,915 N N 14712 99TH PL NE
3 4 345800 0190 03/27/13 $714,001 $872,000 3,410 9 2013 Avg 9,679 N N 10012 NE 151ST ST
3 4 345800 0300 06/22/13 $775,990 $925,000 3,410 9 2013 Avg 9,904 N N 15105 101ST PL NE
3 4 108880 0510 03/25/13 $495,500 $606,000 3,450 9 1995 Avg 9,958 N N 10320 NE 153RD PL
3 4 108880 0740 04/01/14 $685,000 $750,000 3,465 9 1995 Avg 9,617 N N 10204 NE 156TH PL
3 4 345800 0090 10/30/13 $803,967 $922,000 3,540 9 2013 Avg 9,817 N N 15022 101ST AVE NE
3 4 345800 0130 08/09/13 $789,990 $928,000 3,540 9 2013 Avg 10,506 N N 15118 101ST AVE NE
3 4 345800 0160 07/25/13 $780,138 $921,000 3,540 9 2013 Avg 10,046 N N 10030 NE 151ST ST
3 4 345800 0180 04/25/13 $716,726 $868,000 3,540 9 2013 Avg 9,883 N N 10018 NE 151ST ST
3 4 345800 0220 01/17/13 $724,990 $903,000 3,540 9 2013 Avg 9,950 N N 15111 101ST PL NE
3 4 074553 0260 12/23/14 $899,950 $903,000 3,550 9 2013 Avg 10,848 N N 14519 98TH AVE NE
3 4 074553 0280 03/12/13 $730,950 $897,000 3,550 9 2013 Avg 10,201 N N 14609 99TH AVE NE
3 4 074553 0400 01/25/13 $759,950 $944,000 3,560 9 2013 Avg 9,600 N N 14610 98TH AVE NE
3 4 074553 0080 07/09/13 $697,950 $828,000 3,580 9 2013 Avg 9,561 N N 14502 97TH AVE NE
3 4 074553 0140 02/20/14 $774,950 $859,000 3,580 9 2013 Avg 9,909 Y N 14511 97TH AVE NE
3 4 074553 0410 02/05/13 $754,155 $934,000 3,580 9 2013 Avg 9,771 N N 14530 98TH AVE NE
3 4 074553 0430 06/25/13 $835,950 $995,000 3,580 9 2013 Avg 10,927 N N 14518 98TH AVE NE
3 4 345800 0120 09/04/13 $829,987 $968,000 3,600 9 2013 Avg 9,954 N N 15112 101ST AVE NE
3 4 345800 0150 07/30/13 $827,211 $975,000 3,600 9 2013 Avg 9,766 N N 10036 NE 151ST ST
3 4 345800 0170 07/09/13 $766,081 $908,000 3,600 9 2013 Avg 9,938 N N 10024 NE 151ST ST
3 4 345800 0200 01/29/13 $680,252 $844,000 3,600 9 2012 Avg 10,022 N N 10006 NE 151ST DR
3 4 345800 0260 01/17/14 $860,000 $963,000 3,600 9 2012 Avg 9,529 N N 15020 101ST PL NE
3 4 345800 0320 05/01/13 $704,990 $853,000 3,600 9 2013 Avg 9,676 N N 10025 NE 151ST DR
3 4 074552 0130 04/30/12 $689,950 $921,000 3,620 9 2012 Avg 12,271 N N 14527 97TH AVE NE
3 4 074552 0160 01/30/12 $689,950 $943,000 3,620 9 2012 Avg 9,604 N N 14619 97TH AVE NE
3 4 074553 0090 04/09/14 $815,000 $890,000 3,620 9 2013 Avg 9,975 Y N 9704 NE 145TH CT
3 4 074552 0050 02/24/12 $739,050 $1,003,000 3,640 9 2012 Avg 10,679 Y N 14716 97TH AVE NE
3 4 074553 0340 08/13/14 $916,840 $961,000 3,650 9 2014 Avg 9,791 N N 14809 98TH AVE NE
3 4 074552 0170 04/23/12 $694,950 $930,000 3,660 9 2012 Avg 9,633 N N 14705 97TH AVE NE
3 2 698050 0030 12/11/14 $650,000 $655,000 3,700 9 2007 Avg 4,500 N N 16308 SIMONDS RD NE

Improved Sales Used in This Annual Update Analysis
Area 038 -- 1 to 3 Unit Residences
Area 038 40
2015 Annual Update Department of Assessments
Sub Area Nghb Major Minor
Sale Date Sale Price
Adj Sale Price AGLA
Bldg Grade
Year Built/Ren Cond Lot Size View
Water- front Situs Address
3 4 345800 0230 12/23/12 $659,990 $827,000 3,740 9 2012 Avg 9,709 N N 15107 101ST PL NE
3 2 609860 0010 08/06/12 $655,000 $852,000 3,790 9 2007 Avg 6,951 N N 16204 88TH AVE NE
3 4 074553 0270 03/12/13 $752,228 $923,000 3,790 9 2013 Avg 10,232 N N 14525 98TH AVE NE
3 4 074553 0290 02/01/13 $720,950 $894,000 3,790 9 2013 Avg 9,600 N N 14615 98TH AVE NE
3 4 074550 0010 12/08/14 $730,000 $736,000 3,800 9 2008 Avg 9,606 N N 14906 99TH PL NE
3 4 074552 0180 04/18/12 $699,950 $937,000 3,800 9 2012 Avg 9,623 N N 14711 97TH AVE NE
3 4 074552 0120 03/27/12 $699,950 $943,000 3,820 9 2012 Avg 10,490 N N 14521 97TH AVE NE
3 4 074552 0150 01/27/12 $700,000 $957,000 3,820 9 2012 Avg 10,135 N N 14613 97TH AVE NE
3 4 074552 0220 03/12/12 $699,950 $946,000 3,820 9 2012 Avg 11,329 N N 14909 97TH AVE NE
3 0 885400 0010 08/12/14 $540,000 $566,000 1,740 10 1978 Avg 10,059 Y N 9226 VALHALLA WAY
3 2 563450 0373 03/25/13 $514,450 $629,000 1,830 10 2007 Avg 6,051 N N 16504 SIMONDS RD NE
3 3 689999 0200 07/02/14 $720,000 $765,000 2,180 10 1990 Good 12,327 Y N 17401 102ND AVE NE
3 3 689999 0200 03/25/13 $676,000 $826,000 2,180 10 1990 Good 12,327 Y N 17401 102ND AVE NE
3 3 689999 0230 07/01/14 $600,000 $638,000 2,510 10 1990 Avg 14,878 Y N 17221 102ND AVE NE
3 0 755690 0040 08/19/13 $630,000 $738,000 2,870 10 1989 Good 19,868 N N 16306 110TH AVE NE
3 3 569050 0095 08/26/14 $735,000 $767,000 2,960 10 1989 Avg 39,370 N N 16048 104TH AVE NE
3 3 689999 0100 12/24/12 $725,000 $909,000 2,970 10 1987 Good 13,594 Y N 17300 102ND AVE NE
3 0 755690 0050 06/05/12 $639,000 $845,000 3,220 10 1989 Good 35,438 N N 16314 110TH AVE NE
3 0 569050 0010 12/12/13 $700,000 $793,000 3,237 10 1988 Avg 42,900 Y N 16301 107TH AVE NE
3 3 172605 9134 10/10/14 $1,075,000 $1,106,000 2,830 11 2001 Avg 56,628 N N 10618 NE 155TH PL
3 3 172605 9125 04/24/14 $900,000 $978,000 3,110 11 2001 Avg 66,646 N N 10608 NE 157TH ST
3 3 569050 0140 01/10/13 $946,500 $1,181,000 3,870 11 1999 Avg 21,020 Y N 16205 104TH AVE NE
3 3 172605 9062 03/03/14 $1,090,000 $1,204,000 4,250 11 2004 Avg 114,375 N N 16010 104TH AVE NE
4 0 091000 0104 08/06/14 $245,500 $258,000 790 6 1950 Avg 7,500 N N 18715 107TH AVE NE
4 0 956780 0475 10/09/13 $225,000 $260,000 970 6 1946 Good 6,783 N N 18919 103RD AVE NE
4 0 052605 9103 10/13/14 $325,000 $334,000 990 6 1953 Good 15,120 N N 19118 101ST PL NE
4 0 052605 9072 06/06/12 $313,000 $414,000 1,200 6 1931 VGood 13,240 N N 19711 104TH AVE NE
4 0 237420 0005 06/16/14 $375,000 $401,000 2,400 6 1945 Avg 6,000 N N 18226 98TH AVE NE
4 0 525500 0040 12/23/13 $330,000 $372,000 940 7 1959 Avg 8,800 N N 19006 107TH PL NE
4 0 152480 0010 10/01/13 $285,000 $330,000 960 7 1957 Avg 10,800 N N 9715 NE 200TH ST
4 0 956880 0100 11/19/12 $265,000 $335,000 1,000 7 1938 Good 9,000 N N 18641 103RD AVE NE

Improved Sales Used in This Annual Update Analysis
Area 038 -- 1 to 3 Unit Residences
Area 038 41
2015 Annual Update Department of Assessments
Sub Area Nghb Major Minor
Sale Date Sale Price
Adj Sale Price AGLA
Bldg Grade
Year Built/Ren Cond Lot Size View
Water- front Situs Address
4 0 062605 9155 12/10/14 $315,000 $317,000 1,010 7 1977 Good 12,000 N N 19525 100TH AVE NE
4 0 377530 0010 02/27/12 $209,000 $284,000 1,010 7 1965 Avg 10,007 N N 20005 95TH PL NE
4 0 572000 0020 12/31/12 $237,000 $296,000 1,010 7 1960 Avg 8,508 N N 8811 NE 190TH ST
4 0 213800 0080 04/14/14 $305,000 $332,000 1,030 7 1965 Avg 10,700 N N 9232 NE 184TH PL
4 0 572000 0090 08/23/13 $379,000 $444,000 1,050 7 1961 VGood 8,408 N N 18815 89TH AVE NE
4 0 213800 0140 09/26/12 $280,500 $360,000 1,070 7 1962 Avg 8,120 N N 18434 92ND AVE NE
4 0 525530 0070 09/19/12 $275,000 $354,000 1,080 7 1961 Avg 8,741 N N 10515 NE 194TH ST
4 0 213800 0160 05/30/12 $328,000 $435,000 1,090 7 1962 VGood 8,120 N N 18422 92ND AVE NE
4 0 377530 0080 06/18/13 $355,000 $424,000 1,090 7 1964 Good 24,900 N N 20101 95TH PL NE
4 0 551860 0010 07/19/12 $250,000 $327,000 1,110 7 1960 Avg 12,519 N N 19031 104TH AVE NE
4 0 572000 0370 04/01/14 $332,000 $363,000 1,110 7 1959 Good 9,298 N N 8837 NE 187TH ST
4 0 956880 0135 10/16/14 $299,900 $308,000 1,110 7 1949 Fair 8,055 N N 18613 103RD AVE NE
4 0 062605 9315 05/24/13 $279,000 $335,000 1,120 7 1985 Avg 11,168 N N 9708 NE 200TH ST
4 0 224800 0080 05/21/14 $385,500 $415,000 1,120 7 1961 Avg 7,947 N N 9215 NE 183RD ST
4 0 323522 0100 12/19/12 $307,000 $385,000 1,130 7 1976 Avg 13,914 N N 10134 NE 204TH ST
4 0 323522 0170 08/13/13 $350,000 $411,000 1,130 7 1976 Good 10,013 N N 10107 NE 204TH ST
4 0 052605 9257 10/30/13 $302,500 $347,000 1,160 7 1970 Avg 12,980 N N 20407 104TH AVE NE
4 0 379800 0175 11/08/13 $346,000 $396,000 1,160 7 1962 Good 8,284 N N 10418 NE 185TH ST
4 0 102980 0180 08/26/13 $280,000 $327,000 1,190 7 1982 Avg 7,657 N N 11220 NE 174TH ST
4 0 224800 0040 04/26/12 $356,000 $476,000 1,200 7 1959 VGood 7,943 N N 9210 NE 183RD ST
4 0 323522 0090 02/23/13 $309,950 $382,000 1,200 7 1976 Avg 13,547 N N 10126 NE 204TH ST
4 0 377530 0110 10/10/13 $320,000 $369,000 1,200 7 1965 Good 9,600 N N 9518 NE 201ST ST
4 0 949200 0160 06/25/13 $292,500 $348,000 1,200 7 1964 Good 8,789 N N 9232 NE 192ND ST
4 0 072605 9344 12/11/12 $330,000 $415,000 1,220 7 1961 Good 8,659 N N 18129 94TH AVE NE
4 0 377530 0030 12/31/14 $333,500 $334,000 1,220 7 1965 Avg 9,732 N N 20021 95TH PL NE
4 0 052605 9069 05/31/13 $321,003 $385,000 1,230 7 1978 Avg 69,260 N N 20218 103RD PL NE
4 0 949210 0020 02/09/12 $227,000 $309,000 1,230 7 1967 Avg 8,000 N N 19228 92ND AVE NE
4 0 525510 0060 07/06/12 $348,500 $457,000 1,250 7 1961 Good 9,000 N N 19307 108TH AVE NE
4 0 052605 9259 08/19/14 $335,500 $351,000 1,260 7 1970 Avg 8,487 N N 19032 104TH AVE NE
4 0 144400 0080 09/07/12 $350,000 $452,000 1,260 7 1978 Good 11,574 N N 9651 NE 201ST ST
4 0 280680 0090 11/04/14 $390,000 $398,000 1,270 7 1978 Avg 8,036 N N 9826 NE 204TH PL

Improved Sales Used in This Annual Update Analysis
Area 038 -- 1 to 3 Unit Residences
Area 038 42
2015 Annual Update Department of Assessments
Sub Area Nghb Major Minor
Sale Date Sale Price
Adj Sale Price AGLA
Bldg Grade
Year Built/Ren Cond Lot Size View
Water- front Situs Address
4 0 605770 0120 09/17/14 $340,000 $352,000 1,270 7 1967 Avg 8,422 N N 10725 SUNRISE DR
4 0 949320 0010 06/23/14 $347,000 $370,000 1,270 7 1955 Avg 8,400 N N 10618 SUNRISE DR
4 0 146000 0080 07/31/14 $370,000 $390,000 1,280 7 1987 Avg 7,620 N N 20030 99TH CT NE
4 0 091000 0068 01/21/14 $460,000 $514,000 1,290 7 1985 VGood 7,872 N N 18924 107TH AVE NE
4 0 572000 0350 10/26/12 $234,000 $298,000 1,290 7 1959 Good 8,403 N N 18607 89TH AVE NE
4 0 379800 0130 07/25/14 $468,000 $494,000 1,330 7 1958 Good 8,580 N N 18616 105TH AVE NE
4 0 144400 0060 01/30/13 $350,000 $434,000 1,360 7 1978 Good 8,165 N N 9639 NE 201ST ST
4 0 809730 0010 03/21/14 $319,950 $351,000 1,370 7 1961 Avg 8,444 N N 10004 NE 200TH ST
4 0 052605 9179 05/29/12 $308,000 $408,000 1,380 7 1993 Good 6,671 N N 19021 104TH AVE NE
4 0 144400 0110 03/27/13 $390,000 $476,000 1,380 7 1978 Good 8,616 N N 20130 98TH AVE NE
4 0 280680 0180 04/02/13 $364,000 $444,000 1,390 7 1977 Good 7,382 N N 9630 NE 204TH PL
4 0 525540 0160 08/26/13 $369,950 $433,000 1,390 7 1978 Good 8,500 N N 20007 102ND PL NE
4 0 551880 0010 07/03/14 $515,000 $547,000 1,390 7 1977 VGood 9,629 N N 10723 NE 189TH ST
4 0 572000 0490 01/04/13 $250,500 $313,000 1,390 7 1959 Avg 10,260 N N 8811 NE 186TH PL
4 0 144400 0090 07/05/13 $305,000 $362,000 1,400 7 1978 Avg 8,718 N N 20118 98TH AVE NE
4 0 152480 0005 08/12/14 $325,000 $341,000 1,400 7 1974 Good 10,800 N N 19819 98TH AVE NE
4 0 052605 9111 07/11/13 $404,000 $479,000 1,410 7 1953 Good 13,509 N N 19103 103RD AVE NE
4 0 052605 9122 12/05/14 $495,200 $500,000 1,410 7 1955 Avg 22,120 N N 18824 ROSS RD
4 0 280680 0340 01/08/13 $325,000 $406,000 1,410 7 1977 Good 7,200 N N 9907 NE 204TH PL
4 0 377530 0020 03/22/13 $312,500 $382,000 1,410 7 1965 Good 10,126 N N 20011 95TH PL NE
4 0 062605 9317 11/20/14 $375,000 $380,000 1,430 7 1981 Avg 10,574 N N 19043 92ND AVE NE
4 0 280680 0120 06/10/14 $400,000 $428,000 1,440 7 1978 Avg 7,563 N N 9814 NE 204TH PL
4 0 144400 0070 09/15/13 $359,000 $417,000 1,500 7 1978 Avg 8,498 N N 9645 NE 201ST ST
4 0 213800 0120 06/26/14 $435,000 $463,000 1,510 7 1962 Avg 8,751 N N 9320 NE 184TH PL
4 0 949210 0050 07/11/13 $335,000 $397,000 1,550 7 1965 Good 9,306 N N 9223 NE 193RD ST
4 0 525530 0120 09/16/13 $362,000 $421,000 1,570 7 1963 Avg 8,325 N N 10505 NE 195TH ST
4 0 525500 0370 10/04/13 $380,000 $439,000 1,620 7 1959 Good 9,000 N N 19116 108TH AVE NE
4 0 605760 0050 03/20/14 $313,000 $344,000 1,630 7 1956 Good 7,200 N N 10603 SUNRISE DR
4 0 152480 0020 04/24/12 $325,000 $435,000 1,660 7 1968 Good 11,039 N N 9701 NE 200TH ST
4 0 193980 0010 06/30/13 $315,000 $374,000 1,670 7 1924 Fair 12,513 N N 18824 BOTHELL WAY NE
4 0 255750 0170 12/05/13 $457,000 $519,000 1,670 7 1965 Good 34,512 N N 19801 95TH AVE NE

Improved Sales Used in This Annual Update Analysis
Area 038 -- 1 to 3 Unit Residences
Area 038 43
2015 Annual Update Department of Assessments
Sub Area Nghb Major Minor
Sale Date Sale Price
Adj Sale Price AGLA
Bldg Grade
Year Built/Ren Cond Lot Size View
Water- front Situs Address
4 0 512890 0160 12/23/13 $376,000 $424,000 1,670 7 1985 Good 10,269 N N 9937 NE 202ND ST
4 0 052605 9258 06/11/12 $245,000 $324,000 1,680 7 1970 Avg 10,325 N N 20401 104TH AVE NE
4 0 956780 0476 09/16/13 $378,000 $439,000 1,730 7 1990 Good 6,784 N N 18927 103RD AVE NE
4 0 525570 0120 02/09/12 $281,350 $383,000 1,800 7 1969 Avg 8,350 N N 20047 107TH AVE NE
4 0 949210 0130 11/04/13 $330,000 $378,000 1,860 7 1955 Good 10,463 N N 9236 NE 193RD ST
4 0 052605 9199 10/22/14 $398,000 $408,000 1,890 7 1950 Good 16,001 N N 19028 104TH AVE NE
4 0 525500 0210 02/15/13 $349,000 $431,000 1,950 7 1963 Good 8,400 N N 19104 106TH AVE NE
4 0 072605 9048 09/26/14 $490,500 $507,000 1,970 7 1998 Avg 21,883 N N 9424 NE 181ST LN
4 0 525500 0110 10/07/14 $460,000 $474,000 1,970 7 1959 Avg 8,400 N N 19111 108TH AVE NE
4 0 525530 0140 12/19/12 $340,000 $427,000 1,970 7 1961 Good 8,325 N N 10512 NE 194TH ST
4 0 323522 0230 07/25/13 $364,950 $431,000 2,000 7 1976 Avg 10,600 N N 10005 NE 204TH ST
4 0 949210 0170 01/06/14 $305,000 $343,000 2,010 7 1964 Good 9,793 N N 9216 NE 193RD ST
4 0 525520 0220 12/05/14 $405,000 $409,000 2,020 7 1965 Avg 8,531 N N 10604 NE 195TH ST
4 0 052605 9158 10/16/13 $362,400 $417,000 2,060 7 1956 Avg 29,782 N N 19111 ROSS RD
4 0 072605 9395 09/23/14 $516,250 $534,000 2,390 7 1925 Good 8,660 N N 18011 94TH AVE NE
4 0 934380 0030 09/16/13 $450,000 $523,000 2,480 7 1978 Good 13,051 N N 10412 NE 190TH ST
4 0 082605 9318 07/11/12 $364,900 $478,000 880 8 1978 VGood 18,293 N N 10911 VALLEY VIEW RD
4 0 525680 0070 04/17/13 $385,500 $468,000 1,180 8 1982 Good 8,400 N N 10420 NE 200TH ST
4 0 769780 0040 08/26/14 $470,000 $491,000 1,220 8 1979 Good 9,820 N N 10435 NE 204TH PL
4 0 525571 0110 10/23/12 $345,000 $440,000 1,230 8 1976 Good 8,940 N N 20015 108TH AVE NE
4 0 525700 0100 06/04/12 $400,000 $529,000 1,230 8 1978 VGood 9,000 N N 10516 NE 196TH ST
4 0 812531 0090 06/11/13 $405,000 $484,000 1,240 8 1975 Good 9,866 N N 8901 NE 191ST PL
4 0 173731 0090 04/29/14 $501,000 $543,000 1,280 8 1977 Good 9,809 N N 19233 90TH PL NE
4 0 072605 9319 09/13/13 $375,000 $436,000 1,360 8 1960 Avg 14,025 Y N 9418 NE 181ST LN
4 0 956780 0250 10/08/13 $360,000 $416,000 1,390 8 1928 Avg 13,068 N N 10116 NE 187TH ST
4 0 525573 0140 06/18/13 $355,000 $424,000 1,400 8 1975 Avg 11,396 N N 10445 NE 201ST ST
4 0 525573 0070 05/31/13 $399,900 $480,000 1,420 8 1975 Good 9,500 N N 20137 105TH AVE NE
4 0 173732 0080 05/20/13 $434,950 $523,000 1,460 8 1976 Good 8,580 N N 19302 89TH AVE NE
4 0 173732 0120 05/02/14 $470,000 $509,000 1,460 8 1976 Avg 9,655 N N 19334 89TH AVE NE
4 0 173732 0380 04/12/12 $339,950 $456,000 1,460 8 1976 Good 8,744 N N 8910 NE 195TH ST
4 0 525540 0130 05/31/13 $385,000 $462,000 1,480 8 1978 Good 10,750 N N 20037 102ND CT NE

Improved Sales Used in This Annual Update Analysis
Area 038 -- 1 to 3 Unit Residences
Area 038 44
2015 Annual Update Department of Assessments
Sub Area Nghb Major Minor
Sale Date Sale Price
Adj Sale Price AGLA
Bldg Grade
Year Built/Ren Cond Lot Size View
Water- front Situs Address
4 0 173732 0060 06/10/14 $366,000 $392,000 1,520 8 1976 Avg 8,625 N N 19223 89TH AVE NE
4 0 072605 9141 10/07/13 $420,000 $485,000 1,530 8 1994 Good 26,936 N N 18012 94TH AVE NE
4 0 255750 0160 06/25/13 $527,500 $628,000 1,550 8 1977 VGood 27,260 N N 19807 95TH AVE NE
4 0 525569 0090 09/13/12 $359,950 $464,000 1,580 8 1977 Avg 9,000 N N 20225 107TH AVE NE
4 0 525570 0160 08/05/14 $485,000 $510,000 1,590 8 1971 Good 8,384 N N 20048 106TH AVE NE
4 0 102980 0200 03/20/14 $405,000 $445,000 1,630 8 1984 Avg 7,906 N N 11204 NE 174TH ST
4 0 525571 0010 12/15/14 $435,000 $438,000 1,630 8 1976 Avg 13,700 N N 19812 108TH AVE NE
4 0 062605 9299 08/20/13 $457,000 $535,000 1,640 8 1973 Good 23,522 N N 18824 93RD AVE NE
4 0 525550 0310 04/17/14 $488,043 $531,000 1,640 8 1966 Good 8,828 N N 10414 NE 197TH ST
4 0 782000 0038 11/14/14 $454,000 $461,000 1,700 8 1992 Avg 10,000 N N 19012 101ST PL NE
4 0 052605 9276 05/14/13 $435,000 $524,000 1,710 8 1978 Avg 18,420 N N 18914 ROSS RD
4 0 525560 0250 08/10/12 $355,000 $462,000 1,720 8 1967 Avg 10,700 N N 19808 105TH PL NE
4 0 173732 0300 04/24/14 $521,400 $567,000 1,740 8 1977 Good 9,640 N N 9046 NE 195TH ST
4 0 525550 0230 04/01/14 $392,000 $429,000 1,760 8 1966 Avg 9,300 N N 10604 NE 197TH ST
4 0 525700 0150 05/01/14 $486,500 $527,000 1,780 8 1968 Good 9,000 N N 10424 NE 196TH ST
4 0 769780 0170 11/20/12 $299,000 $378,000 1,800 8 1979 Avg 9,314 N N 10618 NE 204TH PL
4 0 206190 0040 05/25/12 $375,000 $497,000 1,940 8 1988 Avg 9,305 N N 10226 NE 197TH ST
4 0 173730 0110 08/26/14 $434,000 $453,000 2,010 8 1973 Avg 8,171 N N 19224 91ST AVE NE
4 0 173732 0410 06/26/13 $315,000 $375,000 2,100 8 1976 Avg 8,666 N N 8802 NE 195TH ST
4 0 062605 9169 02/21/13 $433,000 $534,000 2,180 8 1994 Good 8,402 N N 9818 NE 200TH ST
4 0 525540 0010 07/12/12 $353,000 $462,000 2,240 8 1978 Good 8,347 Y N 10324 NE 200TH ST
4 0 525569 0160 10/09/14 $439,000 $452,000 2,240 8 1978 Avg 8,300 N N 20209 108TH AVE NE
4 0 152480 0060 04/09/14 $539,950 $589,000 2,270 8 1999 Avg 10,800 N N 9726 NE 198TH ST
4 0 102980 0030 09/25/12 $494,000 $634,000 2,300 8 1983 Avg 14,301 Y Y 11113 NE 174TH ST
4 0 062605 9335 09/04/14 $527,000 $549,000 2,330 8 1987 Avg 19,436 N N 9311 NE 191ST ST
4 0 525569 0080 07/03/12 $410,000 $538,000 2,340 8 1977 Good 8,900 N N 20235 108TH AVE NE
4 0 525550 0210 09/21/12 $378,000 $486,000 2,350 8 1966 Good 8,560 N N 10620 NE 197TH ST
4 0 062605 9368 12/27/13 $522,000 $588,000 2,400 8 2012 Avg 10,335 N N 19607 97TH AVE NE
4 0 173732 0070 02/04/13 $398,300 $493,000 2,420 8 1976 Avg 8,690 N N 19222 89TH AVE NE
4 0 072605 9396 07/11/13 $450,000 $533,000 2,520 8 1997 Good 12,942 N N 9316 NE 180TH ST
4 0 072605 9432 08/27/12 $500,000 $647,000 2,520 8 2003 Avg 19,650 N N 18019 94TH AVE NE

Improved Sales Used in This Annual Update Analysis
Area 038 -- 1 to 3 Unit Residences
Area 038 45
2015 Annual Update Department of Assessments
Sub Area Nghb Major Minor
Sale Date Sale Price
Adj Sale Price AGLA
Bldg Grade
Year Built/Ren Cond Lot Size View
Water- front Situs Address
4 0 052605 9309 12/10/12 $482,500 $607,000 2,542 8 2003 Avg 9,601 N N 18906 ROSS RD
4 0 956780 0430 08/14/13 $550,000 $645,000 2,590 8 2013 Avg 7,194 N N 10110 NE 189TH ST
4 0 062605 9327 09/23/13 $507,000 $588,000 2,640 8 1985 Good 16,934 N N 20015 97TH AVE NE
4 0 525571 0150 02/20/14 $450,000 $499,000 2,760 8 1976 Avg 9,197 N N 10705 NE 200TH PL
4 0 062605 9334 09/06/12 $535,000 $691,000 3,190 8 2012 Avg 88,426 N N 9433 NE 191ST ST
4 0 173730 0130 12/22/14 $610,000 $612,000 3,210 8 1970 Avg 12,033 N N 19234 91ST AVE NE
4 0 173750 0070 07/25/12 $490,000 $640,000 2,180 9 1998 Avg 10,529 N N 19606 92ND AVE NE
4 0 339505 0060 07/22/14 $628,000 $663,000 2,190 9 1987 Avg 11,894 N N 10321 NE 201ST PL
4 0 670580 0020 09/17/13 $462,370 $537,000 2,190 9 1989 Avg 11,016 N N 9936 NE 197TH ST
4 0 670580 0040 05/16/14 $551,000 $595,000 2,260 9 1990 Avg 9,604 N N 9824 NE 197TH ST
4 0 062605 9354 04/23/12 $505,000 $675,000 2,330 9 2002 Avg 10,164 N N 20207 96TH AVE NE
4 0 072605 9434 04/06/14 $605,000 $661,000 2,380 9 1976 Good 43,451 N N 18024 94TH AVE NE
4 0 173733 0090 12/02/13 $529,000 $601,000 2,380 9 1993 Good 9,178 N N 19640 88TH PL NE
4 0 613761 0180 12/09/12 $439,200 $553,000 2,470 9 1992 Avg 8,756 N N 19621 109TH PL NE
4 0 052605 9310 01/30/13 $489,000 $607,000 2,550 9 2004 Avg 14,273 N N 19105 103RD AVE NE
4 0 173733 0310 05/16/13 $473,000 $570,000 2,620 9 1993 Avg 8,730 N N 8824 NE 198TH ST
4 0 173733 0190 08/05/13 $530,000 $624,000 2,650 9 1991 Good 8,184 N N 19615 89TH PL NE
4 0 613761 0060 12/09/13 $540,000 $612,000 2,650 9 1989 Avg 10,133 Y N 11004 NE 197TH ST
4 0 613761 0150 04/05/12 $493,900 $664,000 2,730 9 1996 Good 7,697 Y N 19633 109TH PL NE
4 0 173733 0330 02/07/13 $499,900 $619,000 2,750 9 1993 Avg 8,123 N N 8812 NE 198TH ST
4 0 173733 0130 07/29/13 $540,000 $637,000 2,910 9 1991 Good 9,206 N N 8825 NE 198TH ST
4 0 173733 0340 11/25/12 $486,250 $614,000 2,920 9 1993 Avg 10,498 N N 8806 NE 198TH ST
4 0 613761 0040 02/10/12 $416,000 $567,000 2,950 9 1989 Avg 8,851 N N 11014 NE 197TH ST
4 0 613761 0370 07/26/12 $496,640 $648,000 2,950 9 1989 Good 8,771 Y N 19626 110TH PL NE
4 0 062605 9359 08/27/13 $608,750 $712,000 3,060 9 2004 Avg 9,607 N N 20407 96TH AVE NE
4 0 956780 0375 10/12/12 $539,000 $689,000 3,200 9 2007 Avg 6,622 N N 10317 NE 190TH ST
4 0 670580 0110 08/28/14 $575,000 $600,000 3,310 9 1990 Avg 10,110 N N 19628 98TH AVE NE
4 0 613761 0570 02/18/14 $600,000 $665,000 3,510 9 1991 Avg 10,520 N N 11015 NE 197TH ST
4 0 339505 0050 11/14/14 $630,000 $640,000 3,800 9 1983 Avg 13,995 Y N 10318 NE 201ST PL
4 0 613761 0340 01/04/12 $489,000 $673,000 3,960 9 1993 Avg 8,497 Y N 19614 110TH PL NE
4 0 635890 0070 12/22/14 $810,000 $813,000 4,140 9 2007 Avg 46,173 N N 9520 NE 188TH ST

Improved Sales Used in This Annual Update Analysis
Area 038 -- 1 to 3 Unit Residences
Area 038 46
2015 Annual Update Department of Assessments
Sub Area Nghb Major Minor
Sale Date Sale Price
Adj Sale Price AGLA
Bldg Grade
Year Built/Ren Cond Lot Size View
Water- front Situs Address
4 0 785998 0020 08/02/13 $695,000 $818,000 3,510 10 2006 Avg 8,446 N N 10306 NE 194TH ST
5 0 062210 0108 07/01/13 $270,000 $321,000 940 7 1969 Good 20,833 N N 13300 NE 186TH ST
5 0 923845 0270 02/12/13 $321,500 $397,000 970 7 1969 Avg 9,516 N N 19406 131ST AVE NE
5 0 923845 0430 06/24/14 $275,000 $293,000 990 7 1968 Avg 9,798 N N 13101 NE 193RD PL
5 0 923845 0210 06/23/14 $326,000 $347,000 1,030 7 1969 Avg 9,834 N N 19308 131ST AVE NE
5 0 062210 0127 02/25/14 $380,000 $420,000 1,050 7 1981 Avg 15,570 N N 13203 NE 190TH PL
5 0 923845 0330 11/10/14 $330,000 $336,000 1,070 7 1969 Avg 10,563 N N 19433 131ST AVE NE
5 0 445070 0010 07/08/14 $375,000 $398,000 1,130 7 1976 Avg 9,673 N N 13226 NE 186TH ST
5 0 445070 0030 08/22/14 $354,950 $371,000 1,130 7 1976 Avg 9,689 N N 13210 NE 186TH ST
5 0 062210 0092 07/16/14 $440,000 $466,000 1,150 7 1979 Avg 19,747 N N 19415 133RD CT NE
5 0 914430 0010 04/22/14 $322,000 $350,000 1,150 7 1969 Avg 9,621 N N 18563 132ND PL NE
5 0 802968 0010 01/14/14 $300,000 $336,000 1,180 7 1999 Avg 2,976 N N 18461 134TH PL NE
5 0 923845 0400 11/20/12 $293,000 $371,000 1,210 7 1968 Avg 9,600 N N 19309 131ST AVE NE
5 0 923845 0230 07/15/13 $315,000 $373,000 1,240 7 1969 Avg 10,207 N N 13111 NE 194TH ST
5 0 680460 0220 04/18/14 $449,500 $489,000 1,280 7 1986 Avg 9,353 N N 18329 129TH PL NE
5 0 923845 0150 05/12/14 $368,000 $398,000 1,280 7 1968 Avg 9,898 N N 13232 NE 193RD PL
5 0 273863 0140 10/16/12 $339,000 $433,000 1,310 7 1968 Avg 15,281 N N 20103 136TH AVE NE
5 0 807837 0010 05/29/12 $361,375 $479,000 1,320 7 1975 Good 12,042 N N 13422 NE 186TH ST
5 0 062210 0133 06/25/14 $350,000 $373,000 1,380 7 1985 Avg 15,000 N N 18825 136TH AVE NE
5 0 565101 0320 07/22/14 $335,000 $354,000 1,380 7 1988 Avg 5,840 N N 12704 NE 200TH PL
5 0 565101 0160 06/26/13 $331,000 $394,000 1,390 7 1988 Avg 5,868 N N 12816 NE 200TH PL
5 0 802968 0100 04/22/14 $325,950 $354,000 1,410 7 1999 Avg 8,613 N N 18430 134TH PL NE
5 0 062210 0130 09/17/14 $365,000 $378,000 1,440 7 1985 Avg 15,000 N N 18913 136TH AVE NE
5 0 142720 0080 09/14/12 $337,000 $434,000 1,520 7 1995 Avg 6,512 N N 12907 NE 203RD CT
5 0 666241 0120 12/03/13 $380,000 $431,000 1,550 7 1977 Avg 9,600 N N 19536 129TH CT NE
5 0 666240 0105 10/30/14 $375,000 $383,000 1,580 7 2004 Avg 5,725 N N 13255 NE 184TH PL
5 0 802965 0010 09/17/13 $365,000 $424,000 1,600 7 1999 Avg 2,930 N N 18591 134TH PL NE
5 0 062210 0101 03/17/14 $335,000 $368,000 1,610 7 1972 Avg 21,300 N N 13503 NE 186TH ST
5 0 565100 0140 06/04/13 $385,000 $461,000 1,650 7 1987 Good 4,838 N N 20228 HOLLYHILLS DR NE
5 0 565101 0230 09/19/12 $300,000 $386,000 1,650 7 1989 Avg 4,045 N N 12727 NE 200TH PL
5 0 565101 0300 08/21/14 $370,000 $387,000 1,650 7 1988 Avg 4,859 N N 12701 NE 200TH PL

Improved Sales Used in This Annual Update Analysis
Area 038 -- 1 to 3 Unit Residences
Area 038 47
2015 Annual Update Department of Assessments
Sub Area Nghb Major Minor
Sale Date Sale Price
Adj Sale Price AGLA
Bldg Grade
Year Built/Ren Cond Lot Size View
Water- front Situs Address
5 0 802965 0040 05/19/14 $373,000 $402,000 1,670 7 1999 Avg 3,565 N N 18561 134TH PL NE
5 0 565101 0040 11/18/13 $345,000 $393,000 1,700 7 1988 Avg 5,451 N N 12812 NE 201ST PL
5 0 565100 0240 07/15/13 $370,000 $438,000 1,790 7 1987 Avg 4,000 N N 20101 HOLLYHILLS DR NE
5 0 565100 0250 11/19/12 $348,650 $441,000 1,830 7 1987 Avg 4,200 N N 20105 HOLLYHILLS DR NE
5 0 565101 0240 10/16/12 $322,500 $412,000 1,890 7 1988 Avg 3,600 N N 12723 NE 200TH PL
5 0 666241 0200 01/10/14 $465,000 $522,000 1,920 7 1977 VGood 10,550 N N 12911 NE 195TH PL
5 0 565101 0340 03/24/14 $399,900 $439,000 2,020 7 1988 Avg 4,065 N N 12712 NE 200TH PL
5 0 951710 0256 02/04/14 $435,200 $485,000 2,160 7 2001 Avg 11,002 N N 13406 NE 148TH PL
5 0 032605 9009 02/28/13 $379,000 $466,000 2,870 7 2001 Avg 109,502 N N 13645 NE 205TH ST
5 0 680460 0540 11/19/12 $380,000 $481,000 1,180 8 1980 Good 9,451 N N 18741 129TH CT NE
5 0 680460 0520 09/09/13 $352,000 $410,000 1,280 8 1981 Avg 10,095 N N 18734 129TH CT NE
5 0 666241 0020 02/17/12 $315,000 $428,000 1,340 8 1977 Avg 10,123 N N 19532 129TH PL NE
5 0 680460 0260 06/03/14 $420,000 $451,000 1,380 8 1981 Avg 9,600 N N 18223 129TH PL NE
5 0 680460 0290 10/14/14 $420,000 $431,000 1,440 8 1980 Avg 9,662 N N 18308 129TH AVE NE
5 0 424940 0300 05/29/13 $330,500 $397,000 1,480 8 1998 Avg 4,342 N N 13212 NE 201ST CT
5 0 680460 0490 03/04/13 $401,750 $494,000 1,500 8 1980 Avg 9,656 N N 18710 129TH CT NE
5 0 953200 0500 08/01/14 $415,000 $437,000 1,610 8 2010 Avg 3,600 N N 19722 128TH PL NE
5 0 680460 0900 05/28/13 $430,000 $516,000 1,840 8 1983 Good 9,699 N N 12829 NE 185TH CT
5 0 424940 0130 11/22/13 $405,000 $461,000 1,850 8 1998 Avg 6,170 N N 13011 NE 200TH PL
5 0 271750 0120 12/11/12 $390,000 $491,000 1,910 8 1993 Avg 9,319 N N 13006 NE 198TH PL
5 0 680460 0610 10/04/12 $320,000 $410,000 1,950 8 1983 Avg 9,651 N N 18800 129TH AVE NE
5 0 273860 0220 08/04/14 $451,000 $474,000 2,050 8 2005 Avg 4,876 N N 13624 NE 202ND ST
5 0 953200 0560 12/04/12 $409,950 $517,000 2,050 8 2013 Avg 3,600 N N 19729 129TH AVE NE
5 0 814150 0020 04/14/12 $385,000 $516,000 2,060 8 1988 Good 39,909 N N 13538 NE 188TH PL
5 0 953200 0430 06/18/12 $378,807 $499,000 2,080 8 2012 Avg 3,325 N N 12942 NE 198TH PL
5 0 953200 0120 02/23/12 $377,950 $513,000 2,090 8 2012 Avg 3,364 N N 12909 NE 197TH PL
5 0 953200 0460 05/01/13 $435,000 $526,000 2,090 8 2011 Avg 3,376 N N 12877 NE 198TH PL
5 0 953200 0530 04/30/12 $370,777 $495,000 2,090 8 2012 Avg 3,365 N N 12876 NE 197TH PL
5 0 680460 0990 11/24/14 $475,000 $481,000 2,160 8 1981 Avg 19,283 N N 18309 129TH AVE NE
5 0 273860 0130 11/07/13 $499,000 $571,000 2,170 8 2004 Avg 3,298 N N 20116 137TH AVE NE
5 0 952731 0110 08/26/14 $445,000 $465,000 2,180 8 2004 Avg 3,703 N N 20419 128TH PL NE

Improved Sales Used in This Annual Update Analysis
Area 038 -- 1 to 3 Unit Residences
Area 038 48
2015 Annual Update Department of Assessments
Sub Area Nghb Major Minor
Sale Date Sale Price
Adj Sale Price AGLA
Bldg Grade
Year Built/Ren Cond Lot Size View
Water- front Situs Address
5 0 952730 0200 08/25/14 $465,000 $486,000 2,190 8 2004 Avg 3,267 N N 12939 NE 203RD ST
5 0 273860 0140 05/02/14 $499,950 $542,000 2,190 8 2004 Avg 3,345 N N 20120 137TH AVE NE
5 0 953200 0040 11/05/13 $478,500 $548,000 2,190 8 2011 Avg 4,075 N N 12919 NE 198TH PL
5 0 952731 0010 10/18/12 $402,500 $514,000 2,200 8 2004 Avg 3,816 N N 12955 NE 204TH PL
5 0 952731 0200 09/12/12 $400,000 $516,000 2,200 8 2005 Avg 3,800 N N 12938 NE 204TH PL
5 0 273861 0110 11/26/12 $400,000 $505,000 2,200 8 2003 Avg 3,352 N N 13630 NE 203RD ST
5 0 953200 0030 05/01/12 $400,000 $534,000 2,200 8 2008 Avg 4,100 N N 12925 NE 198TH PL
5 0 953200 0130 04/12/12 $397,865 $534,000 2,210 8 2012 Avg 3,365 N N 12903 NE 197TH PL
5 0 953200 0440 07/06/12 $382,441 $502,000 2,210 8 2012 Avg 3,919 N N 12948 NE 198TH PL
5 0 953200 0470 07/10/12 $385,158 $505,000 2,210 8 2012 Avg 3,376 N N 12871 NE 198TH PL
5 0 953200 0510 07/20/12 $446,948 $584,000 2,210 8 2012 Avg 3,656 N N 12864 NE 197TH PL
5 0 953200 0520 04/12/12 $395,475 $530,000 2,210 8 2012 Avg 3,353 N N 12870 NE 197TH PL
5 0 273860 0060 10/09/12 $442,000 $566,000 2,240 8 2004 Avg 4,057 N N 20135 137TH AVE NE
5 0 273860 0080 08/15/14 $495,000 $519,000 2,240 8 2003 Avg 2,811 N N 20127 137TH AVE NE
5 0 142890 0080 10/15/12 $419,950 $536,000 2,250 8 2012 Avg 6,364 N N 19709 130TH AVE NE
5 0 020770 0010 08/17/12 $392,000 $509,000 2,260 8 2007 Avg 4,087 N N 12929 NE 200TH PL
5 0 020770 0100 10/29/12 $380,000 $484,000 2,260 8 2007 Avg 5,752 N N 12852 NE 200TH PL
5 0 182236 0010 02/06/12 $380,000 $518,000 2,270 8 2003 Avg 5,569 N N 13205 NE 202ND CT
5 0 247540 0110 03/21/13 $459,500 $562,000 2,280 8 2001 Avg 10,258 N N 18115 129TH PL NE
5 0 247540 0150 09/18/12 $390,000 $502,000 2,280 8 2002 Avg 6,067 N N 18121 129TH PL NE
5 0 273860 0110 12/03/13 $595,000 $675,000 2,290 8 2003 Avg 4,105 N N 20108 137TH AVE NE
5 0 273861 0080 08/09/12 $425,000 $553,000 2,320 8 2004 Avg 4,561 N N 13670 NE 203RD ST
5 0 680460 0720 08/01/14 $495,000 $521,000 2,350 8 1980 Avg 10,072 N N 18617 129TH AVE NE
5 0 803050 0010 05/28/14 $490,000 $527,000 2,360 8 2003 Avg 4,367 N N 12977 NE 201ST WAY
5 0 803050 0020 07/02/12 $415,000 $545,000 2,360 8 2003 Avg 4,000 N N 12971 NE 201ST WAY
5 0 042605 9055 10/03/14 $620,000 $639,000 2,410 8 2001 Avg 35,236 N N 18933 131ST AVE NE
5 0 020770 0170 03/06/12 $450,000 $609,000 2,430 8 2007 Avg 5,549 N N 12904 NE 200TH PL
5 0 952731 0020 09/05/13 $416,000 $485,000 2,440 8 2004 Avg 3,634 N N 12947 NE 204TH PL
5 0 952730 0030 12/02/13 $450,000 $511,000 2,450 8 2004 Avg 4,129 N N 12954 NE 203RD ST
5 0 952730 0080 02/17/12 $357,200 $486,000 2,450 8 2004 Avg 3,742 N N 12918 NE 203RD ST
5 0 020770 0130 10/29/13 $502,000 $576,000 2,450 8 2007 Avg 4,245 N N 12870 NE 200TH PL

Improved Sales Used in This Annual Update Analysis
Area 038 -- 1 to 3 Unit Residences
Area 038 49
2015 Annual Update Department of Assessments
Sub Area Nghb Major Minor
Sale Date Sale Price
Adj Sale Price AGLA
Bldg Grade
Year Built/Ren Cond Lot Size View
Water- front Situs Address
5 0 953200 0020 03/25/14 $550,000 $603,000 2,490 8 2009 Avg 4,100 N N 12935 NE 195TH PL
5 0 953200 0070 12/01/14 $536,000 $542,000 2,520 8 2009 Avg 4,831 N N 19730 129TH AVE NE
5 0 953200 0550 01/15/13 $470,000 $586,000 2,520 8 2011 Avg 3,600 N N 19723 129TH AVE NE
5 0 247540 0120 10/01/14 $450,000 $464,000 2,530 8 2001 Avg 8,116 N N 12911 NE 182ND PL
5 0 680460 0550 07/08/14 $439,000 $466,000 2,570 8 1980 Avg 9,503 N N 18731 129TH CT NE
5 0 814150 0050 09/19/12 $515,000 $662,000 2,570 8 1987 Good 50,965 N N 13516 NE 188TH PL
5 0 182236 0030 10/04/13 $542,000 $626,000 2,570 8 2003 Avg 6,001 N N 13235 NE 202ND CT
5 0 247540 0100 10/25/12 $520,000 $662,000 2,630 8 2002 Avg 8,264 N N 18109 129TH PL NE
5 0 142890 0033 11/19/14 $576,925 $585,000 2,630 8 2004 Avg 6,100 N N 12964 NE 201ST ST
5 0 142890 0124 12/03/12 $484,000 $610,000 2,710 8 2012 Avg 6,764 N N 19703 130TH AVE NE
5 0 182236 0080 12/11/14 $565,000 $569,000 2,730 8 2003 Avg 6,856 N N 13210 NE 202ND CT
5 0 952731 0240 08/01/14 $540,000 $568,000 2,760 8 2005 Avg 7,321 N N 12962 NE 204TH PL
5 0 142890 0125 07/25/12 $495,000 $646,000 2,850 8 2012 Avg 5,944 N N 12927 NE 129TH PL
5 0 142890 0126 07/26/12 $484,950 $633,000 2,850 8 2012 Avg 5,664 N N 12926 NE 197TH PL
5 0 785996 0210 08/25/13 $569,950 $667,000 3,000 8 2005 Avg 6,060 N N 13072 NE 186TH ST
5 0 953200 0080 08/09/12 $480,000 $624,000 3,060 8 2010 Avg 5,096 N N 12914 NE 197TH PL
5 0 020770 0050 10/15/14 $588,000 $604,000 3,110 8 2007 Avg 4,464 N N 12961 NE 200TH PL
5 0 144630 0050 05/29/14 $590,300 $634,000 1,790 9 1989 Good 8,115 N N 13031 NE 202ND PL
5 0 020035 0070 06/02/14 $559,900 $601,000 1,860 9 2004 Avg 5,569 N N 18960 131ST PL NE
5 0 020035 0070 07/16/12 $465,000 $609,000 1,860 9 2004 Avg 5,569 N N 18960 131ST PL NE
5 0 883535 0240 05/20/14 $530,000 $571,000 1,990 9 1992 Avg 8,249 N N 13002 NE 197TH PL
5 0 062210 0073 12/18/13 $604,750 $683,000 2,140 9 1980 Good 61,182 N N 13423 NE 193RD PL
5 0 273864 0430 08/20/12 $429,000 $556,000 2,200 9 2007 Avg 3,408 N N 20456 134TH AVE NE
5 0 273864 0360 03/23/12 $475,000 $640,000 2,420 9 2007 Avg 3,600 N N 20228 134TH AVE NE
5 0 144630 0170 08/07/13 $500,000 $588,000 2,450 9 1990 Avg 8,672 N N 20313 131ST CT NE
5 0 273865 0020 08/20/13 $529,000 $620,000 2,450 9 2008 Avg 4,160 N N 13580 NE 202ND ST
5 0 144630 0030 01/06/12 $454,000 $624,000 2,460 9 1990 Avg 7,275 N N 13019 NE 202ND PL
5 0 883535 0230 08/25/14 $530,000 $553,000 2,480 9 1992 Avg 7,480 N N 13008 NE 197TH PL
5 0 883535 0010 08/21/12 $380,000 $493,000 2,490 9 1991 Avg 7,248 N N 19621 130TH PL NE
5 0 144630 0020 05/31/14 $587,000 $630,000 2,550 9 1992 Avg 6,256 N N 13013 NE 202ND PL
5 0 883535 0260 07/27/12 $457,500 $597,000 2,570 9 1991 Avg 6,624 N N 13021 NE 197TH PL

Improved Sales Used in This Annual Update Analysis
Area 038 -- 1 to 3 Unit Residences
Area 038 50
2015 Annual Update Department of Assessments
Sub Area Nghb Major Minor
Sale Date Sale Price
Adj Sale Price AGLA
Bldg Grade
Year Built/Ren Cond Lot Size View
Water- front Situs Address
5 0 957815 0090 10/29/12 $508,000 $646,000 2,590 9 1999 Avg 6,792 N N 13185 NE 186TH PL
5 0 957815 0030 02/01/13 $481,500 $597,000 2,610 9 1999 Avg 5,078 N N 13125 NE 186TH PL
5 0 144630 0310 07/23/13 $513,950 $607,000 2,650 9 1989 Avg 7,258 N N 20223 131ST PL NE
5 0 144630 0390 06/26/12 $503,200 $662,000 2,670 9 1989 Good 13,235 N N 20231 130TH CT NE
5 0 144630 0390 04/04/12 $487,500 $655,000 2,670 9 1989 Good 13,235 N N 20231 130TH CT NE
5 0 273865 0070 07/10/13 $572,000 $678,000 2,740 9 2007 Avg 5,449 N N 13565 SE 202ND ST
5 0 273864 0090 08/22/13 $540,000 $632,000 2,760 9 2006 Avg 3,600 N N 20457 134TH AVE NE
5 0 273864 0130 06/20/13 $578,000 $689,000 2,760 9 2007 Avg 3,600 N N 20341 134TH AVE NE
5 0 273864 0170 07/26/13 $564,950 $667,000 2,760 9 2007 Avg 3,600 N N 20233 134TH AVE NE
5 0 042605 9071 10/07/13 $540,000 $624,000 2,790 9 2005 Avg 6,001 N N 18613 132ND AVE NE
5 0 273864 0370 05/29/13 $535,000 $642,000 2,820 9 2006 Avg 3,600 N N 20232 134TH AVE NE
5 0 730860 0070 12/10/14 $709,995 $715,000 2,860 9 2014 Avg 11,880 N N 20319 126TH AVE NE
5 0 883535 0150 07/11/12 $410,000 $537,000 2,970 9 1992 Avg 7,000 N N 19624 131ST PL NE
5 0 273864 0080 08/27/13 $555,000 $649,000 3,000 9 2006 Avg 3,600 N N 20461 134TH AVE NE
5 0 273864 0210 02/02/12 $485,000 $662,000 3,000 9 2008 Avg 3,600 N N 20117 134TH AVE NE
5 0 730860 0340 09/02/14 $769,995 $802,000 3,270 9 2013 Avg 9,794 N N 20408 126TH AVE NE
5 0 730860 0230 06/16/14 $740,000 $791,000 3,380 9 2014 Avg 9,803 N N 20206 126TH AVE NE
5 0 730860 0250 05/28/14 $739,995 $795,000 3,380 9 2014 Avg 9,781 N N 20218 126TH AVE NE
5 0 730860 0300 06/03/14 $749,995 $805,000 3,430 9 2014 Avg 9,724 N N 20326 126TH AVE NE
5 0 730860 0270 03/10/14 $782,995 $863,000 3,460 9 2014 Avg 9,758 N N 20306 126TH AVE NE
5 0 273864 0470 07/16/14 $623,300 $659,000 3,500 9 2007 Avg 4,524 N N 13423 NE 199TH PL
5 0 143753 0020 04/03/12 $575,000 $773,000 3,600 9 2005 Avg 8,471 N N 19415 132ND PL NE
5 0 062210 0074 11/10/14 $720,000 $733,000 1,640 10 1980 Avg 76,531 N N 13403 NE 193RD PL

Improved Sales Removed in This Annual Update Analysis
Area 038 -- 1 to 3 Unit Residences
Area 038 51
2015 Annual Update Department of Assessments
Sub Area Nghb Major Minor Sale Date Sale Price Comments
1 0 011410 0115 10/29/13 $259,000 IMP. CHARACTERISTICS CHANGED SINCE SALE
1 0 011410 0130 04/25/14 $366,000 NO MARKET EXPOSURE
1 0 011410 0221 10/14/14 $511,001 IMP. COUNT > 1; AUCTION SALE; EXEMPT FROM EXCISE TAX
1 0 011410 0225 05/15/12 $97,000 DOR RATIO; QUESTIONABLE PER APPRAISAL
1 0 011410 0243 09/13/13 $256,903 AUCTION SALE; FINANCIAL INSTITUTION RESALE; EXEMPT FROM EXCISE TAX
1 0 011410 0246 11/20/12 $262,032 BANKRUPTCY - RECEIVER OR TRUSTEE; GOV'T TO GOV'T; EXEMPT FROM EXCISE TAX
1 0 011410 0294 10/31/14 $419,228 AUCTION SALE; EXEMPT FROM EXCISE TAX
1 0 011410 0297 09/22/14 $400,000 SALE DATA DOES NOT MATCH ASSESSED VALUE
1 0 011410 0297 09/23/13 $390,000 SALE DATA DOES NOT MATCH ASSESSED VALUE
1 0 011410 0329 04/16/12 $55,000 DOR RATIO; PREVIOUS IMP. VALUE <= 25K; PARTIAL INT (1/3, 1/2, ETC.); QUIT CLAIM DEED
1 0 011410 0379 12/12/12 $157,500 DOR RATIO; BANKRUPTCY - RECEIVER OR TRUSTEE
1 0 011410 0515 09/21/12 $155,200 DOR RATIO
1 0 012604 9167 06/19/14 $380,000 OBSOLESCENCE; PREVIOUS IMP. VALUE <= 25K
1 0 029372 0250 06/07/12 $239,000 NON-REPRESENTATIVE SALE
1 0 177645 0020 04/10/12 $295,000 GOV'T TO NON-GOV'T; IMP. CHAR CHANGED SINCE SALE; FINANCIAL INSTITUTION RESALE
1 0 177645 0260 07/16/14 $451,500 RELOCATION - SALE BY SERVICE; SALE DATA DOES NOT MATCH ASSESSED VALUE
1 0 177645 0260 07/16/14 $449,000 RELOCATION - SALE TO SERVICE
1 0 255810 0120 03/21/13 $307,500 NO MARKET EXPOSURE; RELATED PARTY, FRIEND, OR NEIGHBOR
1 0 255816 0060 08/28/12 $182,755 DOR RATIO; FINANCIAL INSTITUTION RESALE; EXEMPT FROM EXCISE TAX
1 0 257060 0100 07/17/12 $163,000 DOR RATIO; GOV'T TO GOV'T; FINANCIAL INSTITUTION RESALE; EXEMPT FROM EXCISE TAX
1 0 257060 0280 06/04/14 $125,623 DOR RATIO; QUIT CLAIM DEED; RELATED PARTY, FRIEND, OR NEIGHBOR
1 0 313730 0010 08/03/12 $290,000 DIAGNOSTIC OUTLIER; MODEL DEVELOPMENT EXCLUSION
1 0 338440 0120 11/27/13 $463,000 RELOCATION - SALE TO SERVICE
1 0 381950 0020 12/17/13 $387,718 BANKRUPTCY - RECEIVER OR TRUSTEE; GOV'T TO GOV'T; EXEMPT FROM EXCISE TAX
1 0 381950 0065 10/28/14 $290,000 DIAGNOSTIC OUTLIER; OBSERVATION OUTSIDE THE NORM
1 0 382410 0030 12/27/12 $250,000 DIAGNOSTIC OUTLIER; NON-NORMAL DISTRIBUTION
1 0 382410 0082 08/22/14 $35,544 DOR RATIO; FINANCIAL INSTITUTION RESALE; EXEMPT FROM EXCISE TAX
1 0 382410 0135 06/20/12 $215,000 IMP. CHARACTERISTICS CHANGED SINCE SALE
1 0 382410 0140 10/17/12 $361,264 BANKRUPTCY - RECEIVER OR TRUSTEE; EXEMPT FROM EXCISE TAX
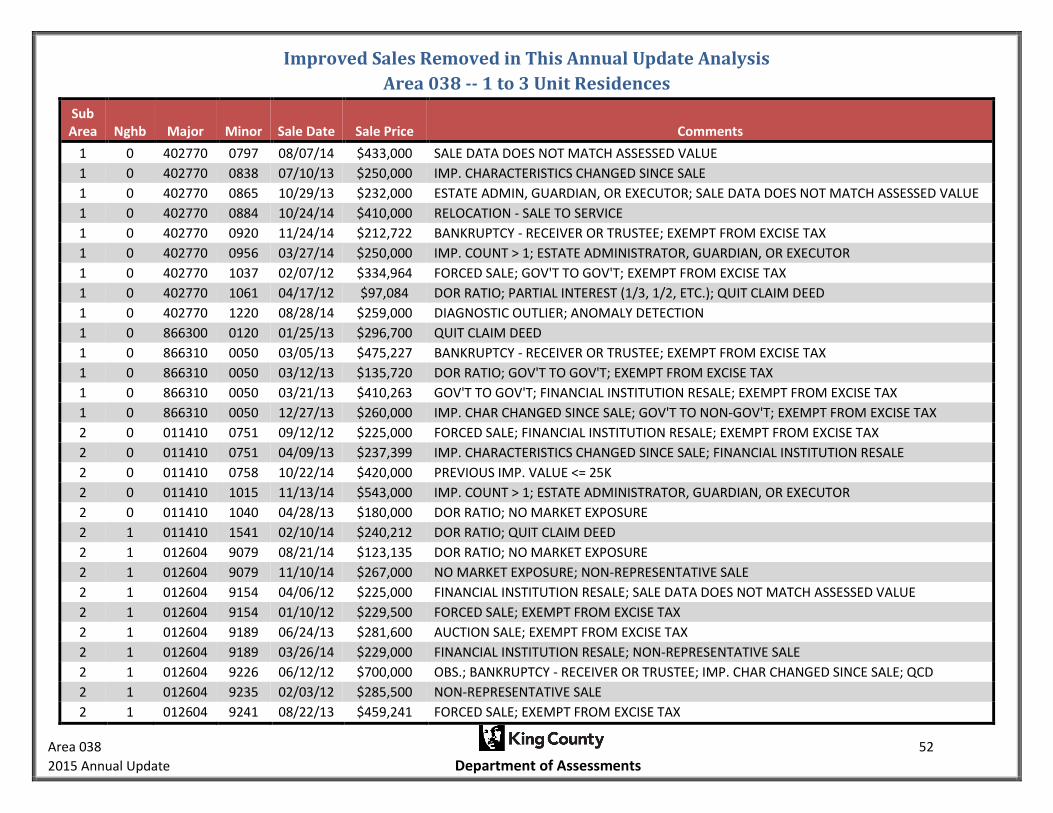
Improved Sales Removed in This Annual Update Analysis
Area 038 -- 1 to 3 Unit Residences
Area 038 52
2015 Annual Update Department of Assessments
Sub Area Nghb Major Minor Sale Date Sale Price Comments
1 0 402770 0797 08/07/14 $433,000 SALE DATA DOES NOT MATCH ASSESSED VALUE
1 0 402770 0838 07/10/13 $250,000 IMP. CHARACTERISTICS CHANGED SINCE SALE
1 0 402770 0865 10/29/13 $232,000 ESTATE ADMIN, GUARDIAN, OR EXECUTOR; SALE DATA DOES NOT MATCH ASSESSED VALUE
1 0 402770 0884 10/24/14 $410,000 RELOCATION - SALE TO SERVICE
1 0 402770 0920 11/24/14 $212,722 BANKRUPTCY - RECEIVER OR TRUSTEE; EXEMPT FROM EXCISE TAX
1 0 402770 0956 03/27/14 $250,000 IMP. COUNT > 1; ESTATE ADMINISTRATOR, GUARDIAN, OR EXECUTOR
1 0 402770 1037 02/07/12 $334,964 FORCED SALE; GOV'T TO GOV'T; EXEMPT FROM EXCISE TAX
1 0 402770 1061 04/17/12 $97,084 DOR RATIO; PARTIAL INTEREST (1/3, 1/2, ETC.); QUIT CLAIM DEED
1 0 402770 1220 08/28/14 $259,000 DIAGNOSTIC OUTLIER; ANOMALY DETECTION
1 0 866300 0120 01/25/13 $296,700 QUIT CLAIM DEED
1 0 866310 0050 03/05/13 $475,227 BANKRUPTCY - RECEIVER OR TRUSTEE; EXEMPT FROM EXCISE TAX
1 0 866310 0050 03/12/13 $135,720 DOR RATIO; GOV'T TO GOV'T; EXEMPT FROM EXCISE TAX
1 0 866310 0050 03/21/13 $410,263 GOV'T TO GOV'T; FINANCIAL INSTITUTION RESALE; EXEMPT FROM EXCISE TAX
1 0 866310 0050 12/27/13 $260,000 IMP. CHAR CHANGED SINCE SALE; GOV'T TO NON-GOV'T; EXEMPT FROM EXCISE TAX
2 0 011410 0751 09/12/12 $225,000 FORCED SALE; FINANCIAL INSTITUTION RESALE; EXEMPT FROM EXCISE TAX
2 0 011410 0751 04/09/13 $237,399 IMP. CHARACTERISTICS CHANGED SINCE SALE; FINANCIAL INSTITUTION RESALE
2 0 011410 0758 10/22/14 $420,000 PREVIOUS IMP. VALUE <= 25K
2 0 011410 1015 11/13/14 $543,000 IMP. COUNT > 1; ESTATE ADMINISTRATOR, GUARDIAN, OR EXECUTOR
2 0 011410 1040 04/28/13 $180,000 DOR RATIO; NO MARKET EXPOSURE
2 1 011410 1541 02/10/14 $240,212 DOR RATIO; QUIT CLAIM DEED
2 1 012604 9079 08/21/14 $123,135 DOR RATIO; NO MARKET EXPOSURE
2 1 012604 9079 11/10/14 $267,000 NO MARKET EXPOSURE; NON-REPRESENTATIVE SALE
2 1 012604 9154 04/06/12 $225,000 FINANCIAL INSTITUTION RESALE; SALE DATA DOES NOT MATCH ASSESSED VALUE
2 1 012604 9154 01/10/12 $229,500 FORCED SALE; EXEMPT FROM EXCISE TAX
2 1 012604 9189 06/24/13 $281,600 AUCTION SALE; EXEMPT FROM EXCISE TAX
2 1 012604 9189 03/26/14 $229,000 FINANCIAL INSTITUTION RESALE; NON-REPRESENTATIVE SALE
2 1 012604 9226 06/12/12 $700,000 OBS.; BANKRUPTCY - RECEIVER OR TRUSTEE; IMP. CHAR CHANGED SINCE SALE; QCD
2 1 012604 9235 02/03/12 $285,500 NON-REPRESENTATIVE SALE
2 1 012604 9241 08/22/13 $459,241 FORCED SALE; EXEMPT FROM EXCISE TAX

Improved Sales Removed in This Annual Update Analysis
Area 038 -- 1 to 3 Unit Residences
Area 038 53
2015 Annual Update Department of Assessments
Sub Area Nghb Major Minor Sale Date Sale Price Comments
2 1 029373 0060 10/29/13 $513,000 RELOCATION - SALE TO SERVICE
2 1 062605 9080 11/28/12 $230,000 RELATED PARTY, FRIEND, OR NEIGHBOR; ESTATE ADM, GUARDIAN, OR EXECUTOR
2 1 062605 9098 11/12/14 $25,000 DOR RATIO; EASEMENT OR RIGHT-OF-WAY; ESTATE ADM, GUARDIAN, OR EXECUTOR
2 1 072605 9119 10/06/14 $615,000 PREVIOUS IMP. VALUE <= 25K
2 1 072605 9148 05/21/12 $275,000 DIAGNOSTIC OUTLIER; MODEL DEVELOPMENT EXCLUSION
2 1 072605 9177 10/09/13 $257,700 SHORT SALE; QUESTIONABLE PER APPRAISAL
2 1 072605 9275 07/11/12 $332,770 ESTATE ADMINISTRATOR, GUARDIAN, OR EXECUTOR; SEGREGATION AND/OR MERGER
2 1 072605 9282 10/02/14 $665,000 PERCENT COMPLETE; BUILDER OR DEVELOPER SALES
2 1 072605 9294 08/28/13 $140,000 NO MARKET EXPOSURE; NON-REPRESENTATIVE SALE
2 1 072605 9483 11/21/14 $660,000 PERCENT COMPLETE
2 1 076500 0040 04/17/13 $213,532 BANKRUPTCY - RECEIVER OR TRUSTEE; EXEMPT FROM EXCISE TAX
2 1 096800 0010 09/25/12 $235,000 SHORT SALE; NON-REPRESENTATIVE SALE
2 1 096800 0020 12/24/13 $297,784 CORRECTION DEED; GOV'T TO GOV'T; EXEMPT FROM EXCISE TAX
2 1 096800 0020 09/05/13 $297,784 GOV'T TO GOV'T; EXEMPT FROM EXCISE TAX
2 1 108865 0170 09/14/14 $469,000 RELOCATION - SALE TO SERVICE
2 1 108865 0340 07/19/12 $320,000 NON-REPRESENTATIVE SALE
2 1 108865 0390 11/13/12 $378,000 RELOCATION - SALE TO SERVICE
2 0 326110 0030 08/19/14 $250,000 NO MARKET EXPOSURE; NON-REPRESENTATIVE SALE
2 0 381840 0090 11/20/12 $361,250 BANKRUPTCY - RECEIVER OR TRUSTEE; EXEMPT FROM EXCISE TAX
2 0 381975 0020 12/26/13 $270,001 BANKRUPTCY - RECEIVER OR TRUSTEE; EXEMPT FROM EXCISE TAX
2 0 381975 0050 04/23/14 $390,000 ESTATE ADM, GUARDIAN, OR EXECUTOR; SALE DATA DOES NOT MATCH ASSESSED VALUE
2 1 418830 0140 01/30/12 $592,000 DIAGNOSTIC OUTLIER; OBSERVATION OUTSIDE THE NORM
2 1 439850 0085 01/24/12 $200,000 NON-REPRESENTATIVE SALE
2 1 544000 0060 05/22/12 $785,000 DIAGNOSTIC OUTLIER; NON-NORMAL DISTRIBUTION
2 0 660140 0030 07/19/12 $258,932 FORCED SALE; GOV'T TO GOV'T; EXEMPT FROM EXCISE TAX
2 1 770201 0060 01/09/12 $330,500 FINANCIAL INSTITUTION RESALE; NON-REPRESENTATIVE SALE
2 1 809660 0100 06/27/13 $212,500 DOR RATIO
2 1 856495 0330 03/28/12 $315,500 IMP. CHARACTERISTICS CHANGED SINCE SALE; SHORT SALE
2 1 856495 0590 04/20/12 $316,000 NON-REPRESENTATIVE SALE
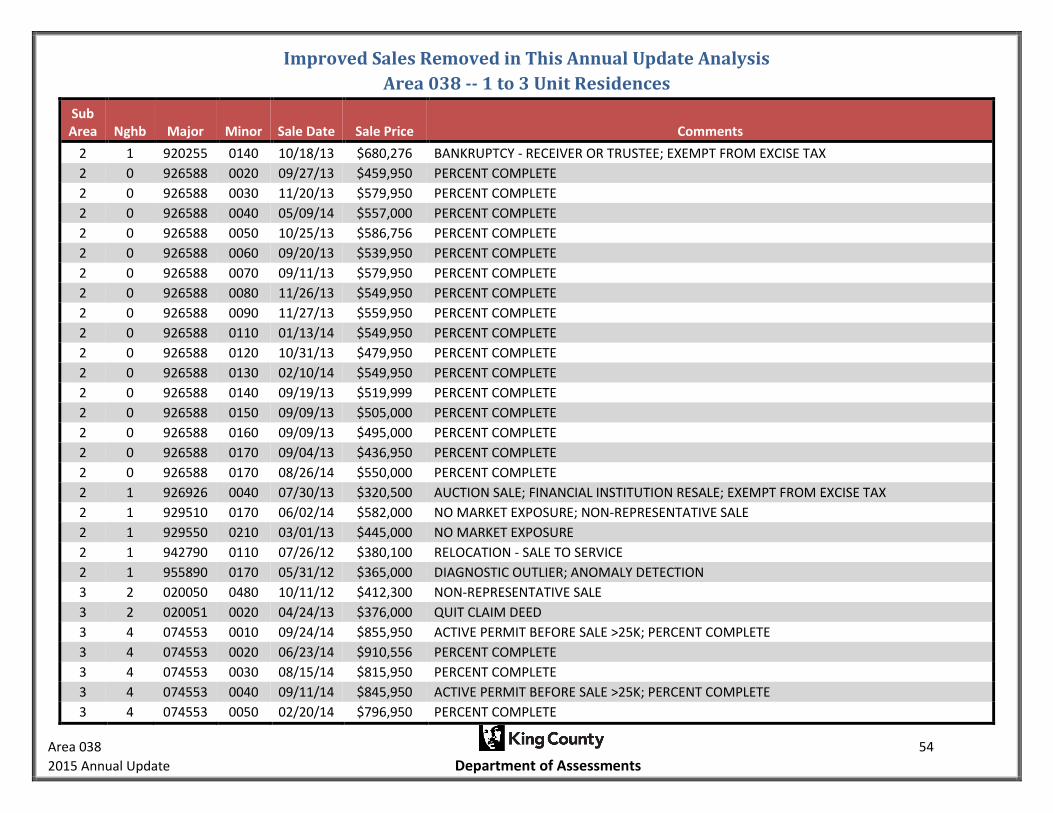
Improved Sales Removed in This Annual Update Analysis
Area 038 -- 1 to 3 Unit Residences
Area 038 54
2015 Annual Update Department of Assessments
Sub Area Nghb Major Minor Sale Date Sale Price Comments
2 1 920255 0140 10/18/13 $680,276 BANKRUPTCY - RECEIVER OR TRUSTEE; EXEMPT FROM EXCISE TAX
2 0 926588 0020 09/27/13 $459,950 PERCENT COMPLETE
2 0 926588 0030 11/20/13 $579,950 PERCENT COMPLETE
2 0 926588 0040 05/09/14 $557,000 PERCENT COMPLETE
2 0 926588 0050 10/25/13 $586,756 PERCENT COMPLETE
2 0 926588 0060 09/20/13 $539,950 PERCENT COMPLETE
2 0 926588 0070 09/11/13 $579,950 PERCENT COMPLETE
2 0 926588 0080 11/26/13 $549,950 PERCENT COMPLETE
2 0 926588 0090 11/27/13 $559,950 PERCENT COMPLETE
2 0 926588 0110 01/13/14 $549,950 PERCENT COMPLETE
2 0 926588 0120 10/31/13 $479,950 PERCENT COMPLETE
2 0 926588 0130 02/10/14 $549,950 PERCENT COMPLETE
2 0 926588 0140 09/19/13 $519,999 PERCENT COMPLETE
2 0 926588 0150 09/09/13 $505,000 PERCENT COMPLETE
2 0 926588 0160 09/09/13 $495,000 PERCENT COMPLETE
2 0 926588 0170 09/04/13 $436,950 PERCENT COMPLETE
2 0 926588 0170 08/26/14 $550,000 PERCENT COMPLETE
2 1 926926 0040 07/30/13 $320,500 AUCTION SALE; FINANCIAL INSTITUTION RESALE; EXEMPT FROM EXCISE TAX
2 1 929510 0170 06/02/14 $582,000 NO MARKET EXPOSURE; NON-REPRESENTATIVE SALE
2 1 929550 0210 03/01/13 $445,000 NO MARKET EXPOSURE
2 1 942790 0110 07/26/12 $380,100 RELOCATION - SALE TO SERVICE
2 1 955890 0170 05/31/12 $365,000 DIAGNOSTIC OUTLIER; ANOMALY DETECTION
3 2 020050 0480 10/11/12 $412,300 NON-REPRESENTATIVE SALE
3 2 020051 0020 04/24/13 $376,000 QUIT CLAIM DEED
3 4 074553 0010 09/24/14 $855,950 ACTIVE PERMIT BEFORE SALE >25K; PERCENT COMPLETE
3 4 074553 0020 06/23/14 $910,556 PERCENT COMPLETE
3 4 074553 0030 08/15/14 $815,950 PERCENT COMPLETE
3 4 074553 0040 09/11/14 $845,950 ACTIVE PERMIT BEFORE SALE >25K; PERCENT COMPLETE
3 4 074553 0050 02/20/14 $796,950 PERCENT COMPLETE

Improved Sales Removed in This Annual Update Analysis
Area 038 -- 1 to 3 Unit Residences
Area 038 55
2015 Annual Update Department of Assessments
Sub Area Nghb Major Minor Sale Date Sale Price Comments
3 4 074553 0060 05/16/14 $795,950 PERCENT COMPLETE
3 4 074553 0070 07/16/13 $704,950 PERCENT COMPLETE
3 4 074553 0100 10/10/13 $761,950 PERCENT COMPLETE
3 4 074553 0110 01/24/14 $711,950 PERCENT COMPLETE
3 4 074553 0120 05/08/14 $815,000 PERCENT COMPLETE
3 4 074553 0130 04/29/14 $809,950 PERCENT COMPLETE
3 4 074553 0150 01/08/14 $785,950 PERCENT COMPLETE
3 4 074553 0160 10/11/13 $808,148 PERCENT COMPLETE
3 4 074553 0170 09/17/13 $759,950 PERCENT COMPLETE
3 4 074553 0180 08/27/13 $810,950 PERCENT COMPLETE
3 4 074553 0190 02/12/14 $855,759 PERCENT COMPLETE
3 4 074553 0200 09/24/14 $922,532 ACTIVE PERMIT BEFORE SALE >25K; PERCENT COMPLETE
3 4 074553 0210 10/10/14 $875,950 ACTIVE PERMIT BEFORE SALE >25K; PERCENT COMPLETE
3 4 074553 0240 12/26/14 $865,950 ACTIVE PERMIT BEFORE SALE >25K; PERCENT COMPLETE
3 4 074553 0250 06/23/14 $775,950 PERCENT COMPLETE
3 4 074553 0300 12/17/13 $730,950 PERCENT COMPLETE
3 4 074553 0310 09/24/14 $917,983 PERCENT COMPLETE
3 4 074553 0320 07/02/14 $867,302 PERCENT COMPLETE
3 4 074553 0330 06/23/14 $824,950 PERCENT COMPLETE
3 4 074553 0350 08/15/14 $932,989 PERCENT COMPLETE
3 4 074553 0360 02/20/14 $839,950 PERCENT COMPLETE
3 4 074553 0370 04/03/14 $817,950 PERCENT COMPLETE
3 4 074553 0380 12/13/13 $817,416 PERCENT COMPLETE
3 4 074553 0390 08/08/13 $745,950 PERCENT COMPLETE
3 4 074553 0440 05/01/14 $814,950 PERCENT COMPLETE
3 4 074553 0450 11/18/13 $740,950 PERCENT COMPLETE
3 4 074553 0460 01/08/14 $780,950 PERCENT COMPLETE
3 4 074553 0470 11/18/13 $740,950 PERCENT COMPLETE
3 4 074553 0480 11/18/13 $709,950 PERCENT COMPLETE

Improved Sales Removed in This Annual Update Analysis
Area 038 -- 1 to 3 Unit Residences
Area 038 56
2015 Annual Update Department of Assessments
Sub Area Nghb Major Minor Sale Date Sale Price Comments
3 0 082605 9041 05/29/13 $280,000 NO MARKET EXPOSURE; RELATED PARTY, FRIEND, OR NEIGHBOR; TEAR DOWN
3 0 082605 9053 06/19/13 $300,000 IMP. CHARACTERISTICS CHANGED SINCE SALE
3 0 096110 0077 05/29/13 $311,941 BANKRUPTCY - RECEIVER OR TRUSTEE; GOV'T TO GOV'T; EXEMPT FROM EXCISE TAX
3 0 096110 0105 09/24/12 $267,000 PREVIOUS IMP. VALUE <= 25K
3 4 108880 0290 02/11/14 $554,750 CORRECTION DEED; FINANCIAL INSTITUTION RESALE; EXEMPT FROM EXCISE TAX
3 4 108880 0290 10/02/13 $551,140 FINANCIAL INSTITUTION RESALE; EXEMPT FROM EXCISE TAX; NON-REPRESENTATIVE SALE
3 4 108880 0290 02/11/14 $554,750 FINANCIAL INSTITUTION RESALE; NON-REPRESENTATIVE SALE
3 4 108880 0360 06/01/12 $420,199 OBSOLESCENCE
3 4 108880 0660 02/17/12 $535,000 RELOCATION - SALE TO SERVICE
3 4 108880 0770 06/06/14 $275,440 DOR RATIO; QUIT CLAIM DEED; RELATED PARTY, FRIEND, OR NEIGHBOR
3 4 108881 0070 12/10/13 $507,269 BANKRUPTCY - RECEIVER OR TRUSTEE; EXEMPT FROM EXCISE TAX
3 4 108881 0070 04/03/14 $384,825 QUIT CLAIM DEED; FINANCIAL INSTITUTION RESALE
3 4 108881 0240 04/18/12 $555,840 DIAGNOSTIC OUTLIER; MODEL DEVELOPMENT EXCLUSION
3 3 172605 9023 10/16/12 $20,000 DOR RATIO; QUIT CLAIM DEED; SEGREGATION AND/OR MERGER
3 0 172605 9053 09/16/14 $270,000 OBSOLESCENCE; PREVIOUS IMP. VALUE <= 25K
3 3 172605 9136 10/29/12 $1,100,000 DIAGNOSTIC OUTLIER; OBSERVATION OUTSIDE THE NORM
3 2 182605 9005 02/19/12 $750,000 SEGREGATION AND/OR MERGER
3 0 182605 9042 09/18/13 $257,250 FINANCIAL INSTITUTION RESALE; NO MARKET EXPOSURE
3 0 320490 0040 12/26/12 $300,000 DOR RATIO; FINANCIAL INSTITUTION RESALE
3 4 345800 0010 03/27/14 $815,000 PERCENT COMPLETE
3 4 345800 0020 01/28/14 $703,990 PERCENT COMPLETE
3 4 345800 0040 01/16/14 $835,000 PERCENT COMPLETE
3 4 345800 0050 02/28/14 $772,641 PERCENT COMPLETE
3 4 345800 0070 02/28/14 $769,990 PERCENT COMPLETE
3 4 345800 0100 12/17/13 $769,990 PERCENT COMPLETE
3 4 345800 0110 11/05/13 $784,990 PERCENT COMPLETE
3 4 345800 0140 08/05/13 $759,990 PERCENT COMPLETE
3 4 345800 0250 02/28/14 $769,990 PERCENT COMPLETE
3 4 345800 0270 11/25/13 $812,906 PERCENT COMPLETE

Improved Sales Removed in This Annual Update Analysis
Area 038 -- 1 to 3 Unit Residences
Area 038 57
2015 Annual Update Department of Assessments
Sub Area Nghb Major Minor Sale Date Sale Price Comments
3 4 345800 0280 11/20/13 $769,990 PERCENT COMPLETE
3 4 345800 0290 01/13/14 $760,000 PERCENT COMPLETE
3 2 357860 0178 08/13/12 $257,500 DOR RATIO
3 2 357860 0178 01/23/12 $283,500 FORCED SALE; IMP. CHARACTERISTICS CHANGED SINCE SALE; EXEMPT FROM EXCISE TAX
3 0 417860 0080 04/10/13 $737,000 DIAGNOSTIC OUTLIER; NON-NORMAL DISTRIBUTION
3 0 417860 0100 07/21/14 $650,000 SALE DATA DOES NOT MATCH ASSESSED VALUE
3 2 563050 0005 11/20/14 $262,500 DIAGNOSTIC OUTLIER; ANOMALY DETECTION
3 2 563450 0370 07/25/14 $457,500 BUILDER OR DEVELOPER SALES;
3 2 563450 0392 09/28/12 $420,000 OBSOLESCENCE
3 0 620405 0070 11/13/13 $520,000 FORCED SALE; EXEMPT FROM EXCISE TAX
3 0 620405 0070 04/04/14 $300,000 NO MARKET EXPOSURE; FINANCIAL INSTITUTION RESALE
3 3 620420 0050 04/09/12 $345,000 IMP. CHARACTERISTICS CHANGED SINCE SALE
3 0 734050 0140 04/16/13 $435,489 BANKRUPTCY - RECEIVER OR TRUSTEE; EXEMPT FROM EXCISE TAX
3 0 734050 0280 06/27/12 $510,000 RELOCATION - SALE TO SERVICE
3 0 885410 0060 02/12/14 $473,000 BANKRUPTCY - RECEIVER OR TRUSTEE
3 0 885410 0130 09/11/14 $600,000 SALE DATA DOES NOT MATCH ASSESSED VALUE
4 0 034850 0010 09/07/12 $165,000 SHORT SALE; NON-REPRESENTATIVE SALE
4 0 052605 9111 02/12/13 $219,500 IMP. CHAR CHANGED SINCE SALE; NO MARKET EXPOSURE; CORPORATE AFFILIATES
4 0 052605 9111 12/20/13 $415,500 NO MARKET EXPOSURE; RELATED PARTY, FRIEND, OR NEIGHBOR
4 0 052605 9113 01/24/12 $500,000 OBS; PREV IMP. VALUE <= 25K; NO MARKET EXP; SEG AND/OR MERGER; CORP AFFILIATES
4 0 052605 9113 04/23/13 $1,210,000 OBS; PREV IMP. VALUE <= 25K; NO MARKET EXP; SEG AND/OR MERGER; CORP AFFILIATES
4 0 052605 9171 12/19/13 $345,000 NO MARKET EXPOSURE; RELATED PARTY, FRIEND OR NEIGHBOR
4 0 052605 9183 05/01/12 $260,000 IMP. CHARACTERISTICS CHANGED SINCE SALE
4 0 052605 9183 08/01/14 $405,000 SALE DATA DOES NOT MATCH ASSESSED VALUE
4 0 052605 9216 02/23/12 $198,404 DIAGNOSTIC OUTLIER; MODEL DEVELOPMENT EXCLUSION
4 0 052605 9224 09/23/14 $260,000 OBSOLESCENCE
4 0 052605 9230 09/18/12 $200,000 NO MARKET EXPOSURE; NON-REPRESENTATIVE SALE
4 0 052605 9285 02/28/14 $221,250 RELATED PARTY, FRIEND, OR NEIGHBOR
4 0 052605 9296 12/05/12 $305,667 IMP. CHARACTERISTICS CHANGED SINCE SALE; SHORT SALE; EXEMPT FROM EXCISE TAX
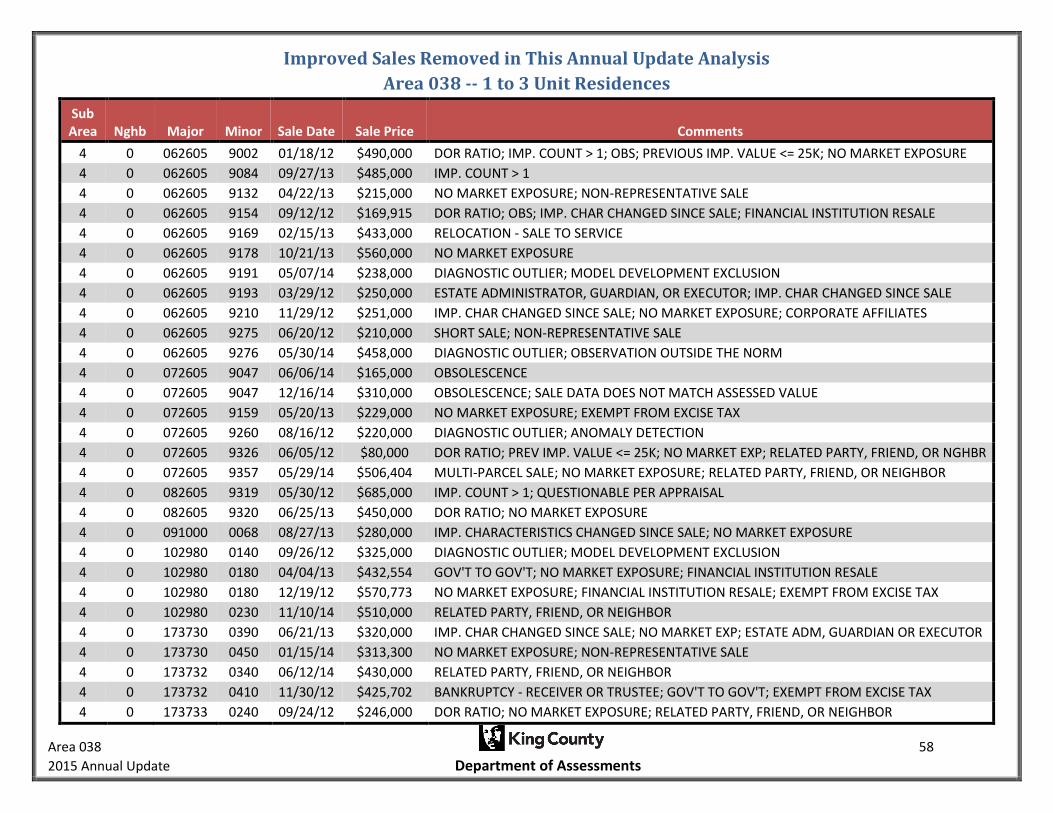
Improved Sales Removed in This Annual Update Analysis
Area 038 -- 1 to 3 Unit Residences
Area 038 58
2015 Annual Update Department of Assessments
Sub Area Nghb Major Minor Sale Date Sale Price Comments
4 0 062605 9002 01/18/12 $490,000 DOR RATIO; IMP. COUNT > 1; OBS; PREVIOUS IMP. VALUE <= 25K; NO MARKET EXPOSURE
4 0 062605 9084 09/27/13 $485,000 IMP. COUNT > 1
4 0 062605 9132 04/22/13 $215,000 NO MARKET EXPOSURE; NON-REPRESENTATIVE SALE
4 0 062605 9154 09/12/12 $169,915 DOR RATIO; OBS; IMP. CHAR CHANGED SINCE SALE; FINANCIAL INSTITUTION RESALE
4 0 062605 9169 02/15/13 $433,000 RELOCATION - SALE TO SERVICE
4 0 062605 9178 10/21/13 $560,000 NO MARKET EXPOSURE
4 0 062605 9191 05/07/14 $238,000 DIAGNOSTIC OUTLIER; MODEL DEVELOPMENT EXCLUSION
4 0 062605 9193 03/29/12 $250,000 ESTATE ADMINISTRATOR, GUARDIAN, OR EXECUTOR; IMP. CHAR CHANGED SINCE SALE
4 0 062605 9210 11/29/12 $251,000 IMP. CHAR CHANGED SINCE SALE; NO MARKET EXPOSURE; CORPORATE AFFILIATES
4 0 062605 9275 06/20/12 $210,000 SHORT SALE; NON-REPRESENTATIVE SALE
4 0 062605 9276 05/30/14 $458,000 DIAGNOSTIC OUTLIER; OBSERVATION OUTSIDE THE NORM
4 0 072605 9047 06/06/14 $165,000 OBSOLESCENCE
4 0 072605 9047 12/16/14 $310,000 OBSOLESCENCE; SALE DATA DOES NOT MATCH ASSESSED VALUE
4 0 072605 9159 05/20/13 $229,000 NO MARKET EXPOSURE; EXEMPT FROM EXCISE TAX
4 0 072605 9260 08/16/12 $220,000 DIAGNOSTIC OUTLIER; ANOMALY DETECTION
4 0 072605 9326 06/05/12 $80,000 DOR RATIO; PREV IMP. VALUE <= 25K; NO MARKET EXP; RELATED PARTY, FRIEND, OR NGHBR
4 0 072605 9357 05/29/14 $506,404 MULTI-PARCEL SALE; NO MARKET EXPOSURE; RELATED PARTY, FRIEND, OR NEIGHBOR
4 0 082605 9319 05/30/12 $685,000 IMP. COUNT > 1; QUESTIONABLE PER APPRAISAL
4 0 082605 9320 06/25/13 $450,000 DOR RATIO; NO MARKET EXPOSURE
4 0 091000 0068 08/27/13 $280,000 IMP. CHARACTERISTICS CHANGED SINCE SALE; NO MARKET EXPOSURE
4 0 102980 0140 09/26/12 $325,000 DIAGNOSTIC OUTLIER; MODEL DEVELOPMENT EXCLUSION
4 0 102980 0180 04/04/13 $432,554 GOV'T TO GOV'T; NO MARKET EXPOSURE; FINANCIAL INSTITUTION RESALE
4 0 102980 0180 12/19/12 $570,773 NO MARKET EXPOSURE; FINANCIAL INSTITUTION RESALE; EXEMPT FROM EXCISE TAX
4 0 102980 0230 11/10/14 $510,000 RELATED PARTY, FRIEND, OR NEIGHBOR
4 0 173730 0390 06/21/13 $320,000 IMP. CHAR CHANGED SINCE SALE; NO MARKET EXP; ESTATE ADM, GUARDIAN OR EXECUTOR
4 0 173730 0450 01/15/14 $313,300 NO MARKET EXPOSURE; NON-REPRESENTATIVE SALE
4 0 173732 0340 06/12/14 $430,000 RELATED PARTY, FRIEND, OR NEIGHBOR
4 0 173732 0410 11/30/12 $425,702 BANKRUPTCY - RECEIVER OR TRUSTEE; GOV'T TO GOV'T; EXEMPT FROM EXCISE TAX
4 0 173733 0240 09/24/12 $246,000 DOR RATIO; NO MARKET EXPOSURE; RELATED PARTY, FRIEND, OR NEIGHBOR

Improved Sales Removed in This Annual Update Analysis
Area 038 -- 1 to 3 Unit Residences
Area 038 59
2015 Annual Update Department of Assessments
Sub Area Nghb Major Minor Sale Date Sale Price Comments
4 0 206180 0050 07/10/12 $449,000 IMP. CHARACTERISTICS CHANGED SINCE SALE
4 0 206190 0100 08/12/14 $127,450 DOR RATIO; PARTIAL INTEREST (1/3, 1/2, ETC.); QCD; RELATED PARTY, FRIEND, OR NGHBR
4 0 255750 0030 01/16/14 $187,000 NO MARKET EXPOSURE; SALE DATA DOES NOT MATCH ASSESSED VALUE
4 0 280680 0340 08/09/12 $198,500 NO MARKET EXPOSURE; IMP. CHARACTERISTICS CHANGED SINCE SALE
4 0 339505 0070 11/02/12 $380,000 DIAGNOSTIC OUTLIER; NON-NORMAL DISTRIBUTION
4 0 377530 0020 09/14/12 $176,001 DOR RATIO; FORCED SALE; NO MARKET EXPOSURE; EXEMPT FROM EXCISE TAX
4 0 379800 0110 08/04/13 $425,000 IMP. CHARACTERISTICS CHANGED SINCE SALE
4 0 379800 0165 10/17/14 $280,000 IMP. CHARACTERISTICS CHANGED SINCE SALE
4 0 525510 0080 06/18/14 $405,000 AFFORDABLE HOUSING SALES
4 0 525540 0160 06/18/12 $260,000 IMP. CHARACTERISTICS CHANGED SINCE SALE; SHORT SALE
4 0 525570 0130 03/20/12 $374,850 NO MARKET EXPOSURE; NON-REPRESENTATIVE SALE
4 0 525571 0110 03/27/12 $249,000 IMP. CHARACTERISTICS CHANGED SINCE SALE; FINANCIAL INSTITUTION RESALE
4 0 525680 0080 02/12/14 $310,000 DIAGNOSTIC OUTLIER; ANOMALY DETECTION
4 0 525700 0100 02/03/12 $235,000 DOR RATIO
4 0 551880 0010 03/03/13 $140,000 DOR RATIO; IMP. CHARACTERISTICS CHANGED SINCE SALE; NO MARKET EXPOSURE
4 0 551960 0060 10/02/12 $210,000 IMP. CHARACTERISTICS CHANGED SINCE SALE
4 0 572000 0030 11/13/12 $240,000 DIAGNOSTIC OUTLIER; MODEL DEVELOPMENT EXCLUSION
4 0 572000 0030 01/23/12 $360,889 FORCED SALE; NO MARKET EXPOSURE; EXEMPT FROM EXCISE TAX
4 0 572000 0030 09/18/12 $321,790 GOV'T TO GOV'T; NO MARKET EXPOSURE; FINANCIAL INSTITUTION RESALE
4 0 572000 0280 03/22/13 $235,000 NO MARKET EXPOSURE; RELATED PARTY, FRIEND, OR NEIGHBOR
4 0 572000 0310 06/25/14 $317,120 BANKRUPTCY - RECEIVER OR TRUSTEE; EXEMPT FROM EXCISE TAX
4 0 572000 0320 02/23/12 $170,000 IMP. CHARACTERISTICS CHANGED SINCE SALE
4 0 572000 0370 03/26/12 $215,000 IMP. CHARACTERISTICS CHANGED SINCE SALE
4 0 572000 0490 05/24/12 $381,793 GOV'T TO GOV'T; NO MARKET EXPOSURE; FINANCIAL INSTITUTION RESALE
4 0 605760 0095 04/13/12 $152,000 NO MARKET EXPOSURE; NON-REPRESENTATIVE SALE
4 0 613761 0540 08/27/14 $490,000 DIAGNOSTIC OUTLIER; OBSERVATION OUTSIDE THE NORM
4 0 613761 0620 08/08/14 $500,000 DIAGNOSTIC OUTLIER; ANOMALY DETECTION
4 0 613761 0620 11/21/13 $280,000 DOR RATIO; NO MARKET EXPOSURE
4 0 635890 0060 12/15/14 $86,736 DOR RATIO; QUIT CLAIM DEED; RELATED PARTY, FRIEND, OR NEIGHBOR

Improved Sales Removed in This Annual Update Analysis
Area 038 -- 1 to 3 Unit Residences
Area 038 60
2015 Annual Update Department of Assessments
Sub Area Nghb Major Minor Sale Date Sale Price Comments
4 0 635890 0120 01/11/12 $408,000 IMP. COUNT > 1
4 0 635990 0111 11/01/13 $266,712 IMP. CHARACTERISTICS CHANGED SINCE SALE
4 0 635990 0143 07/21/12 $410,000 OBSOLESCENCE
4 0 744650 0020 07/13/12 $444,925 OBSOLESCENCE
4 0 744650 0030 01/03/12 $474,000 OBSOLESCENCE
4 0 744650 0060 01/23/12 $425,000 OBSOLESCENCE
4 0 769780 0030 05/12/14 $49,394 DOR RATIO; BANKRUPTCY - RECEIVER OR TRUSTEE; EXEMPT FROM EXCISE TAX
4 0 809730 0010 03/04/14 $319,950 RELOCATION - SALE TO SERVICE
4 0 812530 0090 08/08/14 $385,000 ESTATE ADMINISTRATOR, GUARDIAN, OR EXECUTOR; NO MARKET EXPOSURE
4 0 928682 0040 03/08/12 $275,000 SHORT SALE; NON-REPRESENTATIVE SALE
4 0 956780 0040 07/02/13 $255,000 PREVIOUS IMP. VALUE <= 25K
4 0 956780 0195 05/30/13 $200,000 PERCENT NET CONDITION; NO MARKET EXPOSURE
4 0 956780 0400 06/19/13 $244,000 OBSOLESCENCE; NO MARKET EXPOSURE
4 0 956780 0446 07/16/13 $480,000 IMP. CHARACTERISTICS CHANGED SINCE SALE
4 0 956880 0005 06/29/12 $212,000 IMP. CHAR CHANGED SINCE SALE; NO MARKET EXP; RELATED PARTY, FRIEND, OR NGHBR
4 0 956880 0135 05/14/13 $326,961 BANKRUPTCY - RECEIVER OR TRUSTEE; EXEMPT FROM EXCISE TAX
4 0 956880 0155 02/22/13 $180,000 NO MARKET EXPOSURE; ESTATE ADMINISTRATOR, GUARDIAN, OR EXECUTOR
5 0 020770 0010 06/29/12 $392,000 RELOCATION - SALE TO SERVICE
5 0 032605 9034 11/11/14 $333,038 DOR RATIO; NO MARKET EXPOSURE
5 0 032605 9049 12/10/14 $710,000 IMP. COUNT > 1; NO MARKET EXPOSURE; QUESTIONABLE PER APPRAISAL
5 0 032605 9066 10/07/13 $610,000 DIAGNOSTIC OUTLIER; NON-NORMAL DISTRIBUTION
5 0 032605 9066 02/20/13 $591,868 BANKRUPTCY - RECEIVER OR TRUSTEE; EXEMPT FROM EXCISE TAX
5 0 042605 9047 04/20/12 $450,000 DIAGNOSTIC OUTLIER; MODEL DEVELOPMENT EXCLUSION
5 0 062210 0041 02/19/13 $260,000 SHORT SALE; NON-REPRESENTATIVE SALE
5 0 062210 0093 09/04/12 $308,199 DIAGNOSTIC OUTLIER; ANOMALY DETECTION
5 0 062210 0094 10/30/14 $141,345 DOR RATIO; QUIT CLAIM DEED; RELATED PARTY, FRIEND, OR NEIGHBOR
5 0 062210 0108 07/30/12 $198,000 IMP. CHARACTERISTICS CHANGED SINCE SALE
5 0 062210 0112 03/05/14 $440,046 UNFINISHED AREA
5 0 144630 0050 05/09/14 $590,300 RELOCATION - SALE TO SERVICE

Improved Sales Removed in This Annual Update Analysis
Area 038 -- 1 to 3 Unit Residences
Area 038 61
2015 Annual Update Department of Assessments
Sub Area Nghb Major Minor Sale Date Sale Price Comments
5 0 144630 0410 05/30/13 $530,000 DIAGNOSTIC OUTLIER; OBSERVATION OUTSIDE THE NORM
5 0 273860 0230 07/18/14 $385,273 GOV'T TO GOV'T; EXEMPT FROM EXCISE TAX
5 0 273861 0120 09/10/13 $357,100 NO MARKET EXPOSURE; FINANCIAL INSTITUTION RESALE; EXEMPT FROM EXCISE TAX
5 0 273863 0140 10/12/12 $339,000 RELOCATION - SALE TO SERVICE
5 0 424940 0200 06/11/12 $247,217 GOV'T TO NON-GOV'T; NO MARKET EXPOSURE; QUIT CLAIM DEED
5 0 680460 0290 09/04/14 $420,000 RELOCATION - SALE TO SERVICE
5 0 680460 0540 05/14/12 $290,000 IMP. CHARACTERISTICS CHANGED SINCE SALE
5 0 730860 0010 06/16/14 $749,995 ACTIVE PERMIT BEFORE SALE >25K
5 0 730860 0020 02/11/14 $623,851 DIAGNOSTIC OUTLIER; MODEL DEVELOPMENT EXCLUSION
5 0 730860 0030 06/16/14 $764,952 ACTIVE PERMIT BEFORE SALE >25K
5 0 730860 0040 07/23/14 $769,995 ACTIVE PERMIT BEFORE SALE >25K
5 0 730860 0050 09/09/14 $738,515 ACTIVE PERMIT BEFORE SALE >25K
5 0 730860 0060 08/22/14 $689,995 ACTIVE PERMIT BEFORE SALE >25K
5 0 730860 0090 08/04/14 $767,667 ACTIVE PERMIT BEFORE SALE >25K
5 0 730860 0100 08/22/14 $765,034 ACTIVE PERMIT BEFORE SALE >25K; PERCENT COMPLETE
5 0 730860 0110 10/20/14 $724,995 ACTIVE PERMIT BEFORE SALE >25K; PERCENT COMPLETE
5 0 730860 0130 10/21/14 $779,995 ACTIVE PERMIT BEFORE SALE >25K; PERCENT COMPLETE
5 0 730860 0140 08/04/14 $788,934 ACTIVE PERMIT BEFORE SALE >25K; PERCENT COMPLETE
5 0 730860 0220 07/29/14 $719,995 ACTIVE PERMIT BEFORE SALE >25K
5 0 730860 0240 06/03/14 $736,502 ACTIVE PERMIT BEFORE SALE >25K
5 0 730860 0260 02/04/14 $597,098 DIAGNOSTIC OUTLIER; OBSERVATION OUTSIDE THE NORM
5 0 730860 0280 01/07/14 $637,950 DIAGNOSTIC OUTLIER; NON-NORMAL DISTRIBUTION
5 0 730860 0290 02/04/14 $636,034 DIAGNOSTIC OUTLIER; ANOMALY DETECTION
5 0 730860 0310 04/22/14 $757,986 ACTIVE PERMIT BEFORE SALE >25K
5 0 730860 0320 07/24/14 $759,995 ACTIVE PERMIT BEFORE SALE >25K
5 0 730860 0330 03/04/14 $641,413 ACTIVE PERMIT BEFORE SALE >25K
5 0 785996 0010 04/28/13 $542,200 IMP. CHARACTERISTICS CHANGED SINCE SALE
5 0 802965 0080 10/22/13 $338,200 FINANCIAL INSTITUTION RESALE; EXEMPT FROM EXCISE TAX; NO MARKET EXPOSURE
5 0 807837 0010 05/29/12 $361,375 RELOCATION - SALE TO SERVICE

Improved Sales Removed in This Annual Update Analysis
Area 038 -- 1 to 3 Unit Residences
Area 038 62
2015 Annual Update Department of Assessments
Sub Area Nghb Major Minor Sale Date Sale Price Comments
5 0 914430 0060 05/23/12 $225,000 DIAGNOSTIC OUTLIER; MODEL DEVELOPMENT EXCLUSION
5 0 952731 0020 12/09/12 $440,400 BANKRUPTCY - RECEIVER OR TRUSTEE; EXEMPT FROM EXCISE TAX;
5 0 953200 0100 03/06/12 $388,068 ACTIVE PERMIT BEFORE SALE >25K
5 0 953200 0510 03/07/12 $560,000 QUIT CLAIM DEED
5 0 957815 0030 11/14/12 $434,159 BANKRUPTCY - RECEIVER OR TRUSTEE; GOV'T TO GOV'T; FINANCIAL INSTITUTION RESALE

Vacant Sales Used in this Annual Update Analysis
Area 038
Area 038 63
2015 Annual Update Department of Assessments
Sub Area Nghb Major Minor Sale Date Sale Price Lot Size View Waterfront
1 0 011410 0012 05/28/13 $175,000 10,833 N N
1 0 011410 0020 07/18/14 $183,000 15,010 N N
1 0 382410 0365 07/30/13 $120,000 7,980 N N
1 0 402770 0846 07/26/13 $175,000 7,551 N N
2 0 011410 1132 10/22/14 $245,000 21,617 N N
2 1 012604 9036 11/16/13 $310,000 305,791 N N
2 1 062605 9011 03/12/14 $350,000 210,830 N N
2 0 162200 0050 11/25/14 $150,000 6,327 N N
2 1 868210 0040 09/06/12 $170,000 4,289 N N
3 0 096110 0075 01/25/12 $229,950 23,234 N N
3 2 133275 0010 05/14/13 $230,000 13,016 N N
3 2 133275 0020 08/27/13 $230,000 14,016 N N
3 2 182605 9004 05/08/13 $153,950 957,600 N N
3 2 182605 9071 01/22/14 $205,000 189,050 N N
3 2 182605 9071 10/04/12 $150,000 189,050 N N
3 2 357860 0035 01/29/14 $467,500 74,923 N N
3 2 357860 0050 03/19/12 $130,000 28,188 N N
3 2 357860 0190 04/28/14 $500,000 66,211 N N
3 3 620420 0200 07/03/14 $185,000 7,112 N N
4 0 062605 9060 06/18/13 $231,000 8,528 N N
4 0 062605 9368 09/11/12 $165,000 10,335 N N
4 0 072605 9302 11/07/12 $172,450 7,386 N N
4 0 082605 9078 11/13/14 $1,950,000 9,000 N N
4 0 956780 0430 01/22/13 $137,000 7,194 N N
4 0 956780 0446 04/03/12 $118,000 8,936 N N

Vacant Sales Removed in this Annual Update Analysis
Area 038
Area 038 64
2015 Annual Update Department of Assessments
Sub Area Nghb Major Minor
Sale Date
Sale Price Comments
1 0 382010 0286 02/28/12 $80,000 NO MARKET EXPOSURE
2 0 011410 0720 07/05/13 $75,000 NO MARKET EXPOSURE
2 0 011410 0749 12/31/13 $315,000 CORPORATE AFFILIATES
2 0 012604 9031 09/19/12 $538,000 NO MARKET EXPOSURE; CORPORATE AFFILIATES;
2 1 012604 9042 02/10/14 $425,000 NO MARKET EXPOSURE; SEGREGATION AND/OR MERGER; TEAR DOWN
2 1 062605 9071 05/14/12 $200,000 NO MARKET EXPOSURE; FINANCIAL INSTITUTION RESALE
2 1 868210 0040 09/04/12 $81,000 CORPORATE AFFILIATES
2 1 868210 0070 11/20/12 $81,000 NO MARKET EXPOSURE; CORPORATE AFFILIATES
2 1 868210 0090 09/04/12 $81,000 NO MARKET EXPOSURE; CORPORATE AFFILIATES
3 2 072605 9023 11/12/12 $275,000 NO MARKET EXPOSURE
3 0 096110 0130 12/17/12 $170,000 NO MARKET EXPOSURE; CONTRACT OR CASH SALE
3 0 172605 9117 04/12/14 $11,000 QUIT CLAIM DEED; RELATED PARTY, FRIEND, OR NEIGHBOR; ESTATE ADM, GUARDIAN, OR EXECUTOR
3 2 182605 9074 06/29/12 $135,000 AUCTION SALE
3 2 357860 0031 05/29/14 $170,000 NO MARKET EXPOSURE
3 2 357860 0050 07/09/12 $13,170 QUIT CLAIM DEED
4 0 052605 9017 12/26/13 $250,000 GOV'T TO GOV'T; NO MARKET EXPOSURE
4 0 052605 9215 07/02/12 $10,000 NO MARKET EXPOSURE; RELATED PARTY, FRIEND, OR NEIGHBOR
4 0 062605 9334 03/19/12 $130,000 NO MARKET EXPOSURE; CORPORATE AFFILIATES
4 0 173731 0050 09/26/14 $265,000 NO MARKET EXPOSURE
5 0 062210 0060 06/17/13 $32,500 QUESTIONABLE PER SALES IDENTIFICATION
5 0 730860 0120 10/21/14 $724,847 NEW IMP; SALE DATA DOES NOT MATCH ASSESSED VALUE
5 0 730860 0160 11/19/14 $749,995 NEW IMP; SALE DATA DOES NOT MATCH ASSESSED VALUE
5 0 730860 0170 12/10/14 $714,995 NEW IMP; SALE DATA DOES NOT MATCH ASSESSED VALUE
5 0 730860 0200 12/10/14 $758,873 NEW IMP; SALE DATA DOES NOT MATCH ASSESSED VALUE
5 0 952090 0030 12/22/14 $639,900 NEW IMP; SALE DATA DOES NOT MATCH ASSESSED VALUE
5 0 952090 0050 12/08/14 $635,555 NEW IMP; SALE DATA DOES NOT MATCH ASSESSED VALUE
5 0 952090 0060 12/04/14 $627,680 NEW IMP; SALE DATA DOES NOT MATCH ASSESSED VALUE
5 0 952090 0080 11/26/14 $565,365 NEW IMP; SALE DATA DOES NOT MATCH ASSESSED VALUE
5 0 952090 0090 12/01/14 $593,825 NEW IMP; SALE DATA DOES NOT MATCH ASSESSED VALUE

Vacant Sales Removed in this Annual Update Analysis
Area 038
Area 038 65
2015 Annual Update Department of Assessments
Sub Area Nghb Major Minor
Sale Date
Sale Price Comments
5 0 952090 0130 12/09/14 $580,630 NEW IMP; SALE DATA DOES NOT MATCH ASSESSED VALUE
5 0 952090 0140 12/29/14 $648,975 NEW IMP; SALE DATA DOES NOT MATCH ASSESSED VALUE
5 0 952090 0190 12/03/14 $579,030 NEW IMP; SALE DATA DOES NOT MATCH ASSESSED VALUE
5 0 952090 0200 12/01/14 $664,840 NEW IMP; SALE DATA DOES NOT MATCH ASSESSED VALUE
5 0 952090 0210 12/31/14 $614,285 NEW IMP; SALE DATA DOES NOT MATCH ASSESSED VALUE
5 0 952090 0230 12/17/14 $642,860 NEW IMP; SALE DATA DOES NOT MATCH ASSESSED VALUE
5 0 953200 0560 05/18/12 $150,000 QUIT CLAIM DEED

Mobile Home Sales Used in this Annual Update Analysis
Area 038
Area 038 66
2015 Annual Update Department of Assessments
Sub Area Nghb Major Minor Sale Date Sale Price
Living Area Class
Year Built Cond Lot Size View Situs Address
3 2 182605 9098 08/29/13 $285,000 1,990 Good 1993 Good 10,018 N 8816 NE 163RD ST
5 5 339540 0610 12/04/13 $106,000 1,040 Fair 1969 Avg 3,830 N 12915 NE 192ND PL
5 5 339546 0390 09/16/13 $150,000 1,056 Avg 1985 Good 4,900 N 12516 NE 197TH CT
5 5 339540 0150 10/21/13 $169,950 1,070 Avg 1990 Avg 3,831 N 19224 129TH CT NE
5 5 339545 0170 02/11/14 $101,000 1,080 Avg 1982 Fair 4,984 N 12822 NE 198TH CT
5 5 339540 0690 12/04/12 $195,000 1,080 Avg 1996 Good 4,411 N 19155 130TH AVE NE
5 5 339540 0980 08/27/13 $120,000 1,130 Fair 1971 Avg 3,988 N 19158 130TH CT NE
5 5 339543 0270 10/09/14 $172,450 1,150 Avg 1980 Avg 4,222 N 19268 127TH AVE NE
5 5 339545 0400 07/10/14 $187,000 1,150 Avg 1983 Avg 4,791 N 19809 127TH CT NE
5 5 339545 0320 12/24/13 $175,000 1,150 Avg 1983 Good 4,946 N 12718 NE 199TH ST
5 5 339545 0510 11/07/13 $205,000 1,150 Avg 1980 Good 4,548 N 12723 HOLLYHILLS DR NE
5 5 339543 0620 03/19/13 $150,000 1,150 Avg 1977 Avg 4,740 N 19641 HOLLYHILLS DR NE
5 5 339545 0830 09/10/14 $190,500 1,190 Avg 1981 Avg 4,847 N 19621 129TH AVE NE
5 5 339546 0080 09/02/14 $212,500 1,190 Avg 1990 Avg 5,225 N 19800 126TH AVE NE
5 5 339540 0170 10/17/13 $145,000 1,190 Avg 2005 Good 3,132 N 19232 129TH CT NE
5 5 339540 0600 06/10/13 $225,000 1,190 Good 2007 Good 5,701 N 19004 129TH AVE NE
5 5 339542 0310 10/05/12 $109,000 1,270 Fair 1974 Avg 4,590 N 19230 128TH PL NE
5 5 339540 0560 11/30/12 $125,000 1,290 Avg 1973 Avg 3,600 N 18910 129TH AVE NE
5 5 339546 0510 11/22/13 $186,000 1,300 Avg 1990 Avg 9,364 N 19601 126TH AVE NE
5 5 339546 0410 08/08/13 $163,333 1,300 Avg 1989 Avg 4,634 N 12504 NE 197TH ST
5 5 339541 0120 07/08/14 $113,000 1,340 Fair 1971 Avg 5,249 N 12815 HOLLYHILLS DR NE
5 5 339547 0170 06/12/13 $196,750 1,340 Avg 1987 Vgood 7,888 N 18800 127TH PL NE
5 5 339547 0170 01/17/13 $161,000 1,340 Avg 1987 Vgood 7,888 N 18800 127TH PL NE
5 5 339546 0070 04/03/13 $162,000 1,344 Avg 1989 Avg 5,225 N 19732 126TH AVE NE
5 5 339546 0060 08/19/13 $200,000 1,350 Avg 1989 Avg 5,225 N 19726 126TH AVE NE
5 5 339540 0670 10/23/13 $140,000 1,370 Fair 1970 Avg 4,660 N 19163 130TH AVE NE
5 5 339547 0140 04/28/14 $230,000 1,400 Avg 2006 Good 5,319 N 18812 127TH PL NE
5 5 339545 0590 09/09/14 $211,000 1,440 Avg 1981 Avg 5,135 N 19715 HOLLYHILLS DR NE
5 5 339543 0840 04/21/14 $164,000 1,440 Avg 1977 Avg 5,964 N 19348 HOLLYHILLS DR NE
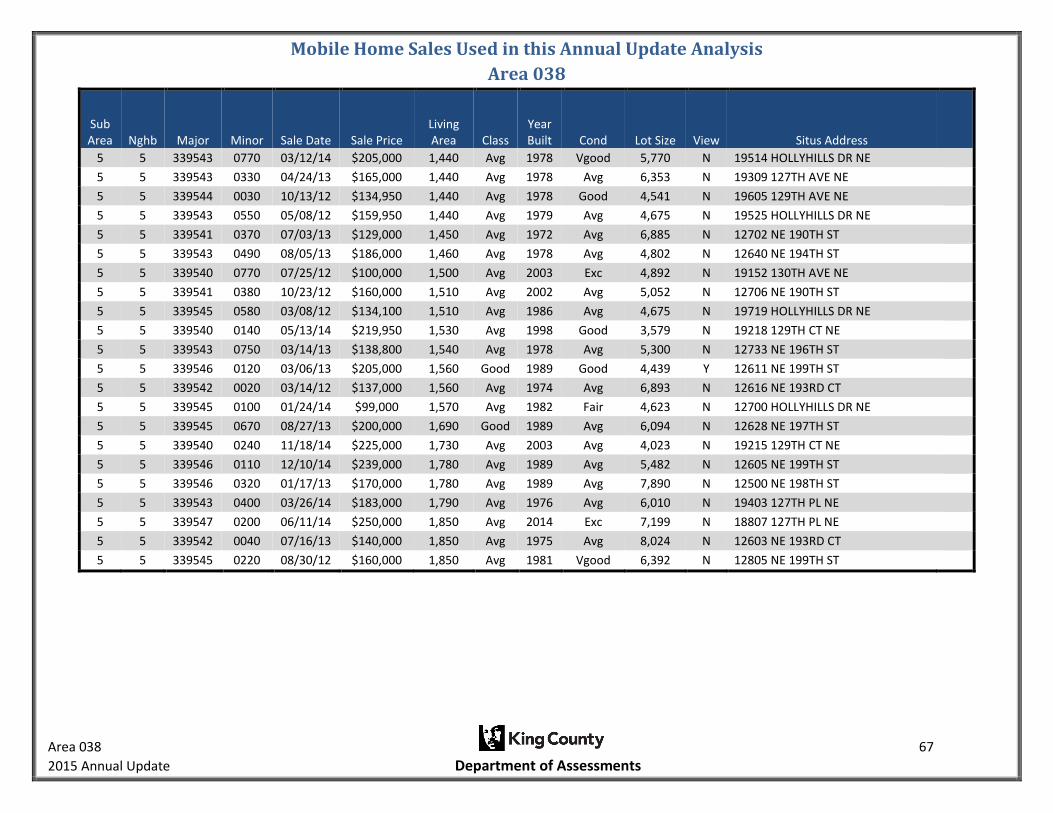
Mobile Home Sales Used in this Annual Update Analysis
Area 038
Area 038 67
2015 Annual Update Department of Assessments
Sub Area Nghb Major Minor Sale Date Sale Price
Living Area Class
Year Built Cond Lot Size View Situs Address
5 5 339543 0770 03/12/14 $205,000 1,440 Avg 1978 Vgood 5,770 N 19514 HOLLYHILLS DR NE
5 5 339543 0330 04/24/13 $165,000 1,440 Avg 1978 Avg 6,353 N 19309 127TH AVE NE
5 5 339544 0030 10/13/12 $134,950 1,440 Avg 1978 Good 4,541 N 19605 129TH AVE NE
5 5 339543 0550 05/08/12 $159,950 1,440 Avg 1979 Avg 4,675 N 19525 HOLLYHILLS DR NE
5 5 339541 0370 07/03/13 $129,000 1,450 Avg 1972 Avg 6,885 N 12702 NE 190TH ST
5 5 339543 0490 08/05/13 $186,000 1,460 Avg 1978 Avg 4,802 N 12640 NE 194TH ST
5 5 339540 0770 07/25/12 $100,000 1,500 Avg 2003 Exc 4,892 N 19152 130TH AVE NE
5 5 339541 0380 10/23/12 $160,000 1,510 Avg 2002 Avg 5,052 N 12706 NE 190TH ST
5 5 339545 0580 03/08/12 $134,100 1,510 Avg 1986 Avg 4,675 N 19719 HOLLYHILLS DR NE
5 5 339540 0140 05/13/14 $219,950 1,530 Avg 1998 Good 3,579 N 19218 129TH CT NE
5 5 339543 0750 03/14/13 $138,800 1,540 Avg 1978 Avg 5,300 N 12733 NE 196TH ST
5 5 339546 0120 03/06/13 $205,000 1,560 Good 1989 Good 4,439 Y 12611 NE 199TH ST
5 5 339542 0020 03/14/12 $137,000 1,560 Avg 1974 Avg 6,893 N 12616 NE 193RD CT
5 5 339545 0100 01/24/14 $99,000 1,570 Avg 1982 Fair 4,623 N 12700 HOLLYHILLS DR NE
5 5 339545 0670 08/27/13 $200,000 1,690 Good 1989 Avg 6,094 N 12628 NE 197TH ST
5 5 339540 0240 11/18/14 $225,000 1,730 Avg 2003 Avg 4,023 N 19215 129TH CT NE
5 5 339546 0110 12/10/14 $239,000 1,780 Avg 1989 Avg 5,482 N 12605 NE 199TH ST
5 5 339546 0320 01/17/13 $170,000 1,780 Avg 1989 Avg 7,890 N 12500 NE 198TH ST
5 5 339543 0400 03/26/14 $183,000 1,790 Avg 1976 Avg 6,010 N 19403 127TH PL NE
5 5 339547 0200 06/11/14 $250,000 1,850 Avg 2014 Exc 7,199 N 18807 127TH PL NE
5 5 339542 0040 07/16/13 $140,000 1,850 Avg 1975 Avg 8,024 N 12603 NE 193RD CT
5 5 339545 0220 08/30/12 $160,000 1,850 Avg 1981 Vgood 6,392 N 12805 NE 199TH ST
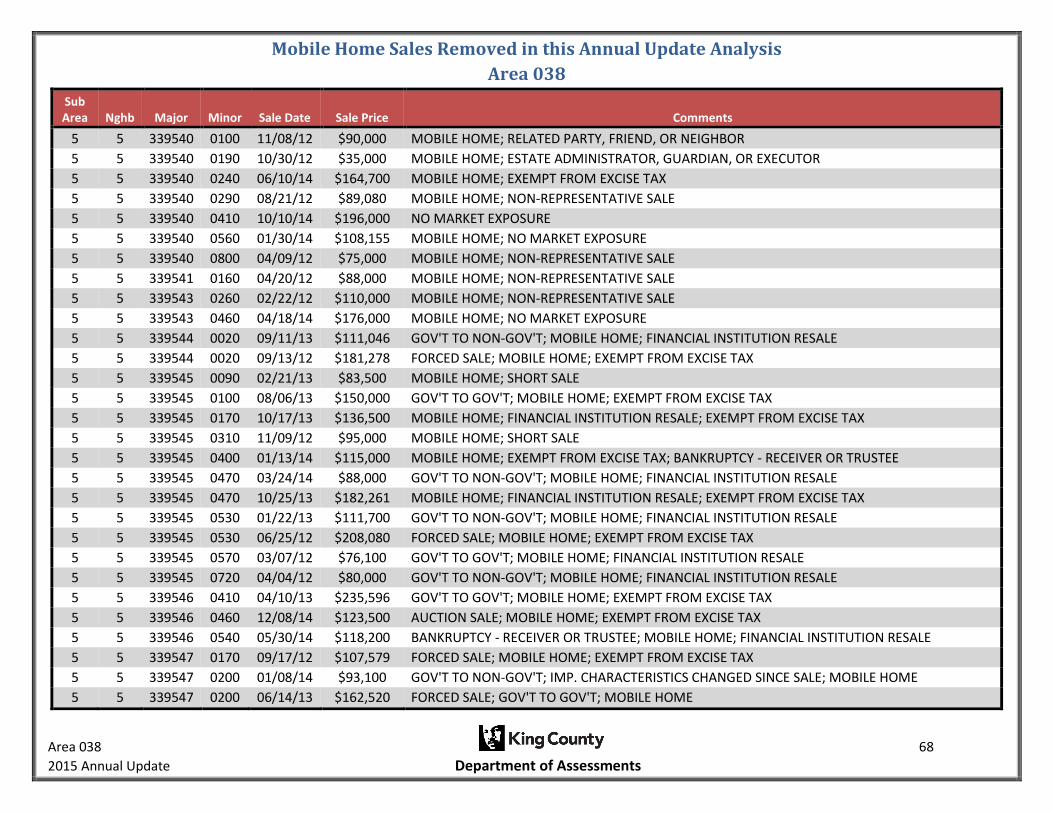
Mobile Home Sales Removed in this Annual Update Analysis
Area 038
Area 038 68
2015 Annual Update Department of Assessments
Sub Area Nghb Major Minor Sale Date Sale Price Comments
5 5 339540 0100 11/08/12 $90,000 MOBILE HOME; RELATED PARTY, FRIEND, OR NEIGHBOR
5 5 339540 0190 10/30/12 $35,000 MOBILE HOME; ESTATE ADMINISTRATOR, GUARDIAN, OR EXECUTOR
5 5 339540 0240 06/10/14 $164,700 MOBILE HOME; EXEMPT FROM EXCISE TAX
5 5 339540 0290 08/21/12 $89,080 MOBILE HOME; NON-REPRESENTATIVE SALE
5 5 339540 0410 10/10/14 $196,000 NO MARKET EXPOSURE
5 5 339540 0560 01/30/14 $108,155 MOBILE HOME; NO MARKET EXPOSURE
5 5 339540 0800 04/09/12 $75,000 MOBILE HOME; NON-REPRESENTATIVE SALE
5 5 339541 0160 04/20/12 $88,000 MOBILE HOME; NON-REPRESENTATIVE SALE
5 5 339543 0260 02/22/12 $110,000 MOBILE HOME; NON-REPRESENTATIVE SALE
5 5 339543 0460 04/18/14 $176,000 MOBILE HOME; NO MARKET EXPOSURE
5 5 339544 0020 09/11/13 $111,046 GOV'T TO NON-GOV'T; MOBILE HOME; FINANCIAL INSTITUTION RESALE
5 5 339544 0020 09/13/12 $181,278 FORCED SALE; MOBILE HOME; EXEMPT FROM EXCISE TAX
5 5 339545 0090 02/21/13 $83,500 MOBILE HOME; SHORT SALE
5 5 339545 0100 08/06/13 $150,000 GOV'T TO GOV'T; MOBILE HOME; EXEMPT FROM EXCISE TAX
5 5 339545 0170 10/17/13 $136,500 MOBILE HOME; FINANCIAL INSTITUTION RESALE; EXEMPT FROM EXCISE TAX
5 5 339545 0310 11/09/12 $95,000 MOBILE HOME; SHORT SALE
5 5 339545 0400 01/13/14 $115,000 MOBILE HOME; EXEMPT FROM EXCISE TAX; BANKRUPTCY - RECEIVER OR TRUSTEE
5 5 339545 0470 03/24/14 $88,000 GOV'T TO NON-GOV'T; MOBILE HOME; FINANCIAL INSTITUTION RESALE
5 5 339545 0470 10/25/13 $182,261 MOBILE HOME; FINANCIAL INSTITUTION RESALE; EXEMPT FROM EXCISE TAX
5 5 339545 0530 01/22/13 $111,700 GOV'T TO NON-GOV'T; MOBILE HOME; FINANCIAL INSTITUTION RESALE
5 5 339545 0530 06/25/12 $208,080 FORCED SALE; MOBILE HOME; EXEMPT FROM EXCISE TAX
5 5 339545 0570 03/07/12 $76,100 GOV'T TO GOV'T; MOBILE HOME; FINANCIAL INSTITUTION RESALE
5 5 339545 0720 04/04/12 $80,000 GOV'T TO NON-GOV'T; MOBILE HOME; FINANCIAL INSTITUTION RESALE
5 5 339546 0410 04/10/13 $235,596 GOV'T TO GOV'T; MOBILE HOME; EXEMPT FROM EXCISE TAX
5 5 339546 0460 12/08/14 $123,500 AUCTION SALE; MOBILE HOME; EXEMPT FROM EXCISE TAX
5 5 339546 0540 05/30/14 $118,200 BANKRUPTCY - RECEIVER OR TRUSTEE; MOBILE HOME; FINANCIAL INSTITUTION RESALE
5 5 339547 0170 09/17/12 $107,579 FORCED SALE; MOBILE HOME; EXEMPT FROM EXCISE TAX
5 5 339547 0200 01/08/14 $93,100 GOV'T TO NON-GOV'T; IMP. CHARACTERISTICS CHANGED SINCE SALE; MOBILE HOME
5 5 339547 0200 06/14/13 $162,520 FORCED SALE; GOV'T TO GOV'T; MOBILE HOME

Mobile Home Sales Removed in this Annual Update Analysis
Area 038
Area 038 69
2015 Annual Update Department of Assessments
Sub Area Nghb Major Minor Sale Date Sale Price Comments
5 5 339547 0200 04/25/13 $162,500 FORCED SALE; EXEMPT FROM EXCISE TAX
5 5 339547 0280 07/18/12 $97,000 NON-REPRESENTATIVE SALE

Area 038 70
2015 Annual Update Department of Assessments
Uniform Standards of Professional Appraisal Practice
Compliance
Client and Intended Use of the Appraisal:
This mass appraisal report is intended for use by the public, King County Assessor and other agencies or departments administering or confirming ad valorem property taxes. Use of this report by others for other purposes is not intended by the appraiser. The use of this appraisal, analyses and conclusions is limited to the administration of ad valorem property taxes in accordance with Washington State law. As such it is written in concise form to minimize paperwork. The assessor intends that this report conform to the Uniform Standards of Professional Appraisal Practice (USPAP) requirements for a mass appraisal report as stated in USPAP SR 6-8. To fully understand this report the reader may need to refer to the Assessor’s Property Record Files, Assessors Real Property Data Base, separate studies, Assessor’s Procedures, Assessor’s field maps, Revalue Plan and the statutes. The purpose of this report is to explain and document the methods, data and analysis used in the revaluation of King County. King County is on a six year physical inspection cycle with annual statistical updates. The revaluation plan is approved by Washington State Department of Revenue. The Revaluation Plan is subject to their periodic review.
Definition and date of value estimate:
Market Value
The basis of all assessments is the true and fair value of property. True and fair value means market value (Spokane etc. R. Company v. Spokane County, 75 Wash. 72 (1913); Mason County Overtaxed, Inc. v. Mason County, 62 Wn. 2d (1963); AGO 57-58, No. 2, 1/8/57; AGO 65-66, No. 65, 12/31/65). The true and fair value of a property in money for property tax valuation purposes is its “market value” or amount of money a buyer willing but not obligated to buy would pay for it to a seller willing but not obligated to sell. In arriving at a determination of such value, the assessing officer can consider only those factors which can within reason be said to affect the price in negotiations between a willing purchaser and a willing seller, and he must consider all of such factors. (AGO 65,66, No. 65, 12/31/65) Retrospective market values are reported herein because the date of the report is subsequent to the effective date of valuation. The analysis reflects market conditions that existed on the effective date of appraisal.
Highest and Best Use
RCW 84.40.030
All property shall be valued at one hundred percent of its true and fair value in money and assessed on the same basis unless specifically provided otherwise by law.
An assessment may not be determined by a method that assumes a land usage or highest and best use not permitted, for that property being appraised, under existing zoning or land use planning ordinances or statutes or other government restrictions.

Area 038 71
2015 Annual Update Department of Assessments
WAC 458-07-030 (3) True and fair value -- Highest and best use.
Unless specifically provided otherwise by statute, all property shall be valued on the basis of its highest and best use for assessment purposes. Highest and best use is the most profitable, likely use to which a property can be put. It is the use which will yield the highest return on the owner's investment. Any reasonable use to which the property may be put may be taken into consideration and if it is peculiarly adapted to some particular use, that fact may be taken into consideration. Uses that are within the realm of possibility, but not reasonably probable of occurrence, shall not be considered in valuing property at its highest and best use.
If a property is particularly adapted to some particular use this fact may be taken into consideration in estimating the highest and best use. (Samish Gun Club v. Skagit County, 118 Wash. 578 (1922)) The present use of the property may constitute its highest and best use. The appraiser shall, however, consider the uses to which similar property similarly located is being put. (Finch v. Grays Harbor County, 121 Wash. 486 (1922)) The fact that the owner of the property chooses to use it for less productive purposes than similar land is being used shall be ignored in the highest and best use estimate. (Samish Gun Club v. Skagit County, 118 Wash. 578 (1922)) Where land has been classified or zoned as to its use, the county assessor may consider this fact, but he shall not be bound to such zoning in exercising his judgment as to the highest and best use of the property. (AGO 63-64, No. 107, 6/6/64)
Date of Value Estimate
RCW 84.36.005 All property now existing, or that is hereafter created or brought into this state, shall be subject to assessment and taxation for state, county, and other taxing district purposes, upon equalized valuations thereof, fixed with reference thereto on the first day of January at twelve o'clock meridian in each year, excepting such as is exempted from taxation by law.
RCW 36.21.080
The county assessor is authorized to place any property that is increased in value due to construction or alteration for which a building permit was issued, or should have been issued, under chapter 19.27, 19.27A, or 19.28 RCW or other laws providing for building permits on the assessment rolls for the purposes of tax levy up to August 31st of each year. The assessed valuation of the property shall be considered as of July 31st of that year.
Reference should be made to the property card or computer file as to when each property was valued. Sales consummating before and after the appraisal date may be used and are analyzed as to their indication of value at the date of valuation. If market conditions have changed then the appraisal will state a logical cutoff date after which no market date is used as an indicator of value.

Area 038 72
2015 Annual Update Department of Assessments
Property Rights Appraised: Fee Simple
Wash Constitution Article 7 § 1 Taxation:
All taxes shall be uniform upon the same class of property within the territorial limits of the authority levying the tax and shall be levied and collected for public purposes only.
The word "property" as used herein shall mean and include everything, whether tangible or intangible, subject to ownership. All real estate shall constitute one class.
Trimble v. Seattle, 231 U.S. 683, 689, 58 L. Ed. 435, 34 S. Ct. 218 (1914)
…the entire [fee] estate is to be assessed and taxed as a unit…
Folsom v. Spokane County, 111 Wn. 2d 256 (1988)
…the ultimate appraisal should endeavor to arrive at the fair market value of the property as if it were an unencumbered fee…
The Dictionary of Real Estate Appraisal, 3rd Addition, Appraisal Institute.
Absolute ownership unencumbered by any other interest or estate, subject only to the limitations imposed by the governmental powers of taxation, eminent domain, police power, and escheat.
Assumptions and Limiting Conditions:
1. No opinion as to title is rendered. Data on ownership and legal description were obtained from public records. Title is assumed to be marketable and free and clear of all liens and encumbrances, easements and restrictions unless shown on maps or property record files. The property is appraised assuming it to be under responsible ownership and competent management and available for its highest and best use.
2. No engineering survey has been made by the appraiser. Except as specifically stated, data relative to size and area were taken from sources considered reliable, and no encroachment of real property improvements is assumed to exist.
3. No responsibility for hidden defects or conformity to specific governmental requirements, such as fire, building and safety, earthquake, or occupancy codes, can be assumed without provision of specific professional or governmental inspections.
4. Rental areas herein discussed have been calculated in accord with generally accepted industry standards.
5. The projections included in this report are utilized to assist in the valuation process and are based on current market conditions and anticipated short term supply demand factors. Therefore, the projections are subject to changes in future conditions that cannot be accurately predicted by the appraiser and could affect the future income or value projections.
6. The property is assumed uncontaminated unless the owner comes forward to the Assessor and provides other information.
7. The appraiser is not qualified to detect the existence of potentially hazardous material which may or may not be present on or near the property. The existence of such substances may have an effect on the value of the property. No consideration has been given in this analysis to any potential diminution in value should such hazardous materials be found (unless specifically noted). We urge the taxpayer to retain an expert in the field and submit data affecting value to the assessor.

Area 038 73
2015 Annual Update Department of Assessments
8. No opinion is intended to be expressed for legal matters or that would require specialized investigation or knowledge beyond that ordinarily employed by real estate appraisers, although such matters may be discussed in the report.
9. Maps, plats and exhibits included herein are for illustration only, as an aid in visualizing matters discussed within the report. They should not be considered as surveys or relied upon for any other purpose.
10. The appraisal is the valuation of the fee simple interest. Unless shown on the Assessor’s parcel maps, easements adversely affecting property value were not considered.
11. An attempt to segregate personal property from the real estate in this appraisal has been made. 12. Items which are considered to be “typical finish” and generally included in a real property
transfer, but are legally considered leasehold improvements are included in the valuation unless otherwise noted.
13. The movable equipment and/or fixtures have not been appraised as part of the real estate. The identifiable permanently fixed equipment has been appraised in accordance with RCW 84.04.090 and WAC 458-12-010.
14. I have considered the effect of value of those anticipated public and private improvements of which I have common knowledge. I can make no special effort to contact the various jurisdictions to determine the extent of their public improvements.
15. Exterior inspections were made of all properties in the physical inspection areas (outlined in the body of the report) however; due to lack of access and time few received interior inspections.
Scope of Work Performed:
Research and analyses performed are identified in the body of the revaluation report. The assessor has no access to title reports and other documents. Because of legal limitations we did not research such items as easements, restrictions, encumbrances, leases, reservations, covenants, contracts, declarations and special assessments. Disclosure of interior home features and, actual income and expenses by property owners is not a requirement by law therefore attempts to obtain and analyze this information are not always successful. The mass appraisal performed must be completed in the time limits indicated in the Revaluation Plan and as budgeted. The scope of work performed and disclosure of research and analyses not performed are identified throughout the body of the report.

Area 038 74
2015 Annual Update Department of Assessments
Certification:
I certify that, to the best of my knowledge and belief:
The statements of fact contained in this report are true and correct
The report analyses, opinions, and conclusions are limited only by the reported assumptions and limiting conditions and are my personal, impartial, and unbiased professional analyses, opinions, and conclusions.
I have no present or prospective interest in the property that is the subject of this report and no personal interest with respect to the parties involved.
I have no bias with respect to the property that is the subject of this report or to the parties involved.
My engagement in this assignment was not contingent upon developing or reporting predetermined results.
My compensation for completing this assignment is not contingent upon the development or reporting of predetermined value or direction in value that favors the cause of the client, the amount of the value opinion, the attainment of a stipulated result, or the occurrence of a subsequent event directly related to the intended use of this appraisal.
My analyses, opinions, and conclusions were developed, and this report has been prepared, in conformity with the Uniform Standards of Professional Appraisal Practice.
The area(s) physically inspected for purposes of this revaluation are outlined in the body of this report.
The individuals listed below were part of the “appraisal team” and provided significant real property appraisal assistance to the person signing this certification. Any services regarding the subject area performed by the appraiser within the prior three years, as an appraiser or in any other capacity is listed adjacent their name.
None Any services regarding the subject area performed by me within the prior three years, as an appraiser or in any other capacity is listed below: To the best of my knowledge the following services were performed by me within the subject area in the last three years:
Annual Update Model Development and Report Preparation Data Collection Sales Verification Appeals Response Preparation / Review Appeal Hearing Attendance
05/26/2015
Appraiser II Date