BOSTON SCIENTIFIC ANNOUNCES RESULTS FOR SECOND …
15
FOR IMMEDIATE RELEASE BOSTON SCIENTIFIC ANNOUNCES RESULTS FOR SECOND QUARTER ENDED JUNE 30, 2013 Natick, Mass. (July 25, 2013) -- Boston Scientific Corporation (NYSE: BSX) generated sales of $1.809 billion and adjusted earnings per share of $0.18 for the second quarter ended June 30, 2013. The company reported GAAP earnings of $0.10 per share. Second quarter results and recent developments: • Exceeded high end of the guidance range with sales of $1.809 billion -- a year-over-year decline of 1 percent on a reported basis and operational growth of 2 percent (constant currency basis, excluding divested businesses). • Delivered adjusted EPS of $0.18, exceeding the company's adjusted EPS guidance range of $0.14 to $0.17. • Achieved global year-over-year revenue growth of 21 percent in Neuromodulation on the strength of the Precision Spectra TM Spinal Cord Stimulator (SCS) System launch, 8 percent in Endoscopy and 5 percent in Peripheral Interventions, all on a constant currency basis. • Continued global expansion with combined year-over-year growth of 29 percent in Brazil, Russia, India and China, all on a constant currency basis. • Reported positive clinical data related to the Vessix TM Renal Denervation System, WATCHMAN ® Left Atrial Appendage Closure Device, Lotus TM Aortic Valve System and Vercise TM Deep Brain Stimulation System - technologies the company believes will help drive growth. • Entered into a definitive agreement to acquire the electrophysiology (EP) business of C.R. Bard, Inc., for $275 million in cash. • Generated operating cash flow of $396 million and used $100 million to repurchase approximately 12.5 million shares under the company's existing share repurchase authorizations. “We are pleased with our improved performance during the quarter,” said Mike Mahoney, president and chief executive officer, Boston Scientific. “As we continue to expand our portfolio, our team is inspired to deliver meaningful innovation to more patients globally.”
Transcript of BOSTON SCIENTIFIC ANNOUNCES RESULTS FOR SECOND …

FOR IMMEDIATE RELEASE
BOSTON SCIENTIFIC ANNOUNCES RESULTS FOR
SECOND QUARTER ENDED JUNE 30, 2013
Natick, Mass. (July 25, 2013) -- Boston Scientific Corporation (NYSE: BSX) generated sales of $1.809
billion and adjusted earnings per share of $0.18 for the second quarter ended June 30, 2013. The
company reported GAAP earnings of $0.10 per share.
Second quarter results and recent developments:
• Exceeded high end of the guidance range with sales of $1.809 billion -- a year-over-year decline of
1 percent on a reported basis and operational growth of 2 percent (constant currency basis,
excluding divested businesses).
• Delivered adjusted EPS of $0.18, exceeding the company's adjusted EPS guidance range of $0.14
to $0.17.
• Achieved global year-over-year revenue growth of 21 percent in Neuromodulation on the strength
of the Precision SpectraTM
Spinal Cord Stimulator (SCS) System launch, 8 percent in Endoscopy
and 5 percent in Peripheral Interventions, all on a constant currency basis.
• Continued global expansion with combined year-over-year growth of 29 percent in Brazil, Russia,
India and China, all on a constant currency basis.
• Reported positive clinical data related to the VessixTM
Renal Denervation System, WATCHMAN®
Left Atrial Appendage Closure Device, LotusTM
Aortic Valve System and VerciseTM
Deep Brain
Stimulation System - technologies the company believes will help drive growth.
• Entered into a definitive agreement to acquire the electrophysiology (EP) business of C.R. Bard,
Inc., for $275 million in cash.
• Generated operating cash flow of $396 million and used $100 million to repurchase approximately
12.5 million shares under the company's existing share repurchase authorizations.
“We are pleased with our improved performance during the quarter,” said Mike Mahoney, president and
chief executive officer, Boston Scientific. “As we continue to expand our portfolio, our team is inspired
to deliver meaningful innovation to more patients globally.”

Worldwide sales for the second quarter:
Three Months Ended
June 30, % Change
in millions 2013 2012
As Reported
Basis Less: Impact of
Foreign Currency
Constant Currency
Basis
Interventional Cardiology $ 520 $ 549 (5)% $ (15 ) (2)% (3)%
Peripheral Interventions 199 196 2% (6 ) (3)% 5%
Cardiovascular 719 745 (4)% (21 ) (3)% (1)%
Cardiac Rhythm Management 475 488 (3)% (4 ) (1)% (2)%
Electrophysiology 36 37 (3)% (1 ) (1)% (2)%
Rhythm Management 511 525 (3)% (5 ) (1)% (2)%
Endoscopy 325 311 5% (11 ) (3)% 8%
Urology/Women's Health 124 126 (1)% (3 ) (2)% 1%
Neuromodulation 111 91 21% 1 0% 21%
MedSurg 560 528 6% (13 ) (3)% 9% Subtotal Core Businesses 1,790 1,798 0% (39 ) (2)% 2% Divested Businesses 19 30 (36)% 1 2% (38)% Worldwide Net Sales $ 1,809 $ 1,828 (1)% $ (38 ) (2)% 1%
Growth rates are based on actual, non-rounded amounts and may not recalculate precisely.
Sales growth rates that exclude the impact of changes in foreign currency exchange rates are not prepared in accordance with U.S. GAAP. An explanation of the company's use of these non-GAAP financial measures is included in the exhibits attached to this news release.
On a consolidated GAAP basis, net income for the second quarter of 2013 was $130 million, or earnings
of $0.10 per share. These results included an intangible asset impairment charge, acquisition- and
divestiture-related net credits, restructuring-related charges, and amortization expense, of $117 million
(after-tax) or $0.08 per share. Adjusted net income for the second quarter of 2013, excluding these net
charges, was $247 million, or $0.18 per share.
On a consolidated GAAP basis, net loss for the second quarter of 2012 was $3.578 billion, or $2.51 per
share. These results included goodwill and other intangible asset impairment charges, acquisition-related
net credits, divestiture-, restructuring- and litigation-related charges and amortization expense, of $3.817
billion or $2.68 per share. Adjusted net income for the second quarter of 2012, excluding these net
charges, was $239 million, or $0.17 per share.
Guidance for Third Quarter and Full Year 2013
The company estimates sales for the third quarter of 2013 in a range of $1.700 to $1.760 billion. The
company estimates earnings on a GAAP basis in a range of $0.03 to $0.05 per share. Adjusted earnings,
excluding acquisition- and restructuring-related charges, divestiture-related net credits and amortization
expense; are estimated in a range of $0.14 to $0.16 per share.
The company estimates sales for the full year 2013 in a range of $7.050 to $7.170 billion. The company
estimates losses on a GAAP basis in a range of ($0.07) to ($0.01) per share. Adjusted earnings, excluding

goodwill and intangible asset impairment charges, acquisition-, restructuring-, and litigation-related
charges, divestiture-related net credits and amortization expense; are estimated in a range of $0.67 to
$0.71 per share.
Conference Call Information Boston Scientific management will be discussing these results with analysts on a conference call today at
8:00 a.m. (ET). The company will webcast the call to interested parties through its website:
www.bostonscientific.com. Please see the website for details on how to access the webcast. The webcast
will be available for approximately one year on the Boston Scientific website.
About Boston Scientific Boston Scientific transforms lives through innovative medical solutions that improve the health of patients
around the world. As a global medical technology leader for more than 30 years, we advance science for
life by providing a broad range of high performance solutions that address unmet patient needs and reduce
the cost of healthcare. For more information, visit www.bostonscientific.com and connect on Twitter and
Facebook.
Cautionary Statement Regarding Forward-Looking Statements This press release contains forward-looking statements within the meaning of Section 27A of the
Securities Act of 1933 and Section 21E of the Securities Exchange Act of 1934. Forward-looking
statements may be identified by words like "anticipate," "expect," "project," "believe," "plan," "estimate,"
"intend" and similar words. These forward-looking statements are based on our beliefs, assumptions and
estimates using information available to us at the time and are not intended to be guarantees of future
events or performance. These forward-looking statements include, among other things, statements
regarding our expected net sales, GAAP earnings and adjusted earnings for the third quarter and full year
2013; our financial performance; our business plans; our growth initiatives and expected impact; our
positioning for revenue and earnings per share growth; and our product pipeline and its importance. If our
underlying assumptions turn out to be incorrect, or if certain risks or uncertainties materialize, actual
results could vary materially from the expectations and projections expressed or implied by our forward-
looking statements. These risks and uncertainties, in some cases, have affected and in the future could
affect our ability to implement our business strategy and may cause actual results to differ materially from
those contemplated by the statements expressed in this press release. As a result, readers are cautioned
not to place undue reliance on any of our forward-looking statements.
Risks and uncertainties that may cause such differences include, among other things: future economic,
political, competitive, reimbursement and regulatory conditions; new product introductions and the
market acceptance of those products; markets for our products; expected pricing environment; expected
procedural volumes; clinical trial results; demographic trends; intellectual property rights; litigation;
financial market conditions; the execution and effect of our restructuring program; the execution and
effect of our business strategy, including our cost-savings and growth initiatives; and future business
decisions made by us and our competitors. New risks and uncertainties may arise from time to time and
are difficult to predict. All of these factors are difficult or impossible to predict accurately and many of
them are beyond our control. For a further list and description of these and other important risks and
uncertainties that may affect our future operations, see Part I, Item IA - Risk Factors in our most recent
Annual Report on Form 10-K filed with the Securities and Exchange Commission, which we may update
in Part II, Item 1A - Risk Factors in Quarterly Reports on Form 10-Q we have filed or will file
hereafter. We disclaim any intention or obligation to publicly update or revise any forward-looking
statement to reflect any change in our expectations or in events, conditions, or circumstances on which
those expectations may be based, or that may affect the likelihood that actual results will differ from
those contained in the forward-looking statements. This cautionary statement is applicable to all
forward-looking statements contained in this press release.

Use of Non-GAAP Financial Information A reconciliation of the company's non-GAAP financial measures to the corresponding GAAP measures,
and an explanation of the company's use of these non-GAAP financial measures, is included in the
exhibits attached to this news release.
CONTACT: Denise Kaigler
508-650-8330 (office)
Corporate Affairs & Communications Boston Scientific Corporation
Peter Lucht
508-650-8796 (office) Global Media Relations
Boston Scientific Corporation
Michael Campbell
508-650-8023 (office)
Investor Relations
Boston Scientific Corporation

BOSTON SCIENTIFIC CORPORATION CONDENSED CONSOLIDATED GAAP RESULTS OF OPERATIONS
(Unaudited)
Three Months Ended Six Months Ended June 30, June 30,
in millions, except per share data 2013 2012 2013 2012
Net sales $ 1,809 $ 1,828 $ 3,570 $ 3,694
Cost of products sold 530 578 1,108 1,209
Gross profit 1,279 1,250 2,462 2,485
Operating expenses:
Selling, general and administrative expenses 661 648 1,292 1,306
Research and development expenses 223 213 427 428
Royalty expense 47 48 87 96
Amortization expense 101 99 204 195
Goodwill impairment charge — 3,602 423 3,602
Intangible asset impairment charges 53 129 53 129
Contingent consideration expense (benefit) (18 ) 1 (41 ) 11
Restructuring charges 26 28 36 39
Gain on divestiture (34 ) — (40 ) —
Litigation-related charges — 69 130 69
1,059 4,837 2,571 5,875
Operating income (loss) 220 (3,587 ) (109 ) (3,390 )
Other income (expense):
Interest expense (65 ) (64 ) (130 ) (132 )
Other, net (3 ) 33 (3 ) 27
Income (loss) before income taxes 152 (3,618 ) (242 ) (3,495 )
Income tax expense (benefit) 22 (40 ) (18 ) (30 )
Net income (loss) $ 130 $ (3,578 ) $ (224 ) $ (3,465 )
Net income (loss) per common share - basic $ 0.10 $ (2.51 ) $ (0.17 ) $ (2.42 )
Net income (loss) per common share - assuming dilution $ 0.10 $ (2.51 ) $ (0.17 ) $ (2.42 )
Weighted-average shares outstanding
Basic 1,343.5 1,423.2 1,347.7 1,434.2
Assuming dilution 1,358.6 1,423.2 1,347.7 1,434.2

BOSTON SCIENTIFIC CORPORATION CONDENSED CONSOLIDATED BALANCE SHEETS
As of
June 30, December 31,
in millions, except share data 2013 2012
(Unaudited)
ASSETS
Current assets:
Cash and cash equivalents $ 530 $ 207
Trade accounts receivable, net 1,278 1,217
Inventories 842 884
Deferred income taxes 496 433
Prepaid expenses and other current assets 352 281
Total current assets 3,498 3,022
Property, plant and equipment, net 1,524 1,564
Goodwill 5,553 5,973
Other intangible assets, net 6,026 6,289
Other long-term assets 395 306
$ 16,996 $ 17,154
LIABILITIES AND STOCKHOLDERS' EQUITY
Current liabilities:
Current debt obligations $ 605 $ 4
Accounts payable 251 232
Accrued expenses 1,365 1,284
Other current liabilities 256 252
Total current liabilities 2,477 1,772
Long-term debt 3,647 4,252
Deferred income taxes 1,711 1,713
Other long-term liabilities 2,558 2,547
Commitments and contingencies
Stockholders' equity
Preferred stock, $.01 par value - authorized 50,000,000
shares, none issued and outstanding
Common stock, $.01 par value - authorized 2,000,000,000
shares and issued 1,551,642,655 shares as of June 30,
2013 and 1,542,347,188 shares as of December 31, 2012 16 15
Treasury stock, at cost 212,293,891 shares as of June 30, 2013
and 186,635,532 shares as of December 31, 2012 (1,292 ) (1,092 )
Additional paid-in capital 16,470 16,429
Accumulated deficit (8,673 ) (8,449 )
Accumulated other comprehensive income (loss), net of tax 82 (33 )
Total stockholders' equity 6,603 6,870
$ 16,996 $ 17,154
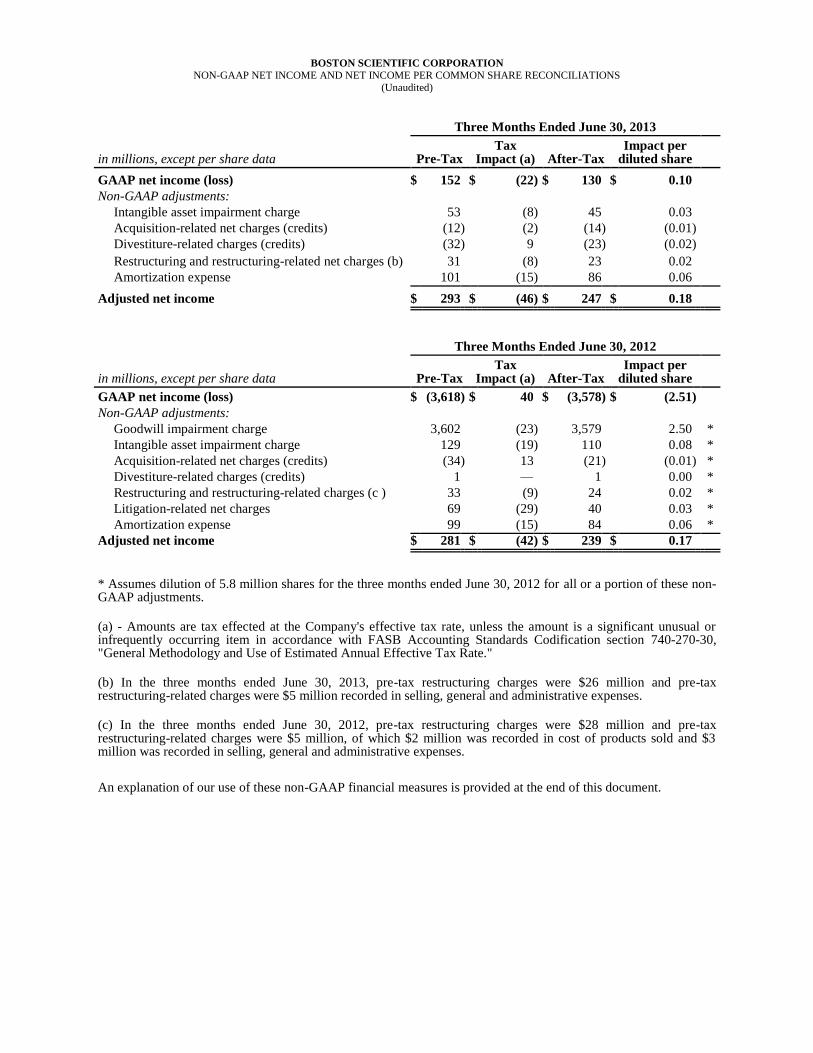
BOSTON SCIENTIFIC CORPORATION NON-GAAP NET INCOME AND NET INCOME PER COMMON SHARE RECONCILIATIONS
(Unaudited)
Three Months Ended June 30, 2013
in millions, except per share data Pre-Tax Tax
Impact (a) After-Tax Impact per
diluted share
GAAP net income (loss) $ 152 $ (22 ) $ 130 $ 0.10
Non-GAAP adjustments:
Intangible asset impairment charge 53 (8 ) 45 0.03
Acquisition-related net charges (credits) (12 ) (2 ) (14 ) (0.01 )
Divestiture-related charges (credits) (32 ) 9 (23 ) (0.02 )
Restructuring and restructuring-related net charges (b) 31 (8 ) 23 0.02
Amortization expense 101 (15 ) 86 0.06
Adjusted net income $ 293 $ (46 ) $ 247 $ 0.18
Three Months Ended June 30, 2012
in millions, except per share data Pre-Tax Tax
Impact (a) After-Tax Impact per
diluted share
GAAP net income (loss) $ (3,618 ) $ 40 $ (3,578 ) $ (2.51 )
Non-GAAP adjustments:
Goodwill impairment charge 3,602 (23 ) 3,579 2.50 *
Intangible asset impairment charge 129 (19 ) 110 0.08 *
Acquisition-related net charges (credits) (34 ) 13 (21 ) (0.01 ) *
Divestiture-related charges (credits) 1 — 1 0.00 *
Restructuring and restructuring-related charges (c ) 33 (9 ) 24 0.02 *
Litigation-related net charges 69 (29 ) 40 0.03 *
Amortization expense 99 (15 ) 84 0.06 *
Adjusted net income $ 281 $ (42 ) $ 239 $ 0.17
* Assumes dilution of 5.8 million shares for the three months ended June 30, 2012 for all or a portion of these non-GAAP adjustments.
(a) - Amounts are tax effected at the Company's effective tax rate, unless the amount is a significant unusual or infrequently occurring item in accordance with FASB Accounting Standards Codification section 740-270-30, "General Methodology and Use of Estimated Annual Effective Tax Rate."
(b) In the three months ended June 30, 2013, pre-tax restructuring charges were $26 million and pre-tax restructuring-related charges were $5 million recorded in selling, general and administrative expenses.
(c) In the three months ended June 30, 2012, pre-tax restructuring charges were $28 million and pre-tax restructuring-related charges were $5 million, of which $2 million was recorded in cost of products sold and $3 million was recorded in selling, general and administrative expenses.
An explanation of our use of these non-GAAP financial measures is provided at the end of this document.

BOSTON SCIENTIFIC CORPORATION NON-GAAP NET INCOME AND NET INCOME PER COMMON SHARE RECONCILIATIONS
(Unaudited)
Six Months Ended June 30, 2013
in millions, except per share data Pre-Tax Tax
Impact (a) After-Tax Impact per
diluted share
GAAP net income (loss) $ (242 ) $ 18 $ (224 ) $ (0.17 )
Non-GAAP adjustments:
Goodwill impairment charge 423 (2 ) 421 0.31 *
Intangible asset impairment charges 53 (8 ) 45 0.03 *
Acquisition-related net charges (credits) (35 ) (1 ) (36 ) (0.03 ) *
Divestiture-related charges (credits) (37 ) 11 (26 ) (0.02 ) *
Restructuring and restructuring-related net charges (b) 46 (12 ) 34 0.03 *
Litigation-related charges 130 (48 ) 82 0.06 *
Amortization expense 204 (29 ) 175 0.14 *
Adjusted net income $ 542 $ (71 ) $ 471 $ 0.35
Six Months Ended June 30, 2012
in millions, except per share data Pre-Tax Tax
Impact (a) After-Tax Impact per
diluted share
GAAP net income (loss) $ (3,495 ) $ 30 $ (3,465 ) $ (2.42 )
Non-GAAP adjustments:
Goodwill impairment charge 3,602 (23 ) 3,579 2.49 **
Intangible asset impairment charge 129 (19 ) 110 0.08 **
Acquisition-related net charges (credits) (21 ) 11 (10 ) (0.01 ) **
Divestiture-related charges (credits) 2 2 — **
Restructuring and restructuring-related charges (c ) 50 (13 ) 37 0.03 **
Litigation-related net charges 69 (29 ) 40 0.03 **
Amortization expense 195 (29 ) 166 0.12 **
Adjusted net income $ 531 $ (72 ) $ 459 $ 0.32
* Assumes dilution of 14.0 million shares for the six months ended June 30, 2013 for all or a portion of these non-GAAP adjustments.
** Assumes dilution of 7.3 million shares for the six months ended June 30, 2012 for all or a portion of these non-GAAP adjustments.
(a) - Amounts are tax effected at the Company's effective tax rate, unless the amount is a significant unusual or infrequently occurring item in accordance with FASB Accounting Standards Codification section 740-270-30, "General Methodology and Use of Estimated Annual Effective Tax Rate."
(b) In the six months ended June 30, 2013, pre-tax restructuring charges were $36 million and pre-tax restructuring-related charges were $10 million recorded in selling, general and administrative expenses.
(c) In the six months ended June 30, 2012, pre-tax restructuring charges were $39 million and pre-tax restructuring-related charges were $11 million, of which $6 million was recorded in cost of products sold and $5 million was recorded in selling, general and administrative expenses.
An explanation of our use of these non-GAAP financial measures is provided at the end of this document.

BOSTON SCIENTIFIC CORPORATION SEGMENT INFORMATION
(Unaudited)
Three Months Ended Six Months Ended
SEGMENT NET SALES* June 30, June 30,
in millions 2013 2012** Change 2013 2012** Change
Interventional Cardiology $ 537 $ 551 (3)% $ 1,050 $ 1,149 (9)%
Peripheral Interventions 205 196 5% 400 384 4%
Cardiovascular 742 747 (1)% 1,450 1,533 (5)%
Cardiac Rhythm Management 485 494 (2)% 970 998 (3)%
Electrophysiology 37 37 (2)% 72 74 (4)%
Rhythm Management 522 531 (2)% 1,042 1,072 (3)%
Endoscopy 334 309 8% 647 607 6%
Urology/Women's Health 126 125 1% 245 243 0%
Neuromodulation 111 92 21% 200 175 14%
MedSurg 571 526 9% 1,092 1,025 6% Subtotal Core Businesses 1,835 1,804 2% 3,584 3,630 (1)%
Divested Businesses 19 31 (38)% 55 60 (7)%
Foreign Currency (45 ) (7 ) N/A (69 ) 4 N/A Worldwide Net Sales $ 1,809 $ 1,828 (1)% $ 3,570 $ 3,694 (3)%
Growth rates are based on actual, non-rounded amounts and may not recalculate precisely.
SEGMENT OPERATING INCOME* Three Months Ended Six Months Ended
June 30, June 30,
in millions 2013 2012** 2013 2012**
Segment operating income
Cardiovascular $ 194 $ 195 $ 364 $ 386
Rhythm Management 61 77 124 160
MedSurg 183 150 333 283
Operating income allocated to reportable segments
438 422 821 829
Corporate expenses and currency exchange (77 ) (71 ) (146 ) (155 )
Goodwill and other intangible asset impairment charges; and acquisition-, divestiture-, restructuring-, and litigation-related net charges and credits (40 ) (3,839 ) (580 ) (3,869 )
Amortization expense (101 ) (99 ) (204 ) (195 )
Operating income (loss) $ 220 $ (3,587 ) $ (109 ) $ (3,390 )
*We measure and evaluate our reportable segments based on segment net sales and operating income, excluding the impact of changes in foreign currency and sales from divested businesses. Sales generated from reportable segments and divested businesses, as well as operating results of reportable segments and corporate expenses, are based on internally-derived standard currency exchange rates, which may differ from year to year, and do not include intersegment profits. We restated segment information for the prior period based on standard currency exchange rates used for the current period in order to remove the impact of foreign currency exchange fluctuations. We exclude from segment operating income certain corporate-related expenses and certain transactions or adjustments that our chief operating decision maker considers to be non-recurring and/or non-operational, such as amounts related to goodwill and other intangible asset impairment charges; acquisition-, divestiture-, restructuring- and litigation-related charges and credits; and amortization expense. Although we exclude these amounts from segment operating income, they are included in reported consolidated operating income (loss) and are included in the reconciliation above.
** We have restated prior year information to conform to current year presentation.
An explanation of the company's use of these non-GAAP financial measures is provided at the end of this document.
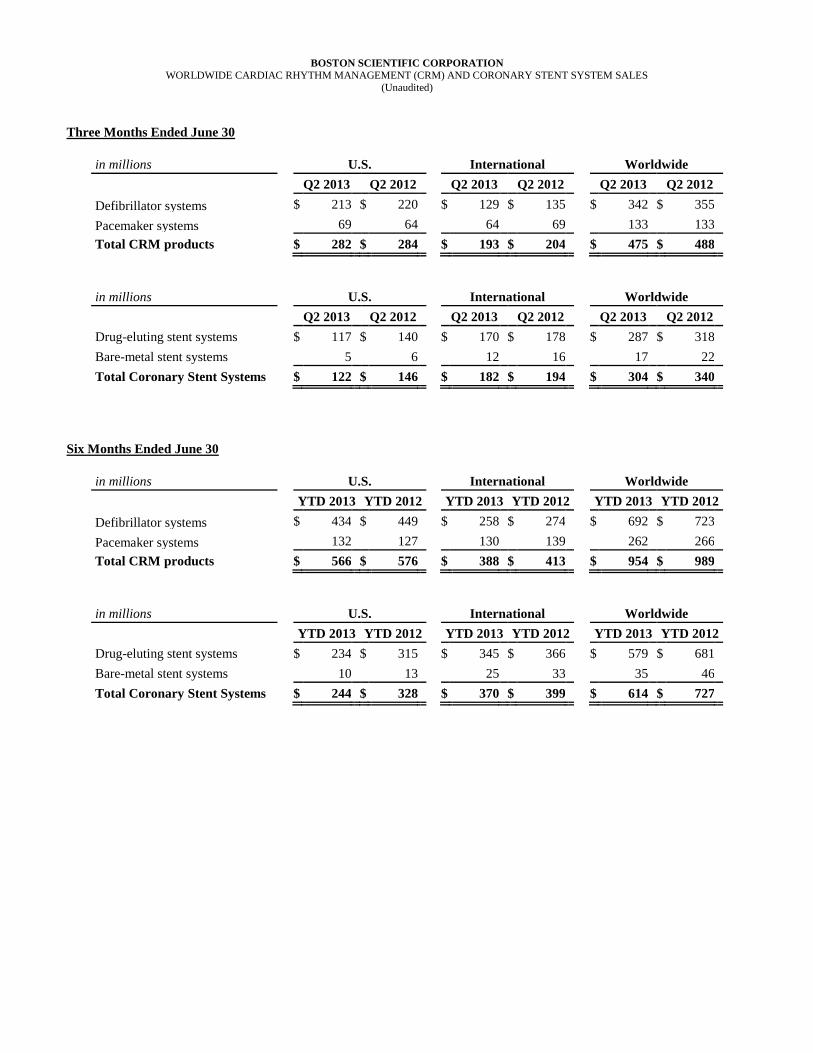
BOSTON SCIENTIFIC CORPORATION WORLDWIDE CARDIAC RHYTHM MANAGEMENT (CRM) AND CORONARY STENT SYSTEM SALES
(Unaudited)
Three Months Ended June 30
in millions U.S. International Worldwide
Q2 2013 Q2 2012 Q2 2013 Q2 2012 Q2 2013 Q2 2012
Defibrillator systems $ 213 $ 220 $ 129 $ 135 $ 342 $ 355
Pacemaker systems 69 64 64 69 133 133
Total CRM products $ 282 $ 284 $ 193 $ 204 $ 475 $ 488
in millions U.S. International Worldwide
Q2 2013 Q2 2012 Q2 2013 Q2 2012 Q2 2013 Q2 2012
Drug-eluting stent systems $ 117 $ 140 $ 170 $ 178 $ 287 $ 318
Bare-metal stent systems 5 6 12 16 17 22
Total Coronary Stent Systems $ 122 $ 146 $ 182 $ 194 $ 304 $ 340
Six Months Ended June 30
in millions U.S. International Worldwide
YTD 2013 YTD 2012 YTD 2013 YTD 2012 YTD 2013 YTD 2012
Defibrillator systems $ 434 $ 449 $ 258 $ 274 $ 692 $ 723
Pacemaker systems 132 127 130 139 262 266
Total CRM products $ 566 $ 576 $ 388 $ 413 $ 954 $ 989
in millions U.S. International Worldwide
YTD 2013 YTD 2012 YTD 2013 YTD 2012 YTD 2013 YTD 2012
Drug-eluting stent systems $ 234 $ 315 $ 345 $ 366 $ 579 $ 681
Bare-metal stent systems 10 13 25 33 35 46
Total Coronary Stent Systems $ 244 $ 328 $ 370 $ 399 $ 614 $ 727

BOSTON SCIENTIFIC CORPORATION BRIC* NET SALES
(Unaudited)
Q2 2013 Percentage change in BRIC Net Sales as compared to Q2 2012
Change Estimated
As Reported Constant Impact of
Currency Currency Foreign
Basis Basis Currency
29% 29 % 0 %
*BRIC - Countries comprised of Brazil, Russia, India and China

BOSTON SCIENTIFIC CORPORATION ESTIMATED NON-GAAP NET INCOME PER COMMON SHARE RECONCILIATIONS
(Unaudited)
Q3 and Full Year 2013 EPS Guidance
Q3 2013 Estimate Full Year 2013 Estimate
(Low) (High) (Low) (High)
GAAP results $ 0.03 $ 0.05 $ (0.07 ) $ (0.01 )
Goodwill impairment charge — — 0.31 0.31 Intangible asset impairment charges — — 0.03 0.03 Estimated acquisition-related net charges (credits) 0.02 0.02 0.01 0.00 Estimated divestiture-related net credits (0.01 ) (0.01 ) (0.02 ) (0.02 )
Estimated restructuring-related charges 0.04 0.04 0.09 0.08 Litigation-related charges — — 0.06 0.06 Estimated amortization expense 0.06 0.06 0.26 0.26
Adjusted results $ 0.14 $ 0.16 $ 0.67 $ 0.71
An explanation of our use of these non-GAAP financial measures is provided at the end of this document.

Use of Non-GAAP Financial Measures
To supplement our unaudited condensed consolidated financial statements presented on a GAAP basis,
we disclose certain non-GAAP financial measures, including adjusted net income and adjusted net
income per share that exclude certain amounts, and revenue growth rates that exclude the impact of
changes in foreign currency exchange rates. These non-GAAP financial measures are not in accordance
with generally accepted accounting principles in the United States.
The GAAP financial measure most directly comparable to adjusted net income is GAAP net income and
the GAAP financial measure most directly comparable to adjusted net income per share is GAAP net
income per share. To calculate revenue growth rates that exclude the impact of changes in foreign
currency exchange rates, we convert actual net sales from local currency to U.S. dollars using constant
foreign currency exchange rates in the current and prior period. The GAAP financial measure most
directly comparable to this non-GAAP financial measure is growth rate percentages using net sales on a
GAAP basis. Reconciliations of each of these non-GAAP financial measures to the corresponding GAAP
financial measure are included in the accompanying schedules.
Management uses these supplemental non-GAAP financial measures to evaluate performance period
over period, to analyze the underlying trends in our business, to assess our performance relative to our
competitors, and to establish operational goals and forecasts that are used in allocating resources. In
addition, management uses these non-GAAP financial measures to further its understanding of the
performance of our operating segments. The adjustments excluded from our non-GAAP financial
measures are consistent with those excluded from our operating segments' measures of net sales and
profit or loss. These adjustments are excluded from the segment measures that are reported to our chief
operating decision maker that are used to make operating decisions and assess performance.
We believe that presenting adjusted net income, adjusted net income per share, and revenue growth rates
that exclude certain amounts and/or the impact of changes in foreign currency exchange rates, in addition
to the corresponding GAAP financial measures, provides investors greater transparency to the
information used by management for its financial and operational decision-making and allows investors
to see our results “through the eyes” of management. We further believe that providing this information
assists our investors in understanding our operating performance and the methodology used by
management to evaluate and measure such performance.
The following is an explanation of each of the adjustments that management excluded as part of these
non-GAAP financial measures for the three and six months ended June 30, 2013 and 2012, and for the
forecasted three month period ending September 30, 2013 and full year ending December 31, 2013, as
well as reasons for excluding each of these individual items:

Adjusted Net Income and Adjusted Net Income per Share:
Goodwill and other intangible asset impairment charges - These amounts represent a) a non-cash write-down of our goodwill balance attributable to our global Cardiac Rhythm Management reporting unit in the first quarter of 2013; b) non-cash write-downs of certain intangible asset balances in the second quarter of 2013; c) a non-cash write-down of our goodwill balance attributable to our Europe, Middle East and Africa (EMEA) reporting unit in the second quarter of 2012; and d) a non-cash write-down of certain intangible asset balances in the second quarter of 2012. We remove the impact of non-cash impairment charges from our operating performance to assist in assessing our cash generated from operations. We believe this is a critical metric for us in measuring our ability to generate cash and invest in our growth. Therefore, this charge is excluded from management's assessment of operating performance and is also excluded for purposes of calculating these non-GAAP financial measures to facilitate an evaluation of our current operating performance and a comparison to our past operating performance, particularly in terms of liquidity.
Acquisition-related charges (credits) - These adjustments consist of (a) contingent consideration fair value adjustments, and (b) due diligence, other fees and exit costs. The contingent consideration adjustments represent accounting adjustments to state contingent consideration liabilities at their estimated fair value. These adjustments can be highly variable depending on the assessed likelihood and amount of future contingent consideration payments. Due diligence, other fees and exit costs include legal, tax, severance and other expenses associated with prior acquisitions that are not representative of on-going operations. Accordingly, management excluded these amounts for purposes of calculating these non-GAAP financial measures to facilitate an evaluation of our current operating performance and a comparison to our past operating performance.
Divestiture-related expenses (gains) - These amounts represent separation costs or recognized gains associated with the sale of our Neurovascular business in January 2011. Separation costs and gains on the sale represent those associated with the divestiture and are not representative of on-going operations. Accordingly, management excluded these amounts for purposes of calculating these non-GAAP financial measures to facilitate an evaluation of our current operating performance and a comparison to our past operating performance.
Restructuring and restructuring-related costs (credits) - These adjustments represent primarily severance and other direct costs associated with our 2011 Restructuring program. These costs are excluded by management in assessing our operating performance, as well as from our operating segments' measures of profit and loss used for making operating decisions and assessing performance. Accordingly, management excluded these costs for purposes of calculating these non-GAAP financial measures to facilitate an evaluation of our current operating performance and a comparison to our past operating performance.
Litigation-related net charges - These adjustments include certain significant product liability and other litigation-related charges and credits. These amounts are excluded by management in assessing our operating performance, as well as from our operating segments' measures of profit and loss used for making operating decisions and assessing performance. Accordingly, management excluded these amounts for purposes of calculating these non-GAAP financial measures to facilitate an evaluation of our current operating performance and a comparison to our past operating performance.
Discrete tax items - These items represent adjustments of certain tax positions, which were initially established in prior periods as a result of intangible asset impairment charges; acquisition-, divestiture-, restructuring- or litigation-related charges or credits. These adjustments do not reflect expected on-going operating results. Accordingly, management excluded these amounts for purposes of calculating these non-GAAP financial measures to facilitate an evaluation of our current operating performance and a comparison to our past operating performance.
Amortization expense - Amortization expense is a non-cash expense and does not impact our liquidity or compliance with the covenants included in our credit facility agreement. Management removes the impact of amortization from our operating performance to assist in assessing our cash generated from operations. We believe this is a critical metric for measuring our ability to generate cash and invest in our growth. Therefore, amortization expense is excluded from management's assessment of operating performance and is also excluded from the measures management uses to set employee compensation. Accordingly, management has excluded amortization expense for purposes of calculating these non-GAAP financial measures to facilitate an evaluation of our current operating performance, particularly in terms of liquidity.
Revenue Growth Rates Excluding the Impact of Changes in Foreign Currency Exchange Rates
Changes in foreign currency exchange rates - The impact of changes in foreign currency exchange rates is highly variable and difficult to predict. Accordingly, management excludes the impact of changes in foreign currency exchange rates for purposes of reviewing revenue growth rates to facilitate an evaluation of our current operating performance and a comparison to our past operating performance.
Adjusted net income, adjusted net income per share and revenue growth rates that exclude certain
amounts and/or the impact of changes in foreign currency exchange rates are not in accordance with U.S.
GAAP and should not be considered in isolation from or as a replacement for the most directly
comparable GAAP financial measures. Further, other companies may calculate these non-GAAP
financial measures differently than we do, which may limit the usefulness of those measures for
comparative purposes.