Boss, E., et al. Observations of pigment and particle ...
11
Observations of pigment and particle distributions in the western North Atlantic from an autonomous float and ocean color satellite E. Boss 1 School of Marine Sciences, University of Maine, Orono, Maine 04469 D. Swift School of Oceanography, University of Washington, Seattle, Washington 98195-7940 L. Taylor and P. Brickley School of Marine Sciences, University of Maine, Orono, Maine 04469 R. Zaneveld WET Labs, Inc., P.O. Box 518, 620 Applegate Street, Philomath, Oregon 97370 S. Riser School of Oceanography, University of Washington, Seattle, Washington 98195-7940 M. J. Perry Ira C. Darling Marine Center and School of Marine Sciences, University of Maine, Walpole, Maine 04573 P. G. Strutton College of Oceanic and Atmospheric Sciences, Oregon State University, Corvallis, Oregon 97331 Abstract Profiling floats with optical sensors can provide important complementary data to satellite ocean color determinations by providing information about the vertical structure of ocean waters, as well as surface waters obscured by clouds. Here we demonstrate this ability by pairing satellite ocean color data with records from a profiling float that obtained continuous, high-quality optical data for 3 yr in the North Atlantic Ocean. Good agreement was found between satellite and float data, and the relationship between satellite chlorophyll and float- derived particulate backscattering was consistent with previously published data. Upper ocean biogeochemical dynamics were evidenced in float measurements, which displayed strong seasonal patterns associated with phytoplankton blooms, and depth and seasonal patterns associated with an increase in pigmentation per particle at low light. Surface optical variables had shorter decorrelation timescales than did physical variables (unlike at low latitudes), suggesting that biogeochemical rather than physical processes controlled much of the observed variability. After 2.25 yr in the subpolar North Atlantic between Newfoundland and Greenland, the float crossed the North Atlantic Current to warmer waters, where it sampled an unusual eddy for 3 months. This anticyclonic feature contained elevated particulate material from surface to 1000-m depth and was the only such event in the float’s record. This eddy was associated with weakly elevated surface pigment and backscattering, but depth- integrated backscattering was similar to that previously observed during spring blooms. Such seldom-observed eddies, if frequent, are likely to make an important contribution to the delivery of particles to depth. Upper ocean processes have long been known to regulate the vertical distribution of phytoplankton and the dynam- ics of blooms and primary production (e.g., Riley et al. 1949; Sverdrup 1953; Denman and Gargett 1983; Smetacek and Passow 1990) through their influence on nutrient and light availability. Unfortunately, estimating primary pro- duction (PP) from shipboard observations at the temporal and spatial scales relevant to quantify the oceans’ role in global elemental cycling and climate is not practical. Efforts have therefore been directed toward estimating PP from remotely observed ocean color. At this time, however, remotely sensed ocean color alone cannot provide sufficiently accurate estimates of phytoplankton standing stocks and PP in the upper ocean. The primary limitations are (1) no consensus exists regarding appropriate algo- rithms for calculating PP and associated uncertainties, (2) ocean color data provide only surface observations, so that 1 Corresponding author ([email protected]). Acknowledgments Discussions with F. Chai and M. Behrenfeld and comments by H. Claustre and an anonymous reviewer are gratefully acknowl- edged. This work was made possible with funding from the Ocean Biology and Biogeochemistry Program of the National Aeronau- tics and Space Administration under grant number NAG5-12473. Limnol. Oceanogr., 53(5, part 2), 2008, 2112–2122 E 2008 by the American Society of Limnology and Oceanography, Inc. 2112
Transcript of Boss, E., et al. Observations of pigment and particle ...
Observations of pigment and particle distributions in the western North Atlantic from
an autonomous float and ocean color satellite
E. Boss1
School of Marine Sciences, University of Maine, Orono, Maine 04469
D. SwiftSchool of Oceanography, University of Washington, Seattle, Washington 98195-7940
L. Taylor and P. BrickleySchool of Marine Sciences, University of Maine, Orono, Maine 04469
R. ZaneveldWET Labs, Inc., P.O. Box 518, 620 Applegate Street, Philomath, Oregon 97370
S. RiserSchool of Oceanography, University of Washington, Seattle, Washington 98195-7940
M. J. PerryIra C. Darling Marine Center and School of Marine Sciences, University of Maine, Walpole, Maine 04573
P. G. StruttonCollege of Oceanic and Atmospheric Sciences, Oregon State University, Corvallis, Oregon 97331
Abstract
Profiling floats with optical sensors can provide important complementary data to satellite ocean colordeterminations by providing information about the vertical structure of ocean waters, as well as surface watersobscured by clouds. Here we demonstrate this ability by pairing satellite ocean color data with records from aprofiling float that obtained continuous, high-quality optical data for 3 yr in the North Atlantic Ocean. Goodagreement was found between satellite and float data, and the relationship between satellite chlorophyll and float-derived particulate backscattering was consistent with previously published data. Upper ocean biogeochemicaldynamics were evidenced in float measurements, which displayed strong seasonal patterns associated withphytoplankton blooms, and depth and seasonal patterns associated with an increase in pigmentation per particleat low light. Surface optical variables had shorter decorrelation timescales than did physical variables (unlike atlow latitudes), suggesting that biogeochemical rather than physical processes controlled much of the observedvariability. After 2.25 yr in the subpolar North Atlantic between Newfoundland and Greenland, the float crossedthe North Atlantic Current to warmer waters, where it sampled an unusual eddy for 3 months. This anticyclonicfeature contained elevated particulate material from surface to 1000-m depth and was the only such event in thefloat’s record. This eddy was associated with weakly elevated surface pigment and backscattering, but depth-integrated backscattering was similar to that previously observed during spring blooms. Such seldom-observededdies, if frequent, are likely to make an important contribution to the delivery of particles to depth.
Upper ocean processes have long been known to regulatethe vertical distribution of phytoplankton and the dynam-ics of blooms and primary production (e.g., Riley et al.1949; Sverdrup 1953; Denman and Gargett 1983; Smetacek
and Passow 1990) through their influence on nutrient andlight availability. Unfortunately, estimating primary pro-duction (PP) from shipboard observations at the temporaland spatial scales relevant to quantify the oceans’ role inglobal elemental cycling and climate is not practical.
Efforts have therefore been directed toward estimatingPP from remotely observed ocean color. At this time,however, remotely sensed ocean color alone cannot providesufficiently accurate estimates of phytoplankton standingstocks and PP in the upper ocean. The primary limitationsare (1) no consensus exists regarding appropriate algo-rithms for calculating PP and associated uncertainties, (2)ocean color data provide only surface observations, so that
1 Corresponding author ([email protected]).
AcknowledgmentsDiscussions with F. Chai and M. Behrenfeld and comments by
H. Claustre and an anonymous reviewer are gratefully acknowl-edged.
This work was made possible with funding from the OceanBiology and Biogeochemistry Program of the National Aeronau-tics and Space Administration under grant number NAG5-12473.
Limnol. Oceanogr., 53(5, part 2), 2008, 2112–2122
E 2008 by the American Society of Limnology and Oceanography, Inc.
2112
estimates of subsurface distributions must rely on poorlyconstrained assumptions, (3) satellites chronically under-sample cloudy regions, and (4) the atmosphere providesnearly 95% of the signal retrieved by the satellite, so veryaccurate atmospheric correction schemes are required forreliable estimates of water-leaving radiance. Since anybiases in estimated PP and algal standing stock directlyaffect downstream estimates of oceanic carbon budgets andfluxes, reducing uncertainties in ocean-color-based algo-rithms will directly improve quantitative characterizationsof global biogeochemical processes.
Profiling floats measuring physical parameters such astemperature and salinity have been in operation since thelate 1990s and are part of an international observationnetwork (Argo, e.g., Gould et al. 2004). However, very fewprofiling floats have been fitted with sensors that monitorthe ocean’s biogeochemistry. Recent effort has beendevoted to pushing for the addition of oxygen sensors tothe Argo floats (Kortzinger et al. 2006). The float describedin this paper was equipped with optical sensors capable ofproviding estimates of the standing stock of particles andphytoplankton chlorophyll a (Chl a) pigment.
Optical properties such as the diffuse attenuationcoefficient and beam attenuation have been previouslymeasured with profiling floats (Mitchell et al. 2000; Bishopet al. 2002, 2004) to investigate the dynamics of phyto-plankton and particulate organic materials in the upperocean for periods of up to 18 months (Bishop et al. 2004).Bishop et al. (2002) used dusk-to-dawn changes in beamattenuation to estimate growth rates of phytoplankton inthe upper ocean and related those rates to dust depositionevents in the North Pacific.
Here we showcase the use of a profiling float to routinelyobtain observations of upper-ocean hydrographical andoptical properties that can be linked to ocean colormeasurements, as would be possible if such sensors wereincorporated into an Argo-like program. In addition tomeasuring algal and particulate carbon parametersthroughout the year, such floats provide measurements incloudy conditions and can be used to interpolate missingremotely sensed data. The floats also provide distributionsof biogeochemical parameters as a function of depth.Together with physical data collected by float and satellitesensors, some links between upper ocean dynamics andbiogeochemistry are studied.
Materials and methods
A Webb Research APEX float was fitted with a Sea-BirdElectronics SBE41 conductivity–temperature–depth (CTD)and a single-prototype, flat-faced digital WET Labshockey-puck-sized sensor package that included twosensors: one measuring side scattering at 880 nm (WETLabs light-scattering sensor [LSS], e.g., Baker et al. 2001)and the other measuring Chl a fluorescence (470 nmexcitation, 680 nm emission, analogous to the commercial-ly available WET Labs ECO fluorometer). The LSS waschosen because it was deemed to be the most sensitivesingle-faced scattering sensor available at the time and ithad the ability to provide estimates of mass concentration
of particles in the deep ocean with an accuracy similar tothat of beam transmissometers (Baker et al. 2001).Chlorophyll fluorescence provides a proxy for chlorophyllconcentration and standing stocks of phytoplanktonbiomass (Cullen 1982), and scattering provides a proxyfor total particulate mass and particulate organic carbon(Baker et al. 2001; Stramski et al. 2008).
The CTD was mounted at the top of the float and theoptical package was mounted near the bottom, facingapproximately 45u outward from the downward directionto avoid reflections from the float and sedimentation ofparticles onto the sensor face. An oxygen sensor was alsodeployed on the float but failed within 6 months of launch;hence, O2 data are not reported here. Sensors wereintegrated into the float using a Sea-Bird Electronics Apf9acontroller. Before launch, the float and sensors were testedfor pressure effects and endurance in a pressure tanksimulating 50 dive cycles to 1200 m, with data recordedthroughout.
Fluorometer calibration—The chlorophyll fluorescencesensor was calibrated in the lab by the manufacturer with asuspension of spinach chloroplasts and by us with a diatomculture at the University of Maine. Two vicarious fieldcalibrations were also performed. The float’s first 70 d ofchlorophyll data were compared with those from threesimilar optical sensors deployed on a Labrador Seamooring in June 2004 (simultaneous with float deployment)and calibrated with chlorophyll extracted from localwaters. Three years of float chlorophyll data werevicariously calibrated against the National Aeronauticsand Space Administration’s (NASA’s) moderate resolutionimaging spectroradiometer (MODIS) chlorophyll product.
Calibration provides two parameters for convertingmeasured fluorescence counts to estimated chlorophyllconcentration: a dark signal measured in the absence offluorescence and a slope parameter describing a linear fit offluorescence to chlorophyll. The dark signal was estab-lished by following the manufacturer’s recommendation tocover the detector with black tape and to immerse theinstrument in water while recording the output signal.During simulated dives in a pressure tank, dark countsvaried between 24 and 28 counts (with a minimum of 19and a maximum of 31 counts). The dark count valuereported by the manufacturer was 28, and the minimum wemeasured in the field was 23 counts. Given this variability,we used a dark count of 25 in the calculations presentedbelow, and we propagated an uncertainty of 6 counts in theestimates of uncertainties. (For comparison, 1 mg m23
chlorophyll equals 500 counts.)The slope relating measured fluoresced intensity (minus
the dark signal, in counts) to chlorophyll concentration (inmg m23) is inherently variable because of biologicalvariability in chlorophyll-normalized absorption and fluo-rescence quantum yield (Cullen 1982). Further uncertaintywas introduced into our fluorescence-to-chlorophyll con-versions by the fact that the 470-nm excitation bandassociated with our sensor is not at the peak of chlorophyllabsorption but rather that of accessory pigments that arepassing electrons to the chlorophyll (Perry et al. 2008).
North Atlantic pigments and particles 2113
The manufacturer’s regression slope for our fluorometer(9.2 3 1023 mg chlorophyll m23 count21), on the basis ofspinach chloroplasts as the calibration standard, differedfrom the slope obtained at the University of Maine (10.8 31023 mg chlorophyll m23 count21) with a diatom culture.Vicarious calibration against the mooring sensors resultedin a lower slope (4.2 3 1023 mg chlorophyll m23 count21,40 match-ups, correlation coefficient R 5 0.76), andregression with NASA’s MODIS chlorophyll product (seebelow) resulted in an even lower slope (2 3 1023 mgchlorophyll m23 count21, 221 match-ups, R 5 0.88). Weelected to use the MODIS slope in the calculationspresented here but suggest that these values may be biasedlow by as much as a factor of 2, with a minimal absoluteuncertainty of 60.03 mg chlorophyll m23 (NASA reportstheir product to have an average global uncertainty of 30%;see also discussion in Perry et al. 2008).
LSS calibration—The LSS was calibrated by themanufacturer with both a turbidity standard (formazine)and polystyrene calibration beads (Duke Scientific) whiletaking simultaneous measurements with a spectral beamtransmissometer (WET Labs ac9). The LSS was designedto provide a robust estimate of mass concentration ofparticles (turbidity); as such, it does not have a well-definedsampling volume or well-defined scattering angle but insteadcollects light scattered from all angles, with maximalresponse to sidescattered photons (Baker et al. 2001).
The LSS calibration provides two parameters: a darksignal measured in the absence of a scattering substanceand a slope parameter that relates the counts measured bythe instrument (minus the dark counts) to the concentra-tion of the calibration standard (expressed in nephelometricturbidity units, when calibrated against formazine or inm21 when calibrated against a beam attenuation meter or abackscattering sensor). The dark counts were estimated bythe manufacturer to be 41.8, and in our pressure tests theyvaried between 50 and 54. The lowest value measured in thefield was 59 counts. Since the pressure tests were done justbefore deployment, we used the lab average of 51.8 countsas the dark count in the calculations presented here, and wepropagated an uncertainty of 10 counts.
The slope parameter determined using a beam transmis-someter measuring attenuation at 650 nm differed by afactor of 3 for the formazine (1.30 3 1024 m21 count21)and calibration bead (3.21 3 1024 m21 count21) solutions.Two vicarious field calibrations were also performed. Theslope derived from calibration against three near-surface,bead-calibrated 440-nm backscattering sensors (i.e., pro-viding an estimate of bbp[440]) on the Labrador Seamooring (1.48 3 1025 m21 count21; 40 match-ups, R 50.64) differed by less than 10% from a regression withinversion-derived estimates of satellite-measured backscat-tering (1.64 3 1025 m21 count21; 213 match-ups; seebelow for details of the ocean color processing). For ourcalculations of mass concentrations of particles, we electedto use the MODIS (satellite) slope.
Theoretical considerations—i.e., Mie calculations using aFournier–Forand analytical phase function (Fournier and
Jonasz 1999); indices of refraction, n, varying from 1.05 to1.15; and a particulate size distribution with differentialpower-law slopes varying from 3.5 to 4.5 (slopes fromStramski and Kiefer 1991)—suggest that the ratio ofparticulate backscattering at 440 nm to the scatteringmeasured by the LSS at 880 nm can vary from 0.2 to0.56. This range of ratios would be much smaller forsamples in which the particle composition varies less widelythan in the theoretical calculations (e.g., for a population ofnear-surface organic particles). On the basis of the factorsdetailed above, we estimate the uncertainties in thebackscattering coefficients reported here to be on the orderof a factor of two, with an absolute uncertainty in thebackscattering coefficient at 440 nm of 3 3 1024 m21. Toput this in perspective we note that the backscatteringcoefficient of pure seawater at 440 nm is 5.0 3 1023
(Twardowski et al. 2007).
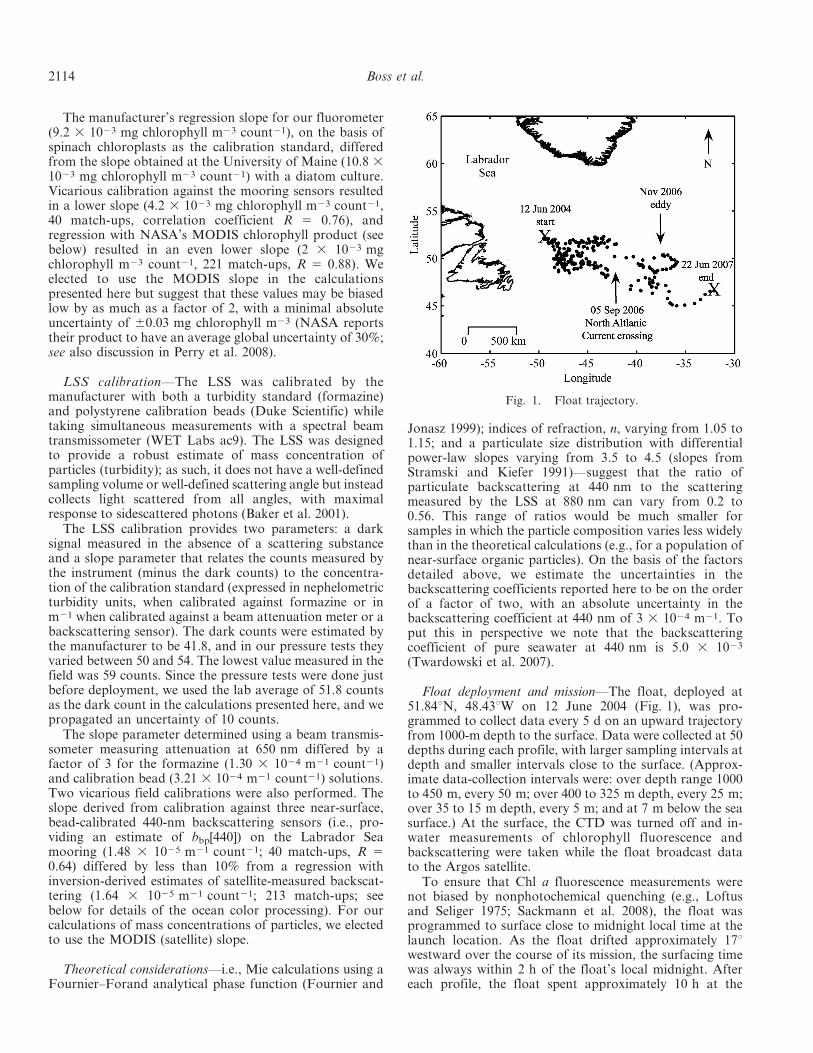
Float deployment and mission—The float, deployed at51.84uN, 48.43uW on 12 June 2004 (Fig. 1), was pro-grammed to collect data every 5 d on an upward trajectoryfrom 1000-m depth to the surface. Data were collected at 50depths during each profile, with larger sampling intervals atdepth and smaller intervals close to the surface. (Approx-imate data-collection intervals were: over depth range 1000to 450 m, every 50 m; over 400 to 325 m depth, every 25 m;over 35 to 15 m depth, every 5 m; and at 7 m below the seasurface.) At the surface, the CTD was turned off and in-water measurements of chlorophyll fluorescence andbackscattering were taken while the float broadcast datato the Argos satellite.
To ensure that Chl a fluorescence measurements werenot biased by nonphotochemical quenching (e.g., Loftusand Seliger 1975; Sackmann et al. 2008), the float wasprogrammed to surface close to midnight local time at thelaunch location. As the float drifted approximately 17uwestward over the course of its mission, the surfacing timewas always within 2 h of the float’s local midnight. Aftereach profile, the float spent approximately 10 h at the
Fig. 1. Float trajectory.
2114 Boss et al.
surface, sending data to the Argos satellite (using analgorithm that ensured that at least 95% of the data wouldbe transferred) and collecting optical surface data beforereturning to its parking depth at 1000 m.
Satellite ocean color—Ocean color remote sensingproducts were obtained from http://oceancolor.gsfc.nasa.gov/PRODUCTS/. For remotely sensed chlorophyll con-centrations, we used NASA’s OC3 standard chlorophyllproduct for the MODIS. For the remotely sensedparticulate backscattering coefficient at 440 nm (bbp[440]),we used normalized water-leaving radiances and theinversion algorithm outlined in Maritorena et al. (2002).Level 2 data were processed as follows: all satellite passeswithin a 6-h period (which amount to all data collectedwithin a daylight period) were averaged into a single scene.The data were subsequently median-averaged over allnonmasked data pixels within 7.5 km of the float’s mostrecent location. (The 7.5-km scale was based on a spatialdecorrelation analysis [not shown] and agrees with the localbaroclinic radius of deformation [e.g., Smith et al. 2000].)For vicarious calibration of the float’s two sensors(described above), the ocean color data were interpolatedto the time of the float’s surfacing (with slightly fewermatch-ups for backscattering than for chlorophyll: n 5 213for bbp and n 5 221 for chlorophyll).
We tested for contamination of pixels adjacent to cloudsby applying a dilation operator. Cloud-masked regionswere enlarged by a binary dilation operation with a disk-shaped kernel (two-pixel radius) to remove cloud edgeeffects (Gonzales and Woods 1992). This operation reducedthe number of available remotely sensed spectra obtainedfor 12 June 2004 to 1 May 2007 from 233 to 150 withoutsignificantly changing either the correlation coefficient orthe calibration slope between in situ data and thoseinverted from satellite. We thus elected not to apply thedilation procedure in the analyses that follow.
Sea surface height—Sea surface height anomaly datawith Ju resolution were obtained from the ColoradoCenter for Astrodynamics Research at the University ofColorado, Boulder. Data were processed as in Leben et al.(2002).
Results
Sensor stability and general oceanographic consistency—Float 0005 accomplished 221 profiles of the upper 1000 mof the western North Atlantic Ocean, one every 5 d,between its launch on 12 June 2004 and its disappearanceon 22 June 2007. The float spent most of its mission in thesubpolar gyre before crossing the North Atlantic Current in
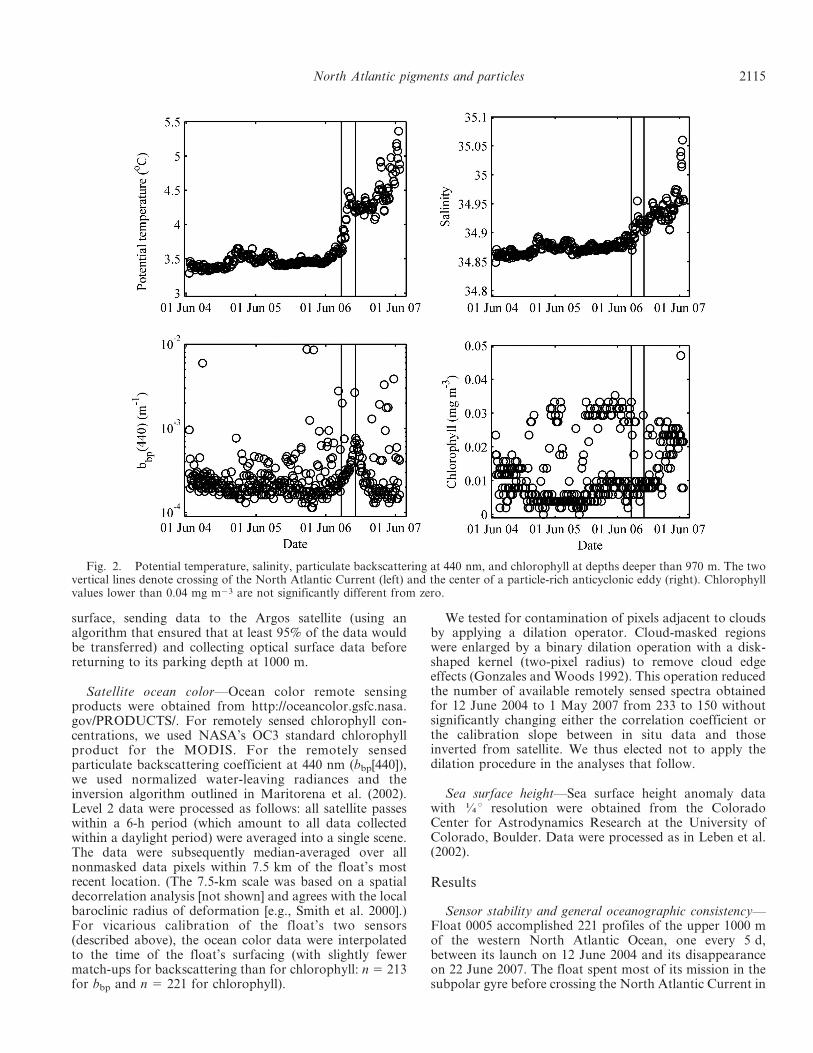
Fig. 2. Potential temperature, salinity, particulate backscattering at 440 nm, and chlorophyll at depths deeper than 970 m. The twovertical lines denote crossing of the North Atlantic Current (left) and the center of a particle-rich anticyclonic eddy (right). Chlorophyllvalues lower than 0.04 mg m23 are not significantly different from zero.
North Atlantic pigments and particles 2115
September 2006 and drifting into warmer waters to thesouth (Fig. 1). The float then spent approximately3 months within an anticyclonic eddy with highly elevatedbackscattering values (see below).
For one assessment of sensor stability, we examined datafrom depths greater than 970 m, with the expectation thatin the absence of sensor drift, these deep-water valuesshould remain approximately consistent throughout thefloat mission. Except for rare spikes in the backscatteringcoefficient (probably associated with occasional largeparticles entering the field of view of the sensor) and thehigher values associated with passage through an eddy, thedeep values are approximately constant (bbp[440] ,0.00015 m21), suggesting that the float sensors were stableover the course of the 3-yr mission (Fig. 2). The variabilityof the deep-water backscattering is on the order of 10% ofthe backscattering by pure seawater. Ultimately this is theuncertainty when using the float data as validation forsatellite-derived backscattering values.
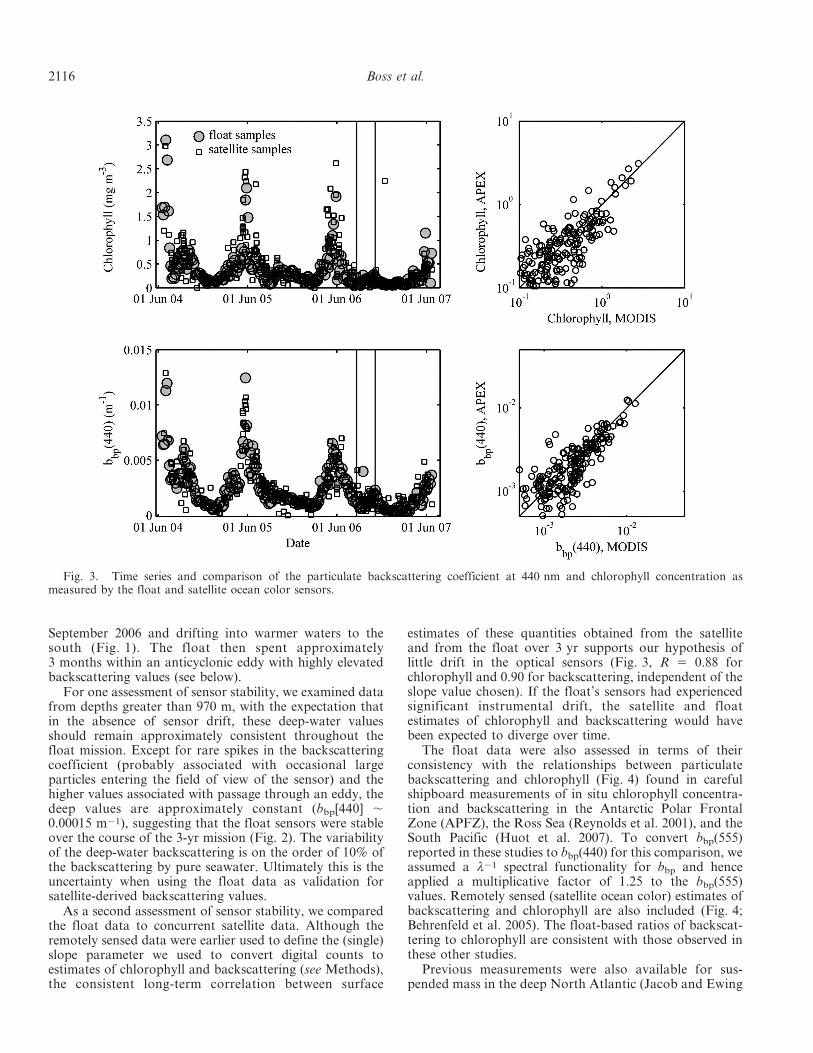
As a second assessment of sensor stability, we comparedthe float data to concurrent satellite data. Although theremotely sensed data were earlier used to define the (single)slope parameter we used to convert digital counts toestimates of chlorophyll and backscattering (see Methods),the consistent long-term correlation between surface
estimates of these quantities obtained from the satelliteand from the float over 3 yr supports our hypothesis oflittle drift in the optical sensors (Fig. 3, R 5 0.88 forchlorophyll and 0.90 for backscattering, independent of theslope value chosen). If the float’s sensors had experiencedsignificant instrumental drift, the satellite and floatestimates of chlorophyll and backscattering would havebeen expected to diverge over time.
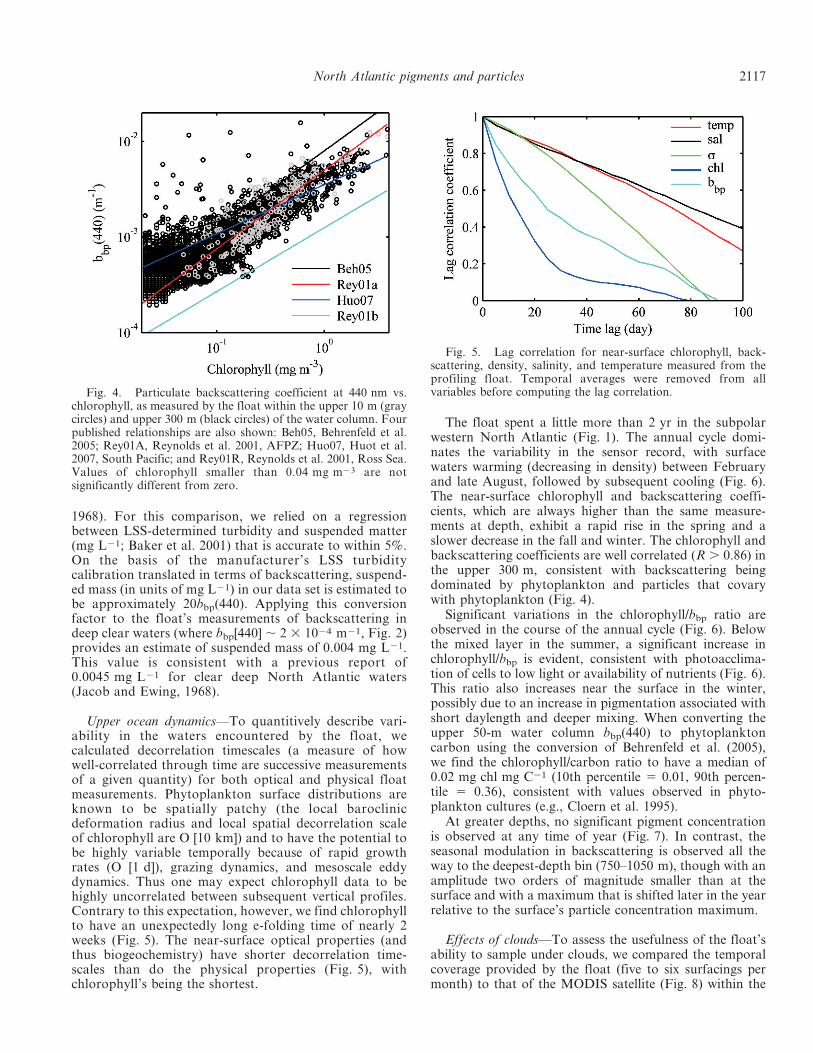
The float data were also assessed in terms of theirconsistency with the relationships between particulatebackscattering and chlorophyll (Fig. 4) found in carefulshipboard measurements of in situ chlorophyll concentra-tion and backscattering in the Antarctic Polar FrontalZone (APFZ), the Ross Sea (Reynolds et al. 2001), and theSouth Pacific (Huot et al. 2007). To convert bbp(555)reported in these studies to bbp(440) for this comparison, weassumed a l21 spectral functionality for bbp and henceapplied a multiplicative factor of 1.25 to the bbp(555)values. Remotely sensed (satellite ocean color) estimates ofbackscattering and chlorophyll are also included (Fig. 4;Behrenfeld et al. 2005). The float-based ratios of backscat-tering to chlorophyll are consistent with those observed inthese other studies.
Previous measurements were also available for sus-pended mass in the deep North Atlantic (Jacob and Ewing
Fig. 3. Time series and comparison of the particulate backscattering coefficient at 440 nm and chlorophyll concentration asmeasured by the float and satellite ocean color sensors.
2116 Boss et al.
1968). For this comparison, we relied on a regressionbetween LSS-determined turbidity and suspended matter(mg L21; Baker et al. 2001) that is accurate to within 5%.On the basis of the manufacturer’s LSS turbiditycalibration translated in terms of backscattering, suspend-ed mass (in units of mg L21) in our data set is estimated tobe approximately 20bbp(440). Applying this conversionfactor to the float’s measurements of backscattering indeep clear waters (where bbp[440] , 2 3 1024 m21, Fig. 2)provides an estimate of suspended mass of 0.004 mg L21.This value is consistent with a previous report of0.0045 mg L21 for clear deep North Atlantic waters(Jacob and Ewing, 1968).
Upper ocean dynamics—To quantitively describe vari-ability in the waters encountered by the float, wecalculated decorrelation timescales (a measure of howwell-correlated through time are successive measurementsof a given quantity) for both optical and physical floatmeasurements. Phytoplankton surface distributions areknown to be spatially patchy (the local baroclinicdeformation radius and local spatial decorrelation scaleof chlorophyll are O [10 km]) and to have the potential tobe highly variable temporally because of rapid growthrates (O [1 d]), grazing dynamics, and mesoscale eddydynamics. Thus one may expect chlorophyll data to behighly uncorrelated between subsequent vertical profiles.Contrary to this expectation, however, we find chlorophyllto have an unexpectedly long e-folding time of nearly 2weeks (Fig. 5). The near-surface optical properties (andthus biogeochemistry) have shorter decorrelation time-scales than do the physical properties (Fig. 5), withchlorophyll’s being the shortest.
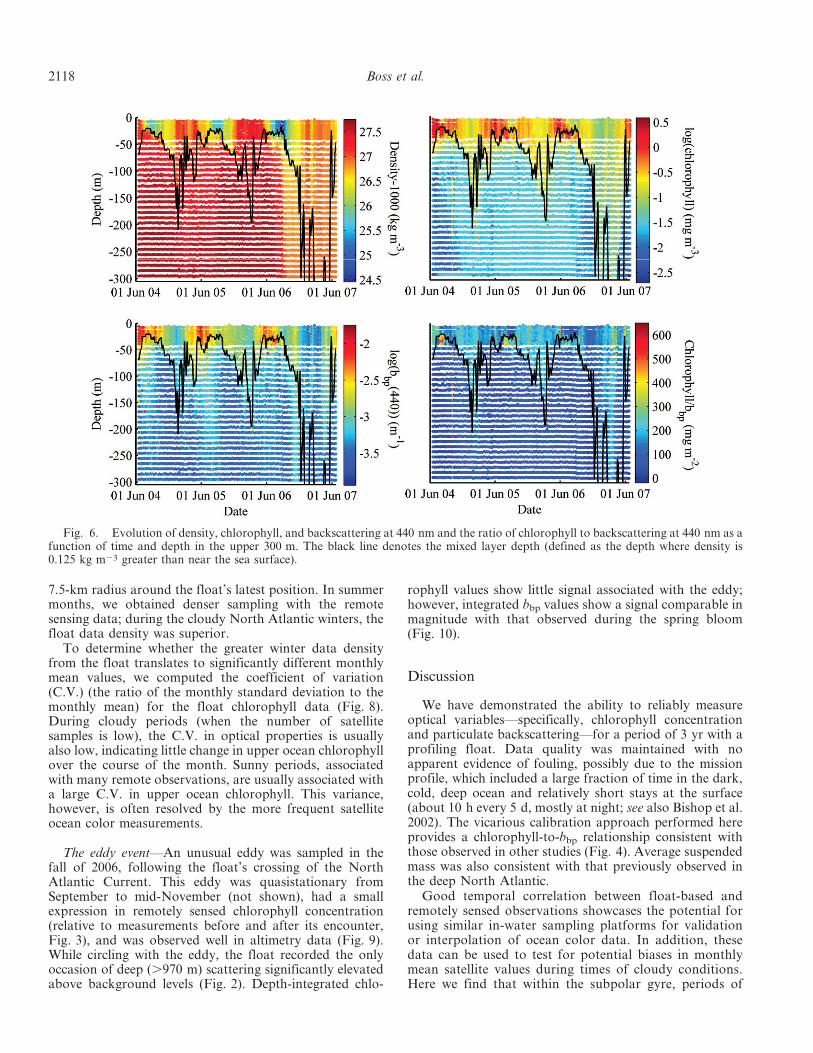
The float spent a little more than 2 yr in the subpolarwestern North Atlantic (Fig. 1). The annual cycle domi-nates the variability in the sensor record, with surfacewaters warming (decreasing in density) between Februaryand late August, followed by subsequent cooling (Fig. 6).The near-surface chlorophyll and backscattering coeffi-cients, which are always higher than the same measure-ments at depth, exhibit a rapid rise in the spring and aslower decrease in the fall and winter. The chlorophyll andbackscattering coefficients are well correlated (R . 0.86) inthe upper 300 m, consistent with backscattering beingdominated by phytoplankton and particles that covarywith phytoplankton (Fig. 4).
Significant variations in the chlorophyll/bbp ratio areobserved in the course of the annual cycle (Fig. 6). Belowthe mixed layer in the summer, a significant increase inchlorophyll/bbp is evident, consistent with photoacclima-tion of cells to low light or availability of nutrients (Fig. 6).This ratio also increases near the surface in the winter,possibly due to an increase in pigmentation associated withshort daylength and deeper mixing. When converting theupper 50-m water column bbp(440) to phytoplanktoncarbon using the conversion of Behrenfeld et al. (2005),we find the chlorophyll/carbon ratio to have a median of0.02 mg chl mg C21 (10th percentile 5 0.01, 90th percen-tile 5 0.36), consistent with values observed in phyto-plankton cultures (e.g., Cloern et al. 1995).
At greater depths, no significant pigment concentrationis observed at any time of year (Fig. 7). In contrast, theseasonal modulation in backscattering is observed all theway to the deepest-depth bin (750–1050 m), though with anamplitude two orders of magnitude smaller than at thesurface and with a maximum that is shifted later in the yearrelative to the surface’s particle concentration maximum.
Effects of clouds—To assess the usefulness of the float’sability to sample under clouds, we compared the temporalcoverage provided by the float (five to six surfacings permonth) to that of the MODIS satellite (Fig. 8) within the
Fig. 4. Particulate backscattering coefficient at 440 nm vs.chlorophyll, as measured by the float within the upper 10 m (graycircles) and upper 300 m (black circles) of the water column. Fourpublished relationships are also shown: Beh05, Behrenfeld et al.2005; Rey01A, Reynolds et al. 2001, AFPZ; Huo07, Huot et al.2007, South Pacific; and Rey01R, Reynolds et al. 2001, Ross Sea.Values of chlorophyll smaller than 0.04 mg m23 are notsignificantly different from zero.
Fig. 5. Lag correlation for near-surface chlorophyll, back-scattering, density, salinity, and temperature measured from theprofiling float. Temporal averages were removed from allvariables before computing the lag correlation.
North Atlantic pigments and particles 2117
7.5-km radius around the float’s latest position. In summermonths, we obtained denser sampling with the remotesensing data; during the cloudy North Atlantic winters, thefloat data density was superior.
To determine whether the greater winter data densityfrom the float translates to significantly different monthlymean values, we computed the coefficient of variation(C.V.) (the ratio of the monthly standard deviation to themonthly mean) for the float chlorophyll data (Fig. 8).During cloudy periods (when the number of satellitesamples is low), the C.V. in optical properties is usuallyalso low, indicating little change in upper ocean chlorophyllover the course of the month. Sunny periods, associatedwith many remote observations, are usually associated witha large C.V. in upper ocean chlorophyll. This variance,however, is often resolved by the more frequent satelliteocean color measurements.
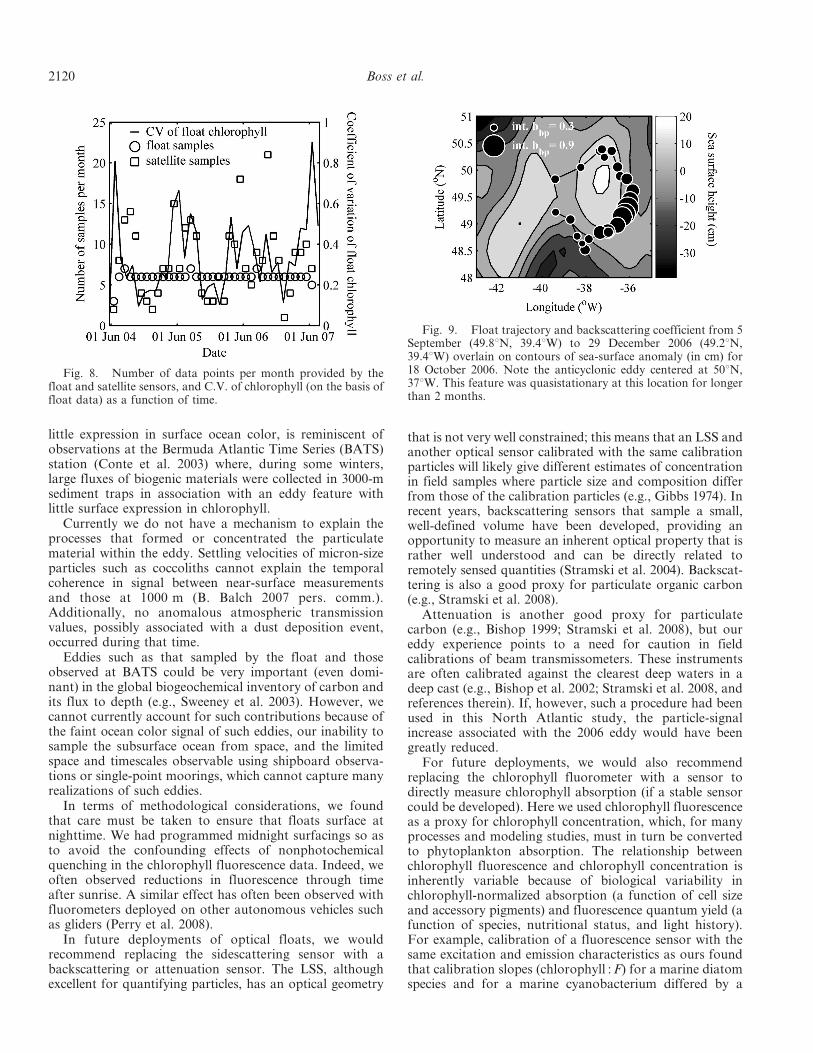
The eddy event—An unusual eddy was sampled in thefall of 2006, following the float’s crossing of the NorthAtlantic Current. This eddy was quasistationary fromSeptember to mid-November (not shown), had a smallexpression in remotely sensed chlorophyll concentration(relative to measurements before and after its encounter,Fig. 3), and was observed well in altimetry data (Fig. 9).While circling with the eddy, the float recorded the onlyoccasion of deep (.970 m) scattering significantly elevatedabove background levels (Fig. 2). Depth-integrated chlo-
rophyll values show little signal associated with the eddy;however, integrated bbp values show a signal comparable inmagnitude with that observed during the spring bloom(Fig. 10).
Discussion
We have demonstrated the ability to reliably measureoptical variables—specifically, chlorophyll concentrationand particulate backscattering—for a period of 3 yr with aprofiling float. Data quality was maintained with noapparent evidence of fouling, possibly due to the missionprofile, which included a large fraction of time in the dark,cold, deep ocean and relatively short stays at the surface(about 10 h every 5 d, mostly at night; see also Bishop et al.2002). The vicarious calibration approach performed hereprovides a chlorophyll-to-bbp relationship consistent withthose observed in other studies (Fig. 4). Average suspendedmass was also consistent with that previously observed inthe deep North Atlantic.
Good temporal correlation between float-based andremotely sensed observations showcases the potential forusing similar in-water sampling platforms for validationor interpolation of ocean color data. In addition, thesedata can be used to test for potential biases in monthlymean satellite values during times of cloudy conditions.Here we find that within the subpolar gyre, periods of
Fig. 6. Evolution of density, chlorophyll, and backscattering at 440 nm and the ratio of chlorophyll to backscattering at 440 nm as afunction of time and depth in the upper 300 m. The black line denotes the mixed layer depth (defined as the depth where density is0.125 kg m23 greater than near the sea surface).
2118 Boss et al.

sparse satellite coverage (i.e., winter) are correlated withlow variability in chlorophyll, suggesting that at highlatitudes winter clouds do not significantly bias remotelyestimated monthly means. This result may be explainedby the fact that the winter period is associated with lowtemperatures and lower average mixed-layer light levels,both of which are likely to decrease phytoplanktongrowth rates.
Autocorrelation analysis of the whole data set showschlorophyll to have a shorter decorrelation timescale thanbackscattering. This difference is likely due to the ability ofphytoplankton to rapidly (within a generation timescale)alter their intracellular chlorophyll concentration in re-sponse to changes in light and nutrients, whereas otherphytoplankton components (phytoplankton carbon, forexample) vary more slowly. The longer decorrelationtimescale for backscattering may also suggest that thescattering sensor is detecting slowly varying material thatdoes not covary with phytoplankton (e.g., non-photosynthbacteria).
The chlorophyll decorrelation timescales observed by thefloat (O[20 d]) are significantly longer than the O(2 d)decorrelation timescales calculated for equatorial Pacificchlorophyll from ocean color data (Strutton and Chavez
2003) and the O(4 d) decorrelation timescale calculated forCalifornia Current in situ chlorophyll from drifters (Abbottand Letelier 1998). This result may seem surprising giventhe shorter deformation radius in the North Atlantic, butcan be explained by the significantly larger seasonal signalthere. This signal dominates the observed variability.
In comparing decorrelation timescales for optical vari-ables and hydrographic variables, we found shorter decor-relation timescales for all of the optical variables. Denmanand Abbott (1994) and Abbott and Letelier (1998), incontrast, observed equal decorrelation timescales for tem-perature and chlorophyll in the California Current. Struttonand Chavez (2003) interpret covariation in decorrelationtimescales as being a sign of causality. Under thatinterpretation, our observation suggests that phytoplanktonconcentration in the western North Atlantic is significantlymodulated by processes other than those responsible forvariability in the upper ocean’s hydrography.
One distinctive event captured by the float was aparticle-rich eddy sampled in the late fall of 2006 justsouth of the North Atlantic Current. This eddy’s particleload was observed coherently throughout the upper 1000 mof the water column, suggesting that it may be responsiblefor a large flux of particles to depth. This event, which had
Fig. 7. Evolution of chlorophyll, density, particulate backscattering, and temperature as a function of time for five depth bins. Linesrepresent the median of the property values for data in the following depth bins: 0–30 m, 75–130 m, 185–245 m, 315–480 m, and 750–1050 m. Each bin contains approximately five sampling depths. The vertical black lines denote crossing of the North Atlantic Current(left) and the center of a highly backscattering anticyclonic eddy (right).
North Atlantic pigments and particles 2119
little expression in surface ocean color, is reminiscent ofobservations at the Bermuda Atlantic Time Series (BATS)station (Conte et al. 2003) where, during some winters,large fluxes of biogenic materials were collected in 3000-msediment traps in association with an eddy feature withlittle surface expression in chlorophyll.
Currently we do not have a mechanism to explain theprocesses that formed or concentrated the particulatematerial within the eddy. Settling velocities of micron-sizeparticles such as coccoliths cannot explain the temporalcoherence in signal between near-surface measurementsand those at 1000 m (B. Balch 2007 pers. comm.).Additionally, no anomalous atmospheric transmissionvalues, possibly associated with a dust deposition event,occurred during that time.
Eddies such as that sampled by the float and thoseobserved at BATS could be very important (even domi-nant) in the global biogeochemical inventory of carbon andits flux to depth (e.g., Sweeney et al. 2003). However, wecannot currently account for such contributions because ofthe faint ocean color signal of such eddies, our inability tosample the subsurface ocean from space, and the limitedspace and timescales observable using shipboard observa-tions or single-point moorings, which cannot capture manyrealizations of such eddies.
In terms of methodological considerations, we foundthat care must be taken to ensure that floats surface atnighttime. We had programmed midnight surfacings so asto avoid the confounding effects of nonphotochemicalquenching in the chlorophyll fluorescence data. Indeed, weoften observed reductions in fluorescence through timeafter sunrise. A similar effect has often been observed withfluorometers deployed on other autonomous vehicles suchas gliders (Perry et al. 2008).
In future deployments of optical floats, we wouldrecommend replacing the sidescattering sensor with abackscattering or attenuation sensor. The LSS, althoughexcellent for quantifying particles, has an optical geometry
that is not very well constrained; this means that an LSS andanother optical sensor calibrated with the same calibrationparticles will likely give different estimates of concentrationin field samples where particle size and composition differfrom those of the calibration particles (e.g., Gibbs 1974). Inrecent years, backscattering sensors that sample a small,well-defined volume have been developed, providing anopportunity to measure an inherent optical property that israther well understood and can be directly related toremotely sensed quantities (Stramski et al. 2004). Backscat-tering is also a good proxy for particulate organic carbon(e.g., Stramski et al. 2008).
Attenuation is another good proxy for particulatecarbon (e.g., Bishop 1999; Stramski et al. 2008), but oureddy experience points to a need for caution in fieldcalibrations of beam transmissometers. These instrumentsare often calibrated against the clearest deep waters in adeep cast (e.g., Bishop et al. 2002; Stramski et al. 2008, andreferences therein). If, however, such a procedure had beenused in this North Atlantic study, the particle-signalincrease associated with the 2006 eddy would have beengreatly reduced.
For future deployments, we would also recommendreplacing the chlorophyll fluorometer with a sensor todirectly measure chlorophyll absorption (if a stable sensorcould be developed). Here we used chlorophyll fluorescenceas a proxy for chlorophyll concentration, which, for manyprocesses and modeling studies, must in turn be convertedto phytoplankton absorption. The relationship betweenchlorophyll fluorescence and chlorophyll concentration isinherently variable because of biological variability inchlorophyll-normalized absorption (a function of cell sizeand accessory pigments) and fluorescence quantum yield (afunction of species, nutritional status, and light history).For example, calibration of a fluorescence sensor with thesame excitation and emission characteristics as ours foundthat calibration slopes (chlorophyll : F) for a marine diatomspecies and for a marine cyanobacterium differed by a
Fig. 8. Number of data points per month provided by thefloat and satellite sensors, and C.V. of chlorophyll (on the basis offloat data) as a function of time.
Fig. 9. Float trajectory and backscattering coefficient from 5September (49.8uN, 39.4uW) to 29 December 2006 (49.2uN,39.4uW) overlain on contours of sea-surface anomaly (in cm) for18 October 2006. Note the anticyclonic eddy centered at 50uN,37uW. This feature was quasistationary at this location for longerthan 2 months.
2120 Boss et al.

factor of 7 (L. Karp-Boss unpubl.; see also Schubert et al.1989). As a result, fluorescence—although a very usefulproxy for chlorophyll concentration, given that quantity’slarge dynamic range in oceanic waters—does not give avery accurate measure of that concentration (Cullen 1982;ACT 2005).
If a chlorophyll fluorometer is to be used, it is advisableto perform the instrument’s prelaunch calibration usingchlorophyll extracted from phytoplankton populationslocal to the float’s mission area. Better yet would belocal-assemblage calibrations conducted at intervalsthroughout the mission as often as possible. Even theseextra-effort calibrations will fall short of ideal becausephytoplankton assemblages change with time and depth,but the more closely the calibration standards can bematched to the local assemblage, the better. In addition, arecent study using a novel optical sensor with multipleexcitation–emission bands suggests the possibility tosignificantly improve the accuracy of retrieved chlorophyllconcentration (Proctor 2008).
For future deployments of optical and biogeochemicalsensors on floats or other platforms, we also recommend thatrigorous, quantitative error analysis and propagation be astandard part of the calibration and data analysis procedures.We devoted considerable effort to this undertaking (seeMethods), demonstrating that the fluorometer and LSSmeasurements are accurate but imprecise. Fluorescence is aninherently noisy proxy for chlorophyll, but, again, because ofchlorophyll’s large dynamic range in oceanic environments,even an imprecise measurement is a useful one.
The quantification of analytical precision (see Methodssection) is not commonly undertaken for optics-basedmethods used to characterize biogeochemical quantities—but it is critically important. Ecosystem and biogeochem-ical ocean modelers are starting to use optical variables tobetter model the underwater light field (e.g., for ratecalculations of photosynthesis and photo-oxidation) and toconstrain biogeochemical variables (e.g., Fujii et al. 2007).Data such as those collected by the float discussed here canprovide these models with much-needed groundtruth,
resulting in increased model skill. Such exercises require,in addition to the basic data set, accompanying estimates ofmethodological and data uncertainties. Otherwise, thepropagation of errors throughout the model calculationsand ‘‘goodness of fit’’ between model output and observa-tions cannot be quantitatively assessed.
In the very near future, O(5 yr), increasing numbers ofbiogeochemical modelers will undoubtedly begin assimilat-ing and testing against optical and other biogeochemicaldata sets. However, the accompanying demand for hightemporal and spatial high-quality optical data will not bemet by existing programs and platforms. In this study, wehave demonstrated the significant contribution that couldbe made by autonomous profiling floats (see also Uz 2006).If a fleet of biogeochemical profiling floats were to operatethroughout the world’s oceans, the contribution of themesoscale band to important biogeochemical fluxes couldbe constrained.
Such a fleet (Argo) already exists for measurements oftemperature and salinity. A coordinated effort by theoceanographic community, analogous to the current effortto add oxygen measurements, could make a complemen-tary biogeochemical fleet a reality. All these future floatmissions will benefit considerably from newer communica-tion technologies such as satellite cell phones (e.g., iridium),which allow for significantly shorter stays at the surface(less than 10 min), two-way communication (allowing foradaptive sampling), and higher vertical sampling resolutionper unit power.
It is our hope that the success and results demonstratedhere and in previous optics-based studies of oceanbiogeochemistry (e.g., Bishop et al. 2002, 2004) willencourage the addition of biogeochemical sensors to theexisting and planned fleet of autonomous platforms in theworld’s oceans. Such a fleet could provide required inputsand constraints for the ocean-scale models needed toimprove our understanding of the oceans’ roles inbiogeochemical cycling in general and of recent climateprocesses in particular.
References
ACT, 2005. Workshop proceedings on ‘‘Applications of in situfluorometers in nearshore waters. Alliance for CoastalTechnologies indexing no. ACT-05-03.
ABBOTT, M. R., AND R. M. LETELIER. 1998. Decorrelation scales ofchlorophyll as observed from bio-optical drifters in theCalifornia Current. Deep-Sea Res. II 45: 1639–1667.
BAKER, E. D., A. TENANT, R. A. FEELY, G. T. LEBON, AND S. L.WAKER. 2001. Field and laboratory studies on the effect ofparticle size and composition on optical backscatteringmeasurements in hydrothermal plumes. Deep-Sea Res. I 48:593–604.
BEHRENFELD, M. J., E. BOSS, D. A. SIEGEL, AND D. M. SHEA. 2005.Carbon-based ocean productivity and phytoplankton physi-ology from space Global Biogeochem. Cycles 19: GB100610.1029/2004GB002299.
BISHOP, J. K. B. 1999. Transmissometer measurement of POC.Deep-Sea Res. I 46: 353–369.
———, R. E. DAVIS, AND J. T. SHERMAN. 2002. Roboticobservations of dust storm enhancement of carbon biomassin the North Pacific. Science 298: 817–821.
Fig. 10. Integrated chlorophyll and particulate backscatter-ing from the surface to 300-m depth.
North Atlantic pigments and particles 2121

———, T. J. WOOD, R. E. DAVIS, AND J. T. SHERMAN. 2004.Robotic observations of enhanced carbon biomass and exportat 55S. Science 304: 417–420.
CLOERN, J. E., C. GENZ, AND L. VIDERGAR-LUCAS. 1995. Anempirical model of phytoplankton chlorophyll : carbon ra-tio—the conversion factor between productivity and growthrate. Limnol. Oceanogr. 40: 1313–1321.
CONTE, M. H., T. D. DICKEY, J. C. WEBER, R. JOHNSON, AND A.KNAP. 2003. Transient physical forcing of pulsed export ofbioreactive material to the deep Sargasso Sea. Deep-Sea Res. I50: 1157–1187.
CULLEN, J. J. 1982. The deep chlorophyll maximum: comparingvertical profiles of chlorophyll a. Can. J. Fish. Aquat. Sci. 39:791–803.
DENMAN, K. L., AND M. R. ABBOTT. 1994. Timescales of patternevolution from cross-spectrum analysis of advanced very highresolution radiometer and coastal zone color scanner. J.Geophys. Res. 99: 7433–7442.
———, AND A. E. GARGETT. 1983. Time and space scales ofvertical mixing and advection of phytoplankton in the upperocean. Limnol. Oceanogr. 28: 801–815.
FOURNIER, G., AND M. JONASZ. 1999. Computer-based underwaterimaging analysis, p. 62–77. In G. Gilbert [ed.], Airborne andin-water underwater imaging. Proceedings of SPIE, v. 3761.
FUJII, M., E. BOSS, AND F. CHAI. 2007. The value of adding opticsto ecosystem models: a case study. Biogeosciences 4: 817–835.
GIBBS, R. J. [ED.]. 1974. Suspended solids in water. Marine ScienceSeries 4. Plenum Press.
GONZALEZ, R. C., AND R. E. WOODS. 1992. Digital imageprocessing. Addison-Wesley.
GOULD, J., AND oTHERS. 2004. Argo profiling floats bring new eraof in situ ocean observations. Eos Trans. AGU 85: 185.
HUOT, Y., A. MOREL, M. S. TWARDOWSKI, D. STRAMSKI, AND R. A.REYNOLDS. 2007. Particle optical backscattering along achlorophyll gradient in the upper layer of the eastern SouthPacific Ocean. Biogeosci. Discuss. 4: 4571–4604.
JACOB, M. B., AND M. EWING. 1968. Suspended particulate matter:concentration in the major oceans. Science 163: 380–383.
KORTZINGER, A., S. C. RISER, AND N. GRUBER. 2006. Oceanicoxygen: the oceanographer’s canary bird of climate change.Argo Newsletter Argonautics 7 June 2006: 2–3.
LEBEN, R. R., G. H. BORN, AND B. R. ENGEBRETH. 2002.Operational altimeter data processing for mesoscale monitor-ing. Mar. Geod. 25: 3–18.
LOFTUS, M. E., AND H. H. SELIGER. 1975. Some limitations of thein vivo fluorescence technique. Chesapeake Sci. 16: 79–92.doi:10.2307/1350685.
MARITORENA, S., D. A. SIEGEL, AND A. PETERSON. 2002.Optimization of a semianalytical ocean color model forglobal-scale applications. Appl. Opt. 41: 2705–2714.
MITCHELL, B. G., M. KAHRU, AND J. SHERMAN. 2000. Autonomoustemperature-irradiance profiler resolves the spring bloom inthe Sea of Japan. Proceedings, Ocean Optics XV, Monaco,October 2000.
PERRY, M. J., B. S. SACKMANN, C. C. ERIKSEN, AND C. M. LEE.2008. Seaglider observations of blooms and subsurfacechlorophyll maxima off the Washington coast. Limnol.Oceanogr. 53: 2169–2179.
PROCTOR, C. 2008. Characterizing the calibration and sources ofvariability in a new sensor package: using fluorescence toestimate phytoplankton concentration and composition.M.Sc. thesis, Univ. of Maine.
REYNOLDS, R. A., D. STRAMSKI, AND B. G. MITCHELL. 2001. Achlorophyll-dependent semianalytical reflectance model de-rived from field measurements of absorption and backscat-tering coefficients within the Southern Ocean. J. Geophys.Res. 106: 7125–7138.
RILEY, G. A., H. STOMMEL, AND D. F. BUMPUS. 1949. Quantitativeecology of the plankton of the Western North Atlantic. Bull.Bingham Oceanogr. Coll. 12: 1–169.
SACKMANN, B. S., M. J. PERRY, AND C. C. ERIKSEN. 2008. Seagliderobservations of variability in daytime fluorescence quenchingof chlorophyll-a in Northeastern Pacific coastal waters.Biogiosciences Discuss. 5: 2839–2865.
SCHUBERT, H., U. SCHIEWER, AND E. TSCHIRNER. 1989. Fluores-cence characteristics of cyanobacteria (blue-green algae). J.Plankton Res. 11: 353–359.
SMETACEK, V., AND U. PASSOW. 1990. Spring bloom initiation andSverdrup’s critical-depth model. Limnol. Oceanogr. 35:228–234.
SMITH, R. D., M. E. MALTRUD, F. O. BRYAN, AND M. W. HECHT.2000. Numerical simulation of the North Atlantic Ocean at1/10u. J. Phys. Oceanogr. 30: 1532–1561.
STRAMSKI, D., E. BOSS, D. BOGUCKI, AND K. J. VOSS. 2004. The roleof seawater constituents in light backscattering in the ocean.Prog. Oceanogr. 61: 27–55.
———, AND D. A. KIEFER. 1991. Light scattering by microor-ganisms in the open ocean. Prog. Oceanogr. 28: 343–383.
———, AND oTHERS. 2008. Relationships between the surfaceconcentration of particulate organic carbon and opticalproperties in the eastern South Pacific and eastern AtlanticOceans. Biogeosciences 5: 171–201.
STRUTTON, P. G., AND F. P. CHAVEZ. 2003. Scales of biological–physical coupling in the equatorial Pacific. In L. Seuront andP. G. Strutton [eds.], Handbook of scaling methods in aquaticecology. CRC Press.
SVERDRUP, H. U. 1953. On conditions for the vernal blooming ofphytoplankton. J. Conseil Exp. Mer. 18: 287.
SWEENEY, E. N., D. J. MCGILLICUDDY, JR., AND K. O. BUESSELER.2003. Biogeochemical impacts due to mesoscale eddy activityin the Sargasso Sea as measured at the Bermuda AtlanticTime-series Study (BATS). Deep Sea Res. II 50: 3017–3039.
TWARDOWSKI, M. S., H. CLAUSTRE, S. A. FREEMAN, D. STRAMSKI,AND Y. HUOT. 2007. Optical backscattering properties of the‘‘clearest’’ natural waters. Biogeosciences 4: 1041–1058.
UZ, B. M. 2006. Argo floats complement biological remotesensing. EOS Trans. 87: 313–320.
Received: 16 September 2007Accepted: 21 April 2008Amended: 30 May 2008
2122 Boss et al.