
BORN Information System Maternal Newborn Dashboard Matern… · BORN Information System Maternal...
27
BORN Information System Maternal Newborn Dashboard BORN Ontario Webinar August 30, 2012 Sherrie Kelly Epidemiologist Sandy Dunn Knowledge Translation Specialist
Transcript of BORN Information System Maternal Newborn Dashboard Matern… · BORN Information System Maternal...
BORN Information System
Maternal Newborn Dashboard
BORN Ontario Webinar
August 30, 2012
Sherrie Kelly
Epidemiologist
Sandy Dunn
Knowledge Translation Specialist
2
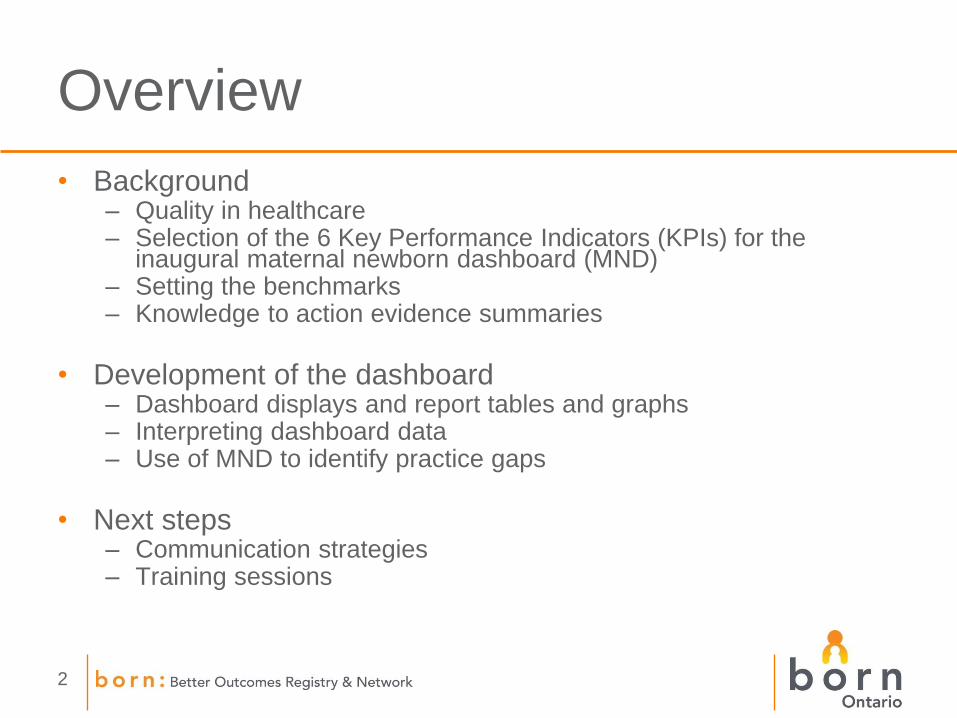
Overview
• Background – Quality in healthcare – Selection of the 6 Key Performance Indicators (KPIs) for the
inaugural maternal newborn dashboard (MND) – Setting the benchmarks – Knowledge to action evidence summaries
• Development of the dashboard
– Dashboard displays and report tables and graphs – Interpreting dashboard data – Use of MND to identify practice gaps
• Next steps
– Communication strategies – Training sessions
3
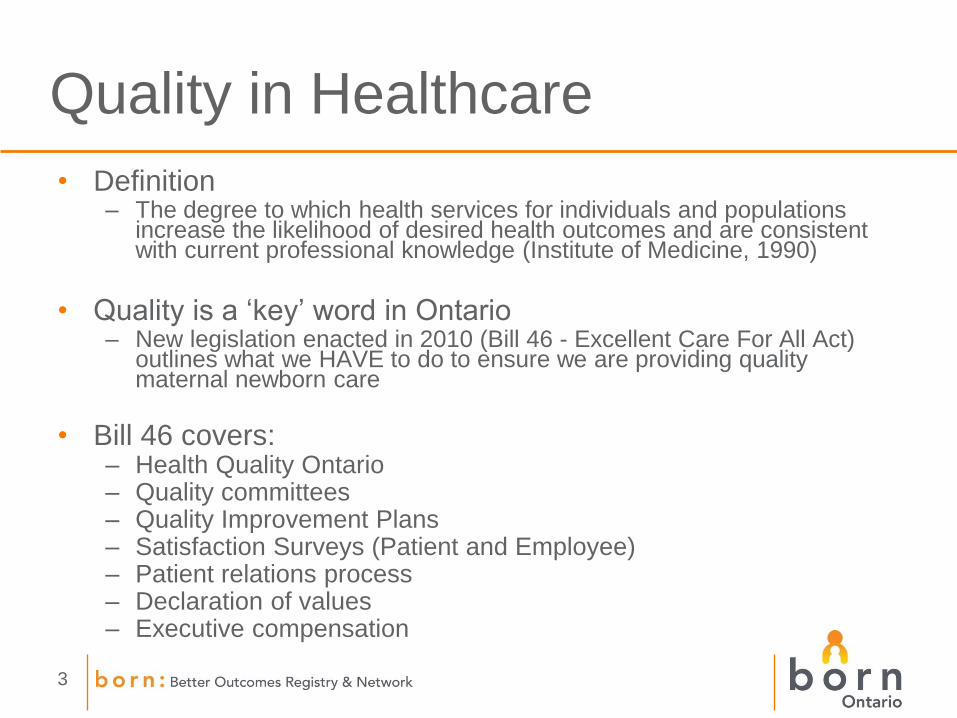
Quality in Healthcare
• Definition – The degree to which health services for individuals and populations
increase the likelihood of desired health outcomes and are consistent with current professional knowledge (Institute of Medicine, 1990)
• Quality is a ‘key’ word in Ontario
– New legislation enacted in 2010 (Bill 46 - Excellent Care For All Act) outlines what we HAVE to do to ensure we are providing quality maternal newborn care
• Bill 46 covers: – Health Quality Ontario – Quality committees – Quality Improvement Plans – Satisfaction Surveys (Patient and Employee) – Patient relations process – Declaration of values – Executive compensation
4
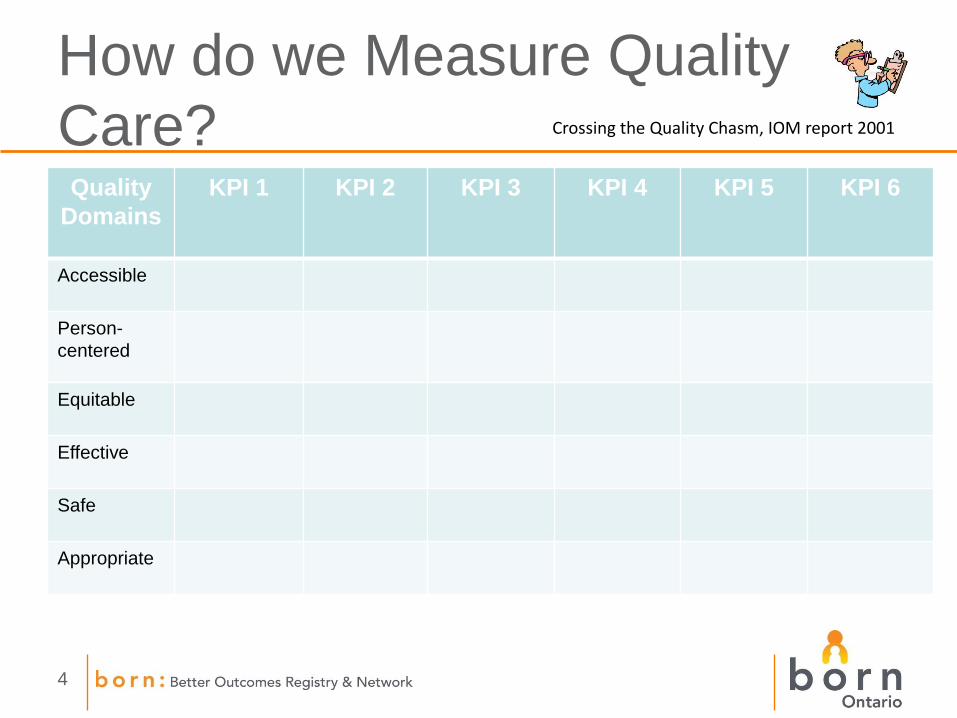
How do we Measure Quality
Care? Quality
Domains
KPI 1 KPI 2 KPI 3 KPI 4 KPI 5 KPI 6
Accessible
Person-
centered
Equitable
Effective
Safe
Appropriate
Crossing the Quality Chasm, IOM report 2001
5
BORN – Mission and Vision
• With a vision of providing the knowledge needed for
– The best possible beginnings for lifelong health,
• The mission of BORN is to:
– Facilitate and improve care for mothers, children and youth by linking information and providers to address care gaps spanning the spectrum from normal to high acuity and rare conditions
– Be an authoritative source of accurate, trusted and timely information to monitor, evaluate and plan for the best possible beginnings for life-long health
– Provide scientific and technical leadership for Ontario’s maternal, child and youth health system through the support of research and innovation
– Mobilize information and expertise to optimize care and contribute to a high-performing healthcare system, improving the lives of individual mothers and children
6
The Dashboard Concept
A dashboard is a performance measurement system that
provides data on structure, process and outcome variables
and incorporates the following functions:
Reports on a selected key performance indicators (feedback)
Compares performance to established ideal levels (benchmark)
Provides alerts to trigger action when performance is sub-optimal
(signal)
Dashboards have been used for a variety of purposes
within health care, but are primarily implemented to drive
quality improvement
7
Cochrane Review (2012)
• Explored the effects of audit and feedback on professional practice and healthcare outcomes – 82 comparisons from 49 studies
• HCPs are more likely to modify their practice when given performance feedback showing that their clinical practice is inconsistent with desirable targets
• The authors concluded that audit and feedback was more effective: – If baseline performance is low
– If feedback is provided more than once
– When the feedback includes explicit targets and an action plan.
• What the MND is designed to do Provide site-specific and comparison data (feedback)
Visually indicate an evidence-practice gap (signal)
Provide direction for practice change (benchmark)
8
Dashboard KPI Possibilities
• Key performance indicators (KPI) must be:
– Clinically meaningful • important, serious, affects many people, high cost
– Feasible • can be measured, access to high quality data
– Actionable • can be changed without moving heaven and earth
Strongly Disagree Strongly Agree
(Hermann & Palmer Framework, 2002)
9
Approach to KPI Selection
• Maternal Newborn Outcomes Committee (MNOC) – Dashboard Sub-committee
• Interprofessional membership of clinical experts from across the province
• Representing obstetrics, neonatology, pediatrics, midwifery, nursing, and epidemiology
• Looked for high quality data in the BIS – Reflected current practice issues or hot topics
– 24 KPIs identified
10
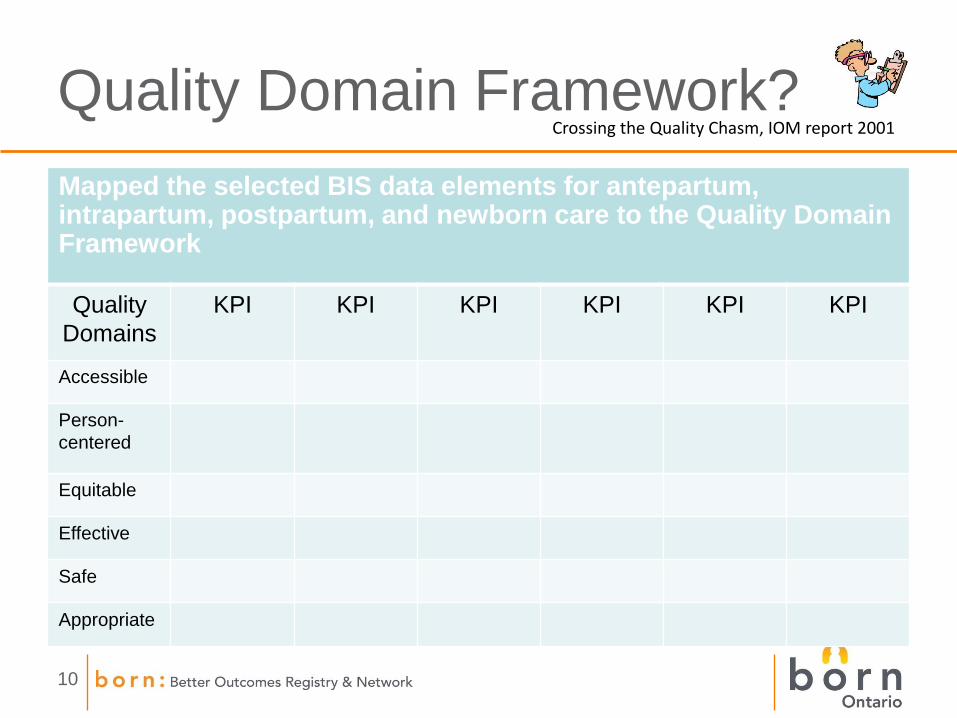
Quality Domain Framework?
Mapped the selected BIS data elements for antepartum, intrapartum, postpartum, and newborn care to the Quality Domain Framework
Quality
Domains
KPI KPI KPI KPI KPI KPI
Accessible
Person-
centered
Equitable
Effective
Safe
Appropriate
Crossing the Quality Chasm, IOM report 2001
11
Approach to KPI Selection
• Modified Delphi process: – Seek feedback about the potential indicators of quality – Establish face validity – Prioritize the list to a manageable number of KPIs for the inaugural
MND
- Online survey - Shortlist the KPIs based on Hermann & Palmer’s
Framework - Most clinically relevant - Most amenable to change
- Validate the KPIs as appropriate for use across the province - Extracted data from the BIS for fiscal years 2009-2010 to
assess historical and current performance on these KPIs across Ontario’s 14 LHINs
12
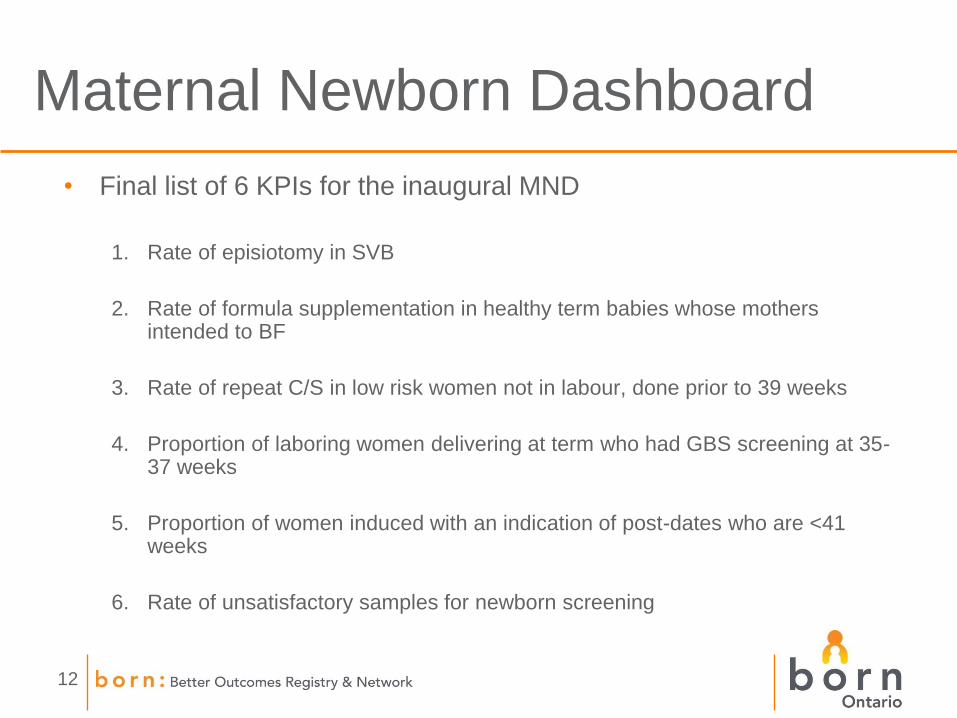
Maternal Newborn Dashboard
• Final list of 6 KPIs for the inaugural MND
1. Rate of episiotomy in SVB
2. Rate of formula supplementation in healthy term babies whose mothers intended to BF
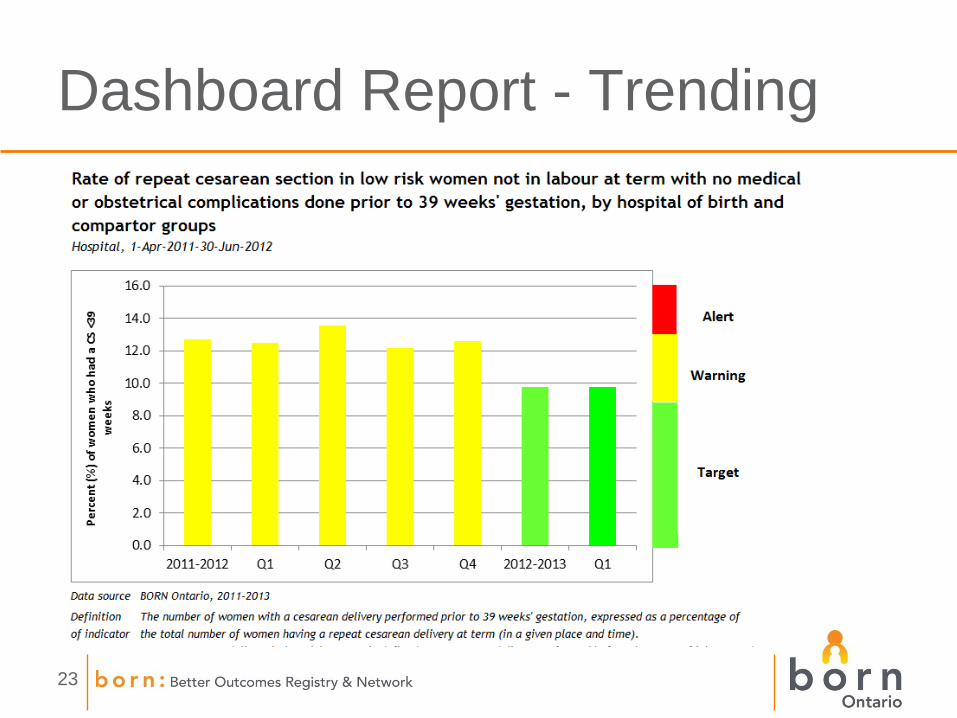
3. Rate of repeat C/S in low risk women not in labour, done prior to 39 weeks
4. Proportion of laboring women delivering at term who had GBS screening at 35-37 weeks
5. Proportion of women induced with an indication of post-dates who are <41 weeks
6. Rate of unsatisfactory samples for newborn screening
13
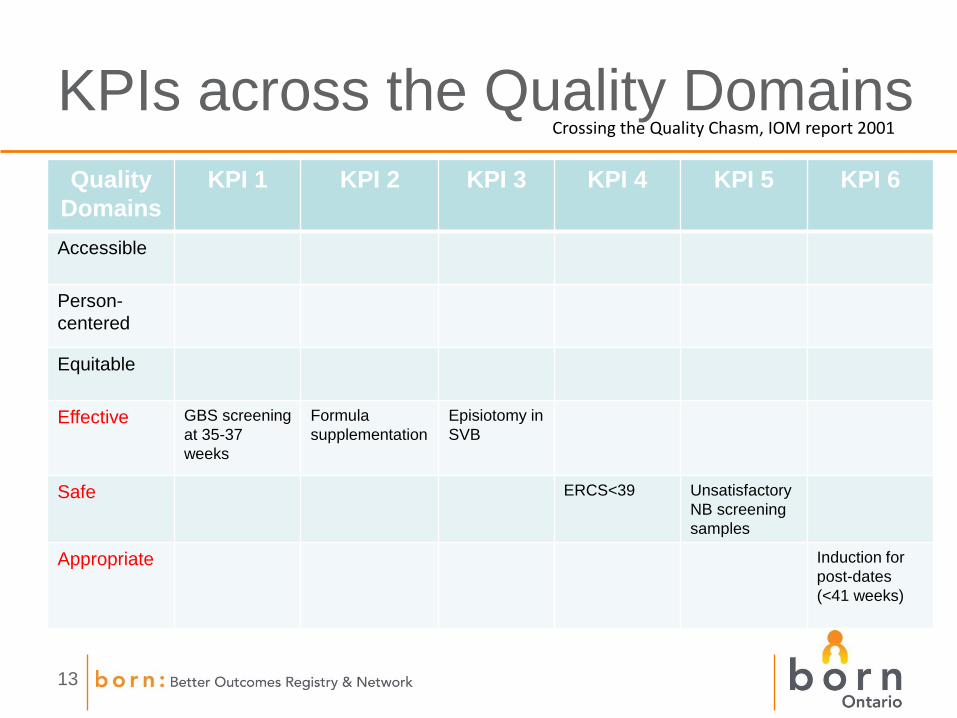
KPIs across the Quality Domains
Quality
Domains
KPI 1 KPI 2 KPI 3 KPI 4 KPI 5 KPI 6
Accessible
Person-
centered
Equitable
Effective GBS screening
at 35-37
weeks
Formula
supplementation
Episiotomy in
SVB
Safe ERCS<39 Unsatisfactory
NB screening
samples
Appropriate Induction for
post-dates
(<41 weeks)
Crossing the Quality Chasm, IOM report 2001
14
Performance Benchmarks
- Used various forms of evidence to establish performance benchmarks - Peer-reviewed literature
- Current clinical practice in Ontario
- Clinical expertise of our committee
- Set benchmarks for - Target (green light)
- Warning (yellow light)
- Alert (red light)
15
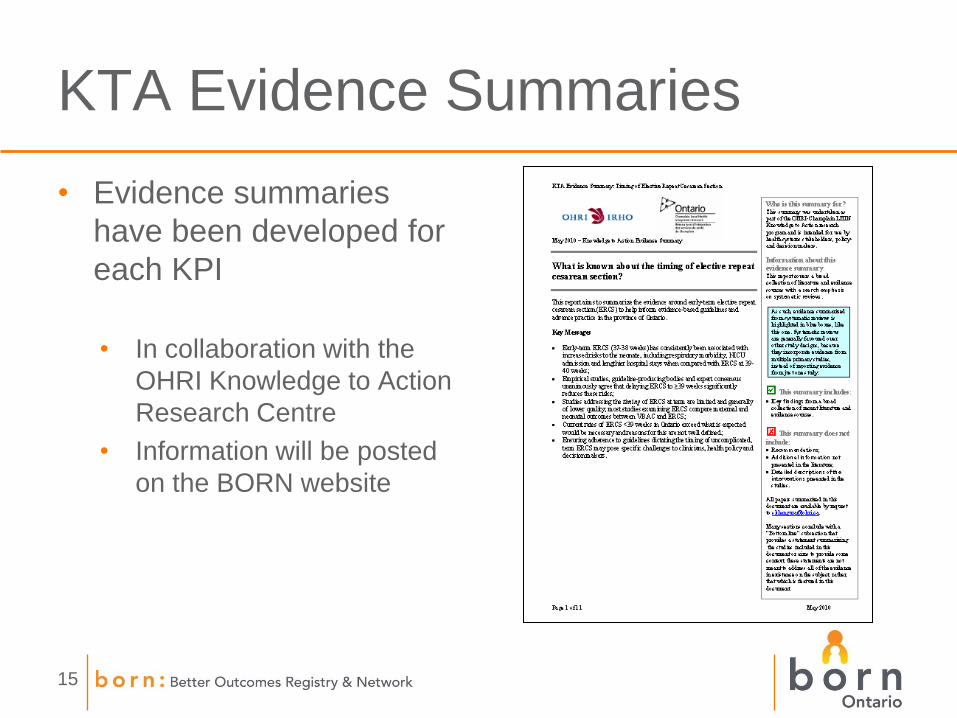
KTA Evidence Summaries
• Evidence summaries
have been developed for
each KPI
• In collaboration with the
OHRI Knowledge to Action
Research Centre
• Information will be posted
on the BORN website
17
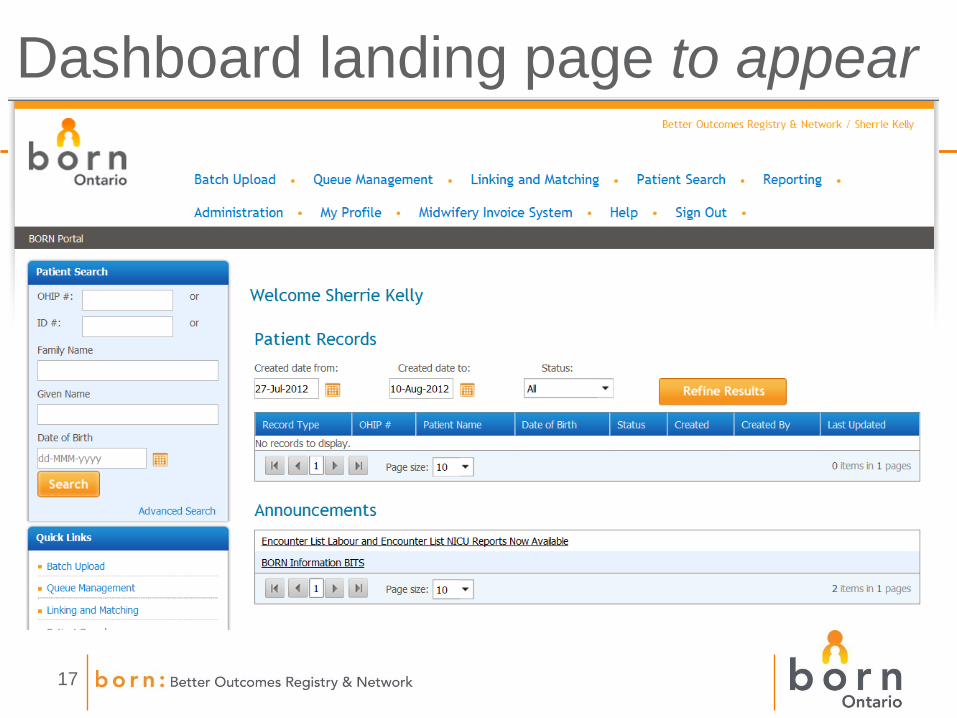
Dashboard landing page to appear
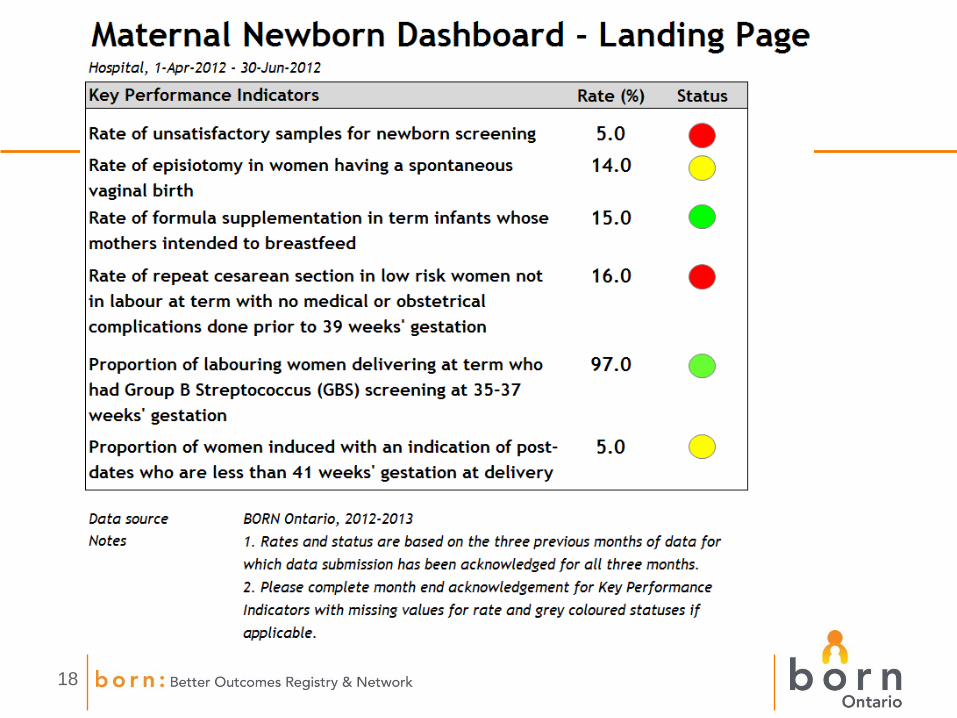
18
19
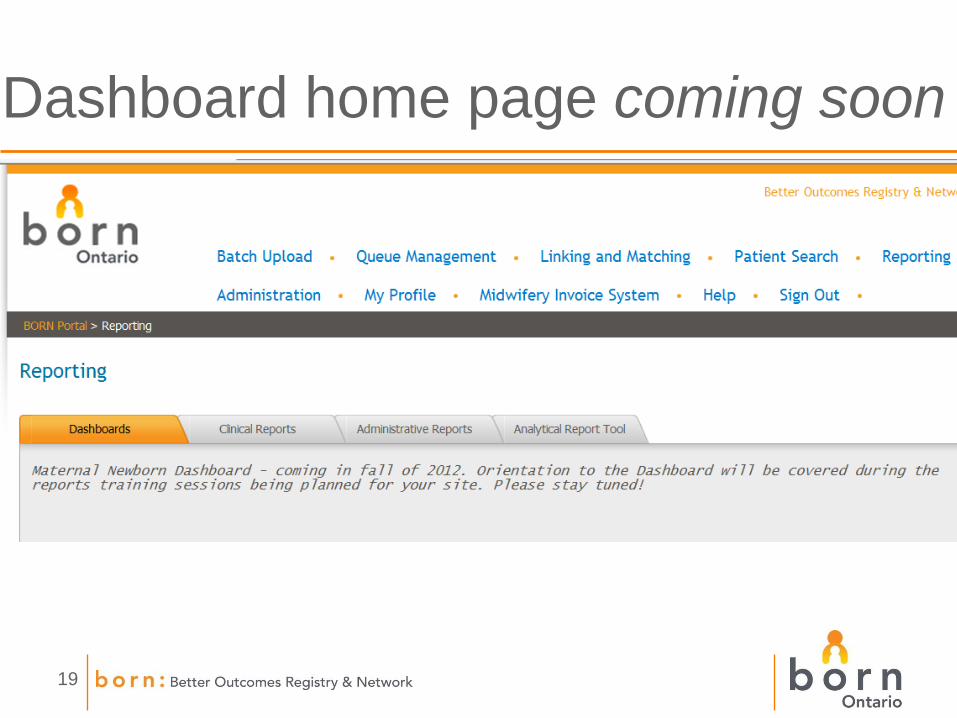
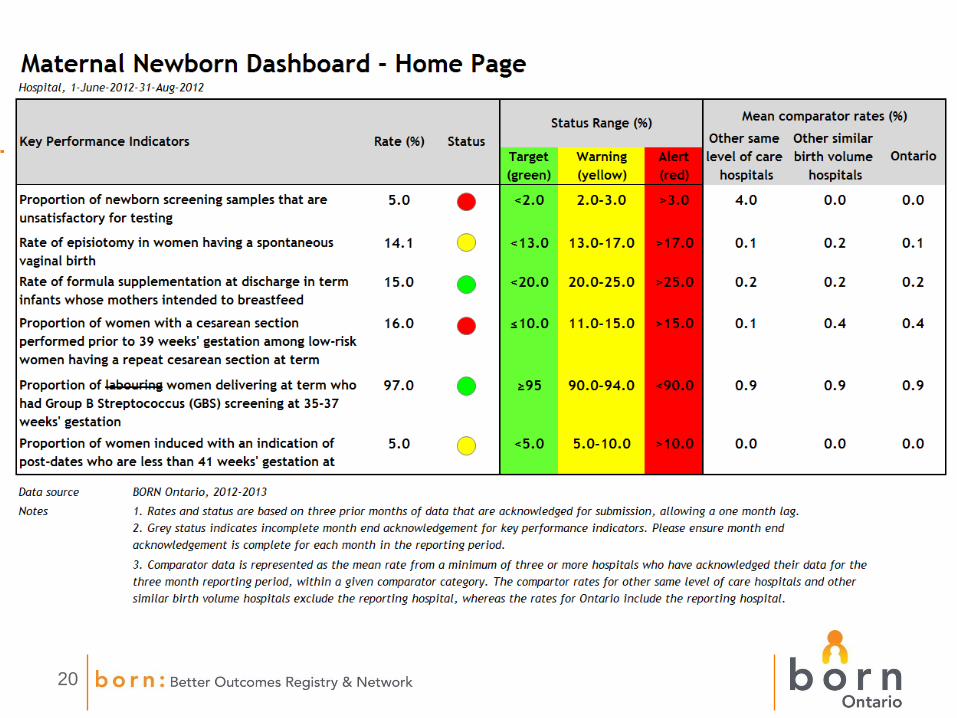
Dashboard home page coming soon
20
21
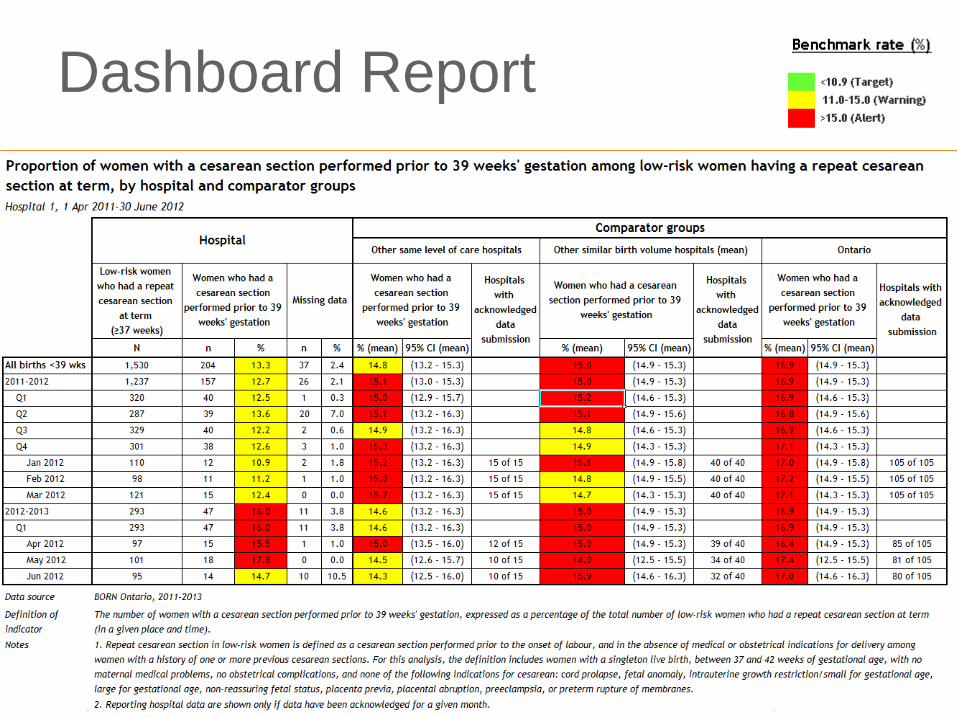
Dashboard Report
22
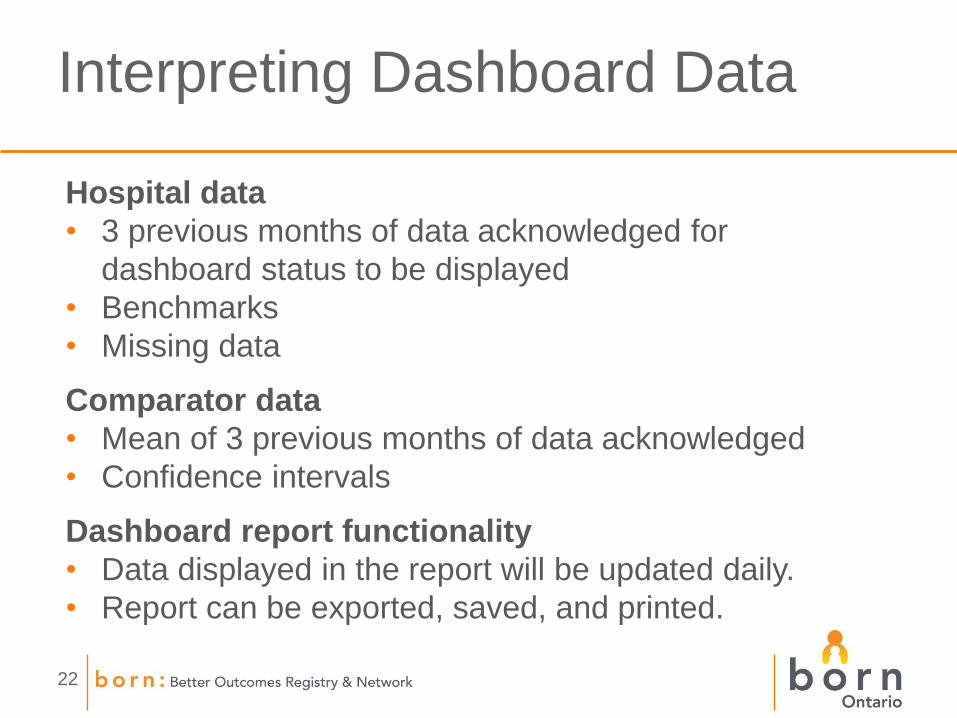
Hospital data
• 3 previous months of data acknowledged for
dashboard status to be displayed
• Benchmarks
• Missing data
Comparator data
• Mean of 3 previous months of data acknowledged
• Confidence intervals
Dashboard report functionality
• Data displayed in the report will be updated daily.
• Report can be exported, saved, and printed.
Interpreting Dashboard Data
23
Dashboard Report - Trending
24
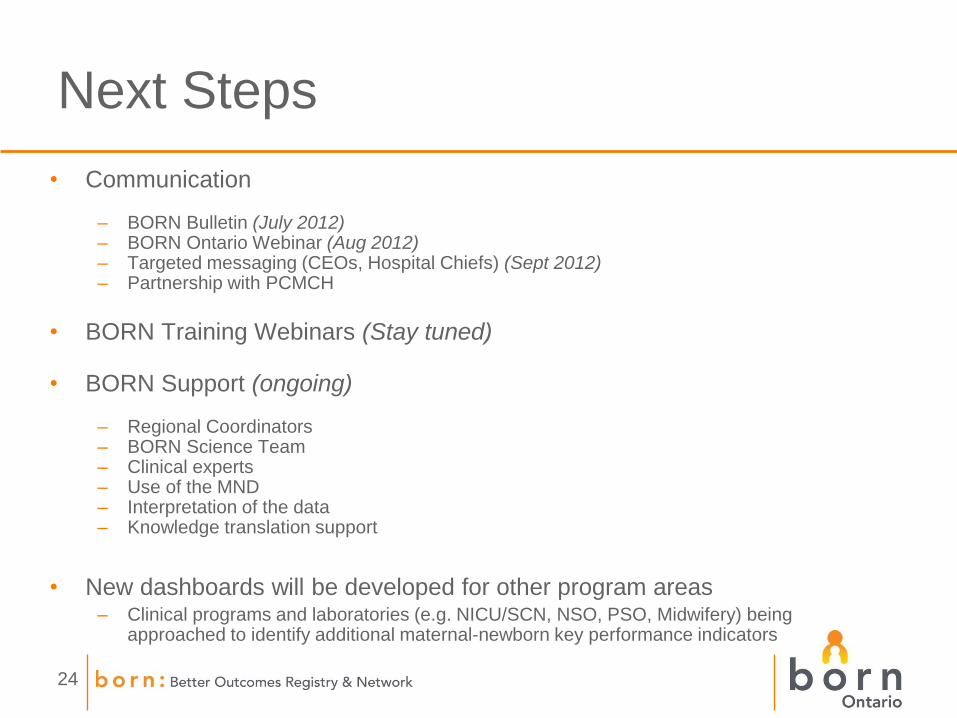
Next Steps
• Communication
– BORN Bulletin (July 2012) – BORN Ontario Webinar (Aug 2012) – Targeted messaging (CEOs, Hospital Chiefs) (Sept 2012) – Partnership with PCMCH
• BORN Training Webinars (Stay tuned)
• BORN Support (ongoing)
– Regional Coordinators – BORN Science Team – Clinical experts – Use of the MND – Interpretation of the data – Knowledge translation support
• New dashboards will be developed for other program areas – Clinical programs and laboratories (e.g. NICU/SCN, NSO, PSO, Midwifery) being
approached to identify additional maternal-newborn key performance indicators
25
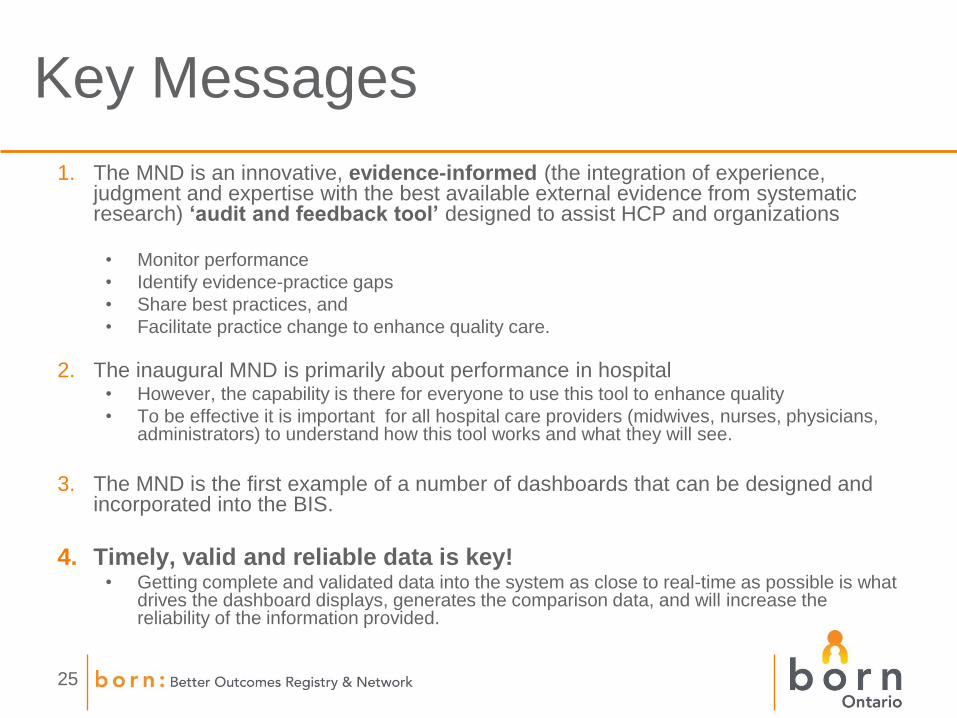
Key Messages
1. The MND is an innovative, evidence-informed (the integration of experience, judgment and expertise with the best available external evidence from systematic research) ‘audit and feedback tool’ designed to assist HCP and organizations
• Monitor performance
• Identify evidence-practice gaps
• Share best practices, and
• Facilitate practice change to enhance quality care.
2. The inaugural MND is primarily about performance in hospital • However, the capability is there for everyone to use this tool to enhance quality
• To be effective it is important for all hospital care providers (midwives, nurses, physicians, administrators) to understand how this tool works and what they will see.
3. The MND is the first example of a number of dashboards that can be designed and incorporated into the BIS.
4. Timely, valid and reliable data is key! • Getting complete and validated data into the system as close to real-time as possible is what
drives the dashboard displays, generates the comparison data, and will increase the reliability of the information provided.
26
References
1. Hermann, R.C., Palmer, R.H. (2002) Common ground: A framework for selecting core quality measures for mental health and substance abuse care. Psychiatric Services, 53(3), 281-287.
2. Ivers, N., Jamtvedt, G., Flottorp, S., Young, J.M., Odgaard-Jensen, J., French, S.D. et al. (2012) Audit and feedback: Effects on professional practice and healthcare. Cochrane Database of Systematic Reviews, 6(CD000259).
3. Institute of Medicine (2001) Crossing the quality chasm: A new health system for the 21st century. Washington, DC: National Academy Press.
4. Ministry of Health and Longterm Care (2010) Bill 46: Excellent Care for All Act. Toronto, Legislative Assembly of Ontario.
27
Questions?