
Boral Annual Report 2015
137
17 September 2015 The Manager, Listings Australian Securities Exchange ASX Market Announcements Exchange Centre 20 Bridge Street Sydney NSW 2000 Dear Sir 2015 Annual Report We attach the Company's 2015 Annual Report. The 2015 Annual Report is being sent to shareholders, other than those who have chosen to receive no reports, in accordance with choices made by them. Shareholders who have not made a choice will receive the Boral Review. The Annual Report and the Boral Review, together with the Notice of Meeting for the Company's 2015 Annual General Meeting, will also be posted on Boral's website www.boral.com.au. Yours faithfully Dominic Millgate Company Secretary Boral Limited Level 3, 40 Mount Street North Sydney NSW 2060 PO Box 1228 North Sydney NSW 2059 T: +61 (02) 9220 6300 F: +61 (02) 9233 6605 www.boral.com.au Boral Limited ABN 13 008 421 761
description
Company Annual report
Transcript of Boral Annual Report 2015

17 September 2015
The Manager, Listings Australian Securities Exchange ASX Market Announcements Exchange Centre 20 Bridge Street Sydney NSW 2000 Dear Sir 2015 Annual Report We attach the Company's 2015 Annual Report. The 2015 Annual Report is being sent to shareholders, other than those who have chosen to receive no reports, in accordance with choices made by them. Shareholders who have not made a choice will receive the Boral Review. The Annual Report and the Boral Review, together with the Notice of Meeting for the Company's 2015 Annual General Meeting, will also be posted on Boral's website www.boral.com.au. Yours faithfully
Dominic Millgate Company Secretary
Boral Limited Level 3, 40 Mount Street North Sydney NSW 2060 PO Box 1228 North Sydney NSW 2059
T: +61 (02) 9220 6300 F: +61 (02) 9233 6605
www.boral.com.au
Boral Limited ABN 13 008 421 761
Boral LimitedAnnual Report for the year ended 30 June 2015 2015
BORALANNUALREPORT
Boral LimitedABN 13 008 421 761
Financial calendarPlease note dates are subject to review.
Record date for final dividend 4 September 2015
Final dividend payable 28 September 2015
Annual General Meeting 5 November 2015
Half year end 31 December 2015
Half year results announcement 10 February 2016
Ex dividend share trading commences 16 February 2016
Record date for interim dividend 18 February 2016
Interim dividend payable 11 March 2016
Year end 30 June 2016
The Annual General Meeting of Boral Limited will be held at the Civic Pavilion, The Concourse, Chatswood on Thursday 5 November 2015 at 10.30am.

Boral Limited Annual Report 2015 1
Chairman’s Review 2Chief Executive’s Review 4Financial Review 6Divisional Performance 10Sustainability Overview 18Executive Committee 26Board of Directors 27Corporate Governance 28Directors’ Report 412015 Remuneration Report 48Financial Statements 65Statutory Statements 128Shareholder Information 130Financial History 133
Non-IFRS information
EBIT before significant items and net profit after tax before significant items are non-IFRS measures used to provide a greater understanding of the underlying performance of the Group. This information has been extracted or derived from the financial statements. Significant items are detailed in note 4 to the financial statements and relate to income and expenses that are associated with significant business restructuring, impairment or individual transactions.
The sections of our Annual Report titled Chairman’s Review, Chief Executive’s Review, Financial Review and Divisional Performance comprise our operating and financial review (OFR) and form part of the Directors’ Report.
Boral Limited Annual ReportFor the year ended 30 June 2015
Boral Limited Annual Report 20152
From the Chairman
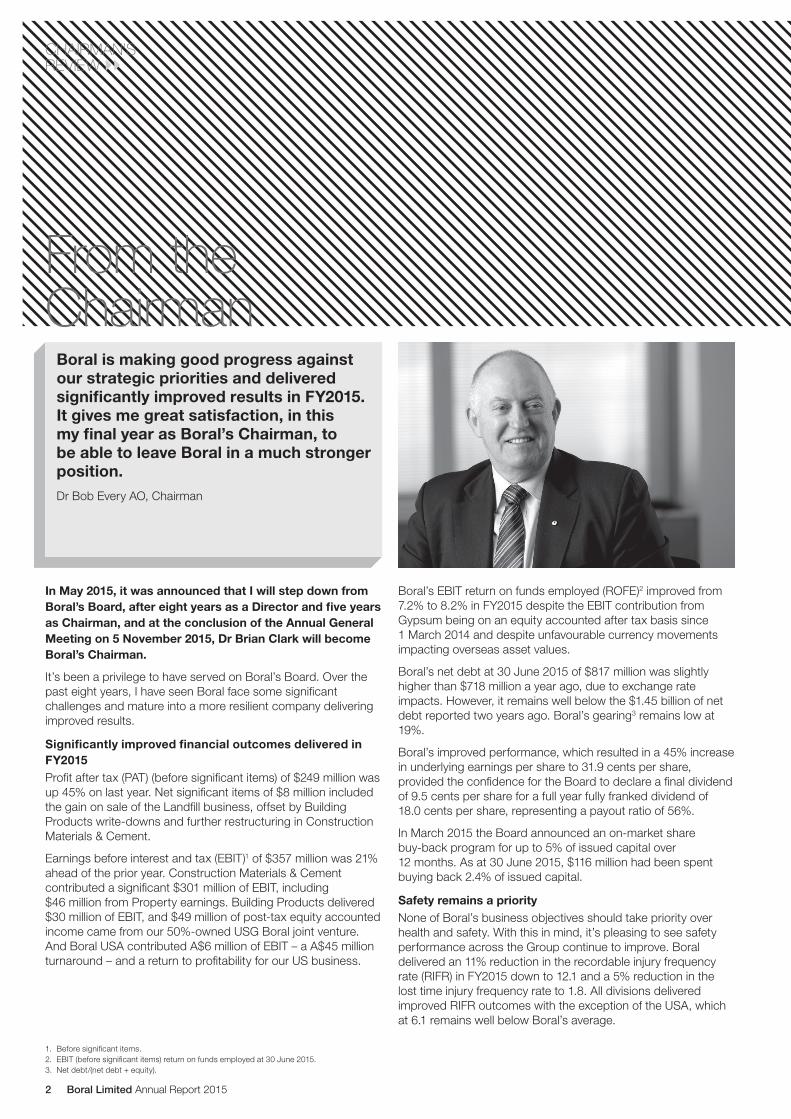
CHAIRMAN’S REVIEW
Boral is making good progress against our strategic priorities and delivered significantly improved results in FY2015. It gives me great satisfaction, in this my final year as Boral’s Chairman, to be able to leave Boral in a much stronger position.Dr Bob Every AO, Chairman
Boral’s EBIT return on funds employed (ROFE)2 improved from 7.2% to 8.2% in FY2015 despite the EBIT contribution from Gypsum being on an equity accounted after tax basis since 1 March 2014 and despite unfavourable currency movements impacting overseas asset values.
Boral’s net debt at 30 June 2015 of $817 million was slightly higher than $718 million a year ago, due to exchange rate impacts. However, it remains well below the $1.45 billion of net debt reported two years ago. Boral’s gearing3 remains low at 19%.
Boral’s improved performance, which resulted in a 45% increase in underlying earnings per share to 31.9 cents per share, provided the confidence for the Board to declare a final dividend of 9.5 cents per share for a full year fully franked dividend of 18.0 cents per share, representing a payout ratio of 56%.
In March 2015 the Board announced an on-market share buy-back program for up to 5% of issued capital over 12 months. As at 30 June 2015, $116 million had been spent buying back 2.4% of issued capital.
Safety remains a priorityNone of Boral’s business objectives should take priority over health and safety. With this in mind, it’s pleasing to see safety performance across the Group continue to improve. Boral delivered an 11% reduction in the recordable injury frequency rate (RIFR) in FY2015 down to 12.1 and a 5% reduction in the lost time injury frequency rate to 1.8. All divisions delivered improved RIFR outcomes with the exception of the USA, which at 6.1 remains well below Boral’s average.
In May 2015, it was announced that I will step down from Boral’s Board, after eight years as a Director and five years as Chairman, and at the conclusion of the Annual General Meeting on 5 November 2015, Dr Brian Clark will become Boral’s Chairman.
It’s been a privilege to have served on Boral’s Board. Over the past eight years, I have seen Boral face some significant challenges and mature into a more resilient company delivering improved results.
Significantly improved financial outcomes delivered in FY2015Profit after tax (PAT) (before significant items) of $249 million was up 45% on last year. Net significant items of $8 million included the gain on sale of the Landfill business, offset by Building Products write-downs and further restructuring in Construction Materials & Cement.
Earnings before interest and tax (EBIT)1 of $357 million was 21% ahead of the prior year. Construction Materials & Cement contributed a significant $301 million of EBIT, including $46 million from Property earnings. Building Products delivered $30 million of EBIT, and $49 million of post-tax equity accounted income came from our 50%-owned USG Boral joint venture. And Boral USA contributed A$6 million of EBIT – a A$45 million turnaround – and a return to profitability for our US business.
1. Before significant items.2. EBIT (before significant items) return on funds employed at 30 June 2015.3. Net debt/(net debt + equity).

Boral Limited Annual Report 2015 3
Stronger housing activityIn FY2015, Boral benefited from increased activity in US and Australian housing markets and strength in Asian construction markets. Non-residential construction in Australia was strong, especially in New South Wales, but overall it was slightly softer in FY2015 than in the prior year. Similarly, Australian roads, highways and engineering activity slowed during the year, which was in line with market expectations.
In the USA, housing starts increased from around 950,000 starts in FY2014 to 1.05 million in FY2015. When taken together with US$20 million of business improvement initiatives, this helped return Boral USA to profitability for the first time since FY2007.
Fix, Execute, Transform program is delivering resultsBoral’s Fix, Execute, Transform program continues to be an effective framework for business improvement, with efforts continuing to manage costs down and maintain a strong balance sheet.
During FY2015, rationalisation and portfolio reshaping initiatives also continued. In December 2014, the specialty cement kiln at Maldon was closed, continuing Boral’s transition away from sub-scale cement manufacturing to lower cost imports. In February 2015, the divestment of Boral’s Landfill business in Melbourne to Transpacific Industries (TPI) was completed, delivering significant benefits. Boral received an upfront payment of approximately $165 million from TPI and will continue to receive a long-term earnings stream in the form of fixed payments and volume-based royalties. In May 2015, the Australian East Coast Bricks joint venture between CSR and Boral commenced, and is expected to deliver synergies of between $7 million and $10 million per annum following integration.
The BoardAs announced in May 2015, Brian Clark has agreed to succeed me as Chairman of Boral following this year’s AGM. Brian has had an outstanding career as an executive with extensive international experience. He is also a very experienced director and is well positioned to chair the Company through the next phase of its Fix, Execute, Transform program.
Succession planning has been an important focus for the Board and I am confident that the Company and the Board will be in very capable hands under Brian’s Chairmanship as it continues to drive the Company’s strategy to create sustainable value for shareholders.
Thank youOn behalf of the Board, I thank Mike Kane for his excellent leadership over the past three years. I also thank Boral’s employees and executive team, for their skill and commitment to delivering positive outcomes for Boral’s shareholders, customers and communities.
We remain confident that Boral has the right team and the right strategy to continue to transform into a company that is known for its excellent safety performance, innovative product platforms and attractive returns on shareholders’ funds.
On a personal note, it gives me great satisfaction, in this my final year as Boral’s Chairman, to be able to leave Boral in a much stronger postion and well positioned for the future.
My time as Chairman has seen difficult market conditions in the USA and much restructuring. It has not been a very rewarding time for shareholders and I thank them all for their ongoing support.
I also thank current and past Board members and all of Boral’s people who have supported me as Chairman. I thank them for the job they have done and for the friendships I have made.
Dr Bob Every AOChairman
THESE ROBUST DEMAND LEVELS, COMBINED WITH BENEFITS FROM IMPROVEMENT INITIATIVES AND PROPERTY SALES, UNDERPINNED A SIGNIFICANTLY IMPROVED PROFIT RESULT IN FY2015.

Boral Limited Annual Report 20154
Q: What’s driving the improvement in underlying business performance?
MK: We’ve been improving Boral’s cost base and managing our portfolio of businesses more efficiently to take advantage of upturns in demand, to respond more quickly to shortfalls in volumes as markets slow and to ensure that improvement programs offset inflationary cost pressures.
For example, while we took advantage of the peak demand in Australian housing construction during the year, in Construction Materials & Cement we experienced lower demand from roads, engineering and major infrastructure projects in Australia. In response, we took costs out, realigned our Asphalt operations in Queensland and Victoria, and we expedited a number of surplus property sales to take advantage of the strong property market.
Meanwhile in the USA, the rate of recovery in the housing market was lower than originally expected, so we took further action to take more costs out of the business and reduce expenditure, delivering US$20 million of benefits in FY2015. This ensured a return to profitability despite lower than expected volumes.
Q: How is health and safety performance tracking in Boral?
MK: Over the past three years Boral’s medical treatment injuries have reduced from 17 per million hours worked to 10. We are reducing these incidents on average by around 15% per year every year. More significantly the severity of these medical treatment cases has been cut in half.
Boral’s lost time injuries of 1.8 per million hours worked by employees and contractors in FY2015 was a 5% improvement on the prior year.
The last work-related fatality in Boral was in 2013 when a contracted driver was tragically killed in a heavy vehicle road accident while transporting Boral materials.
QUESTION: Which businesses performed well in FY2015?
MIKE KANE: I’m pleased to say that there are good stories to tell from all of Boral’s divisions.
Boral’s largest division – Construction Materials & Cement – delivered a significant $301 million of earnings before interest and tax (EBIT), 9% higher than in the previous year. Higher margins in Asphalt, Cement and Concrete Placing due to operational and cost improvements, and $46 million of Property earnings more than offset the impact of fewer engineering, roads and infrastructure projects.
Boral’s smaller Building Products division delivered $30 million of EBIT in FY2015 – a $70 million turnaround in only two years. Restructuring and improvement initiatives have positioned the business well to take advantage of higher housing-related volumes.
Our 50%-owned USG Boral gypsum joint venture delivered a 38% increase in underlying EBIT to $141 million, resulting in a post-tax profit contribution of $49 million for Boral. The business continued to leverage underlying market growth at the same time as increasing product penetration in maturing markets, including our new world leading Sheetrock® technology products.
Perhaps the best news for Boral, however, is that our US division returned to profitability in FY2015, with a positive A$6 million of EBIT. This is the first profitable outcome since the global financial crisis impacted in FY2007. The A$45 million year-on-year turnaround was underpinned by a 10% increase in housing starts to 1.05 million.
CHIEF EXECUTIVE’S REVIEW
In conversation with Mike Kane
We’ve firmly moved to the Execute and Transform phases of our Fix, Execute, Transform program and our performance reflects this.
Mike Kane, CEO & Managing Director

Boral Limited Annual Report 2015 5
I remain resolutely focused on creating a culture of Zero Harm. To deliver on this requires commitment and trust in the people who work for me and the broader Boral team. I need to know they share the same obligation so that we are all fully engaged in ensuring that everyone is safe – always. I expect senior leaders to inspire and require change, and I am pleased to report that I am seeing this throughout the organisation.
Q: After almost three years as CEO, how do you see Boral’s strategy progressing?
MK: My vision is to transform Boral into a global building products and construction materials company recognised for its world-class safety performance and for delivering strong returns. I want Boral to deliver performance excellence and sustainable growth with innovation at its core.
We are moving in the right direction. We’ve firmly moved to the Execute and Transform phases of our Fix, Execute, Transform program and our performance reflects this.
We’ve improved Boral’s cost base, strengthened the balance sheet and we’re managing our portfolio of businesses more efficiently. Portfolio realignment continues to strengthen Boral. This includes the sale of our Western Landfill business in Melbourne and the formation of the Boral CSR Bricks joint venture during the year.
We are also growing through innovation. The formation of USG Boral, providing access to world leading technologies, and our Innovation Factory, which is developing lightweight composite products, are helping to achieve this.
Q: What is the outlook for Boral?
MK: Boral’s medium- and longer-term earnings growth will come from the continuing market recovery in the USA, and long-term market growth and product penetration in Asia.
In Australia, the aim is to strengthen and protect Boral’s leading integrated positions in Construction Materials & Cement, and continue to improve Building Products.
I see encouraging signs for Boral over the next five years. Boral is well positioned to take full advantage of strong conditions expected in most key markets.
Looking at the near term, in FY2016 we expect:
Construction Materials & Cement will be focused on maintaining earnings, excluding property, broadly in line with FY2015. Benefits from restructuring and improvement initiatives, together with continued strength in the Sydney construction market, will be needed to offset a depressed Queensland construction market, subdued activity in roads, infrastructure and engineering, and further tapering off of LNG major project volumes. Property is expected to contribute to earnings in FY2016 but the timing and quantum is uncertain.
Earnings from Building Products should be maintained, with improvement initiatives offsetting the impact of housing activity coming off its peak and the impact of earnings from Bricks East moving to a 40% post-tax equity accounted share of earnings from Boral CSR Bricks.
USG Boral is expected to deliver further underlying performance improvements. Volumes of new Sheetrock® products should continue to grow and synergies should also strengthen in FY2016. Synergies are expected to exceed the cash costs associated with the expanded product portfolio and technology roll-out this year.
Boral USA should report a further increase in earnings in FY2016 on the back of increased housing activity. While the cost-out program undertaken in FY2015 will not be repeated, EBIT is expected to lift as a result of forecasters’ projected increase in housing activity to approximately 1.2 million starts in FY2016.
Mike KaneCEO & Managing Director
AS BORAL’S CEO, MY MOST IMPORTANT OBLIGATION IS TO DO EVERYTHING WITHIN MY CONTROL TO FOSTER A SAFE AND HEALTHY WORK ENVIRONMENT WHERE NO ONE IS HURT.

Boral Limited Annual Report 20156
FINANCIAL REVIEW
• Building Products revenue of $485.4m was in line with prior year. Price gains and stronger housing construction activity in NSW, Queensland, Victoria and Western Australia were offset by the absence of two months of East Coast Bricks revenue following the formation of the Boral CSR Bricks joint venture on 1 May 2015. In addition, Timber volumes were down, reflecting the exit from the engineered flooring business and efforts to reduce inventories in the prior year.
• Gypsum underlying revenue of $1.27b was up 16% on the prior year, driven by a 2% growth in board volumes, increased non-board revenue and higher average prices in Australia, Korea and Indonesia.
• USA revenue of A$838.6m was up 23% on the prior year, benefiting from increased US housing construction activity across all key geographic regions. Total US housing starts increased by 10% to 1.05 million starts during FY2015.
Financial performanceRevenueReported revenue of $4.41b was down 15% on the prior year, reflecting the impact of a full year of equity accounting in the Gypsum division, following the formation of the USG Boral joint venture on 1 March 2014. Revenue from continuing operations was broadly steady at $4.30b, with revenue growth in the USA offsetting a decline in Construction Materials & Cement.
• Construction Materials & Cement revenue of $3.09b was down 6%, with declines in Quarries and Asphalt driven by the slowdown in roads and highways activity, particularly in Queensland. Cement revenue was down as a result of changed wholesale supply agreements. This was partly offset by higher volumes in Concrete with stronger housing construction activity in major capital cities, despite lower volumes elsewhere including into major LNG projects.
Income statementYear ended 30 June 2015 2014
$ millions GroupContinuing operations
Discontinued operations Group
Continuing operations
Discontinued operations
Sales revenue 4,414.7 4,297.6 117.1 5,203.9 4,325.7 878.2
EBIT1 356.7 345.4 11.3 294.2 222.5 71.7
Finance costs1 (63.7) (63.7) – (83.1) (80.7) (2.4)
Tax expense1 (43.8) (39.7) (4.1) (36.8) (13.1) (23.7)
Non-controlling interests – – – (2.9) 2.9 (5.8)
Underlying net profit after tax1 249.2 242.0 7.2 171.4 131.6 39.8
Net significant items 7.8 1.4 6.4 1.9 (22.6) 24.5
Net profit after tax 257.0 243.4 13.6 173.3 109.0 64.3
1. Before significant items. EBIT before significant items is a non-IFRS measure used to provide a greater understanding of the underlying business performance of the Group. The disclosures are extracted or derived from the audited financial statements.
Report from the CFO
Continued growth in housing market activity in Australia and the USA, together with higher property earnings, offset by a slowdown in roads and resource-related construction activity in Australia, led to an improved performance for the Group during FY2015.
Rosaline Ng, Chief Financial Officer

Boral Limited Annual Report 2015 7
Earnings before interest and tax (EBIT)1
Group EBIT before significant items of $356.7m was up 21% on the prior year, reflecting a strong focus on operational improvements and cost savings.
• Construction Materials & Cement EBIT of $301.4m was up 9% due to higher Property earnings of $46.0m in FY2015 compared to $8.0m in FY2014. Excluding Property, EBIT of $255.4m was down 5% compared to the prior year, with higher earnings from operational and cost improvements in Asphalt, Cement and Concrete Placing offset by lower earnings in Concrete and Quarries.
• Building Products EBIT of $29.5m was a $21.3m improvement on the prior year as the division continued its turnaround. The result was driven by improved pricing across all products and markets, the benefits of production volume leverage, and improved operational and cost performance, particularly in Bricks and Timber.
• Gypsum contributed $48.7m of equity accounted income to the Group, representing 12 months of Boral’s 50% share of post-tax USG Boral earnings. The result is $28.8m below the prior year which consisted of eight months of 100% consolidated pre-tax earnings and four months of equity accounted earnings after the formation of the joint venture. The underlying performance of the joint venture improved by 38% with margin expansion in all key regions and strong results from Australia, Korea, Thailand and Indonesia.
• USA EBIT of A$5.9m was a A$44.5m improvement on the prior year. The return to profitability was underpinned by significant volume gains, particularly in Cultured Stone, Trim and Roofing; solid pricing growth in Trim, Roofing, Fly Ash and Construction Materials; improved production volume leverage, and US$20.0m in cost savings from SG&A savings and from the restructure and consolidation of regional sales and manufacturing undertaken in June 2014.
Finance costs1
Net underlying interest expense decreased from $83.1m in FY2014 to $63.7m in FY2015, reflecting the impact of a full year of lower debt levels following the Gypsum sale in February 2014, as well as the receipt of proceeds from the sale of the Western Landfill business received in February 2015. Underlying interest cover improved from 3.5 times last year to 5.6 times in FY2015.
Tax expense1
The average effective tax rate for the year decreased from 17% in FY2014 to 15% in FY2015, driven by increased equity accounted earnings and the benefit of capital losses recovered during the year.
Net profit after tax1
Net profit after tax before significant items was $249.2m, a 45% increase over the prior year. This improvement was due to a 21% increase in EBIT together with a $19.4m reduction in interest, partially offset by a $7m increase in tax expense. Reported profit after tax of $257.0m included a net benefit of $7.8m from significant items and compares to a profit of $173.3m in the prior year, which included significant gains of $1.9m.
Significant itemsDuring the year, the Group recorded an after-tax significant gain of $7.8m in respect of items that were excluded from the underlying trading result. This primarily relates to gains and losses arising from changes made to the portfolio and as a result of impairment charges in Building Products and restructuring activities in Construction Materials & Cement.
Reconciliation of underlying results to reported results for FY2015
$ millions EBIT Finance costs Tax Profit after tax
Underlying results 356.7 (63.7) (43.8) 249.2
Significant items
Gain on disposal of Western Landfill 115.0
Impairment of Building Products businesses
West Coast Bricks (31.3)
Roofing and Masonry (29.9)
Hardwood (11.4)
Construction Materials & Cement restructure
Site closures (16.4)
SG&A redundancies (10.0)
Waurn Ponds make safe demolition (4.5)
East Coast Bricks costs (8.1)
Other (1.5)
Income tax benefit 5.9
Total significant items 1.9 – 5.9 7.8
Reported results 358.6 (63.7) (37.9) 257.0

Boral Limited Annual Report 20158
FINANCIALREVIEW
Gain on disposal of Western LandfillIn February 2015, the Group completed a transaction to divest its Western Landfill business in Melbourne, Victoria. This generated sale proceeds of $150.0m plus site preparation fees of approximately $15m. An EBIT gain of $115.0m was recognised after taking into account the costs of disposal and the value of assets disposed of as part of the transaction.
The Group will continue to receive royalty revenue of approximately $15m per annum.
Impairment of Building Products businessesThe Group has continued to review the Building Products portfolio. In light of current and expected market conditions, and the competitive landscapes in which the Building Products businesses operate, a reassessment of the carrying value of the West Coast Bricks, Roofing and Masonry, and Hardwood businesses was performed during the year.
The outlook for falling housing starts in Western Australia from its current peak, combined with increased competitor activity, has led to an impairment of $31.3m being recorded in the year for the Australian West Coast Bricks business.
The outlook for the Australian Roofing and Masonry business is impacted by falling levels of roofing intensity and increased penetration of metal roofing substitute products. The combination of this and the expectation that market conditions will deteriorate over the medium term, has led to an impairment of $29.9m being recorded in the year.
The Hardwood business has commenced a significant restructuring program as a result of a strategic review of the business. Activities include upgrades of the Herons Creek, Koolkhan and Nowra saw mills, construction of a new distribution centre in Murwillumbah and an overhaul of the logistics network. The implementation of this plan has led to an asset impairment of $8.9m and restructuring costs of $2.5m being incurred.
Construction Materials & Cement restructureThe decline in roads and highways activity and the reduction in resource-related construction work has led to a review of the asset portfolio and organisational structure of the Construction Materials business. As a result, asset impairment and restructuring costs of $16.4m have been recorded for the closure of 10 sites, predominantly in Queensland.
This is in addition to $10.0m of redundancy and restructuring costs recorded in the first half of FY2015, to further streamline the organisation in response to current market conditions.
Finally, $4.5m of costs have been recorded in connection with make safe demolition works to be performed on the Waurn Ponds clinker manufacturing facility, which was fully impaired in FY2013. While the site has not been formally closed, deterioration in the condition of the existing plant and equipment has led to the requirement to perform essential safety-related demolition work, particularly to ensure the safety of employees at the adjoining grinding facility.
East Coast Bricks costsDuring the year, the Group received clearance from the Australian Competition and Consumer Commission for the East Coast Bricks business to enter into a joint venture with CSR Limited. On disposal of its interest, Boral deconsolidated its existing East Coast Bricks business and recognised an equity accounted investment in respect of its 40% shareholding in the Boral CSR Bricks joint venture. This resulted in a net loss of $1.7m.
Following formation of Boral CSR Bricks, the joint venture incurred restructuring and stamp duty costs of $6.4m in order to realise overhead savings from the consolidation of management structures and efficiency gains in sales and administration functions.
OtherOther items relate to the gain on disposal of Oklahoma Quarries, which completed in January 2015 for a profit on sale of $1.7m; and a loss of $3.2m as a result of the finalisation of completion adjustments associated with the disposal of the Gypsum shareholding in FY2014.
Income tax benefitThe income tax benefit of $5.9m includes a benefit attributable to tax losses recovered from previous sale transactions recorded in significant items.
Cash flowFor year ended 30 June, $ millions 2015 2014
EBITDA1 605 556
Change in working capital 37 91
Interest and tax (109) (65)
Equity earnings less dividends (34) (28)
Profit on sale of assets (41) (15)
Other items 4 3
Restructuring costs paid (44) (34)
Operating cash flow 418 507
Capital expenditure (250) (268)
Investments – (48)
Proceeds on disposal of assets 45 37
Proceeds on disposal of controlled entities2
149 555
Free cash flow 363 782
Dividends paid – net DRP (129) (57)
On-market share buy-back (116) –
Other items – (4)
Cash flow 118 721
Operating cash flow decreased by $89m to $418m in FY2015, reflecting higher tax payments and a lower inflow from working capital, offsetting improved earnings, compared to the prior year.
1. Excluding significant items.2. Excludes cash disposed in FY2014: $79m.(Figures may not add due to rounding).

Boral Limited Annual Report 2015 9
Change in working capitalThe Group recorded a net cash inflow from working capital movements in FY2015, driven by the receipt of approximately $15m in site preparation deferred revenue associated with the Western Landfill transaction and further improvements in debtor management. The prior year working capital improvement benefited from a number of one-off inflows including a reduction in inventories in the Australian Brick and Timber businesses, proceeds from the sale of the Quarrywest property, insurance proceeds from the Queensland floods and a cash receipt from the Forestry Corporation of NSW for a reduced timber allocation.
Interest and taxInterest payments declined compared to the previous year reflecting reduced debt levels following the receipt of proceeds from the Gypsum divestment in February 2014, the Western Landfill divestment in February 2015, and ongoing tight working capital management.
The Group reported increased tax payments as a result of a catch-up in payments required in respect of tax from FY2014 and a higher instalment rate during FY2015. The prior year also benefited from the resolution of matters with the Australian Taxation Office.
Capital expenditureCapital expenditure at $250m in FY2015 continued to be tightly managed and was held below the prior year levels. Stay-in-business expenditure was broadly in line with the prior year with the Group focused on safety and environmental initiatives, asset replacement and cost reduction projects. Stay-in-business expenditure represented 85% of depreciation, up from 78% in FY2014. Growth expenditure decreased from $65m in FY2014 to $39m in FY2015.
InvestmentsFY2014 included the final payment of $48m in respect of the outstanding liability relating to the acquisition of the Cultured Stone business in the USA.
Proceeds on disposal of controlled entitiesDuring the year, the Group generated $149m from the disposal of Western Landfill and Oklahoma Quarries, net of transaction costs; compared to $555m from the disposal of the Gypsum and Windows businesses, net of transaction costs, in FY2014.
Debt and gearing
As at 30 June 2015
$ millions2014
$ millions
Total debt 1,322.6 1,101.5
Total cash and deposits 505.8 383.2
Net debt 816.8 718.3
Total shareholders equity 3,524.1 3,348.1
Gearing ratios
Net debt: equity (%) 23 21
Net debt: equity plus net debt (%) 19 18
Interest cover1 (times) 5.6 3.5
Net debtNet debt increased by $98.5m to $816.8m, primarily due to the impact of the foreign currency translation of US denominated debt as the Australian dollar weakened offsetting positive cash generation during the year.
Gearing ratiosBoral’s gearing covenant with its financiers, measured as gross debt to gross debt plus equity less intangibles, increased to 29%, remaining comfortably within the 60% threshold. Gearing as measured by net debt to net debt plus equity is broadly in line with FY2014 at 19%.
In May 2015, the Group refinanced US$200m of US senior notes. The new notes have expiry dates ranging from May 2025 to March 2030. This has led to an increase in the weighted average debt maturity to around 4.5 years compared to 3.4 years in FY2014.
In addition, the Group maintained A$500m of committed undrawn bank debt facilities as a hedge against unforeseen macro-economic risk throughout FY2015. On 1 July 2015, this was replaced with a US$400m committed undrawn bank debt facility, with a maturity date of 1 July 2020.
Financial risk managementThe Group is exposed to financial risk in its operations as a result of fluctuations occurring in interest and foreign exchange rates and certain commodity prices. Boral uses financial instruments where considered appropriate to manage these risks. Boral has hedged its foreign exchange exposures arising from its investment in its US operations; however, earnings from foreign operations are not hedged.
Capital management On 18 March 2015, Boral announced its intention to commence an on-market share buy-back program for up to 5% of the Company’s issued capital, or approximately 39 million shares, over the next 12 months. As at 30 June 2015, the Company bought back 18,494,862 shares for total consideration of $116.0m.
In FY2015 an interim dividend of 8.5 cents per share and a final dividend of 9.5 cents per share were declared. Both were fully franked. The Group’s Dividend Reinvestment Plan remains suspended until further notice.1. Excludes significant items.

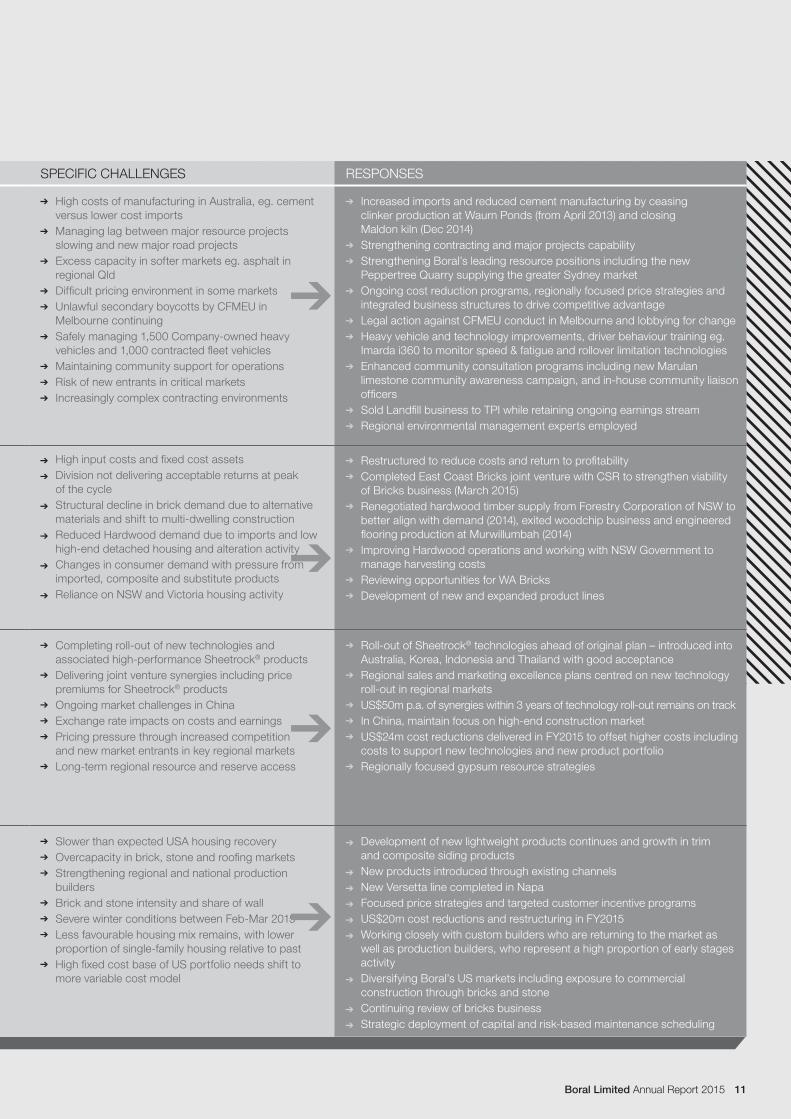
How we’re responding to
Risks and ChallengesOUR DIVISIONS PRODUCTS STRATEGIC DIRECTION SPECIFIC CHALLENGES RESPONSES
BORAL CONSTRUCTION MATERIALS & CEMENT
PROTECT AND STRENGTHEN LEADING INTEGRATED POSITIONS. GROW MAJOR PROJECT CAPABILITY FOR LONG-TERM VALUE
High costs of manufacturing in Australia, eg. cement versus lower cost imports
Managing lag between major resource projects slowing and new major road projects
Excess capacity in softer markets eg. asphalt in regional Qld
Difficult pricing environment in some markets Unlawful secondary boycotts by CFMEU in
Melbourne continuing Safely managing 1,500 Company-owned heavy
vehicles and 1,000 contracted fleet vehicles Maintaining community support for operations Risk of new entrants in critical markets Increasingly complex contracting environments
Increased imports and reduced cement manufacturing by ceasing clinker production at Waurn Ponds (from April 2013) and closing Maldon kiln (Dec 2014)
Strengthening contracting and major projects capability Strengthening Boral’s leading resource positions including the new
Peppertree Quarry supplying the greater Sydney market Ongoing cost reduction programs, regionally focused price strategies and
integrated business structures to drive competitive advantage Legal action against CFMEU conduct in Melbourne and lobbying for change Heavy vehicle and technology improvements, driver behaviour training eg.
Imarda i360 to monitor speed & fatigue and rollover limitation technologies Enhanced community consultation programs including new Marulan
limestone community awareness campaign, and in-house community liaison officers
Sold Landfill business to TPI while retaining ongoing earnings stream Regional environmental management experts employed
CONCRETEQUARRIESCEMENTASPHALTPLACINGPROPERTY
BORAL BUILDING PRODUCTS
OPTIMISE ASSETS TO MAXIMISE RETURNS. FURTHER WORK REQUIRED TO DELIVER ACCEPTABLE RETURNS
High input costs and fixed cost assets Division not delivering acceptable returns at peak
of the cycle Structural decline in brick demand due to alternative
materials and shift to multi-dwelling construction Reduced Hardwood demand due to imports and low
high-end detached housing and alteration activity Changes in consumer demand with pressure from
imported, composite and substitute products Reliance on NSW and Victoria housing activity
Restructured to reduce costs and return to profitability Completed East Coast Bricks joint venture with CSR to strengthen viability
of Bricks business (March 2015) Renegotiated hardwood timber supply from Forestry Corporation of NSW to
better align with demand (2014), exited woodchip business and engineered flooring production at Murwillumbah (2014)
Improving Hardwood operations and working with NSW Government to manage harvesting costs
Reviewing opportunities for WA Bricks Development of new and expanded product lines
BRICKSROOFING MASONRYTIMBER
BORAL GYPSUM
DELIVER USG BORAL SYNERGIES. LONG-TERM GROWTH PLATFORM LEVERAGING MARKET GROWTH, INCREASING PRODUCT PENETRATION, INNOVATION AND ADJACENT PRODUCTS
Completing roll-out of new technologies and associated high-performance Sheetrock® products
Delivering joint venture synergies including price premiums for Sheetrock® products
Ongoing market challenges in China Exchange rate impacts on costs and earnings Pricing pressure through increased competition
and new market entrants in key regional markets Long-term regional resource and reserve access
Roll-out of Sheetrock® technologies ahead of original plan – introduced into Australia, Korea, Indonesia and Thailand with good acceptance
Regional sales and marketing excellence plans centred on new technology roll-out in regional markets
$50m p.a. of synergies within 3 years of technology roll-out remains on track In China, maintain focus on high-end construction market US$24m cost reductions delivered in FY2015 to offset higher costs including
costs to support new technologies and new product portfolio Regionally focused gypsum resource strategies
PLASTERBOARD CEILINGS & ADJACENT PRODUCTS VIA 50%–OWNED USG BORAL
BORAL USA SIGNIFICANT GROWTH THROUGH MARKET RECOVERY. PORTFOLIO REFINEMENT AS CYCLE STRENGTHENS
Slower than expected USA housing recovery Overcapacity in brick, stone and roofing markets Strengthening regional and national production
builders Brick and stone intensity and share of wall Severe winter conditions between Feb-Mar 2015 Less favourable housing mix remains, with lower
proportion of single-family housing relative to past High fixed cost base of US portfolio needs shift to
more variable cost model
Development of new lightweight products continues and growth in trim and composite siding products
New products introduced through existing channels New Versetta line completed in Napa Focused price strategies and targeted customer incentive programs US$20m cost reductions and restructuring in FY2015 Working closely with custom builders who are returning to the market as
well as production builders, who represent a high proportion of early stages activity
Diversifying Boral’s US markets including exposure to commercial construction through bricks and stone
Continuing review of bricks business Strategic deployment of capital and risk-based maintenance scheduling
CLADDING ROOFINGFLY ASH
GENERAL RISKS
Health, Safety & Environment (HSE) Risks
Licence to operate Injury and accident risks Environmental damage risk
Industry & Market Risks High costs of doing business Structural changes in demand Cyclical changes in demand Political cycles and impact
on infrastructure spend
Competition Risks New market entrants Import competition Technology developments
/ R&D
Business Interruption Risks Plant failure Weather impacts Geopolitical impacts Industrial action
Foreign Exchange Risks Cost of inputs Translation of Boral USA and
Boral Gypsum earnings Capital equipment transactions
RESPONSES
Formal, bottom-up risk management process undertaken twice yearly
HSE operating standards, policies, procedures and training with Board committee to review and monitor HSE matters
People strategy to attract, retain and develop talent with deep industry experience
Business continuity planning US net assets matched with
USD debt to hedge against USD fluctuations
Fix, Execute, Transform to deliver strong earnings, balance sheet and growth
DIVISIONAL PERFORMANCE
Boral Limited Annual Report 201510
OUR DIVISIONS PRODUCTS STRATEGIC DIRECTION SPECIFIC CHALLENGES RESPONSES
BORAL CONSTRUCTION MATERIALS & CEMENT
PROTECT AND STRENGTHEN LEADING INTEGRATED POSITIONS. GROW MAJOR PROJECT CAPABILITY FOR LONG-TERM VALUE
High costs of manufacturing in Australia, eg. cement versus lower cost imports
Managing lag between major resource projects slowing and new major road projects
Excess capacity in softer markets eg. asphalt in regional Qld
Difficult pricing environment in some markets Unlawful secondary boycotts by CFMEU in
Melbourne continuing Safely managing 1,500 Company-owned heavy
vehicles and 1,000 contracted fleet vehicles Maintaining community support for operations Risk of new entrants in critical markets Increasingly complex contracting environments
Increased imports and reduced cement manufacturing by ceasing clinker production at Waurn Ponds (from April 2013) and closing Maldon kiln (Dec 2014)
Strengthening contracting and major projects capability Strengthening Boral’s leading resource positions including the new
Peppertree Quarry supplying the greater Sydney market Ongoing cost reduction programs, regionally focused price strategies and
integrated business structures to drive competitive advantage Legal action against CFMEU conduct in Melbourne and lobbying for change Heavy vehicle and technology improvements, driver behaviour training eg.
Imarda i360 to monitor speed & fatigue and rollover limitation technologies Enhanced community consultation programs including new Marulan
limestone community awareness campaign, and in-house community liaison officers
Sold Landfill business to TPI while retaining ongoing earnings stream Regional environmental management experts employed
CONCRETEQUARRIESCEMENTASPHALTPLACINGPROPERTY
BORAL BUILDING PRODUCTS
OPTIMISE ASSETS TO MAXIMISE RETURNS. FURTHER WORK REQUIRED TO DELIVER ACCEPTABLE RETURNS
High input costs and fixed cost assets Division not delivering acceptable returns at peak
of the cycle Structural decline in brick demand due to alternative
materials and shift to multi-dwelling construction Reduced Hardwood demand due to imports and low
high-end detached housing and alteration activity Changes in consumer demand with pressure from
imported, composite and substitute products Reliance on NSW and Victoria housing activity
Restructured to reduce costs and return to profitability Completed East Coast Bricks joint venture with CSR to strengthen viability
of Bricks business (March 2015) Renegotiated hardwood timber supply from Forestry Corporation of NSW to
better align with demand (2014), exited woodchip business and engineered flooring production at Murwillumbah (2014)
Improving Hardwood operations and working with NSW Government to manage harvesting costs
Reviewing opportunities for WA Bricks Development of new and expanded product lines
BRICKSROOFING MASONRYTIMBER
BORAL GYPSUM
DELIVER USG BORAL SYNERGIES. LONG-TERM GROWTH PLATFORM LEVERAGING MARKET GROWTH, INCREASING PRODUCT PENETRATION, INNOVATION AND ADJACENT PRODUCTS
Completing roll-out of new technologies and associated high-performance Sheetrock® products
Delivering joint venture synergies including price premiums for Sheetrock® products
Ongoing market challenges in China Exchange rate impacts on costs and earnings Pricing pressure through increased competition
and new market entrants in key regional markets Long-term regional resource and reserve access
Roll-out of Sheetrock® technologies ahead of original plan – introduced into Australia, Korea, Indonesia and Thailand with good acceptance
Regional sales and marketing excellence plans centred on new technology roll-out in regional markets
US$50m p.a. of synergies within 3 years of technology roll-out remains on track In China, maintain focus on high-end construction market US$24m cost reductions delivered in FY2015 to offset higher costs including
costs to support new technologies and new product portfolio Regionally focused gypsum resource strategies
PLASTERBOARD CEILINGS & ADJACENT PRODUCTS VIA 50%–OWNED USG BORAL
BORAL USA SIGNIFICANT GROWTH THROUGH MARKET RECOVERY. PORTFOLIO REFINEMENT AS CYCLE STRENGTHENS
Slower than expected USA housing recovery Overcapacity in brick, stone and roofing markets Strengthening regional and national production
builders Brick and stone intensity and share of wall Severe winter conditions between Feb-Mar 2015 Less favourable housing mix remains, with lower
proportion of single-family housing relative to past High fixed cost base of US portfolio needs shift to
more variable cost model
Development of new lightweight products continues and growth in trim and composite siding products
New products introduced through existing channels New Versetta line completed in Napa Focused price strategies and targeted customer incentive programs US$20m cost reductions and restructuring in FY2015 Working closely with custom builders who are returning to the market as
well as production builders, who represent a high proportion of early stages activity
Diversifying Boral’s US markets including exposure to commercial construction through bricks and stone
Continuing review of bricks business Strategic deployment of capital and risk-based maintenance scheduling
CLADDING ROOFINGFLY ASH
Boral Limited Annual Report 2015 11

Boral Limited Annual Report 201512
Boral Construction Materials & Cement(A$) FY2015
Revenue $3,091m 6%
EBITDA1 $485m 9%
EBIT1 $301m 9%
Net assets $2,086m 4%
ROFE1 14.5%
Employees 4,803 5%
EBIT of $301m was $24m higher than in FY2014, driven by higher Property earnings, increased residential construction, a strong NSW market and improvement initiatives, which offset the impact of lower volumes from major roads, infrastructure and engineering construction activity and a challenging pricing environment.
FY15
FY14
$3.1
b
$3.3
b
FY15
FY14
$301
m
$277
m
Revenue EBIT1
Boral GypsumBoral’s full year reported result (A$) FY2015
Reported EBIT1/Equity income3 $49m 37%
Underlying USG Boral result (A$) FY2015
Revenue $1,268m 16%
EBITDA1 $201m 36%
EBIT1 $141m 38%
Net assets $1,901m 14%
ROFE1 7.4%
Employees 2,878 11%
Boral’s reported equity accounted income of $49m represents our 50% share of post-tax earnings from the USG Boral joint venture for the full year of FY2015, and compares with $77m for the FY2014 reported result3. EBIT in the underlying business increased 38% due to strong price discipline, a larger product range with the launch of Sheetrock® Brand products and USG adjacent products, as well as market activity.
Boral Building Products(A$) FY2015
Revenue $485m –
EBITDA1 $50m 70%
EBIT1 $30m 260%
Net assets $328m 20%
ROFE1 9.0%
Employees2 952 24%
A significant increase in EBIT from $8m in the prior year to $30m in FY2015 was driven by strong price and volume gains across all businesses, and improved operational performance and production costs.
FY15
FY14
$485
m
$487
m
FY15
FY14
$30m
$8m
Revenue EBIT1
Boral USA(A$) FY2015
Revenue $839m 23%
EBITDA1 $50m
EBIT1 $6m
Net assets $827m 24%
ROFE1 0.7%
Employees 2,357 2%
Boral USA broke through to profitability for the first time since FY2007 with EBIT of A$6m, up from an EBIT loss of A$39m in FY2014, reflecting the ongoing recovery in US housing activity, and a strong focus on costs and business improvement initiatives.
FY15
FY14
US
$695
m
US
$622
m
FY15
FY14
US
$5m
(US
$35m
)
Revenue EBIT 1
1. Excluding significant items.2. Includes a reduction of 290 employees in the East Coast Bricks business now employed in the Boral CSR Bricks JV.3. Gypsum consolidated results for the period Jul-13 to Feb-14; post-tax equity accounted income for period Mar-14 to Jun-15.
DIVISIONAL PERFORMANCE
Divisional results at a glance

Boral Limited Annual Report 2015 13
Asia Asia accounts for ~8% of Boral’s share of revenue1.
After strong growth last year, more modest levels of growth occurred in Korea in FY2015. Increased product penetration supported growth in gypsum demand in Indonesia and Thailand against a backdrop of steady construction markets. In China, construction activity remains more subdued than in previous years including in USG Boral’s high-end markets.
USATotal US housing starts increased by 10% to 1.05 million starts during FY20155. Overall, single-family starts increased by 8%, being up 8% in Boral’s US Brick States and up 9% in Boral’s US Tile States over the same period5.
Single-family starts as a proportion of total US starts at 64% remains below the long-term average of 71%.
Competition Boral generally competes against two or three large competitors and a number of smaller, independent players in most of its building products and construction materials markets.
In general, Boral’s large competitors in Australia, the USA and Asia have global leadership positions, which help drive efficiency and best practice. A few businesses experience additional competition as a result of imports, including Boral’s Timber business in Australia and the USG Boral joint venture in Asia.
In some cases, such as concrete and asphalt in Australia, barriers to entry are lower and new entrants are attracted to enter markets when demand is strong. Specific challenges relating to competition are highlighted on page 11.
In FY2015, Australian housing market activity continued to increase while non-residential, roads, highways and engineering activity contracted in line with expectation.
In Asia, strengthening or stable economic conditions benefited most markets, while in the USA, single-family housing construction continued to improve compared to the prior year, albeit at rates slower than anticipated.
Boral external revenue1 by market
Australian RHS&B 22%
Other Australian engineering 4%
USA dwellings12%
USA non-dwellings& engineering 3%
Other 6%
Australian dwellings30%Australian
non-dwellings 15%
Asia 8%
AustraliaRoads, highways, subdivisions & bridges (RHS&B) activity continued to decrease from its FY2012 peak, declining by an estimated 2% in FY20152. Other engineering activity is also estimated to have declined in FY2015. In FY2015, ~26% of Boral’s revenue was derived from Australian RHS&B and engineering market segments.
Housing activity in Australia drives ~30% of Boral’s total revenues with ~14% from detached housing, ~7% from multi-dwellings and the remaining ~9% from alterations & additions (A&A).
Detached housing starts increased by an estimated 9% in FY2015 on the prior year, while multi-residential starts increased 32%3. HIA is estimating housing starts increased to 214,700 in FY20153 which is a historical high, and up from 181,000 in FY2014.
Detached housing starts as a proportion of total starts have remained at historically low levels at an estimated 53% compared to the prior 20-year average of 66%.
Australian A&A activity increased by a modest 1% in FY20154 with NSW, Queensland and South Australia strongest.
Non-residential activity underpins ~15% of Boral’s revenue and was slightly down on the prior period falling 1%4, with strong growth in NSW and Victoria offset by reduced activity in the other states.
1. Includes Boral’s 50% share of underlying revenue from USG Boral, which does not appear in Boral’s consolidated accounts.
2. Based on the average forecasts of Macromonitor and BIS.3. ABS original housing starts; Jun-15 quarter based on HIA forecasts prepared in Jul-15.4. ABS value of work done 2012/13 constant prices; average of Macromonitor and
BIS forecasts used for Jun-15 quarter.5. US Census seasonally adjusted housing starts. McGraw Hill / Dodge data - Brick States:
Alabama, Arkansas, Georgia, Kentucky, Louisiana, Mississippi, North Carolina, Oklahoma, South Carolina, Tennessee, Texas. Tile States: Arizona, California, Florida, Nevada.
DIVISIONAL PERFORMANCE
Market conditions and competition
Boral Limited Annual Report 201514
OutlookCM&C will be focused on maintaining FY2016 EBIT broadly in line with FY2015, excluding Property.
Benefits from restructuring and improvement initiatives, together with continued strength in the Sydney construction market, will be needed to offset a depressed Queensland construction market, subdued RHS&B activity more broadly and further tapering off of LNG major project volumes. While pricing is challenging, we remain committed to maximising opportunities to improve price and margin outcomes but this needs to be balanced against our ability to sustain market share.
Property is expected to contribute in FY2016, but given the nature of Property earnings which have ranged between $8m and $46m over the past five years, the level of contribution in FY2016 is uncertain.
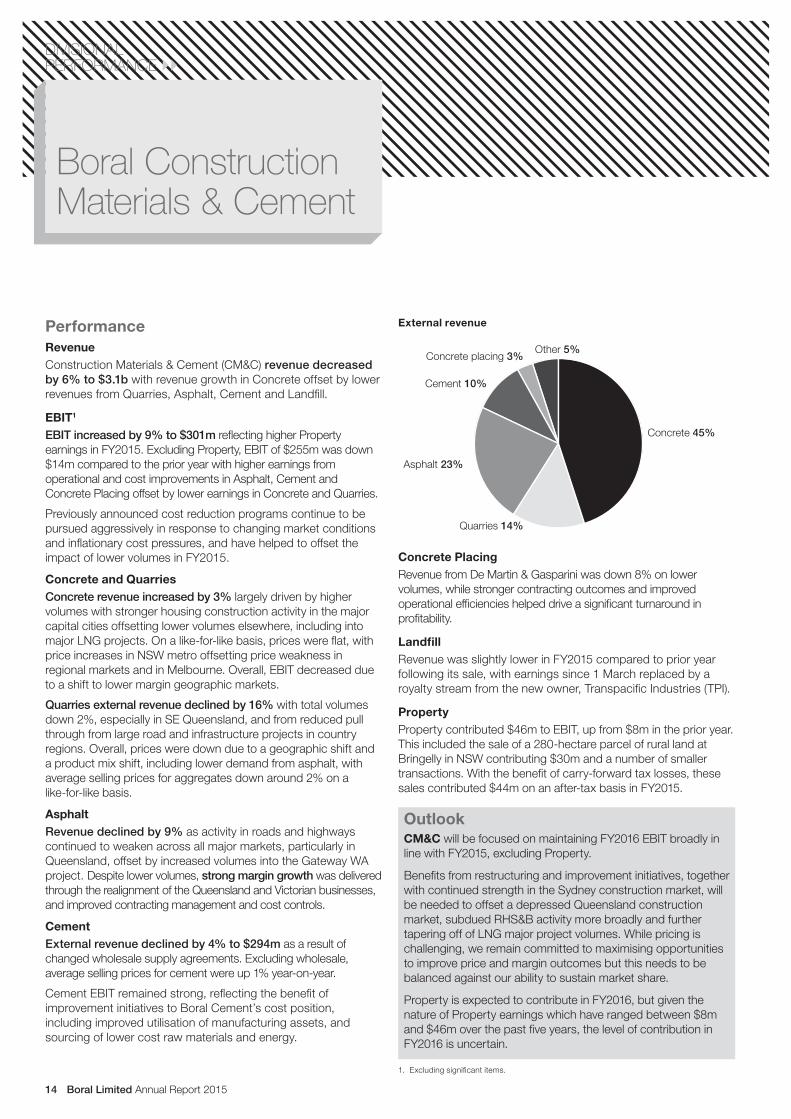
PerformanceRevenue Construction Materials & Cement (CM&C) revenue decreased by 6% to $3.1b with revenue growth in Concrete offset by lower revenues from Quarries, Asphalt, Cement and Landfill.
EBIT1
EBIT increased by 9% to $301m reflecting higher Property earnings in FY2015. Excluding Property, EBIT of $255m was down $14m compared to the prior year with higher earnings from operational and cost improvements in Asphalt, Cement and Concrete Placing offset by lower earnings in Concrete and Quarries.
Previously announced cost reduction programs continue to be pursued aggressively in response to changing market conditions and inflationary cost pressures, and have helped to offset the impact of lower volumes in FY2015.
Concrete and Quarries Concrete revenue increased by 3% largely driven by higher volumes with stronger housing construction activity in the major capital cities offsetting lower volumes elsewhere, including into major LNG projects. On a like-for-like basis, prices were flat, with price increases in NSW metro offsetting price weakness in regional markets and in Melbourne. Overall, EBIT decreased due to a shift to lower margin geographic markets.
Quarries external revenue declined by 16% with total volumes down 2%, especially in SE Queensland, and from reduced pull through from large road and infrastructure projects in country regions. Overall, prices were down due to a geographic shift and a product mix shift, including lower demand from asphalt, with average selling prices for aggregates down around 2% on a like-for-like basis.
Asphalt Revenue declined by 9% as activity in roads and highways continued to weaken across all major markets, particularly in Queensland, offset by increased volumes into the Gateway WA project. Despite lower volumes, strong margin growth was delivered through the realignment of the Queensland and Victorian businesses, and improved contracting management and cost controls.
Cement External revenue declined by 4% to $294m as a result of changed wholesale supply agreements. Excluding wholesale, average selling prices for cement were up 1% year-on-year.
Cement EBIT remained strong, reflecting the benefit of improvement initiatives to Boral Cement’s cost position, including improved utilisation of manufacturing assets, and sourcing of lower cost raw materials and energy.
Concrete Placing Revenue from De Martin & Gasparini was down 8% on lower volumes, while stronger contracting outcomes and improved operational efficiencies helped drive a significant turnaround in profitability.
LandfillRevenue was slightly lower in FY2015 compared to prior year following its sale, with earnings since 1 March replaced by a royalty stream from the new owner, Transpacific Industries (TPI).
Property Property contributed $46m to EBIT, up from $8m in the prior year. This included the sale of a 280-hectare parcel of rural land at Bringelly in NSW contributing $30m and a number of smaller transactions. With the benefit of carry-forward tax losses, these sales contributed $44m on an after-tax basis in FY2015.
External revenue
Concrete 45%
Cement 10%
Concrete placing 3%Other 5%
Quarries 14%
Asphalt 23%
DIVISIONAL PERFORMANCE
Boral Construction Materials & Cement
1. Excluding significant items.

Boral Limited Annual Report 2015 15
OutlookBuilding Products is expected to maintain a similar EBIT in FY2016 to the reported EBIT for FY2015. Improvement initiatives should offset the impact of housing activity coming off its peak and the impact of earnings from Bricks East moving from 100% consolidated to a 40% post-tax equity accounted share of earnings from the Boral CSR Bricks JV.
Performance1
RevenueBoral Building Products revenue was broadly steady at $485m, reflecting price gains and stronger housing activity in NSW, Queensland, Victoria and Western Australia, offset by the absence of two months of East Coast Bricks revenues after the formation of the Boral CSR Bricks JV on 1 May 2015 as well as decreased Timber volumes.
EBIT2 Building Products continued its turnaround with a strong $22m improvement in EBIT to $30m; Bricks and Timber reported significant gains over the prior year. The result reflects improved pricing across all products and markets, the benefits of production volume leverage, and improved operational performance and costs.
Bricks Volumes were up 5% with growth in all regions in line with housing construction activity, particularly in NSW, Queensland and WA. Nationally, average selling prices increased by 3% on the prior year with improved pricing outcomes in all states, particularly in NSW.
Roofing Overall modest volume growth was achieved over the prior year driven by increases in Victoria and South Australia, while volumes in NSW were impacted by competition from substitute products. Higher average selling prices reflected pricing gains together with an improved customer and product mix in Victoria.
Timber Revenue decreased by 3% compared to the prior year with growth in Softwood revenue partially offsetting a decline in Hardwood.
Higher Softwood revenues were driven by a 9% rise in average selling prices, which in part reflected increased sales of higher-priced structural products. Volumes were impacted by production constraints and competition from imports, particularly in the last quarter.
Volumes in Hardwood decreased 18% reflecting an exit from the engineered flooring business as well as significant efforts to reduce excess inventories in the prior year.
For continuing products, volumes were down 4% year-on-year reflecting subdued demand in the high-end alterations market and ongoing competitive pressures. Despite this, price rises were successfully implemented for continuing products with an increase of 4%. Inventory levels were marginally higher due to restructuring activity on the NSW south coast. Inventory reduction remains a priority.
External revenue
Bricks androo�ng 71%
Timber 29%
DIVISIONAL PERFORMANCE
Boral Building Products
1. Includes 10 months of fully consolidated results from the East Coast Bricks business, and two months of equity accounted (40%) share of post-tax earnings from the Boral CSR Bricks JV from 1 May 2015. Remaining Masonry operations are incorporated into the Bricks business in Western Australia and the Roofing business in other states.
2. Excluding significant items.
Boral Limited Annual Report 201516
Korea continued to report strong revenue and margin growth with prices up 4% and a significant rise in non-board sales. While market conditions were favourable, volumes were impacted as a key competitor overcame production supply constraints, which delivered a short-term volume benefit in the prior year.
Thailand reported solid earnings and margin growth with stronger volumes and lower fuel costs. While the political situation has stabilised, pricing remains challenged in a highly competitive environment.
Indonesia reported strong revenue and margin growth following significant price and volume gains. Good price outcomes following the introduction of Sheetrock® products offset the impact of slowing economic growth and local currency weakness.
Sales of non-board products and strong cost management underpinned results in China where the focus remains on selling to the high-end market.
The roll-out of Sheetrock® board technology is on track to remain within the two-year capital expenditure of US$50m. Synergies of US$50m per annum continue to be expected within three years of the full technology roll-out.
OutlookBoral Gypsum is expected to deliver further underlying performance improvements. Volumes of new Sheetrock® products should continue to grow and synergies should also strengthen in FY2016. Synergies are expected to exceed the cash costs associated with the expanded product portfolio and technology roll-out this year.
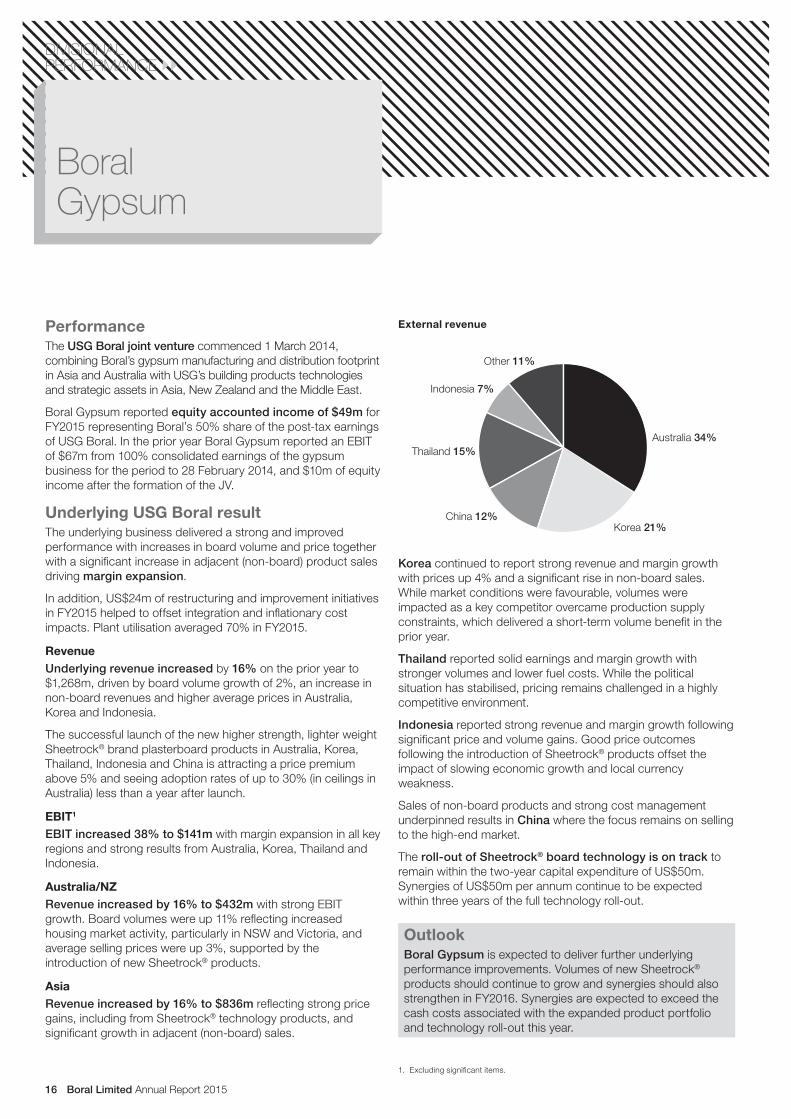
PerformanceThe USG Boral joint venture commenced 1 March 2014, combining Boral’s gypsum manufacturing and distribution footprint in Asia and Australia with USG’s building products technologies and strategic assets in Asia, New Zealand and the Middle East.
Boral Gypsum reported equity accounted income of $49m for FY2015 representing Boral’s 50% share of the post-tax earnings of USG Boral. In the prior year Boral Gypsum reported an EBIT of $67m from 100% consolidated earnings of the gypsum business for the period to 28 February 2014, and $10m of equity income after the formation of the JV.
Underlying USG Boral resultThe underlying business delivered a strong and improved performance with increases in board volume and price together with a significant increase in adjacent (non-board) product sales driving margin expansion.
In addition, US$24m of restructuring and improvement initiatives in FY2015 helped to offset integration and inflationary cost impacts. Plant utilisation averaged 70% in FY2015.
Revenue Underlying revenue increased by 16% on the prior year to $1,268m, driven by board volume growth of 2%, an increase in non-board revenues and higher average prices in Australia, Korea and Indonesia.
The successful launch of the new higher strength, lighter weight Sheetrock® brand plasterboard products in Australia, Korea, Thailand, Indonesia and China is attracting a price premium above 5% and seeing adoption rates of up to 30% (in ceilings in Australia) less than a year after launch.
EBIT1 EBIT increased 38% to $141m with margin expansion in all key regions and strong results from Australia, Korea, Thailand and Indonesia.
Australia/NZ Revenue increased by 16% to $432m with strong EBIT growth. Board volumes were up 11% reflecting increased housing market activity, particularly in NSW and Victoria, and average selling prices were up 3%, supported by the introduction of new Sheetrock® products.
Asia Revenue increased by 16% to $836m reflecting strong price gains, including from Sheetrock® technology products, and significant growth in adjacent (non-board) sales.
DIVISIONAL PERFORMANCE
Boral Gypsum
External revenue
Australia 34%Thailand 15%
Indonesia 7%
Other 11%
Korea 21%China 12%
1. Excluding significant items.

Boral Limited Annual Report 2015 17
OutlookBoral USA should report a further increase in earnings in FY2016 on the back of increased housing activity. While the cost-out program undertaken in FY2015 will not be repeated, EBIT is expected to lift in line with forecasters’ projected increase to approximately 1.2 million housing starts in FY20162.
PerformanceRevenue Boral USA revenue increased by 12% on the prior year to US$695m, with strong growth in Cladding, Roofing and the Colorado Construction Materials business. Australian dollar revenue increased by 23% to A$839m.
The business benefited from increased US housing construction activity across all key geographic regions. While brick and stone intensity levels per housing start remain broadly steady, housing growth continues to be skewed towards multi-family activity with pent-up demand in the single-family segment constrained by financing, land and labour supply.
EBIT1
EBIT improved by US$40m to a US$5m profit with all businesses other than Bricks being profitable or close to break-even. The result was driven by:
• significant volume gains, particularly in Cultured Stone, Trim and Roofing;
• solid price gains in Trim, Roofing, Fly Ash and Construction Materials;
• improved production volume leverage; and
• US$20m in cost savings comprising SG&A savings and the previously announced US$12m of savings from the regional sales and manufacturing restructuring and consolidation activities undertaken in June 2014.
Cladding Revenue from the Cladding business, which includes Bricks, Cultured Stone and Trim, grew 16% to US$374m.
Bricks revenue increased by 13% to US$246m, driven by an 8% lift in volumes in line with the broader market, stronger commercial sales and a 1% rise in average selling prices, with strong pricing gains in some markets such as Texas. Distribution revenue from the sale of non-brick products also increased by 20%, particularly in Texas.
Cultured Stone broke through to profitability with a 17% increase in volumes, 1% higher average selling prices and operational cost savings. Sales of Versetta and the new second brand, ProStone, also contributed to the increase in revenue.
Brick and Cultured Stone increased plant utilisation by 3% each to 52% and 30% respectively, with inventories broadly unchanged.
Boral’s innovative Trim product rose strongly on the back of continued market penetration and geographical expansion with an increased number of dealer locations stocking the products. Volumes rose 58% and average selling prices were up 8% helped by the new siding product launched in 1Q FY2015, resulting in a close to break-even result for this small but growing business.
Roofing Revenue rose 14% to US$159m. Volumes increased 11% and average selling prices increased 5%. Higher cement input costs were offset by cost savings and operating leverage. Concrete roofing plant utilisation was 28%, up from 24% in the prior year.
Fly Ash and Construction Materials Combined revenue of US$162m was up 1% with both businesses increasing in profitability, despite fly ash volumes being impacted by industry supply constraints. Conditions in the construction materials market in Denver were favourable with increased volumes and strong price gains.
DIVISIONAL PERFORMANCE
Boral USA
External revenue
Cladding 54%
Roo�ng 23%
Fly Ash & ConstructionMaterial 23%
1. Excluding significant items.2. Analysts’ average (Dodge, Wells Fargo, NAR, NAHB, Fannie Mae, Freddie Mac, MBA)
between May & July 2015.

Boral Limited Annual Report 201518
SUSTAINABILITY OVERVIEW
Sustainability Overview
At Boral we strive to Build Something Great. For Boral’s people this means a safe, challenging and rewarding workplace. For our communities this means a socially responsible approach to all our activities.
Our peopleAt a glance FY2015 FY2014 FY2013
Boral employees, FTE 8,356 8,953 12,610
Boral contractors, FTE ~4,400 ~4,000 ~6,600
JV employees, FTE 3,676 3,498 570
JV contractors, FTE ~3,000 ~2,600 n/a
Average length of service
Australia 9.2 years 9.1 years 9.1 years
USA 7.8 years 7.5 years 7.7 years
Women in Boral 14% 14% 15%
Women on the Board 38% 25% 25%
Boral employed 8,356 full-time equivalent (FTE) employees and approximately 4,400 contractors across our global operations as at 30 June 2015. The reduction in employees and contractors over recent years primarily reflects our portfolio restructuring, including the transfer of Gypsum division employees to the USG Boral joint venture in FY2014 and the transfer of Australia’s east coast brick employees to the Boral CSR Bricks joint venture in FY2015. As at 30 June 2015, we had 3,676 FTE employees working in our joint venture operations and ~3,000 contractors.
The average length of service of a Boral employee in Australia is approximately 9.2 years, and in the USA is approximately 7.8 years, which remains broadly consistent with previous years. Overall, 13% of our workforce has been working for Boral for more than 20 years.
Although employee turnover in Australia increased from 15% in FY2014 to 18% in FY2015, and fell in the USA from 18% in FY2014 to 15% in FY2015, these turnover levels have normalised following extensive organisational and portfolio restructuring in FY2013. Employee turnover excludes the transfer of employees to the Boral CSR Bricks joint venture.
DiversityDiversity continues to be an important area of focus for Boral. Following the formation of Boral’s Diversity Council in FY2014, a detailed review of Boral’s diversity strategy was completed this year together and with an implementation plan to deliver long-term improved diversity outcomes across Boral. The plan includes a refreshed framework with six strategic elements of leadership, communication and education, system and process design, gender equality and pay equity, generational diversity and indigenous relations. The Board has set measurable objectives against these elements, with the Boral Diversity Council responsible for the implementation of key initiatives to deliver targeted outcomes.
In terms of gender diversity, Boral has a good representation of women at senior levels with three of eight (38%) Directors of the Board being women, and three positions on our Executive Committee management team of 13 (23%) held by women, namely the Chief Financial Officer, Group Communications & Investor Relations Director and Group Human Resources Director. Increasing the representation of women throughout Boral’s operations is an important objective. Women also occupy 13% of Boral’s management positions.
Women represent 14% of Boral’s employees at 30 June 2015, which is consistent with last year. The proportion of female employees varies significantly by occupation. Women occupy 69% of clerical positions, 33% of sales positions and 33% of professional positions. In contrast, men account for 95% of Boral’s trade, machinery operator and transport roles. There is a higher than average proportion of women than men amongst employees under the age of 50 and a lower than average proportion of women over the age of 50.
With a number of recruitment and retention strategies in place to increase Indigenous employment, we are proud of the continued high level of retention of Indigenous employees of over 90% across Boral’s Australian operations.
For more information on Diversity refer to pages 37-39.
0% 10% 20% 30%
60+
50-59
40-49
30-39
20-29
<20
Age pro�le of employees (years)
Male Female0% 20% 40% 60%
21+
16-20
11-15
6-10
0-5
Length of service of employees (years)
Male Female
0% 20% 40% 60%Operators & drivers
Technicians & trade
Clerical & admin
Sales
Professionals
Managers
Executives
Employees by occupation
Male Female

Boral Limited Annual Report 2015 19
People development and leadershipOur aim is to have an engaged workforce of employees with the skills and capabilities to develop their careers and perform their roles effectively.
Formal processes such as our talent and capability identification and assessment, development pathways and the performance review process help to provide a structured and supportive approach to employee development. The performance review process identifies and communicates performance expectations and establishes a plan to help employees reach their highest potential.
The Skilled4Action training program, developed in FY2014, continues to provide employees and managers with learning and capability building in areas such as safety, people engagement, the Boral Production System, sales and marketing excellence, and innovation. In FY2015, more than 200 employees completed Certificate II, III or IV or Diploma qualifications through Boral’s Australian Registered Training Organisation in disciplines such as Surface Extraction Operations, Civil Construction and Manufactured Mineral Products. Approximately 3% of Boral’s Australian workforce is currently enrolled to complete qualifications such as Diplomas, Certificate II, III or IV or certificates of attainment through the Registered Training Organisation. These programs supported by on-the-job and local initiatives help to ensure that our people have the skills to deliver our plans and objectives.
In FY2015, we delivered a range of leadership programs including the Future Leaders Program developed in partnership with the Australian Graduate School of Management. To further develop leaders with the capability to effectively engage our people and drive a performance culture, we have established programs to learn from experienced leaders through interaction and conversation, placements, mentoring and coaching. Boral’s Learn from Leaders series saw employees from across Boral participating in lunches with the CEO, the Board and key executives, as well as Diversity in Leadership Forums and safety interventions, which all provide learning opportunities and access to our senior leadership team.
Boral’s approach to leadership development is set out below:
Health, safety and environmentOur goal is Zero Harm to our people and the environment. While Boral’s performance continues to trend positively and compares well across industry benchmarks, our strategy and plans are based on further improving our performance towards that goal.
StrategyIn FY2014 we established a group strategy for managing health, safety and environment (HSE) to embed relevant activities within our operations in order to achieve our goal of Zero Harm.
Our strategy incorporates 20 improvement programs within five focus areas across the themes of people, systems, and products, plant and equipment. The five focus areas are:
1. Capable and confident leaders
2. Engaged, empowered and competent workforce
3. Fit-for-purpose systems
4. Sustainable solutions
5. Fit-for-purpose plant and equipment.
Considerable progress was made in implementing our strategy in FY2015. Consistent with Boral’s Fix, Execute, Transform program, our focus this year has been on delivering programs that will provide the essential foundation for more ambitious change programs from FY2016 and beyond.
A more engaged and empowered workplaceOur results from the McKinsey Organisational Health Survey show a substantial improvement across several key areas since our previous survey in 2013. Benchmarked against a global database of over 1,500 companies, employees from Boral’s Construction Materials & Cement division rated improvements in the areas of strategic direction, employee motivation, accountability, culture and climate, innovation and learning, and our external orientation. Overall, the division moved into the second quartile of all organisations surveyed with a score of 70/100 in 2015, up from being a third quartile organisation with a score of 59/100 in 2013. As a result, managers report that they know where to focus organisational efforts while employee-initiated turnover has decreased from 13% to 10%.

Boral Limited Annual Report 201520
SUSTAINABILITY OVERVIEW
A summary of our plan and our key achievements in FY2015 is set out below:
PEOPLE
Objective 1 – Capable and confident leaders• HSE stewardship• Skilled4Action
Leadership development activity underway with various initiatives deployed to cascade and embed Zero Harm within the business
Use of Skilled4Action training modules for front line managers in HSE related systems, including risk assessment, toolbox sessions and LEAN production
Objective 2 – Engaged, empowered and competent workforce
• Human error reduction• Manual handling interventions• Leveraging LEAN• Roles and responsibilities• Consequence management
Roll-out of human error reduction program, including development of in-house training resources across Boral Building Products (BBP) and some parts of Boral’s Construction Materials & Cement (CM&C)
HSE related roles and responsibilities clearly defined Continued focus on practical deployment of LEAN skills, including early
adoption of LEAN safety principles Safety Absolutes program launched across CM&C
SYSTEMS
Objective 3 – Fit-for-purpose systems
• Contractor safety• Learning management system• Serious harm prevention• Incident management system• 1Boral SMS review• Self insurance
Pilot of a contractor safety service completed in CM&C Roll-out of Boral’s new learning management system, My Learning Space,
commenced in Asphalt operations Serious harm prevention program commenced with enhanced reporting,
communication and review of controls for high risk activities New HSE incident management system implemented, with further
functionality to be added in FY2016 Comprehensive review of safety, health, environment and quality
management system Move to Retro Paid Loss workers compensation scheme in NSW and
upgrade of self insurance program in South Australia to meet new legislative requirements
PRODUCTS, PLANT AND EQUIPMENT
Objective 4 – Sustainable solutions
• Lifecycle analysis and environmental product disclosures
• Occupational health and hygiene• Chemical management
Comprehensive review of occupational health and hygiene systems and improved management of dust and noise exposures within CM&C
Working with customers and other stakeholders to reduce lifecycle impacts of Boral’s products eg. through the introduction of ENVISIA concrete
Objective 5 – Fit-for-purpose plant and equipment
• Energy efficiency• Driver safety• Plant and equipment procurement• Product Council support
Improved driver safety for our heavy vehicle fleet including vehicle stability systems, driver aids and improved driver training
Energy efficiency improvements targeted using LEAN principles

Boral Limited Annual Report 2015 21
Work health and safetyPerformanceOur safety performance measures continue to trend positively with some good safety outcomes delivered in Boral’s businesses in FY2015. Boral’s safety outcomes continue to compare well against industry benchmarks.
Boral has been fatality-free since December 2013 which is the longest fatality-free period since 2002. We are working hard to ensure that this continues.
Recordable Injury Frequency Rate (RIFR), which includes both Medical Treatment Injury Frequency Rate (MTIFR) and Lost Time Injury Frequency Rate (LTIFR) for employees and contractors per million hours worked, is Boral’s preferred indicator of safety performance. Separately reporting MTIFR and LTIFR is not always a clear or helpful indicator of injury severity and business impact.
During FY2015, our RIFR reduced from 13.6 in FY2014 to 12.1 on a like-for-like basis which is an improvement of 11%. Our LTIFR improved from 1.9 in FY2014 to 1.8 in FY2015, an improvement of 5%.
Employee and contractor injury rates
FY15FY14FY13FY12FY11FY10FY09FY08
3.2 2.0 2.2 2.0 1.8 1.9 1.9 1.8
23.0 21.8 20.5 19.4 17.2 15.5 11.7 10.3
26.223.8
22.721.4
19.017.4
13.6
LTIFR
RIF
R (I
njur
ies
per
milli
on h
ours
)
MTIFR
12.1
The safety performance outcomes for the majority of Boral’s divisions showed year-on-year improvement on the basis of recordable injury rates. Boral’s USA division reported a slight increase in RIFR for the year but remains well below the Group average and historical levels. The divisional results are set out below:
Recordable Injury Frequency Rate (RIFR) FY2015 FY2014 Improvement
Boral Construction Materials & Cement
18.7 21.5 13%
Boral USA 6.1 5.7 (7%)
Boral Building Products 16.4 18.8 13%
Boral Gypsum1 3.0 4.1 27%
Boral Corporate 0 0 –
Boral total1 12.1 13.6 11%
In addition to these lagging measures of safety performance, we monitor and record a number of other measures to help us understand our safety performance. These measures of performance are also trending positively:
• Percentage Hours Lost2, a measure of injury severity, has reduced to 0.03 in FY2015, a 40% improvement on the prior year and a 36% improvement over the average of the prior three years. An improvement in this measure indicates that when lost time injuries occur, they are less serious, or our return to work programs are more effective in helping our people recover, or both.
• The Hours Away on Restricted or Transfer (HART)2 rate is a broader measure of the impact of injuries. This measure also improved in FY2015, reducing by 20%, again showing that when injuries do occur, the impact to our people and the business is less severe.
• Near Miss (or Near Hit) events are those incidents which could, in slightly different circumstances, result in injury. The rate of reporting increased again across Boral in FY2015, which we regard as a positive trend reflecting greater maturity in our safety journey.
We are also increasingly monitoring leading indicators of safety including hazard reporting and corrective action management. We intend to increase reporting of these measures across our operations, on the back of upgrades to our HSE reporting systems.
While our long-term goal remains Zero Harm and we have an unwavering belief that all injuries are preventable, we remain focused on preventing events that result in or could result in fatalities or life-changing injuries. We are also focused on reducing the less serious injuries that predominantly drive our safety performance measures, for example sprains and strains, slips and trips and minor cuts and bruising.
Injury analysisInjury analysis assists in the development of corrective action plans, training and process redesign. In Australia, our systems allow us to analyse our injury experience in further detail for our fully owned businesses.
Of all injuries reported in FY2015, 9% required no treatment, 58% required first aid only, 29% required medical treatment without lost time, and 5% resulted in lost time.
Australian injury analysis
100%
80%
60%
40%
20%
0%Total Employees Contractors
Lost time injuryMedical treatment injuryFirst aid injuryNo treatment
1. Includes data from 100% owned Boral Gypsum through to 28 February 2014 and then data from the USG Boral joint venture from 1 March 2014.
2. For Boral’s fully owned businesses only.

Boral Limited Annual Report 201522
SUSTAINABILITY OVERVIEW
Boral’s safety performance stacks up wellBoral has around 6,200 employees and 4,300 contractors in Australia in our Construction Materials & Cement and Building Products divisions. And with a significant fleet of 3,000 Company-owned and contracted heavy vehicles transporting Boral products and materials, Boral is one of Australia’s largest transport managers.
Heavy vehicle transport comes with risks, but we are very good at managing those risks through engineering and compliance management. We train our people in the correct use of equipment and to be aware of behavioural triggers that contribute to critical errors and unsafe behaviour. We adopt new ideas from employees and contractors – ideas that help them and others to be safe. We work with suppliers, regulators, contractors and industry groups to innovate, share knowledge and implement the safest standards. And we have the support of the unions that represent our employees and contractors to deliver continuous improvements to our safety management systems.
However, statistically at least, transport is a relatively hazardous business. Since 2007, there have been four fatalities associated with Boral activities in Australia – all involving contractors in transport related accidents. Fortunately, there has not been a fatality in Boral’s operations in Australia or overseas since 2013, and while Boral’s long-term safety performance in relation to truck-related work fatalities is significantly less than the national average, this does not mean we have a perfect record in this area. It simply confirms our commitment to making our transport operations even safer and continuing to strive for Zero Harm across all of our workplaces.
Beyond transport, Boral pours concrete and lays asphalt across major projects and construction sites around the country. And with over 100 quarries and 400 manufacturing operations producing cement, concrete, asphalt, bricks, roof tiles, and timber products Boral’s safety performance can also be benchmarked with the construction and manufacturing sectors.
Latest figures published by Safe Work Australia show the average injury rate across the Construction industry in Australia to be 8.4 injuries1 for every million hours worked. This compares with Boral’s injury rate in Australia for FY2015, measured on the same basis, of 1.2. Boral’s safety performance stacks up well. The broader industries in which Boral operates experience lost time accidents seven to eight times more frequently than Boral’s employees and contractors.
10.7
Boral’s relative performance to Australian industryaverage lost time injuries1
9.48.4
5.0
1.2
10.1
Per
milli
on h
ours
Agric
ultu
reFo
rest
ryTr
ansp
ort,
Post
al,
War
ehou
sing
Man
ufac
turin
g
Con
stru
ctio
n
Min
ing
Bora
l Aus
tralia
The relative contribution of injuries in the ‘Other’ category rose. This category includes injury mechanisms that are unspecified such as muscular injuries developing over time rather than from a defined event. We continue to focus our efforts on accurate reporting to provide better clarity on these situations. In FY2015 we have also been able to capture potentially high consequence injuries due to falls from heights (3% of injuries) and vehicle accidents (2% of injuries).
This year, contractors were more likely to be hit by a moving object or sustain a fall on same level than employees, however were less likely to sustain a muscular stress injury or an injury in the other or unspecified/unknown category. These differences are likely to be a function of the activities undertaken by contractors. We continue to encourage consistent reporting of injuries between both employees and contractors but note that contractors appear to be less likely to let low severity injuries impair their work practices.
Mechanism of injury – describing the action, exposure or event that led to an injury
Other 31%
Vehicle accident 2%
Hit by movingobject 21%
Hit object withbody part 15%
Fall on samelevel 15%
Muscular stress 13%
Fall from height 3%
Our efforts in recent years to reduce the number of muscular-stress injuries arising from manual handling-related activities have been largely successful with injuries from muscular stress falling to 13% of reported injuries in FY2015 from 36% two years ago. Injuries from being hit by a moving object rose slightly while injuries from hitting an object fell slightly, and falls on the same level were unchanged from FY2014.
1. Based on Safe Work Australia’s definition of Lost Time Injury Frequency Rate using injuries that resulted in five or more days lost time from work. The latest industry data is provisional for the period FY2013. Boral data is for Australia only for comparative purposes for FY2015.
Source: Safe Work Australia data 2012-13

Boral Limited Annual Report 2015 23
Collaborating on game-changing technologiesBoral has signed an agreement with technology startup Mineral Carbonation International (MCi) to explore the early stages of commercialisation of an Australian-developed technology which aims to reduce carbon emissions by storing CO2 in solid products for the building industry.
This collaboration, involving Boral’s Innovation team, MCi’s researchers and chemical engineers from the University of Newcastle and Orica, will be conducted over an initial two year period. The project has the potential to reduce the cost of cement-based products and associated carbon emissions, opening the long-term possibility of carbon-neutral construction products.
– MCi is funded by the NSW and Federal Governments and Orica Ltd.
EnvironmentPolicyAs an international resources-based manufacturing company, we acknowledge that our shareholders, employees and the community at large expect responsible environmental practice by Boral’s businesses. We continually work to identify and minimise environmental risk at all our operations and, wherever practicable, eliminate adverse environmental impacts.
Specifically, Boral is committed to:
• complying with environmental legislation, regulations, standards and codes of practice relevant to the particular business as the absolute minimum requirement in each of the communities in which we operate;
• reducing greenhouse gas emissions from our processes, operations and facilities, including appropriate use of alternative fuels and/or carbon offsets;
• eliminating waste in all its forms, by application of LEAN manufacturing principles, leading to:
– efficient use of energy; – conservation of water; – minimisation and recycling of waste production
materials and energy; – prevention of pollution; and – effective use of virgin and recovered resources and
supplemental materials;• open, constructive engagement with communities
surrounding our operations; and• protecting biodiversity values at and around our facilities.
Through communication and training, our employees will be encouraged and assisted to enhance Boral’s environmental performance.
Greenhouse gas emissions and energy use
GHG emissions (million t CO2-e) FY2015 FY2014 FY2013 FY2012 FY2011
Australia 2.2 2.5 2.7 2.9 3.0
USA 0.2 0.2 0.2 0.2 0.2
Asia 0.2 0.5 0.5 0.4 0.4
Total 2.6 3.2 3.4 3.5 3.6
In FY2015, greenhouse gas (GHG) emissions from Boral’s fully owned businesses in Australia and the USA together with our 50% share of emissions from USG Boral totalled 2.6 million tonnes of carbon dioxide equivalent (CO2-e), which was 7% lower than in FY2014 on a like-for-like basis2. Emissions from Australian operations were down 10%, the US operations up 7%, and Asian operations up 2% on the prior year.
Boral’s overall energy use in FY2015 was 22 petajoules from businesses, down 5% on FY2014 on a like-for-like basis2. Australian operations energy consumption was down 9%, the US operations up 6%, and Asian operations up 1% on the prior year.
Changes in GHG emissions and energy consumption in FY2015 were driven largely by changes in Boral’s business portfolio and activity in various markets. For example, in FY2015 the specialty
1. FY2015 figures are Boral’s 50% share of emissions and energy from the USG Boral joint venture.2. Prior year figures are adjusted for Boral’s 50% share of USG Boral operations.
cement kiln at Maldon was closed and reductions in FY2014 reflect the ceasing of clinker manufacturing at the Waurn Ponds cement kiln in Victoria in the prior year.
We continue to look for ways to reduce emissions from our ongoing operations. In late 2014 Boral Cement was awarded a $4 million grant to install technology at its operations at Berrima, NSW to use waste derived fuels sourced from general waste streams in addition to black coal, which will result in an estimated 90,000 t CO2-e reduction in annual emissions when fully implemented in FY2016.
Boral’s Australian GHG emissions
Calcination 37%
Electricity 19%
Coal 19%
Natural gas 11%
Diesel & LiquidFuels 11%
Other 3%
Australian climate and carbon policyObligations under the carbon pricing scheme for FY2014 needed to be met in FY2015 despite the legislation being repealed by the Federal Government on 17 July 2014. In addition to the one million unit interim liability for FY2014 which was met in June 2014, a final FY2014 liability of 0.5 million carbon units for FY2014 was due in January 2015 and met by a mix of Carbon Credit Units generated from our Landfill operations (which Boral divested on 28 February 2015), carbon units issued to Boral as part of the Jobs and Competitiveness Program, and directly purchased and surrendered carbon units.
Boral is investigating the potential ways that we may access funds from the Federal Government’s Emissions Reduction Fund to apply towards improving the energy efficiency of our operations.
1

Boral Limited Annual Report 201524
SUSTAINABILITY OVERVIEW
Infringements
FY2015 FY2014 FY2013 FY2012 FY2011
Number 3 15 7 7 5
Fines $11,658 $38,849 $31,960 $10,750 $12,473
Undertakings $100,000
Following changes to the regulatory environment in FY2014, which saw an increase in infringement notices and penalties, our performance has substantially improved with fewer infringements in FY2015. This follows the successful roll-out of programs to improve our on the ground compliance as well as our interactions with regulators in Australia.
During FY2015, Boral incurred three penalties related to environmental contraventions in Australia and the USA resulting in $11,658 in fines. In Australia, we incurred penalties for exceeding stack emissions at an asphalt plant (self-reported) and for rubbish being displaced on a windy day at our Landfill operations in Melbourne. In the USA we incurred a fine for understating the volatiles content of a raw material (self-reported). There were no penalty infringements across our Asian operations.
In addition, at the time of publication, we were involved in a legal proceeding in relation to aggregate allegedly being washed into water courses at Narangba Quarry, Queensland, which has yet to be resolved.
Boral TimberBoral Timber is the largest customer of Forestry Corporation of NSW, with a substantial proportion of volumes supplied to Boral being valuable blackbutt timber. It is therefore critically important for Boral to work closely with the government to ensure sustainable harvesting of the north coast forests now and for the future.
Forestry Corporation of NSW is certified to meet the Australian Forestry Standard (AFS), an independently audited forest management standard. All products made by Boral Timber are also certified to the AFS Australian Chain of Custody standard, which traces Boral’s production back to its source of supply. This provides Boral’s customers with certainty that its products come from legal and sustainable sources.
Biodiversity and heritageBoral has a long history of protecting Australia’s biodiversity both directly as well as through our association with community partners with programs aimed at biodiversity, conservation and education, for example Conservation Volunteers Australia and Taronga Conservation Society.
Examples of our biodiversity projects in the communities in which we operate include:
• At our former Calsil Brick Works site at Kurnell NSW, rehabilitation efforts focused on the nationally endangered Green and Golden Bell Frog, and establishing vegetation consistent with the neighbouring endangered Kurnell Dune Forest.
• The ongoing supply of koala fodder from our plantations at our Narangba and Petrie quarries in Queensland which commenced in 2002.
• Supporting the Safehaven Wombat refuge facility at Mt Larcom, outside of Gladstone, Queensland. Safehaven has been able to expand its facility to include a breeding and research program for the critically endangered Northern Hairy-Nosed Wombat.
Community partnershipsBoral provides financial support to a range of community groups and organisations that share our values and where there is relevance to our people, places and products.
We partner with community organisations that can make a valued and sustained contribution to the communities in which we operate, focusing on building meaningful long-term relationships that deliver value to both Boral and our partners. In FY2015, Boral contributed approximately $820,000 of cash to its key community partnerships and other corporate community support initiatives. In addition, approximately $54,000 of materials in-kind support was provided to partners such as Habitat for Humanity, Conservation Volunteers Australia, Touched by Olivia and HomeAid to assist with their building projects.
In addition to our corporate community partnerships, Boral’s businesses and employees support local activities, including charities, emergency services, sporting and environmental groups.
As a matter of policy, the Group does not participate in or donate to any political or politically associated organisations.
Anzac Centenary Public FundAnzac Centenary commemoration events commenced across Australia in 2014 to coincide with the 100 year passing of the start of World War 1, and will continue through to 2018. Boral is supporting the Anzac Centenary Public Fund by providing cash donations for a range of significant initiatives and projects across the country associated with the Anzac Centenary, in addition to the donation of materials where appropriate.
Bangarra Dance TheatreBoral has sponsored Bangarra, one of Australia’s leading performing arts companies, since 2003. As Bangarra’s Production Partner, Boral employees, customers and suppliers
Rehabilitation of Kurnell Dune Forest helps the endangered Green and Golden Bell FrogThe NSW Department of Primary Industries has recognised the excellence of Boral’s site planning, together with the environmental benefits of sensitive landscaping and the creation of a thriving wetland at our former Calsil Brick Works site at Kurnell, NSW. The Department commented that “Boral’s investment in site rehabilitation and landscape strategies delivered an outstanding and visually striking environmental legacy that reflects well on the Company’s performance as a lessee of Crown land.” The regeneration of the wetland also helps support the re-establishment of the nationally endangered Green and Golden Bell Frog.

Boral Limited Annual Report 2015 25
attended Bangarra performances during the year, as well as a special performance for the second annual Corroboree Sydney and Bangarra’s 25th year celebrations, and a dance workshop at Bangarra’s Sydney Wharf studio for Boral families.
Boral’s sponsorship funding also contributed towards the employment and support of four trainee dancers at Bangarra during FY2015.
Conservation Volunteers Australia (CVA)Boral has partnered with CVA since 1988, making this our longest-standing community partnership. In FY2015 Boral and CVA launched the Connected Communities program, targeting 45 schools and communities relevant to Boral’s operational footprint across Australia. The program aims to assist in educating and inspiring youth to take action for the future of their environment, with the help of CVA volunteers. In FY2015 schools, local parks and reserves from every state and territory in Australia received assistance to undertake practical conservation and biodiversity projects through the partnership.
Habitat for HumanityBoral’s newest community partnership is with Habitat for Humanity Australia; a not-for-profit organisation which provides housing for families living in poverty. As the Building Community Resilience partner, we are supporting disaster resilience projects in the Quang Nam province in Vietnam and an urban slum upgrade in the Jogyakarta region in Indonesia.
Employee engagement is an important part of our partnership. During FY2015 more than 30 participants from USG Boral Vietnam helped build a home for a family in need. In Australia, Boral and USG Boral have donated in-kind building and construction materials to help build homes in regional Victoria and Western Australia.
HomeAidBoral has supported HomeAid, a not-for-profit provider of housing for homeless families and individuals in the USA, since 2006. In addition to annual cash donations, in FY2015 Boral donated goods and gifts for HomeAid Atlanta’s annual Essentials Drive for babies and Christmas Giving Tree for individuals in transitional housing.
Boral also donated in-kind materials for some of HomeAid’s housing and shelter projects this year, including bricks and mortar for the construction of a new apartment building and community centre for Rainbow Village, a transitional housing community for homeless families with children; and concrete roof tiles for the expansion of the William Fry Drop-in Center for homeless and at-risk youth.
Outward BoundThis is the fourth year that Boral has contributed to the Australian Outward Bound Development Fund to assist disadvantaged youth.
This year’s program was held in June 2015 with 21 Year 9 students from the Southern Highlands and Tablelands region of NSW attending a seven day leadership program and camp. Following the program, Boral staff will be mentoring the students to engage with community service projects.
RedkiteBoral has been a Supporting Partner of Redkite’s Financial Assistance Program, the most accessed area of support that the organisation provides, since 2012. Through this program, families of a child with cancer can meet day-to-day needs such as buying groceries, paying utility bills and ensuring that there is fuel in the car to take a child to treatment.
Boral’s support has assisted more than 187 families across Australia this year. In addition to the corporate donation, Boral employees have raised $64,000 in FY2015 through a range of fundraising actitives.
Taronga Conservation SocietyBoral has sponsored Taronga Zoo and Taronga Western Plains Zoo since 2003, and the Youth at the Zoo (YATZ) program since 2006. Approximately 1,200 teenagers have participated in the YATZ conservation and education program in that time.
As a Crown Partner of Taronga Zoo, Boral staff can benefit from free zoo entry and discounted tickets throughout the year. Boral families have logged more than 1,400 visits in FY2015, while more than 200 employees and their families attended the Family Day in October 2014.
Touched by Olivia FoundationBoral supports the Touched by Olivia Foundation to create vibrant playgrounds catering for children of varying abilities and ages. These assist children with special needs and their families to integrate more fully into the community. In FY2015, Boral’s support included in-kind materials donations for two inclusive playgrounds in Victoria: Livvi’s Place Casey, which will open to the public in September 2015, and Livvi’s Place Ballarat, scheduled to open in December 2015.
University of New South WalesIn FY2015 Boral contributed a cash donation to assist in building the new, state-of-the-art Materials Science and Engineering Building at the University of New South Wales.

Boral Limited Annual Report 201526
Executive Committee
Joseph GossDivisional Managing Director, Boral Construction Materials & Cement
David MarinerExecutive General Manager, Boral Building Products
Al BormPresident and CEO, Boral Industries Inc
Joined in 2013 from Lafarge North America and was previously with Schlumberger NV. Joe has experience in roles across Europe, the USA and Australasia and holds a PhD and a Masters of Science in Materials Science & Engineering.
Joined in 2010 and was previously Chief Operating Officer for the Boral USA Cladding Division. Prior to joining Boral, David held a variety of management roles with Holcim, Daimler Chrysler and Detroit Diesel. He has a Civil Engineering degree and an MBA.
Frederic de RougemontCEO, USG Boral
Joined in 2010 and was previously President, Boral Roofing USA. Prior to joining Boral, Al held roles with USG, Pioneer, Hanson Building Products and Oldcastle APG and worked across North America, Europe and Asia. He has a Bachelor of Science in Management and an MBA.
Joined in 2011 and was previously CEO of LBGA. Prior to joining Boral, Frederic held senior roles with Lafarge in South Africa and South Korea, as well as research roles in France and the USA. He has a PhD in Physical Sciences. Since 28 February 2014 on formation of USG Boral, Frederic has been employed by the USG Boral Building Products joint venture.
Damien SullivanGroup General Counsel
Rosaline NgChief Financial Officer
Joined in January 2006 and held senior roles in Boral’s Cement division. Ross has over 30 years’ experience with industrial process industries including the energy, pulp and paper and building material sectors. He holds a Doctorate in Chemistry and completed the Executive Management Programme at the University of Michigan, Ann Arbor.
Joined Boral in 2009 and was previously General Counsel, Australia. Damien has worked as a lawyer in private practice and in-house legal roles in Sydney, New York and Los Angeles. He has Law and Applied Science degrees.
Joined in 1995 and held senior finance roles in Boral’s Building Products division. Rosaline left in 2001 to work at Phoneware/Sirius Telecommunications before returning to Boral in 2002. Most recently she has overseen the finance function in the USA. Rosaline has a Bachelor of Commerce and is a member of Chartered Accountants Australia and New Zealand.
Matt CorenGroup Strategy and M&A Director
Joined in 2010 and was previously Boral’s Assistant Company Secretary. Prior to joining Boral, he held legal counsel and company secretary roles in Australia and Singapore and legal roles in London and Sydney. Dominic has a finance degree and a Master of Laws.
Joined in 2010 following a career in global investment banking. Matt focused on strategy in industrial sectors and M&A and capital markets transactions. He has degrees in commerce and law.
Michael WilsonGroup Health, Safety and Environment Director
With Boral from 1995 to 2010, then re-joined in 2012. Kylie has a background in production management and corporate affairs and investor relations. She has a Ceramic Engineering degree and an MBA.
Joined Boral in 2000 and previously held Group and divisional HR roles in Boral. Prior to joining Boral, Linda was with Pioneer International in HR roles covering Australia and Asia. She has a degree in Economics and Political Science and an MBA.
Kylie FitzGeraldGroup Communications & Investor Relations Director
Linda CoatesGroup Human Resources Director
Ross HarperExecutive General Manager, Boral Cement
Dominic MillgateCompany Secretary
Joined Boral in 2013. Michael has held senior roles overseeing the management and governance of safety, environment and quality in mining and industrial companies in Australia and the UK, as well as in the Australian Department of Defence and the Environment Department. Michael has an Applied Science degree and a Master of Environmental Engineering Science.
Mike KaneChief Executive Officer & Managing Director

Boral Limited Annual Report 2015 27
Board of Directors
Bob Every AONon-executive Chairman, Age 70
Dr Bob Every AO joined the Boral Board in September 2007 and became Chairman of Directors on 1 June 2010. Dr Every is also the Chairman of Wesfarmers Limited, a Director of O’Connell Street Associates Pty Limited, Harry Perkins Institute of Medical Research and UNSW Foundation Limited and a Patron of Redkite. During his executive career, Dr Every gained extensive experience internationally in manufacturing and distribution industries, he was Managing Director of Tubemakers of Australia and held senior executive positions with BHP Limited before becoming Managing Director and CEO of OneSteel Limited. He holds a science degree (honours), a doctorate of philosophy (metallurgy), an honorary doctorate of science from the University of New South Wales and in 2012, was appointed an Officer of the Order of Australia for his distinguished service to business and to educational, charitable and cultural organisations. On 20 May 2015, Boral announced that Dr Every will be stepping down from the Board at the conclusion of Boral’s 2015 AGM to be held on 5 November.
Dr Every is a member of the Audit & Risk Committee and Remuneration & Nomination Committee.
Brian ClarkNon-executive Director, Age 66
Dr Brian Clark joined the Boral Board in May 2007 and will become the Chairman of Directors at the conclusion of Boral’s 2015 AGM in November. Dr Clark has experience as an executive and director in Australasia, Japan, China, Italy, the UK and South Africa. He is currently a Director of AMP Limited and Chairman of AMP Capital Limited, and was previously on the Board of National Australia Bank and a member of the Merrill Lynch Australian Advisory Board. In South Africa, he was President of the Council for Scientific and Industrial Research (CSIR) and CEO of Telkom SA. He also spent 10 years with the UK’s Vodafone Group as CEO Vodafone Australia, CEO Vodafone Asia Pacific and Group Human Resources Director. He holds a doctorate in physics from
the University of Pretoria, South Africa and completed the Advanced Management Program at the Harvard Business School.
Dr Clark is Chairman of the Remuneration & Nomination Committee.
Catherine BrennerNon-executive Director, Age 44
Catherine Brenner joined the Boral Board in September 2010. Ms Brenner is a Director of AMP Limited, Coca-Cola Amatil Limited and SCEGGS Darlinghurst Limited, and a Trustee of the Sydney Opera House Trust. Ms Brenner is also Chairman of AMP Life Limited and the National Mutual Life Association of Australasia. She previously held directorships including Centennial Coal Company Limited and the Australian Brandenburg Orchestra, and was previously a member of the Takeovers Panel. She has extensive experience in corporate finance and capital markets, previously holding the position of Managing Director, Investment Banking of ABN AMRO Australia. She holds an MBA from the Australian Graduate School of Management and a Bachelor of Laws and Bachelor of Economics from Macquarie University.
Ms Brenner is a member of the Audit & Risk Committee and of the Remuneration & Nomination Committee.
Eileen DoyleNon-executive Director, Age 60
Dr Eileen Doyle joined the Boral Board in March 2010. Dr Doyle is a Director of GPT Group Limited and Bradken Limited. She is also a Director of a number of private companies and Government boards including being Deputy Chairman of CSIRO. She was previously a Director of OneSteel Limited and Ross Human Directions Limited and Chairman of Port Waratah Coal Services Limited. Her extensive executive and non-executive experience includes manufacturing and marketing in building and industrial materials throughout Australasia, Asia and North America. She holds a PhD in Applied Statistics from the University of Newcastle, is a Fulbright Scholar and has an Executive MBA from Columbia University Business School. She is
a Fellow of the Australian Institute of Company Directors.
Dr Doyle is Chairman of the Health, Safety & Environment Committee and a member of the Audit & Risk Committee.
Kathryn FaggNon-executive Director, Age 54
Kathryn Fagg joined the Boral Board in September 2014. Ms Fagg is a Board member of the Reserve Bank of Australia and a Director of Incitec Pivot Limited and Djerriwarrh Investments Limited. She is also the Chair of the Melbourne Recital Centre and a Director of Breast Cancer Network Australia. Ms Fagg is an experienced senior executive having worked across a range of industries in Australia and Asia, including logistics, manufacturing, resources, banking and professional services. She was previously President of Corporate Development with the Linfox Logistics Group and prior to that she held executive roles at BlueScope Steel and ANZ and consulted for McKinsey and Co. She holds a Master of Commerce in Organisation Behaviour from the University of New South Wales and a chemical engineering degree from the University of Queensland.
Ms Fagg is a member of the Remuneration & Nomination Committee and the Health, Safety & Environment Committee.
Mike KaneCEO & Managing Director, Age 64
Mike Kane joined the Boral Board in October 2012, when he was appointed CEO & Managing Director, after being President of Boral USA since February 2010. Mr Kane has extensive experience in the building and construction industry, including 24 years in senior executive roles with US Gypsum, Pioneer/Hanson Building Materials, Johns-Manville Corp and Holcim.
His experience spans a broad range of geographies across America, Europe and the Asia Pacific, and his portfolio of responsibilities has included cement, aggregate, concrete, plasterboard, bricks and roof tile businesses. Prior to joining Boral, he was CEO and Board Member of Calstar Products Inc, a Silicon Valley Clean Technology start-up reinventing exterior building materials for sustainable construction. He holds a Bachelor of Arts in Sociology from Southern Illinois University, a Juris Doctorate from DePaul University’s School of Law in Illinois and a Masters in Science from Creighton University, School of Law in Nebraska.
John Marlay Non-executive Director, Age 66
John Marlay joined the Boral Board in December 2009. Mr Marlay is the Chairman of Cardno Limited and a Director of Incitec Pivot Limited and Independent Chairman of Flinders Ports Holdings Pty Limited. He has senior executive experience in the global materials and cement industries as well as non-executive director experience in companies with significant North American business operations. Mr Marlay was the Chief Executive Officer and Managing Director of Alumina Limited from December 2002 until his retirement from that position in 2008. He has also held senior executive positions and directorships with Esso Australia Limited, James Hardie Industries Limited, Pioneer International Group Holdings and Hanson plc. He holds a science degree from the University of Queensland and a Graduate Diploma from the Australian Institute of Company Directors. He is a Fellow of the Australian Institute of Company Directors.
Mr Marlay is a member of the Remuneration & Nomination Committee and of the Health, Safety & Environment Committee.
Paul RaynerNon-executive Director, Age 61
Paul Rayner joined the Boral Board in 2008. Mr Rayner is the Chairman of Treasury Wine Estates Limited and a Director of Qantas Airways Limited and Chairman of its Remuneration Committee, and a Director of the Murdoch Childrens Research Institute. He was previously a Director of Centrica plc, a UK listed company. He brings to the Board extensive international experience in markets relevant to Boral including North America, Asia and Australia. He has worked in the fields of Finance, Corporate Transactions and General Management in consumer goods, manufacturing and resources industries. His last role as an Executive was Finance Director of British American Tobacco plc, based in London from January 2002 to 2008. He holds an Economics Degree from the University of Tasmania and a Masters of Administration from Monash University.
Mr Rayner is Chairman of the Audit & Risk Committee.
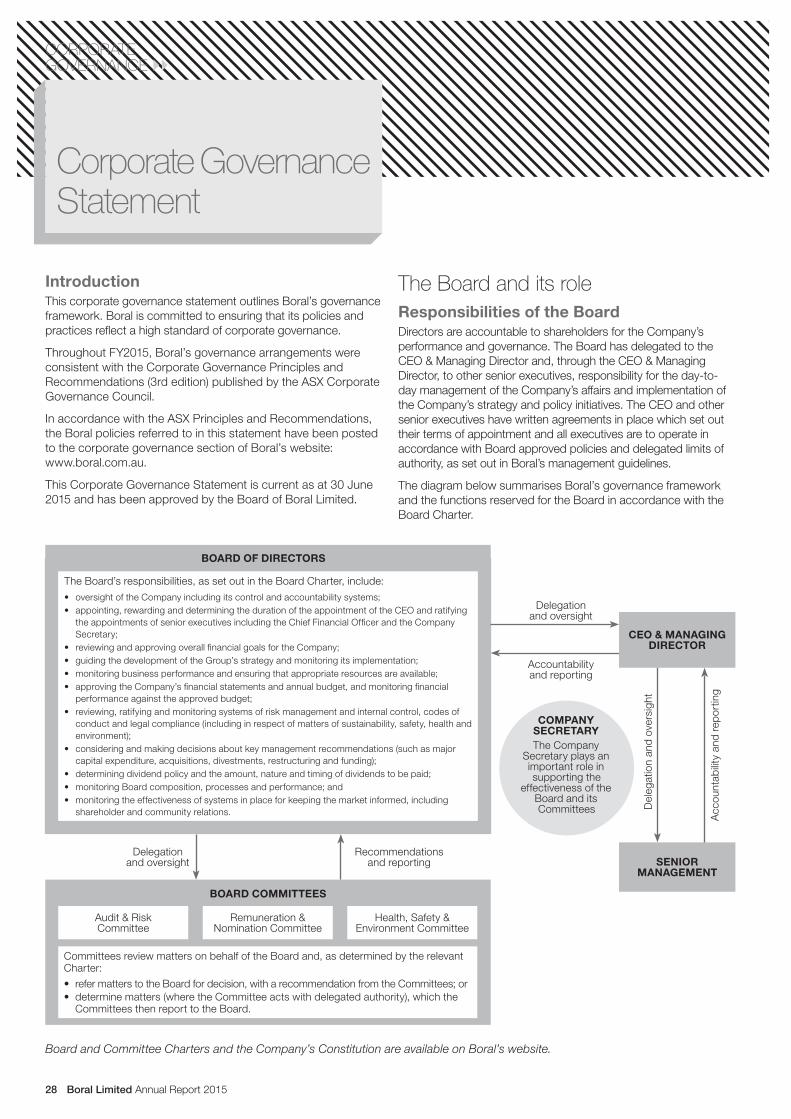
Boral Limited Annual Report 201528
CORPORATE GOVERNANCE
Corporate Governance Statement
The Board’s responsibilities, as set out in the Board Charter, include:
• oversight of the Company including its control and accountability systems;• appointing, rewarding and determining the duration of the appointment of the CEO and ratifying
the appointments of senior executives including the Chief Financial Officer and the Company Secretary;
• reviewing and approving overall financial goals for the Company;• guiding the development of the Group’s strategy and monitoring its implementation;• monitoring business performance and ensuring that appropriate resources are available;• approving the Company’s financial statements and annual budget, and monitoring financial
performance against the approved budget;• reviewing, ratifying and monitoring systems of risk management and internal control, codes of
conduct and legal compliance (including in respect of matters of sustainability, safety, health and environment);
• considering and making decisions about key management recommendations (such as major capital expenditure, acquisitions, divestments, restructuring and funding);
• determining dividend policy and the amount, nature and timing of dividends to be paid;• monitoring Board composition, processes and performance; and• monitoring the effectiveness of systems in place for keeping the market informed, including
shareholder and community relations.
The Board and its role Responsibilities of the BoardDirectors are accountable to shareholders for the Company’s performance and governance. The Board has delegated to the CEO & Managing Director and, through the CEO & Managing Director, to other senior executives, responsibility for the day-to-day management of the Company’s affairs and implementation of the Company’s strategy and policy initiatives. The CEO and other senior executives have written agreements in place which set out their terms of appointment and all executives are to operate in accordance with Board approved policies and delegated limits of authority, as set out in Boral’s management guidelines.
The diagram below summarises Boral’s governance framework and the functions reserved for the Board in accordance with the Board Charter.
IntroductionThis corporate governance statement outlines Boral’s governance framework. Boral is committed to ensuring that its policies and practices reflect a high standard of corporate governance.
Throughout FY2015, Boral’s governance arrangements were consistent with the Corporate Governance Principles and Recommendations (3rd edition) published by the ASX Corporate Governance Council.
In accordance with the ASX Principles and Recommendations, the Boral policies referred to in this statement have been posted to the corporate governance section of Boral’s website: www.boral.com.au.
This Corporate Governance Statement is current as at 30 June 2015 and has been approved by the Board of Boral Limited.
BOARD COMMITTEES
BOARD OF DIRECTORS
Audit & RiskCommittee
Remuneration & Nomination Committee
SENIOR MANAGEMENT
Health, Safety & Environment Committee
Committees review matters on behalf of the Board and, as determined by the relevant Charter:
• refer matters to the Board for decision, with a recommendation from the Committees; or• determine matters (where the Committee acts with delegated authority), which the
Committees then report to the Board.
Delegation and oversight
Delegation and oversight
Recommendations and reporting
Accountability and reporting
Acc
ount
abili
ty a
nd r
epor
ting
Del
egat
ion
and
over
sigh
t
COMPANY SECRETARYThe Company
Secretary plays an important role in supporting the
effectiveness of the Board and its Committees
CEO & MANAGING DIRECTOR
Board and Committee Charters and the Company’s Constitution are available on Boral’s website.

Boral Limited Annual Report 2015 29
Non-executive Directors spend at least 35 days each year (considerably more in the case of the Chairman) on Board business and activities, including Board and Committee meetings, meetings with senior management to discuss in detail the strategic direction of the Company’s businesses, visits to operations and meeting employees, customers, business associates and other stakeholders.
During the year, the Board visited operations at a number of sites, including Boral’s concrete operations at Chevron’s Wheatstone LNG Facility in Western Australia and various sites in Queensland. Health, Safety & Environment Committee members also visited Boral’s transport and logistics site at Prestons, New South Wales.
Composition of the BoardMembershipThe accompanying diagram illustrates the current composition of the Board.
Boral’s Constitution provides that there will be a minimum of three Directors and a maximum of 12 Directors on the Board.
The Board of Directors comprises seven non-executive Directors (including the Chairman) and one executive Director, being the CEO & Managing Director.
The roles of Chairman and CEO & Managing Director are not exercised by the same individual.
Chairman’s appointment and responsibilitiesThe Board selects the Chairman from the non-executive independent Directors. The Chairman leads the Board and is responsible for the efficient organisation and effective function of the Board. He ensures that Directors have the opportunity to contribute to Board deliberations. The Chairman regularly communicates with the CEO & Managing Director to review key issues and performance trends. He also represents the Company in the wider community.
Mike KaneCEO & Managing Director
Chairman
Cha
irman
Ele
ct
Catherine Brenner
Paul R
ayner
Eileen DoyleJohn Marlay
Kath
ryn
Fagg
Bria
n C
lark
Bob Every
Independent N
on-ex
ecu
tiv
e D
ire
cto
rs
Executive
BoardComposition

Boral Limited Annual Report 201530
CORPORATE GOVERNANCE
Each of these areas is currently well represented on the Board. The Board benefits from the combination of Directors’ individual skills, experience and expertise in particular areas, as well as the varying perspectives and insights that arise from the interaction of Directors with diverse backgrounds.
The Board skills matrix was utilised in the Company’s appointment of Ms Kathryn Fagg in September 2014, and as part of the Board’s orderly succession planning process with Dr Bob Every planning to step down from the Board at the conclusion of Boral’s 2015 Annual General Meeting.
The skills, experience and expertise of each Director are set out on page 27 of the Annual Report.
Director independenceThe Board has assessed the independence of each of the non-executive Directors (including the Chairman) in light of their interests, positions, associations and relationships and considers each of them to be independent. The criteria considered in assessing the independence of non-executive Directors include that the Director:
• is not a substantial shareholder of the Company or an officer of, or otherwise associated directly with, a substantial shareholder;
• is not employed, or has not previously been employed in an executive capacity by a Boral company or, if the Director has been previously employed in an executive capacity, there has been a period of at least three years between ceasing such employment and serving on the Board;
• has not within the last three years been a partner, director or senior employee of a provider of material professional services to a Boral company;
• has not been within the last three years, in a material business relationships (ie. as a supplier or customer) with a Boral company, or an officer of or otherwise associated with someone with such a relationship;
• has no material contractual relationship with a Boral company other than as a Director;
• does not have close family ties with any person who falls within any of the categories described above; or
• has not been a director of Boral for such a period that his or her independence may have been compromised.
It is considered that none of the interests of Directors (or the interests of persons with whom Directors have close family ties) with other firms or companies having a business relationship with Boral could materially interfere with the ability of those Directors to act in Boral’s best interests. Material in the context of Director independence is, generally speaking, regarded as being 5% of the revenue of the supplier, customer or other entity being attributable to the association with a Boral company or companies.
Accordingly, all of the non-executive Directors (including the Chairman) are considered independent.
Skills and diversity of the BoardMatters relating to Board and Board Committee composition are considered by the Remuneration & Nomination Committee in accordance with the framework set out in the Remuneration & Nomination Committee Charter and through processes implemented by the Board.
The Board actively seeks to ensure that it has an appropriate mix of diversity (including gender diversity), skills, experience and expertise to enable it to discharge its responsibilities effectively and to be well equipped to assist our Company to navigate the range of opportunities and challenges we face.
Diversity includes differences that relate to gender, age and cultural background, as well as differences in background and life experience, communication styles, interpersonal skills, education, functional expertise and problem solving skills.
To assist in identifying areas of focus and maintaining an appropriate and diverse mix in its membership, the Board utilises a skills matrix which is reviewed by the Board on a regular basis. It is an important, but not the only, basis of criteria applying to Board appointments.
The Board skills matrix sets out the mix of skills, experience and expertise that the Board currently has and is looking to achieve in its membership. It supports the Company’s overarching strategy to “Fix, Execute and Transform” the business, as well as other areas of relevance to the composition of the Board. The areas addressed in the matrix are as follows:
Board skills matrix – skills and experience across the Board as a whole support
Boral’s strategy to “Fix, Execute and Transform”
Element Skills
Leadership Executive Leadership
Health, Safety & Environment
Portfolio Strategy / M&A
Financial acumen
Risk management
Global experience
Market and customer knowledge
Innovation
Change and transition
Information technology
People Organisational sustainability
Remuneration and rewards
Governance Governance and regulation
Board experience

Boral Limited Annual Report 2015 31
TenureUnder Boral’s Constitution, and as required by the ASX Listing Rules, a Director must not hold office (without re-election) past the longer of the third Annual General Meeting and three years following that Director’s last election or appointment. Retiring Directors are eligible for re-election. When a vacancy is filled by the Board during a year, the new Director must stand for election at the next Annual General Meeting. The requirements relating to retirement from office do not apply to the Managing Director of the Company.
The length of service of each current Director is set out on page 27 in the Annual Report, and shows that the Board is well served with an appropriate and diverse mix of tenure.
The Board does not regard nominations for re-election as being automatic but rather as being based on the individual performance of Directors and the needs of the Company. Before the business to be conducted at the Annual General Meeting is finalised, the Board discusses the performance of Directors standing for re-election in the absence of those Directors. Each Director’s suitability for re-election is considered on a case-by-case basis, having regard to individual performance. Tenure is just one of the many factors that the Board takes into account when assessing the independence and ongoing contribution of a Director.
The Board has determined that as a general rule, the Chairman must retire from that position at the expiration of 10 years in that role unless the Board decides otherwise. Dr Every will be stepping down from the Board as Chairman and Dr Clark will succeed Dr Every at the conclusion of Boral’s 2015 AGM.
InductionManagement, with the Board, provides an orientation program for new Directors. The program includes discussions with executives and management, the provision to the new Director of materials such as the Strategic Plan, the Code of Business Conduct and the Share Trading Policy, site visits to some of Boral’s key operations and discussions with other Directors.
In FY2015 the induction process for new non-executive Directors was refreshed and modernised. The new process provides non-executive Directors with greater exposure to the Company’s strategy and operations and its governance arrangements before joining the Board.
The Company also offers ongoing opportunities for Directors to continue to develop their professional skills.

Boral Limited Annual Report 201532
CORPORATE GOVERNANCE
Succession planningBoard succession planning, and the progressive and orderly renewal of Board membership, are an important part of the governance process. The Board’s policy for the selection, appointment and re-appointment of Directors is to ensure that the Board possesses an appropriate range of skills, experience and expertise to enable the Board to carry out its responsibilities most effectively. The Board is also committed to maintaining gender diversity in its membership. Currently three of the seven non-executive Directors on the Boral Board are women. As part of the appointment process, Directors consider Board renewal and succession plans and whether the Board is of a size and composition that is conducive to making appropriate decisions.
The non-executive Directors meet on a regular basis without management present in a forum intended to allow for open discussion, including in relation to Board and management performance.
Process Explanation
Board review • The appointment of Directors follows a process during which the full Board (with the assistance of external search consultants) assesses the necessary and desirable competencies of potential candidates and considers a number of candidates before deciding on the most suitable candidate for appointment.
• The selection process includes obtaining background checks on candidates and assistance from an external consultant, where appropriate, to identify and assess suitable candidates. Background checks are conducted before appointing a Director and putting forward to shareholders a candidate.
• Candidates identified as being suitable are interviewed by a number of Directors. Confirmation is sought from prospective Directors that they would have sufficient time to fulfil their duties as a Director.
Remuneration & Nomination Committee recommendation
• The Remuneration & Nomination Committee has responsibility for making recommendations to the Board on matters such as succession plans for the Board, suitable candidates for appointment to the Board, Board induction and Board evaluation procedures.
Appointment • At the time of appointment of a new non-executive Director, the key terms and conditions relative to that person’s appointment, the Board’s responsibilities and the Company’s expectations of a Director are set out in a letter of appointment. All current Directors have been provided with a letter confirming their terms of appointment.
Shareholder communications • When candidates are submitted to shareholders for election or re-election, the Company includes in the notice of meeting all information in its possession that is material to the decision whether to elect or re-elect the candidate.
Conflicts of interestIn accordance with Boral’s Constitution and the Corporations Act 2001 (Cth) (Corporations Act), Directors are required to declare the nature of any interest they have in business to be dealt with by the Board. Except as permitted by the Corporations Act, Directors with a material personal interest in a matter being considered by the Board may not be present when the matter is being considered and may not vote on the matter.
Access to information, independent advice and indemnificationAfter consultation with the Chairman, Directors may seek independent professional advice, in furtherance of their duties, at the Company’s expense. Directors also have access to members of senior management at any time to request relevant information.
The Company Secretary, who is accountable to the Board through the Chairman, provides advice and support to the Board and is responsible for all matters to do with the proper functioning of the Board.
Under the Company’s Constitution and agreements with Directors and to the extent permitted by law, the Company indemnifies Directors and executive officers against liabilities to third parties incurred in their capacity as officers of the Company and against certain legal costs incurred in defending an action for such a liability.

Boral Limited Annual Report 2015 33
Board CommitteesThe qualifications and experience of each Committee member are set out on page 27 of the Annual Report. Details of the number of Committee meetings Directors attended during the reporting period are set out on page 44 in the Directors’ Report.
Audit & Risk CommitteeComposition and roleBoral has an Audit & Risk Committee which assists the effective operation of the Board. In December 2014, the Audit Committee was renamed the Audit & Risk Committee to better reflect its continuing responsibility for overseeing risk. The Audit & Risk Committee comprises only independent non-executive Directors. Its members are:
Paul Rayner (Chairman)
Eileen Doyle
Catherine Brenner
Bob Every
The Committee met four times during FY2015.
The Audit & Risk Committee has a formal Charter which sets out its role and responsibilities, composition, structure and membership requirements. Its responsibilities include review and oversight of:
• the financial information provided to shareholders and the public;
• the integrity and quality of Boral’s financial statements and disclosures;
• the systems and processes that the Board and management have established to identify and manage areas of significant risk; and
• Boral’s auditing, accounting and financial reporting processes.
The Committee has the necessary power and resources to meet its responsibilities under its Charter, including rights of access to management and auditors (internal and external) and to seek explanations and additional information.
Accounting and financial control policies and procedures have been established and are monitored by the Committee to ensure that the financial reports and other records are accurate and reliable. Any new accounting policies are reviewed by the Committee. Compliance with these procedures and policies and limits of authority delegated by the Board to management are subject to review by the external and internal auditors.
When considering the yearly and half yearly financial reports, the Audit & Risk Committee reviews the carrying value of assets, provisions and other accounting issues. Questionnaires completed by divisional management are reviewed by the Committee half yearly.
Both the external and internal auditors attend each scheduled meeting of the Committee and report to the Committee as appropriate on the outcome of their audits and the quality of controls throughout Boral. As part of its agenda, the Audit & Risk Committee meets with the external and internal auditors, in the absence of the CEO & Managing Director and the Chief Financial Officer, at least twice during the year.
The Chairman of the Audit & Risk Committee reports to the full Board after Committee Meetings. Minutes of Meetings of the Audit & Risk Committee are included in the papers for the next full Board Meeting after each Committee Meeting.
Responsibilities in relation to the internal and external auditBoral’s external auditor is KPMG. At least annually, as occurred in FY2015, the Audit & Risk Committee reviews the scope of the external audit and evaluates the quality of the performance, the effectiveness and the independence of the external auditor.
If circumstances arise where it becomes necessary to replace the external auditor, the Audit & Risk Committee will formalise a process for the selection and appointment of a new auditor and recommend to the Board the external auditor to be appointed to fill the vacancy.
The Audit & Risk Committee monitors procedures to ensure the rotation of external audit engagement partners every five years as required by the Corporations Act.
The Audit & Risk Committee has approved a process for the monitoring and reporting of non-audit work to be undertaken by the external auditor. The type of services of the external auditor which are prohibited because they have the potential, or appear, to impair independence include the participation in activities normally undertaken by management, being remunerated on a “success fee” basis and where the external auditor would be required to review their work as part of the audit.
The Independence Declaration by the external auditor is set out on page 47. The Committee’s role in relation to the internal audit function is discussed on page 36.

Boral Limited Annual Report 201534
CORPORATE GOVERNANCE
Remuneration & Nomination CommitteeComposition and roleThe Board has a Remuneration & Nomination Committee which comprises five independent non-executive Directors.
The members of the Committee are:
Brian Clark (Chairman)
Bob Every
John Marlay
Catherine Brenner
Kathryn Fagg
The Committee met on four occasions during FY2015.
The Remuneration & Nomination Committee has a formal Charter which sets out its role and responsibilities, composition, structure and membership requirements.
The Committee makes recommendations to the full Board on remuneration arrangements for the CEO & Managing Director and senior executives and, as appropriate, on other aspects arising from its functions.
Part of the role of the Remuneration & Nomination Committee is to advise the Board on the remuneration policies and practices for Boral generally and the remuneration arrangements for senior executives. In 2014 the Remuneration & Nomination Committee oversaw the search for a new independent non-executive Director by an external service provider. The Remuneration & Nomination Committee recommended the final candidate to the Board for approval, which resulted in the appointment of Kathryn Fagg, who was elected by shareholders at Boral’s Annual General Meeting in 2014.
Health, Safety & Environment Committee Composition and roleThe Board has a Health, Safety & Environment Committee which comprises three independent non-executive Directors.
The members of the Committee are:
Eileen Doyle (Chairman)
John Marlay
Kathryn Fagg
The Committee met on three occasions during FY2015.
The Committee’s responsibilities include the review and monitoring of:
• the Group’s strategy for health, safety and environment (HSE) and management’s plans to improve HSE performance;
• the effectiveness of the Group’s policies, systems and governance structure for identifying and managing HSE risks which are material to the Group;
• the policies and systems within the Group for ensuring compliance with applicable legal and regulatory requirements associated with HSE matters;
• the performance of the Group, assessed by reference to agreed targets and measures, in relation to HSE matters, including the impact on employees, third parties and the reputation of the Group;
• the output of the Group’s audit performance in relation to HSE matters;
• the adequacy of the Group’s systems for reporting actual or potential accidents, breaches and significant incidents, and review of investigations and remedial actions in respect of any significant incident; and
• the Group’s reports which are prepared and lodged in compliance with its statutory obligations concerning the environment.

Boral Limited Annual Report 2015 35
Performance evaluation and remunerationPerformance evaluation processThe following table explains the Company’s performance evaluation processes for the Board, Committees, individual Directors and senior executives.
Board, Committees and Directors CEO & Managing Director Senior executives
The Board undertakes an evaluation of the performance of the Board, its Committees, individual Directors and the Chairman at least annually.
Periodically this review is undertaken with the assistance of an external facilitator. The evaluation encompasses a review of the structure and operation of the Board, the skills and characteristics required by the Board to maximise its effectiveness and whether the blending of skills, experience and expertise and the Board’s practices and procedures are appropriate for the present and future needs of the Company.
Steps involved in the evaluation include the completion of a questionnaire by each Director, review of responses to the questionnaire at a Board Meeting and a private discussion between the Chairman and each other Director.
On an annual basis, the Remuneration & Nomination Committee and subsequently the Board formally review the performance of the CEO & Managing Director. The criteria assessed are both qualitative and quantitative and include profit performance, other financial measures, safety performance and strategic actions.
Further details on the assessment criteria for CEO & Managing Director and senior executive remuneration (including equity-based plans) are set out in the Remuneration Report which forms part of the Annual Report.
The CEO & Managing Director annually reviews the performance of each of Boral’s senior executives, being members of the Executive Committee, using criteria consistent with those used for reviewing the CEO & Managing Director.
The performance of senior executives is reviewed annually against appropriate measures as part of Boral’s performance management system, which is in place for all managers and staff. The system includes processes for the setting of objectives and the annual assessment of performance against objectives and workplace style and effectiveness.
The CEO & Managing Director reports to the Board through the Remuneration & Nomination Committee on the outcome of those reviews.
An evaluation of the performance of the Board, its Committees and individual Directors took place in FY2015 in accordance with the process described above.
An evaluation of the performance of the CEO & Managing Director took place in FY2015 in accordance with the process described above.
An evaluation of the performance of senior executives of Boral took place in FY2015 in accordance with the process described above.
Remuneration Remuneration of non-executive DirectorsThe remuneration of the non-executive Directors is fixed. The non-executive Directors do not receive any options, at risk remuneration or other performance related incentives. Nor are there any schemes for retirement benefits for non-executive Directors.
The remuneration arrangements for non-executive Directors are distinct from the arrangements for senior executives.
Remuneration of senior executives Boral’s remuneration policy and practices for senior executives, including the CEO & Managing Director, are designed to attract, motivate and retain high quality people. The policy is built around principles that:
• executive rewards be competitive in the markets in which Boral operates;
• executive remuneration has an appropriate balance of fixed and at risk reward;
• remuneration be linked to Boral’s performance and the creation of shareholder value;
• at risk remuneration for executives has both short- and long-term components; and
• a significant proportion of executive reward be dependent upon performance assessed against key business measures.
These principles ensure that the level and composition of remuneration is sufficient and reasonable and that its relationship to corporate and individual performance is defined.
Further information relating to the remuneration of the non-executive Directors and senior executives is set out in the Remuneration Report on page 48.

Boral Limited Annual Report 201536
CORPORATE GOVERNANCE
Boral policies and risk frameworkRisk identification and management The Board (through the Audit & Risk Committee) is responsible for satisfying itself that a sound system of risk oversight and management exists and that internal controls are effective. In particular, the Board seeks assurance that:
• the principal strategic, operational, financial reporting and compliance risks are identified; and
• systems are in place to assess, manage, monitor and report on these risks.
The managers of Boral’s businesses are responsible for identifying and managing risks. Under supervision of the Board, management is responsible for designing and implementing risk management and internal control systems to manage the Company’s material business risks. This comprises the identification of core strategic, operational, financial and compliance risks, and encompasses the assessment, monitoring and mitigation of identified risks.
On a twice yearly basis, the Group Audit and Risk Manager facilitates a formal bottom-up, organisation-wide risk management process with the business. Outcomes are shared with the Audit & Risk Committee and management, which also receive presentations by senior divisional management on a regular basis. The process is governed centrally through Boral’s risk management framework and directed by policies and procedures within functional areas such as Treasury, Health, Safety and Environment, Human Resources and Learning, Group Legal and Finance.
Boral’s senior management has reported to the Board (through the Audit & Risk Committee) on the effectiveness of the management of the material business risks faced by Boral during FY2015. The Audit & Risk Committee has reviewed the risk management framework and is satisfied that it continues to be sound.
Boral’s Risk Management Policy is available on Boral’s website.
Internal auditThe internal audit function is carried out by Group Audit and Risk, which provides independent and objective assurance to management and the Board on the effectiveness of Boral’s internal control, risk management and governance systems and processes. The function is led by the Group Audit and Risk Manager who oversees the execution of the internal audit plan as approved by the Audit & Risk Committee. The Group Audit and Risk Manager has a reporting line to the Chief Financial Officer as well as to the Audit & Risk Committee.
The function comprises a dedicated in-house team of qualified professionals based in Australia, Asia and the USA, with targeted support as required from external specialists. The internal audit function is independent of management and has full access to all Boral entities, records and personnel.
The internal audit plan is formulated using a risk-based approach to align audit activity with the key risks of Boral. Internal audit activity and outcomes are reported to the Audit & Risk Committee on at least a quarterly basis.
Business and sustainability risksDetails regarding our approach to managing business and sustainability risks are contained in the OFR (pages 2 to 17 of the Annual Report), Sustainability Overview (pages 18 to 25 of the Annual Report) and the risks section of the Annual Report at pages 10 to 11 and 41 to 42. These explain the Company’s exposure to economic, environmental and social sustainability risks and how that exposure is managed.
Chief Executive Officer and Chief Financial Officer declarationThe CEO & Managing Director and the Chief Financial Officer give a declaration to the Board, before the Board resolves that the Directors’ Declaration accompanying the full year and half year financial statements be signed, that in their opinion, the Company’s financial records have been properly maintained and the financial reports comply with the appropriate accounting standards and give a true and fair view of the financial position and performance of the Company, and that their opinion has been formed on the basis of a sound system of risk management and internal control which is operating effectively.
The CEO & Managing Director and the Chief Financial Officer gave this declaration to the Directors for the full year ended 30 June 2015 and the half year ended 31 December 2014.
Compliance with laws and policiesThe Company has adopted policies to monitor compliance with occupational health, safety, environment, competition and consumer laws.
There are also procedures providing employees with alternative means to usual management communication lines through which to raise concerns relating to suspected illegal or unethical conduct. The Company believes that whistleblowing can be an appropriate means to protect Boral and individuals and to ensure that operations and businesses are conducted within the law.
There are ongoing programs for the audit of the large number of Boral operating sites. Occupational health and safety, environmental and other risks are covered by these audits. Boral also has staff to monitor and advise on workplace health and safety and environmental issues and, in addition, education programs provide training and information on regulatory issues.

Boral Limited Annual Report 2015 37
Diversity at Boral Diversity at Boral is led by the CEO & Managing Director, with the support of the Board overseeing the strategy and plan initiatives and progress on diversity objectives.
Management, supported and assisted by the Boral Diversity Council, is responsible for implementing initiatives throughout the businesses to achieve the Group’s diversity objectives, and more generally to reinforce Boral’s commitment to fostering an inclusive and supportive workplace in accordance with the principles outlined in the Diversity Policy.
Boral is committed to fostering an inclusive workplace which embraces diversity and recognises that a diverse workplace can:
• produce better business outcomes by leveraging the unique experiences of people with diverse backgrounds; and
• improve employee engagement and retention by fostering a culture that promotes personal achievement and is based on fair and equitable treatment of all employees, irrespective of their individual backgrounds.
We believe that a diverse workforce is fundamental to implementing the strategy for the growth and success of the business.
Diversity at Boral is underpinned by the following principles:
• recruiting and promoting on merit;
• remunerating on a non-discriminatory basis;
• ensuring that development activities are available to all on a non-discriminatory basis; and
• striving to increase the proportion of women in the organisation, particularly in executive and senior management roles.
Diversity – Measurable objectives for FY2015Boral’s diversity plan has six strategic elements against which the Board has set measurable objectives for FY2015, as outlined below:
Strategic Element and Objective Status Key Outcomes
1 Leadership
1.1 Leadership Engagement: engage senior leaders to take carriage of deploying diversity communication, education
Completed • Leadership accountabilities for diversity strategy, plan, objectives and guiding principles adopted and communicated.
2 Communication & Education
2.1 Communication: develop communications engagement framework and packages to raise knowledge and understanding of diversity
Completed • Communication plan and materials finalised and adopted, including branding and education materials.
In progress • Improving employee access to information on the diversity strategy, status of plan and Diversity Council, including how to participate in diversity programs.
2.2 Education: develop diversity educational framework to provide management with capability to lead and manage diversity and diverse teams
Completed • Framework established with programs for diversity and unconscious bias developed for deployment.
Ongoing • Increase the representation of women in leadership development programs with a target of 20% in the next intake and up to 25% in subsequent intakes.
• 13% of Future Leader program participants in FY2015 were women in operational leadership roles.
2.3 Networking: establish Women in Leadership Forum series to provide networking opportunities for key leaders, with an emphasis on women leaders, across Boral
Completed • Women in Leadership Forum series established with 43 participants; 93% of participants were women in leadership roles.
• Forums provide opportunities for women leaders to develop networks, discuss gender issues in leadership and consult with key leaders on issues of gender and diversity in their businesses. Forum series is sponsored by the CEO & Managing Director and is chaired by the Chair of the Diversity Council.
Ongoing • The forum series is an ongoing initiative with two forums scheduled for each financial year with a target of 90% of the 30 participants being females in leadership roles.

Boral Limited Annual Report 201538
CORPORATE GOVERNANCE
Strategic Element and Objective Status Key Outcomes
2.4 Track and Report: develop key performance indicators to measure, track and report on change and progress
Completed • Reporting and analysis of workforce by gender, pay levels, selection, retention and promotion trends communicated to executive teams.
• Results from analysis incorporated into diversity planning and program development.
2.5 Benchmark: adopt external metric to measure and benchmark effectiveness of diversity strategy
Completed • Benchmarking against ASX Women on Boards Traffic Light Index higher ranking companies with opportunities for improvement identified and included in plan.
In progress • Long-term partnership with Diversity Council of Australia leveraged to identify best practice and benchmark the effectiveness of Boral’s diversity strategy and plan against external organisations.
3 System and Process Design
3.1 Search and Selection: embed diversity principles in standardised recruitment
Completed • Executive Recruitment Strategy adopted with guiding principles for identification, selection and placement of people in key executive positions to increase representation of women in leadership roles.
• In FY2015, 40% of new hires in senior management and executive roles were women and 65% of Boral’s intake of graduates were women working in disciplines such as engineering, materials sciences and business.
4 Gender Equality and Equity
4.1 Analysis: complete an analysis of Boral pay equity at least annually to monitor pay rates and identify issues
Completed • Annual gender remuneration gap analysis completed for the last three financial years.
• Pay equity improving overall in FY2015.
5 Generational Diversity
5.1 Investigate: work/life needs of different generations to understand needs to develop programs to lift capability of managers to effectively lead multi-generational teams
In progress • An investigation into work/life needs of different generations is underway.
6 Indigenous Relations
6.1 Indigenous Employment: through Indigenous Employment strategy increase the representation of Indigenous employees in Boral’s workforce
Completed • Integration of Indigenous employment strategy into national recruitment to increase opportunities for identification, selection and placement of Indigenous employees.
• 32% of Indigenous employment since FY2013 is through the national recruitment process, with the balance through the FY2011 Indigenous Relations and Employment Plan.
Diversity – Measurable objectives for FY2015 (continued)

Boral Limited Annual Report 2015 39
Proportion of female and male employees at BoralThe table below is a detailed representation of women and men working in Boral1 as at 30 June 2015:
Female Male
Role Number Percentage Number Percentage
Board 3 38% 5 62%
Executive Management2
31 15% 178 85%
Middle Management3
61 12% 462 88%
Other Roles 1,088 14% 6,838 86%
Total 1,180 14% 7,478 86%
1. Includes all full time, part time and casual employees of Boral, its wholly owned subsidiaries, excluding employees in joint ventures and contractors.
2. Executive management includes leadership positions three reporting levels from the CEO & Managing Director.
3. Middle management includes management and leadership positions four and more reporting levels from the CEO & Managing Director, excluding supervisor and team leader positions.
4. Other Roles includes key functional support roles such as finance, legal, human resources, technical, support services and front line employees.
In accordance with the requirements of the Workplace Gender Equality Act 2012 (Cth), Boral submitted its Workplace Gender Equality Public Report with the Workplace Gender Equality Agency. The Report can be viewed at www.wgea.gov.au.
Boral’s Diversity Policy is available on Boral’s website.
For more information regarding People and Diversity see the Sustainability Overview at pages 18 to 19.
Conduct and ethicsThe Board’s policy is that Boral companies and employees must observe both the letter and spirit of the law, and adhere to high standards of business conduct and comply with best practice. As part of Boral’s commitment to continually promoting ethical and responsible decision making, the Group rolled out its new Code of Business Conduct in July 2014.
Boral’s management guidelines include the new Code of Business Conduct and other guidelines and policies which set out legal and ethical standards for employees. As part of performance management, employees are assessed against the Boral values of excellence, integrity, collaboration and endurance.
The new Code and related guidelines and policies guide the Directors, the CEO & Managing Director, the Chief Financial Officer, the Company Secretary and other key executives as to the practices necessary to maintain confidence in the Company’s integrity and as to the responsibility and accountability of individuals for reporting, and investigating reports of, unethical practices. The new Code also guides compliance with legal and other obligations to stakeholders.
Boral’s Code of Business Conduct is available on Boral’s website.
Dealings in Boral shares Under Boral’s Share Trading Policy, trading in Boral shares by Directors, senior executives and other designated employees and their close associates is restricted to the following trading windows:
• the 30 day period commencing at 10.00am (Sydney time) on the day after the release of Boral’s half year results announcement to the ASX;
• the 30 day period commencing at 10.00am (Sydney time) on the day after the release of Boral’s full year results;
• the 30 day period commencing at 10.00am (Sydney time) on the day after the Annual General Meeting; and
• any additional period designated by the Board (or its delegate) from time to time (for example, during a period of enhanced disclosure).
The Policy precludes executives from entering into any hedge or derivative transactions relating to options or share rights granted to them as long-term incentives, regardless of whether or not the options or share rights have vested.
Breaches of the Policy are treated seriously and may lead to disciplinary action being taken against the executive, including dismissal.
Trading in Boral shares at any time is of course subject to the overriding prohibition on trading while in possession of inside information.
Boral’s Share Trading Policy is available on Boral’s website.
Directors’ shareholdingsUnder Boral’s Constitution, Directors must hold a minimum of 1,000 ordinary shares in the Company.
To align the interests of non-executive Directors with the interests of our shareholders, the Board established minimum shareholding guidelines which encourage non-executive Directors to accumulate over time a holding of ordinary shares in the Company equivalent in approximate value to the gross annual base fee paid to each non-executive Director.
Under the guidelines, the minimum shareholding may be held directly or indirectly by a Director, and may be accumulated over a period of up to five years from the later of 1 July 2014 or the date of appointment.
Progress is monitored on an ongoing basis and Boral’s non-executive Directors are continuing to track well against these guidelines.
The timeframe to allow Directors to build their minimum shareholding is a necessary reflection of the fact that Directors are very limited in the opportunities they have to acquire shares, given their exposure to price sensitive information from time to time regarding the Company.
Details of Directors’ shareholdings in the Company are set out on page 45 of this Annual Report.
Boral Limited Annual Report 201540
CORPORATE GOVERNANCE
Continuous disclosureThe Company appreciates the importance of timely and adequate disclosure to the market. It is committed to making timely and balanced disclosure of all material matters and maintaining effective communication with its shareholders and investors so as to give them ready access to balanced and understandable information.
The Company has in place mechanisms designed to ensure compliance with all relevant disclosure laws and ASX Listing Rule requirements under the Continuous Disclosure Policy adopted by the Board. These mechanisms also ensure accountability at a senior executive level for that compliance.
The CEO & Managing Director, the Chief Financial Officer and the Company Secretary are responsible for determining whether or not information is required to be disclosed to the ASX.
Boral’s Continuous Disclosure Policy is available on Boral’s website.
Communications with shareholdersThe Company’s policy is to promote effective two-way communication with shareholders and other investors so that they understand Boral’s business, governance, financial performance and prospects, as well as how to assess relevant information about Boral and its corporate activities.
Annual reporting Shareholders may elect to receive annual reports electronically or to receive notifications via email when reports are available online. Hard copy annual reports are provided to those shareholders who elect to receive them. While companies are not required to send annual reports to shareholders other than those who have elected to receive them, any shareholder who has not made an election is sent an easy-to-read summary of the Annual Report, called the Boral Review.
Company announcements All formal reporting and Company announcements made to the ASX are published on Boral’s website after confirmation of lodgment has been received from the ASX. These documents are also available for download by mobile devices from Boral’s Investor Relations (IR) App, which is available for no cost from the App Store or Google Play. Furthermore, Boral has an email list of investors, analysts and other interested parties who are sent relevant announcements via email alert after those announcements have been lodged with the ASX. Announcements are also sent to major media outlets and newswire services for broader dissemination.
General Meetings Boral encourages shareholders to attend and participate in all general meetings including annual general meetings. Shareholders are entitled to ask questions about the management of the Company and of the auditor as to its conduct of the audit and preparation of its reports.
Notices of Meeting are accompanied by explanatory notes to provide shareholders with information to enable them to decide whether to attend and how to vote upon the business of the meeting. Full copies of Notices of Meeting and explanatory notes are posted on Boral’s website. If shareholders are unable to attend general meetings, they may vote by appointing a proxy using the form attached to the Notice of Meeting or an online facility.
Annual General Meeting Shareholders are invited, at the time of receiving the Notice of Meeting, to put forward questions that they would like addressed at the Annual General Meeting.
At the Annual General Meeting, shareholders have a reasonable opportunity to ask the external auditor questions in relation to the conduct of the audit, the preparation and content of the Auditor’s Report, the accounting policies adopted by the Company in relation to the preparation of the financial statements of the Company, and the independence of the external auditor in relation to the conduct of the audit.
Investor relations To encourage two-way communication, the Company’s dedicated investor relations team and share registry can be contacted directly by shareholders by telephone or electronically via email. The links to these contacts are available on the Boral website at www.boral.com.au.
Boral’s policy on Communications with Shareholders is available on Boral’s website.
ConclusionWhile the Board is satisfied with its level of compliance with governance requirements, it recognises that practices and procedures can always be improved. Accordingly, the corporate governance framework of the Company will be kept under review to take account of changing standards and regulations.

Boral Limited Annual Report 2015 41
DIRECTORS’ REPORT
Directors’ Report
While the Company continues to meet its obligations in respect of continuous disclosure, we have not included information where it would be likely to result in unreasonable prejudice to Boral. This includes information that is commercially sensitive, is confidential or could give a third party a commercial advantage (for example, details of our internal budgets and forecasts).
RisksThe achievement of Boral’s future prospects may be adversely impacted by several risks, some of which are beyond our control. An overview of the material business risks facing the Group and our approach to managing those risks is set out below.
Additional information regarding Boral’s material business risks is included in the OFR. The Group’s broader risk identification and management framework is also set out in the Corporate Governance Statement on pages 28 to 40 of the Annual Report.
Industry and market risks
As Boral operates mainly in residential, non-residential and infrastructure construction markets, its financial performance is closely tied to the performance of those markets. The housing, industrial, commercial and infrastructure construction markets are cyclical and affected by various factors beyond the Group’s control, including:
• the performance of national economies in the countries in which Boral operates;
• monetary policies in the countries in which Boral operates (such as a change in interest rates);
• the allocation of government funding for public infrastructure and other building programs;
• the level of demand for construction materials and services generally; and
• the availability of labour, raw materials and transport services, as well as the price and availability of fuel and energy.
To manage the above risks, we have implemented key initiatives to reduce costs, improve operating efficiencies and encourage sustainable performance within the Group. These initiatives include the implementation of organisational restructuring and the allocation of capital expenditure to those businesses with the potential to deliver strong earnings growth. Boral also actively manages short-term fluctuations in fuel and energy costs through the use of hedging instruments and electricity demand management.
The Directors of Boral Limited (“Company”) report on the consolidated entity, being the Company and its controlled entities (“Group” or “Boral”), for the financial year ended 30 June 2015:
(1) Review and results of operationsInformation on the operations and financial position of Boral is set out in our operating and financial review (OFR), which comprises the Chairman’s Review, Chief Executive’s Review, the Financial Review and Divisional Performance on pages 2 to 17 of the Annual Report accompanying the Directors’ Report.
(2) State of affairsThe following significant changes in Boral’s state of affairs occurred during the year:
• The Group reported a net profit after tax of $257m after recognising a net significant gain of $8m as detailed in Note 4 to the financial statements.
(3) Principal activities and changesBoral’s principal activities are the manufacture and supply of building and construction materials in Australia, the USA and Asia. There were no significant changes in the nature of those activities during the year.
(4) Events after end of financial yearThere are no matters or circumstances that have arisen since the end of the year that have significantly affected, or may significantly affect:
(a) Boral’s operations in future financial years; or
(b) the results of those operations in future financial years; or(c) Boral’s state of affairs in future financial years.
(5) Likely developments, business strategies, prospects and risksLikely developments, business strategies and prospects The OFR refers to likely developments in Boral’s operations in future financial years and the expected results of those operations. Other than the information set out in the OFR, information regarding other likely future developments in Boral’s operations and the expected results of those operations has not been included in the Directors’ Report.
The OFR sets out information on Boral’s business strategies and prospects for future financial years. This information has been provided to enable shareholders to make an informed assessment of our business strategies and future prospects.

Boral Limited Annual Report 201542
DIRECTORS’ REPORT
Competition risks
Boral operates in competitive markets, against domestic suppliers and in some cases imported product suppliers. The competitive environment can be significantly affected by local market forces, such as new market entrants, production capacity utilisation, economic conditions and product demand. Such competition may lead to product price volatility risk. Boral has in place various strategies to manage these risks, including seeking to sustain and improve margins by reducing costs, optimising capacity in line with projected demand, and increasing the size and share of our higher margin businesses. We are also exploring options for future technology innovation in order to diversify our product range and develop new products in our core markets.
Health, safety and environment risks
Boral is subject to a broad range of health, safety and environmental laws, regulations and standards in the jurisdictions in which it operates, which could give rise to losses and liabilities. Due to the operating scale of the construction and building materials industry, there is a risk of incidents occurring that may cause injury to Boral’s staff or contractors, or damage to the environment. Any such events may result in additional costs and fines, and may adversely affect Boral’s reputation.
To manage these risks, Boral applies strict operating standards, policies, procedures and training to ensure compliance with all applicable health, safety and environmental laws. We are focused on achieving better safety outcomes across the Group as part of our broader strategy to deliver world-class safety performance. The Group also has established reserves for known environmental liabilities, including quarry remediation. Further details regarding our approach to managing health, safety and environment risks are contained in the OFR and in the Sustainability Overview on pages 18 to 25 of the Annual Report.
Business interruption risks
Due to the high fixed-cost nature of the construction and building materials industry, interruptions in production capabilities and lower capacity utilisation at key manufacturing and processing facilities may have a material adverse effect on the productivity and results of the Group’s operations. The Group’s manufacturing processes and related services are dependent upon critical plant, which may occasionally be out of service or damaged as a result of unanticipated failures, incidents or force majeure events. Furthermore, from time to time, there may be shortages of raw material which are critical to Boral’s ability to manufacture certain products and to meet market demand, as a result of force majeure type events.
To mitigate against potential losses from such risks, Boral has instigated a comprehensive risk management program which actively manages and mitigates risks from a Group through to local site operating level through both management intervention and business continuity planning. Boral also covers certain major risk exposures through its comprehensive Group insurance program, which provides cover for damage to facilities and associated business interruption, as well as product performance.
Foreign exchange risks
Boral has significant operations in Australia, the USA and Asia and is also dependent on imported products and supply of plant and equipment. The Group is therefore exposed to the macro-economic conditions in those regions and to movements in various foreign currencies (in particular, to movements in the Australian and US dollar exchange rates). As part of its approach to managing these risks, Boral’s US net assets are closely matched with its US dollar debt in order to hedge against fluctuations in the US dollar. The Group also utilises forward exchange contracts for material product and equipment supply in order to manage against short- to medium-term currency fluctuations.
(6) Environmental performanceDetails of Boral’s performance in relation to environmental regulation are set out under “Environment” on pages 19 to 24 of the Annual Report.
(7) Other informationOther than information in the Annual Report, there is no information that shareholders of the Company would reasonably require to make an informed assessment of:
(a) the operations of Boral; and
(b) the financial position of Boral; and(c) Boral’s business strategies and its prospects for future
financial years.
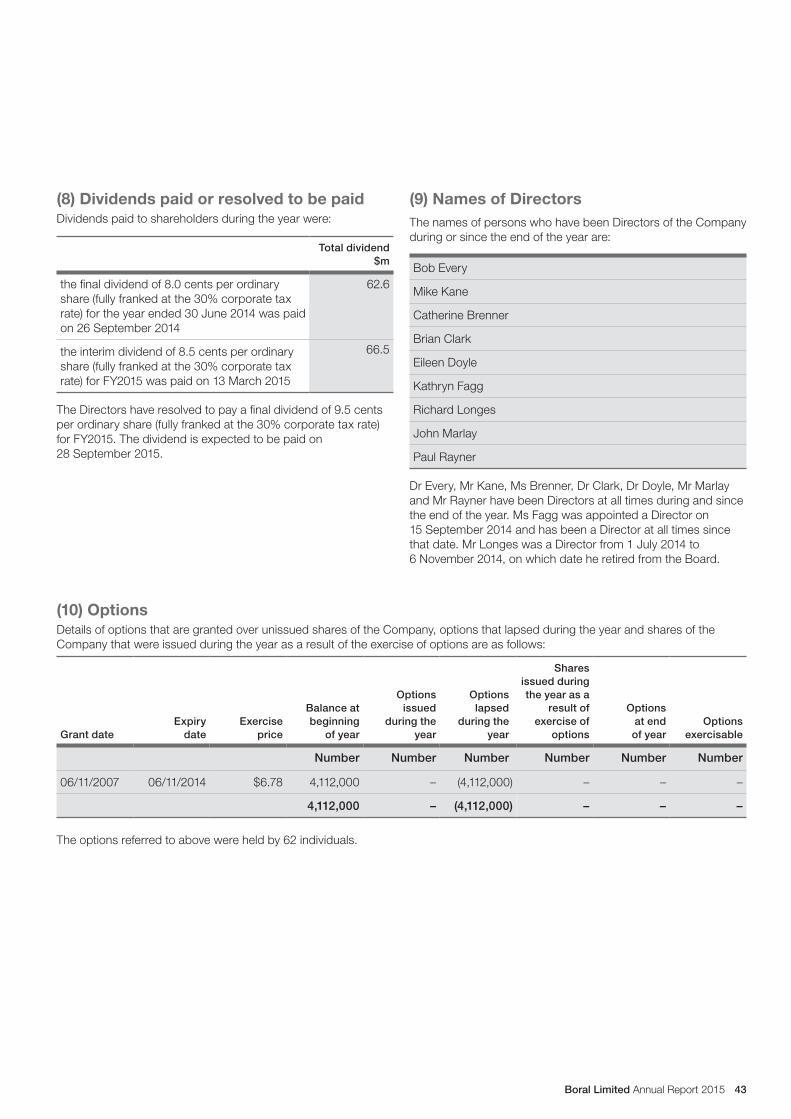
Boral Limited Annual Report 2015 43
(8) Dividends paid or resolved to be paid Dividends paid to shareholders during the year were:
Total dividend $m
the final dividend of 8.0 cents per ordinary share (fully franked at the 30% corporate tax rate) for the year ended 30 June 2014 was paid on 26 September 2014
62.6
the interim dividend of 8.5 cents per ordinary share (fully franked at the 30% corporate tax rate) for FY2015 was paid on 13 March 2015
66.5
The Directors have resolved to pay a final dividend of 9.5 cents per ordinary share (fully franked at the 30% corporate tax rate) for FY2015. The dividend is expected to be paid on 28 September 2015.
(9) Names of DirectorsThe names of persons who have been Directors of the Company during or since the end of the year are:
Bob Every
Mike Kane
Catherine Brenner
Brian Clark
Eileen Doyle
Kathryn Fagg
Richard Longes
John Marlay
Paul Rayner
Dr Every, Mr Kane, Ms Brenner, Dr Clark, Dr Doyle, Mr Marlay and Mr Rayner have been Directors at all times during and since the end of the year. Ms Fagg was appointed a Director on 15 September 2014 and has been a Director at all times since that date. Mr Longes was a Director from 1 July 2014 to 6 November 2014, on which date he retired from the Board.
(10) OptionsDetails of options that are granted over unissued shares of the Company, options that lapsed during the year and shares of the Company that were issued during the year as a result of the exercise of options are as follows:
Grant dateExpiry
dateExercise
price
Balance at beginning
of year
Options issued
during the year
Options lapsed
during the year
Shares issued during the year as a
result of exercise of
options
Options at end of year
Options exercisable
Number Number Number Number Number Number
06/11/2007 06/11/2014 $6.78 4,112,000 – (4,112,000) – – –
4,112,000 – (4,112,000) – – –
The options referred to above were held by 62 individuals.

Boral Limited Annual Report 201544
DIRECTORS’ REPORT
(11) Indemnities and insurance for officers and auditorsDuring or since the end of the year, Boral has not given any indemnity to a current or former officer or auditor against a liability or made any agreement under which an officer or auditor may be given any indemnity of the kind covered by subsection 199A(2) or (3) of the Corporations Act 2001 (Cth) (Corporations Act).
During the year, Boral paid premiums in respect of Directors’ and Officers’ Liability and Legal Expenses insurance contracts for the year ended 30 June 2015 and since the end of the year, Boral has paid, or agreed to pay, premiums in respect of such contracts for the year ending 30 June 2016. The insurance contracts insure against certain liability (subject to exclusions) in respect of persons who are or have been Directors or officers of the Company and its controlled entities. A condition of the contracts is that the nature of the liability indemnified and the premium payable not be disclosed.
(12) Directors’ qualifications, experience and special responsibilities and directorships of other listed companies in the last three financial yearsEach Director’s qualifications, experience and special responsibilities are set out on page 27 of the Annual Report.
Details for each Director of all directorships of other listed companies held at any time in the three years before the end of the financial year (in the case of Richard Longes, as at the date on which he ceased to be a Director) and the period for which such directorships have been held are:
Bob EveryWesfarmers Limited from February 2006 (current)
Mike KaneNo other directorships to be disclosed
Catherine BrennerCoca-Cola Amatil Limited from April 2008 (current)AMP Limited from June 2010 (current)
Brian ClarkAMP Limited from January 2008 (current)
Eileen DoyleGPT Group Limited from March 2010 (current)Bradken Limited from July 2011 (current)
Kathryn FaggIncitec Pivot Limited from April 2014 (current)Djerriwarrh Investments Limited from May 2014 (current)
Richard LongesAustbrokers Holdings Limited from November 2005 (current)Metcash Limited from April 2005 to August 2012
John MarlayIncitec Pivot Limited from December 2006 (current) Cardno Limited from November 2011 (current) Alesco Corporation Limited from November 2011 to December 2012
Paul RaynerQantas Airways Limited from July 2008 (current) Treasury Wine Estates Limited from May 2011 (current) Centrica plc from September 2004 to 31 December 2014
(13) Meetings of Directors The number of Meetings of the Board of Directors and each Board Committee held during the year and each Director’s attendance at those Meetings are set out below:
Board of Directors
Audit & Risk Committee
Remuneration & Nomination
Committee
Health, Safety & Environment
Committee
Meetings held while a
DirectorMeetings attended
Meetings held while a member
Meetings attended
Meetings held while a member
Meetings attended
Meetings held while a member
Meetings attended
Catherine Brenner 10 10 4 4 4 4 – –
Brian Clark 10 10 – – 4 4 – –
Eileen Doyle 10 10 4 4 – – 3 3
Bob Every 10 10 4 4 4 4 1 1
Kathryn Fagg 8 8 – – 3 3 2 2
Mike Kane 10 10 – – – – – –
Richard Longes 4 4 1 1 – – – –
John Marlay 10 10 – – 4 4 3 3
Paul Rayner 10 10 4 4 – – – –
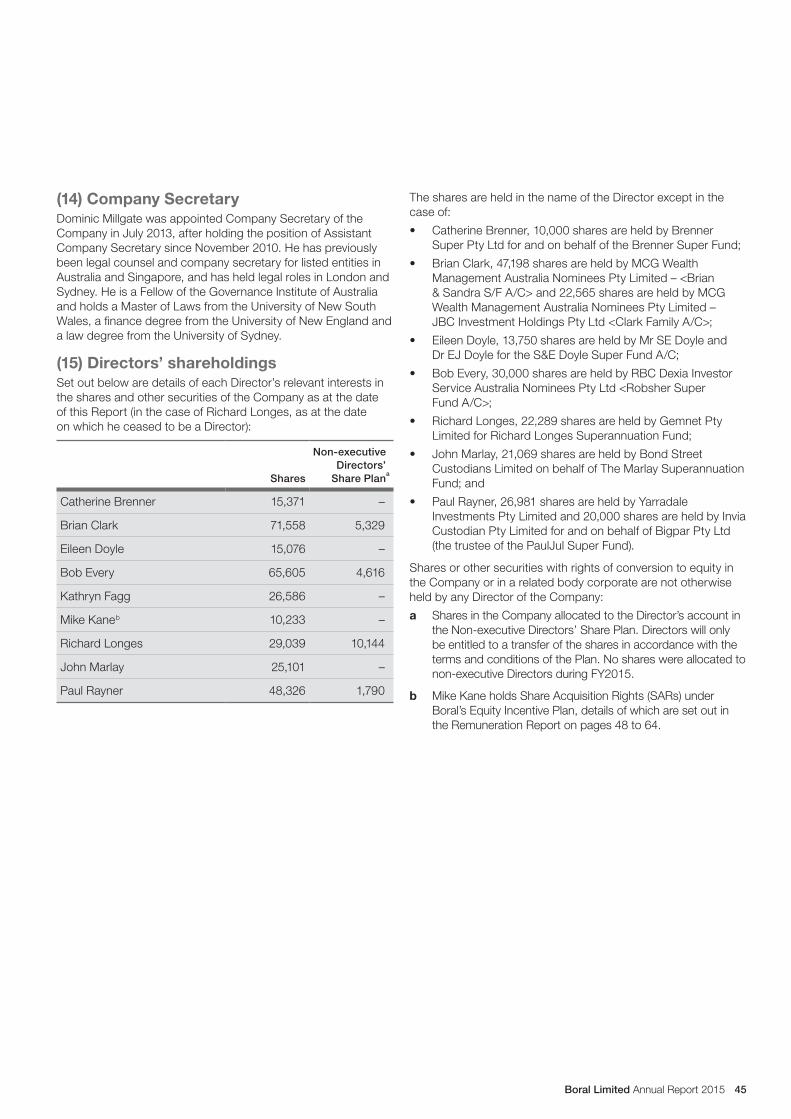
Boral Limited Annual Report 2015 45
The shares are held in the name of the Director except in the case of:
• Catherine Brenner, 10,000 shares are held by Brenner Super Pty Ltd for and on behalf of the Brenner Super Fund;
• Brian Clark, 47,198 shares are held by MCG Wealth Management Australia Nominees Pty Limited – <Brian & Sandra S/F A/C> and 22,565 shares are held by MCG Wealth Management Australia Nominees Pty Limited – JBC Investment Holdings Pty Ltd <Clark Family A/C>;
• Eileen Doyle, 13,750 shares are held by Mr SE Doyle and Dr EJ Doyle for the S&E Doyle Super Fund A/C;
• Bob Every, 30,000 shares are held by RBC Dexia Investor Service Australia Nominees Pty Ltd <Robsher Super Fund A/C>;
• Richard Longes, 22,289 shares are held by Gemnet Pty Limited for Richard Longes Superannuation Fund;
• John Marlay, 21,069 shares are held by Bond Street Custodians Limited on behalf of The Marlay Superannuation Fund; and
• Paul Rayner, 26,981 shares are held by Yarradale Investments Pty Limited and 20,000 shares are held by Invia Custodian Pty Limited for and on behalf of Bigpar Pty Ltd (the trustee of the PaulJul Super Fund).
Shares or other securities with rights of conversion to equity in the Company or in a related body corporate are not otherwise held by any Director of the Company:
a Shares in the Company allocated to the Director’s account in the Non-executive Directors’ Share Plan. Directors will only be entitled to a transfer of the shares in accordance with the terms and conditions of the Plan. No shares were allocated to non-executive Directors during FY2015.
b Mike Kane holds Share Acquisition Rights (SARs) under Boral’s Equity Incentive Plan, details of which are set out in the Remuneration Report on pages 48 to 64.
(14) Company Secretary Dominic Millgate was appointed Company Secretary of the Company in July 2013, after holding the position of Assistant Company Secretary since November 2010. He has previously been legal counsel and company secretary for listed entities in Australia and Singapore, and has held legal roles in London and Sydney. He is a Fellow of the Governance Institute of Australia and holds a Master of Laws from the University of New South Wales, a finance degree from the University of New England and a law degree from the University of Sydney.
(15) Directors’ shareholdings Set out below are details of each Director’s relevant interests in the shares and other securities of the Company as at the date of this Report (in the case of Richard Longes, as at the date on which he ceased to be a Director):
Shares
Non-executive Directors’
Share Plan
Catherine Brenner 15,371 –
Brian Clark 71,558 5,329
Eileen Doyle 15,076 –
Bob Every 65,605 4,616
Kathryn Fagg 26,586 –
Mike Kane b 10,233 –
Richard Longes 29,039 10,144
John Marlay 25,101 –
Paul Rayner 48,326 1,790
a

Boral Limited Annual Report 201546
DIRECTORS’ REPORT
(16) No officers are former auditorsNo officer of the Company has been a partner in an audit firm, or a Director of an audit company, that is an auditor of the Company during the year or was such a partner or Director at a time when the audit firm or the audit company undertook an audit of the Company.
(17) Non-Audit ServicesAmounts paid or payable to Boral’s auditor, KPMG, for non-audit services provided during the year by KPMG totalled $800,000. These services consisted of:
Taxation compliance in Australia $203,000
Taxation compliance/due diligence related services in jurisdictions other than in Australia
$33,000
Australian due diligence and other services $564,000
In accordance with advice from the Company’s Audit & Risk Committee, Directors are satisfied that the provision of the above non-audit services during the year by the auditor is compatible with the general standard of independence for auditors imposed by the Corporations Act.
Also in accordance with advice from the Audit & Risk Committee, Directors are satisfied that the provision of those non-audit services during the year by the auditor did not compromise the auditor independence requirements of the Corporations Act because:
• Directors are not aware of any reason to question the auditor’s independence declaration under section 307C of the Corporations Act;
• the nature of the non-audit services provided is not inconsistent with the requirements of the Corporations Act; and
• provision of the non-audit services is consistent with the processes in place for the Audit & Risk Committee to monitor the independence of the auditor.
(18) Auditor’s Independence DeclarationThe auditor’s independence declaration made under section 307C of the Corporations Act is set out on page 47 of the Annual Report and forms part of this Report.
(19) Remuneration ReportThe Remuneration Report is set out on pages 48 to 64 of the Annual Report and forms part of this Report.
(20) Proceedings on behalf of the CompanyNo application under section 237 of the Corporations Act has been made in respect of the Company and there are no proceedings that a person has brought or intervened in on behalf of the Company under that section.
(21) Rounding of amountsThe Company is of a kind referred to in ASIC Class Order 98/100 and in accordance with that Class Order, amounts in the financial report and the Directors’ Report have been rounded off to the nearest one hundred thousand dollars unless otherwise indicated.
Signed in accordance with a resolution of the Directors.
Dr Bob Every AO Director
Mike Kane Director Sydney, 27 August 2015
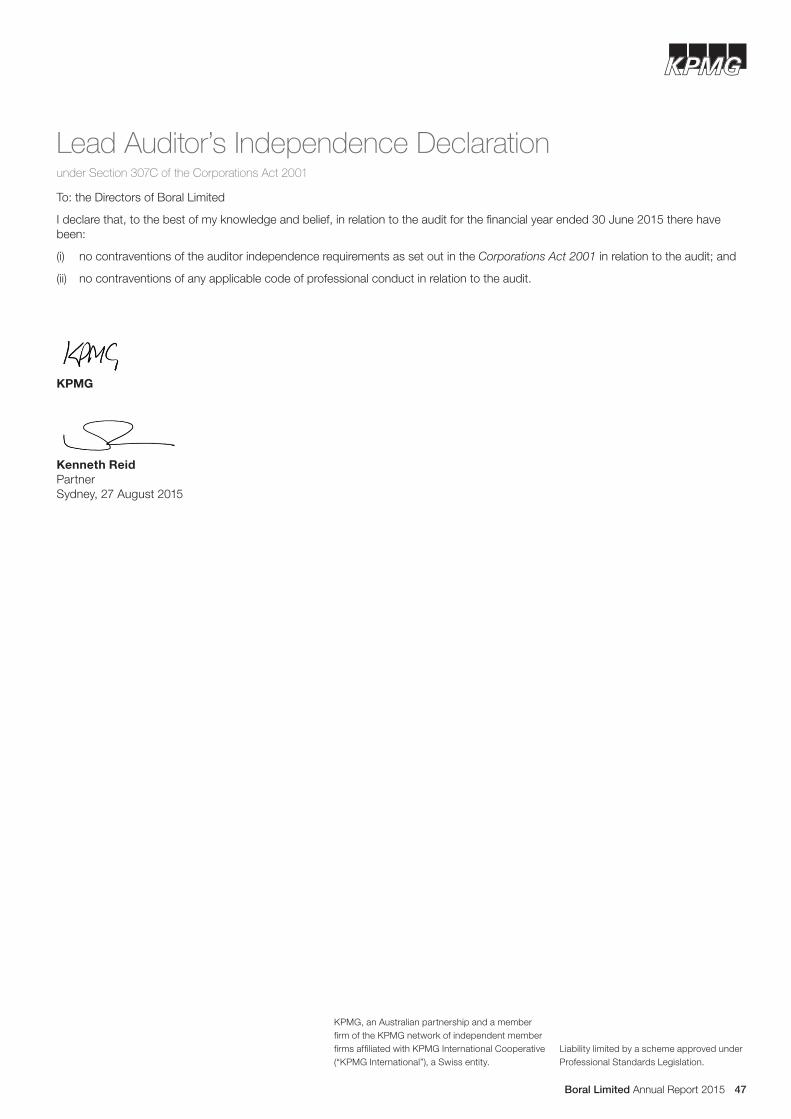
Boral Limited Annual Report 2015 47
To: the Directors of Boral Limited
I declare that, to the best of my knowledge and belief, in relation to the audit for the financial year ended 30 June 2015 there have been:
(i) no contraventions of the auditor independence requirements as set out in the Corporations Act 2001 in relation to the audit; and
(ii) no contraventions of any applicable code of professional conduct in relation to the audit.
KPMG
Kenneth Reid Partner Sydney, 27 August 2015
Lead Auditor’s Independence Declarationunder Section 307C of the Corporations Act 2001
KPMG, an Australian partnership and a member firm of the KPMG network of independent member firms affiliated with KPMG International Cooperative (“KPMG International”), a Swiss entity.
Liability limited by a scheme approved under Professional Standards Legislation.
Boral Limited Annual Report 201548
2015 REMUNERATION REPORT
2015 Remuneration Report
Introduction from the Chairman of the Remuneration & Nomination Committee Dear Shareholders
I am pleased to present our Remuneration Report for 2015, which is designed to provide a clear summary of the remuneration strategy arrangements and outcomes for your Directors and members of the senior executive team.
Following two consecutive years of structural changes to our remuneration framework to ensure remuneration arrangements align with the Company’s strategy, business performance and shareholder expectations, we have not introduced any material remuneration changes in FY2015.
In order to ensure stable leadership and continuity in delivering business transformation initiatives, in FY2016 the Board is considering introducing an additional retention incentive for certain key executives who report to the CEO or to members of the Executive Committee.
For FY2015, a year in which Boral delivered total shareholder returns (TSR) of 19%1, a 21% increase in earnings before interest and tax (EBIT)2 and a 45% increase in profit after tax (PAT)2, it was pleasing to see EBIT financial targets for the Group and for most of Boral’s businesses achieved or exceeded. This triggered the payment of $3.28 million of short-term incentives (STI) to executive Key Management Personnel (KMP) for FY2015 which was higher than STI payments for FY2014.
No long-term incentive (LTI) performance hurdles were met in FY2015 and therefore no LTI performance rights vested during the year. Despite this, relative TSR and EBIT return on average funds employed (ROFE)2 were solid during FY2015. Boral delivered a TSR of 19% in FY2015, ranking 43rd in the ASX100 group of companies, and Boral’s ROFE lifted from 6.6% to 8.5%.
On behalf of the Board and Remuneration & Nomination Committee, I invite you to read the 2015 Remuneration Report and welcome your feedback on our approach to, and disclosure of, Boral’s remuneration arrangements.
Brian Clark Chairman, Remuneration & Nomination Committee
ContentsIntroduction
Section 1: Senior Executive remuneration outcomes 50
Section 2: Senior Executive remuneration governance and framework 50
Section 3: Senior Executive remuneration structure 52
Section 4: Linking remuneration to performance 56
Section 5: Senior Executive contracts and transitions 59
Section 6: Senior Executive remuneration tables 60
Section 7: Non-executive Directors’ remuneration 62
Section 8: Senior Executive and non-executive Director transactions 63
1. Total shareholder returns is calculated based on the change in Boral’s share price, reinvestment of dividends and franking credits applied to dividends for the period from 1 July 2014 to 30 June 2015.2. Excludes financial impact of significant items. See note titled ‘Non-IFRS information’ on page 1 of the Annual Report.

Boral Limited Annual Report 2015 49
IntroductionThe Directors of Boral Limited present the Remuneration Report (the “Report”) for the Company and its controlled entities for the year ended 30 June 2015 (FY2015). This Report forms part of the Directors’ Report and has been audited in accordance with section 300A of the Corporations Act 2001. The Report sets out remuneration information for the Company’s:
• Non-executive Directors; and
• Chief Executive Officer & Managing Director (CEO) as well as other current and former members of the senior executive team (Senior Executives).
These people are accountable for planning, directing and controlling the affairs of the Company and its controlled entities. Collectively, they are the Key Management Personnel (KMP) of the Company.
The broader management group (who also participate in the various reward programs) are referred to as executives.
Key Management PersonnelThe table below details the KMP for FY2015. For those who served in a KMP role for only part of FY2015, this Report only sets out the amounts they received as remuneration in their capacity as a KMP.
Name Position
Senior Executives
Mike Kane Chief Executive Officer & Managing Director
Al Borm President and CEO, Boral Industries USA
Joseph Goss Divisional Managing Director, Boral Construction Materials & Cement
Ross Harper Executive General Manager, Cement (effective as KMP from 1 July 2014)
David Mariner Executive General Manager, Boral Building Products (appointed 1 January 2015)
Rosaline Ng Chief Financial Officer
Former Senior Executives
Darren Schulz Executive General Manager, Boral Building Products (ceased as a KMP effective 28 November 2014)
Non-executive Directors
Bob Every Chairman
Catherine Brenner Non-executive Director
Brian Clark Non-executive Director
Eileen Doyle Non-executive Director
Kathryn Fagg Non-executive Director (appointed 15 September 2014)
Richard Longes Non-executive Director (retired effective 6 November 2014)
John Marlay Non-executive Director
Paul Rayner Non-executive Director

Boral Limited Annual Report 201550
2015 REMUNERATION REPORT
Section 1: Senior Executive remuneration outcomes The table below sets out the cash and other benefits received by the current Senior Executives who were KMP in FY2015. This non-statutory remuneration outcomes table has been prepared to provide shareholders with a view of the remuneration that was actually paid to current Senior Executives for FY2015. The Board believes that presenting information this way provides shareholders with increased clarity and transparency. Remuneration details prepared in accordance with statutory obligations and accounting standards are contained on pages 60 to 61 of the Report. The totals in the table below received by the current Senior Executives in FY2015 are lower than the amounts shown in the remuneration table on pages 60 to 61 of the Report. This is because the full remuneration table includes amounts in respect of:
1. annual and long service leave movements which are generally increases in statutory accruals rather than cash payments; and2. options and rights which are amortised over the vesting period and may not have delivered value to executives in FY2015. For
example, it includes accounting values for current and prior years’ LTI grants that have not been, and may never be, realised as they are dependent on the performance hurdles being met in future years. The table below includes the values of any LTI grants which actually vested to executives in FY2015.
FY2015 remuneration outcomes table
A$’000s Fixed remunerationa STIb Other cashc LTI Other non-cashe Total
Mike Kane 1,734.2 1,687.4 – – 548.4 3,970.0
Al Borm 629.0 391.9 76.2 – 44.6 1,141.7
Joseph Goss 777.7 385.8 – – 227.6 1,391.1
Ross Harper 522.3 202.8 18.8 – 2.9 746.8
David Marinerg 285.5 163.8 92.1d – 299.3f 840.7
Rosaline Ng 704.5 447.2 18.8 – 41.6 1,212.1
a. “Fixed remuneration” is cash salary paid to the Senior Executive for their period as a KMP.b. The value of short-term incentives (STI) represents 80% of the total STI with the remaining 20% deferred into equity for two years.c. “Other cash” includes relocation allowances and superannuation or equivalent contributions.d. “Other cash” for David Mariner includes an amount of $73,209 as a one-off relocation allowance for relocating Mr Mariner and his family from his base in USA to Sydney, and an $18,873
contribution into the US Supplemental Executive Retirement Plan (SERP) under the terms of his employment contract.e. “Other non-cash” comprises non-monetary benefits, such as car parking, housing benefits and medical insurance including any fringe benefits tax paid on these benefits.f. “Other non-cash” for David Mariner includes an amount of $71,743 in tax equalisation costs, incurred to ensure that as an expatriate employee he is not disadvantaged by US tax regulations in
his home state for the period of his expatriate assignment. No tax equalisation costs were required for any other expatriates in the preceding table, due to different taxation rules applicable in their respective home states in the USA.
g. David Mariner’s details are for the period in which he has been a KMP, from 1 January 2015 to 30 June 2015.
Section 2: Senior Executive remuneration governance and frameworkRemuneration governanceRemuneration & Nomination CommitteeThe Remuneration & Nomination Committee of the Board (the “Committee”) makes recommendations for approval by the full Board on remuneration arrangements for non-executive Directors, the CEO & Managing Director, other Senior Executives and other executives. This includes recommendations relating to Directors’ fees, annual executive remuneration reviews, short-term incentive (STI) and long-term incentive (LTI) structures, grants, measures, targets and outcomes. The Committee also advises the Board on remuneration policies and practices for Boral generally.
The Committee comprises five independent non-executive Directors: Brian Clark (Committee Chairman), Catherine Brenner, Bob Every, Kathryn Fagg and John Marlay. The responsibilities of the Committee are outlined in its Charter, which is reviewed annually by the Board. A copy of the Charter is available at the corporate governance section of Boral’s website at www.boral.com.au.
Independent remuneration consultantThe Committee seeks information and advice regarding remuneration directly from its external remuneration consultant EY, which is independent of the Company’s management.
During FY2015, EY provided information only. No advice was provided by EY that contained “remuneration recommendations” relating to the remuneration of KMP.
The main information received from the Committee’s remuneration consultant related to benchmarking of the CEO, the CEO’s direct reports and non-executive Director reward.

Boral Limited Annual Report 2015 51
The Board has adopted a protocol governing the engagement of remuneration consultants and the provision of remuneration recommendations. The purpose of this protocol is to ensure that recommendations provided by consultants are made free from undue influence by the Senior Executives to whom the recommendations relate.
The protocol provides that before Boral enters into a contract to engage a consultant to provide remuneration recommendations, the proposed consultant must be approved by the Committee or the non-executive Directors. The remuneration consultant must report directly to the Committee or the non-executive Directors. If a consultant makes a recommendation concerning the remuneration of a Senior Executive, the recommendation must be provided directly to the Committee or the non-executive Directors. This arrangement was reviewed in FY2015 by the Remuneration & Nomination Committee and no changes were considered necessary.
Remuneration frameworkBoral’s remuneration framework provides the foundation of our remuneration structure, policies and processes. The key elements of this framework are:
REMUNERATION STRATEGY
Align reward to business strategy and shareholder value creationAttract and retain high calibre employees with market competitive and flexible reward
REMUNERATION PRINCIPLES
ALIGNED TO SHAREHOLDERS MARKET COMPETITIVE LINKED TO BUSINESS CONDITIONSShort and long-term incentives are based on performance measures designed to drive sustainable value creation for shareholders
High calibre employees with ability to deliver required financial and non-financial outcomes are attracted and retained with fixed rewards that reflect seniority and complexity of roles
At risk reward outcomes are reflective of financial performance objectives
APPLICATION OF REMUNERATION PRINCIPLES
Short-term incentives are based on earnings before interest and tax (EBIT) and long-term incentives are based on relative total shareholder return (TSR) and return on average funds employed (ROFE)
External market data and benchmarking information are reviewed to ensure that remuneration is set at competitive levels relative to both ASX listed and industry peers
Short-term incentives have threshold and stretch targets that are differentiated based on Group and/or divisional results and individual performance
Deferral of a portion of short-term incentives into performance rights promotes retention and encourages sustained performance by being aligned to the shareholder experience
Individuals with unsatisfactory performance are not rewarded
Minimum shareholding requirements apply to Senior Executives
Equity participants do not receive dividends on unvested equity
Unvested equity is generally forfeited on resignation
Treatment of USG Boral Building Products employeesThe joint venture Board has assumed accountability for the remuneration arrangements of USG Boral Building Products employees. Remuneration for those employees continues to be aligned to the market conditions of the countries in which the joint venture operates. In designing new at risk remuneration components, there is a strong alignment to achieving Boral’s financial objectives by measuring performance outcomes based on earnings before interest, tax, depreciation and amortisation (EBITDA) and ROFE. Performance hurdles for joint venture executives are tied back to the specific performance targets necessary for Boral to achieve up to US$75 million over five years as earn out payments under the joint venture agreement.

Boral Limited Annual Report 201552
2015 REMUNERATION REPORT
Section 3: Senior Executive remuneration structure The total target remuneration (TTR) arrangements of the Senior Executives are made up of two components:
1. Fixed annual remuneration (FAR) which provides a predictable “base” level of reward; and2. At risk reward that is performance based and comprised of both short and long-term incentives.
FIXED ANNUAL REMUNERATION
+AT RISK REMUNERATION
SHORT-TERM INCENTIVES LONG-TERM INCENTIVES
ANNUAL CASH INCENTIVE (STI)
TWO YEAR DEFERRED INCENTIVE (DEFERRED STI)
THREE YEAR LONG-TERM INCENTIVE (LTI)
Performance measures based on Group and/or divisional and/or business EBIT and individual performance
20% of STI deferred into equity and forfeited if executive resigns within two years
Performance measures based on relative TSR and ROFE
=TOTAL TARGET REMUNERATION
Total target remunerationBoral’s target mix of fixed and “at risk” components for each of the current Senior Executives disclosed in the Report, as a percentage of total target annual remuneration for FY2015, is as follows:
FIXED AT RISK REMUNERATION
FAR STI LTI
CEO 34% 33% 33%
Other current Senior Executivesa 50 – 60% 20 – 25% 20 – 25%
a. Other current Senior Executive percentages vary between individuals.
Fixed annual remuneration (FAR)FAR includes base salary, non-cash benefits such as provision of a vehicle (including any fringe benefits tax) and superannuation contributions.
Total remuneration levels are reviewed annually by the Committee and the Board through a process that ensures Senior Executives’ fixed remuneration remains competitive with the market and reflects their skills, experience, accountability and general performance.
In undertaking the review, the Committee benchmarks the remuneration of the current Senior Executives against a group of companies which it considers reflects the size and complexity of Boral and its competition for key executive talent. The comparator group comprises S&P/ASX 200 entities within 50% and 200% of Boral’s market capitalisation and revenue plus an overlay of industrials or materials sector entities in the S&P/ASX 200 within 33% and 300% of Boral’s market capitalisation and revenue. For FY2015 the industrials and materials sector’s range was broadened to ensure a meaningful sample size for comparison. In determining each Senior Executive’s FAR, the Committee considers the median FAR within the comparator group. Use of a range around the median provides flexibility to recognise capability, contribution, value to the organisation and performance of individuals, while maintaining remuneration at levels that are not more generous than necessary to retain and motivate.
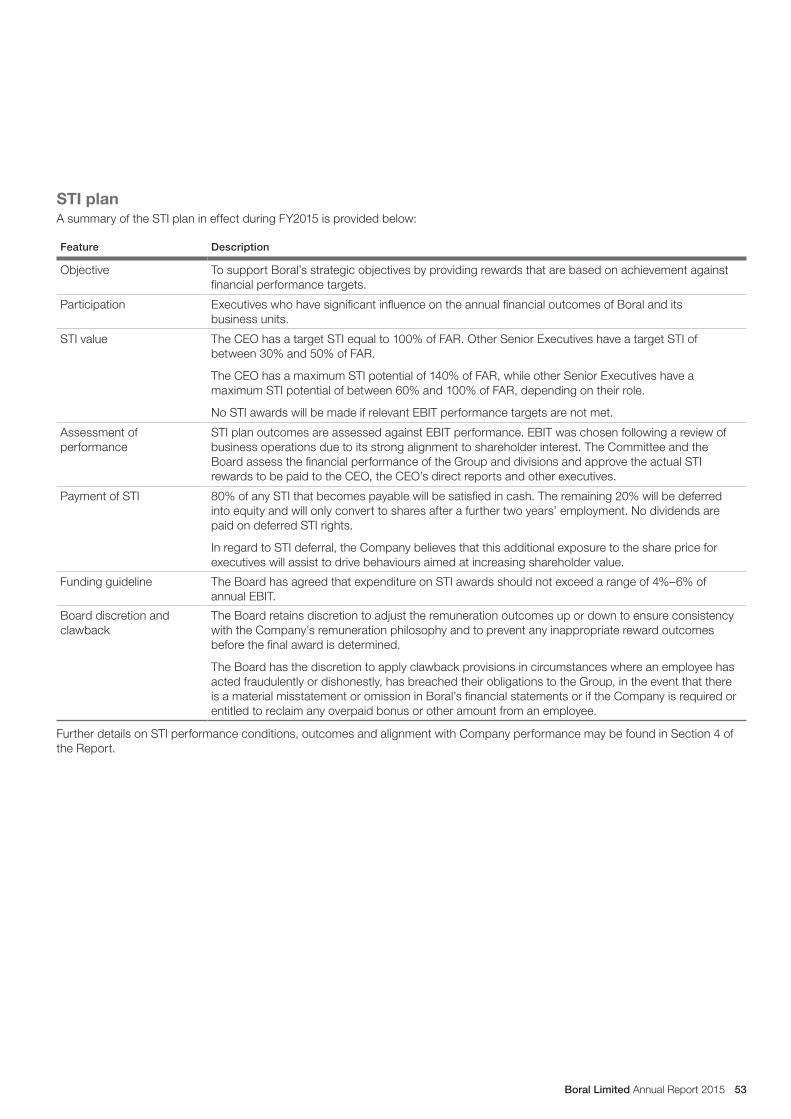
Boral Limited Annual Report 2015 53
STI planA summary of the STI plan in effect during FY2015 is provided below:
Feature Description
Objective To support Boral’s strategic objectives by providing rewards that are based on achievement against financial performance targets.
Participation Executives who have significant influence on the annual financial outcomes of Boral and its business units.
STI value The CEO has a target STI equal to 100% of FAR. Other Senior Executives have a target STI of between 30% and 50% of FAR.
The CEO has a maximum STI potential of 140% of FAR, while other Senior Executives have a maximum STI potential of between 60% and 100% of FAR, depending on their role.
No STI awards will be made if relevant EBIT performance targets are not met.
Assessment of performance
STI plan outcomes are assessed against EBIT performance. EBIT was chosen following a review of business operations due to its strong alignment to shareholder interest. The Committee and the Board assess the financial performance of the Group and divisions and approve the actual STI rewards to be paid to the CEO, the CEO’s direct reports and other executives.
Payment of STI 80% of any STI that becomes payable will be satisfied in cash. The remaining 20% will be deferred into equity and will only convert to shares after a further two years’ employment. No dividends are paid on deferred STI rights.
In regard to STI deferral, the Company believes that this additional exposure to the share price for executives will assist to drive behaviours aimed at increasing shareholder value.
Funding guideline The Board has agreed that expenditure on STI awards should not exceed a range of 4%–6% of annual EBIT.
Board discretion and clawback
The Board retains discretion to adjust the remuneration outcomes up or down to ensure consistency with the Company’s remuneration philosophy and to prevent any inappropriate reward outcomes before the final award is determined.
The Board has the discretion to apply clawback provisions in circumstances where an employee has acted fraudulently or dishonestly, has breached their obligations to the Group, in the event that there is a material misstatement or omission in Boral’s financial statements or if the Company is required or entitled to reclaim any overpaid bonus or other amount from an employee.
Further details on STI performance conditions, outcomes and alignment with Company performance may be found in Section 4 of the Report.

Boral Limited Annual Report 201554
2015 REMUNERATION REPORT
LTI planA summary of the LTI plan in effect during FY2015 is provided below:
Feature Description
Objective To link long-term executive rewards with the sustained creation of shareholder value through the allocation of equity awards that are subject to the satisfaction of long-term performance conditions.
In addition, the LTI structure aims to attract and retain high quality executives and to reward executives for the achievement of performance conditions which underpin sustainable long-term performance.
Participation The CEO, Senior Executives and other executives.
Equity type Awards are delivered in the form of performance rights. Upon vesting, each performance right entitles the executive to one ordinary share.
LTI value The CEO has a maximum LTI equal to 100% of FAR. Senior Executives have a maximum LTI equal to 25% to 50% of FAR.
The number of performance rights allocated depends on each executive’s maximum LTI. The number is calculated using a fair market value methodology in which the fair value is determined from the face value of a Boral share on 1 September, discounted for a number of factors that impact the value of a TSR tested right, such as the possibility that the TSR performance hurdle will not be met. Other factors that are taken into account when determining the discount from face value include the time to vesting, expected volatility of the share price and the dividends expected to be paid in relation to the shares. This approach is in line with the methodology used for valuing TSR tested rights for accounting purposes. The fair value is determined by an independent valuer (being PwC).
Performance hurdles The LTI award granted in FY2015 is measured against the relative TSR of the S&P/ASX 100 Index and ROFE. Two thirds of the LTI grant is subject to the TSR hurdle (TSR Component) and one third is subject to a ROFE hurdle (ROFE Component).
TSR represents the change in capital value of a listed entity’s share price over a three year performance period, plus reinvested dividends, expressed as a percentage of the opening value. For the LTI grants made in FY2015, the TSR performance period is 1 September 2014 to 1 September 2017.
The compound growth in the Company’s TSR over the performance measurement period is compared with the TSR performance over the same period of a comparator group (as outlined below).
ROFE tests the efficiency and profitability of the Company’s capital investments and is determined by the Board based on earnings before interest and tax (EBIT) in the year of testing as a percentage of average funds employed (where funds employed is the sum of net assets and net debt). The ROFE performance hurdle and relevant targets are intended to reward achievement linked to improving the Company’s ROFE performance through the cycle. Our longer term goal is to exceed the weighted average cost of capital and the ROFE targets for annual LTI awards are set progessively with a view to achieving this goal.
By way of background, ROFE was adopted as a second LTI performance hurdle in FY2014. At that time, the Board considered a number of return measures with EBIT return on average funds employed selected as the most appropriate measure because it encourages appropriate use of capital, while utilising measures that are readily understood and reported. It also allows divisional performance to be easily tracked which helps executives to drive overall performance against target.
TSR comparator group Companies comprising the S&P/ASX 100 Index as at the grant date.
The Board has the discretion to adjust the comparator group to take into account events including, but not limited to, takeovers or mergers that might occur during the performance period.
Retesting There is no retest. Rights that do not vest based on performance over the three year measurement period will lapse on the third anniversary of the grant date.
Total shares issued The number of shares allocated on the vesting of all outstanding rights and the exercise of all outstanding options under any Boral employee share scheme may not exceed 5% of the total number of shares on issue at the time of the offer.

Boral Limited Annual Report 2015 55
Feature Description
Cessation of employment For “good leavers” (including cessation of employment due to death, permanent disablement, bona fide retirement, redundancy, sale of a subsidiary or business assets):• rights will remain on foot beyond termination (with a pro rata scale-back based on the portion of
the performance period elapsed at the cessation date); and• rights that will be tested on the usual test date will only vest if they meet the performance hurdle. For other leavers, rights will lapse upon cessation of employment unless the Board determines otherwise.
Forfeiture and clawback The Board has the discretion to partially reduce or forfeit an LTI award where an employee has their employment terminated for cause, acts fraudulently or dishonestly, or breaches their obligations to the Group.
The Board has a further discretion to apply clawback provisions in the event that there is a material misstatement or omission in Boral’s financial statements or if the Company is required or entitled to reclaim any overpaid bonus or other amount from an employee.
Change of control The Board may exercise its discretion to allow all or some unvested rights to vest if a change of control event occurs. The Board would have regard to the performance of the Company during the vesting period up to the date of a change of control event.
Vesting schedulesIf at the end of the performance period, the TSR of the Company:
The percentage of the TSR Component which will vest is:
Does not reach the 50th percentile of the TSRs of the S&P/ASX 100
NIL
Reaches the 50th percentile of the TSRs of the S&P/ASX 100
50%
Exceeds the 50th percentile of the TSRs of the S&P/ASX 100 but does not reach the 75th percentile
Progressive pro rata vesting from 50% to 100% (ie. on a straight-line basis)
Reaches or exceeds the 75th percentile of the TSRs of the S&P/ASX 100
100%
In regard to the LTI grant made in September 2014, the following vesting schedule applies for the ROFE Component:
If the Company’s ROFE performance for FY2017 is:The percentage of the ROFE Component which will vest is:
Less than 11.0% NIL
11.0% 50%
Greater than 11.0% and less than 11.5% Progressive pro rata vesting from 50% to 100% (ie. on a straight-line basis)
11.5% or above 100%
See below for the vesting schedule to be applied for the proposed September 2015 grant.
Dealing restrictions Boral’s Share Trading Policy prohibits executives from entering into hedge and other derivative transactions in relation to rights granted under the LTI plan.
Shares allocated to participants upon vesting of their LTIs may only be dealt with in accordance with the Share Trading Policy.
Any contravention of the Policy would result in disciplinary action.
Dividends No dividends are paid on unvested LTI awards.
LTI plan (continued)

Boral Limited Annual Report 201556
2015 REMUNERATION REPORT
LTI grant for September 2015In regard to the LTI grant expected to be made in September 2015, the grant will be made on similar terms to the plan in effect during FY2015, except that the percentage of the ROFE Component which may vest will be determined by the Board based on ROFE performance for the financial year ending 30 June 2018 in accordance with the following vesting schedule:
If the Company’s ROFE performance for FY2018 is: The percentage of the ROFE Component which will vest is:
Less than 11.5% NIL
11.5% 50%
Greater than 11.5% and less than 12.0% Progressive pro rata vesting in a straight line from 50% to 100%
12% or above 100%
The percentage of the ROFE Component that does not vest in accordance with this schedule will lapse (ie. there will be no further testing). For each subsequent year’s LTI grant, new ROFE targets will be set.
The Company’s ROFE performance will be reported annually in the Company’s Remuneration Report. Refer to the table in Section 4 for the Company’s ROFE performance (EBIT to average funds employed) from FY2011 to FY2015. For FY2015, the Company’s ROFE performance was 8.5%.
Minimum shareholding requirementsTo further align the interests of the Company’s key executives with the interests of shareholders, the Board established minimum shareholding requirements effective from 1 July 2013 for the CEO & Managing Director and all other Senior Executives.
Senior Executives are required to accumulate a minimum shareholding in the Company over a period of up to five years from the later of 1 July 2013 or their date of appointment as a KMP. The CEO & Managing Director is required to build a minimum shareholding equivalent to 100% of annual fixed remuneration and other Senior Executives must build a minimum shareholding equivalent to 50% of their annual fixed remuneration.
The Company’s policy for non-executive Directors’ minimum shareholdings is set out on page 39 of the Corporate Governance Statement.
Section 4: Linking remuneration to performance Overview of 2015 financial performanceStrategic decisions regarding organisational structure, portfolio alignment, cost structures and growth are intended to ensure that Boral is an organisation that is more responsive to the realities of a cyclical marketplace and which can remain competitive not just during the cycle highs, but also when conditions are challenging, as they have been in recent years.
The effect of the business cycle on Boral’s performance is demonstrated in the charts below.
In FY2015, Boral’s improved returns reflect the benefits of business improvement initiatives and portfolio realignment, together with strong housing and infrastructure markets in Australia, early stages of market recovery in the USA, and growing markets in Asia.
Earnings Per Share1, cents
0
5
10
15
20
25
30
35
FY15FY14FY13FY12FY11
24.4
13.6 13.6
22.0
31.9
Return on Equity1, %
0
2
4
6
8
10
FY15FY14FY13FY12FY11
5.6
3.0 3.2
5.1
7.1
Boral share price
$1.00
$2.00
$3.00
$4.00
$5.00
$6.00
$7.00
FY10 FY11 FY12 FY13 FY14 FY15
Dividend Per Share, cents
15.018.0
0
5
10
15
20
FY15FY14FY13FY12FY11
14.5
11.0 11.0
1. Excludes financial impact of significant items
Source: Bloomberg

Boral Limited Annual Report 2015 57
Short-term performance – FY2015Boral continued to use a single financial hurdle for STI awards in respect of FY2015 to create a clear line of sight for executives and transparency for shareholders as to how STI awards are determined. Performance at the completion of the financial year is measured against pre-determined EBIT targets that were established as part of the Group’s annual budget process.
EBIT was chosen as the financial target because the Board believes that it effectively aligns rewards for executives with the Company’s strategic focus on delivering strong earnings throughout the business cycle. The focus on EBIT is considered appropriate in light of the difficult market conditions that Boral has faced over the past few years, and continues to face in some markets.
The table below provides an overview of the STI performance targets for FY2015 for current Senior Executives.
Position Weighting and target
CEO & Managing Director and Chief Financial Officer 100% Group EBIT
Other current Senior Executives 50% Group EBIT plus 50% relevant divisional EBIT
or 50% Group EBIT plus 20% relevant divisional EBIT plus 30% relevant business EBIT
The STI performance objectives are communicated to Senior Executives at the beginning of the performance year and annual performance evaluations are conducted following the end of the financial year. For FY2015, the evaluations were conducted in July and August 2015. The remuneration table on pages 60 to 61 provides details of the STI awards made for performance during FY2015.
On average, 133% of target STI was paid out to current Senior Executives for FY2015 performance compared with 100% of target STI for FY2014 performance. This reflects improvements in the delivery of EBIT versus target at the divisional and Group levels.
Boral’s EBIT was higher in FY2015 versus FY2014 as a result of ongoing improvement programs including cost reduction and revenue enhancement initiatives and portfolio enhancements, together with the benefits of volume improvements in some markets, particularly in the USA.
Boral’s EBIT over the past five years is shown in the chart below.
Earnings Before Interest & Tax (EBIT)1, $ millions
0
50
100
150
200
250
300
350
400
FY15FY14FY13FY12FY11
277
200228
294
357
1. Excludes financial impact of significant items.
Long-term performance – FY2015Prior to FY2014, relative TSR was the sole performance condition for the LTI awards. The Board believes that a relative TSR hurdle ensures alignment between comparative shareholder return and reward for the executive.
In FY2014, Return on Funds Employed (ROFE) was introduced as a second LTI performance measure in order to reward achievement linked to improving the Company’s ROFE performance through the cycle.
TSR performanceThe LTI grants that were available for vesting in FY2015 were the grants with respect to FY2007, FY2009 and FY2011.
The relative TSR performance and the vesting level for each LTI grant since November 2007 are set out in the table over the page. Grants from 2007 to 2012 are generally tested at years 3, 5 and 7, and the performance hurdle may be reached at any of those testing dates, otherwise they lapse. From the September 2013 grant there is only one test at year 3.
The table over the page demonstrates the level of performance achieved for each of the outstanding LTI grants up to 30 June 2015.

Boral Limited Annual Report 201558
2015 REMUNERATION REPORT
Grant date Next test date Expiry dateOption exercise price
Mix of options/rights
Relative TSR performance Vesting level
Nov 07 N/A Nov 14 $6.78 50% options 50% rights
68th Percentile as at 1st test date – balance of grant expired at final test (Nov 14)
86%
Nov 08 Nov 15 Nov 15 N/A 100% rights 33rd Percentile as at 2nd test date (Nov 2013)
0%
Nov 09 Nov 16 Nov 16 N/A 100% rights 29th Percentile as at 2nd test date (Nov 2014)
0%
Nov 10 Nov 15 Nov 17 N/A 100% rights 40th Percentile as at 1st test date (Nov 2013)
0%
Sep 11 Sep 16 Sep 18 N/A 100% rights 44th Percentile as at 1st test date (Sep 2014)
0%
Sep 12 Sep 15 Sep 19 N/A 100% rights 1st test date Sep 2015 N/A
Sep 13 N/A Sep 16 N/A 100% rights Test date Sep 2016 N/A
Sep 14 N/A Sep 17 N/A 100% rights Test date Sep 2017 N/A
In FY2015, Boral’s relative TSR performance was strong. Taking into account share price appreciation and dividends paid, Boral delivered a TSR of 19.3% for shareholders between 1 July 2014 and 30 June 2015. As shown in the graph below, this TSR ranked Boral in the second quartile of ASX 100 companies for FY2015 or 43rd out of the 96 companies that were in the ASX100 at the start of the year and remained listed on the ASX for the period.
FY2015 Total Shareholder Return (TSR) for Boral vs. ASX 100 companies
BLD
-100%
-50%
0%
50%
100%
150%
19.3%
1st Quartile 2nd Quartile 3rd Quartile 4th Quartile
ROFE performanceBoral’s performance as measured by EBIT return on average funds employed (ROFE) continued to improve in FY2015 from a low of 4.7% in FY2012 and FY2013.
At 8.5%, Boral’s ROFE performance in FY2015 is a significant improvement on 6.6% achieved in FY2014, but remains short of our longer term goal to exceed the cost of capital.
The LTI ROFE targets of 8.0% in FY2016, 11.5% in FY2017 and 12% in FY2018, which are set with a three-year time horizon, are on a challenging but achievable improvement trajectory. For every 1% lift in ROFE, an EBIT improvement of approximately $43 million or around 12% is required assuming a constant level of funds employed at current levels.
EBIT1 Return on Average Funds Employed (ROFE), %
0
2
4
6
8
10
FY15FY14FY13FY12FY11
7.4
4.7 4.7
6.6
8.5
1. Excludes financial impact of significant items.

Boral Limited Annual Report 2015 59
Section 5: Senior Executive contracts and transitionsRemuneration structure and contract terms for Mr Mike KaneMr Kane was appointed CEO & Managing Director on 1 October 2012.
An overview of the terms of his employment is provided below:
Feature Description
Total reward determination Benchmarked to a comparator group which is closely aligned to Boral’s current market position and selected from similar companies within a range of Boral’s market capitalisation.
The group includes companies from the S&P/ASX 200 Index with a 12 month average market capitalisation and revenue of between 50% and 200% of Boral, as well as industrials and materials sector companies with market capitalisation and revenue between 33% and 300% of Boral’s.
Total reward summary FAR of $1.74m as at 1 September 2014.
STI entitlement is 100% of FAR for “target” performance with a maximum of 140% of FAR for “stretch” performance.
LTI entitlement is a maximum of 100% of FAR and is granted under the terms of the LTI plan (described on pages 54 to 55 of this Report).
Shareholders approved a grant of 615,957 performance rights to Mr Kane at the 2014 Annual General Meeting (AGM).
Contract duration Ongoing contract, which can be terminated at any time by the Company upon giving 12 months’ notice (or three months in the case of illness) or by Mr Kane upon giving six months’ notice.
Performance expectations The remuneration structure for Mr Kane includes short and long-term incentives linked to Boral’s financial performance and shareholder returns. The Board also considers the management of non-financial performance when setting CEO remuneration and assessing the CEO’s performance.
For example, managing safety well is considered a fundamental part of the CEO’s role. The Board believes that attracting and retaining a leader who has the right focus, commitment and track record in safety management, and reflecting this in the fixed remuneration component of the CEO, will lead to a more sustainable journey towards a zero harm workplace. As such, the Board takes safety performance into consideration in reviewing the performance of the CEO and setting the fixed remuneration, rather than it being an additional determinant of STI payments.
Termination of employment (without cause)
If employment is terminated without cause, by reason of illness or death or as a result of a fundamental change, Mr Kane will receive a separation payment equal to 12 months’ FAR.
In such circumstances, Mr Kane will forfeit his entitlement to any STI in respect of the year of termination (ie. the STI is not pro rated), unless the Board determines otherwise.
In relation to the FY2014 LTI award, any performance rights that are unvested will remain on foot and vest on the usual test date if the performance hurdles are satisfied. If vesting does not occur at that time, the rights will lapse.
For LTI grants which remain unvested at the date of termination, the incentives will remain on foot in accordance with the terms of the individual grant, unless the Board determines otherwise.
Termination of employment (with cause) or resignation
Where Mr Kane resigns, or his employment is terminated for cause, Mr Kane will not receive a separation payment. In these circumstances, Mr Kane will not be entitled to any STI in respect of the year of termination, and any unvested LTI entitlements will lapse unless the Board determines otherwise.
Relocation expenses Mr Kane is entitled to relocation expenses to and from Sydney. Boral agreed to pay for the cost of relocating Mr Kane and his family from his base in the USA to Sydney as a result of his appointment as CEO & Managing Director, as well as reasonable rental costs for up to five years.
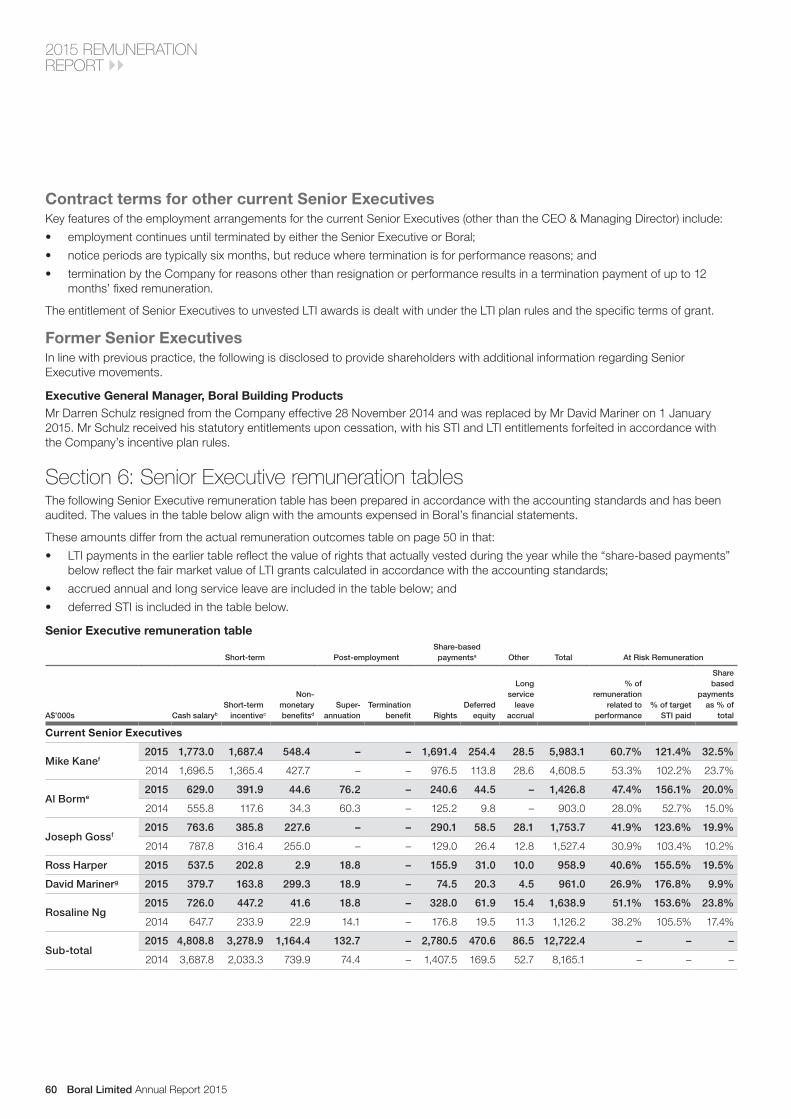
Boral Limited Annual Report 201560
2015 REMUNERATION REPORT
Contract terms for other current Senior ExecutivesKey features of the employment arrangements for the current Senior Executives (other than the CEO & Managing Director) include:
• employment continues until terminated by either the Senior Executive or Boral;
• notice periods are typically six months, but reduce where termination is for performance reasons; and
• termination by the Company for reasons other than resignation or performance results in a termination payment of up to 12 months’ fixed remuneration.
The entitlement of Senior Executives to unvested LTI awards is dealt with under the LTI plan rules and the specific terms of grant.
Former Senior Executives In line with previous practice, the following is disclosed to provide shareholders with additional information regarding Senior Executive movements.
Executive General Manager, Boral Building ProductsMr Darren Schulz resigned from the Company effective 28 November 2014 and was replaced by Mr David Mariner on 1 January 2015. Mr Schulz received his statutory entitlements upon cessation, with his STI and LTI entitlements forfeited in accordance with the Company’s incentive plan rules.
Section 6: Senior Executive remuneration tables The following Senior Executive remuneration table has been prepared in accordance with the accounting standards and has been audited. The values in the table below align with the amounts expensed in Boral’s financial statements.
These amounts differ from the actual remuneration outcomes table on page 50 in that:
• LTI payments in the earlier table reflect the value of rights that actually vested during the year while the “share-based payments” below reflect the fair market value of LTI grants calculated in accordance with the accounting standards;
• accrued annual and long service leave are included in the table below; and
• deferred STI is included in the table below.
Senior Executive remuneration table
Short-term Post-employment Share-based paymentsa Other Total At Risk Remuneration
A$’000s Cash salaryb Short-term incentivec
Non- monetary benefitsd
Super-annuation
Termination benefit Rights
Deferred equity
Long service
leave accrual
% of remuneration
related to performance
% of target STI paid
Share based
payments as % of
total
Current Senior Executives
Mike Kanef2015 1,773.0 1,687.4 548.4 – – 1,691.4 254.4 28.5 5,983.1 60.7% 121.4% 32.5%
2014 1,696.5 1,365.4 427.7 – – 976.5 113.8 28.6 4,608.5 53.3% 102.2% 23.7%
Al Borme2015 629.0 391.9 44.6 76.2 – 240.6 44.5 – 1,426.8 47.4% 156.1% 20.0%
2014 555.8 117.6 34.3 60.3 – 125.2 9.8 – 903.0 28.0% 52.7% 15.0%
Joseph Gossf2015 763.6 385.8 227.6 – – 290.1 58.5 28.1 1,753.7 41.9% 123.6% 19.9%
2014 787.8 316.4 255.0 – – 129.0 26.4 12.8 1,527.4 30.9% 103.4% 10.2%
Ross Harper 2015 537.5 202.8 2.9 18.8 – 155.9 31.0 10.0 958.9 40.6% 155.5% 19.5%
David Marinerg 2015 379.7 163.8 299.3 18.9 – 74.5 20.3 4.5 961.0 26.9% 176.8% 9.9%
Rosaline Ng2015 726.0 447.2 41.6 18.8 – 328.0 61.9 15.4 1,638.9 51.1% 153.6% 23.8%
2014 647.7 233.9 22.9 14.1 – 176.8 19.5 11.3 1,126.2 38.2% 105.5% 17.4%
Sub-total2015 4,808.8 3,278.9 1,164.4 132.7 – 2,780.5 470.6 86.5 12,722.4 – – –
2014 3,687.8 2,033.3 739.9 74.4 – 1,407.5 169.5 52.7 8,165.1 – – –

Boral Limited Annual Report 2015 61
Short-term Post-employment Share-based paymentsa Other Total At Risk Remuneration
A$’000s Cash salaryb Short-term incentivec
Non- monetary benefitsd
Super-annuation
Termination benefit Rights
Deferred equity
Long service
leave accrual
% of remuneration
related to performance
% of target STI paid
Share based
payments as % of
total
Former Senior Executives
Darren Schulz2015 247.4 – 11.2 7.8 – – – (4.7) 261.7 0.0% 0.0% 0.0%
2014 480.3 165.8 10.7 17.8 – 45.1 13.8 (0.6) 732.9 30.7% 138.2% 8.0%
Sub–total2015 247.4 – 11.2 7.8 – – – (4.7) 261.7 – – –
2014 480.3 165.8 10.7 17.8 – 45.1 13.8 (0.6) 732.9 – – –
Total2015 5,056.2 3,278.9 1,175.6 140.5 – 2,780.5 470.6 81.8 12,984.1 – – –
2014 4,168.1 2,199.1 750.6 92.2 – 1,452.6 183.3 52.1 8,898.0 – – –
a. The fair market value of the options and rights is calculated at the date of grant using the Monte Carlo simulation analysis. For the grants prior to FY2013, the value is allocated to each reporting period evenly over the period of five years from the grant date. For the grants issued from FY2014 the value is allocated evenly over the period of three years from the grant date. The value disclosed above is the portion of the fair market value of the options and rights for each relevant reporting period, including the value of deferred equity.
b. Cash salary includes all fixed salary, relocation allowances and accrued annual leave.c. STI values for current KMP represent 80% of total STI with remaining 20% to be deferred into equity and expensed over three years in accordance with the deferred STI plan introduced from FY2014.d. Includes non-monetary benefits; parking, medical insurance, home leave, housing allowances, vehicle costs, and applicable fringe benefits tax payable by the Company upon providing these benefits.e. Al Borm’s remuneration has been converted at the foreign exchange rate of AUD 1 = USD 0.8287, being the average conversion for the FY2015 period (0.9141 for the FY2014 period).f. Under the terms of their expatriate agreements, superannuation contributions have not been made for Mike Kane or Joseph Goss.g. David Mariner’s details are for the period as a KMP from 1 January 2015 to 30 June 2015. "Cash salary" for David Mariner includes an amount of $73,209 as a one-off relocation allowance for relocating
Mr Mariner and his family from his base in USA to Sydney. "Non-monetary benefits" for David Mariner includes an amount of $71,743 in tax equalisation costs, incurred to ensure the expatriate employee is not disadvantaged by US tax regulations in his home state for the period of his expatriate assignment. No tax equalisation costs were required for any other expatriates in the preceding table, due to different taxation rules applicable in their respective home states in the USA. "Superannuation" for David Mariner includes an $18,873 contribution into the US Supplemental Executive Retirement Plan (SERP) under the terms his employment contract.
Equity grants and movement during the year The following table provides details of rights granted during the year under the Boral Equity Incentive Plan, as well as the movement during the year in options and rights granted under the plan in previous financial years.
Equity TypeBalance as at 30 June 2014
Granted during the year as
remunerationa Value of Grantb
Exercised/Vested during
the Year
Value of Options and rights exercised/
vestedc
Lapsed/cancelled during the
yeard
Balance as at 30 June 2015
No. No. $ No. $ No. No.
Current Senior Executives
Mike KaneLTI Rights 1,580,124 615,957 2,166,115 – – – 2,196,081
Deferred STI Rights – 62,382 341,348 – – – 62,382
Al Borm LTI Rights 192,782 100,898 354,825 – – – 293,680
Deferred STI Rights – 5,373 29,401 – – – 5,373
Joseph Goss LTI Rights 167,763 138,351 486,534 – – – 306,114
Deferred STI Rights – 14,456 79,102 – – – 14,456
Ross Harper
LTI Rights 196,229 48,160 169,363 – – (1,038) 243,551
Options 28,500 – – – – (28,500) –
Deferred STI Rights – 7,730 42,298 – – – 7,730
David Mariner LTI Rights 129,620 53,089 186,696 – – – 182,709
Deferred STI Rights – 3,631 19,868 – – – 3,631
Rosaline Ng
LTI Rights 298,198 129,078 453,924 – – (900) 426,376
Options 24,700 – – – – (24,700) –
Deferred STI Rights – 13,496 73,849 – – – 13,496
Former Senior Executives
Darren SchulzLTI Rights 63,662 46,099 140,418 – – (109,761) –
Deferred STI Rights - 7,580 41,477 – – (7,580) –
a. LTI Rights were granted to Senior Executives on 1 September 2014, to be tested on 1 September 2017, and there will be no retesting. Deferred STI rights were also granted on 1 September 2014.b. The fair market value of LTI Rights granted on 1 September 2014, calculated using a Monte Carlo simulation analysis, is $2.82 per right for two-thirds of the grant relating to the TSR measure
and $4.91 per right for one-third of the grant relating to the ROFE hurdle.c. Calculated per right as the market price of Boral shares on the date of vesting. No exercise price is payable in respect of rights that vest. While there were exercisable options during the year,
no options were exercised by Senior Executives because the exercise price exceeded the market price for Boral shares.d. Rights and options that lapsed/cancelled during the year were granted to Senior Executives in FY2007.

Boral Limited Annual Report 201562
2015 REMUNERATION REPORT
No options have been granted to Senior Executives since 2007, with all remaining options expiring on 6 November 2014.
The number of rights included in the balance at 30 June 2015 for the Senior Executives is set out below:
Year of grant
2008 2009 2010 2011 2012 2013 2014
Balance as at 30 June
2015
Current Senior Executives
Mike KaneLTI Rights – – 78,717 102,285 666,666 732,456 615,957 2,196,081
Deferred STI Rights – – – – – – 62,382 62,382
Al BormLTI Rights – – 14,582 34,318 34,640 109,242 100,898 293,680
Deferred STI Rights – – – – – – 5,373 5,373
Joseph GossLTI Rights – – – – – 167,763 138,351 306,114
Deferred STI Rights – – – – – – 14,456 14,456
Ross HarperLTI Rights 19,086 18,670 26,319 36,136 36,866 58,114 48,160 243,351
Deferred STI Rights – – – – – – 7,730 7,730
David Mariner LTI Rights – – 11,512 30,236 30,520 57,352 53,089 182,709
Deferred STI Rights – – – – – – 3,631 3,631
Rosaline NgLTI Rights 16,798 16,792 29,519 39,962 40,718 153,509 129,078 426,376
Deferred STI Rights – – – – – – 13,496 13,496
Former Senior Executives
Darren SchulzLTI Rights – – – – – – – –
Deferred STI Rights – – – – – – – –
Section 7: Non-executive Directors’ remuneration The non-executive Directors receive fixed fees only, which includes base fees and Board Committee fees. It is structured on a total fee basis which is paid in the form of cash and superannuation contributions. The Directors do not receive any at risk remuneration or other performance-related incentives such as options or rights to shares, and no retirement benefits are provided to non- executive Directors other than superannuation contributions.
The current aggregate fee limit of $1,750,000 per annum was approved at the Company’s AGM in November 2014.
Non-executive Director fee levels for FY2015 were as follows:
2015 2014
Fees Chair Member Chair Member
Board 417,800 139,100 405,600 135,000
Audit & Risk 38,000 19,500 28,540 14,270
Remuneration & Nomination 28,540 14,270 28,540 14,270
Health, Safety & Environment 28,540 14,270 28,540 14,270
The total annual non-executive Director remuneration for the current Board of seven non-executive Directors for FY2015 was $1,489,623 including superannuation.
A comprehensive review of the level of fees paid to Boral’s non-executive Directors was undertaken during the year, and included a review of market benchmarking information prepared by EY, Boral’s external remuneration consultant. The review considered the elements of size and complexity of the business, time commitments and fees paid for non-executive Directors of companies of a comparable size. As a result of the market review, with effect from 1 July 2015, base and committee fees for non-executive Directors were increased by 2.5%.

Boral Limited Annual Report 2015 63
Non-executive Directors’ total remunerationThe remuneration of the non-executive Directors is set out in the following table.
2015 2014
A$’000s
Short-term Board and
Committee fees
Post-employment
superannuation Total fees
Short-term Board and
Committee fees
Post-employment
superannuation Total fees
Catherine Brennera 157.9 15.0 172.9 164.7 13.8 178.5
Brian Clark 153.1 14.5 167.6 149.7 13.8 163.5
Eileen Doyle 170.9 16.2 187.1 162.8 15.1 177.9
Bob Every, Chairman 399.0 18.8 417.8 387.8 17.8 405.6
Kathryn Faggb 121.8 11.6 133.4 – – –
Richard Longesc 60.4 5.7 66.1 136.6 12.6 149.2
John Marlay 153.1 14.5 167.6 149.7 13.8 163.5
Paul Rayner 161.7 15.4 177.1 149.7 13.8 163.5
Total 1,377.8 111.8 1,489.6 1,301.0 100.7 1,401.7
a. Catherine Brenner received a one-off payment of $15,000 in FY2014 for additional services as Chairman of the Due Diligence Committee that was established by the Board for the formation of the USG Boral Building Products joint venture.
b. Kathryn Fagg was appointed on 15 September 2014.c. Richard Longes retired from the Board on 6 November 2014.
Section 8: Senior Executive and Non-executive Director transactions LoansThere were no loans made or outstanding to Senior Executives or non-executive Directors during FY2015.
Movements in sharesThe number of shares held in Boral Limited during the financial year by each Senior Executive and non-executive Director of Boral Limited, including their personally related entities, are set out below:
Balance at the beginning of the year
Received during the year on the exercise of
options/SARsOther changes during the year
Balance at the end of the year
Number Number Number Number
Current Senior Executives
Mike Kane2015 10,233 – – 10,233
2014 10,100 – 133 10,233
Al Borm2015 – – – –
2014 – – – –
Joseph Goss2015 – – – –
2014 – – – –
Ross Harper 2015 – – – –
David Mariner 2015 – – – –
Rosaline Ng2015 28,586 – – 28,586
2014 28,586 – – 28,586
Former Senior Executives
Darren Schulz2015 – – – –
2014 – – – –

Boral Limited Annual Report 201564
2015 REMUNERATION REPORT
Balance at the beginning of the year
Received during the year on the exercise of
options/SARs
Allocation in Non- executive Directors’
Share Plana
Other changes during the year
Balance at the end of the year
Number Number Number Number Number
Non-executive Directors
Bob Every2015 70,221 – – – 70,221
2014 70,221 – – – 70,221
Catherine Brenner 2015 15,371 – – – 15,371
2014 15,301 – – 70 15,371
Brian Clark2015 76,887 – – – 76,887
2014 75,957 – – 930 76,887
Eileen Doyle2015 15,076 – – – 15,076
2014 15,058 – – 18 15,076
Kathryn Fagg 2015 – – – 26,586 26,586
Richard Longes2015 39,183 – – – 39,183
2014 38,674 – – 509 39,183
John Marlay2015 25,101 – – – 25,101
2014 25,048 – – 53 25,101
Paul Rayner2015 50,116 – – – 50,116
2014 49,747 – – 369 50,116
a. Directors will only be entitled to a transfer of the shares in accordance with the terms and conditions of the plan.
Other transactionsTransactions entered into during the year with non-executive Directors or Senior Executives of Boral Limited and the Group are within normal employee, customer or supplier relationships on terms and conditions no more favourable than dealings in the same circumstances on an arm’s length basis and include:
• the receipt of dividends from Boral Limited;
• participation in the Boral long-term incentive plan;
• terms and conditions of employment;
• reimbursement of expenses;
• purchases of goods and services.
A number of Directors of the Company hold directorships in other entities. Several of these entities transacted with the Group on terms and conditions no more favourable than those available on an arm’s length basis.

Boral Limited Annual Report 2015 65
FinancialStatements
FINANCIAL STATEMENTS

Boral Limited Annual Report 201566
INCOME STATEMENT 67STATEMENT OF COMPREHENSIVE INCOME 68BALANCE SHEET 69STATEMENT OF CHANGES IN EQUITY 70STATEMENT OF CASH FLOWS 71NOTES TO THE FINANCIAL STATEMENTS 1 Significant accounting policies 72 2 Segments 78 3 Profit for the period 80 4 Significant items 82 5 Discontinued operations, assets held for sale
and business disposals 86 6 Income tax expense 89 7 Dividends 90 8 Earnings per share 91 9 Receivables 92 10 Inventories 93 11 Investments accounted for using the equity method 93 12 Property, plant and equipment 95 13 Intangible assets 97 14 Loans and borrowings 98 15 Deferred tax assets and liabilities 100 16 Provisions 102 17 Issued capital 104 18 Reserves 105 19 Contingent liabilities 106 20 Commitments 107 21 Employee benefits 108
22 Financial instruments 110 23 Key management personnel disclosures 118 24 Auditors’ remuneration 119 25 Acquisition/disposal of controlled entities 120 26 Controlled entities 121 27 Related party disclosures 123 28 Notes to Statement of Cash Flows 124 29 Parent entity disclosures 125 30 Deed of cross guarantee 126STATUTORY STATEMENTS 128
EBIT before significant items and net profit after tax before significant items are non-IFRS measures used to provide a greater understanding of the underlying performance of the Group. This information has been extracted or derived from the financial statements. Significant items are detailed in note 4 to the financial statements and relate to income and expenses that are associated with significant business restructuring, impairment or individual transactions.
ContentsBoral Limited and Controlled Entities
FINANCIAL STATEMENTS

Boral Limited Annual Report 2015 67
CONSOLIDATED
For the year ended 30 June Note2015
$ millions2014
$ millions
Continuing operations
Revenue 3 4,297.6 4,325.7
Cost of sales (3,039.2) (3,141.5)
Selling and distribution expenses (767.6) (753.7)
Administrative expenses (270.1) (267.6)
(4,076.9) (4,162.8)
Other income 3 166.3 21.4
Other expenses 3 (103.5) (62.7)
Share of equity accounted income 11 68.7 37.3
Profit before net financing costs and income tax expense 352.2 158.9
Financial income 3 12.8 20.3
Financial expenses 3 (76.5) (84.7)
Net financing costs (63.7) (64.4)
Profit before income tax expense 288.5 94.5
Income tax benefit/(expense) 6 (45.1) 11.6
Profit from continuing operations 243.4 106.1
Discontinued operations
Profit from discontinued operations (net of income tax) 5 13.6 70.1
Net profit 257.0 176.2
Attributable to:
Members of the parent entity 257.0 173.3
Non-controlling interests – 2.9
Net profit 257.0 176.2
Basic earnings per share 8 32.9c 22.2c
Diluted earnings per share 8 32.6c 22.0c
Continuing operations
Basic earnings per share 8 31.2c 14.0c
Diluted earnings per share 8 30.9c 13.9c
The Income Statement should be read in conjunction with the accompanying notes which form an integral part of the financial statements.
Income StatementBoral Limited and Controlled Entities

Boral Limited Annual Report 201568
FINANCIAL STATEMENTS
CONSOLIDATED
For the year ended 30 June Note2015
$ millions2014
$ millions
Net profit 257.0 176.2
Other comprehensive income
Items that may be reclassified subsequently to Income Statement:
Net exchange differences from translation of foreign operations taken to equity
99.7 10.6
Foreign currency translation reserve transferred to net profit on disposal of controlled entities
18 – (146.5)
Fair value adjustment on cash flow hedges 18 8.7 (10.1)
Income tax on items that may be reclassified subsequently to Income Statement
45.1 7.3
Total comprehensive income 410.5 37.5
Total comprehensive income is attributable to:
Members of the parent entity 410.5 34.4
Non-controlling interests – 3.1
Total comprehensive income 410.5 37.5
The Statement of Comprehensive Income should be read in conjunction with the accompanying notes which form an integral part of the financial statements.
Statement of Comprehensive IncomeBoral Limited and Controlled Entities
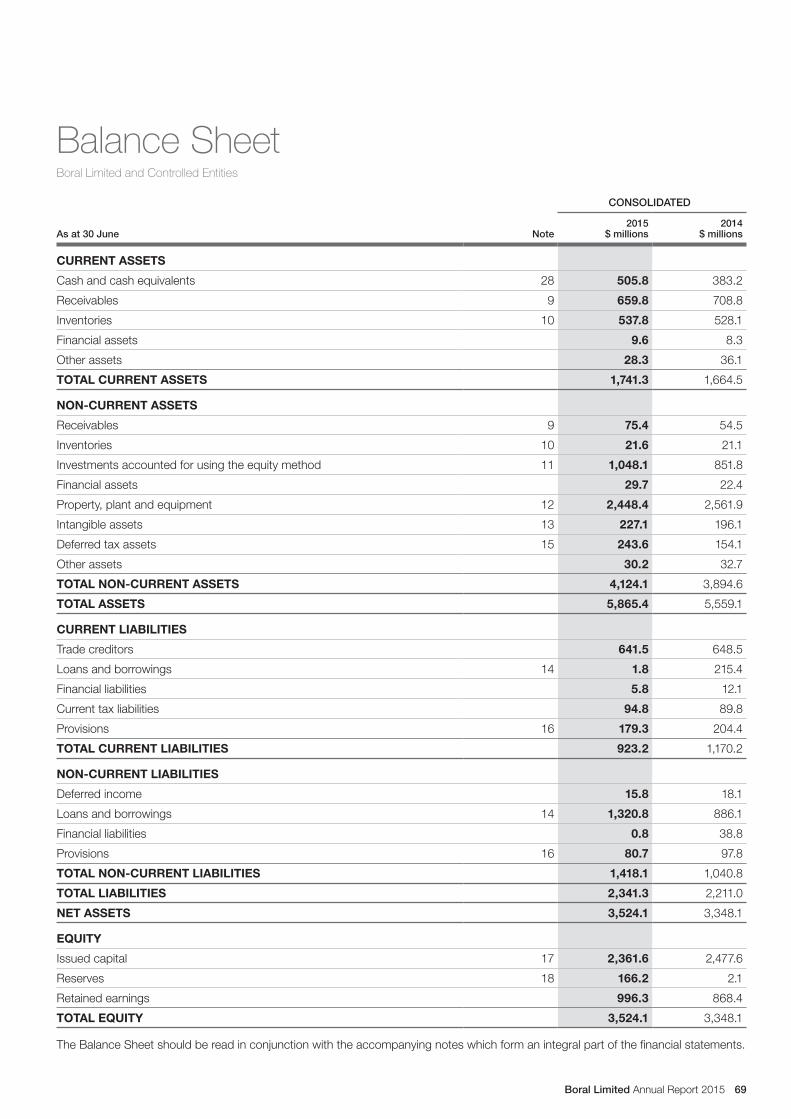
Boral Limited Annual Report 2015 69
CONSOLIDATED
As at 30 June Note2015
$ millions2014
$ millions
CURRENT ASSETS
Cash and cash equivalents 28 505.8 383.2
Receivables 9 659.8 708.8
Inventories 10 537.8 528.1
Financial assets 9.6 8.3
Other assets 28.3 36.1
TOTAL CURRENT ASSETS 1,741.3 1,664.5
NON-CURRENT ASSETS
Receivables 9 75.4 54.5
Inventories 10 21.6 21.1
Investments accounted for using the equity method 11 1,048.1 851.8
Financial assets 29.7 22.4
Property, plant and equipment 12 2,448.4 2,561.9
Intangible assets 13 227.1 196.1
Deferred tax assets 15 243.6 154.1
Other assets 30.2 32.7
TOTAL NON-CURRENT ASSETS 4,124.1 3,894.6
TOTAL ASSETS 5,865.4 5,559.1
CURRENT LIABILITIES
Trade creditors 641.5 648.5
Loans and borrowings 14 1.8 215.4
Financial liabilities 5.8 12.1
Current tax liabilities 94.8 89.8
Provisions 16 179.3 204.4
TOTAL CURRENT LIABILITIES 923.2 1,170.2
NON-CURRENT LIABILITIES
Deferred income 15.8 18.1
Loans and borrowings 14 1,320.8 886.1
Financial liabilities 0.8 38.8
Provisions 16 80.7 97.8
TOTAL NON-CURRENT LIABILITIES 1,418.1 1,040.8
TOTAL LIABILITIES 2,341.3 2,211.0
NET ASSETS 3,524.1 3,348.1
EQUITY
Issued capital 17 2,361.6 2,477.6
Reserves 18 166.2 2.1
Retained earnings 996.3 868.4
TOTAL EQUITY 3,524.1 3,348.1
The Balance Sheet should be read in conjunction with the accompanying notes which form an integral part of the financial statements.
Balance SheetBoral Limited and Controlled Entities

Boral Limited Annual Report 201570
FINANCIAL STATEMENTS
CONSOLIDATED
For the year ended 30 June 2015
Issued capital
$ millionsReserves $ millions
Retained earnings
$ millions
Total parent entity
interest $ millions
Non- controlling
interests $ millions
Total equity $ millions
Balance at 1 July 2014 2,477.6 2.1 868.4 3,348.1 – 3,348.1
Net profit – – 257.0 257.0 – 257.0
Other comprehensive income
Translation of net assets of overseas entities – 259.5 – 259.5 – 259.5
Translation of long-term borrowings and foreign currency forward contracts –
(159.8) – (159.8) – (159.8)
Fair value adjustment on cash flow hedges – 8.7 – 8.7 – 8.7
Income tax relating to other comprehensive income – 45.1 – 45.1 – 45.1
Total comprehensive income – 153.5 257.0 410.5 – 410.5
Transactions with owners in their capacity as owners
On-market share buy-back (116.0) – – (116.0) – (116.0)
Dividends paid – – (129.1) (129.1) – (129.1)
Share-based payments – 10.6 – 10.6 – 10.6
Total transactions with owners in their capacity as owners (116.0) 10.6 (129.1) (234.5) – (234.5)
Balance at 30 June 2015 2,361.6 166.2 996.3 3,524.1 – 3,524.1
CONSOLIDATED
For the year ended 30 June 2014
Issued capital
$ millionsReserves $ millions
Retained earnings
$ millions
Total parent entity
interest $ millions
Non- controlling
interests $ millions
Total equity $ millions
Balance at 1 July 2013 2,433.8 74.4 796.0 3,304.2 89.3 3,393.5
Net profit – – 173.3 173.3 2.9 176.2
Other comprehensive income
Translation of net assets of overseas entities – 24.4 – 24.4 0.2 24.6
Translation of long-term borrowings and foreign currency forward contracts – (14.0) – (14.0) – (14.0)
Foreign currency translation reserve transferred to net profit on disposal of controlled entities – (146.5) – (146.5) – (146.5)
Fair value adjustment on cash flow hedges – (10.1) – (10.1) – (10.1)
Income tax relating to other comprehensive income – 7.3 – 7.3 – 7.3
Total comprehensive income/(loss) – (138.9) 173.3 34.4 3.1 37.5
Transactions with owners in their capacity as owners
Shares issued under the Dividend Reinvestment Plan 43.8 – – 43.8 – 43.8
Dividends paid – – (100.9) (100.9) (6.9) (107.8)
Other – Cultured Stone – 59.4 – 59.4 (59.4) –
Share-based payments – 7.2 – 7.2 – 7.2
Non-controlling interests disposed – – – – (28.2) (28.2)
Contributions by non-controlling interests – – – – 2.1 2.1
Total transactions with owners in their capacity as owners 43.8 66.6 (100.9) 9.5 (92.4) (82.9)
Balance at 30 June 2014 2,477.6 2.1 868.4 3,348.1 – 3,348.1
The Statement of Changes in Equity should be read in conjunction with the accompanying notes which form an integral part of the financial statements.
Statement of Changes in EquityBoral Limited and Controlled Entities
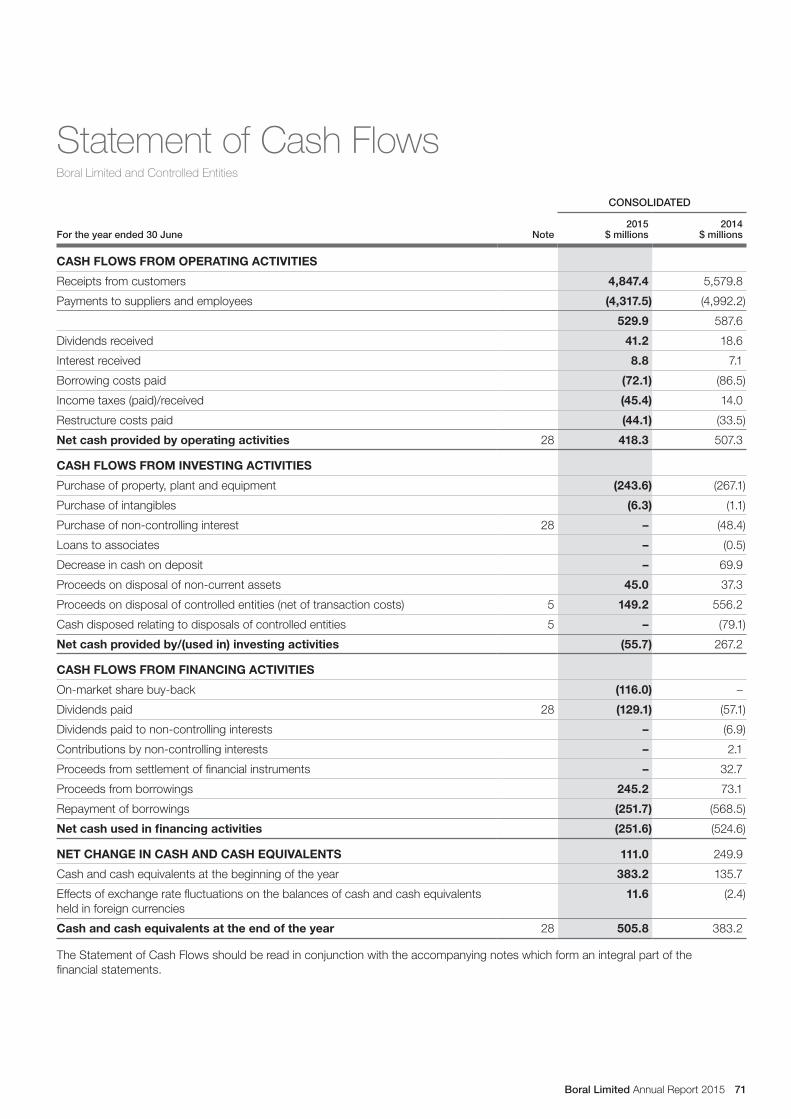
Boral Limited Annual Report 2015 71
CONSOLIDATED
For the year ended 30 June Note2015
$ millions2014
$ millions
CASH FLOWS FROM OPERATING ACTIVITIES
Receipts from customers 4,847.4 5,579.8
Payments to suppliers and employees (4,317.5) (4,992.2)
529.9 587.6
Dividends received 41.2 18.6
Interest received 8.8 7.1
Borrowing costs paid (72.1) (86.5)
Income taxes (paid)/received (45.4) 14.0
Restructure costs paid (44.1) (33.5)
Net cash provided by operating activities 28 418.3 507.3
CASH FLOWS FROM INVESTING ACTIVITIES
Purchase of property, plant and equipment (243.6) (267.1)
Purchase of intangibles (6.3) (1.1)
Purchase of non-controlling interest 28 – (48.4)
Loans to associates – (0.5)
Decrease in cash on deposit – 69.9
Proceeds on disposal of non-current assets 45.0 37.3
Proceeds on disposal of controlled entities (net of transaction costs) 5 149.2 556.2
Cash disposed relating to disposals of controlled entities 5 – (79.1)
Net cash provided by/(used in) investing activities (55.7) 267.2
CASH FLOWS FROM FINANCING ACTIVITIES
On-market share buy-back (116.0) –
Dividends paid 28 (129.1) (57.1)
Dividends paid to non-controlling interests – (6.9)
Contributions by non-controlling interests – 2.1
Proceeds from settlement of financial instruments – 32.7
Proceeds from borrowings 245.2 73.1
Repayment of borrowings (251.7) (568.5)
Net cash used in financing activities (251.6) (524.6)
NET CHANGE IN CASH AND CASH EQUIVALENTS 111.0 249.9
Cash and cash equivalents at the beginning of the year 383.2 135.7
Effects of exchange rate fluctuations on the balances of cash and cash equivalents held in foreign currencies
11.6 (2.4)
Cash and cash equivalents at the end of the year 28 505.8 383.2
The Statement of Cash Flows should be read in conjunction with the accompanying notes which form an integral part of the financial statements.
Statement of Cash FlowsBoral Limited and Controlled Entities
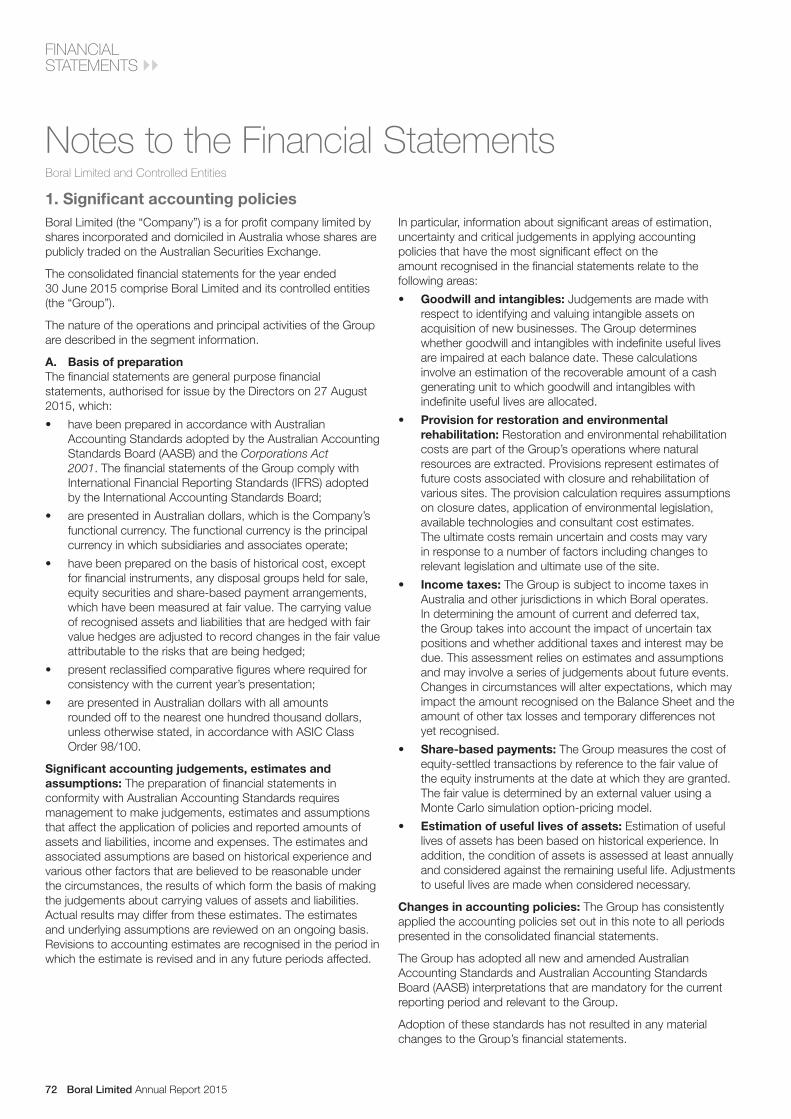
Boral Limited Annual Report 201572
FINANCIAL STATEMENTS
1. Significant accounting policiesBoral Limited (the “Company”) is a for profit company limited by shares incorporated and domiciled in Australia whose shares are publicly traded on the Australian Securities Exchange.
The consolidated financial statements for the year ended 30 June 2015 comprise Boral Limited and its controlled entities (the “Group”).
The nature of the operations and principal activities of the Group are described in the segment information.
A. Basis of preparationThe financial statements are general purpose financial statements, authorised for issue by the Directors on 27 August 2015, which:
• have been prepared in accordance with Australian Accounting Standards adopted by the Australian Accounting Standards Board (AASB) and the Corporations Act 2001. The financial statements of the Group comply with International Financial Reporting Standards (IFRS) adopted by the International Accounting Standards Board;
• are presented in Australian dollars, which is the Company’s functional currency. The functional currency is the principal currency in which subsidiaries and associates operate;
• have been prepared on the basis of historical cost, except for financial instruments, any disposal groups held for sale, equity securities and share-based payment arrangements, which have been measured at fair value. The carrying value of recognised assets and liabilities that are hedged with fair value hedges are adjusted to record changes in the fair value attributable to the risks that are being hedged;
• present reclassified comparative figures where required for consistency with the current year’s presentation;
• are presented in Australian dollars with all amounts rounded off to the nearest one hundred thousand dollars, unless otherwise stated, in accordance with ASIC Class Order 98/100.
Significant accounting judgements, estimates and assumptions: The preparation of financial statements in conformity with Australian Accounting Standards requires management to make judgements, estimates and assumptions that affect the application of policies and reported amounts of assets and liabilities, income and expenses. The estimates and associated assumptions are based on historical experience and various other factors that are believed to be reasonable under the circumstances, the results of which form the basis of making the judgements about carrying values of assets and liabilities. Actual results may differ from these estimates. The estimates and underlying assumptions are reviewed on an ongoing basis. Revisions to accounting estimates are recognised in the period in which the estimate is revised and in any future periods affected.
In particular, information about significant areas of estimation, uncertainty and critical judgements in applying accounting policies that have the most significant effect on the amount recognised in the financial statements relate to the following areas:
• Goodwill and intangibles: Judgements are made with respect to identifying and valuing intangible assets on acquisition of new businesses. The Group determines whether goodwill and intangibles with indefinite useful lives are impaired at each balance date. These calculations involve an estimation of the recoverable amount of a cash generating unit to which goodwill and intangibles with indefinite useful lives are allocated.
• Provision for restoration and environmental rehabilitation: Restoration and environmental rehabilitation costs are part of the Group’s operations where natural resources are extracted. Provisions represent estimates of future costs associated with closure and rehabilitation of various sites. The provision calculation requires assumptions on closure dates, application of environmental legislation, available technologies and consultant cost estimates. The ultimate costs remain uncertain and costs may vary in response to a number of factors including changes to relevant legislation and ultimate use of the site.
• Income taxes: The Group is subject to income taxes in Australia and other jurisdictions in which Boral operates. In determining the amount of current and deferred tax, the Group takes into account the impact of uncertain tax positions and whether additional taxes and interest may be due. This assessment relies on estimates and assumptions and may involve a series of judgements about future events. Changes in circumstances will alter expectations, which may impact the amount recognised on the Balance Sheet and the amount of other tax losses and temporary differences not yet recognised.
• Share-based payments: The Group measures the cost of equity-settled transactions by reference to the fair value of the equity instruments at the date at which they are granted. The fair value is determined by an external valuer using a Monte Carlo simulation option-pricing model.
• Estimation of useful lives of assets: Estimation of useful lives of assets has been based on historical experience. In addition, the condition of assets is assessed at least annually and considered against the remaining useful life. Adjustments to useful lives are made when considered necessary.
Changes in accounting policies: The Group has consistently applied the accounting policies set out in this note to all periods presented in the consolidated financial statements.
The Group has adopted all new and amended Australian Accounting Standards and Australian Accounting Standards Board (AASB) interpretations that are mandatory for the current reporting period and relevant to the Group.
Adoption of these standards has not resulted in any material changes to the Group’s financial statements.
Notes to the Financial StatementsBoral Limited and Controlled Entities

Boral Limited Annual Report 2015 73
1. Significant accounting policies (continued)New accounting standards and interpretations not yet adopted: The Group has not adopted the following new accounting standards which are available for early adoption for periods beginning after 1 July 2014:
• AASB 9 Financial Instruments
• AASB 15 Revenue from Contracts with Customers
The impact of these changes is still being fully assessed; however, initial assessments indicate that there would be no significant impact on the Group’s financial statements.
B. Principles of consolidationSubsidiaries: Subsidiaries are entities controlled by the Group. Control exists when the Group is exposed to, or has rights to, variable returns from its involvement with the entity and has the ability to affect those returns through its power to direct the activities of the entity. Subsidiaries are consolidated from the date that control commences until the date that control ceases.
Interests in equity-accounted entities: The Group’s interests in equity-accounted entities comprise interests in associates and joint ventures.
Associates are those entities in which the Group has significant influence, but not control or joint control, over the financial and operating policies. A joint venture is an arrangement in which the Group has joint control, whereby the Group has rights to the net assets of the arrangement, rather than rights to its assets and obligations for its liabilities.
Interests in associates and joint ventures are accounted for using the equity method. They are recognised initially at cost, which includes transaction costs. Subsequent to initial recognition, the consolidated financial statements include the Group’s share of the profit or loss and non-controlling interest of equity-accounted entities, until the date on which significant influence or joint control ceases.
Joint operations: The Group recognises its direct right to the assets, liabilities, revenues and expenses of joint operations and its share of any jointly held or incurred assets, liabilities, revenues and expenses.
Transactions eliminated on consolidation: Intragroup balances and transactions, and any unrealised gains and losses arising from intragroup transactions, are eliminated in preparing the consolidated financial statements. Unrealised gains arising from transactions with associates and jointly controlled entities are eliminated to the extent of the Group’s interest in the entity. Unrealised losses arising from transactions with associates are eliminated in the same way as unrealised gains, but only to the extent that there is no evidence of impairment.
Business combinations: The acquisition method of accounting is used to account for all business combinations.
The consideration transferred for the acquisition of a subsidiary or business comprises the fair values of the assets transferred, the liabilities incurred and the equity interests issued by the Group. The consideration transferred also includes the fair value of any asset or liability resulting from a contingent consideration arrangement and the fair value of any pre-existing equity interest in the subsidiary.
Acquisition related costs are expensed as incurred. Identifiable assets acquired and liabilities and contingent liabilities assumed in a business combination are initially measured at their fair values at the acquisition date.
On an acquisition-by-acquisition basis the Group recognises any non-controlling interest in the acquiree either at fair value or at the non-controlling interest’s proportionate share of the acquiree’s net identifiable assets.
The excess of consideration transferred, the amount of any non-controlling interest in the acquiree and the acquisition date fair value of any previous equity interest in the acquiree over the fair value of the Group’s share of the net identifiable assets acquired is recorded as goodwill. Where the excess is negative, a bargain purchase gain is recognised immediately in the Income Statement.
Where settlement of any part of cash consideration is deferred, the amounts payable in the future are discounted to their present value as at the date of exchange. The discount rate used is the entity’s incremental borrowing rate.
Contingent consideration is classified either as equity or a financial liability. Amounts classified as a financial liability are subsequently remeasured to fair value with changes in fair value recognised in the Income Statement.
C. Revenue recognitionRevenue is recognised at fair value of the consideration received net of the amount of goods and services tax (GST).
Sale of goods revenue: Sale of goods revenue is recognised (net of returns, discounts and allowances) when the significant risks and rewards of ownership have been transferred to the buyer, which is the date goods are delivered to the customer.
Rendering of services revenue: Revenue from rendering services is recognised in proportion to the stage of completion of the contract when the stage of contract completion can be reliably measured. An expected loss is recognised immediately as an expense.
Land development projects: Revenue from the sale of land development projects is recognised when all of the following conditions have been met: contracts are exchanged; a significant non-refundable deposit is received; and material conditions contained within the contract are met.
Dividends: Revenue from dividends from other investments is recognised once the right to receive payment is established.

Boral Limited Annual Report 201574
FINANCIAL STATEMENTS
1. Significant accounting policies (continued)D. Government grantsGrants from the government are recognised at their fair value where there is reasonable assurance that the grant will be received and the Group will comply with all attached conditions.
Government grants relating to the purchase of property, plant and equipment are included in non-current liabilities as deferred income and are credited to the Income Statement on a straight-line basis over the expected lives of the related assets.
E. Income taxIncome tax disclosed in the Income Statement comprises current and deferred tax. Income tax is recognised in the Income Statement except to the extent that it relates to items recognised directly in equity, in which case it is recognised in equity.
Current tax is the expected tax payable on the taxable income for the year, using tax rates enacted or substantively enacted at the balance sheet date, and any adjustments to tax payable in respect of previous years.
Deferred tax is provided using the balance sheet liability method, providing for temporary differences between the carrying amounts of assets and liabilities for financial reporting purposes and the amounts used for taxation purposes. The following temporary differences are not provided for: goodwill not deductible for tax purposes, the initial recognition of assets or liabilities that affect neither accounting nor taxable profits and differences relating to investments in subsidiaries to the extent that they will probably not reverse in the foreseeable future. The amount of deferred tax provided is based on the expected manner of realisation or settlement of the carrying amount of assets and liabilities, using tax rates enacted or substantively enacted at the balance sheet date.
A deferred tax asset is recognised only to the extent that it is probable that future taxable profits will be available against which the asset can be utilised. Deferred tax assets are reduced to the extent that it is no longer probable that the related tax benefit will be realised.
Tax consolidation: Boral Limited and its wholly owned Australian controlled entities have elected to enter into tax consolidation effective 1 July 2002. As a consequence, all members of the tax consolidated group are taxed as a single entity. The head entity is Boral Limited.
F. Goods and services taxRevenues, expenses and assets are recognised net of goods and services tax (GST), except where the GST incurred is not recoverable from the Australian Taxation Office (ATO). In these circumstances, the GST is recognised as part of the cost of acquisition of the asset or as part of the expense.
Receivables and payables are stated with the amount of GST included. The net GST recoverable from, or payable to, the ATO is included as a current asset or liability in the Balance Sheet.
Cash flows are included in the Statement of Cash Flows on a gross basis. The GST components of cash flows arising from investing and financing activities which are recoverable from, or payable to, the ATO are classified as operating cash flows.
G. Net financing costsFinancing costs include interest payable on borrowings calculated using the effective interest rate method, finance charges in respect of finance leases, exchange differences arising from foreign currency borrowings to the extent that they are regarded as an adjustment to interest costs and differences relating to the unwinding of the discount of assets and liabilities measured at amortised cost.
Financing costs are recognised as an expense in the period in which they are incurred, unless they relate to a qualifying asset. Financing costs incurred for the construction of any qualifying asset are capitalised during the period of time that is required to complete and prepare the asset for its intended use or sale.
Financial income is recognised as it accrues taking into account the effective yield on the financial asset.
H. Foreign currenciesTransactions: Transactions in foreign currencies are translated at the foreign exchange rate ruling at the date of the transaction. Monetary assets and liabilities denominated in foreign currencies at the balance sheet date are translated to Australian dollars at the foreign exchange rate ruling at that date. Foreign exchange differences arising on translation are recognised in the Income Statement. Non-monetary assets and liabilities that are measured in terms of historical cost in a foreign currency are translated using the exchange rate at the date of the transaction.
Translation: The financial statements of foreign operations are translated to Australian dollars as follows:
• assets (including goodwill) and liabilities for each balance sheet are translated at the closing rate at the date of that balance sheet;
• all resulting exchange differences are recognised as a separate component of equity (foreign currency translation reserve); and
• income and expenses for each Income Statement are translated at average exchange rates approximating the rates prevailing on the transaction dates.
On consolidation, exchange differences arising from the translation of any net investment in foreign entities, and of borrowings and other currency instruments designated as hedges of such investments, are taken to the foreign currency translation reserve. When a foreign operation is sold, a proportionate share of such exchange differences are recognised in the Income Statement as part of the gain or loss on sale.
I. ReceivablesTrade receivables are recognised initially at fair value and subsequently measured at amortised cost, less allowance for impairment. See note 9 for a description of the Group’s allowance for impairment policy on Trade receivables.
Notes to the Financial StatementsBoral Limited and Controlled Entities

Boral Limited Annual Report 2015 75
1. Significant accounting policies (continued)J. InventoriesInventories and work in progress are valued at the lower of cost (including materials, labour and appropriate overheads) and net realisable value. Cost is determined predominantly on the first-in-first-out basis of valuation. Net realisable value is determined on the basis of each entity’s normal selling pattern. Expenses of marketing, selling and distribution to customers are estimated and are deducted to establish net realisable value.
Land development projects: Land development projects are stated at the lower of cost and net realisable value. Cost includes the cost of acquisition, development and holding costs during development. Costs incurred after completion of development are expensed as incurred.
K. Non-current assets held for sale and discontinued operations
Non-current assets are classified as held for sale and stated at the lower of their carrying amount and fair value less costs to sell if their carrying amount will be recovered principally through a sale transaction rather than through continuing use. An impairment loss is recognised for any initial or subsequent write-down of the asset to fair value less costs to sell. A gain is recognised for any subsequent increase in fair value less costs to sell of an asset, but not in excess of any cumulative impairment loss.
Non-current assets are not depreciated or amortised while they are classified as held for sale.
A discontinued operation is a component of the entity that has been disposed of or is classified as held for sale and that represents a separate major line of business or geographical area of operations, is part of a single coordinated plan to dispose of such a line of business or area of operations, or is a subsidiary acquired exclusively with a view to resale. The results of discontinued operations are presented separately on the face of the Income Statement.
L. ImpairmentThe carrying value of the Group’s assets, other than inventories and deferred tax assets, are reviewed at each balance sheet date to determine whether there is any indication of impairment. If any such indication exists, the asset’s recoverable amount is estimated. For goodwill, the recoverable amount is assessed at each balance date.
An impairment loss is recognised whenever the carrying amount of an asset or its cash generating unit exceeds its recoverable amount. Impairment losses are recognised in the Income Statement, unless the asset has previously been revalued, in which case the impairment loss is recognised as a reversal to the extent of that previous revaluation with any excess recognised through the Income Statement. Impairment losses recognised in respect of cash generating units are allocated first to reduce the carrying amount of any goodwill allocated to the cash generating units (group of units) and then, to reduce the carrying amount of the other assets in the unit (group of units) on a pro rata basis.
The recoverable amount of other assets is the greater of their fair value less costs to sell and value in use. In assessing value in use, the estimated future cash flows are discounted to their present value of money using a pre-tax discount rate that reflects current market assessments of the time value of money and the risks specific to the asset. For an asset that does not generate largely independent cash inflows, the recoverable amount is determined for the cash generating unit to which the asset belongs.
In respect of assets valued at fair value less costs to sell, the assets are valued based on indicative offers.
Reversals of impairment: An impairment loss in respect of goodwill is not reversed. In respect of other assets, an impairment loss is reversed if there is an indication that the impairment loss may no longer exist and there has been a change in the estimates used to determine the recoverable amount.
An impairment loss is reversed only to the extent of the asset’s carrying amount net of depreciation or amortisation, as if no impairment loss has been recognised.
M. Intangible assetsGoodwill: Goodwill represents the difference between the cost of the acquisition and the fair value of the net identifiable assets acquired.
Goodwill is stated at cost less any accumulated impairment losses. Goodwill is allocated to cash generating units and is not amortised but is tested annually for impairment. In respect of associates, the carrying amount of goodwill is included in the carrying amount of the investment in the associate.
Negative goodwill arising on an acquisition is recognised directly in the Income Statement.
Other intangible assets: Other intangible assets that are acquired by the Group are stated at cost less accumulated amortisation and impairment losses.
The amortisation methods and rates used by the Group are disclosed in note 13.
N. Property, plant and equipmentOwned assets: Items of property, plant and equipment are stated at cost or deemed cost less accumulated depreciation and impairment losses. The cost of self-constructed assets includes the cost of materials, direct labour and an appropriate proportion of production overheads. Assessment of impairment loss is made in accordance with the impairment policy.
The cost of property, plant and equipment includes the cost of decommissioning and restoration costs at the end of their economic lives if a present legal or constructive obligation exists.
When an item of property, plant and equipment comprises major components having different useful lives, they are accounted for as separate items of property, plant and equipment.
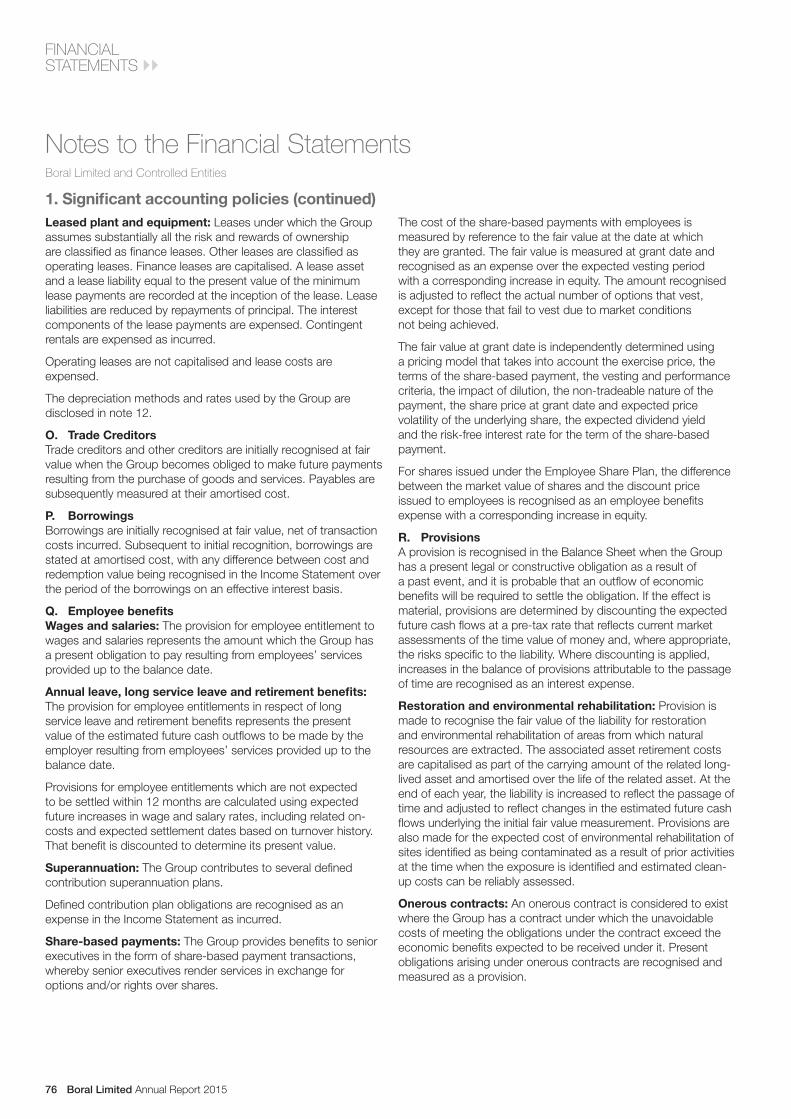
Boral Limited Annual Report 201576
FINANCIAL STATEMENTS
1. Significant accounting policies (continued)Leased plant and equipment: Leases under which the Group assumes substantially all the risk and rewards of ownership are classified as finance leases. Other leases are classified as operating leases. Finance leases are capitalised. A lease asset and a lease liability equal to the present value of the minimum lease payments are recorded at the inception of the lease. Lease liabilities are reduced by repayments of principal. The interest components of the lease payments are expensed. Contingent rentals are expensed as incurred.
Operating leases are not capitalised and lease costs are expensed.
The depreciation methods and rates used by the Group are disclosed in note 12.
O. Trade CreditorsTrade creditors and other creditors are initially recognised at fair value when the Group becomes obliged to make future payments resulting from the purchase of goods and services. Payables are subsequently measured at their amortised cost.
P. BorrowingsBorrowings are initially recognised at fair value, net of transaction costs incurred. Subsequent to initial recognition, borrowings are stated at amortised cost, with any difference between cost and redemption value being recognised in the Income Statement over the period of the borrowings on an effective interest basis.
Q. Employee benefitsWages and salaries: The provision for employee entitlement to wages and salaries represents the amount which the Group has a present obligation to pay resulting from employees’ services provided up to the balance date.
Annual leave, long service leave and retirement benefits: The provision for employee entitlements in respect of long service leave and retirement benefits represents the present value of the estimated future cash outflows to be made by the employer resulting from employees’ services provided up to the balance date.
Provisions for employee entitlements which are not expected to be settled within 12 months are calculated using expected future increases in wage and salary rates, including related on-costs and expected settlement dates based on turnover history. That benefit is discounted to determine its present value.
Superannuation: The Group contributes to several defined contribution superannuation plans.
Defined contribution plan obligations are recognised as an expense in the Income Statement as incurred.
Share-based payments: The Group provides benefits to senior executives in the form of share-based payment transactions, whereby senior executives render services in exchange for options and/or rights over shares.
The cost of the share-based payments with employees is measured by reference to the fair value at the date at which they are granted. The fair value is measured at grant date and recognised as an expense over the expected vesting period with a corresponding increase in equity. The amount recognised is adjusted to reflect the actual number of options that vest, except for those that fail to vest due to market conditions not being achieved.
The fair value at grant date is independently determined using a pricing model that takes into account the exercise price, the terms of the share-based payment, the vesting and performance criteria, the impact of dilution, the non-tradeable nature of the payment, the share price at grant date and expected price volatility of the underlying share, the expected dividend yield and the risk-free interest rate for the term of the share-based payment.
For shares issued under the Employee Share Plan, the difference between the market value of shares and the discount price issued to employees is recognised as an employee benefits expense with a corresponding increase in equity.
R. ProvisionsA provision is recognised in the Balance Sheet when the Group has a present legal or constructive obligation as a result of a past event, and it is probable that an outflow of economic benefits will be required to settle the obligation. If the effect is material, provisions are determined by discounting the expected future cash flows at a pre-tax rate that reflects current market assessments of the time value of money and, where appropriate, the risks specific to the liability. Where discounting is applied, increases in the balance of provisions attributable to the passage of time are recognised as an interest expense.
Restoration and environmental rehabilitation: Provision is made to recognise the fair value of the liability for restoration and environmental rehabilitation of areas from which natural resources are extracted. The associated asset retirement costs are capitalised as part of the carrying amount of the related long-lived asset and amortised over the life of the related asset. At the end of each year, the liability is increased to reflect the passage of time and adjusted to reflect changes in the estimated future cash flows underlying the initial fair value measurement. Provisions are also made for the expected cost of environmental rehabilitation of sites identified as being contaminated as a result of prior activities at the time when the exposure is identified and estimated clean-up costs can be reliably assessed.
Onerous contracts: An onerous contract is considered to exist where the Group has a contract under which the unavoidable costs of meeting the obligations under the contract exceed the economic benefits expected to be received under it. Present obligations arising under onerous contracts are recognised and measured as a provision.
Notes to the Financial StatementsBoral Limited and Controlled Entities

Boral Limited Annual Report 2015 77
1. Significant accounting policies (continued)S. Derivative financial instrumentsThe Group is exposed to changes in interest rates, foreign exchange rates and commodity prices from its activities. The Group uses the following derivative financial instruments to hedge these risks: interest rate swaps, forward rate agreements, interest rate options, forward foreign exchange contracts and futures commodity fixed price swap contracts.
The Group does not enter into derivative financial instrument transactions for trading purposes. However, financial instruments entered into to hedge an underlying exposure which does not qualify for hedge accounting are accounted for as trading instruments.
Derivatives are initially recognised at fair value on the date a derivative contract is entered into and are subsequently remeasured to their fair value. The method of recognising the resulting gain or loss depends on whether the derivative is designated as a hedging instrument, and if so, the nature of the item being hedged. The Group designates certain derivatives as either; hedges of the fair value of recognised assets or liabilities or a firm commitment (fair value hedge), hedges of highly probable forecast transactions (cash flow hedge), and hedges of net investment in foreign operations.
The Group documents at the inception of the transaction the relationship between hedging instruments and hedged items, as well as its risk management objective and strategy for undertaking various hedge transactions. The Group also documents its assessment, both at hedge inception and on an ongoing basis, of whether the derivatives that are used in hedging transactions have been and will continue to be highly effective in offsetting changes in fair values of cash flows or hedged items.
Fair value hedge: Changes in the fair value of derivatives that are designated and qualify as fair value hedges are recorded in the Income Statement, together with any changes in the fair value of the hedged asset or liability that are attributable to the hedged risk.
Cash flow hedge: The effective portion of changes in the fair value of derivatives that are designated and qualify as cash flow hedges is recognised in equity in the hedging reserve. The gain or loss relating to the ineffective portion is recognised immediately in the Income Statement.
Amounts accumulated in equity are recycled in the Income Statement in the periods when the hedged item will affect profit or loss. However, when the forecast transaction that is hedged results in the recognition of a non-financial asset or a non-financial liability, the gains and losses previously deferred in equity are transferred from equity and included in the measurement of the initial cost and carrying amount of the asset or liability.
When a hedging instrument expires or is sold or terminated, or when a hedge no longer meets the criteria for hedge accounting, any cumulative gain or loss existing in equity at that time remains in equity and is recognised when the forecast transaction is ultimately recognised in the Income Statement. When a forecast transaction is no longer expected to occur, the cumulative gain or loss that was reported in equity is immediately transferred to the Income Statement.
Hedge of net investment in a foreign operation: The portion of the gain or loss on an instrument used to hedge a net investment in a foreign operation that is determined to be an effective hedge is recognised directly in equity. The ineffective portion is recognised immediately in the Income Statement.
Derivatives that do not qualify for hedge accounting: Certain derivative instruments do not qualify for hedge accounting. Changes in the fair value of any derivative instrument that does not qualify for hedge accounting are recognised immediately in the Income Statement.

Boral Limited Annual Report 201578
FINANCIAL STATEMENTS
2. SegmentsOperating segments are based on internal reporting to the Chief Executive Officer in assessing performance and determining the allocation of resources.
The following summary describes the operations of the Group’s reportable segments:
Construction Materials & Cement – Quarries, concrete, asphalt, transport, landfill, property, cement and concrete placing.
Building Products* – Australian bricks (comprising West Coast bricks, East Coast bricks up to 30 April 2015 and Boral CSR bricks joint venture from 1 May 2015), roofing and masonry, and timber products.
Boral Gypsum* – Australian and Asian plasterboard (100% interest).
Boral Gypsum Joint Venture – 50/50 joint venture between USG Corporation and Boral Limited responsible for the manufacture and sale of plasterboard and associated products.
Boral USA – Bricks, cultured stone, trim, roof tiles, fly ash, concrete and quarries.
Discontinued Operations – None (2014: Windows).
Unallocated – Non-trading operations and unallocated corporate costs.
* The results of the East Coast bricks operations for the current and prior year comparative periods and the Boral Gypsum operations for the prior year comparative period are shown as part of “Discontinued Operations” in the Income Statement.
During financial year ended 2014, the Group entered into an agreement with USG Corporation to combine its Australian and Asian Gypsum entities with USG Corporation’s Asian and Middle East entities and technology into two 50/50 owned joint ventures.
For the period 1 July 2013 to 28 February 2014, the Group held 100% interest in Boral Gypsum, and the results were consolidated into the Group’s financial report and have been shown in the Boral Gypsum segment.
From 1 March 2014, the Group deconsolidated its existing Australian and Asian subsidiaries, and recognised an equity accounted investment in respect of its 50% shareholding in the newly formed joint ventures. The newly formed joint ventures consist of Boral’s Gypsum division and USG’s Asian and Middle Eastern businesses and technology. The results from this date have been equity accounted and have been shown in the Boral Gypsum Joint Venture segment. Refer to note 11 of the financial statements.
The major end use markets for Boral’s products include residential and non-residential construction and the engineering and infrastructure markets.
Inter-segment pricing is determined on an arm’s length basis.
The Group has a large number of customers to which it provides products, with no single customer responsible for more than 10% of the Group’s revenue.
Segment results, assets and liabilities include items directly attributable to a segment as well as those that can be allocated on a reasonable basis.
CONSOLIDATED
Reconciliations of reportable segment revenues and profits Note2015
$ millions2014
$ millions
External revenue 4,414.7 5,203.9
Less: Revenue from discontinued operations 5 (117.1) (878.2)
Revenue from continuing operations 4,297.6 4,325.7
Profit before tax
Profit before net financing costs and income tax expense from reportable segments 358.6 251.3
Profit before net financing costs and income tax expense fromdiscontinued operations
5 (6.4) (92.4)
Profit before net financing costs and income tax expense from continuing operations 352.2 158.9
Net financing costs from continuing operations (63.7) (64.4)
Profit before tax from continuing operations 288.5 94.5
Notes to the Financial StatementsBoral Limited and Controlled Entities

Boral Limited Annual Report 2015 79
2. Segments (continued)TOTAL REVENUE INTERNAL REVENUE EXTERNAL REVENUE
2015 $ millions
2014 $ millions
2015 $ millions
2014 $ millions
2015 $ millions
2014 $ millions
Construction Materials & Cement 3,110.9 3,310.4 20.2 23.3 3,090.7 3,287.1
Building Products* 485.4 488.0 – 0.9 485.4 487.1
Boral Gypsum* – 691.3 – – – 691.3
Boral USA 840.1 681.7 1.5 0.8 838.6 680.9
Discontinued Operations – 57.5 – – – 57.5
4,436.4 5,228.9 21.7 25.0 4,414.7 5,203.9
OPERATING PROFIT(EXC EQUITY
ACCOUNTED INCOME)EQUITY ACCOUNTED
INCOME
PROFIT BEFORE NETFINANCING COSTS ANDINCOME TAX EXPENSE
2015 $ millions
2014 $ millions
2015 $ millions
2014 $ millions
2015 $ millions
2014 $ millions
Construction Materials & Cement 276.2 245.3 25.2 31.3 301.4 276.6
Building Products* 28.0 8.2 1.5 – 29.5 8.2
Boral Gypsum* – 61.5 – 5.9 – 67.4
Boral Gypsum Joint Venture – – 48.7 10.1 48.7 10.1
Boral USA 6.2 (38.3) (0.3) (0.3) 5.9 (38.6)
Discontinued Operations – (0.5) – – – (0.5)
Unallocated (28.8) (29.0) – – (28.8) (29.0)
281.6 247.2 75.1 47.0 356.7 294.2
Significant items (refer to note 4) 8.3 (39.1) (6.4) (3.8) 1.9 (42.9)
289.9 208.1 68.7 43.2 358.6 251.3
SEGMENT ASSETS(EXC EQUITY ACCOUNTED
INVESTMENTS)EQUITY ACCOUNTED
INVESTMENTS TOTAL ASSETS
2015 $ millions
2014 $ millions
2015 $ millions
2014 $ millions
2015 $ millions
2014 $ millions
Construction Materials & Cement 2,629.9 2,762.6 13.7 19.0 2,643.6 2,781.6
Building Products* 321.0 515.1 83.9 – 404.9 515.1
Boral Gypsum Joint Venture – – 950.5 832.8 950.5 832.8
Boral USA 1,010.6 813.3 – – 1,010.6 813.3
Unallocated 106.4 79.0 – – 106.4 79.0
4,067.9 4,170.0 1,048.1 851.8 5,116.0 5,021.8
Cash and cash equivalents 505.8 383.2 – – 505.8 383.2
Tax assets 243.6 154.1 – – 243.6 154.1
4,817.3 4,707.3 1,048.1 851.8 5,865.4 5,559.1
* The results of the East Coast Bricks operations for the current and prior year comparative periods and the Boral Gypsum operations for the prior year comparative period are shown as part of “Discontinued Operations” in the Income Statement.

Boral Limited Annual Report 201580
FINANCIAL STATEMENTS
2. Segments (continued)
LIABILITIESACQUISITION OF
SEGMENT ASSETS**DEPRECIATION AND
AMORTISATION
2015 $ millions
2014 $ millions
2015 $ millions
2014 $ millions
2015 $ millions
2014 $ millions
Construction Materials & Cement 557.9 610.0 189.1 211.9 183.9 168.2
Building Products* 76.7 106.2 13.9 13.9 20.2 21.1
Boral Gypsum* – – – 10.2 – 29.1
Boral USA 183.7 149.0 45.9 29.5 44.3 41.7
Discontinued Operations – – – 0.5 – 0.6
Unallocated 105.6 154.5 1.0 2.2 0.4 0.7
923.9 1,019.7 249.9 268.2 248.8 261.4
Loans and borrowings 1,322.6 1,101.5 – – – –
Tax liabilities 94.8 89.8 – – – –
2,341.3 2,211.0 249.9 268.2 248.8 261.4
* The results of the East Coast Bricks operations for the current and prior year comparative periods and the Boral Gypsum operations for the prior year comparative period are shown as part of “Discontinued Operations” in the Income Statement.
** Excludes amounts attributable to the acquisition of controlled entities and businesses.
Geographical informationFor the year ended 30 June 2015, the Group’s trading revenue from external customers in Australia amounted to $3,576.1 million (2014: $4,010.5 million), with nil (2014: $455.0 million) from the Plasterboard Asia operations, $838.6 million (2014: $680.9 million) relating to operations in the USA and nil (2014: $57.5 million) relating to other operations. The Group’s non-current assets (excluding deferred tax assets and other financial assets) in Australia amounted to $2,509.3 million (2014: $2,602.3 million), with $646.5 million (2014: $537.9 million) in Asia and $695.0 million (2014: $577.9 million) in the USA.
In presenting information on a geographical basis, segment revenues are based on the geographical location of customers, while segment assets are based on the geographical location of assets.
3. Profit for the periodCONSOLIDATED
For the year ended 30 June Note2015
$ millions2014
$ millions
REVENUE FROM CONTINUING OPERATIONS
Sale of goods 4,217.0 4,237.4
Rendering of services 80.6 88.3
Revenue from continuing operations 4,297.6 4,325.7
OTHER INCOME FROM CONTINUING OPERATIONS
Significant items 4 116.7 –
Net profit on sale of assets 41.0 14.5
Net foreign exchange gain 5.7 –
Other income 2.9 6.9
Other income from continuing operations 166.3 21.4
OTHER EXPENSES FROM CONTINUING OPERATIONS
Significant items 4 103.5 59.8
Net foreign exchange loss – 2.9
Other expenses from continuing operations 103.5 62.7
Notes to the Financial StatementsBoral Limited and Controlled Entities

Boral Limited Annual Report 2015 81
3. Profit for the period (continued)CONSOLIDATED
For the year ended 30 June Note2015
$ millions2014
$ millions
NET FINANCING COSTS FROM CONTINUING OPERATIONS
Interest income received or receivable from:
Associated entities 0.1 –
Other parties (cash at bank and bank short-term deposits) 9.6 3.1
Unwinding of discount 3.1 0.9
Significant item – interest recoveries 4 – 16.3
12.8 20.3
Interest expense paid or payable to:
Other parties (bank overdrafts, bank loans and other loans)* 72.7 80.6
Finance charges on capitalised leases 0.7 0.8
Unwinding of discount 3.1 3.3
76.5 84.7
Net financing costs from continuing operations (63.7) (64.4)
* In addition, in FY2014, interest of $4.7 million was paid to other parties and capitalised in respect of qualifying assets. The capitalisation rate used was 6.0%.
OTHER CHARGES
Employee benefits expense* 946.8 1,060.5
Operating lease rental charges 75.5 96.2
Bad and doubtful debts expense 2.4 9.6
Depreciation and amortisation expense 248.8 261.4
* Employee benefits expense includes salaries and wages, defined contribution expenses together with share-based payments and other entitlements.

Boral Limited Annual Report 201582
FINANCIAL STATEMENTS
4. Significant items2015 Significant itemsNet profit includes the following items whose disclosure is relevant in explaining the financial performance of the Group:
Note
Asset impairment
$ millions
Redundancies & Restructure
$ millions
Sale of Business $ millions
Total $ millions
Gain on disposal of Western Landfill Continuing (i) – – 115.0 115.0
Impairment of Building Products businesses Continuing (ii) (70.1) (2.5) – (72.6)
Construction Materials & Cement restructure Continuing (iii) (13.3) (17.6) – (30.9)
Loss on disposal of East Coast Bricks Discontinued (iv) – – (1.7) (1.7)
Boral CSR Bricks Joint Venture restructure Continuing (v) – (6.4) – (6.4)
Other Continuing (vi) – – 1.7 1.7
Other Discontinued (vi) – – (3.2) (3.2)
(83.4) (26.5) 111.8 1.9
Note
Asset impairment
$ millions
Redundancies & Restructure
$ millions
Sale of Business $ millions
Total $ millions
Continuing operations
Other income 3 – – 116.7 116.7
Other expense 3 (83.4) (20.1) – (103.5)
Share of equity accounted income 11 – (6.4) – (6.4)
Discontinued operations 5 – – (4.9) (4.9)
(83.4) (26.5) 111.8 1.9
Asset impairment
$ millions
Redundancies & Restructure
$ millions
Sale of Business $ millions
Total $ millions
Summary of significant items from continuing operations
Profit/(loss) before interest and tax (83.4) (26.5) 116.7 6.8
Income tax benefit/(expense) 25.0 6.0 (36.4) (5.4)
Net significant items from continuing operations (58.4) (20.5) 80.3 1.4
Summary of significant items from discontinued operations
Loss before interest and tax – – (4.9) (4.9)
Income tax benefit* – – 11.3 11.3
Net significant items from discontinued operations – – 6.4 6.4
Summary of significant items
Profit/(loss) before interest and tax (83.4) (26.5) 111.8 1.9
Income tax benefit/(expense) 25.0 6.0 (25.1) 5.9
Net significant items (58.4) (20.5) 86.7 7.8
* Includes tax benefits attributable to tax losses recovered from previous sale transactions.
Notes to the Financial StatementsBoral Limited and Controlled Entities

Boral Limited Annual Report 2015 83
4. Significant items (continued)2015 Significant items (continued)(i) Gain on disposal of Western LandfillIn February 2015, the Group sold its Western Landfill business for net cash proceeds of $139.0 million, and generated a profit before tax of $115.0 million.
(ii) Impairment of Building Products businessesOur ongoing review of the Building Products segment has resulted in impairments of Building Products assets reflecting current results and forecasts. A value in use methodology was used to determine the recoverable amount of the West Coast Bricks and Roofing and Masonry businesses, leading to an impairment of $31.3 million for West Coast Bricks and $29.9 million for Roofing and Masonry. A pre-tax discount rate of 15% was used in the value in use model.
In the Hardwood business, a structural improvement program has been implemented to improve operational efficiency and restructure its warehousing and distribution network, which has led to an asset impairment of $8.9 million and restructuring costs of $2.5 million being incurred.
(iii) Construction Materials & Cement restructureIn response to current market conditions, a review of the asset portfolio of Construction Materials has been performed resulting in impairment costs of $13.3 million and restructuring costs of $7.6 million being incurred in the second half of the year. This related to the mothballing and closure of a number of operating sites, predominantly in Queensland, as well as make safe demolition costs at the Waurn Ponds clinker manufacturing facility. In addition, restructuring costs in the first half of $10.0 million were incurred to streamline the division and align with current market conditions.
(iv) Loss on disposal of East Coast BricksDuring the period, the Group received clearance by the Australian Competition and Consumer Commission for the East Coast Bricks business to enter into a joint venture with CSR Limited. On disposal of its interest, Boral deconsolidated its existing East Coast Bricks business and recognised an equity accounted investment in respect of its 40% shareholding in the Boral CSR Bricks Joint Venture. This resulted in a net loss of $1.7 million.
(v) Boral CSR Bricks Joint Venture restructureFollowing formation of the Boral CSR Bricks Joint Venture, the joint venture incurred restructuring and stamp duty costs of $6.4 million (Boral’s share) in order to realise overhead savings from consolidation of management structures and efficiency gains in sales and administration functions.
(vi) OtherOther items include the gain on disposal of the Oklahoma Quarries business of $1.7 million, and a loss of $3.2 million as a result of finalisation of completion adjustments associated with the disposal of the Gypsum shareholding.

Boral Limited Annual Report 201584
FINANCIAL STATEMENTS
4. Significant items (continued)2014 Significant itemsNet profit includes the following items whose disclosure is relevant in explaining the financial performance of the Group:
Note
Asset impairment
$ millions
Redundancies & Restructure
$ millions
Sale of Business $ millions
Other $ millions
Total $ millions
Construction Materials & Cement restructure Continuing (i) (9.1) (21.8) – – (30.9)
USA restructure Continuing (ii) (22.0) (8.2) – – (30.2)
Gain on disposal of Gypsum shareholding Discontinued (iii) – – 26.4 – 26.4
Boral Gypsum Joint Venture restructure Continuing (iv) – (3.8) – – (3.8)
Proposed East Coast BricksJoint Venture costs
Discontinued (v) – (2.0) – – (2.0)
Interest recoveries Continuing (vi) – – – 16.3 16.3
Impact of change in fair valuationof financial instruments
Continuing – – – 1.3 1.3
Loss on disposal of Windows business Discontinued – – (3.7) – (3.7)
(31.1) (35.8) 22.7 17.6 (26.6)
Note
Asset impairment
$ millions
Redundancies & Restructure
$ millions
Sale of Business $ millions
Other $ millions
Total $ millions
Continuing operations
Other expense 3 (31.1) (30.0) – 1.3 (59.8)
Share of equity accounted income 11 – (3.8) – – (3.8)
Interest income 3 – – – 16.3 16.3
Discontinued operations 5 – (2.0) 22.7 – 20.7
(31.1) (35.8) 22.7 17.6 (26.6)
Asset impairment
$ millions
Redundancies & Restructure
$ millions
Sale of Business $ millions
Other $ millions
Total $ millions
Summary of significant items from continuing operations
Profit/(loss) before interest and tax (31.1) (33.8) – 1.3 (63.6)
Interest recoveries – – – 16.3 16.3
Profit/(loss) before tax (31.1) (33.8) – 17.6 (47.3)
Income tax benefit 11.7 9.9 – 3.1 24.7
Net significant items from continuing operations (19.4) (23.9) – 20.7 (22.6)
Summary of significant items from discontinued operations
Profit/(loss) before interest and tax – (2.0) 22.7 – 20.7
Income tax benefit – – 3.8 – 3.8
Net significant items from discontinued operations – (2.0) 26.5 – 24.5
Summary of significant items
Profit/(loss) before interest and tax (31.1) (35.8) 22.7 1.3 (42.9)
Interest recoveries – – – 16.3 16.3
Profit/(loss) before tax (31.1) (35.8) 22.7 17.6 (26.6)
Income tax benefit 11.7 9.9 3.8 3.1 28.5
Net significant items (19.4) (25.9) 26.5 20.7 1.9
Notes to the Financial StatementsBoral Limited and Controlled Entities

Boral Limited Annual Report 2015 85
4. Significant items (continued)2014 Significant items (continued)(i) Construction Materials & Cement restructureIn June 2014, the Group announced the closure of its Maldon Cement manufacturing operations, which resulted in recognition of impairment charges of $6.9 million and redundancy and restructure costs of $6.9 million.
As part of the overall reshaping of the Group, further redundancy and restructure activities were undertaken in the Australian Construction Materials businesses in Queensland and in Asphalt Victoria. In addition, due to the significant portfolio changes within the Group over the last few years, the Group has reviewed the level of centralised services required to support the more streamlined organisation which resulted in redundancies and restructure charges of $14.9 million and an asset impairment charge of $2.2 million.
(ii) USA restructureIn the USA, a reassessment of the manufacturing footprint was undertaken, resulting in the impairment of assets of $22.0 million associated with the Ione rooftile plant in California and Augusta paver plant. In addition, redundancies of $8.2 million were made to further reshape the business.
(iii) Gain on disposal of Gypsum shareholdingDuring the period, the Group entered into an agreement with USG Corporation to combine its Australian and Asian Gypsum entities with USG Corporation’s Asian and Middle East entities and technology into two 50/50 owned joint ventures. On disposal of its interest, Boral deconsolidated its existing Australian and Asia subsidiaries; and recognised an equity accounted investment in respect of its remaining 50% shareholding in each of the Australian and Asian entities. This resulted in a net gain of $26.4 million.
(iv) Boral Gypsum Joint Venture restructureFollowing formation of the Boral Gypsum Joint Venture, the joint venture incurred restructuring and redundancy costs of $3.8 million to strengthen its low cost position and ensure a focused organisation that is well placed to deliver long-term performance.
(v) Proposed East Coast Bricks Joint Venture costsThese relate to costs associated with the potential joint venture of the Group’s East Coast Bricks operations with CSR, which at the time was subject to clearance by the Australian Competition and Consumer Commission.
(vi) Interest recoveriesInterest received on resolution of outstanding taxation matters.
CONSOLIDATED
Asset Impairment2015
$ millions2014
$ millions
Property, plant and equipment (74.2) (21.3)
Other assets – (0.9)
Inventory (9.2) (8.9)
(83.4) (31.1)
CONSOLIDATED
Summary of significant items before interest and tax by segment2015
$ millions2014
$ millions
Construction Materials & Cement 84.1 (30.9)
Building Products (79.0) –
Boral Gypsum – 26.4
Boral Gypsum Joint Venture – (3.8)
Boral USA 1.7 (30.2)
Discontinued Operations (4.9) (3.7)
Unallocated – (0.7)
1.9 (42.9)
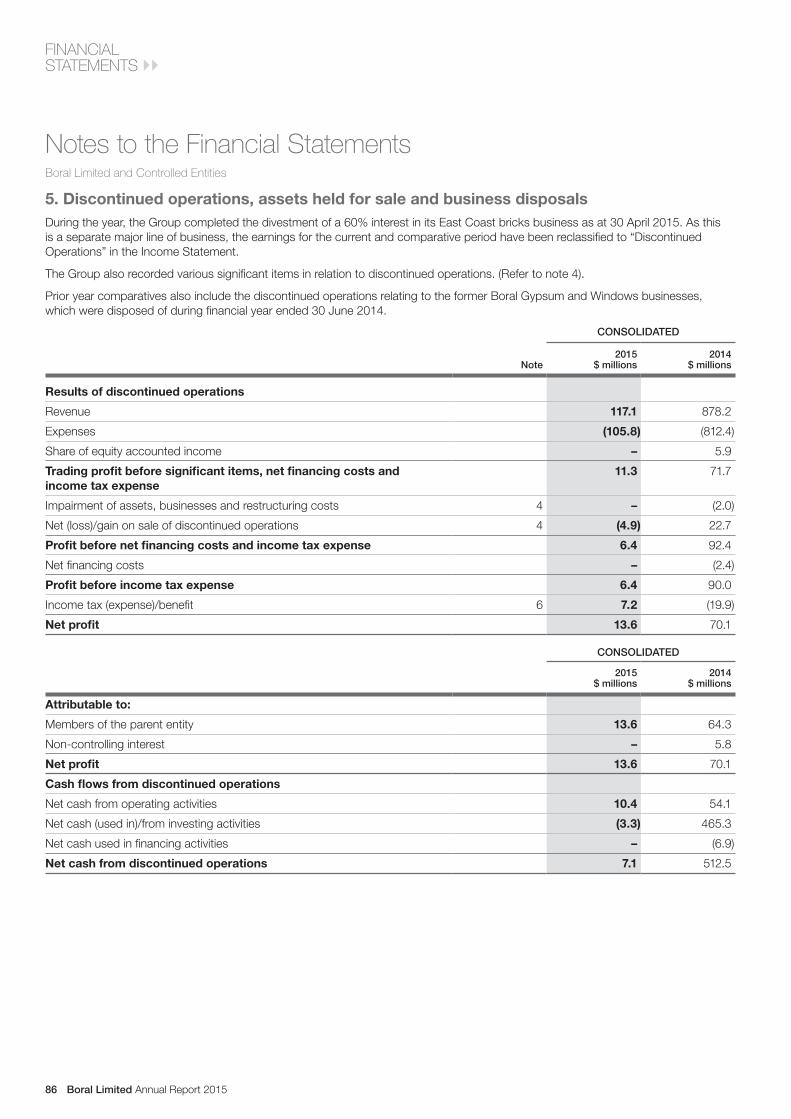
Boral Limited Annual Report 201586
FINANCIAL STATEMENTS
5. Discontinued operations, assets held for sale and business disposalsDuring the year, the Group completed the divestment of a 60% interest in its East Coast bricks business as at 30 April 2015. As this is a separate major line of business, the earnings for the current and comparative period have been reclassified to “Discontinued Operations” in the Income Statement.
The Group also recorded various significant items in relation to discontinued operations. (Refer to note 4).
Prior year comparatives also include the discontinued operations relating to the former Boral Gypsum and Windows businesses, which were disposed of during financial year ended 30 June 2014.
CONSOLIDATED
Note2015
$ millions2014
$ millions
Results of discontinued operations
Revenue 117.1 878.2
Expenses (105.8) (812.4)
Share of equity accounted income – 5.9
Trading profit before significant items, net financing costs andincome tax expense
11.3 71.7
Impairment of assets, businesses and restructuring costs 4 – (2.0)
Net (loss)/gain on sale of discontinued operations 4 (4.9) 22.7
Profit before net financing costs and income tax expense 6.4 92.4
Net financing costs – (2.4)
Profit before income tax expense 6.4 90.0
Income tax (expense)/benefit 6 7.2 (19.9)
Net profit 13.6 70.1
CONSOLIDATED
2015 $ millions
2014 $ millions
Attributable to:
Members of the parent entity 13.6 64.3
Non-controlling interest – 5.8
Net profit 13.6 70.1
Cash flows from discontinued operations
Net cash from operating activities 10.4 54.1
Net cash (used in)/from investing activities (3.3) 465.3
Net cash used in financing activities – (6.9)
Net cash from discontinued operations 7.1 512.5
Notes to the Financial StatementsBoral Limited and Controlled Entities

Boral Limited Annual Report 2015 87
5. Discontinued operations, assets held for sale and business disposals (continued)Effect of disposal on the financial position of the Group(i) Disposal of discontinued businessesDuring the period, the Group received clearance by the Australian Competition and Consumer Commission for the East Coast bricks business to enter into a joint venture with CSR Limited. This transaction was completed on 30 April 2015. This joint venture is responsible for the manufacture and sale of bricks and associated products throughout the East Coast of Australia and South Australia.
For the period 1 July 2014 to 30 April 2015, the Group held 100% interest in the East Coast bricks business, and the results were consolidated into the Group’s financial report. On disposal Boral:
• deconsolidated its existing East Coast bricks business; and
• recognised an equity accounted investment in respect of its 40% shareholding in the Boral CSR Bricks Joint Venture.
The transaction completed on 30 April 2015, resulting in the following disposal entries.
Prior year comparatives also include the disposal entries relating to the former Boral Gypsum and Windows businesses.
CONSOLIDATED
2015 $ millions
2014 $ millions
Fair value of interest in new Joint Venture 100.8 846.7
Cash consideration – 581.1
Contingent consideration – 43.5
Less: Transaction costs (2.2) (24.9)
Total consideration 98.6 1,446.4
Cash – (79.1)
Receivables (20.4) (213.0)
Inventories (30.3) (91.4)
Investments accounted for using the equity method – (14.7)
Property, plant and equipment (65.6) (792.5)
Intangible assets – (668.8)
Other assets (0.3) (4.4)
Payables 11.3 144.0
Loans and borrowings – 55.0
Current tax liabilities – 2.6
Deferred taxes – 23.0
Provisions 5.0 40.9
Net assets disposed (100.3) (1,598.4)
Foreign currency translation reserve transferred to net profit on disposal of controlled entities – 146.5
Non-controlling interest disposed – 28.2
Gain/(loss) on disposal of discontinued operations before income tax expense (1.7) 22.7
Cash consideration – 581.1
Less: Transaction costs (2.2) (24.9)
Cash consideration net of transaction costs (2.2) 556.2
Less: Cash and cash equivalents disposed – (79.1)
Consideration (net of transaction costs and cash and cash equivalents disposed) (2.2) 477.1

Boral Limited Annual Report 201588
FINANCIAL STATEMENTS
5. Discontinued operations, assets held for sale and business disposals (continued)Effect of disposal on the financial position of the Group (continued)(ii) Disposal of other businessesIn January 2015, the Group sold its Oklahoma Quarries business for net cash proceeds of $12.4 million and generated a profit before tax of $1.7 million.
In February 2015, the Group sold its Western Landfill business for net cash proceeds of $139.0 million, and generated a profit before tax of $115.0 million.
The disposal of the Western Landfill and Oklahoma Quarries businesses were not recorded as a discontinued operation as they were not a separate major line of business of the Group.
CONSOLIDATED
2015 $ millions
2014 $ millions
Summary of cash consideration (after transaction costs)
Boral Limited and CSR Limited Joint Venture (2.2) –
Western Landfill 139.0 –
Oklahoma Quarries 12.4 –
Boral Limited and USG Corporation Gypsum Joint Venture – 539.7
Windows – 16.5
149.2 556.2
Less: Cash and cash equivalents disposed – (79.1)
Total 149.2 477.1
Notes to the Financial StatementsBoral Limited and Controlled Entities
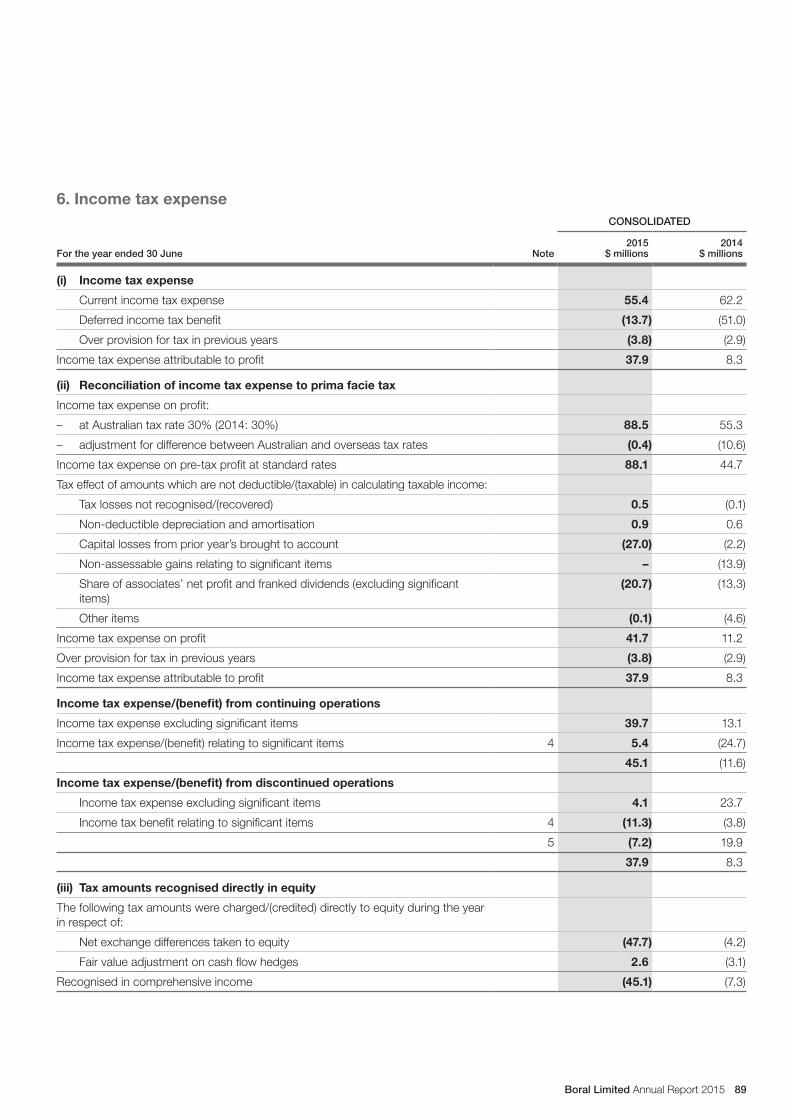
Boral Limited Annual Report 2015 89
6. Income tax expenseCONSOLIDATED
For the year ended 30 June Note2015
$ millions2014
$ millions
(i) Income tax expense
Current income tax expense 55.4 62.2
Deferred income tax benefit (13.7) (51.0)
Over provision for tax in previous years (3.8) (2.9)
Income tax expense attributable to profit 37.9 8.3
(ii) Reconciliation of income tax expense to prima facie tax
Income tax expense on profit:
– at Australian tax rate 30% (2014: 30%) 88.5 55.3
– adjustment for difference between Australian and overseas tax rates (0.4) (10.6)
Income tax expense on pre-tax profit at standard rates 88.1 44.7
Tax effect of amounts which are not deductible/(taxable) in calculating taxable income:
Tax losses not recognised/(recovered) 0.5 (0.1)
Non-deductible depreciation and amortisation 0.9 0.6
Capital losses from prior year’s brought to account (27.0) (2.2)
Non-assessable gains relating to significant items – (13.9)
Share of associates’ net profit and franked dividends (excluding significant items)
(20.7) (13.3)
Other items (0.1) (4.6)
Income tax expense on profit 41.7 11.2
Over provision for tax in previous years (3.8) (2.9)
Income tax expense attributable to profit 37.9 8.3
Income tax expense/(benefit) from continuing operations
Income tax expense excluding significant items 39.7 13.1
Income tax expense/(benefit) relating to significant items 4 5.4 (24.7)
45.1 (11.6)
Income tax expense/(benefit) from discontinued operations
Income tax expense excluding significant items 4.1 23.7
Income tax benefit relating to significant items 4 (11.3) (3.8)
5 (7.2) 19.9
37.9 8.3
(iii) Tax amounts recognised directly in equity
The following tax amounts were charged/(credited) directly to equity during the year in respect of:
Net exchange differences taken to equity (47.7) (4.2)
Fair value adjustment on cash flow hedges 2.6 (3.1)
Recognised in comprehensive income (45.1) (7.3)

Boral Limited Annual Report 201590
FINANCIAL STATEMENTS
7. DividendsDividends recognised by the Group are:
Amount per shareTotal amount
$ millionsFranked amount
per share Date of payment
2015
2014 final – ordinary 8.0 cents 62.6 8.0 cents 26 September 2014
2015 interim – ordinary 8.5 cents 66.5 8.5 cents 13 March 2015
Total 129.1
2014
2013 final – ordinary 6.0 cents 46.4 6.0 cents 27 September 2013
2014 interim – ordinary 7.0 cents 54.5 7.0 cents 24 March 2014
Total 100.9
Subsequent eventSince the end of the financial year, the Directors declared the following dividend:
2015 final – ordinary 9.5 cents 72.6 9.5 cents 28 September 2015
The financial effect of the final dividend for the year ended 30 June 2015 has not been brought to account in the financial statements for the year but will be recognised in subsequent financial reports.
Dividend franking accountThe balance of the franking account of Boral Limited as at 30 June 2015 is $77.3 million (2014: $65.8 million) after adjusting for franking credits/(debits) that will arise from:
• the payment/refund of the amount of the current tax liability;
• the receipt of dividends recognised as receivables at year end;
and before taking into account the franking credits associated with payment of the final dividend declared subsequent to year end.
The impact on the franking account of the dividend recommended by the Directors since year end, but not recognised as a liability at year end, will be a reduction in the franking account of $31.1 million (2014: $26.8 million).
Dividend Reinvestment PlanThe Group’s Dividend Reinvestment Plan, which was suspended following the interim dividend paid on 24 March 2014, will remain suspended until further notice.
Notes to the Financial StatementsBoral Limited and Controlled Entities

Boral Limited Annual Report 2015 91
8. Earnings per shareClassification of securities as ordinary sharesOnly ordinary shares have been included in basic earnings per share (EPS).
Classification of securities as potential ordinary sharesOptions outstanding under the Executive Share Option Plan and Share Performance Rights have been classified as potential ordinary shares and are included in diluted earnings per share only.
CONSOLIDATED
2015 2014
Weighted average number of ordinary shares used as the denominator
Number for basic earnings per share 780,336,204 778,940,970
Effect of potential ordinary shares 8,327,214 7,225,673
Number for diluted earnings per share 788,663,418 786,166,643
Basic earnings per shareBasic earnings per share (EPS) is calculated by dividing the net profit attributable to members of the parent entity, by the weighted average number of ordinary shares of Boral Limited, adjusted for any bonus issue.
Diluted earnings per shareDiluted EPS is calculated by dividing the net profit attributable to members of the parent entity, by the weighted average number of ordinary shares after adjustment for the effects of all dilutive potential ordinary shares and bonus issue.
Continuing operations
Discontinued operations Total
Continuing operations
Discontinued operations Total
2015 $ millions
2015 $ millions
2015 $ millions
2014 $ millions
2014 $ millions
2014 $ millions
Earnings reconciliation
Net profit before significant items 242.0 7.2 249.2 128.7 45.6 174.3
Loss/(profit) attributable to non-controlling interests
– – – 2.9 (5.8) (2.9)
Net profit attributable to members of the parent entity excluding significant items
242.0 7.2 249.2 131.6 39.8 171.4
Net significant items (refer note 4) 1.4 6.4 7.8 (22.6) 24.5 1.9
Net profit attributable to members of the parent entity
243.4 13.6 257.0 109.0 64.3 173.3
Basic earnings per share* 31.2c 1.7c 32.9c 14.0c 8.3c 22.2c
Diluted earnings per share* 30.9c 1.7c 32.6c 13.9c 8.2c 22.0c
Basic earnings per share (excluding significant items)*
31.0c 0.9c 31.9c 16.9c 5.1c 22.0c
Diluted earnings per share (excluding significant items)*
30.7c 0.9c 31.6c 16.7c 5.1c 21.8c
* Numbers may not add due to rounding
The average market value of the Company’s shares for the purpose of calculating the dilutive effect of share options and performance rights was based on quoted market prices for the period that the options were outstanding.
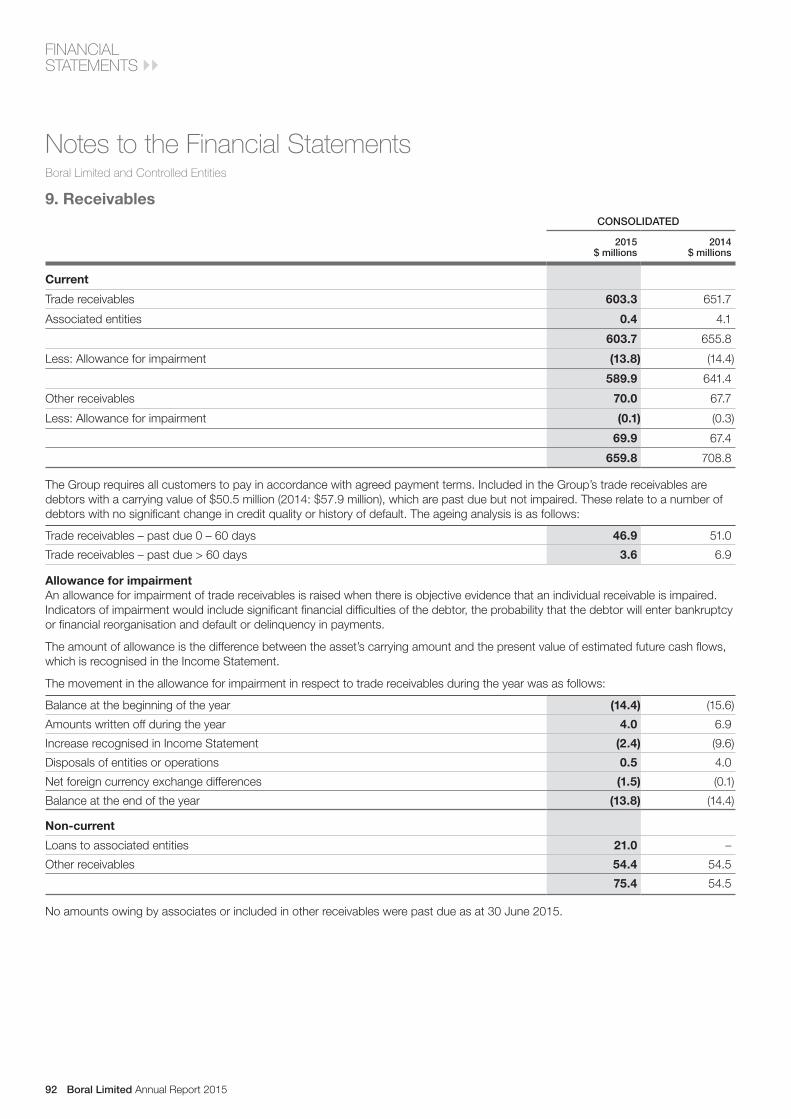
Boral Limited Annual Report 201592
FINANCIAL STATEMENTS
9. ReceivablesCONSOLIDATED
2015 $ millions
2014 $ millions
Current
Trade receivables 603.3 651.7
Associated entities 0.4 4.1
603.7 655.8
Less: Allowance for impairment (13.8) (14.4)
589.9 641.4
Other receivables 70.0 67.7
Less: Allowance for impairment (0.1) (0.3)
69.9 67.4
659.8 708.8
The Group requires all customers to pay in accordance with agreed payment terms. Included in the Group’s trade receivables are debtors with a carrying value of $50.5 million (2014: $57.9 million), which are past due but not impaired. These relate to a number of debtors with no significant change in credit quality or history of default. The ageing analysis is as follows:
Trade receivables – past due 0 – 60 days 46.9 51.0
Trade receivables – past due > 60 days 3.6 6.9
Allowance for impairmentAn allowance for impairment of trade receivables is raised when there is objective evidence that an individual receivable is impaired. Indicators of impairment would include significant financial difficulties of the debtor, the probability that the debtor will enter bankruptcy or financial reorganisation and default or delinquency in payments.
The amount of allowance is the difference between the asset’s carrying amount and the present value of estimated future cash flows, which is recognised in the Income Statement.
The movement in the allowance for impairment in respect to trade receivables during the year was as follows:
Balance at the beginning of the year (14.4) (15.6)
Amounts written off during the year 4.0 6.9
Increase recognised in Income Statement (2.4) (9.6)
Disposals of entities or operations 0.5 4.0
Net foreign currency exchange differences (1.5) (0.1)
Balance at the end of the year (13.8) (14.4)
Non-current
Loans to associated entities 21.0 –
Other receivables 54.4 54.5
75.4 54.5
No amounts owing by associates or included in other receivables were past due as at 30 June 2015.
Notes to the Financial StatementsBoral Limited and Controlled Entities

Boral Limited Annual Report 2015 93
10. InventoriesCONSOLIDATED
2015 $ millions
2014 $ millions
Current
Raw materials and consumable stores 145.7 159.4
Work in progress 53.9 53.7
Finished goods 330.9 307.5
Land development projects 7.3 7.5
537.8 528.1
Non-current
Land development projects 21.6 21.1
Land development projects comprises:
Cost of acquisition 6.2 11.1
Development costs capitalised 22.7 17.5
28.9 28.6
11. Investments accounted for using the equity methodCONSOLIDATED
OWNERSHIP INTEREST
INVESTMENT CARRYING AMOUNT
Name Principal activityCountry of incorporation
Balance date
2015 %
2014 %
2015 $ millions
2014 $ millions
Details of equity accounted investments
Bitumen Importers Australia Pty Ltd Bitumen importer Australia 30-Jun 50 50 0.2 –
Caribbean Roof Tile Company Limited Roof tiles Trinidad 31-Dec 50 50 – –
Boral CSR Bricks Pty Limited* Bricks Australia 31-Mar 40 – 83.9 –
Flyash Australia Pty Ltd Fly ash collection Australia 31-Dec 50 50 2.1 1.9
Highland Pine Products Pty Ltd Timber Australia 30-Jun 50 50 – –
Penrith Lakes Development Corporation Ltd Quarrying Australia 30-Jun 40 40 – –
South East Asphalt Pty Ltd Asphalt Australia 30-Jun 50 50 0.8 0.7
Sunstate Cement Ltd Cement manufacturer
Australia 30-Jun 50 50 10.6 16.4
USG Boral Building Products** Plasterboard Australia/Singapore
30-Jun 50 50 950.5 832.8
US Tile LLC Roof tiles USA 31-Dec 50 50 – –
TOTAL 1,048.1 851.8
* The Group has a 40% interest in the Boral CSR Bricks Pty Limited joint venture. The results were equity accounted from 1 May 2015 when the joint venture was formed.** The Group has a 50% interest in the Gypsum joint ventures in Australia (USG Boral Building Products Pty Ltd) and Asia (USG Boral Building Products Pte Ltd). The results were equity
accounted from 1 March 2014 when the joint ventures were formed.

Boral Limited Annual Report 201594
FINANCIAL STATEMENTS
11. Investments accounted for using the equity method (continued)CONSOLIDATED
Note2015
$ millions2014
$ millions
Movements in carrying value of equity accounted investments
Balance at the beginning of the year 851.8 34.6
Acquired during the year 88.9 846.7
Disposed during the year – (14.7)
Share of equity accounted income 75.1 47.0
Impairment and restructure costs disclosed as significant item 4 (6.4) (3.8)
Dividends received (41.2) (18.6)
Results recognised against losses previously taken to non-currentreceivables/provisions
(11.4) (19.3)
Share of movement in currency reserve (29.9) 6.7
Net foreign currency exchange differences 121.2 (26.8)
Balance at the end of the year 1,048.1 851.8
When the Group’s share of losses from an equity accounted investment exceed the Group’s investment in the relevant equity accounted investment, the losses are taken against any long-term receivables relating to the equity accounted investment and if the Group’s obligation for losses exceeds this amount, they are recorded as a provision in the Group’s financial statements to the extent that the Group has an obligation to fund the liability.
USG Boral Building Products Total
Note2015
$ millions2014
$ millions2015
$ millions2014
$ millions
Summarised Income Statement at 100%
Revenue 1,268.0 400.1 1,641.3 630.4
Profit before income tax expense 140.7 33.7 194.5 136.1
Income tax expense (36.0) (11.5) (46.5) (42.2)
Non-controlling interest (7.3) (2.0) (7.3) (2.0)
Net profit before significant items 97.4 20.2 140.7 91.9
Restructure costs disclosed as significant item net of tax – (7.6) (16.0) (7.6)
Net profit – equity accounted relating tocontinuing operations
97.4 12.6 124.7 84.3
The Group’s share based on % ownership:
Net profit before significant items 48.7 10.1 75.1 41.1
Restructure costs disclosed as significant item 4 – (3.8) (6.4) (3.8)
Net profit – equity accounted relating to continuing operations
48.7 6.3 68.7 37.3
Notes to the Financial StatementsBoral Limited and Controlled Entities

Boral Limited Annual Report 2015 95
11. Investments accounted for using the equity method (continued)USG Boral Building Products Total
2015 $ millions
2014 $ millions
2015 $ millions
2014 $ millions
Summarised Balance Sheet at 100%
Current assets 522.9 459.3 708.8 523.1
Non-current assets 1,903.8 1,614.1 2,230.2 1,805.8
Total assets 2,426.7 2,073.4 2,939.0 2,328.9
Current liabilities (300.0) (260.5) (393.1) (339.3)
Non-current liabilities (101.8) (71.8) (283.7) (210.6)
Total liabilities (401.8) (332.3) (676.8) (549.9)
Non-controlling interest (124.0) (75.4) (124.0) (75.4)
Net assets 1,900.9 1,665.7 2,138.2 1,703.6
The Group’s share of net assets based on % ownership 950.5 832.8 1,048.1 851.8
12. Property, plant and equipmentCONSOLIDATED
2015 $ millions
2014 $ millions
Land and buildings
At cost 1,076.4 1,072.6
Less: Accumulated depreciation, amortisation and impairment (183.1) (155.9)
893.3 916.7
Mineral reserves, licences and quarry stripping
At cost 284.7 262.5
Less: Accumulated amortisation and impairment (121.5) (100.9)
163.2 161.6
Plant and equipment
At cost 4,033.5 4,029.2
Less: Accumulated depreciation and impairment (2,645.0) (2,550.0)
1,388.5 1,479.2
Leased plant and equipment capitalised 5.9 5.7
Less: Accumulated amortisation (2.5) (1.3)
3.4 4.4
1,391.9 1,483.6
Total 2,448.4 2,561.9

Boral Limited Annual Report 201596
FINANCIAL STATEMENTS
12. Property, plant and equipment (continued)Reconciliation of movements in property, plant and equipment
Land and buildingsMineral reserves, licences
and quarry stripping Plant and equipment Total
2015 $ millions
2014 $ millions
2015 $ millions
2014 $ millions
2015 $ millions
2014 $ millions
2015 $ millions
2014 $ millions
Balance at the beginning of the year
916.7 1,244.3 161.6 161.9 1,483.6 1,971.9 2,561.9 3,378.1
Additions 0.3 4.2 28.0 21.1 215.3 241.8 243.6 267.1
Disposals (18.9) (7.6) – – (7.3) (5.8) (26.2) (13.4)
Disposals of entities or operations
(55.4) (366.4) (9.1) (4.6) (43.0) (421.5) (107.5) (792.5)
Transferred (to)/from other property, plant and equipment
37.0 68.3 – – (37.0) (68.3) – –
Impairment disclosed as significant items
(15.2) (8.5) (1.6) – (57.4) (12.8) (74.2) (21.3)
Transfer (to)/from other assets or liabilities
(1.7) – (0.3) 1.3 (1.3) 0.3 (3.3) 1.6
Depreciation or amortisation expense
(15.9) (17.8) (20.3) (17.7) (209.9) (222.7) (246.1) (258.2)
Net foreign currency exchange differences
46.4 0.2 4.9 (0.4) 48.9 0.7 100.2 0.5
Balance at the end of the year
893.3 916.7 163.2 161.6 1,391.9 1,483.6 2,448.4 2,561.9
DepreciationItems of property, plant and equipment, including buildings and leasehold property but excluding freehold land, are depreciated using the straight-line method over their expected useful lives. Assets are depreciated from the date of acquisition or, in respect of internally constructed assets, from the time an asset is completed and held ready for use. Quarry stripping assets are amortised over the expected life of the identified resources using the units of production method.
The depreciation and amortisation rates used for each class of asset are as follows:
2015 2014
Buildings 1 – 10% 1 – 10%
Mineral reserves and licences 1 – 5% 1 – 5%
Plant and equipment 5 – 33.3% 5 – 33.3%
Notes to the Financial StatementsBoral Limited and Controlled Entities

Boral Limited Annual Report 2015 97
13. Intangible assetsCONSOLIDATED
2015 $ millions
2014 $ millions
Goodwill 208.6 183.1
Other intangible assets 38.3 29.1
Less: Accumulated amortisation (19.8) (16.1)
18.5 13.0
Total 227.1 196.1
Reconciliation of movements in goodwill
Balance at the beginning of the year 183.1 825.8
Goodwill disposed – (662.6)
Net foreign currency exchange differences 25.5 19.9
Balance at the end of the year 208.6 183.1
Impairment testing for cash generating units containing goodwillFor the purposes of the impairment testing, goodwill is allocated to the Group’s operating divisions according to business types and geographical span of operations. The aggregate carrying amounts of goodwill allocated to each Cash Generating Unit (CGU) are as follows:
US Bricks 105.6 86.2
Other* 103.0 96.9
208.6 183.1
* Relates to multiple business units, none of which are considered individually significant.
Key assumptionsThe recoverable amount of CGUs is the higher of the asset’s fair value less costs to sell and its value in use. Value in use calculations use pre-tax cash flow projections based on financial budgets and plans approved by management.
US BricksRecognising the cyclical nature of the USA building industry, cash flow projections for the US Bricks business cover a period of 10 years, reflecting a full business cycle. Cash flows beyond the projection period are extrapolated using growth rates of 0.8% for US Bricks. These growth rates do not exceed the long-term average growth rate for the industry in which the CGU operates.
The Group’s weighted cost of capital is used as a starting point for determining the discount rate with appropriate adjustments for the risk profile relating to the relevant segments and the countries in which they operate. The discount rate applied to pre-tax cash flows was 13.9% for US Bricks.
Key assumptions relate to the number of housing starts, market share and the average selling price of bricks through the forecast period for the bricks business in the USA.
These assumptions have been determined with reference to current and historical performance and taking into account external forecasts. Housing start forecasts utilised in the cash flow projections are based on historical experiences in the relevant geographies and independent economists’ forecasts.
The recoverable amount of the CGU based on value in use exceeds its carrying value as at 30 June 2015. Management believe no reasonable changes in the key assumptions on which the estimates for the US Brick business are based would cause the carrying amount to exceed the recoverable amount.
Other cash generating unitsThe recoverable amount of other CGUs has been reviewed and exceed their carrying values as at 30 June 2015. No reasonable changes in the key assumptions on which the estimates have been based for these businesses would cause the carrying amount to exceed the recoverable amount.

Boral Limited Annual Report 201598
FINANCIAL STATEMENTS
13. Intangible assets (continued)CONSOLIDATED
Segment summary of goodwill2015
$ millions2014
$ millions
Construction Materials & Cement 70.2 70.2
Boral USA 138.4 112.9
208.6 183.1
Reconciliation of movements in other intangible assets
Balance at the beginning of the year 13.0 24.1
Additions 6.3 1.1
Australian carbon credit units (0.7) (2.9)
Disposals of entities or operations – (6.2)
Amortisation expense (2.7) (3.2)
Net foreign currency exchange differences 2.6 0.1
Balance at the end of the year 18.5 13.0
Other intangible assetsOther intangible assets relate predominantly to brand names, technology, software development and government grant of carbon credits.
Amortisation is charged to the Income Statement on a straight-line basis over the estimated useful lives of other intangible assets unless such lives are indefinite. Other intangible assets with an indefinite useful life are systematically tested for impairment annually. Where appropriate, other intangible assets are amortised from the date that they are available for use at rates from 5% to 20%.
14. Loans and borrowingsCONSOLIDATED
2015 $ millions
2014 $ millions
Current
Other loans – unsecured 0.4 214.1
Finance lease liabilities 1.4 1.3
1.8 215.4
Non-current
Other loans – unsecured 1,317.1 881.3
Finance lease liabilities 3.7 4.8
1,320.8 886.1
Notes to the Financial StatementsBoral Limited and Controlled Entities

Boral Limited Annual Report 2015 99
14. Loans and borrowings (continued)TERM AND DEBT REPAYMENT SCHEDULETerms and conditions of outstanding loans were as follows:
CONSOLIDATED
30 June 2015 30 June 2014
Currency
Effective interest rate
2015
Calendar year of
maturity
Carrying amount
$ millionsFair value $ millions
Carrying amount
$ millionsFair value $ millions
Current
US senior notes – unsecured USD – – – – 213.7 222.3
Other loans – unsecured Multi 8.29% 2015 – 2016 0.4 0.4 0.4 0.4
Finance lease liabilities AUD 6.07% 2015 – 2016 1.4 1.4 1.3 1.3
1.8 1.8 215.4 224.0
Non-current
US senior notes – unsecured USD 6.02% 2017 – 2030 1,104.9 1,152.8 699.7 745.6
CHF notes – unsecured CHF 2.25% 2020 208.9 222.3 178.1 184.2
Other loans – unsecured Multi 8.86% 2016 – 2022 3.3 3.3 3.5 3.5
Finance lease liabilities AUD 6.01% 2016 – 2020 3.7 3.7 4.8 4.8
1,320.8 1,382.1 886.1 938.1
Total 1,322.6 1,383.9 1,101.5 1,162.1
US SENIOR NOTES – UNSECURED
BorrowerNotional amount
US$ millions Issue date Interest rate Maturity dateAUD equivalent
$ millions
Boral USA 53.5 05/2002 7.11% 05/2017 69.7
Boral USA 30.0 04/2008 7.12% 04/2018 39.1
Boral USA 76.2 04/2008 7.22% 04/2020 99.3
Boral Limited 200.0 05/2005 5.52% 05/2017 281.7
Boral Limited 276.0 04/2008 7.12% 04/2018 360.9
Boral Limited 135.0 05/2015 4.01% 05/2025 171.5
Boral Limited 41.0 05/2015 4.16% 05/2027 52.1
Boral Limited 24.0 03/2015 4.31% 03/2030 30.6
Total 835.7 1,104.9
CHF NOTES – UNSECURED
BorrowerNotional amount
CHF millions Issue date Interest rate Maturity dateAUD equivalent
$ millions
Boral Limited 150.0 02/2013 2.25% 02/2020 208.9
BANK FACILITIESSyndicated loan facilityA committed A$500 million multi-currency syndicated loan facility was established on 24 November 2011 to provide liquidity for general corporate purposes. The original maturity date of the facility was 23 November 2015 and has since been extended to 23 November 2016. The facility was undrawn as at 30 June 2015. On 1 July 2015, the Group refinanced the A$500 million multi-currency syndicated loan facility into a US$400 million multi-currency syndicated loan facility. The maturity date of this new facility is 1 July 2020.
Bank overdraft, lease liabilities and otherThe Group operates unsecured bank overdraft facility arrangements in Australia and USA that have combined limits of A$24.7 million (2014: A$22.7 million). The facilities within Australia are conducted on a set-off basis. All facilities are subject to annual review where repayment can occur on demand by the lending bank. Finance leases within Australia are subject to lease terms of various maturities. For each of the above named facilities, the Group has complied with the respective borrowing covenants throughout the year ended 30 June 2015.

Boral Limited Annual Report 2015100
FINANCIAL STATEMENTS
15. Deferred tax assets and liabilitiesCONSOLIDATED
2015 $ millions
2014 $ millions
Recognised deferred tax balances
Deferred tax asset 243.6 154.1
Unrecognised deferred tax assets
The potential deferred tax asset has not been taken into account in respect oftax losses where recovery is not probable
133.9 130.1
The potential benefit of the deferred tax asset will only be obtained if:
(i) the relevant entities derive future assessable income of a nature and an amount sufficient to enable the benefit to be realised, or the benefit can be utilised by another company in the Group in accordance with tax law in the jurisdiction in which the company operates;
(ii) the relevant Group entities continue to comply with the conditions for deductibility imposed by the law; and
(iii) no changes in tax legislation adversely affect the relevant entities in realising the asset.
The gross amount of capital and revenue tax losses carried forward that have not been recognised and the range of expiry dates for recovery by tax jurisdiction are as follows:
CONSOLIDATED
Tax jurisdiction Expiry date2015
$ millions2014
$ millions
Australia* No restriction – 66.4
Germany No restriction 45.0 52.4
United Kingdom* No restriction 47.6 42.1
United States of America* 30 Jun 2016 – 6.8
United States of America 30 Jun 2029 – 30 June 2034 291.6 218.7
* Unbooked capital losses.
Notes to the Financial StatementsBoral Limited and Controlled Entities
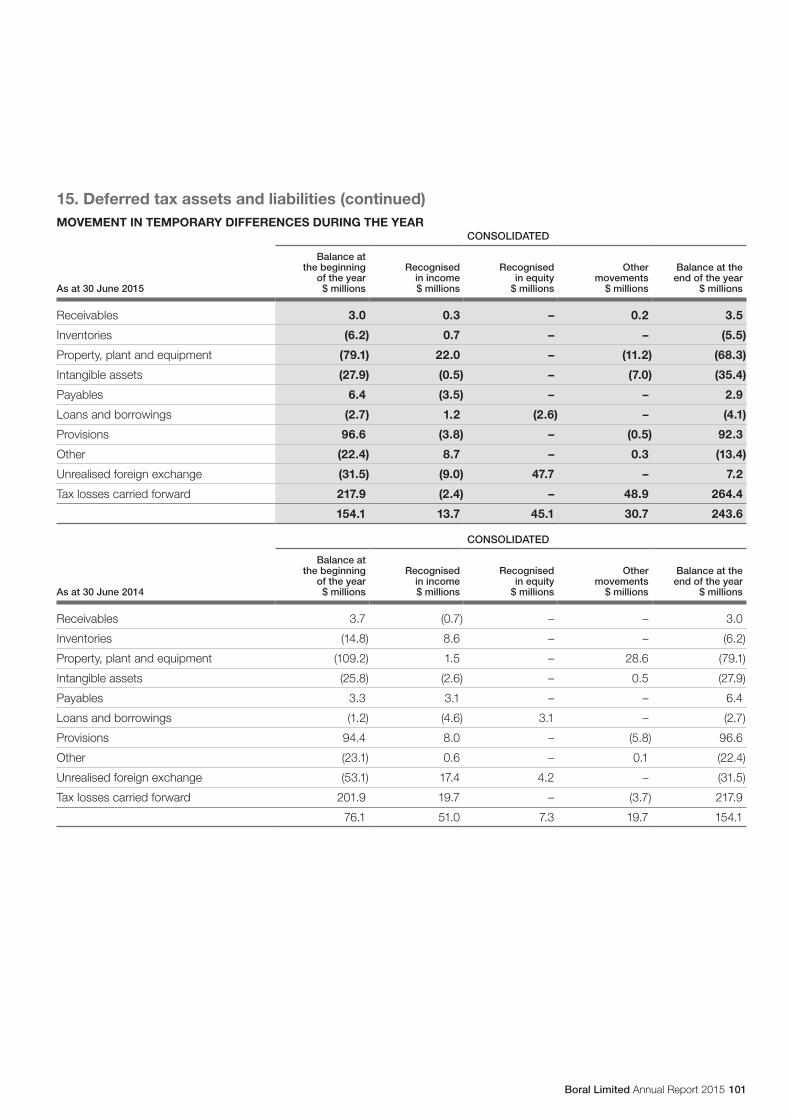
Boral Limited Annual Report 2015 101
15. Deferred tax assets and liabilities (continued)MOVEMENT IN TEMPORARY DIFFERENCES DURING THE YEAR
CONSOLIDATED
As at 30 June 2015
Balance at the beginning
of the year $ millions
Recognised in income $ millions
Recognised in equity
$ millions
Other movements
$ millions
Balance at the end of the year
$ millions
Receivables 3.0 0.3 – 0.2 3.5
Inventories (6.2) 0.7 – – (5.5)
Property, plant and equipment (79.1) 22.0 – (11.2) (68.3)
Intangible assets (27.9) (0.5) – (7.0) (35.4)
Payables 6.4 (3.5) – – 2.9
Loans and borrowings (2.7) 1.2 (2.6) – (4.1)
Provisions 96.6 (3.8) – (0.5) 92.3
Other (22.4) 8.7 – 0.3 (13.4)
Unrealised foreign exchange (31.5) (9.0) 47.7 – 7.2
Tax losses carried forward 217.9 (2.4) – 48.9 264.4
154.1 13.7 45.1 30.7 243.6
CONSOLIDATED
As at 30 June 2014
Balance at the beginning
of the year $ millions
Recognised in income $ millions
Recognised in equity
$ millions
Other movements
$ millions
Balance at the end of the year
$ millions
Receivables 3.7 (0.7) – – 3.0
Inventories (14.8) 8.6 – – (6.2)
Property, plant and equipment (109.2) 1.5 – 28.6 (79.1)
Intangible assets (25.8) (2.6) – 0.5 (27.9)
Payables 3.3 3.1 – – 6.4
Loans and borrowings (1.2) (4.6) 3.1 – (2.7)
Provisions 94.4 8.0 – (5.8) 96.6
Other (23.1) 0.6 – 0.1 (22.4)
Unrealised foreign exchange (53.1) 17.4 4.2 – (31.5)
Tax losses carried forward 201.9 19.7 – (3.7) 217.9
76.1 51.0 7.3 19.7 154.1
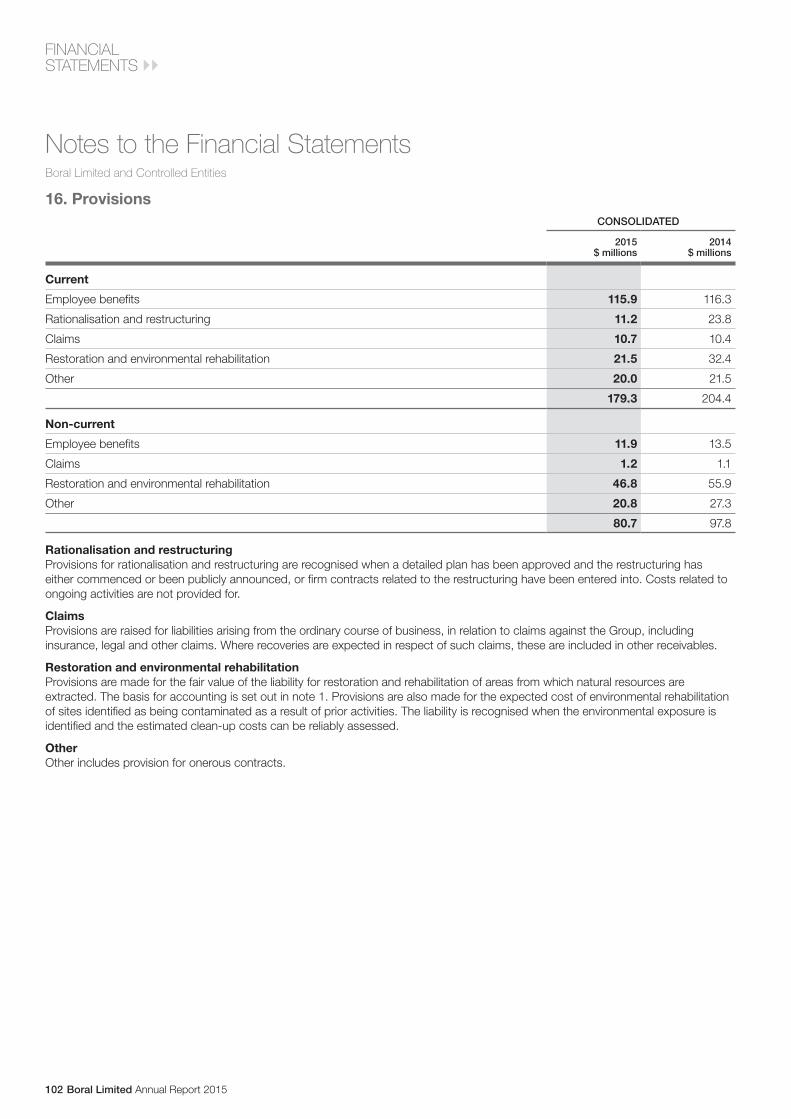
Boral Limited Annual Report 2015102
FINANCIAL STATEMENTS
16. ProvisionsCONSOLIDATED
2015 $ millions
2014 $ millions
Current
Employee benefits 115.9 116.3
Rationalisation and restructuring 11.2 23.8
Claims 10.7 10.4
Restoration and environmental rehabilitation 21.5 32.4
Other 20.0 21.5
179.3 204.4
Non-current
Employee benefits 11.9 13.5
Claims 1.2 1.1
Restoration and environmental rehabilitation 46.8 55.9
Other 20.8 27.3
80.7 97.8
Rationalisation and restructuringProvisions for rationalisation and restructuring are recognised when a detailed plan has been approved and the restructuring has either commenced or been publicly announced, or firm contracts related to the restructuring have been entered into. Costs related to ongoing activities are not provided for.
ClaimsProvisions are raised for liabilities arising from the ordinary course of business, in relation to claims against the Group, including insurance, legal and other claims. Where recoveries are expected in respect of such claims, these are included in other receivables.
Restoration and environmental rehabilitationProvisions are made for the fair value of the liability for restoration and rehabilitation of areas from which natural resources are extracted. The basis for accounting is set out in note 1. Provisions are also made for the expected cost of environmental rehabilitation of sites identified as being contaminated as a result of prior activities. The liability is recognised when the environmental exposure is identified and the estimated clean-up costs can be reliably assessed.
OtherOther includes provision for onerous contracts.
Notes to the Financial StatementsBoral Limited and Controlled Entities

Boral Limited Annual Report 2015 103
16. Provisions (continued)Reconciliations
Rationalisation and restructuring Claims
Restoration and environmental rehabilitation Other
As at 30 June 20152015
$ millions2015
$ millions2015
$ millions2015
$ millions
Reconciliations
Balance at the beginning of the year 23.8 11.5 88.3 48.8
Provisions made during the year 13.2 1.4 3.8 10.4
Unwind of discount – – 1.9 1.2
Decrease through disposal of entity – (0.3) (9.9) (0.3)
Payments made during the year (27.1) (1.4) (16.0) (17.0)
Transferred to investments accounted for using the equity method
– – – (2.4)
Net foreign currency exchange differences 1.3 0.7 0.2 0.1
Balance at the end of the year 11.2 11.9 68.3 40.8
Rationalisation and restructuring Claims
Restoration and environmental rehabilitation Other
As at 30 June 20142014
$ millions2014
$ millions2014
$ millions2014
$ millions
Reconciliations
Balance at the beginning of the year 13.8 11.8 88.0 57.5
Provisions made during the year 20.4 3.0 6.4 15.3
Unwind of discount – – 2.0 0.8
Decrease through disposal of entity (0.6) (1.5) – (0.7)
Payments made during the year (9.6) (1.8) (8.1) (4.6)
Transferred to investments accounted for using the equity method
– – – (19.5)
Net foreign currency exchange differences (0.2) – – –
Balance at the end of the year 23.8 11.5 88.3 48.8

Boral Limited Annual Report 2015104
FINANCIAL STATEMENTS
17. Issued capitalCONSOLIDATED
2015 $ millions
2014 $ millions
Issued and paid up capital
764,241,387 (2014: 782,736,249) ordinary shares, fully paid 2,361.6 2,477.6
Movements in ordinary issued capital
Balance at the beginning of the year 2,477.6 2,433.8
Nil (2014: 8,735,608) shares issued under the Dividend Reinvestment Plan – 43.8
18,494,862 (2014: Nil) on-market share buy-back (116.0) –
Balance at the end of the year 2,361.6 2,477.6
During the year, the Company completed the buy-back of 18,494,862 shares. This is part of the Company’s on-market share buy-back program for up to 5% of the Company’s issued capital or approximately 39 million ordinary shares from 18 March 2015 to 17 March 2016. As at 30 June 2015, the total consideration for shares bought back on market was $116.0 million and at an average price of $6.27. The consideration paid was allocated to share capital.
Issued and paid up capital is recognised at the fair value of the consideration received by the Company. Transaction costs directly attributable to the issue of ordinary shares are recognised directly to equity, as a reduction of the share proceeds received, net of any tax effects.
Holders of ordinary shares are entitled to receive dividends as declared from time to time and are entitled to one vote per share at shareholders’ meetings.
In the event of a winding up of Boral Limited, ordinary shareholders rank after creditors and are fully entitled to any proceeds of liquidation.
Notes to the Financial StatementsBoral Limited and Controlled Entities

Boral Limited Annual Report 2015 105
18. ReservesCONSOLIDATED
2015 $ millions
2014 $ millions
Foreign currency translation reserve 97.4 (50.0)
Hedging reserve – cash flow hedges 1.5 (4.6)
Other reserve (6.9) (6.9)
Share-based payments reserve 74.2 63.6
166.2 2.1
Reconciliations
Foreign currency translation reserve
Balance at the beginning of the year (50.0) 81.9
Net gain on translation of assets and liabilities of overseas entities 259.5 24.4
Foreign currency translation reserve transferred to net profit on disposal of controlled entities – (146.5)
Net loss on translation of long-term borrowings and foreign currency forward contracts net of tax benefit $47.7 million (2014: $4.2 million)
(112.1) (9.8)
Balance at the end of the year 97.4 (50.0)
Hedging reserve
Balance at the beginning of the year (4.6) 2.4
Transferred to the Income Statement 1.1 1.8
Transferred to initial carrying amount of hedged item (0.3) (5.6)
Losses taken directly to equity 7.9 (6.3)
Tax (expense)/benefit (2.6) 3.1
Balance at the end of the year 1.5 (4.6)
Other reserve
Balance at the beginning of the year (6.9) (66.3)
Acquisition of Cultured Stone non-controlling interest – 59.4
Balance at the end of the year (6.9) (6.9)
Share-based payments reserve
Balance at the beginning of the year 63.6 56.4
Option/rights expense 10.6 7.2
Balance at the end of the year 74.2 63.6
Nature and purpose of reservesForeign currency translation reserveThe translation reserve comprises all foreign exchange differences arising from the translation of the financial statements of foreign operations where their functional currency is different to the presentation currency of the Group, together with foreign exchange differences from the translation of liabilities that hedge the Group’s net investment in a foreign subsidiary.
Hedging reserveThe hedging reserve comprises the effective portion of the cumulative net change in the fair value of cash flow hedging instruments related to hedged transactions that have not yet occurred.
Other reserveThe other reserve relates to the Cultured Stone acquisition.
Share-based payments reserveThe share-based payments reserve is used to recognise the fair value of options and rights granted.
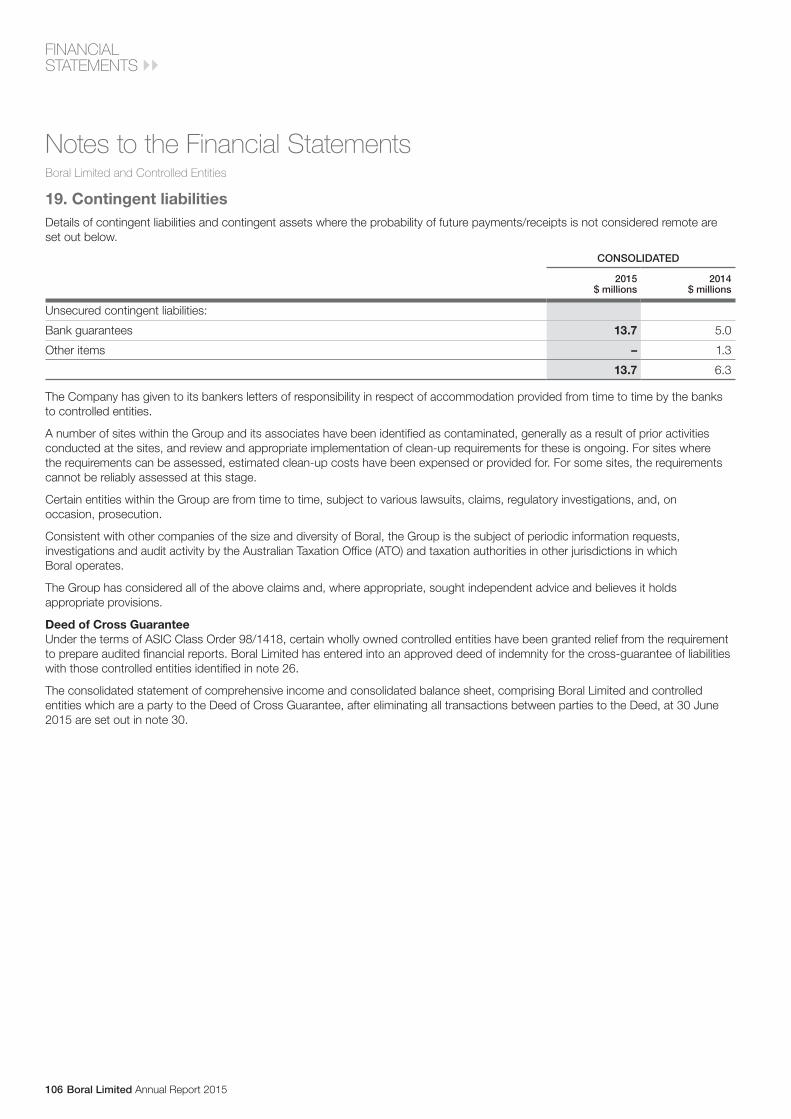
Boral Limited Annual Report 2015106
FINANCIAL STATEMENTS
19. Contingent liabilitiesDetails of contingent liabilities and contingent assets where the probability of future payments/receipts is not considered remote are set out below.
CONSOLIDATED
2015 $ millions
2014 $ millions
Unsecured contingent liabilities:
Bank guarantees 13.7 5.0
Other items – 1.3
13.7 6.3
The Company has given to its bankers letters of responsibility in respect of accommodation provided from time to time by the banks to controlled entities.
A number of sites within the Group and its associates have been identified as contaminated, generally as a result of prior activities conducted at the sites, and review and appropriate implementation of clean-up requirements for these is ongoing. For sites where the requirements can be assessed, estimated clean-up costs have been expensed or provided for. For some sites, the requirements cannot be reliably assessed at this stage.
Certain entities within the Group are from time to time, subject to various lawsuits, claims, regulatory investigations, and, on occasion, prosecution.
Consistent with other companies of the size and diversity of Boral, the Group is the subject of periodic information requests, investigations and audit activity by the Australian Taxation Office (ATO) and taxation authorities in other jurisdictions in which Boral operates.
The Group has considered all of the above claims and, where appropriate, sought independent advice and believes it holds appropriate provisions.
Deed of Cross GuaranteeUnder the terms of ASIC Class Order 98/1418, certain wholly owned controlled entities have been granted relief from the requirement to prepare audited financial reports. Boral Limited has entered into an approved deed of indemnity for the cross-guarantee of liabilities with those controlled entities identified in note 26.
The consolidated statement of comprehensive income and consolidated balance sheet, comprising Boral Limited and controlled entities which are a party to the Deed of Cross Guarantee, after eliminating all transactions between parties to the Deed, at 30 June 2015 are set out in note 30.
Notes to the Financial StatementsBoral Limited and Controlled Entities
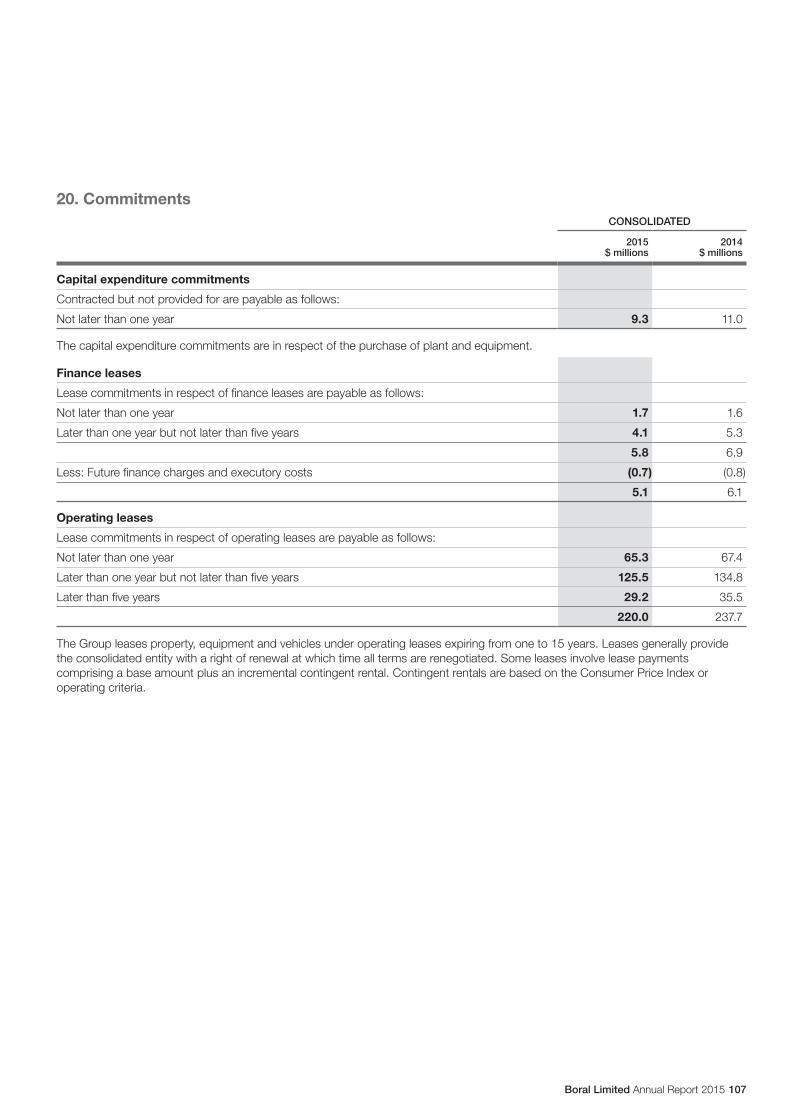
Boral Limited Annual Report 2015 107
20. CommitmentsCONSOLIDATED
2015 $ millions
2014 $ millions
Capital expenditure commitments
Contracted but not provided for are payable as follows:
Not later than one year 9.3 11.0
The capital expenditure commitments are in respect of the purchase of plant and equipment.
Finance leases
Lease commitments in respect of finance leases are payable as follows:
Not later than one year 1.7 1.6
Later than one year but not later than five years 4.1 5.3
5.8 6.9
Less: Future finance charges and executory costs (0.7) (0.8)
5.1 6.1
Operating leases
Lease commitments in respect of operating leases are payable as follows:
Not later than one year 65.3 67.4
Later than one year but not later than five years 125.5 134.8
Later than five years 29.2 35.5
220.0 237.7
The Group leases property, equipment and vehicles under operating leases expiring from one to 15 years. Leases generally provide the consolidated entity with a right of renewal at which time all terms are renegotiated. Some leases involve lease payments comprising a base amount plus an incremental contingent rental. Contingent rentals are based on the Consumer Price Index or operating criteria.
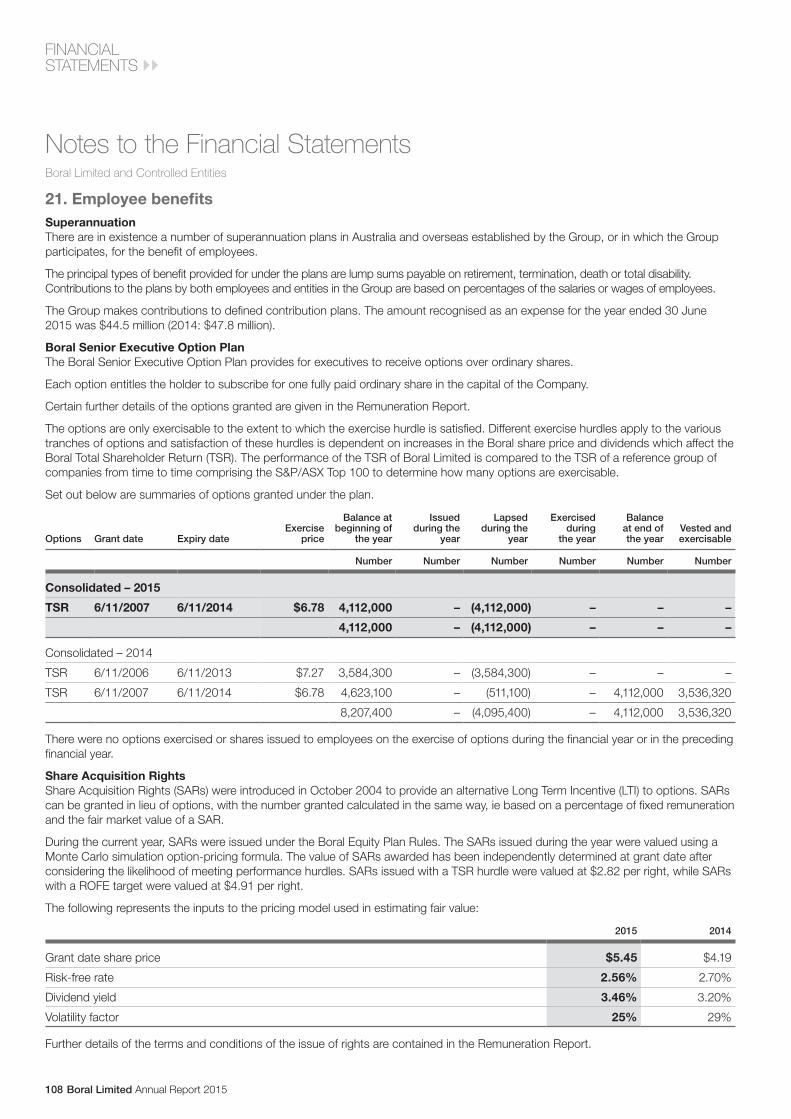
Boral Limited Annual Report 2015108
FINANCIAL STATEMENTS
21. Employee benefitsSuperannuationThere are in existence a number of superannuation plans in Australia and overseas established by the Group, or in which the Group participates, for the benefit of employees.
The principal types of benefit provided for under the plans are lump sums payable on retirement, termination, death or total disability. Contributions to the plans by both employees and entities in the Group are based on percentages of the salaries or wages of employees.
The Group makes contributions to defined contribution plans. The amount recognised as an expense for the year ended 30 June 2015 was $44.5 million (2014: $47.8 million).
Boral Senior Executive Option PlanThe Boral Senior Executive Option Plan provides for executives to receive options over ordinary shares.
Each option entitles the holder to subscribe for one fully paid ordinary share in the capital of the Company.
Certain further details of the options granted are given in the Remuneration Report.
The options are only exercisable to the extent to which the exercise hurdle is satisfied. Different exercise hurdles apply to the various tranches of options and satisfaction of these hurdles is dependent on increases in the Boral share price and dividends which affect the Boral Total Shareholder Return (TSR). The performance of the TSR of Boral Limited is compared to the TSR of a reference group of companies from time to time comprising the S&P/ASX Top 100 to determine how many options are exercisable.
Set out below are summaries of options granted under the plan.
Options Grant date Expiry dateExercise
price
Balance at beginning of
the year
Issued during the
year
Lapsed during the
year
Exercised during
the year
Balance at end of the year
Vested and exercisable
Number Number Number Number Number Number
Consolidated – 2015
TSR 6/11/2007 6/11/2014 $6.78 4,112,000 – (4,112,000) – – –
4,112,000 – (4,112,000) – – –
Consolidated – 2014
TSR 6/11/2006 6/11/2013 $7.27 3,584,300 – (3,584,300) – – –
TSR 6/11/2007 6/11/2014 $6.78 4,623,100 – (511,100) – 4,112,000 3,536,320
8,207,400 – (4,095,400) – 4,112,000 3,536,320
There were no options exercised or shares issued to employees on the exercise of options during the financial year or in the preceding financial year.
Share Acquisition RightsShare Acquisition Rights (SARs) were introduced in October 2004 to provide an alternative Long Term Incentive (LTI) to options. SARs can be granted in lieu of options, with the number granted calculated in the same way, ie based on a percentage of fixed remuneration and the fair market value of a SAR.
During the current year, SARs were issued under the Boral Equity Plan Rules. The SARs issued during the year were valued using a Monte Carlo simulation option-pricing formula. The value of SARs awarded has been independently determined at grant date after considering the likelihood of meeting performance hurdles. SARs issued with a TSR hurdle were valued at $2.82 per right, while SARs with a ROFE target were valued at $4.91 per right.
The following represents the inputs to the pricing model used in estimating fair value:
2015 2014
Grant date share price $5.45 $4.19
Risk-free rate 2.56% 2.70%
Dividend yield 3.46% 3.20%
Volatility factor 25% 29%
Further details of the terms and conditions of the issue of rights are contained in the Remuneration Report.
Notes to the Financial StatementsBoral Limited and Controlled Entities

Boral Limited Annual Report 2015 109
21. Employee benefits (continued)Share Acquisition Rights (continued)Set out below are summaries of share acquisition rights granted under the plans.
Rights Grant date Expiry dateExercise
price
Balance at beginning of
the year
Issued during the
year
Cancelled during
the year
Vested and exercised
during the year
Balance at end of the year
Number Number Number Number Number
Consolidated – 2015
TSR 6/11/2007 6/11/2014 $0.00 51,642 – (51,642) – –
TSR 3/11/2008 3/11/2015 $0.00 911,244 – (108,905) – 802,339
TSR 5/11/2009 5/11/2016 $0.00 1,397,351 – (151,623) – 1,245,728
TSR 12/11/2010 12/11/2017 $0.00 1,778,206 – (43,715) – 1,734,491
TSR 1/9/2011 1/9/2018 $0.00 3,243,321 – (680,839) – 2,562,482
TSR 1/9/2012 1/9/2019 $0.00 2,929,230 – (248,414) – 2,680,816
TSR 1/9/2013 1/9/2016 $0.00 2,760,235 – (305,352) – 2,454,883
ROFE 1/9/2013 1/9/2016 $0.00 1,380,117 – (152,676) – 1,227,441
TSR 1/9/2014 1/9/2017 $0.00 – 1,962,920 (105,005) – 1,857,915
ROFE 1/9/2014 1/9/2017 $0.00 – 981,460 (52,502) – 928,958
Deferred STI 1/9/2014 1/9/2016 $0.00 – 606,580 (26,893) – 579,687
14,451,346 3,550,960 (1,927,566) – 16,074,740
Consolidated – 2014
TSR 6/11/2006 6/11/2013 $0.00 205,049 – (205,049) – –
TSR 6/11/2007 6/11/2014 $0.00 70,250 – (18,608) – 51,642
TSR 3/11/2008 3/11/2015 $0.00 1,237,637 – (326,393) – 911,244
TSR 5/11/2009 5/11/2016 $0.00 1,788,789 – (391,438) – 1,397,351
TSR 12/11/2010 12/11/2017 $0.00 2,440,347 – (662,141) – 1,778,206
TSR 1/9/2011 1/9/2018 $0.00 3,574,508 – (331,187) – 3,243,321
TSR 1/9/2012 1/9/2019 $0.00 3,558,907 – (629,677) – 2,929,230
TSR 1/9/2013 1/9/2016 $0.00 – 2,885,300 (125,065) – 2,760,235
ROFE 1/9/2013 1/9/2016 $0.00 – 1,442,650 (62,533) – 1,380,117
12,875,487 4,327,950 (2,752,091) – 14,451,346
During the year ended 30 June 2015, the consolidated entity recognised an expense of $10.6 million (2014: $7.2 million) in relation to share-based payments.
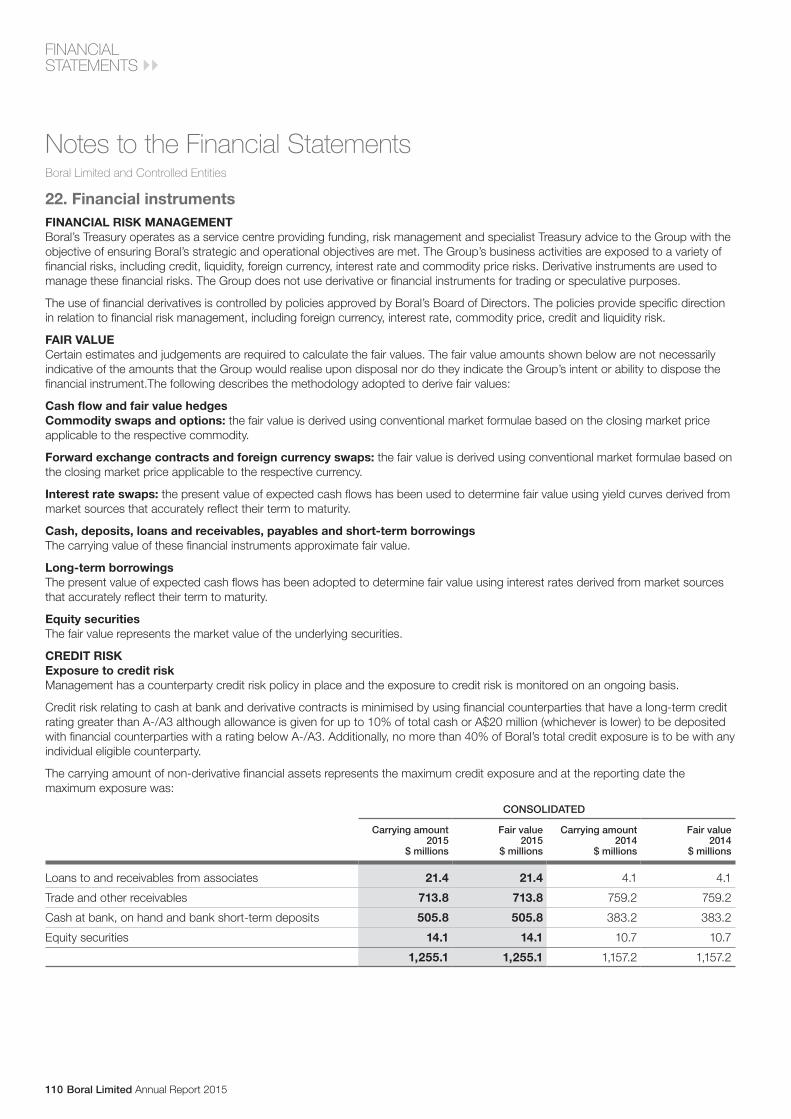
Boral Limited Annual Report 2015110
FINANCIAL STATEMENTS
22. Financial instrumentsFINANCIAL RISK MANAGEMENTBoral’s Treasury operates as a service centre providing funding, risk management and specialist Treasury advice to the Group with the objective of ensuring Boral’s strategic and operational objectives are met. The Group’s business activities are exposed to a variety of financial risks, including credit, liquidity, foreign currency, interest rate and commodity price risks. Derivative instruments are used to manage these financial risks. The Group does not use derivative or financial instruments for trading or speculative purposes.
The use of financial derivatives is controlled by policies approved by Boral’s Board of Directors. The policies provide specific direction in relation to financial risk management, including foreign currency, interest rate, commodity price, credit and liquidity risk.
FAIR VALUECertain estimates and judgements are required to calculate the fair values. The fair value amounts shown below are not necessarily indicative of the amounts that the Group would realise upon disposal nor do they indicate the Group’s intent or ability to dispose the financial instrument.The following describes the methodology adopted to derive fair values:
Cash flow and fair value hedgesCommodity swaps and options: the fair value is derived using conventional market formulae based on the closing market price applicable to the respective commodity.
Forward exchange contracts and foreign currency swaps: the fair value is derived using conventional market formulae based on the closing market price applicable to the respective currency.
Interest rate swaps: the present value of expected cash flows has been used to determine fair value using yield curves derived from market sources that accurately reflect their term to maturity.
Cash, deposits, loans and receivables, payables and short-term borrowingsThe carrying value of these financial instruments approximate fair value.
Long-term borrowingsThe present value of expected cash flows has been adopted to determine fair value using interest rates derived from market sources that accurately reflect their term to maturity.
Equity securitiesThe fair value represents the market value of the underlying securities.
CREDIT RISKExposure to credit riskManagement has a counterparty credit risk policy in place and the exposure to credit risk is monitored on an ongoing basis.
Credit risk relating to cash at bank and derivative contracts is minimised by using financial counterparties that have a long-term credit rating greater than A-/A3 although allowance is given for up to 10% of total cash or A$20 million (whichever is lower) to be deposited with financial counterparties with a rating below A-/A3. Additionally, no more than 40% of Boral’s total credit exposure is to be with any individual eligible counterparty.
The carrying amount of non-derivative financial assets represents the maximum credit exposure and at the reporting date the maximum exposure was:
CONSOLIDATED
Carrying amount 2015
$ millions
Fair value 2015
$ millions
Carrying amount 2014
$ millions
Fair value 2014
$ millions
Loans to and receivables from associates 21.4 21.4 4.1 4.1
Trade and other receivables 713.8 713.8 759.2 759.2
Cash at bank, on hand and bank short-term deposits 505.8 505.8 383.2 383.2
Equity securities 14.1 14.1 10.7 10.7
1,255.1 1,255.1 1,157.2 1,157.2
Notes to the Financial StatementsBoral Limited and Controlled Entities

Boral Limited Annual Report 2015 111
22. Financial instruments (continued)CREDIT RISK (continued)The following table indicates maximum credit exposure, the periods in which the cash flows associated with derivative financial assets are expected to occur and the impact on profit or loss:
CONSOLIDATED
30 June 2015
Carrying amount
$ millionsFair value $ millions
Contractual cash flows
$ millions
6 months or less
$ millions
6-12 months
$ millions1-2 years $ millions
2-5 years $ millions
More than 5 years
$ millions
Derivative financial assets
Forward exchange contracts designated as cash flow hedges
0.4 0.4 0.4 0.4 – – – –
Interest rate swaps designated as fair value hedges
1.5 1.5 1.4 (1.0) 1.4 1.5 (0.5) –
Commodity swaps designated as cash flow hedges
2.7 2.7 2.7 1.3 0.8 0.6 – –
Cross currency swaps designated as fair value hedges
20.6 20.6 21.3 2.6 4.0 14.7 – –
25.2 25.2 25.8 3.3 6.2 16.8 (0.5) –
CONSOLIDATED
30 June 2014
Carrying amount
$ millionsFair value $ millions
Contractual cash flows
$ millions
6 months or less
$ millions
6-12 months
$ millions1-2 years $ millions
2-5 years $ millions
More than 5 years
$ millions
Derivative financial assets
Interest rate swaps designated as fair value hedges
0.7 0.7 0.6 (0.7) 1.3 – – –
Commodity swaps designated as cash flow hedges
1.2 1.2 1.2 0.9 0.3 – – –
Cross currency swaps designated as fair value hedges
3.3 3.3 3.4 1.3 2.1 – – –
Cross currency swaps designated as natural investment hedges
14.8 14.8 15.2 0.7 2.5 4.8 13.5 (6.3)
20.0 20.0 20.4 2.2 6.2 4.8 13.5 (6.3)
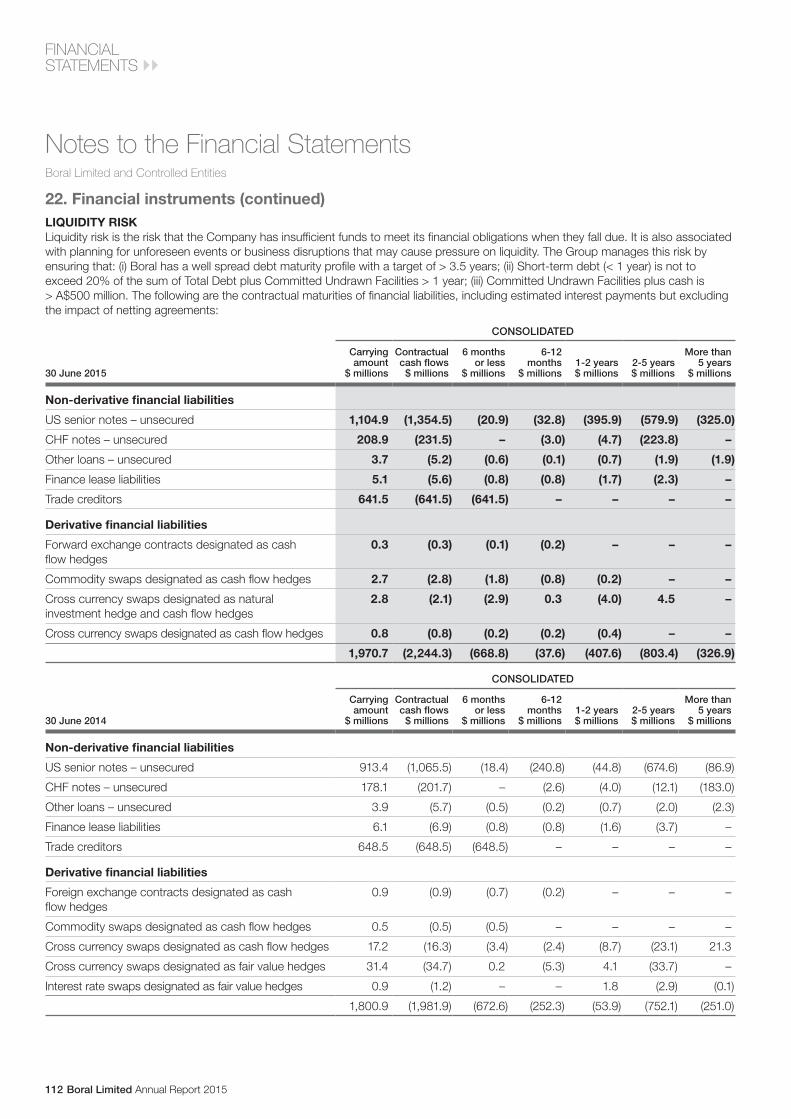
Boral Limited Annual Report 2015112
FINANCIAL STATEMENTS
22. Financial instruments (continued)LIQUIDITY RISKLiquidity risk is the risk that the Company has insufficient funds to meet its financial obligations when they fall due. It is also associated with planning for unforeseen events or business disruptions that may cause pressure on liquidity. The Group manages this risk by ensuring that: (i) Boral has a well spread debt maturity profile with a target of > 3.5 years; (ii) Short-term debt (< 1 year) is not to exceed 20% of the sum of Total Debt plus Committed Undrawn Facilities > 1 year; (iii) Committed Undrawn Facilities plus cash is > A$500 million. The following are the contractual maturities of financial liabilities, including estimated interest payments but excluding the impact of netting agreements:
CONSOLIDATED
30 June 2015
Carrying amount
$ millions
Contractual cash flows
$ millions
6 months or less
$ millions
6-12 months
$ millions1-2 years $ millions
2-5 years $ millions
More than 5 years
$ millions
Non-derivative financial liabilities
US senior notes – unsecured 1,104.9 (1,354.5) (20.9) (32.8) (395.9) (579.9) (325.0)
CHF notes – unsecured 208.9 (231.5) – (3.0) (4.7) (223.8) –
Other loans – unsecured 3.7 (5.2) (0.6) (0.1) (0.7) (1.9) (1.9)
Finance lease liabilities 5.1 (5.6) (0.8) (0.8) (1.7) (2.3) –
Trade creditors 641.5 (641.5) (641.5) – – – –
Derivative financial liabilities
Forward exchange contracts designated as cashflow hedges
0.3 (0.3) (0.1) (0.2) – – –
Commodity swaps designated as cash flow hedges 2.7 (2.8) (1.8) (0.8) (0.2) – –
Cross currency swaps designated as natural investment hedge and cash flow hedges
2.8 (2.1) (2.9) 0.3 (4.0) 4.5 –
Cross currency swaps designated as cash flow hedges 0.8 (0.8) (0.2) (0.2) (0.4) – –
1,970.7 (2,244.3) (668.8) (37.6) (407.6) (803.4) (326.9)
CONSOLIDATED
30 June 2014
Carrying amount
$ millions
Contractual cash flows
$ millions
6 months or less
$ millions
6-12 months
$ millions1-2 years $ millions
2-5 years $ millions
More than 5 years
$ millions
Non-derivative financial liabilities
US senior notes – unsecured 913.4 (1,065.5) (18.4) (240.8) (44.8) (674.6) (86.9)
CHF notes – unsecured 178.1 (201.7) – (2.6) (4.0) (12.1) (183.0)
Other loans – unsecured 3.9 (5.7) (0.5) (0.2) (0.7) (2.0) (2.3)
Finance lease liabilities 6.1 (6.9) (0.8) (0.8) (1.6) (3.7) –
Trade creditors 648.5 (648.5) (648.5) – – – –
Derivative financial liabilities
Foreign exchange contracts designated as cashflow hedges
0.9 (0.9) (0.7) (0.2) – – –
Commodity swaps designated as cash flow hedges 0.5 (0.5) (0.5) – – – –
Cross currency swaps designated as cash flow hedges 17.2 (16.3) (3.4) (2.4) (8.7) (23.1) 21.3
Cross currency swaps designated as fair value hedges 31.4 (34.7) 0.2 (5.3) 4.1 (33.7) –
Interest rate swaps designated as fair value hedges 0.9 (1.2) – – 1.8 (2.9) (0.1)
1,800.9 (1,981.9) (672.6) (252.3) (53.9) (752.1) (251.0)
Notes to the Financial StatementsBoral Limited and Controlled Entities
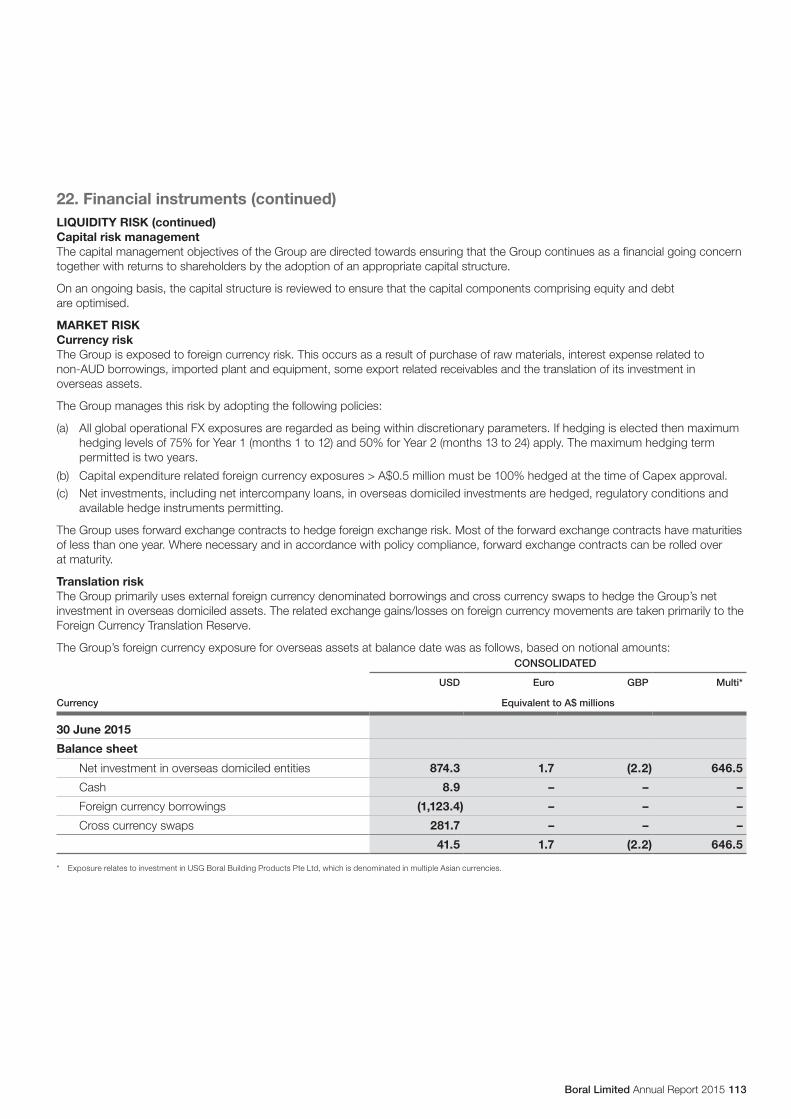
Boral Limited Annual Report 2015 113
22. Financial instruments (continued)LIQUIDITY RISK (continued)Capital risk managementThe capital management objectives of the Group are directed towards ensuring that the Group continues as a financial going concern together with returns to shareholders by the adoption of an appropriate capital structure.
On an ongoing basis, the capital structure is reviewed to ensure that the capital components comprising equity and debt are optimised.
MARKET RISKCurrency riskThe Group is exposed to foreign currency risk. This occurs as a result of purchase of raw materials, interest expense related to non-AUD borrowings, imported plant and equipment, some export related receivables and the translation of its investment in overseas assets.
The Group manages this risk by adopting the following policies:
(a) All global operational FX exposures are regarded as being within discretionary parameters. If hedging is elected then maximum hedging levels of 75% for Year 1 (months 1 to 12) and 50% for Year 2 (months 13 to 24) apply. The maximum hedging term permitted is two years.
(b) Capital expenditure related foreign currency exposures > A$0.5 million must be 100% hedged at the time of Capex approval.(c) Net investments, including net intercompany loans, in overseas domiciled investments are hedged, regulatory conditions and
available hedge instruments permitting.
The Group uses forward exchange contracts to hedge foreign exchange risk. Most of the forward exchange contracts have maturities of less than one year. Where necessary and in accordance with policy compliance, forward exchange contracts can be rolled over at maturity.
Translation riskThe Group primarily uses external foreign currency denominated borrowings and cross currency swaps to hedge the Group’s net investment in overseas domiciled assets. The related exchange gains/losses on foreign currency movements are taken primarily to the Foreign Currency Translation Reserve.
The Group’s foreign currency exposure for overseas assets at balance date was as follows, based on notional amounts:CONSOLIDATED
USD Euro GBP Multi*
Currency Equivalent to A$ millions
30 June 2015
Balance sheet
Net investment in overseas domiciled entities 874.3 1.7 (2.2) 646.5
Cash 8.9 – – –
Foreign currency borrowings (1,123.4) – – –
Cross currency swaps 281.7 – – –
41.5 1.7 (2.2) 646.5
* Exposure relates to investment in USG Boral Building Products Pte Ltd, which is denominated in multiple Asian currencies.
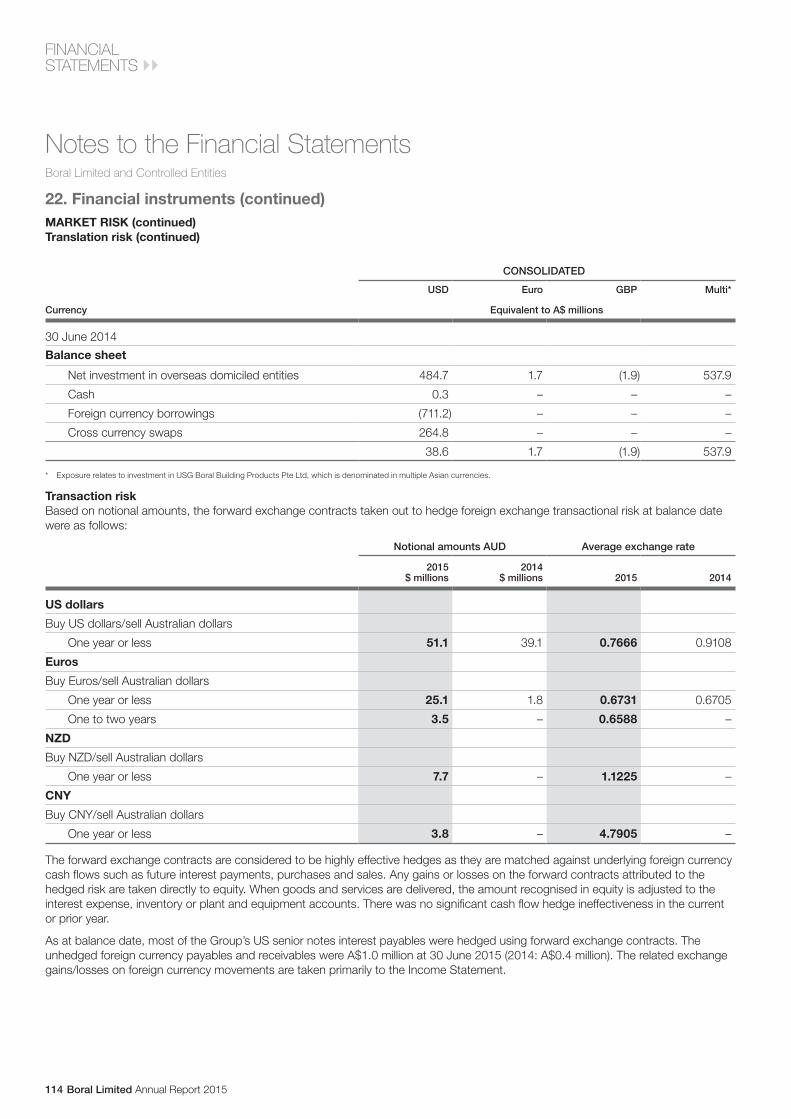
Boral Limited Annual Report 2015114
FINANCIAL STATEMENTS
Notes to the Financial StatementsBoral Limited and Controlled Entities
22. Financial instruments (continued)MARKET RISK (continued)Translation risk (continued)
CONSOLIDATED
USD Euro GBP Multi*
Currency Equivalent to A$ millions
30 June 2014
Balance sheet
Net investment in overseas domiciled entities 484.7 1.7 (1.9) 537.9
Cash 0.3 – – –
Foreign currency borrowings (711.2) – – –
Cross currency swaps 264.8 – – –
38.6 1.7 (1.9) 537.9
* Exposure relates to investment in USG Boral Building Products Pte Ltd, which is denominated in multiple Asian currencies.
Transaction riskBased on notional amounts, the forward exchange contracts taken out to hedge foreign exchange transactional risk at balance date were as follows:
Notional amounts AUD Average exchange rate
2015 $ millions
2014 $ millions 2015 2014
US dollars
Buy US dollars/sell Australian dollars
One year or less 51.1 39.1 0.7666 0.9108
Euros
Buy Euros/sell Australian dollars
One year or less 25.1 1.8 0.6731 0.6705
One to two years 3.5 – 0.6588 –
NZD
Buy NZD/sell Australian dollars
One year or less 7.7 – 1.1225 –
CNY
Buy CNY/sell Australian dollars
One year or less 3.8 – 4.7905 –
The forward exchange contracts are considered to be highly effective hedges as they are matched against underlying foreign currency cash flows such as future interest payments, purchases and sales. Any gains or losses on the forward contracts attributed to the hedged risk are taken directly to equity. When goods and services are delivered, the amount recognised in equity is adjusted to the interest expense, inventory or plant and equipment accounts. There was no significant cash flow hedge ineffectiveness in the current or prior year.
As at balance date, most of the Group’s US senior notes interest payables were hedged using forward exchange contracts. The unhedged foreign currency payables and receivables were A$1.0 million at 30 June 2015 (2014: A$0.4 million). The related exchange gains/losses on foreign currency movements are taken primarily to the Income Statement.
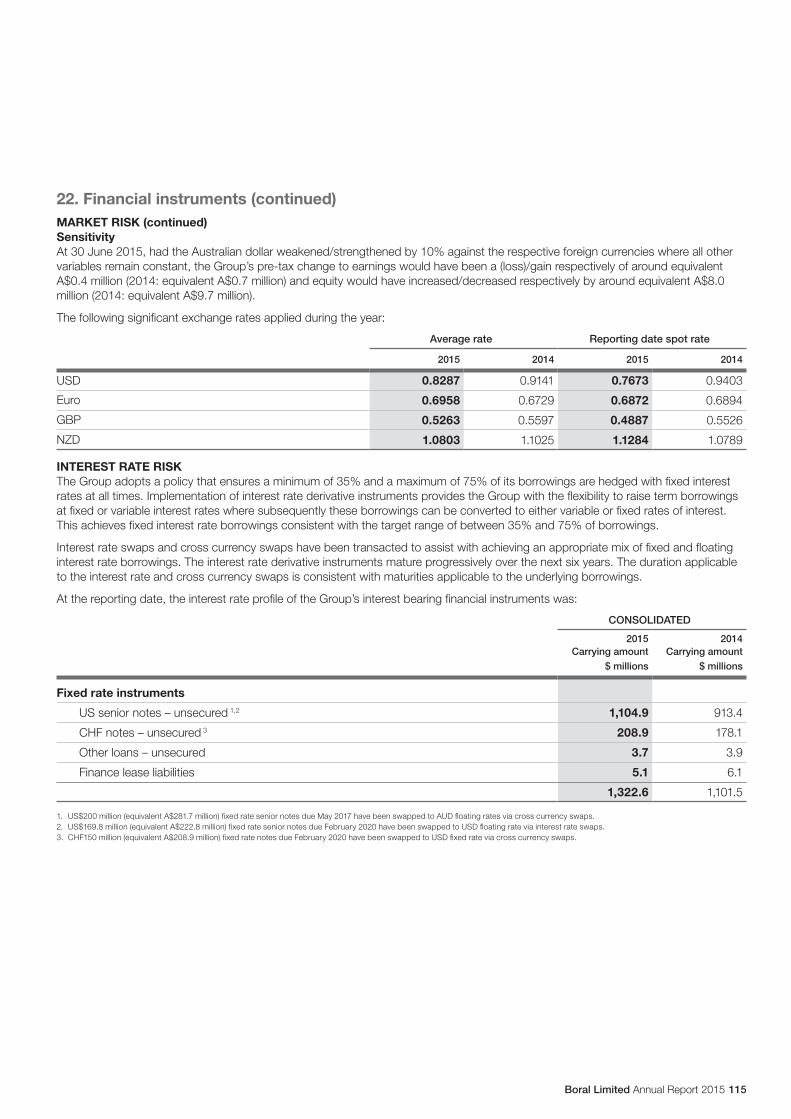
Boral Limited Annual Report 2015 115
22. Financial instruments (continued)MARKET RISK (continued)SensitivityAt 30 June 2015, had the Australian dollar weakened/strengthened by 10% against the respective foreign currencies where all other variables remain constant, the Group’s pre-tax change to earnings would have been a (loss)/gain respectively of around equivalent A$0.4 million (2014: equivalent A$0.7 million) and equity would have increased/decreased respectively by around equivalent A$8.0 million (2014: equivalent A$9.7 million).
The following significant exchange rates applied during the year:
Average rate Reporting date spot rate
2015 2014 2015 2014
USD 0.8287 0.9141 0.7673 0.9403
Euro 0.6958 0.6729 0.6872 0.6894
GBP 0.5263 0.5597 0.4887 0.5526
NZD 1.0803 1.1025 1.1284 1.0789
INTEREST RATE RISKThe Group adopts a policy that ensures a minimum of 35% and a maximum of 75% of its borrowings are hedged with fixed interest rates at all times. Implementation of interest rate derivative instruments provides the Group with the flexibility to raise term borrowings at fixed or variable interest rates where subsequently these borrowings can be converted to either variable or fixed rates of interest. This achieves fixed interest rate borrowings consistent with the target range of between 35% and 75% of borrowings.
Interest rate swaps and cross currency swaps have been transacted to assist with achieving an appropriate mix of fixed and floating interest rate borrowings. The interest rate derivative instruments mature progressively over the next six years. The duration applicable to the interest rate and cross currency swaps is consistent with maturities applicable to the underlying borrowings.
At the reporting date, the interest rate profile of the Group’s interest bearing financial instruments was:
CONSOLIDATED
2015 2014 Carrying amount Carrying amount
$ millions $ millions
Fixed rate instruments
US senior notes – unsecured 1,2 1,104.9 913.4
CHF notes – unsecured 3 208.9 178.1
Other loans – unsecured 3.7 3.9
Finance lease liabilities 5.1 6.1
1,322.6 1,101.5
1. US$200 million (equivalent A$281.7 million) fixed rate senior notes due May 2017 have been swapped to AUD floating rates via cross currency swaps.2. US$169.8 million (equivalent A$222.8 million) fixed rate senior notes due February 2020 have been swapped to USD floating rate via interest rate swaps.3. CHF150 million (equivalent A$208.9 million) fixed rate notes due February 2020 have been swapped to USD fixed rate via cross currency swaps.

Boral Limited Annual Report 2015116
FINANCIAL STATEMENTS
Notes to the Financial StatementsBoral Limited and Controlled Entities
22. Financial instruments (continued)INTEREST RATE RISK (continued)
CONSOLIDATED
2015 2014 Fair value Fair value
$ millions $ millions
Interest rate derivatives – (asset)/liability
Pay fixed interest rate derivatives
Cross currency swap pay fixed US$ rate 2.8 0.5
2.8 0.5
Pay variable interest rate derivatives
Interest rate swap pay floating US$ LIBOR (1.5) 0.2
Cross currency swap pay floating A$ BBSW (19.8) 30.0
(21.3) 30.2
SensitivityAt 30 June 2015, if interest rates had changed by +/- 1% pa from the year end rates with all other variables held constant, the Group’s pre-tax profit for the year would have been A$0.4 million higher/lower (2014: A$0.7 million) and the change in equity would have been A$0.3 million (2014: A$0.7 million) mainly as a result of a higher interest cost applying to interest rate derivatives.
INTEREST RATES USED FOR DETERMINING FAIR VALUEWhere appropriate, the Group uses BBSW, LIBOR and Treasury Bond yield curves as of 30 June 2015 plus an adequate credit spread to discount financial instruments. The interest rates used are as follows:
2015 % pa
2014 % pa
Derivatives 2.40 – 4.00 2.35 – 4.00
Interest bearing loans and borrowings 2.25 – 8.94 2.25 – 8.94
Finance leases 5.64 – 8.49 5.64 – 8.49
COMMODITY PRICE RISKThe Group is exposed to commodity price risk that is associated with the purchase of petroleum, natural gas, electricity and coal purchases under variable price contract arrangements. The Group adopts a policy where the only commodity exposure where compulsory hedging applies is diesel for the Australia Business and this hedging is to be in AUD. All other global commodity exposures fall within discretionary hedging parameters. If hedging is elected then a minimum of 50% of the Australian Diesel exposure is to be hedged for a period of not less than six months with maximum hedging levels of 75% for Year 1 (months 1 to 12) and 50% for Year 2 (months 13 to 24). The maximum permitted term for a hedge transaction is two years.
The Group uses commodity swaps to hedge commodity price risk. All of the commodity swaps have maturities of less than two years.
Commodities hedging activitiesNotional value of commodity derivative instruments at year end is as follows:
CONSOLIDATED
2015 $ millions
2014 $ millions
Singapore gasoil 0.05% 45.8 25.8
Natural gas (NYMEX) 10.7 9.1
Newcastle Coal 5.9 2.7

Boral Limited Annual Report 2015 117
22. Financial instruments (continued)COMMODITY PRICE RISK (continued)Commodities hedging activities (continued)Details of balance sheet carrying value/fair value of instruments hedging commodities price risk:
CONSOLIDATED
2015 $ millions
2014 $ millions
Assets
Commodity swaps designated as cash flow hedges 2.7 1.2
Liabilities
Commodity swaps designated as cash flow hedges (2.7) (0.5)
– 0.7
The commodity swaps are considered to be highly effective hedges as they are matched against forward commodity purchases. The ineffective portion of the hedges transferred to the Income Statement was Nil in 2015 (2014: Nil).
SensitivityAt 30 June 2015, if the commodity price had changed by +/- 10% from the year end prices with all other variables held constant, the Group’s pre-tax earnings for the year would be unchanged (2014: unchanged) and the change in equity would have been A$6.2 million (2014: A$3.8 million).
Master netting or similar agreementsThe Group enters into derivative transactions under International Swaps and Derivatives Association (ISDA) master netting agreements. The ISDA agreements do not meet the criteria for offsetting on the Balance Sheet.
Accordingly, derivatives have been disclosed on a gross basis on the Balance Sheet.
THE FAIR VALUE HIERARCHYThe table below analyses financial instruments carried at fair value, by valuation method. The different levels have been defined as follows:
Level 1 – Quoted prices (unadjusted) in active markets for identical assets or liabilities.
Level 2 – Inputs other than quoted prices included within level 1 that are observable for the asset or liability, either directly (ie as prices) or indirectly (ie derived from prices).
Level 3 – Inputs for the asset or liability that are not based on observable market data.
The Group’s financial instruments that are measured and recognised at fair value include:
• financial assets, including derivatives used for hedging (interest rate swaps, commodity swaps, cross currency swaps); and
• financial liabilities, including derivatives used for hedging (forward exchange contracts, commodity swaps, interest rate swaps, cross currency swaps).
The Group does not have financial instruments that have been valued at Level 3.
The following table presents the Group’s financial assets and liabilities that are measured at Level 1 and Level 2 fair value:
Level 1 Level 2
2015 $ millions
2014 $ millions
2015 $ millions
2014 $ millions
Assets
Equity securities 14.1 10.7 – –
Derivatives used for hedging – – 25.2 20.0
Total assets 14.1 10.7 25.2 20.0
Liabilities
Derivatives used for hedging – – 6.6 50.9
Total liabilities – – 6.6 50.9

Boral Limited Annual Report 2015118
FINANCIAL STATEMENTS
23. Key management personnel disclosuresThe following were key management personnel (KMPs) of the Group during the reporting period and unless otherwise indicated for the entire period:
DIRECTORSCurrent Directors
Bob Every AO Chairman and Non-executive Director
Mike Kane CEO and Managing Director
Catherine Brenner Non-executive Director
Brian Clark Non-executive Director
Eileen Doyle Non-executive Director
Kathyrn Fagg Non-executive Director (appointed 15 September 2014)
John Marlay Non-executive Director
Paul Rayner Non-executive Director
Former DirectorMr Richard Longes held the position of Non-executive Director until 6 November 2014 on which date he retired from the Board.
EXECUTIVESCurrent Executives
Al Borm President and CEO Boral USA
Joseph Goss Divisional Managing Director – Boral Construction Materials & Cement
Ross Harper Executive General Manager – Cement from 1 July 2014
David Mariner Executive General Manager – Boral Building Products from 1 January 2015
Rosaline Ng Chief Financial Officer of Boral Limited
Former ExecutivesMr Darren Schulz held the position of Executive General Manager – Boral Building Products until his resignation effective 28 November 2014.
KEY MANAGEMENT PERSONNEL COMPENSATIONThe key management personnel compensation included in “employee benefits expense” in note 3 is as follows:
CONSOLIDATED
2015 $’000
2014 $’000
Short-term employee benefits 10,888.5 9,437.4
Post-employment benefits 252.3 273.9
Termination benefits – 798.6
Share-based payments 3,251.1 1,526.1
Long-term employee benefits 81.8 52.1
14,473.7 12,088.1
June 2014 comparatives include key management personnel for that year.
Notes to the Financial StatementsBoral Limited and Controlled Entities
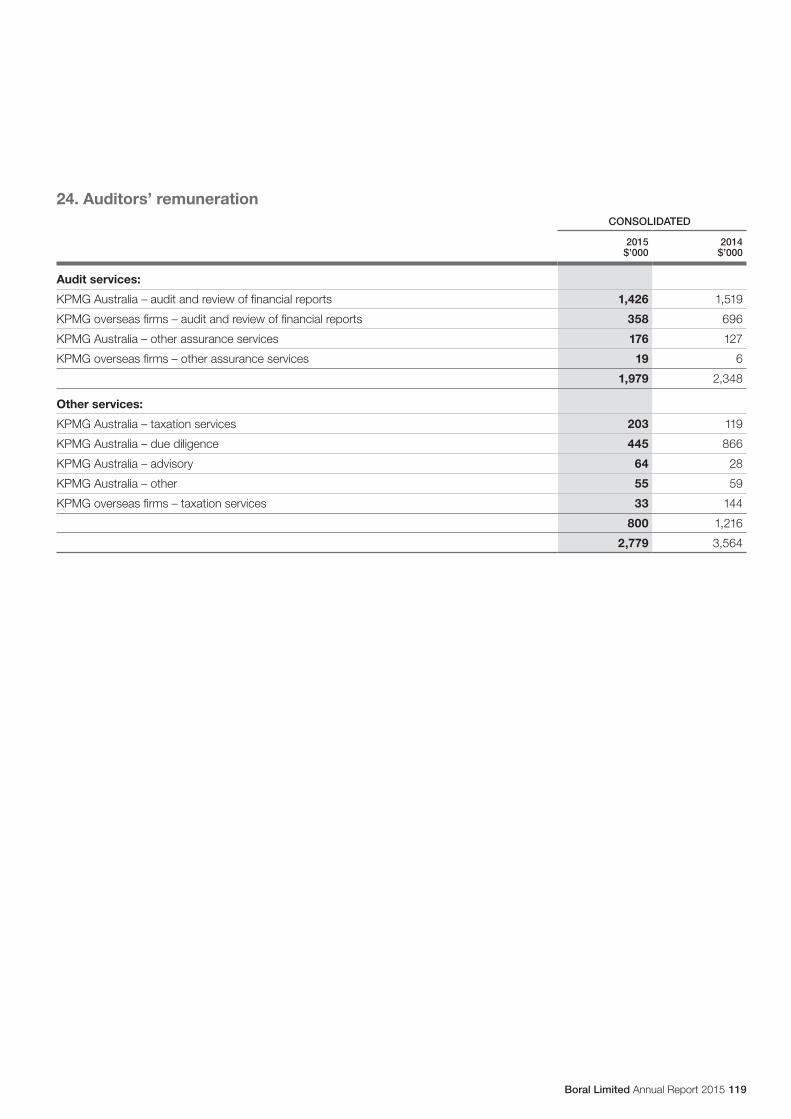
Boral Limited Annual Report 2015 119
24. Auditors’ remunerationCONSOLIDATED
2015 $’000
2014 $’000
Audit services:
KPMG Australia – audit and review of financial reports 1,426 1,519
KPMG overseas firms – audit and review of financial reports 358 696
KPMG Australia – other assurance services 176 127
KPMG overseas firms – other assurance services 19 6
1,979 2,348
Other services:
KPMG Australia – taxation services 203 119
KPMG Australia – due diligence 445 866
KPMG Australia – advisory 64 28
KPMG Australia – other 55 59
KPMG overseas firms – taxation services 33 144
800 1,216
2,779 3,564

Boral Limited Annual Report 2015120
FINANCIAL STATEMENTS
25. Acquisition/disposal of controlled entitiesThe following controlled entities were acquired or disposed of during the financial year ended 30 June 2015:
Entities acquired:There were no acquisitions during the year ended 30 June 2015.
Date of loss of control
Entities deregistered:
Boral Industries Ltd (in liquidation) Dec 2014
Boral Building Products (NZ) Ltd (in liquidation) Dec 2014
Boral Finance Inc Jun 2015
Boral Stone LLC merged into Boral Stone Products LLC Jun 2015
The following controlled entities were disposed of during the financial year ended 30 June 2014:
Date of disposal
Entities disposed:
Boral Window Systems Ltd Nov 2013
Boral Gypsum Asia Sdn Bhd and controlled entities Feb 2014
Boral Australian Gypsum Ltd and controlled entities Feb 2014
Name changes during the financial period:
Boral Australian Gypsum Ltd to USG Boral Building Products Pty Limited
Notes to the Financial StatementsBoral Limited and Controlled Entities

Boral Limited Annual Report 2015 121
26. Controlled entitiesControlled entitiesThe financial statements of the following entities have been consolidated to determine the results of the consolidated entity.
Beneficial ownership by
Country of incorporation
Consolidated entity 2015
%
Consolidated entity 2014
%
Boral Limited Australia
Boral Cement Limited > * Australia 100 100
Barnu Pty Ltd * Australia 100 100
Boral Building Materials Pty Ltd > * Australia 100 100
Boral International Pty Ltd > * Australia 100 100
MJI (Thailand) Ltd Thailand 100 100
Boral Concrete (Thailand) Ltd Thailand 100 100
Boral USA< USA 100 100
Boral International Holdings Inc. USA 100 100
Boral Construction Materials LLC USA 100 100
Ready Mixed Concrete Company USA 100 100
Sprat-Platte Ranch Co. LLLP USA 100 100
Morton Lakes LLC USA 100 100
Aggregate Investments LLC USA 100 100
BCM Oklahoma LLC USA 100 100
McCanne Ditch and Reservoir Company USA 100 100
Boral Industries Inc. USA 100 100
Boral Finance Inc. ** USA – 100
Boral Lifetile Inc. USA 100 100
Boral Concrete Tile Inc. USA 100 100
Boral Roofing LLC USA 100 100
Boral Roofing de Mexico S. de R.L. de C.V. Mexico 100 100
E.U.M. Teja de Concreto Servicio Compania S.R.L. de C.V.
Mexico 100 100
Tile Service Company LLC USA 100 100
Boral Bricks Inc. USA 100 100
Dennis Brick Distributors USA 50 50
Boral Composites Inc. USA 100 100
Boral Material Technologies LLC USA 100 100
Boral Stone LLC ** USA – 100
Boral Stone Products LLC USA 100 50
Boral IP Holdings LLC USA 100 100
Boral (UK) Ltd UK 100 100
Boral Investments BV Netherlands 100 100
Boral Industrie GmbH Germany 100 100
Boral Klinker GmbH Germany 100 100
Boral Mecklenburger Ziegel GmbH Germany 100 100
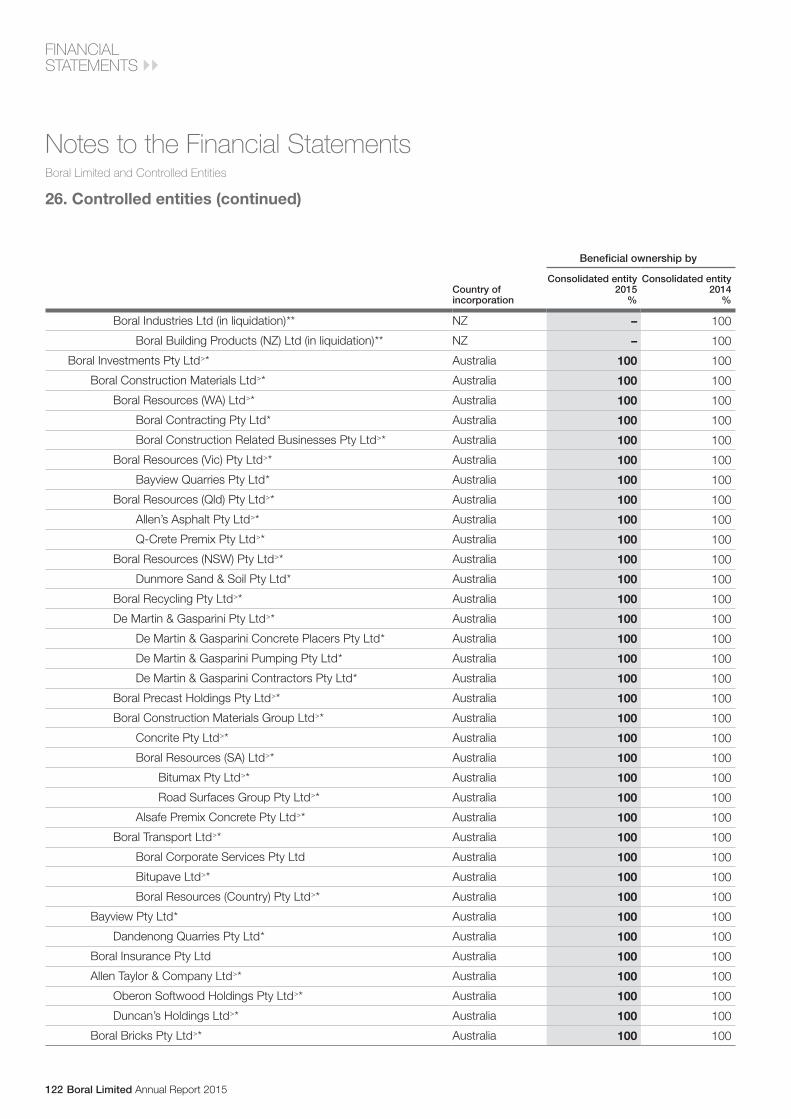
Boral Limited Annual Report 2015122
FINANCIAL STATEMENTS
26. Controlled entities (continued)
Beneficial ownership by
Country of incorporation
Consolidated entity 2015
%
Consolidated entity 2014
%
Boral Industries Ltd (in liquidation) ** NZ – 100
Boral Building Products (NZ) Ltd (in liquidation) ** NZ – 100
Boral Investments Pty Ltd > * Australia 100 100
Boral Construction Materials Ltd > * Australia 100 100
Boral Resources (WA) Ltd > * Australia 100 100
Boral Contracting Pty Ltd * Australia 100 100
Boral Construction Related Businesses Pty Ltd > * Australia 100 100
Boral Resources (Vic) Pty Ltd > * Australia 100 100
Bayview Quarries Pty Ltd * Australia 100 100
Boral Resources (Qld) Pty Ltd > * Australia 100 100
Allen’s Asphalt Pty Ltd > * Australia 100 100
Q-Crete Premix Pty Ltd > * Australia 100 100
Boral Resources (NSW) Pty Ltd > * Australia 100 100
Dunmore Sand & Soil Pty Ltd * Australia 100 100
Boral Recycling Pty Ltd > * Australia 100 100
De Martin & Gasparini Pty Ltd > * Australia 100 100
De Martin & Gasparini Concrete Placers Pty Ltd * Australia 100 100
De Martin & Gasparini Pumping Pty Ltd * Australia 100 100
De Martin & Gasparini Contractors Pty Ltd * Australia 100 100
Boral Precast Holdings Pty Ltd > * Australia 100 100
Boral Construction Materials Group Ltd > * Australia 100 100
Concrite Pty Ltd > * Australia 100 100
Boral Resources (SA) Ltd > * Australia 100 100
Bitumax Pty Ltd > * Australia 100 100
Road Surfaces Group Pty Ltd > * Australia 100 100
Alsafe Premix Concrete Pty Ltd > * Australia 100 100
Boral Transport Ltd > * Australia 100 100
Boral Corporate Services Pty Ltd Australia 100 100
Bitupave Ltd > * Australia 100 100
Boral Resources (Country) Pty Ltd > * Australia 100 100
Bayview Pty Ltd * Australia 100 100
Dandenong Quarries Pty Ltd * Australia 100 100
Boral Insurance Pty Ltd Australia 100 100
Allen Taylor & Company Ltd > * Australia 100 100
Oberon Softwood Holdings Pty Ltd > * Australia 100 100
Duncan’s Holdings Ltd > * Australia 100 100
Boral Bricks Pty Ltd > * Australia 100 100
Notes to the Financial StatementsBoral Limited and Controlled Entities

Boral Limited Annual Report 2015 123
26. Controlled entities (continued)Beneficial ownership by
Country of incorporation
Consolidated entity 2015
%
Consolidated entity 2014
%
Boral Masonry Ltd > * Australia 100 100
Boral Hollostone Masonry (South Aust) Pty Ltd > * Australia 100 100
Boral Montoro Pty Ltd > * Australia 100 100
Boral Timber Fibre Exports Pty Ltd > * Australia 100 100
Boral Shared Business Services Pty Ltd > * Australia 100 100
Boral Building Products Ltd > * Australia 100 100
Boral Bricks Western Australia Pty Ltd > * Australia 100 100
Boral IP Holdings (Australia) Pty Ltd Australia 100 100
> Granted relief by the Australian Securities and Investments Commission from specified accounting requirements in accordance with Class Order (refer to note 29).* Entered into cross guarantee with Boral Limited (refer to note 30).** Deregistered during the year.< A Delaware general partnership.
All the shares held by Boral Limited in controlled entities are ordinary shares.
27. Related party disclosuresCONTROLLED ENTITIESInterests held in controlled entities are set out in note 26.
ASSOCIATED ENTITIESInterests held in associated entities are set out in note 11. The business activities of a number of these entities are conducted under joint venture arrangements. Associated entities conduct business transactions with various controlled entities. Such transactions include purchases and sales of certain products, dividends, interest and loans. All such transactions are conducted on the basis of normal commercial terms and conditions.
DIRECTOR TRANSACTIONS WITH THE GROUPTransactions entered into during the year with Directors of Boral Limited and the Group are within normal employee, customer or supplier relationships on terms and conditions no more favourable than dealings in the same circumstances on an arm’s length basis and include:
• the receipt of dividends from Boral Limited;
• participation in the Boral Long Term Incentive Plan;
• terms and conditions of employment;
• reimbursement of expenses;
• purchases of goods and services.
A number of Directors of the Company hold directorships in other entities. Several of these entities transacted with the Group on terms and conditions no more favourable than those available on an arm’s length basis.

Boral Limited Annual Report 2015124
FINANCIAL STATEMENTS
28. Notes to Statement of Cash FlowsConsolidated
For the year ended 30 June2015
$ millions2014
$ millions
(i) Reconciliation of cash and cash equivalents:
Cash includes cash on hand, at bank and short-term deposits, net of outstanding bank overdrafts. Cash as at the end of the year as shown in the statement of cash flows is reconciled to the related items in the balance sheet as follows:
Cash at bank and on hand 87.9 95.6
Bank short-term deposits 417.9 287.6
505.8 383.2
The bank short-term deposits mature within 90 days and pay interest at a weighted average interest rate of 2.28% (2014: 2.21%).
(ii) Reconciliation of net profit to net cash provided by operating activities:
Net profit 257.0 176.2
Adjustments for non-cash items:
Depreciation and amortisation 248.8 261.4
Discount unwinding – 2.3
Gain on sale of assets and businesses (156.8) (41.4)
Impairment of assets, businesses and demolition costs 106.7 60.0
Share-based payment expense 10.6 7.2
Unrealised foreign exchange gains (6.3) –
Non-cash equity income (27.5) (24.6)
Net cash provided by operating activities before change in assets and liabilities 432.5 441.1
Changes in assets and liabilities net of effects from acquisitions/disposals
– Receivables 81.3 (22.6)
– Inventories (16.5) 49.5
– Payables (15.9) 25.8
– Provisions (53.8) 1.9
– Current and deferred taxes (7.5) 22.3
– Other (1.8) (10.7)
Net cash provided by operating activities 418.3 507.3
(iii) In June 2014, the Group paid $48.4 million in respect of the outstanding liability relating to the acquisition of the Cultured Stone business in the USA.
(iv) Dividends paid are net of dividends reinvested under the Dividend Reinvestment Plan. – 43.8
Notes to the Financial StatementsBoral Limited and Controlled Entities

Boral Limited Annual Report 2015 125
29. Parent entity disclosuresBORAL LIMITED
2015 $ millions
2014 $ millions
RESULT OF THE PARENT ENTITY
Profit after tax 155.7 61.1
Other comprehensive income after tax 6.4 (3.0)
Total comprehensive income for the period 162.1 58.1
FINANCIAL POSITION OF PARENT ENTITY
Current assets 6,989.8 6,272.5
Non-current assets 543.0 475.5
Total assets 7,532.8 6,748.0
Current liabilities 3,142.1 2,645.3
Non-current liabilities 1,111.6 754.1
Total liabilities 4,253.7 3,399.4
Net assets 3,279.1 3,348.6
Issued capital 2,361.6 2,477.6
Reserves 75.8 58.8
Retained earnings 841.7 812.2
Total equity 3,279.1 3,348.6
PARENT ENTITY CONTINGENCIESDetails of contingent liabilities and contingent assets where the probability of future payments/receipts is not considered remote are set out below.
Unsecured contingent liabilities:
Bank guarantees 13.7 5.0
The Company has given to its bankers letters of responsibility in respect of accommodation provided from time to time by the banks to controlled entities.
Certain entities within the Company are subject to various lawsuits and claims in the ordinary course of business.
Consistent with other companies of the size and diversity of Boral, the Company is the subject of periodic information requests, investigations and audit activity by the Australian Taxation Office (ATO) and taxation authorities in other jurisdictions in which Boral operates.
The Company has considered all of the above claims and, where appropriate, sought independent advice and believes it holds appropriate provisions.
Parent entity guarantees in respect of debts of its subsidiariesUnder the terms of ASIC Class Order 98/1418, certain wholly owned controlled entities have been granted relief from the requirement to prepare audited financial reports. The Company has entered into an approved deed of indemnity for the cross-guarantee of liabilities with those controlled entities identified in note 26.
Parent entity capital commitmentsThe parent entity does not have any capital commitments for acquisition of property, plant and equipment at 30 June 2015 (2014: Nil).

Boral Limited Annual Report 2015126
FINANCIAL STATEMENTS
30. Deed of cross guaranteeThe following consolidated statement of comprehensive income and balance sheet comprises Boral Limited and its controlled entities which are party to the Deed of Cross Guarantee (refer to note 26), after eliminating all transactions between parties to the Deed.
CONSOLIDATED
For the year ended 30 June2015
$ millions2014
$ millions
STATEMENT OF COMPREHENSIVE INCOME
Continuing operations
Revenue 3,462.6 3,661.6
Profit before income tax expense 94.4 137.6
Income tax benefit (3.9) 11.8
Profit from continuing operations 90.5 149.4
Discontinued operations
Profit/(loss) from discontinued operations (net of income tax) 13.6 17.8
Net profit 104.1 167.2
Other comprehensive income
Items that may be reclassified subsequently to Income Statement:
Exchange differences from translation of foreign operations taken to equity 66.7 (14.4)
Fair value adjustment on cash flow hedges 8.7 (10.5)
Income tax on items that may be reclassified subsequently to Income Statement (2.6) 3.2
Total comprehensive income 176.9 145.5
Attributable to:
Members of the parent entity 176.9 145.5
Non-controlling interest – –
176.9 145.5
Reconciliation of movements in retained earnings
Balance at the beginning of the year 867.8 801.5
Net profit/(loss) attributable to members of the parent entity 104.1 167.2
Dividends recognised during the year (129.1) (100.9)
Balance at the end of the year 842.8 867.8
Notes to the Financial StatementsBoral Limited and Controlled Entities

Boral Limited Annual Report 2015 127
30. Deed of cross guarantee (continued)CONSOLIDATED
As at 30 June2015
$ millions2014
$ millions
BALANCE SHEET
CURRENT ASSETS
Cash and cash equivalents 425.9 314.0
Receivables 541.2 623.2
Inventories 336.0 372.2
Other financial assets 9.6 8.3
Other 25.6 33.6
TOTAL CURRENT ASSETS 1,338.3 1,351.3
NON-CURRENT ASSETS
Receivables 74.8 54.5
Inventories 28.9 23.6
Investments accounted for using the equity method 1,048.1 851.8
Other financial assets 1,355.0 1,286.8
Property, plant and equipment 1,914.7 2,108.6
Intangible assets 69.7 70.7
Deferred tax asset 64.4 2.3
Other 23.9 30.4
TOTAL NON-CURRENT ASSETS 4,579.5 4,428.7
TOTAL ASSETS 5,917.8 5,780.0
CURRENT LIABILITIES
Payables 950.1 896.5
Loans and borrowings 1.7 215.3
Other financial liabilities 5.8 12.1
Current tax liabilities 85.3 81.1
Provisions 167.5 188.4
TOTAL CURRENT LIABILITIES 1,210.4 1,393.4
NON-CURRENT LIABILITIES
Payables 15.7 18.2
Loans and borrowings 1,320.7 886.0
Other financial liabilities 0.8 38.8
Deferred tax liabilities 1.3 –
Provisions 78.6 95.9
TOTAL NON-CURRENT LIABILITIES 1,417.1 1,038.9
TOTAL LIABILITIES 2,627.5 2,432.3
NET ASSETS 3,290.3 3,347.7
EQUITY
Issued capital 2,361.6 2,477.6
Reserves 85.9 2.3
Retained earnings 842.8 867.8
TOTAL EQUITY 3,290.3 3,347.7

Boral Limited Annual Report 2015128
STATUTORY STATEMENTS
Directors’ Declaration1. In the opinion of the Directors of Boral Limited:
(a) the consolidated financial statements and notes set out on pages 65 to 127 and the Remuneration Report in the Directors’ Report, set out on pages 48 to 64, are in accordance with the Corporations Act 2001, including:
(i) giving a true and fair view of the Group’s financial position as at 30 June 2015 and of its performance for the financial year ended on that date; and
(ii) complying with Australian Accounting Standards and the Corporations Regulations 2001;
(b) there are reasonable grounds to believe that the Group will be able to pay its debts as and when they become due and payable.
2. There are reasonable grounds to believe that Boral Limited and the controlled entities identified in note 26 will be able to meet any obligations or liabilities to which they are or may become subject by virtue of the Deed of Cross Guarantee between Boral Limited and those controlled entities pursuant to ASIC Class Order 98/1418.
3. The Directors have been given the declarations required by section 295A of the Corporations Act 2001 from the chief executive officer and chief financial officer for the financial year ended 30 June 2015.
4. The Directors draw attention to note 1 to the consolidated financial statements, which includes a statement of compliance with International Financial Reporting Standards.
Signed in accordance with a resolution of the Directors:
Dr Bob Every AOChairman
Mike KaneCEO & Managing Director
Sydney, 27 August 2015
Statutory StatementsBoral Limited and Controlled Entities
Boral Limited Annual Report 2015 129
Independent Auditor’s Report to the members of Boral LimitedReport on the Financial ReportWe have audited the accompanying financial report of Boral Limited (“the Company”), which comprises the consolidated balance sheet as at 30 June 2015, and consolidated income statement and consolidated statement of comprehensive income, consolidated statement of changes in equity and consolidated statement of cash flows for the year ended on that date, notes 1 to 30 comprising a summary of significant accounting policies and other explanatory information and the Directors’ declaration of the Group comprising the Company and the entities it controlled at the year’s end or from time to time during the financial year.
Directors’ responsibility for the financial report The Directors of the Company are responsible for the preparation of the financial report that gives a true and fair view in accordance with Australian Accounting Standards and the Corporations Act 2001 and for such internal control as the Directors determine is necessary to enable the preparation of the financial report that is free from material misstatement whether due to fraud or error. In note 1, the Directors also state, in accordance with Australian Accounting Standard AASB 101 Presentation of Financial Statements, that the financial statements of the Group comply with International Financial Reporting Standards.
Auditor’s responsibilityOur responsibility is to express an opinion on the financial report based on our audit. We conducted our audit in accordance with Australian Auditing Standards. These Auditing Standards require that we comply with relevant ethical requirements relating to audit engagements and plan and perform the audit to obtain reasonable assurance whether the financial report is free from material misstatement.
An audit involves performing procedures to obtain audit evidence about the amounts and disclosures in the financial report. The procedures selected depend on the auditor’s judgement, including the assessment of the risks of material misstatement of the financial report, whether due to fraud or error. In making those risk assessments, the auditor considers internal control relevant to the entity’s preparation of the financial report that gives a true and fair view in order to design audit procedures that are appropriate in the circumstances, but not for the purpose of expressing an opinion on the effectiveness of the entity’s internal control. An audit also includes evaluating the appropriateness of accounting policies used and the reasonableness of accounting estimates made by the Directors, as well as evaluating the overall presentation of the financial report.
We performed the procedures to assess whether in all material respects the financial report presents fairly, in accordance with the Corporations Act 2001 and Australian Accounting Standards, a true and fair view which is consistent with our understanding of the Group’s financial position and of its performance.
We believe that the audit evidence we have obtained is sufficient and appropriate to provide a basis for our audit opinion.
IndependenceIn conducting our audit, we have complied with the independence requirements of the Corporations Act 2001.
Auditor’s opinion In our opinion:(a) the financial report of the Group is in accordance with the Corporations Act 2001, including:
(i) giving a true and fair view of the Group’s financial position as at 30 June 2015 and of its performance for the year ended on that date; and
(ii) complying with Australian Accounting Standards and the Corporations Regulations 2001.(b) the financial report also complies with International Financial Reporting Standards as disclosed in note 1.
Report on the Remuneration ReportWe have audited the Remuneration Report included in clause 19 of the Directors’ Report for the year ended 30 June 2015. The Directors of the Company are responsible for the preparation and presentation of the Remuneration Report in accordance with Section 300A of the Corporations Act 2001. Our responsibility is to express an opinion on the Remuneration Report, based on our audit conducted in accordance with auditing standards.
Auditor’s opinionIn our opinion, the Remuneration Report of Boral Limited for the year ended 30 June 2015 complies with Section 300A of the Corporations Act 2001.
KPMG
Kenneth Reid PartnerSydney, 27 August 2015
Cameron Slapp Partner
KPMG, an Australian partnership and a member firm of the KPMG network of independent member firms affiliated with KPMG International Cooperative (“KPMG International”), a Swiss entity.
Liability limited by a scheme approved under Professional Standards Legislation.

Boral Limited Annual Report 2015130
SHAREHOLDER INFORMATION
Shareholder Information Boral Limited and Controlled Entities
For those shareholders with a registered address in Australia or New Zealand, dividend payments will only be made by direct credit to your nominated bank account (rather than by cheque posted to your registered address). To provide or update your bank account details, please contact the share registry or visit its website at www.linkmarketservices.com.au
For those shareholders without a registered address in Australia or New Zealand, if you wish your dividends to be paid directly to a bank, building society or credit union account in Australia or New Zealand, please contact the share registry or visit its website at www.linkmarketservices.com.au for an application form. The payments are electronically credited on the dividend payment date and confirmed by payment advices mailed to the shareholder’s registered address. All instructions received remain in force until amended or cancelled in writing.
Shareholders are also reminded to bank dividend cheques as soon as possible. Dividend cheques that are not banked are required to be handed over to the Chief Commissioner of State Revenue under the Unclaimed Money Act 1995 (NSW).
Tax File Number (TFN), Australian Business Number (ABN) or exemptionYou are strongly advised to lodge your TFN, ABN or exemption. If you choose not to lodge these details with the share registry, then Boral Limited is obliged to deduct tax at the highest marginal rate (plus the Medicare levy) from the unfranked portion of any dividend payment. Certain pensioners are exempt from supplying their TFNs. You can confirm whether you have lodged your TFN, ABN or exemption via the internet at www.linkmarketservices.com.au
Uncertificated forms of shareholdingTwo forms of uncertificated holdings are available to Boral shareholders:
Issuer Sponsored Holdings: This type of holding is sponsored by Boral and provides shareholders with the advantages of uncertificated holdings without the need to be sponsored by any particular stockbroker.
Broker Sponsored Holdings (CHESS): Shareholders may arrange to be sponsored by a stockbroker (or certain other financial institutions) and are required to sign a sponsorship agreement appointing the sponsor as their “controlling participant” for the purposes of CHESS. This type of holding is likely to attract regular stock market traders or those shareholders who have their share portfolio managed by a stockbroker.
Holding statements are issued to shareholders not later than five business days after the end of any month in which transactions alter the balance of a holding. Shareholders requiring replacement holding statements should be directed to their controlling participant.
Shareholders communicating with the share registry should have to hand their Securityholder Reference Number (SRN) or Holder Identification Number (HIN) as it appears on the Issuer Sponsored/CHESS holding statements or dividend advices. For security reasons, shareholders should keep their Securityholder Reference Numbers confidential.
Shareholder communicationsEnquiries or notifications by shareholders regarding their shareholdings or dividends should be directed to Boral’s share registry:
Link Market Services LimitedLocked Bag A14Sydney South NSW 1235 Australia
Hand deliveries to:Level 12, 680 George StreetSydney NSW 2000 AustraliaTelephone +61 1300 730 644Facsimile +61 2 9287 0303
Shareholders can also send questions to the share registry via email.
Internet: www.linkmarketservices.com.au
Email: [email protected]
Online servicesYou can access information and update information about your holdings in Boral Limited via the internet by visiting Link Market Services’ website www.linkmarketservices.com.au or Boral’s website www.boral.com.au
Some of the services available online include: check current and previous holding balances, choose your preferred Annual Report option, update address details, update bank details, confirm whether you have lodged your TFN, ABN or exemption, check the share prices and graphs or download a variety of forms.
Dividends The final dividend for FY2015 of 9.5 cents per share is expected to be paid by Boral on 28 September 2015. The dividend will be fully franked.
Dividend Reinvestment Plan (DRP)Following payment of the interim dividend on 24 March 2014, Boral’s DRP was suspended until further notice. Additional amendments to the terms and conditions of the DRP were notified to shareholders on 24 March 2014. For further information on the suspension and amendments to the DRP, please visit Boral’s website. In future, if the DRP is reactivated, it will be notified by way of an ASX announcement.
Dividend paymentsAs foreshadowed in Boral’s 2011 Annual Report, Boral implemented direct credit as the preferred method for the payment of cash dividends, effective from the interim dividend paid on 5 April 2012.

Boral Limited Annual Report 2015 131
Annual report mailing listShareholders (whether Issuer or Broker Sponsored) not wishing to receive the Annual Report should advise the share registry in writing so that their names can be removed from the mailing list. Shareholders are also able to update their preference via the Link Market Services or Boral websites, and can nominate to receive email notification of the release of the Annual Report and then access it via a link. The share registry can provide forms for making annual report delivery elections.
While companies are not required to send annual reports to shareholders other than those who have elected to receive them, any shareholder who has not made an election is sent an easy-to-read summary called the Boral Review.
Change of addressShareholders who are Issuer Sponsored should notify any change of address to the share registry promptly. This can be done via the Link Market Services website or in writing quoting their Securityholder Reference Number, previous address and new address. Application forms for Change of Address are also available for download via the Link Market Services or Boral websites. Broker Sponsored (CHESS) holders must advise their sponsoring broker of the change.
Information on BoralBoral has a comprehensive internet site featuring news items, announcements, corporate information and a wide range of product and service information. Boral’s internet address is www.boral.com.au
The Annual Report is the main source of information for shareholders. Other sources of information include:
• February – the interim results announcement for the December half year.
• August – the annual results announcement for the year ended 30 June.
• November – the Annual General Meeting.
Requests for publications and other enquiries about Boral’s affairs should be addressed to:
Group Communications & Investor Relations DirectorBoral LimitedPO Box 1228North Sydney NSW 2059
Enquiries can also be made via email: [email protected] or visit Boral’s website at www.boral.com.au
Share trading and priceBoral shares are traded on the Australian Securities Exchange Limited (ASX). The stock code under which they are traded is “BLD” and the details of trading activity are available on the internet and published in most daily newspapers under that abbreviation.
Share sale facilityA means for Issuer Sponsored shareholders, particularly small shareholders, to sell their entire Boral shareholding is to use the share registry’s sale facility by contacting Link Market Services’ Share Sale Centre on +61 1300 730 644.
American depositary receipts (ADRs)In the USA, Boral shares are traded in the over-the-counter market in the form of ADRs issued by the depositary, The Bank of New York Mellon (BNY Mellon). Each ADR represents four ordinary Boral shares.
Holders of Boral’s ADRs should contact BNY Mellon on all matters relating to their ADR holdings.
By mail:BNY Mellon Shareowner Services PO Box 30170College Station, TX 77842-3170USA
By telephone: To speak directly to a BNY Mellon representative, please call 1-888-BNY-ADRS (1-888-269-2377) if you are calling from within the United States. If you are calling from outside the United States, please call 201-680-6825.
By email: You may also send an email enquiry to [email protected] or visit the website at www.bnymellon.com/shareowner
Share information as at 14 August 2015 Substantial shareholdersPerpetual Limited, by a notice of change of interests of substantial holder dated 2 July 2015, advised that it and its associates were entitled to 59,458,898 ordinary shares.
Commonwealth Bank of Australia, by a notice of change of interests of substantial holder dated 20 March 2015, advised that it and its associates were entitled to 80,710,025 ordinary shares.
Ausbil Dexia Limited, by a notice of change of interests of substantial holder dated 9 November 2010, advised that it and its associates were entitled to 44,499,371 ordinary shares.

Boral Limited Annual Report 2015132
SHAREHOLDER INFORMATION
Shareholder InformationBoral Limited and Controlled Entities
Distribution schedule of shareholders as at 14 August 2015
Size of shareholdingNumber of
shareholders % of ordinary shares
(a) in the categories –
1 to 1,000 23,874 1.56
1,001 to 5,000 24,397 7.34
5,001 to 10,000 4,314 4.02
10,001 to 100,000 2,563 6.91
100,001 and over 103 80.17
55,251 100.00
(b) holding less than a marketable parcel (77 shares) 1,181 0.004
Voting rights – ordinary sharesOn a show of hands, every person present, who is a member or proxy, attorney or representative of a member, shall have one vote and on a poll every member who is present in person or by proxy, attorney or representative shall have one vote for each share held by him or her.
On-market share buy-backOn 18 March 2015, Boral announced its intention to commence an on-market share buy-back program for up to 5% of Boral’s issued capital or approximately 39 million ordinary shares. To date, Boral has bought back 18,494,862 ordinary shares or approximately 2.4% of issued capital for approximately $116 million.
Twenty largest shareholders as at 14 August 2015
Ordinary shares % of ordinary shares
1 HSBC Custody Nominees (Australia) Limited 165,220,700 21.62
2 J P Morgan Nominees Australia Limited 121,635,313 15.92
3 Citicorp Nominees Pty Limited 105,030,585 13.74
4 National Nominees Limited 103,199,933 13.5
5 BNP Paribas Nominees Pty Ltd 33,297,200 4.36
6 RBC Dexia Investor Services Australia Nominees Pty Limited 26,407,503 3.46
7 UBS Wealth Management Australia Nominees Pty Ltd 15,892,759 2.08
8 Warbont Nominees Pty Ltd 5,002,259 0.65
9 AMP Life Limited 4,509,695 0.59
10 Australian Foundation Investment Company Limited 4,008,492 0.52
11 Argo Investments Limited 3,075,132 0.4
12 SBN Nominees Pty Limited 3,000,000 0.39
13 Equitas Nominees Pty Limited 2,450,738 0.32
14 Bond Street Custodians Limited 2,331,648 0.31
15 Gwynvill Investments Pty Ltd 1,987,750 0.26
16 Milton Corporation Limited 1,666,463 0.22
17 UBS Nominees Pty Ltd 1,084,000 0.14
18 Invia Custodian Pty Limited 1,052,321 0.14
19 Portman Trading Pty Limited 730,000 0.1
20 Navigator Australia Limited 640,753 0.08
SHAREHOLDER INFORMATION

Boral Limited Annual Report 2015 133
Financial HistoryBoral Limited and Controlled Entities
30 June2015
$ millions2014
$ millions2013
$ millions2012
$ millions2011
$ millions2010
$ millions2009
$ millions2008
$ millions2007
$ millions2006
$ millions
Revenue 4,415 5,204 5,286 5,010 4,711 4,599 4,875 5,199 4,909 4,767
Earnings before interest, tax, depreciation and amortisation (EBITDA) 1
605 556 519 473 522 505 539 688 762 823
Depreciation and amortisation 249 261 291 273 245 253 263 240 231 209
Earnings before interest and tax 1 357 294 228 200 277 252 276 448 531 614
Net financing costs 1 (64) (83) (97) (88) (64) (97) (127) (112) (111) (98)
Profit before tax 1 293 211 130 111 213 155 149 336 420 516
Income tax expense 1 (44) (37) (20) (9) (40) (22) (17) (90) (122) (153)
Non-controlling interests – (3) (6) (1) 2 (1) – 1 – –
Net profit after tax 1 249 171 104 101 175 132 131 247 298 362
Significant items – net of tax 8 2 (316) 75 (8) (222) 11 (4) – –
Net profit/(loss) attributable to members of Boral Limited
257 173 (212) 177 168 (91) 142 243 298 362
Total assets 5,865 5,559 6,316 6,499 5,668 5,209 5,491 5,895 5,817 5,587
Total liabilities 2,341 2,211 2,923 3,096 2,512 2,583 2,738 2,985 2,829 2,832
Net assets 3,524 3,348 3,394 3,403 3,156 2,626 2,754 2,910 2,987 2,755
Shareholders’ funds 3,524 3,348 3,394 3,403 3,156 2,626 2,754 2,910 2,987 2,755
Net debt 817 718 1,446 1,518 505 1,183 1,514 1,515 1,482 1,578
Funds employed 4,341 4,066 4,840 4,921 3,662 3,809 4,268 4,425 4,470 4,333
Dividends paid or declared 139 117 85 82 105 88 77 202 203 200
Statistics
Dividend per ordinary share 18.0c 15.0c 11.0c 11.0c 14.5c 13.5c 13c 34c 34c 34c
Dividend payout ratio 1 56% 68% 81% 81% 60% 67% 59% 82% 68% 55%
Dividend cover 1 1.8 1.5 1.2 1.2 1.7 1.5 1.7 1.2 1.5 1.8
Earnings per ordinary share 1 31.9c 22.0c 13.6c 13.6c 24.4c 22.1c 22.2c 41.4c 50.0c 61.7c
Return on equity 1 7.1% 5.1% 3.2% 3.0% 5.6% 5.0% 4.8% 8.5% 10.0% 13.2%
EBIT to sales 1 8.1% 5.7% 4.3% 4.0% 5.9% 5.5% 5.7% 8.6% 10.8% 12.9%
EBIT to funds employed 1 8.2% 7.2% 4.7% 4.1% 7.6% 6.6% 6.5% 10.1% 11.9% 14.2%
ROFE 2 (EBIT to average funds employed 1)
8.5% 6.6% 4.7% 4.7% 7.4% 6.2% 6.3% 10.1% 12.1% 15.1%
Net interest cover (times) 1 5.6 3.5 2.3 2.3 4.4 2.6 2.2 4.0 4.8 6.3
Gearing (net debt to equity) 23% 21% 43% 45% 16% 45% 55% 52% 50% 57%
Gearing (net debt to net debt plus equity)
19% 18% 30% 31% 14% 31% 35% 34% 33% 36%
Net tangible asset backing per share $4.31 $4.03 $3.17 $3.31 $3.91 $3.92 $4.12 $4.41 $4.41 $4.07
1. Excludes the impact of significant items in 2015, 2014, 2013, 2012, 2011, 2010, 2009 and 2008.2. Refer to the Remuneration Report for a discussion of how ROFE is used as an additional performance hurdle under the Company’s long-term incentive plan.
Results for the years ended 2006 to 2015 have been prepared under Australian equivalents to International Financial Reporting Standards (A-IFRS).
Figures may not add due to rounding.
FINANCIAL HISTORY

Boral LimitedABN 13 008 421 761
Level 3, 40 Mount Street, North Sydney NSW 2060PO Box 1228, North Sydney NSW 2059Telephone: +61 2 9220 6300Internet: www.boral.com.auEmail: [email protected]
Share Registryc/- Link Market Services LimitedLevel 12, 680 George Street, Sydney NSW 2000Locked Bag A14Sydney South NSW 1235Telephone: +61 1300 730 644Internet: www.linkmarketservices.com.auEmail: [email protected]


![September 2015 Generic Seismic Design - USG Boral · SEISMIC DESIGN STATEMENT Jacobs (formerly Sinclair Knight Merz [SKM]) has provided USG Boral with structural design services in](https://static.fdocuments.us/doc/165x107/5e6da852d29167699605df08/september-2015-generic-seismic-design-usg-boral-seismic-design-statement-jacobs.jpg)
