BOR CUPCA FY 2013 Full Year Operating Plan for … Operating_Plan.pdf1,000 the number of seasonal...
17
Transcript of BOR CUPCA FY 2013 Full Year Operating Plan for … Operating_Plan.pdf1,000 the number of seasonal...

1
Department of the Interior 2013 Operating Plans
As required by the 2013 Full Year Continuing Resolution (P.L. 113-6), the Department submits bureau and office Operating Plans showing how discretionary funds provided for 2013 will be allocated among programs, projects and activities. These Operating Plans build upon those provided to Congress in October for the first six months of 2013 and allocate programmatic reductions, an across-the-board reduction of 0.2 percent, and a 5.0 percent sequester reduction. The Interior strategy in developing the 2013 Operating Plans seeks to mitigate the most severe near-term impacts to its mission and employees while balancing longer-term impacts and further requirements for reductions. In general, the Operating Plans seek to maintain core capabilities with a limited number of adjustments to mitigate sequester impacts to account for fixed expenses, such as rent, or the loss of long-term technical capability. Bureaus anticipate reduced levels of services provided – such as fewer onshore oil and gas lease sales, fewer onshore permits to drill processed, reduced welfare payments to Indian Country, cuts in Bureau of Indian Education school services for its universities, and reduced capabilities for the U.S. Geological Survey to provide research and monitor resources. The Wildland Fire program will limit the length of the hiring season and the number of seasonal fire fighters and reduce the scope of contracts for aviation services to continue coverage with smaller-scale equipment. The 2013 Continuing Resolution reduced the Bureau of Land Management, National Park Service, and Fish and Wildlife Service operating accounts by a total of $53 million below 2012 enacted, before accounting for the sequester. With the sequester, these accounts are $281 million below 2012 enacted. To accommodate these reductions, all three bureaus will reduce seasonal hiring, limit operating hours, and reduce visitor services. For example, the NPS will reduce by 1,000 the number of seasonal hires in parks. Impacts will vary by facility. In general, bureaus will need to close certain areas within facilities to visitors, reduce hours of operation, eliminate certain guided ranger tours and other outreach programs, conduct fewer back-country patrols, reduce activities to protect natural and cultural resources, and defer maintenance of roads, trails and facilities. Although a priority is placed on minimizing impacts to critical services, there will be some reductions to law enforcement programs, most notably the need to furlough U.S. Park Police employees for up to 14 days. Agencies will manage these reductions to maintain protection at high-priority sites. Within the operating accounts, bureaus propose reductions to maintenance funding where they have some flexibility to defer spending. For example, NPS reduced cyclic maintenance by $20 million. Total maintenance funding for BLM, FWS, NPS and the Bureau of Indian Affairs is $59 million below 2012 enacted, a 9 percent drop. Bureaus will also defer the replacement of equipment and vehicles. By deferring maintenance, bureaus will face increased operational costs in the future. Total funding for Federal land acquisition is $146 million without the sequester, essentially level with 2012 enacted. After the sequester, funding is $139 million, $7.7 million below 2012

2
enacted. Interior funding from the Land and Water Conservation Fund under the 2013 Operating Plans totals $205 million as compared to the 2012 enacted level of $217 million. Major grant programs total $245 million in the 2013 Operating Plans after accounting for the sequester. This is a $13.5 million reduction from the 2012 level of $259 million. Construction funding totals $248 million post-sequester, a reduction of $58 million from 2012 enacted and $8 million from the amount available before sequester. Personnel Staffing: On February 20, 2013, the Department implemented a freeze on hiring and overtime, with a limited exception process subject to approval at the highest levels of the Department and the bureaus. The Department will also actively continue its workforce planning initiative.
Furloughs: At this time, four Interior organizations anticipate furloughs of employees. Employee furloughs are expected in the BIA (up to 8 days), Office of the Solicitor (up to 3 days), the U.S. Park Police within the NPS (up to 14 days), and USGS (up to 7 days). Seasonal Hiring: The Department conducts the majority of its work during the summer seasons, particularly for the northern tier of States in the continental United States and Alaska. This is the peak season for visitation and visitor use; and when the bureaus conduct a large share of annual field work, including monitoring, data collection, and environmental studies. Seasonal hiring comprises about 20 percent of Interior’s overall workforce, and reductions will disrupt key programs including firefighting, visitor services, and field work. These cuts will also significantly impact youth employment. Contracts, Cooperative Agreements and Financial Assistance Interior bureaus and offices identified all contracts and cooperative agreements they would not renew or defer and sent letters to vendors and cooperative partners of the potential for discontinuation of agreements. Bureaus will review these lists to cancel, defer, or re-scope lower priority contracts and cooperative agreements. In general, regional and field office managers will have discretion on how to best manage their work requirements, including how to manage contracts. The BIA is working closely with the Tribes performing work under PL 93-638 contracts to determine the impacts of sequestration on tribal services. The impacts to all tribal programs resulting from sequestration are not yet fully identified. Many of Interior’s grant programs are funded in separate accounts with little flexibility to reallocate. Adjustments to grant allocations have been planned for and communicated to awardees as appropriate in advance of execution. Reducing Operating, Administrative and other Costs Interior is managing travel on an exception basis and is curtailing training and conferences. Conferences must be approved at the Departmental level and roughly 70 percent of previously planned conference attendance has been cancelled.

3
Shared service providers such as the Interior Business Center and Office of the Secretary Working Capital Fund programs have reduced charges for 2013 by 2.87 percent and are evaluating further reductions for 2014. The Bureau of Safety and Environmental Enforcement is evaluating a 2013 reduction as well – it is a shared service provider to the Office of the Secretary and the Bureau of Ocean Energy Management for human resources. Overview of Funding Adjustments Not Included in Previous Operating Plan BLM moves $1 million from Deferred Maintenance to Administrative Support and redirects $900,000 from the Alaska Conveyance program to Lands and Realty Management, a technical shift to realign funds to the appropriate subactivity. BOEM moves $3 million from Renewable Energy to the Conventional Energy activity to support near-term conventional energy program activities and related environmental studies. FWS redirects $1.2 million from Refuge Maintenance to Hatchery Maintenance to complete repairs at the White River Hatchery and redirects $845,000 from Deferred Maintenance into other Refuge Maintenance program elements. NPS moves $9.3 million from Park Management to External Administrative Costs to meet fixed commitments, such as rent in GSA space, workers compensation, and unemployment compensation. USGS moves funding from nearly all subactivities to maintain funding at the 2012 enacted levels in Rental Payments under Facilities. USGS moves funds from the Water Resources Research Institutes and the Cooperative Water program to partially mitigate sequester reductions to other Water Resources subactivities. The Bureau of Reclamation proposes adjustments in 19 programs/projects including: San Joaquin River Restoration to accelerate progress; Navajo Gallup Water Supply to accelerate progress; WaterSMART Grants to remain level with 2013 request; ESRIP Platte River to accelerate progress; and Fryingpan-Arkansas Project - Arkansas Valley Conduit to initiate preconstruction activities.

Reclamation/CUPCA - 2013 Full Year Continuing Resolution Operating PlanDollars in $000s
Water and Related Resources 895,000 -1,790 893,210 -45,024 848,186 848,186 Policy and Administration 60,000 -120 59,880 -3,018 56,862 56,862 Total Central Valley Project Restoration Fund 53,068 -27 53,041 -2,670 50,371 50,371 Total California Bay Delta 39,651 -79 39,572 -1,995 37,577 37,577
Total Reclamation 1,047,719 -2,016 1,045,703 -52,707 992,996 992,996
Central Utah Project Completion Account 21,000 -42 20,958 - 20,958 20,958 Note: As the 2013 CUPCA appropriation was less than the 2013 part year Continuing Resolution annualized amount minus the sequestration, the crediting provisions of BBEDCA Section 253(f) will offset the financial effects of the sequester for 2013 by providing a reduction in the amount of the sequestration.
Initial 2013 Full Year Operating
Plan
FY 2013 Enacted Operating Plan
(P.L. 113-6) w/ 0.2% ATB
Final 2013 Operating PlanAccounts Funding after
SequesterSequester Reduction
ATB Decrease(-0.2%)
1 of 10

Reclamation/CUPCA - 2013 Full Year Continuing Resolution Operating PlanDollars in $000s
Water and Related ResourcesAk Chin Indian Water Rights Settlement Act Project AZ 12,075 -24 12,051 -607 11,444 11,444Animas-La Plata Project, Colorado River Storage Participating Project CO 2,334 -5 2,329 -117 2,212 2,212Arbuckle Project OK 245 0 245 -12 233 233Balmorhea Project TX 58 0 58 -3 55 55Boise Area Projects ID 5,574 -11 5,563 -280 5,283 5,283Cachuma Project CA 1,331 -3 1,328 -67 1,261 1,261Canadian River Project TX 201 0 201 -10 191 191Carlsbad Project NM 3,760 -8 3,752 -189 3,563 3,563Central Valley Projects: American River Division, Folsom Dam Unit/Mormon Island (SOD) CA 10,566 -21 10,545 -532 10,013 10,013 Auburn-Folsom South Unit CA 3,165 -6 3,159 -159 3,000 3,000 Delta Division CA 11,919 -24 11,895 -600 11,295 11,295 East Side Division CA 3,848 -8 3,840 -194 3,646 3,646 Friant Division Friant Division CA 5,559 -11 5,548 -280 5,268 5,268 San Joaquin River Restoration CA 16,387 -33 16,354 -824 15,530 15,530 Miscellaneous Project Programs CA 10,443 -21 10,422 -525 9,897 9,897 Replacements, Additions, and Extraordionary Maint. Program CA 17,230 -34 17,196 -867 16,329 16,329 Sacramento River Division CA 5,414 -11 5,403 -272 5,131 5,131 San Felipe Division CA 577 -1 576 -29 547 547 San Joaquin Division CA 50 0 50 -3 47 47 Shasta Division CA 8,372 -17 8,355 -421 7,934 7,934 Trinity River Division CA 18,637 -37 18,600 -938 17,662 17,662 Water and Power Operations CA 8,204 -16 8,188 -413 7,775 7,775 West San Joaquin Division, San Luis Unit CA 24,053 -48 24,005 -1210 22,795 22,795
Central Valley Project Total 144,424 -288 144,136 -7,267 136,869 136,869Collbran Project CO 1,753 -4 1,749 -88 1,661 1,661
Final 2013 Operating
Plan1State Sequester
Reduction Funding after
Sequester
Initial 2013 Full Year Operating
Plan
ATB Decrease(-0.2%)
FY 2013 Enacted Operating Plan
(P.L. 113-6) w/ 0.2% ATB
2 of 10

Reclamation/CUPCA - 2013 Full Year Continuing Resolution Operating PlanDollars in $000s
Final 2013 Operating
Plan1State Sequester
Reduction Funding after
Sequester
Initial 2013 Full Year Operating
Plan
ATB Decrease(-0.2%)
FY 2013 Enacted Operating Plan
(P.L. 113-6) w/ 0.2% ATB
Colorado River Basin Project - Central Arizona Project AZ 7,892 -16 7,876 -397 7,479 7,479Colorado River Basin Salinity Control Project - Title I BW 10,706 -21 10,685 -539 10,146 10,146Colorado River Basin Salinity Control Project, Title II - Basinwide Prog. BW 8,000 -16 7,984 -402 7,582 7,582Colorado River Front Work and Levee System AZ 1,907 -4 1,903 -96 1,807 1,807Colorado River Water Quality Improvement Program BW 537 -1 536 -27 509 509Colorado-Big Thompson Project CO 13,646 -27 13,619 -686 12,933 12,933Columbia and Snake River Salmon Recovery Project ID 18,000 -36 17,964 -906 17,058 17,058Columbia Basin Project WA 9,031 -18 9,013 -455 8,558 8,558Crooked River Project OR 767 -2 765 -39 726 726Colorado River Storage Project (CRSP), Section 5 BW 9,280 -17 9,263 -467 8,796 8,796Colorado River Storage Project (CRSP), Section 8 BW 4,315 -8 4,307 -217 4,090 4,090Dam Safety Program: 0 0 Department of the Interior Dam Safety Program BW 1,100 -2 1,098 -55 1,043 1,043 Initiate Safety of Dams Corrective Action BW 67,000 -134 66,866 -3371 63,495 63,495 Safety Evaluation of Existing Dams BW 19,350 -39 19,311 -973 18,338 18,338
Dam Safety Program Total 87,450 -175 87,275 -4,399 82,876 82,876Deschutes Project OR 676 -1 675 -34 641 641Eastern Oregon Projects OR 909 -2 907 -46 861 861Emergency Planning and Disaster Response Program BW 1,300 -3 1,297 -65 1,232 1,232Endangered Species Recovery Implementation Program BW 21,816 -44 21,772 -1,098 20,674 20,674Environmental Program Administration BW 1,670 -3 1,667 -84 1,583 1,583Examination of Existing Structures BW 8,760 -17 8,743 -439 8,304 8,304Federal Building Seismic Safety Program BW 1,300 -3 1,297 -65 1,232 1,232Fruitgrowers Dam Project CO 300 -1 299 -15 284 284Fryingpan-Arkansas Project CO 8,818 -18 8,800 -444 8,356 8,356Fryingpan-Arkansas Project - Arkansas Valley Conduit CO 4,000 -8 3,992 -201 3,791 3,791General Planning Activities BW 2,532 -4 2,528 -127 2,401 2,401Grand Valley Unit, CRBSCP, Title II CO 1,969 -4 1,965 -99 1,866 1,866Hungry Horse Project MT 763 -2 761 -38 723 723
3 of 10

Reclamation/CUPCA - 2013 Full Year Continuing Resolution Operating PlanDollars in $000s
Final 2013 Operating
Plan1State Sequester
Reduction Funding after
Sequester
Initial 2013 Full Year Operating
Plan
ATB Decrease(-0.2%)
FY 2013 Enacted Operating Plan
(P.L. 113-6) w/ 0.2% ATB
Huntley Project MT 88 0 88 -4 84 84Hyrum Project UT 383 -1 382 -19 363 363Indian Water Rights Settlements: Aamodt Indian Water Rights Settlement BW 5,000 -10 4,990 -252 4,738 4,738 Crow Tribe Water Rights Settlement BW 10,000 -20 9,980 -503 9,477 9,477 Navajo Gallup Water Supply BW 28,359 -61 28,298 -1430 26,868 26,868 Taos Pueblo Indian Water Rights Settlement BW 4,000 -8 3,992 -201 3,791 3,791 White Mountain Apache BW 2,500 -5 2,495 -126 2,369 2,369
Indian Water Rights Settlements Total: 49,859 -104 49,755 -2,512 47,243 47,243Kendrick Project WY 4,853 -10 4,843 -244 4,599 4,599Klamath Project OR 25,734 -51 25,683 -1295 24,388 24,388Lahontan Basin Project (Humbolt, Newlands, and Washoe Projects) NV 9,516 -19 9,497 -479 9,018 9,018Lake Mead/Las Vegas Wash Program NV 206 0 206 -10 196 196Lake Tahoe Regional Wetlands Development NV 112 0 112 -6 106 106Land Resources Management Program BW 8,702 -18 8,684 -438 8,246 8,246Leadville/Arkansas River Recovery Project CO 4,106 -8 4,098 -207 3,891 3,891Lewiston Orchards Project ID 2,350 -5 2,345 -118 2,227 2,227Lower Colorado River Operations Program BW 29,424 -59 29,365 -1480 27,885 27,885Lower Rio Grande Water Conservation Project TX 50 0 50 -3 47 47Lower Yellowstone Project MT 400 -1 399 -20 379 379Mancos Project CO 216 0 216 -11 205 205McGee Creek Project OK 838 -2 836 -42 794 794Mid-Dakota Rural Water Project SD 15 0 15 -1 14 14Middle Rio Grande Project NM 22,537 -45 22,492 -1134 21,358 21,358Milk River Project MT 1,939 -4 1,935 -98 1,837 1,837Minidoka Area Projects ID 8,677 -17 8,660 -437 8,223 8,223Mirage Flats Project NE 147 0 147 -7 140 140Miscellaneous Flood Control Operations BW 871 -1 870 -44 826 826
4 of 10

Reclamation/CUPCA - 2013 Full Year Continuing Resolution Operating PlanDollars in $000s
Final 2013 Operating
Plan1State Sequester
Reduction Funding after
Sequester
Initial 2013 Full Year Operating
Plan
ATB Decrease(-0.2%)
FY 2013 Enacted Operating Plan
(P.L. 113-6) w/ 0.2% ATB
Moon Lake Project UT 170 0 170 -9 161 161Mountain Park Project OK 585 -1 584 -29 555 555Native American Affairs Program BW 6,466 -13 6,453 -325 6,128 6,128Negotiation and Administration of Water Marketing BW 2,409 -5 2,404 -121 2,283 1,885Newton Project UT 123 0 123 -6 117 117Norman Project OK 494 -1 493 -25 468 468North Platte Project WY 1,580 -3 1,577 -79 1,498 1,498Nueces River Project TX 683 -1 682 -34 648 648Ogden River Project UT 449 -1 448 -23 425 425Operation and Program Management BW 2,217 -4 2,213 -111 2,102 2,102Orland Project CA 633 -1 632 -32 600 600Paradox Valley Unit, CRBSCP, Title II CO 2,628 -5 2,623 -132 2,491 2,491Pine River Project CO 467 -1 466 -23 443 443Power Program Services BW 4,430 -9 4,421 -223 4,198 4,198Provo River Project UT 1,628 -3 1,625 -82 1,543 1,543P-SMBP - Garrison Diversion Unit (Non-Rural Water) BW 9,619 -19 9,600 -484 9,116 9,116Pick-Sloan Missouri Basin Program - Other BW 42,412 -85 42,327 -2,133 40,194 40,194Preston Bench ID 0 0 0 0 0 0Public Access and Safety Program BW 872 -1 871 -43 828 828Rapid Valley Project SD 92 0 92 -5 87 87Reclamation Law Administration BW 2,311 -5 2,306 -117 2,189 2,189Recreation and Fish and Wildlife Program Administration BW 1,908 -3 1,905 -96 1,809 1,809Research and Development: Desalination and Water Purification Prog. BW 2,998 -6 2,992 -151 2,841 2,841 Science and Technology Program BW 10,050 -20 10,030 -506 9,524 9,524
Research and Development Total 13,048 -26 13,022 -657 12,365 12,365Rio Grande Project NM 5,376 -11 5,365 -270 5,095 5,095Rio Grande Pueblos NM 250 -1 249 -13 236 236Rogue River Basin Project, Talent Division OR 763 -2 761 -38 723 723
5 of 10
Reclamation/CUPCA - 2013 Full Year Continuing Resolution Operating PlanDollars in $000s
Final 2013 Operating
Plan1State Sequester
Reduction Funding after
Sequester
Initial 2013 Full Year Operating
Plan
ATB Decrease(-0.2%)
FY 2013 Enacted Operating Plan
(P.L. 113-6) w/ 0.2% ATB
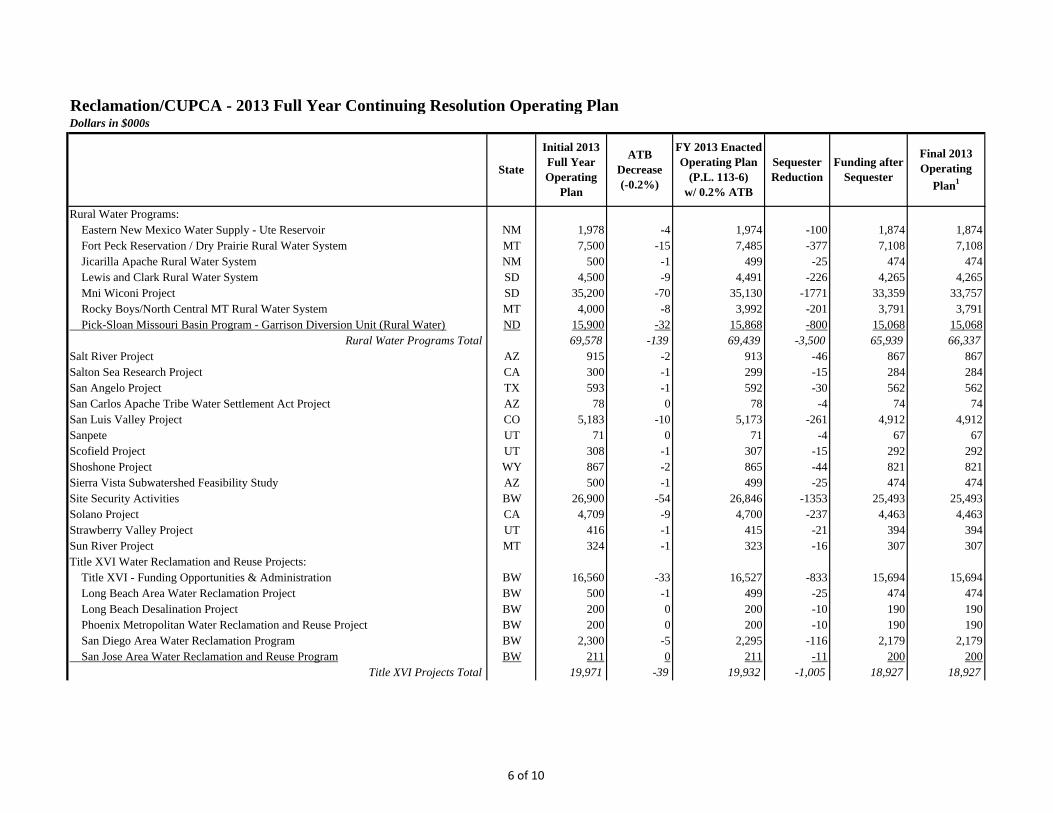
Rural Water Programs: Eastern New Mexico Water Supply - Ute Reservoir NM 1,978 -4 1,974 -100 1,874 1,874 Fort Peck Reservation / Dry Prairie Rural Water System MT 7,500 -15 7,485 -377 7,108 7,108 Jicarilla Apache Rural Water System NM 500 -1 499 -25 474 474 Lewis and Clark Rural Water System SD 4,500 -9 4,491 -226 4,265 4,265 Mni Wiconi Project SD 35,200 -70 35,130 -1771 33,359 33,757 Rocky Boys/North Central MT Rural Water System MT 4,000 -8 3,992 -201 3,791 3,791 Pick-Sloan Missouri Basin Program - Garrison Diversion Unit (Rural Water) ND 15,900 -32 15,868 -800 15,068 15,068
Rural Water Programs Total 69,578 -139 69,439 -3,500 65,939 66,337Salt River Project AZ 915 -2 913 -46 867 867Salton Sea Research Project CA 300 -1 299 -15 284 284San Angelo Project TX 593 -1 592 -30 562 562San Carlos Apache Tribe Water Settlement Act Project AZ 78 0 78 -4 74 74San Luis Valley Project CO 5,183 -10 5,173 -261 4,912 4,912Sanpete UT 71 0 71 -4 67 67Scofield Project UT 308 -1 307 -15 292 292Shoshone Project WY 867 -2 865 -44 821 821Sierra Vista Subwatershed Feasibility Study AZ 500 -1 499 -25 474 474Site Security Activities BW 26,900 -54 26,846 -1353 25,493 25,493Solano Project CA 4,709 -9 4,700 -237 4,463 4,463Strawberry Valley Project UT 416 -1 415 -21 394 394Sun River Project MT 324 -1 323 -16 307 307Title XVI Water Reclamation and Reuse Projects: Title XVI - Funding Opportunities & Administration BW 16,560 -33 16,527 -833 15,694 15,694 Long Beach Area Water Reclamation Project BW 500 -1 499 -25 474 474 Long Beach Desalination Project BW 200 0 200 -10 190 190 Phoenix Metropolitan Water Reclamation and Reuse Project BW 200 0 200 -10 190 190 San Diego Area Water Reclamation Program BW 2,300 -5 2,295 -116 2,179 2,179 San Jose Area Water Reclamation and Reuse Program BW 211 0 211 -11 200 200
Title XVI Projects Total 19,971 -39 19,932 -1,005 18,927 18,927
6 of 10

Reclamation/CUPCA - 2013 Full Year Continuing Resolution Operating PlanDollars in $000s
Final 2013 Operating
Plan1State Sequester
Reduction Funding after
Sequester
Initial 2013 Full Year Operating
Plan
ATB Decrease(-0.2%)
FY 2013 Enacted Operating Plan
(P.L. 113-6) w/ 0.2% ATB
Tualatin Project OR 260 -1 259 -13 246 246Tucumcari Project NM 90 0 90 -5 85 85Umatilla Project OR 3,806 -8 3,798 -191 3,607 3,607Uncompahgre Project CO 992 -2 990 -50 940 940United States/Mexico Border Issues - Technical Support 97 0 97 -5 92 92Upper Colorado River Operations Program CO 265 -1 264 -13 251 251Ventura River Project CA 377 -1 376 -19 357 357W.C. Austin Project OK 665 -1 664 -33 631 631Washington Area Projects WA 463 -1 462 -23 439 439Washita Basin Project OK 1,578 -3 1,575 -79 1,496 1,496Weber Basin Project UT 1,839 -4 1,835 -92 1,743 1,743Weber River Project UT 151 0 151 -8 143 143WaterSMART Program WaterSMART Grants BW 22,626 -45 22,581 -1138 21,443 21,443 Water Conservation Field Services Program (above) BW 6,206 -13 6,193 -312 5,881 5,881 Title XVI Water Reclamation/Reuse Projects (see above) BW 19,971 -39 19,932 -1005 18,927 18,927 Cooperative Watershed Management BW 250 -1 249 -13 236 236 Basin Studies BW 6,000 -12 5,988 -302 5,686 5,686
WaterSMART Total 55,053 -110 54,943 -2,770 52,173 52,173Wichita Project KS 580 -1 579 -29 550 550Wichita Project (Equus Beds Division) KS 50 0 50 -3 47 47Yakima Project WA 7,418 -15 7,403 -373 7,030 7,030Yakima River Basin Water Enhancement Project WA 10,524 -21 10,503 -529 9,974 9,974Yuma Area Projects AZ 22,015 -44 21,971 -1107 20,864 20,864
Facilities O&M BW 7,300 -15 7,285 -367 6,918 6,918
Total Water and Related Resources 895,000 -1,790 893,210 -45,024 848,186 848,186
7 of 10

Reclamation/CUPCA - 2013 Full Year Continuing Resolution Operating PlanDollars in $000s
Final 2013 Operating
Plan1State Sequester
Reduction Funding after
Sequester
Initial 2013 Full Year Operating
Plan
ATB Decrease(-0.2%)
FY 2013 Enacted Operating Plan
(P.L. 113-6) w/ 0.2% ATB
Policy and Administration BW 60,000 -120 59,880 -3018 56,862 56,862
Total Policy and Administration 60,000 -120 59,880 -3,018 56,862 56,862
F/WL Resources Habitat 36,535 -19 36,516 -1,838 34,678 34,678Miscellaneous Project Programs CA 22,935 -12 22,923 -1153 21,770 21,770San Joaquin Division CA 11,600 -6 11,594 -584 11,010 11,010San Joaquin River Basin Resource Management Initiative CA 2,000 -1 1,999 -101 1,898 1,898
F/WL Resources Management 16,533 -8 16,525 -832 15,693 15,693Shasta Division CA 555 0 555 -28 527 527Trinity River Division CA 2,000 -1 1,999 -101 1,898 1,898Miscellaneous Project Programs CA 13,978 -7 13,971 -703 13,268 13,268
Total Central Valley Project Restoration Fund 2/ 53,068 -27 53,041 -2,670 50,371 50,371 2/ CVPRF funding in FY 2013 reflects 2012 CR amount, not the 3 year rolling average.
California Bay DeltaRenewed Federal State Partnership CA 1,900 -4 1,896 -96 1,800 1,800 Program Management, Oversight & Coordination CA 1,900 -4 1,896 -96 1,800 1,800
Smarter Water Supply and Use CA 8,444 -17 8,427 -425 8,002 8,002 Water Conservation Projects CA 3,894 -8 3,886 -196 3,690 3,690 Los Vaqueros Expansion CA 300 -1 299 -15 284 284 San Joaquin River Basin Study CA 2,000 -4 1,996 -101 1,895 1,895 North-of-the-Delta Offstream Storage (Sites Reservoir) Study CA 600 -1 599 -30 569 569 Shasta Enlargement Study CA 1,500 -3 1,497 -75 1,422 1,422 San Luis Lowpoint Feasibility Study CA 150 0 150 -8 142 142
8 of 10
Reclamation/CUPCA - 2013 Full Year Continuing Resolution Operating PlanDollars in $000s
Final 2013 Operating
Plan1State Sequester
Reduction Funding after
Sequester
Initial 2013 Full Year Operating
Plan
ATB Decrease(-0.2%)
FY 2013 Enacted Operating Plan
(P.L. 113-6) w/ 0.2% ATB
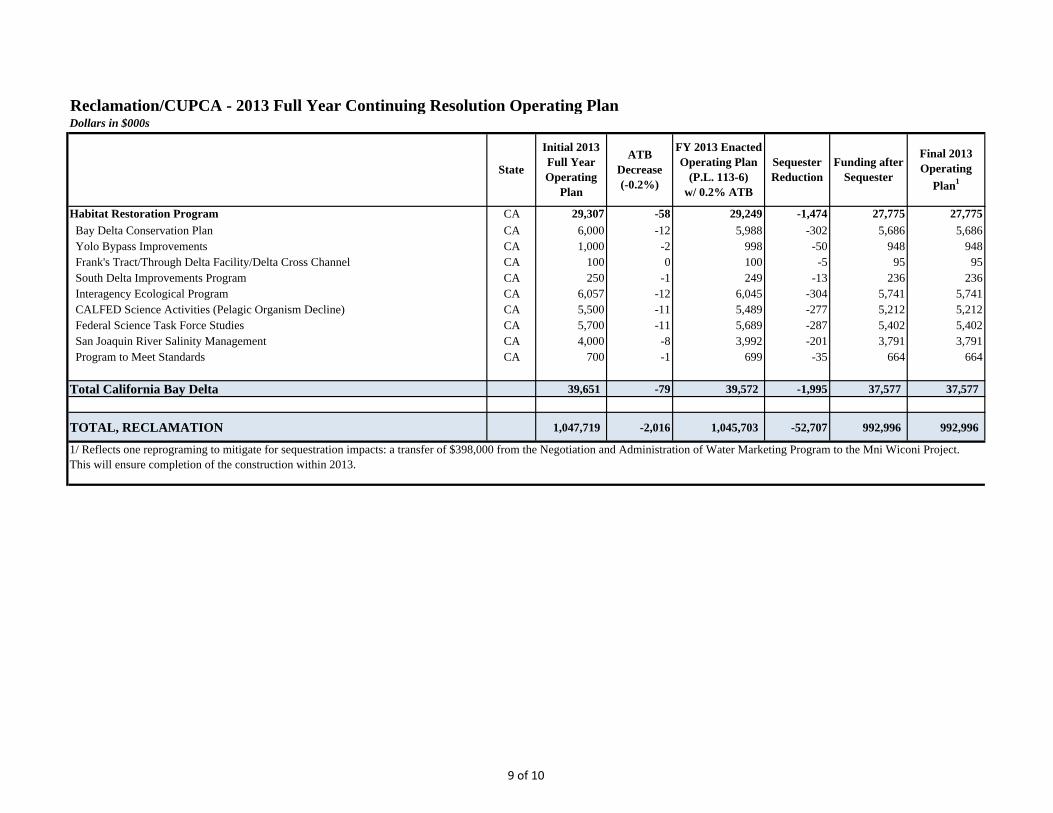
Habitat Restoration Program CA 29,307 -58 29,249 -1,474 27,775 27,775 Bay Delta Conservation Plan CA 6,000 -12 5,988 -302 5,686 5,686 Yolo Bypass Improvements CA 1,000 -2 998 -50 948 948 Frank's Tract/Through Delta Facility/Delta Cross Channel CA 100 0 100 -5 95 95 South Delta Improvements Program CA 250 -1 249 -13 236 236 Interagency Ecological Program CA 6,057 -12 6,045 -304 5,741 5,741 CALFED Science Activities (Pelagic Organism Decline) CA 5,500 -11 5,489 -277 5,212 5,212 Federal Science Task Force Studies CA 5,700 -11 5,689 -287 5,402 5,402 San Joaquin River Salinity Management CA 4,000 -8 3,992 -201 3,791 3,791 Program to Meet Standards CA 700 -1 699 -35 664 664
Total California Bay Delta 39,651 -79 39,572 -1,995 37,577 37,577
TOTAL, RECLAMATION 1,047,719 -2,016 1,045,703 -52,707 992,996 992,996
1/ Reflects one reprograming to mitigate for sequestration impacts: a transfer of $398,000 from the Negotiation and Administration of Water Marketing Program to the Mni Wiconi Project. This will ensure completion of the construction within 2013.
9 of 10

Reclamation/CUPCA - 2013 Full Year Continuing Resolution Operating PlanDollars in $000s
Final 2013 Operating
Plan1State Sequester
Reduction Funding after
Sequester
Initial 2013 Full Year Operating
Plan
ATB Decrease(-0.2%)
FY 2013 Enacted Operating Plan
(P.L. 113-6) w/ 0.2% ATB
Central Utah Project Completion AccountWater Conservancy District UT 17,300 -35 17,265 0 17,265 17,265Fish and Wildlife Conservation UT 1,200 -2 1,198 0 1,198 1,198Program Oversight and Administration UT 1,300 -3 1,297 0 1,297 1,297
Total Central Utah Project Completion Account 19,800 -40 19,760 - 19,760 19,760
Mitigation and Conservation AccountMitigation and Conservation UT 1,200 -2 1,198 0 1,198 1,198
Total Mitigation and Conservation Account 1,200 -2 1,198 - 1,198 1,198
TOTAL, Central Utah Project Completion Account 21,000 -42 20,958 - 20,958 20,958 Note: As the 2013 CUPCA appropriation was less than the 2013 part year Continuing Resolution annualized amount minus the sequestration, the crediting provisions of BBEDCA Section 253(f) will offset the financial effects of the sequester for 2013 by providing a reduction in the amount of the sequestration.
10 of 10