
BOOT Jan 2016 Investor Presentation
25
1 ICR XChange Conference January 12, 2016
-
Upload
ala-baster -
Category
Documents
-
view
9 -
download
2
description
BOOT Jan 2016 Investor Presentation
Transcript of BOOT Jan 2016 Investor Presentation

1
ICR XChange Conference January 12, 2016

2
2
FORWARD LOOKING STATEMENTS Forward-Looking Statements
This presentation contains forward-looking statements that are subject to risks and uncertainties. All statements other than statements of historical fact included in this presentation are forward-looking statements. You can identify forward-looking statements by the fact that they generally include words such as "anticipate," "estimate," "expect," "project," "plan,“ "intend," "believe," “outlook” and other words and terms of similar meaning in connection with any discussion of the timing or nature of future operating or financial performance or other events but not all forward-looking statements contain these identifying words. These forward-looking statements are based on assumptions that the Company’s management has made in light of their industry experience and on their perceptions of historical trends, current conditions, expected future developments and other factors they believe are appropriate under the circumstances. As you consider this presentation, you should understand that these statements are not guarantees of performance or results. They involve risks, uncertainties (some of which are beyond the Company’s control) and assumptions. These risks, uncertainties and assumptions include, but are not limited to, the following: the failure to realize the anticipated synergies from the Sheplers acquisition and other risks of integration, declines in consumer spending or changes in consumer preferences and the Company’s ability to effectively execute on its growth strategy; to maintain and enhance its strong brand image; to compete effectively; to maintain good relationships with its key suppliers; and to improve and expand its exclusive product offerings. The Company discusses the foregoing risks and other risks in greater detail under the heading “Risk factors” in the periodic reports filed by the Company with the Securities and Exchange Commission. Although the Company believes that these forward-looking statements are based on reasonable assumptions, you should be aware that many factors could affect the Company’s actual financial results and cause them to differ materially from those anticipated in the forward-looking statements. Because of these factors, the Company cautions that you should not place undue reliance on any of these forward-looking statements. New risks and uncertainties arise from time to time, and it is impossible for the Company to predict those events or how they may affect the Company. Further, any forward-looking statement speaks only as of the date on which it is made. Except as required by law, the Company does not intend to update or revise the forward-looking statements in this presentation after the date of this presentation.
Industry and Market Information
Statements in this presentation concerning our industry and the markets in which we operate, including our general expectations and competitive position, business opportunity and market size, growth and share, are based on information from independent industry organizations and other third-party sources, data from our internal research and management estimates. Management estimates are derived from publicly available information and the information and data referred to above, and are based on assumptions and calculations made by us based upon our interpretation of such information and data. The information and data referred to above are imprecise and may prove to be inaccurate because the information cannot always be verified with complete certainty due to the limitations on the availability and reliability of raw data, the voluntary nature of the data gathering process and other limitations and uncertainties. As a result, please be aware that the data and statistical information in this presentation may differ from information provided by our competitors or from information found in current or future studies conducted by market research institutes, consultancy firms or independent sources.
Non-GAAP Financial Measures
The Company presents Adjusted EBITDA and Adjusted EBIT because they are important financial measures that its management, board of directors and lenders use to assess the Company’s operating performance. However, Adjusted EBITDA and Adjusted EBIT are non-GAAP financial measures and should not be considered in isolation or as an alternative to net income or any other measure of financial performance calculated and presented in accordance with GAAP. The Company defines Adjusted EBITDA as earnings before interest, income tax, depreciation and amortization, or EBITDA, adjusted to exclude non-cash stock-based compensation, the non-cash accrual for future award redemptions, recapitalization expenses, acquisition expenses, acquisition-related integration and reorganization costs, amortization of inventory fair value adjustment, loss on disposal of assets and contract termination costs, secondary offering costs, and other unusual or non-recurring expenses. Adjusted EBIT is defined as Adjusted EBITDA less depreciation and amortization. Since Adjusted EBITDA and Adjusted EBIT are non-GAAP financial measures, they are susceptible to varying calculations and the Company’s Adjusted EBITDA and Adjusted EBIT may not be comparable to similarly titled measures of other companies, including companies in its industry. See the Appendix to this presentation for a reconciliation of Adjusted EBITDA to Net Income.

3
3
3
3
OVERVIEW OF BOOT BARN
STRATEGIC INITIATIVES
BUSINESS UPDATE
FINANCIAL UPDATE
AGENDA

4
4
EVERYDAY AMERICAN CUSTOMERS
1 Forbes.com, 2/27/12, “NASCAR’s back!”; 2 Mlive blog, 1/4/2014, “America’s Top 20 Best-Selling Vehicles of 2013”; 3 NPD Group, 2/28/13, “Country Music Rises to Become America’s Favorite Genre”; 4 Forbes.com, 8/30/2013, “America’s Fastest Growing Sport: Professional Bull Riding”
#1 spectator sport1
Most popular music genre3
Highest selling vehicle2
Fastest growing sport4

5
5
EVERYDAY MERCHANDISE ASSORTMENT
RUGGED FOOTWEAR OUTERWEAR OVERALLS PANTS SHIRTS
WO
RK
Low fashion quotient enables high degree of replenishment
BOOTS DENIM WESTERN SHIRTS COWBOY HATS BELTS / BELT BUCKLES
WES
TER
N

6
6
BOOT BARN SNAPSHOT
SALES COMPOSITION1
Footwear 51%
Hats, Accessories & Other 17%
Apparel 32%
ILLUSTRATIVE STORE
1Note: Fiscal year ended March 28, 2015, excluding Sheplers.
SALES BY END USER1
Men's 60% Women's
26%
Kids’ 5% Unisex
9%

7
7
OVER 200 BRANDS AND MORE THAN 1,500 STYLES
= Private brands
WESTERN WORK / OTHER
8
8
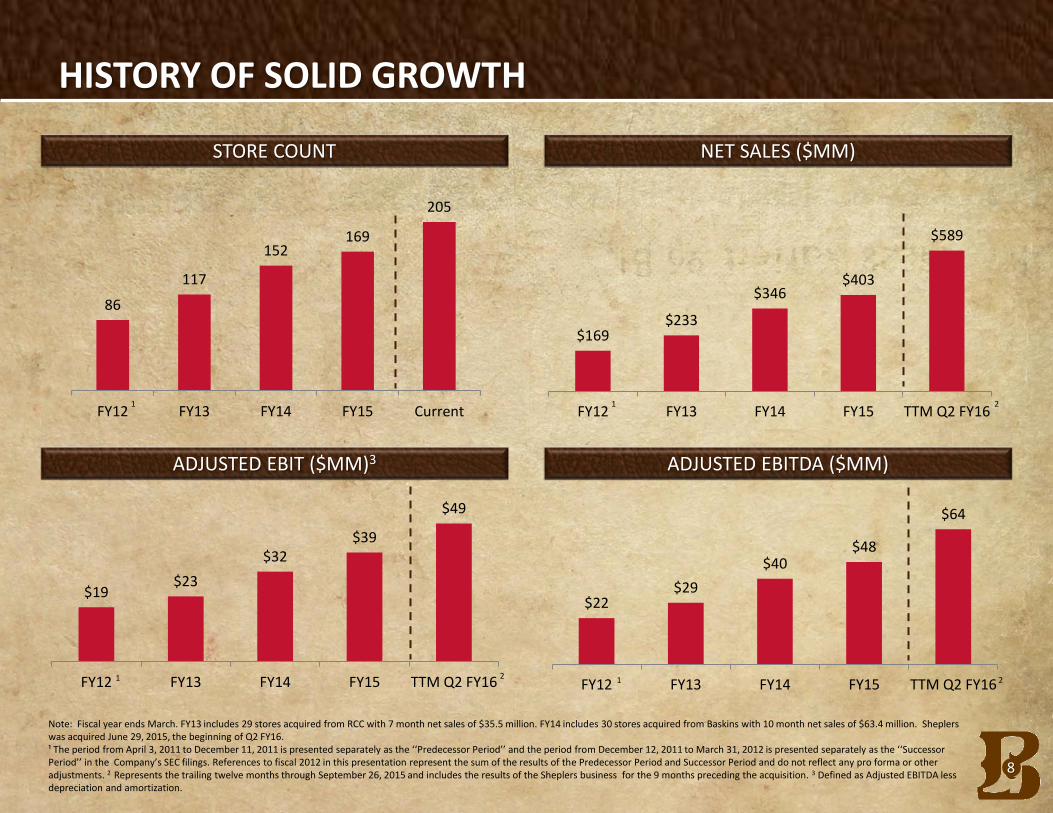
HISTORY OF SOLID GROWTH
Note: Fiscal year ends March. FY13 includes 29 stores acquired from RCC with 7 month net sales of $35.5 million. FY14 includes 30 stores acquired from Baskins with 10 month net sales of $63.4 million. Sheplers was acquired June 29, 2015, the beginning of Q2 FY16. ¹ The period from April 3, 2011 to December 11, 2011 is presented separately as the ‘‘Predecessor Period’’ and the period from December 12, 2011 to March 31, 2012 is presented separately as the ‘‘Successor Period’’ in the Company’s SEC filings. References to fiscal 2012 in this presentation represent the sum of the results of the Predecessor Period and Successor Period and do not reflect any pro forma or other adjustments. 2 Represents the trailing twelve months through September 26, 2015 and includes the results of the Sheplers business for the 9 months preceding the acquisition. 3 Defined as Adjusted EBITDA less depreciation and amortization.
STORE COUNT NET SALES ($MM)
ADJUSTED EBIT ($MM)3 ADJUSTED EBITDA ($MM)
2
2 2 1
1 1
1
86
117
152 169
205
FY12 FY13 FY14 FY15 Current
$169 $233
$346 $403
$589
FY12 FY13 FY14 FY15 TTM Q2 FY16
$19 $23
$32 $39
$49
FY12 FY13 FY14 FY15 TTM Q2 FY16
$22 $29
$40 $48
$64
FY12 FY13 FY14 FY15 TTM Q2 FY16

9
9
LARGEST WESTERN AND WORK WEAR RETAILER
WESTERN WEAR CHAINS (ESTIMATED STORE COUNT)1 OTHER COMPETITORS
7
10
23
71
>2.5x as many stores
as closest competitor
National
Regional (Mostly Texas)
Geographic presence
Independent retailers
Regional (Western Canada)
Arizona
North & South Carolina
1 Store count as of January 6, 2016
We are the fastest-growing western and work wear retailer
Thousands
Farm supply stores
Mass merchandisers
Online
205

10
10
BOOT BARN STRATEGIC POSITIONING
Genuine lifestyle retail brand
Clear national leader in a large and fragmented market niche
Significant new store growth opportunity
Great omni channel brand…plus…leading pure play e-commerce brand
Long history of same store sales growth
Strong portfolio of exclusive private brands
Loyal customer base
Experienced management team and passionate organization 10

11
11
11
11
1 EXPAND OUR STORE BASE
2
3
4
DRIVE SAME STORE SALES GROWTH
BUILD OUT PRIVATE BRAND PORTFOLIO
GROW E-COMMERCE AND OMNI CHANNEL EXPERIENCE
STRATEGIC INITIATIVES
12
12
12
12
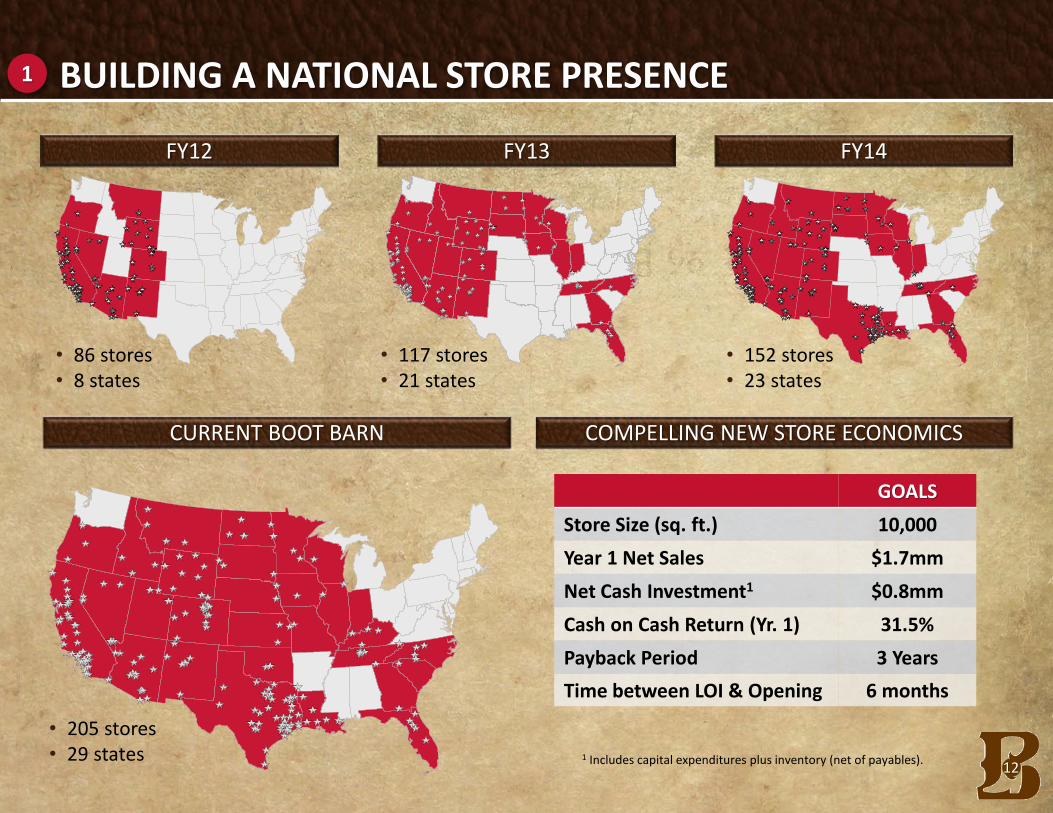
BUILDING A NATIONAL STORE PRESENCE
FY12
• 86 stores • 8 states
FY13
• 117 stores • 21 states
• 152 stores • 23 states
FY14
COMPELLING NEW STORE ECONOMICS CURRENT BOOT BARN
• 205 stores • 29 states
1
GOALS
Store Size (sq. ft.) 10,000
Year 1 Net Sales $1.7mm
Net Cash Investment1 $0.8mm
Cash on Cash Return (Yr. 1) 31.5%
Payback Period 3 Years
Time between LOI & Opening 6 months
1 Includes capital expenditures plus inventory (net of payables).
13
13
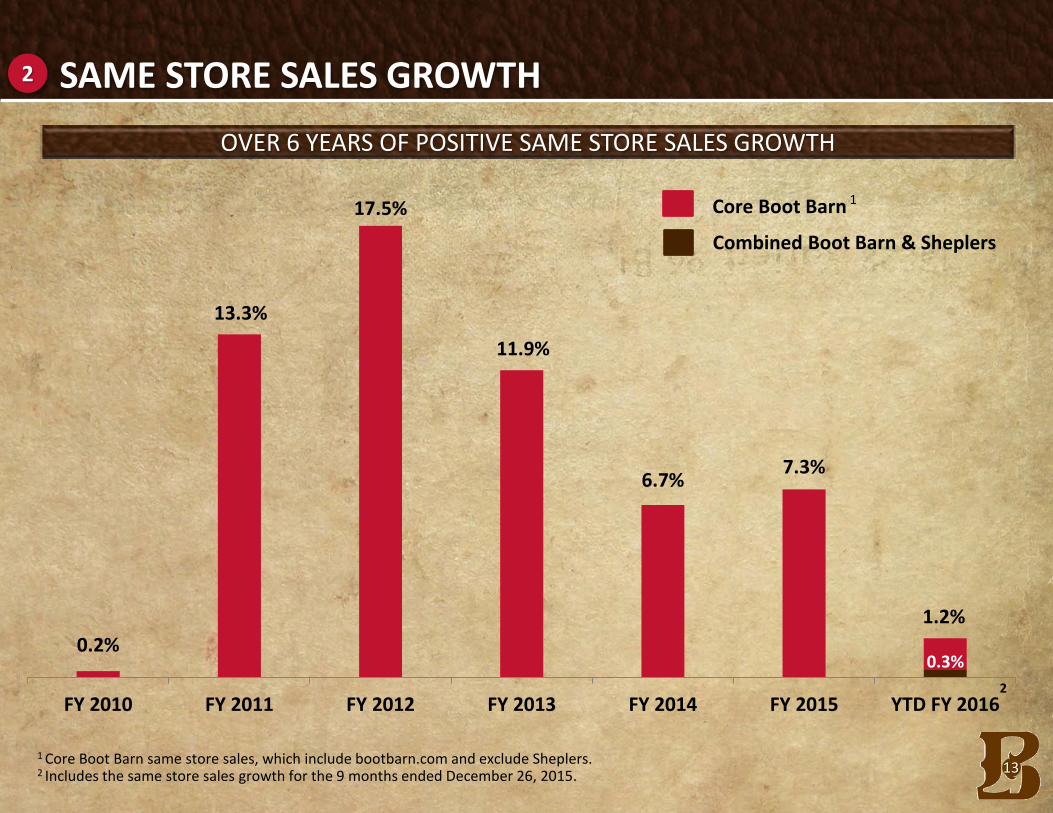
SAME STORE SALES GROWTH 2
OVER 6 YEARS OF POSITIVE SAME STORE SALES GROWTH
1
1 Core Boot Barn same store sales, which include bootbarn.com and exclude Sheplers. 2 Includes the same store sales growth for the 9 months ended December 26, 2015.
0.2%
13.3%
17.5%
11.9%
6.7% 7.3%
0.3%
1.2%
FY 2010 FY 2011 FY 2012 FY 2013 FY 2014 FY 2015 YTD FY 2016
Core Boot Barn
Combined Boot Barn & Sheplers
2

14
14
HIGHLY SUCCESSFUL PRIVATE BRANDS
Private brands account for approximately 13% of sales
3
CORE BOOT BARN PRIVATE BRAND PENETRATION
3%
5%
7%
10%
13%
FY2012 FY2013 FY2014 FY2015 YTD Q3FY2016
1
1 Excludes Sheplers

15
15
LEADING OMNI CHANNEL & LEADING E-COMMERCE BRANDS
DUAL BRAND STRATEGY
Product / Lifestyle / Omni-Channel
Direct-to-Consumer / Promotional
1 Trailing 12 months (TTM) as of December 26, 2015.
4
E-COMM SALES WITH SHEPLERS ($M)
8 12
14 17
FY12 FY13 FY14 FY15 Q3 FY16TTM
Combined
CAGR: 83%
1
94

16
16
16
16
OVERVIEW OF BOOT BARN
STRATEGIC INITIATIVES
BUSINESS UPDATE
FINANCIAL UPDATE
AGENDA

17
17 17
SHEPLERS ACQUISITION OVERVIEW
Background
• Authentic western retail and e-commerce business
• Rich 116-year heritage – founded in 1899
• Leading Direct to Consumer brand with catalog legacy 1
• The 3rd largest western retailer in the U.S.
• 19 stores rebranded to Boot Barn
• Sheplers.com continues as leading e-commerce site in western industry
• Acquisition closed June 29, 2015
Financials
• Key financials (for 12 months ending March 2015)2:
‐ Total Sales: $157 million
‐ E-Commerce Sales: $66 million
• Leading e-commerce platform:
‐ Represents 42% of total Sheplers sales3
‐ Highest customer traffic vs. all western competitors
‐ Domestic and international customer base
KEY FACTS
Northglenn, CO
Greenwood Village, CO
Mesquite, TX
Dallas/Fort Worth, TX
San Antonio, TX
McAllen, TX
Orlando, FL
Frisco, TX
Wichita, KS
Omaha, NE
Oklahoma City, OK
Mesa, AZ
Arlington, TX
Lubbock, TX
Odessa, TX
Austin, TX
Preston, TX
1 Sheplers phased out its catalog business in 2014 to focus exclusively on e-commerce and stores
2 Unaudited financials
3 Trailing 12 months (TTM) as of March 2015

18
18
SHEPLERS ACQUISITION UPDATE
Accomplishments Sheplers Q3 Results
• Consolidated / integrated all Corporate and Field functions
• Converted POS and most back office systems
• Launched new product assortment and rebranded Sheplers stores
• Rolled out Boot Barn private brands
• Implemented Boot Barn marketing and B-Rewarded Loyalty program in stores
• Retained key management at Sheplers ecommerce
Sales • Solid growth in ecommerce sales • Rebranded store sales declined for the
quarter but have turned positive post Christmas after cycling heavy promotional period
Margin • Uptick in stores’ merchandise margin due
to fewer promotions vs prior year • Successful introduction of private brands
Expenses • Greater expense savings than anticipated
Customer Loyalty • Enrolled more than 100,000 customers in
our B-Rewarded loyalty program since the acquisition
19
19
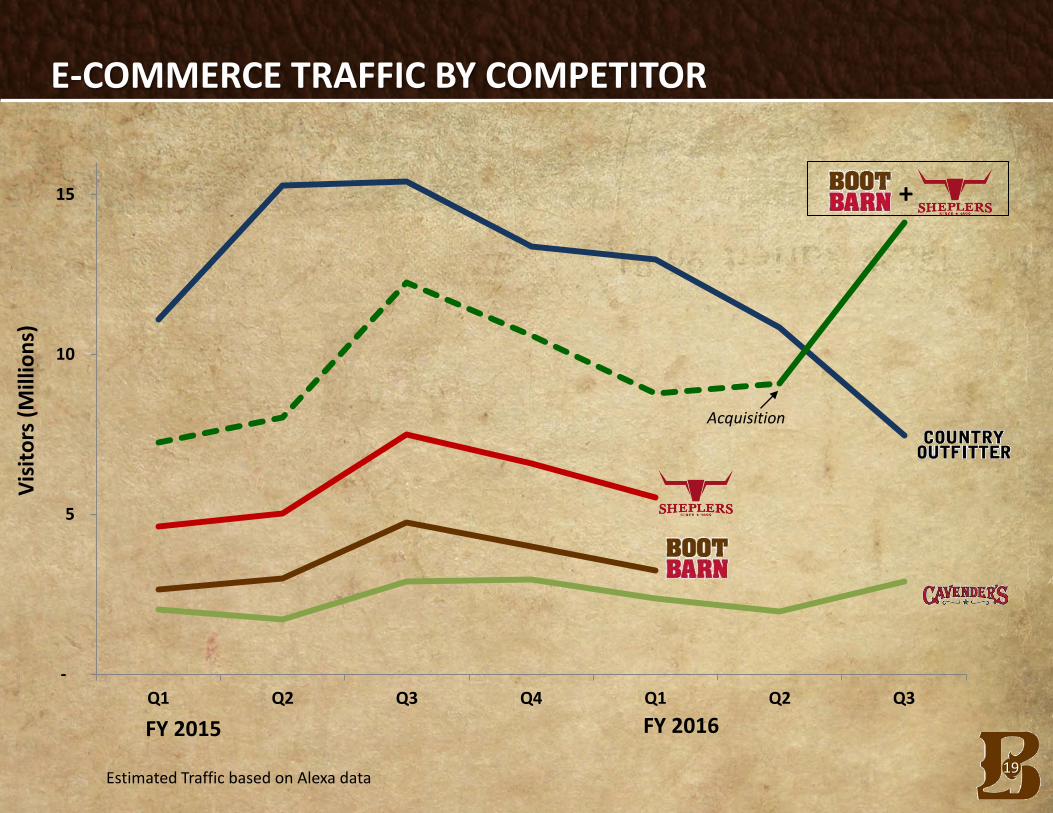
E-COMMERCE TRAFFIC BY COMPETITOR
-
5
10
15
Q1 Q2 Q3 Q4 Q1 Q2 Q3
FY 2015 FY 2016
+
Vis
ito
rs (
Mill
ion
s)
Estimated Traffic based on Alexa data
Acquisition

20
20
SHEPLERS STORE REBRANDING

21
21
Q3 BUSINESS UPDATE
• Sales in markets exposed to oil and commodities continued to be pressured (including
North Dakota, Colorado, Wyoming and Texas)
• Disruption from Sheplers store construction coupled with a highly promotional prior year period led to a decline in Sheplers store sales (which turned positive post-Christmas)
• Unseasonably warm weather negatively impacted sales
• Double digit growth in e-commerce
• Stores in many core markets without commodity exposure continue to show strong growth (including Nevada, California and Arizona)
• Maintained full price selling model
• Boot Barn model continues to be compelling
Challenges
Achievements

22
22
OVERVIEW OF BOOT BARN
STRATEGIC INITIATIVES
BUSINESS UPDATE
FINANCIAL UPDATE
AGENDA
23
23
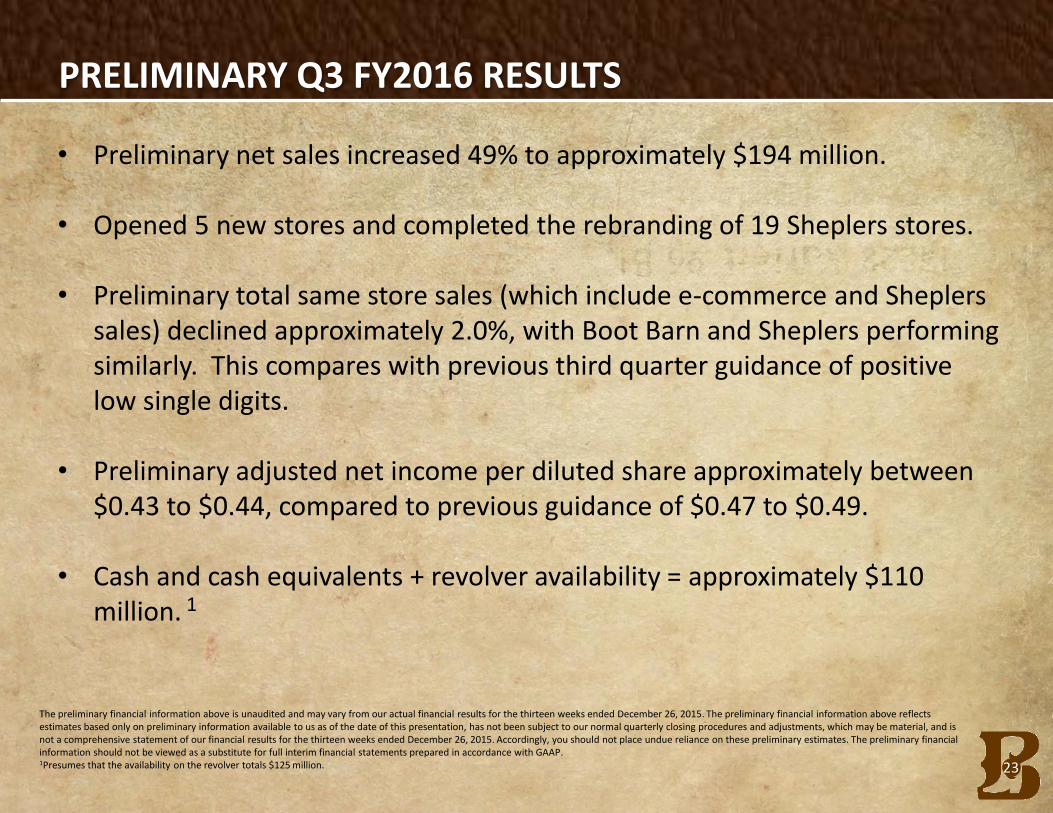
PRELIMINARY Q3 FY2016 RESULTS
The preliminary financial information above is unaudited and may vary from our actual financial results for the thirteen weeks ended December 26, 2015. The preliminary financial information above reflects estimates based only on preliminary information available to us as of the date of this presentation, has not been subject to our normal quarterly closing procedures and adjustments, which may be material, and is not a comprehensive statement of our financial results for the thirteen weeks ended December 26, 2015. Accordingly, you should not place undue reliance on these preliminary estimates. The preliminary financial information should not be viewed as a substitute for full interim financial statements prepared in accordance with GAAP. 1Presumes that the availability on the revolver totals $125 million.
• Preliminary net sales increased 49% to approximately $194 million. • Opened 5 new stores and completed the rebranding of 19 Sheplers stores. • Preliminary total same store sales (which include e-commerce and Sheplers
sales) declined approximately 2.0%, with Boot Barn and Sheplers performing similarly. This compares with previous third quarter guidance of positive low single digits.
• Preliminary adjusted net income per diluted share approximately between
$0.43 to $0.44, compared to previous guidance of $0.47 to $0.49. • Cash and cash equivalents + revolver availability = approximately $110
million. 1

24
24
APPENDIX

25
25
ADJUSTED EBITDA RECONCILIATION
(a) Represents non-cash compensation expenses related to stock options and restricted stock awards granted to certain of our employees and directors. (b) Represents non-cash accrual for future award redemptions in connection with our customer loyalty program. (c) Represents non-capitalized costs associated with the Recapitalization. (d) Represents direct costs and fees related to the acquisitions of RCC, Baskins, and Sheplers. (e) Represents certain store integration, remerchandising and corporate consolidation costs incurred in connection with the integrations of RCC, Baskins, and Sheplers. (f) Represents the amortization of purchase-accounting adjustments that increased the value of inventory acquired to its fair value. (g) Represents loss on disposal of assets in connection with the rebranding of RCC, Baskins, and Sheplers acquired stores and store closures, as well as other costs. (h) Represents professional fees and expenses incurred in connection with the secondary offering held in February 2015. (i) Represents professional fees and expenses incurred in connection with other acquisition activity. Also includes costs incurred at Sheplers prior to the June 29, 2015 acquisition such as non-recurring legal and other professional fees, transaction and settlement costs, and store pre-opening costs for new stores.
TTM Successor Predecessor
(in thousands)
September
26, March 28, March 29, March 30,
Dec. 12,
2011 to
Apr 3, 2011
to
2015 2015 2014 2013 31-Mar-12
Dec. 11,
2011
EBITDA Reconciliation:
Net income $ 6,851 $ 13,730 $ 5,660 $ 680 $ (4,601) $ (660)
Income tax expense 8,668 8,466 3,321 826 (1,047) (135)
Interest expense, net 21,248 13,291 11,594 7,415 1,442 3,684
Depreciation and intangible asset amortization 14,126 9,207 8,129 5,588 1,095 1,218
EBITDA 50,893 44,694 28,704 14,509 (3,111) 4,107
Non-cash stock-based compensation (a) 2,510 2,048 1,291 787 99
-
Non-cash accrual for future award redemptions (b) 26 (49) 591 219 384 470
Recapitalization expenses (c) -
- - - 3,027 7,336
Acquisition-related expenses (d) 891
- 671 1,138
-
-
Acquisition-related integration and reorganization costs (e) 5,368
- 6,167 2,061
-
-
Amortization of inventory fair value adjustment (f) (225)
- 867 9,199 9,369
-
Loss on disposal of assets (g) 1,101 134 1,980 322 17 4
Secondary Offering Costs (h) 541 541
Other unusual non-recurring expenses (i) 2,458 864
- 698
-
-
Adjusted EBITDA $ 63,562 $ 48,232 $ 40,271 $ 28,933 $ 9,785 $ 11,917
Fiscal Year Ended