Boom or Bust: Where to Australia?
25
Boom or Bust: Where to Australia? Speech given by Professor Quentin Grafton FASSA ([email protected]; +62 2 6125 6558) of the Crawford School of Public Policy, the Australian National University (ANU) on the occasion of the Keith Campbell Distinguished Lecture held at the Annual Conference of the Australian Agricultural & Resource Economics Society, 7 February 2014. Opening Remarks First, let me thank Peter Warr, the President of the Society, Alan Randall and also the organising committee for this year’s conference for giving me the opportunity to present the Keith Campbell Distinguished Lecture. I am also grateful for the research support and advice of Sam Reinhardt in her role as a graduate student at the ANU. Second, let me explain that my lecture looks at key past and current economic trends, reviews the risks and opportunities and considers the challenges ahead to 2020. I do not consider social and environmental issues. This is not because I consider these issues unimportant, but because my focus today is exclusively on the economy. Third, I claim no unique insight or expertise beyond that of an Australian who tries to follow and understand the state of the domestic and global economy, but who has worked as both an academic economist and as a Chief Economist for the Australian government. I also recognise that I am in a crowded space of keen observers and commentators in academia (such as Henry Ergas, Ross Garnaut, Warwick McKibbin and John Quiggin to name just a few of the more prominent), business economists (such as Saul Eslake, Bill Evans and Warren Hogan), economic editors in the media (such as Ross Gittins, Alan Mitchell and David Uren) and the pronouncements from the key insiders such as Glenn Stevens at the RBA and Martin Parkinson at the Treasury. Introduction I believe that neither the 15 second news report or the 600 words op ed allow for a fully- informed and comprehensive public debate that Australia must have about its economic future. Such ‘sound bites’ inevitably only provide one part of the puzzle whether be it the state of our federal budget, the price of iron ore, China’s last quarterly growth numbers or the latest news on the US Fed’s tapering of its bond purchases. My value add today is not in the uniqueness of my insights, some of which I expect that many of you share, but the synthesis that this invitation to speak to you today affords me. My speech is in three parts: First, I will briefly explain how we got to where are today in the economy by highlighting the past decade and the impacts of the millennium mining boom. For those seeking a more detailed review of the boom, please see my September 2012 speech at the Australian National Conference on Resources & Energy which is available for download from the Bureau of Resources & Energy Economics (BREE), or from me on request.
Transcript of Boom or Bust: Where to Australia?

Boom or Bust: Where to Australia?
Speech given by Professor Quentin Grafton FASSA ([email protected]; +62 2 6125 6558) of the Crawford School of Public Policy, the Australian National University (ANU) on the occasion of the Keith Campbell Distinguished Lecture held at the Annual Conference of the Australian Agricultural & Resource Economics Society, 7 February 2014.
Opening Remarks
First, let me thank Peter Warr, the President of the Society, Alan Randall and also the organising committee for this year’s conference for giving me the opportunity to present the Keith Campbell Distinguished Lecture. I am also grateful for the research support and advice of Sam Reinhardt in her role as a graduate student at the ANU.
Second, let me explain that my lecture looks at key past and current economic trends, reviews the risks and opportunities and considers the challenges ahead to 2020. I do not consider social and environmental issues. This is not because I consider these issues unimportant, but because my focus today is exclusively on the economy.
Third, I claim no unique insight or expertise beyond that of an Australian who tries to follow and understand the state of the domestic and global economy, but who has worked as both an academic economist and as a Chief Economist for the Australian government. I also recognise that I am in a crowded space of keen observers and commentators in academia (such as Henry Ergas, Ross Garnaut, Warwick McKibbin and John Quiggin to name just a few of the more prominent), business economists (such as Saul Eslake, Bill Evans and Warren Hogan), economic editors in the media (such as Ross Gittins, Alan Mitchell and David Uren) and the pronouncements from the key insiders such as Glenn Stevens at the RBA and Martin Parkinson at the Treasury.
Introduction
I believe that neither the 15 second news report or the 600 words op ed allow for a fully-informed and comprehensive public debate that Australia must have about its economic future. Such ‘sound bites’ inevitably only provide one part of the puzzle whether be it the state of our federal budget, the price of iron ore, China’s last quarterly growth numbers or the latest news on the US Fed’s tapering of its bond purchases. My value add today is not in the uniqueness of my insights, some of which I expect that many of you share, but the synthesis that this invitation to speak to you today affords me.
My speech is in three parts:
First, I will briefly explain how we got to where are today in the economy by highlighting the past decade and the impacts of the millennium mining boom. For those seeking a more detailed review of the boom, please see my September 2012 speech at the Australian National Conference on Resources & Energy which is available for download from the Bureau of Resources & Energy Economics (BREE), or from me on request.

Second, I will review the economic risks and opportunities facing Australia. These include both the home-grown variety that Australia is able as a nation to respond to, and the external risks in the global economy about which we can do little.
Third, I will close by offering my thoughts as to what economic tack Australia should be sailing as it steers towards 2020.
How did Australia get here?
First let me talk about how Australia arrived at the state of its economy today. I will emphasise two stand-out economic features of this millennium:
First, and foremost, the biggest influence of the past decade on Australia has been the Millennium Mining Boom which is the largest boom ever experienced since Australia became a nation. The price paths of the boom peaked in 2011 and the investment phase in 2013, the output phase will not peak for another 4-5 years and will likely provide much of the growth in the economy and exports over this period.
Source: BREE 2013

While mining directly only employs a little over 2% of the Australian workforce it represents about 60% of the value of Australian exports (including energy) and currently half of all private capital expenditures.
Source: ABS 2013, 5625.0 Private New Capital Expenditure and Expected Expenditure
The boom was brought about unprecedented growth in demand for some of Australia’s key mineral exports (iron ore, coal and gas) in China and other emerging economies. The boom in the resources and energy sector has spilled over to the whole of the economy and has restructured the economy. It led to substantially higher real incomes, increased government revenues that generated concomitant rises in government expenditures, and a wealth effect for Australian consumers through consistently high levels of the Australian dollar (especially at the peak of the boom).
0%
10%
20%
30%
40%
50%
60%
70%
Mar-1989 Mar-1993 Mar-1997 Mar-2001 Mar-2005 Mar-2009 Mar-2013
Mining Share of Private Capex

Sources: (1) Terms of Trade: ABS, 5206.0 Australian National Accounts: National Income, Expenditure and Product (2) Iron ore prices from Indexmundi
The boom built on two decades or so of economic reforms that began in the early 1980s with the floating of the dollar and continued through to competition, microeconomic and tax reforms in the 1990s that helped Australia to respond to and benefit from the boom.
Second, as with all countries, the Global Financial Crisis (GFC) has shaped and is shaping the world and Australia’s economy. It was by far the biggest economic downturn the global economy experienced since the Second World War. Despite recent and welcome economic news over the past few months the policy settings, especially in terms of monetary policy in developed countries, still remain at GFC levels more than five years after the final trigger of the crisis, the filing for bankruptcy by the Lehman Brothers on September 15, 2008.
As a result of massive and co-ordinated fiscal stimulus by G20 countries and zero or close to zero interest rates in the world’s major economies, disaster was averted. Nevertheless, countries continue to suffer and some, such as Greece, may take decades to return to their pre-GFC income levels. For nations like Greece the severity of the impact of the GFC is
45.0
55.0
65.0
75.0
85.0
95.0
105.0
115.0
0
20
40
60
80
100
120
140
160
180
200
Mar
-199
4
Jan-
1995
Nov
-199
5
Sep-
1996
Jul-1
997
May
-199
8
Mar
-199
9
Jan-
2000
Nov
-200
0
Sep-
2001
Jul-2
002
May
-200
3
Mar
-200
4
Jan-
2005
Nov
-200
5
Sep-
2006
Jul-2
007
May
-200
8
Mar
-200
9
Jan-
2010
Nov
-201
0
Sep-
2011
Jul-2
012
May
-201
3
Iron Ore Price Terms of Trade Index

equivalent to that suffered by the US during the Great Depression. The US itself has recovered in the sense that its output exceeds its pre-GFC level, but remains well below (about 8%) where it would have been in the absence of the crisis and had it stayed on its prior trend growth. One of the contributing causes of the crisis is sustained global imbalances, and while diminished, they still remain.
Source: IMF WEO Database, http://www.imf.org/external/pubs/ft/weo/2013/02/weodata/index.aspx
By contrast to many countries, Australia managed the initial period of the GFC well due to a rapid easing of monetary policy and fiscal stimulus domestically, and by its key trading partners (especially China), coupled with a rapid depreciation in the Australian dollar. Some of the factors that assisted Australia in 2009/10 are a ‘two-edged sword’. This is because the growth in spending in response to the GFC is not sustainable by either Australia or its trading partners. Further, falls in the dollar which Australia has experienced since the last quarter of 2013 will increase domestic prices. As the inevitable fiscal adjustment to ‘normal’ occurs Australia faces hard spending choices and also trade-offs about what should be the appropriate cash rate.
The economic risks and opportunities facing Australia can be divided into, one, Made-in-Australia challenges and, two, global risks to which Australia can do little or nothing to influence.
-800
-600
-400
-200
0
200
400
600
-800
-600
-400
-200
0
200
400
600
1990 1994 1998 2002 2006 2010 2014 2018
United States
Current Account (U.S.$ Billion)

Made in Australia: Risks and Opportunities
The Three Ps
A useful framework for understanding the key supply determinants of level and trend in economic performance at a per capita level is the 3 Ps. They include: (1) Participation in the workforce; (2) Productivity (labour and multifactor); and (3) Prices (terms of trade). Australia has been fortunate that in the 1980s it benefited from a sustained increase in labour force participation, in the 1990s enjoyed a surge in productivity growth and in the 2000s a dramatic increase in its terms of trade.
Over the past three decades Australia has enjoyed solid growth in real per capita incomes. The relative contributions to gross national income of the three Ps, including population, are provided in the figure below for the decade before and the decade of the millennium mining boom.
Source: Grafton 2012 As projected by the Australian Treasury, in the decade to 2023 per capita income growth will decline
Income
49%
Population
12%
Participation
1%
Productivity
18%
Terms of Trade
4%
1992-20022002-2012
Income: Real gross national income: Chain volume measures Productivity: Multifactor productivity, quality hours adjusted hours worked
16%
3%
- 3%
46% 86%
Income
49%
Population
12%
Participation
1%
Productivity
18%
Terms of Trade
4%
1992-20022002-2012
Income: Real gross national income: Chain volume measures Productivity: Multifactor productivity, quality hours adjusted hours worked
16%
3%
- 3%
46% 86%
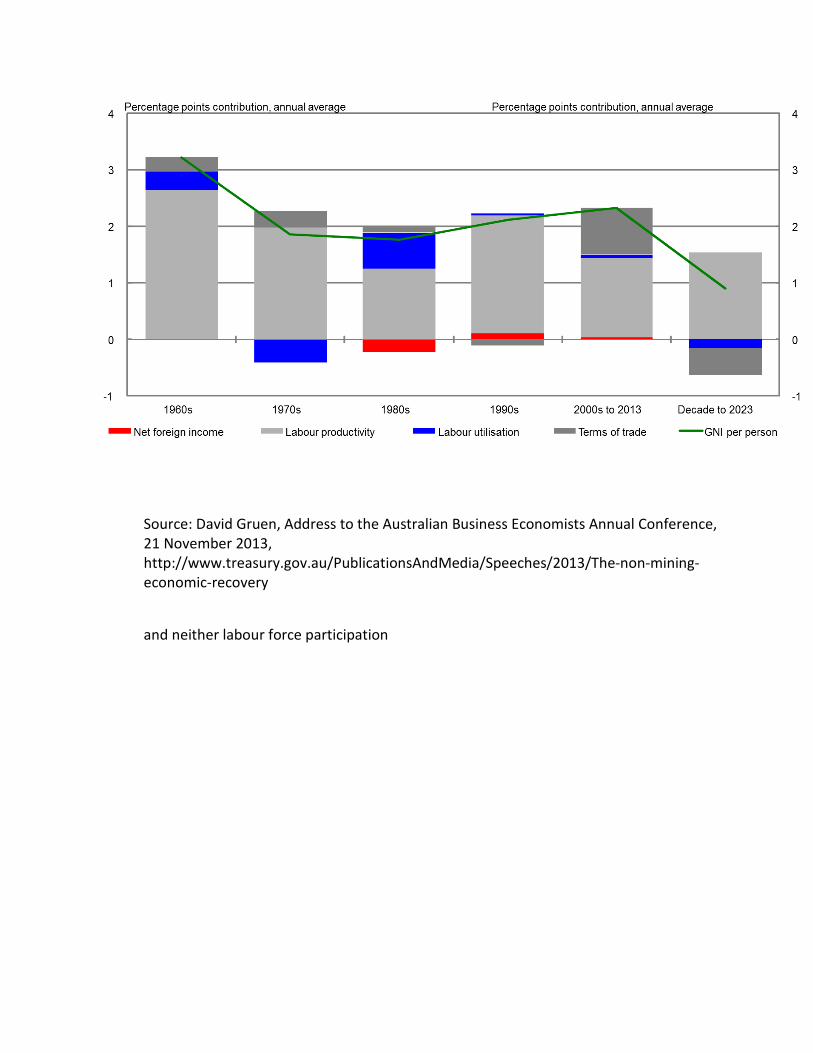
Source: David Gruen, Address to the Australian Business Economists Annual Conference, 21 November 2013, http://www.treasury.gov.au/PublicationsAndMedia/Speeches/2013/The-non-mining-economic-recovery
and neither labour force participation

Source: Australia to 2050 (Intergenerational Report) 2010, p12
nor prices will support income growth to 2020.

Source: ABS 2013 Only productivity is expected to make a positive net contribution to income growth over the next decade, but this growth is expected to be at a level below the stellar performance of the 1990s.
0.0
20.0
40.0
60.0
80.0
100.0
120.0
0
20
40
60
80
100
120
Terms of trade…

Source: ABS 2012, 5260.0.55.002 Estimates of Industry Multifactor Productivity, Australia: Detailed Productivity Estimates.
Government Revenues and Spending
A direct consequence of the current economic trends is that nominal GDP growth, a key determinant of growth in government revenues, has dropped sharply since the boom peaked, declining from 8.5% in 2010-11 to 2.5% in 2012-13.
-6.00%
-4.00%
-2.00%
0.00%
2.00%
4.00%
6.00%
8.00%
10.00%
1994-95 1996-97 1998-99 2000-01 2002-03 2004-05 2006-07 2008-09 2010-11 Labour productivity (hours worked basis) Capital productivity
MFP (hours worked basis)

Source: Treasury 2013, Data provided by Treasury to SR. (Data attached to earlier email.) (Also in budget documents spanning a longer time period: Budget 2012-13, BP1, Statement 2: Economic Outlook, p2-37) Less robust nominal income growth requires that the expectations of Australians and the policy settings of the Commonwealth and state governments change from their GFC levels. The most immediate impact, which is already being felt in 2014, is the effect on government revenues and budgets. The bottom line is that forecast budgets are not sustainable in the long run if recent growth in spending continues and GDP growth stays at current levels.
-6.00
-4.00
-2.00
0.00
2.00
4.00
6.00
8.00
10.00
-6.00
-4.00
-2.00
0.00
2.00
4.00
6.00
8.00
10.00
1996-97 2000-01 2004-05 2008-09 2012-13
Real GDP GNE deflator contribution
Terms of trade contribution Nominal GDP

Source: Australia to 2050 (Intergenerational Report) 2010, p 48
This is because current projections are that payments will exceed receipts for the next decade,
1.9 2.5
3.8 4.2 4.2
3.5
0
1
2
3
4
5
1980s expansion 1990s expansion 2000s expansion
Average real spending growth rate Average real GDP growth rate

Source: Mid-Year Economic and Fiscal Outlook 2013, p24
as will the underlying cash balance of the Australian government

Source: Mid-Year Economic and Fiscal Outlook 2013, p24
This will occur even with bracket creep and recovery of tax revenues. Further, key sources of tax revenue that include the GST and corporate tax have, since 2011-12, declined as a proportion of national income. The underlying budget math is that during the millennium mining boom, under both the coalition and labor governments, the average annual rate of growth in real spending was about 3.5% per year. Much of this growth was paid for by the close to $200 billion increase in revenues enjoyed by Australian governments during the boom. From 2012-13 to 2013-14, Australian government tax revenues in nominal terms are expected to increase by about 4%, but nominal spending as a result of new programs and commitments in the 2013 election year will rise by twice as much. This is despite a commitment by the previous government to limit, on average, real spending growth to 2%/year. Sustainable budgets over the business cycle require much more than reducing the growth in spending. It demands tax and transfer reform. This is because the current tax system provides for a wide range of deductions that, at least for high-income Australians, imposes substantial opportunity costs and gives incentives to shift away from productive employment and investment to tax avoidance (especially in self-managed super funds). The current tax system also disconnects revenue raised from

spending responsibilities at the state and federal level and includes many inequities and inefficiencies (such as stamp duties). A good place to start tax reform is the Henry Tax Review released in 2010 Beyond the immediate budget challenge to rein in the growth in spending, an increase in per capita incomes over the coming decade in Australia will depend almost entirely on productivity growth. Unsurprisingly, during the mining boom productivity growth slumped especially in capital-intensive sectors, such as mining and electricity and water, and where there had been very large increases in investment. As the output from these investments comes on stream, at least in the mining sector, labour productivity should rise. Long-term growth in productivity, beyond tax reform, requires special attention to skills, training and education. Higher productivity is needed to justify Australia’s high wages. The challenge is that Australia is not only a high-cost economy relative to developing and emerging economies, but is high-cost compared to major developed economies such as the United States. For instance, in 2012 in the construction of large-scale utility plants adjusted per unit Australian labour costs were about four times greater than in the US as a result of both lower productivity and higher per unit labour costs. While a fall in the Australian dollar has, and will boost competitiveness, the long-term key to growing real wages is not a lower valued dollar, but a sustained increase in both labour and multi-factor productivity.
Productivity Growth
A key to productivity growth is to allow capital to be invested where it most productive such that capital and labour can shift across sectors without being kept in place supported by governments noting that tax concessions and budget outlays to Australian industry amounted to almost $10 billion in 2011-12. In addition to flexibility in the economy, other drivers of productivity growth are incentives (competition and the tax/transfer system) and capabilities (skills & management). By itself, skills and education may not be sufficient to raise productivity growth to the levels of the 1990s, but they are absolutely necessary to ensure higher long-term productivity growth. Without a highly-skilled and productive workforce, Australia will not be able to take full advantage of the so-called Asian Century and to capture the benefits of the expected rise in the demand for services in the Asia-Pacific region. Multiple improvements to long-term educational and workforce performance are required, including better management that comes with a flexible and competitive economy. But above all, improved teacher selection and training and pay must be a priority. Recruiting teachers who have some of the lowest entry scores to university,

providing them with little specialised subject matter knowledge and inadequate mentoring and support to learn how to teach has, and will, serve Australia poorly. Other ways to raise working population capabilities include: curricula that support the fundamentals of numeracy and literacy, high-quality and available vocational learning, life-long opportunities for retraining, and equitable and needs-based funding to ensure high-quality teaching across Australia in both government and non-government schools. The PC report on Government Services released in January 2014 indicates that Australia, at least in some states, does not have sufficient needs-based school funding. Building school gyms, or simply lowering entry or graduation standards at university, are not answers to Australia’s declining educational performance.
To support my concerns about educational performance, I highlight the Programme for International Student Assessment (PISA) scores. These regular cross-country comparisons indicate a worrying trend of reduced performance by Australia, especially for lower performing students as well as a decline in the proportion of students performing at the top performance level (see figure p. 10). Since 2009 Australia’s relative ranking has fallen from 9 to 14 in reading, 10 to 16 in science, and 15 to 19 in mathematics.

Source: Australian Council for Education Research. ‘PISA 2012: How Australia measures up,’ Data underlying figures in Chapter 2. http://www.acer.edu.au/ozpisa/statistical-tables-pisa-2012
The PISA relative performance measures are of concern because, in part, the size of Australia’s services sector accounts for about 80% of the economy’s value added, and 90% of employment, the growing importance of IT transformations for both low and high skilled employment within the services sector, and because Australia’s high-wage
0
5
10
15
20
25
30
35
40Ho
ng K
ong-
Chin
aKo
rea
Liec
hten
stei
nM
acao
-Chi
naJa
pan
Switz
erla
ndBe
lgiu
mN
ethe
rland
sG
erm
any
Pola
ndCa
nada
Finl
and
New
Zea
land
Aust
ralia
Aust
riaO
ECD
aver
age
Fran
ceCz
ech
Repu
blic
Luxe
mbo
urg
Icel
and
Slov
ak R
epub
licIre
land
Port
ugal
Denm
ark
Italy
Nor
way
Hung
ary
Uni
ted
Stat
esSw
eden
Spai
nLa
tvia
Russ
ian
Fede
ratio
nTu
rkey
Gre
ece
Thai
land
Mex
ico
Percentage Achieving Level 5 (High Level) Mathematics
2003 2012

economy makes it uncompetitive (exceptions include the resources sector) unless it can produce high-value and niche goods and services. I contend that the deficiency in Australia’s capital stocks is not so much in physical assets, but rather in its human capital. Indeed, I would argue (and contrary to many commentators) that with the exception of public transportation networks in its faster-growing cities, Australia does not have a deficiency of new infrastructure. At an annual average spend of 6% of GDP over the past four decades Australia has invested in infrastructure at a rate about 50% greater than its industrialised peers. Further, the enormous past and current private-sector investments in Australia’s resources and energy sectors on infrastructure, and also in the electricity and water utility sectors, attest that, when needed, infrastructure can and does get built by the private sector or with private/public sector partnerships. By contrast, the equally important need for Australia to invest wisely in training and education is not being met, at least as judged by our relative educational performance.
House Price Growth
I want to highlight risks in terms of asset price growth, especially in the housing sector. Australia is not alone in facing these risks, but it has had the most rapid growth in nominal house prices of all developed economies since 1997. This strong price growth is partly justified because Australia has also enjoyed one of the highest increases in real incomes within the OECD during the boom. Nevertheless, Australia ranks second in the world in terms of price to income ratio and the household debt to income ratio at about 150% is close to, but not yet at record levels. This is also true for house price to income ratios, but at current rates of price growth this ratio will reach an all-time high in 2014.
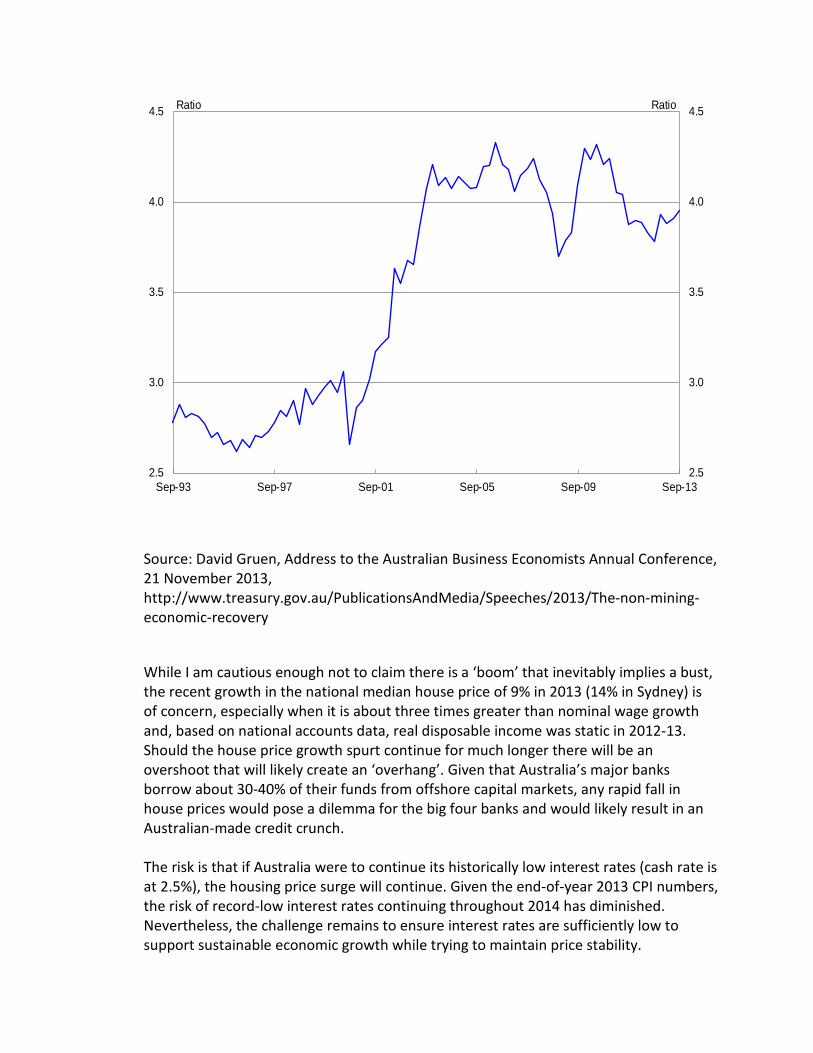
Source: David Gruen, Address to the Australian Business Economists Annual Conference, 21 November 2013, http://www.treasury.gov.au/PublicationsAndMedia/Speeches/2013/The-non-mining-economic-recovery
While I am cautious enough not to claim there is a ‘boom’ that inevitably implies a bust, the recent growth in the national median house price of 9% in 2013 (14% in Sydney) is of concern, especially when it is about three times greater than nominal wage growth and, based on national accounts data, real disposable income was static in 2012-13. Should the house price growth spurt continue for much longer there will be an overshoot that will likely create an ‘overhang’. Given that Australia’s major banks borrow about 30-40% of their funds from offshore capital markets, any rapid fall in house prices would pose a dilemma for the big four banks and would likely result in an Australian-made credit crunch. The risk is that if Australia were to continue its historically low interest rates (cash rate is at 2.5%), the housing price surge will continue. Given the end-of-year 2013 CPI numbers, the risk of record-low interest rates continuing throughout 2014 has diminished. Nevertheless, the challenge remains to ensure interest rates are sufficiently low to support sustainable economic growth while trying to maintain price stability.
2.5
3.0
3.5
4.0
4.5
2.5
3.0
3.5
4.0
4.5
Sep-93 Sep-97 Sep-01 Sep-05 Sep-09 Sep-13
RatioRatio

Successfully achieving all of these policy objectives simultaneously while avoiding a housing price boom, and in the midst of competitive devaluations from key trading partners, is a ‘big ask’ of any central bank.
Global Risks and Opportunities
Asset Prices
A great deal has been written about global imbalances and what to do about them, especially since the start of the GFC in 2008. All I intend to do is to highlight the very real and present dangers that have been identified by others and to stress that the GFC is not, and cannot be considered ‘over’, until the policy settings implemented over the past five and a half years return to ‘normal’.
First, let me examine what has happened to the price of equities over the past decade or so.
Sources: (1) All ords: ASX website, Market Statistics: http://www.asx.com.au/about/historical-market-statistics.htm; (2) DJ Industrial Index: http://www.djaverages.com/?go=industrial-index-data
On the basis of the Dow Jones Index it would seem that US and global equity investors are even more bullish than they were just before the dot com crash or before the GFC. For instance, the DJ index exceeded 16,000 in the third week of January 2014 which is

greater than its peak in October 2007 of 15,100 (before the GFC) and in January 2000 of 14,700 (before the dot com crash). While Australia’s all ordinaries index has not returned to its former peak, it has also been carried along with global sentiments.
I acknowledge that stock market indices are leading and not lagging indicators, but it is surprising to me given the immediate prospects for the Australian economy that investors in both equities (2013 annual return of 15% on ASX 200) and fixed assets (2013 median house price capital gain of 9%) are enjoying such stellar returns while the economy comes off from its glory days in 2011. While the confidence of investors, with luck, may prove to be correct I contend that the underlying risks, at least as of the end of January 2014, are grossly under-priced by the equity bulls.
Policy Levers
To an extent not fully appreciated by many investors, what happens to asset prices depends to a remarkable degree on the decisions of just a few decision makers who control key policy levers. This is the wisdom of the few rather than the wisdom of the crowds. For example, the US treasury yield curve and the exchange rate of US dollars for renminbi/yuan are not ‘made in the market’, but decided to a great measure in Washington DC, Beijing, Tokyo and Brussels.
Non-neutral monetary policy may be needed to maintain current asset prices that, if there were to fall sharply, could trigger another global economic downturn. That this risk is identified by the IMF, and others, as real indicates that the world economy is not built on solid foundations. Moreover, the ability of developed economies to respond to another crisis has greatly diminished because of the conversion of private debt to sovereign debts and fiscal stimulus as a direct result of the GFC.

Source: IMF 2011
While some important measures have been implemented since 2008 to reduce financial risks in the global banking sector, long-standing trade imbalances remain. Further, it is not all clear to me that the Basel rule changes since the GFC are sufficient to ensure the resilience of Banks that are too big (or too connected) to fail. If one accepts the liquidity model of booms and busts proposed by Irving Fischer, as I do, then it is credit and liquidity factors that are the most important cause of severe recessions (including the GFC).
The relevance of global liquidity to the global economy in 2014 is that, when credit is available and borrowing is relatively cheap, there is a reduction in risk aversion which is coincident with the point in time when riskier assets perform the best. Of course, when liquidity tightens there is a flight back to low risk and higher-quality assets. My point is simply that if the liquidity ‘tap’ stops, or even starts flowing at a slower rate, those countries dependant, in part, on international capital inflows for domestic loans and credit, such as Australia, will be squeezed.
Debt Levels
High levels of sovereign debt remain a key risk especially when financed by foreign investors and their investments are more liquid than domestic investments. High debt levels are typically associated with lower economic growth, impose hardships on the groups that have no or a weak political voice, and reduce economic resilience because high debt constrains the policy options to respond to negative external shocks.
While higher debt loads, all else equal, are undesirable, it is not just about the absolute level of debt, but whether the borrowing has been used to generate productive assets or simply used for consumption and/or spent or redundant assets that do not contribute to growth in productivity. The challenge for the world economy is to control further increases in already high-debt-to-GDP ratios in developed economies while simultaneously avoiding fiscal consolidation that may weaken already low rates of economic growth.
At present, it appears that the US is successfully managing both fiscal consolidation and increasing its growth rate, but this is not the case for several Eurozone countries locked into a ‘straight jacket’ of a fixed exchange rate. Indeed, in countries like Greece, fiscal austerity with a fixed exchange rate has undoubtedly contributed to further shrinkage of its economy and a rise in its debt-to-GDP ratio.
China
The risks of global trade imbalances arise when a few, large economies have big and on-going surpluses. While the decline in China’s current account surplus from 10% of GDP in 2007 to about 2% in 2012 diminishes risks, the overhang of recycling its surpluses may

fuel price spikes elsewhere given that about 60% of its reserves are already currently denominated in US government securities.
Rapid credit growth in China itself represents another global risk. Business and household debt levels have increased in proportional terms by 60% in the past six years and at 200% of GDP is larger than the debt level in Japan in the late 1980s or the US before the GFC. Fortunately, Chinese authorities are aware of the risks and since June 2013 have responded by changing the policy levers to constrain credit. Such rebalancing, and the reforms announced by the new leadership of President Xi Jinping and Premier Li Keqiang, should, over time, support greater levels of consumption and help China maintain sustainable growth rates, albeit at levels well below of the past two decades.
The challenge for Australia is that rebalancing of the Chinese economy to proportionally less investment and more consumption will impose costs on resource exporters. For instance, suppose there were to be a decline in the proportion that investment accounts for in China’s GDP from its current level of about 50% to, say 35%, by 2020. This would mean that growth in investment that has averaged about 17% since 2001 will need to drop by about half under current GDP growth targets.
Given that China has undertaken annual infrastructure investment equivalent to about 13% of GDP since the mid-1990s, its annual growth in expenditures in 2013 on transport was over 20% (annual growth was less than 5% in 2011) and the fact that it already has the highest proportional and actual spend on infrastructure in the world with an already sufficient infrastructure stock at 76% of GDP (the McKinsey ‘rule of thumb’ of sufficiency is 70%) it seems likely that its infrastructure spending will decline in proportional terms by 2020.
All else equal, reduced investment and infrastructure spending as a proportion of GDP will accelerate expected declines in the price of some of Australia’s most valuable exports: iron ore and metallurgical coal. Given that China now accounts for close to 40% of our merchandise trade, structural adjustments by China to proportionally higher levels of consumption and lower investment will also have an impact on Australian exports well beyond the decline in commodity prices. In other words, even a ‘soft landing’ for the Chinese economy, and which I expect, will impose hard adjustments on the Australian economy.
Trade
As an open economy, Australia’s income levels are based on trade. In the early history as a nation Australia overcome the ‘tyranny of distance’ to develop an export trade to Europe through both innovation and investment and the advantages of an abundant land resource. This allowed Australia to become globally competitive in primary industries first in wool, then meat, and now a range of crops. Today, Australia is advantaged by location as it is placed in the fastest growing part of the world, the Asia and the Pacific.

As a result of policies that over several decades has allowed migrants to come to Australia on the basis of their skills, rather than ethnicity or background, Australia now has a diverse and multi-cultural population with strong ties to Asia. Australia’s geographical proximity, its sizable Asian diaspora, and also long-standing diplomatic relationships to Asia provide Australia with export opportunities especially in tourism, education, financial services, technology services, and also agriculture. While important, the growth potential in any one of these sectors alone as China restructures will not, in the near to medium term, substitute for expected declines in commodity prices and investments in the resources and energy sector.
Source: ABS, 5206.0 Australian National Accounts: National Income, Expenditure and Product
The trade opportunities available to Australia can be enhanced by additional free trade agreements or with liberalising trade via the WTO provided such agreements provide greater market access to Australia’s agricultural and services sectors.
Boom or Bust?
0%
2%
4%
6%
8%
10%
12%
0%
2%
4%
6%
8%
10%
12%
Jan-
1975
Jan-
1977
Jan-
1979
Jan-
1981
Jan-
1983
Jan-
1985
Jan-
1987
Jan-
1989
Jan-
1991
Jan-
1993
Jan-
1995
Jan-
1997
Jan-
1999
Jan-
2001
Jan-
2003
Jan-
2005
Jan-
2007
Jan-
2009
Jan-
2011
Jan-
2013
Mining (% of GDP) Agriculture, forestry and fishing (% of GDP)
% of GDP

In conclusion I would like to offer some cautionary remarks about Australia’s economic future out to 2020:
1. To a great extent Australia is like a yacht in a gale, its policy makers can change its direction, but only within certain boundaries and only after carefully aligning the sails to take account of the direction and strength of the global winds.
2. It appears unlikely that the older generation of working Australians will again enjoy the size of the decade plus boom Australia has just experienced. Consequently, Australia must ‘trim it sails’ in terms of its policy levers to ensure government spending and revenues converge, not diverge, so that when conditions get worse governments can respond effectively to manage negative shocks.
3. Like a competitor in the Sydney-Hobart race, Australia must compare itself with its peers. This requires both ‘thinking ahead’ and ‘looking around’. This demands that Australia has a sailing plan, but one sufficiently responsive that if conditions and our competitors change, it can alter course. Thus, if our terms of trade are in decline and labour force participation is static, we must have a coherent and useful plan to increase productivity growth if we want to have rising per capita incomes. Such a plan must be pragmatic and be responsive to what works. It should not be based on unsupported assertions, but use empirical evidence and cross-country comparisons to support policy interventions.
4. Finally, Australia must navigate its way to avoid reefs ahead and be prepared should the gale become a storm. The recent history of what happened to the US and the global economy when regulators were ’asleep at the wheel’ should make Australia doubly vigilant to avoid its own home-made credit crunch and to take advantage now, when its economy is growing, to become a more competitive and resilient nation better able to respond to unexpected downturns.
5. Australia is not the sole master of its own destiny, but neither can it simply hope for the best or bet on its famed luck. Inaction, or the wrong sort of actions, will make Australia more vulnerable and greatly increase the chances of a ‘hard landing’ for its economy.