
Booklet VoltageClampTutorial r2€¦ · 2 A poration A poration 3 Most bodies are electrically...
20
VOLTAGE-CLAMP TUTORIAL by Antonio Guia, Ph.D
Transcript of Booklet VoltageClampTutorial r2€¦ · 2 A poration A poration 3 Most bodies are electrically...

VOLTAGE-CLAMP TUTORIAL
by Antonio Guia, Ph.D

1Aviva Biosciences Corporation
TABLE OF CONTENT
Psychology teaches that a healthy life is one which is well adapted and responds well to its environment. This is true as well for the biology of living organisms and for each cell making them up. Cells need to respond to their surroundings in order to know when to grow, eat, secrete, communicate, contract, etc. Although cellular responses may be modulated or initiated by macromolecules, much of the process of communication, secretion, contraction, are initiated, sustained, terminated, and in part controlled by the movement of ions across the plasmalemma.
Channels are present on the cell membrane in order to allow the passage of charged molecules and ions across the lipophilic cell membrane. These channels are for the most part quite specific in their permeability to the molecules. As such, there are channels specific for sodium, others for calcium, others for potassium, and so on. Each channel type plays a different role not only in the communication of the cell with other cells and with its surroundings, but also with the cellular functions.
The function of the heart in the body is to contract rhythmically. Control, coordination and regulation of contraction is tightly coupled to excitation of the cells. An understanding of excitation-contraction coupling in the heart allows us to focus interventions toward a specific remedy for a specific disease. It is therefore necessary to understand the methods by which we measure cardiac excitation and contraction. The focus of the lecture will be to describe the methods which we have available to measure cardiac excitation: the action potential and its ionic components. The foundations underlying electrophysiological measurements are based on some principles in electrochemistry.
PreamblePreamble . . . . . . . . . . . . . . . . . . . . . . . . . . . . . . . . . . . . . . . . . . . . . . . . . . . . . . . . . . . . . . . . . . . . 1
Part I: Electrochemistry . . . . . . . . . . . . . . . . . . . . . . . . . . . . . . . . . . . . . . . . . . . . . . . . . . 2 A. How electricity relates to ion movements . . . . . . . . . . . . . . . . . . . . . . 2
B. Electrical potentials . . . . . . . . . . . . . . . . . . . . . . . . . . . . . . . . . . . . . . . . . . . . . . . 3
C. Multiple ions . . . . . . . . . . . . . . . . . . . . . . . . . . . . . . . . . . . . . . . . . . . . . . . . . . . . . . 5
Part II: Voltage Clamp Methods . . . . . . . . . . . . . . . . . . . . . . . . . . . . . . . . . . . . . . . . . . . 7 A. Voltage Clamp . . . . . . . . . . . . . . . . . . . . . . . . . . . . . . . . . . . . . . . . . . . . . . . . . . . . 8
B. High resistance voltage measurements in whole tissues. . . . . . . . 9
C. Low resistance current clamp in single cells. . . . . . . . . . . . . . . . . . . . . 9
D. Low resistance voltage clamp in single cells . . . . . . . . . . . . . . . . . . . .11
E. Low resistance voltage clamp in cell membrane patches. . . . . . 13
Part III: Cardiac Electrophysiology . . . . . . . . . . . . . . . . . . . . . . . . . . . . . . . . . . 20 A. The Cardiac Action Potential . . . . . . . . . . . . . . . . . . . . . . . . . . . . . . . . . . 20
B. Currents in the action potential . . . . . . . . . . . . . . . . . . . . . . . . . . . . . . . .23
C. Gating of voltage-dependent channels in the cardiac action potential . . . . . . . . . . . . . . . . . . . . . . . . . . . . . . . . . . . . 25
Part IV: Potassium Channel Blockers as Antiarrhythmics . . . . . . . . . 28
A. Significance of antiarrhythmics . . . . . . . . . . . . . . . . . . . . . . . . . . . . . . . . . 27
B. Defining IK pharmacologically . . . . . . . . . . . . . . . . . . . . . . . . . . . . . . . . . 29

2 3Aviva Biosciences Corporation Aviva Biosciences Corporation
Most bodies are electrically neutral at steady state because it is the lowest electrochemical energy state (μ). Specifically, this is one of the three laws of thermodynamics. Energy input is required to move a body away from neutrality; this energy input is conserved, also by the laws of thermodynamics, as potential energy.
Electrical potential energy is measured in Volts (V) and represents the difference in the quantity of charge between two regions, regardless of whether the charges are moving or not. Keeping in mind that each ion contains a charge, this is further interpreted as the difference between ion concentrations in different regions.
With specific reference to a cell, the electrical potential describes the difference in ion concentrations between both sides of the membrane. It is important to note that while electrical potential may be expressed in absolute terms (Equation 2), where the voltage can be measured
only relative to some other point of reference (Δμ=μ1-μ2), hence relative to one another there is a measurable difference in potentials between two chambers, which in cellular terms is the potential difference across the membrane, more simply termed as the membrane potential (Em) expressed relative to the extracellular voltage.
To understand ion channels, some basic principles of electrochemistry must be understood. The central theory is Ohm’s law. All matter is made up of charged particles which are usually in equal numbers of opposite charges, hence most bodies are electrically neutral, meaning that a mole of NaCl dissolved in water becomes 6.02 × 10²³ positive charges, and the same number of negative charges (Avogadro’s constant for the number of particles in a mole of substance), still neutral.
Every charged particle, whether a cation or an anion, contains the same amount of charge per valence. This quantum is measured in Coulombs, with each charged particle having 1.6 × 10⁻¹⁹ Coulombs. The Faraday constant (F) describes the charge per valence (z) of a mole of cations or of anions: 9.648 × 10⁴ Coulombs per mole (n ). These charges in a solution balance out to give neutrality.
Selectively permeable membranes can exclude the passage of certain charges or ions. Whenever opposite electrical charges move independently of one another there is a net current (I), measured in Amperes where one Ampere is equal to the movement of one Coulomb of charge per second. Hence Equation 1 may be derived allowing us to directly quantify the net movement of charged particles according to a measured current. Since the valence does not change for a particular ion, the number of moles of an ion moving per second are directly proportional to the measured current.
(1)
(2) μ=μ°+RTlnX+zFE
A. How electricity relates to ion movements B. Electrical potentials
n / sec =z x I____
F
Part I: Electrochemistry

4 5Aviva Biosciences Corporation Aviva Biosciences Corporation
The Nernst equation (Equation 3) predicts the equilibrium potentials across membranes or between solutions. Namely, an equilibrium potential exists when ion X with a valence z is distributed in different concentrations into chamber 1 and chamber 2 (T is temperature in °C, and R is Rhyberg’s gas constant: 8.3144 J/mol K). In most textbooks all the constants are collected, the natural log is converted to a logarithmic value, and chambers 1 and 2 become intracellular (i) and extracellular (o) solutions, giving us Equation 4 where the constant K is a temperature-dependent term. The Nernst equation may be used to predict the equilibrium potentials for each ion (EX) that exists in the solutions at steady state.
Knowing the value of EX allows for the prediction of the driving forces for an ion to traverse the membrane. For example, if the equilibrium potential for ion X across a membrane is +100 mV at equilibrium, then the ion is distributed such that flux down its concentration gradient is opposed by the electrical repulsion on the other side of the membrane and attraction on its own side: a positive (+) charge is attracted to a negative (-) charge, but repelled from another positive charge). In such a situation, if an external electrical source forces Em to 0 mV, removing the electrical driving force which keeps the concentrations on both sides different, then the ions will flow down their concentration gradients across the membrane (producing a
Part I: Electrochemistry
(3) Ex =RT
ln[xs][xl]zxF
(4) Ex =K
log[xs][xl]zx
The same concentrations of two different ions with the same charge on opposite sides of a membrane, for example 100 mMK+ on one side and 100 mM Na+ on the other, must be considered separately since they are different chemical species.
In order to predict a membrane potential as a result of movement of ions of different species one more piece of information must be obtained: the conductance (g) of that ion across the membrane, measured in siemens (S). If the conductance of both species is exactly the same, then Em in our case becomes Em = EK + ENa, since both are equal in magnitude, but traveling in opposite directions they cancel out, leaving Em equal to 0 mV. Conversely, if the conductance is different for both, then the relative contributions of each ion to Em is proportional to their relative conductances according to the chord conductance formula (Equation 5) where gTotal is the sum of all the individual conductances (gx, gy, gz) for each ion.
B. Electrical potentials (con’t)
C. Multiple ions
°C K
0 54.20
20 58.17
25 59.16
37 61.54
measurable current) until the concentrations are equal on both sides. If, however a potential of +200 mV is applied from an external source, then the net flux of ions will be from the low concentration to the high concentration, being driven against its concentration gradient by the magnitude of the charges on the membrane. As a result, the movement of the ions would impart an opposite current, pushing the membrane potential down toward +100 mV, the equilibrium potential of that ion. The ionic current across the membrane will push Em toward the equilibrium potential of that ion. The maximum magnitude of a current of ion X is determined by the difference between Em and EX and is related the driving force. By convention, the equilibrium potential values are from inside the cell with respect to the outside of the cell. The voltage outside the cell is considered to be neutral.
6 7Aviva Biosciences Corporation Aviva Biosciences Corporation
C. Multiple ions (con’t)
Part I: Electrochemistry Part II: Voltage Clamp Methods
(5)
(6)
(7)
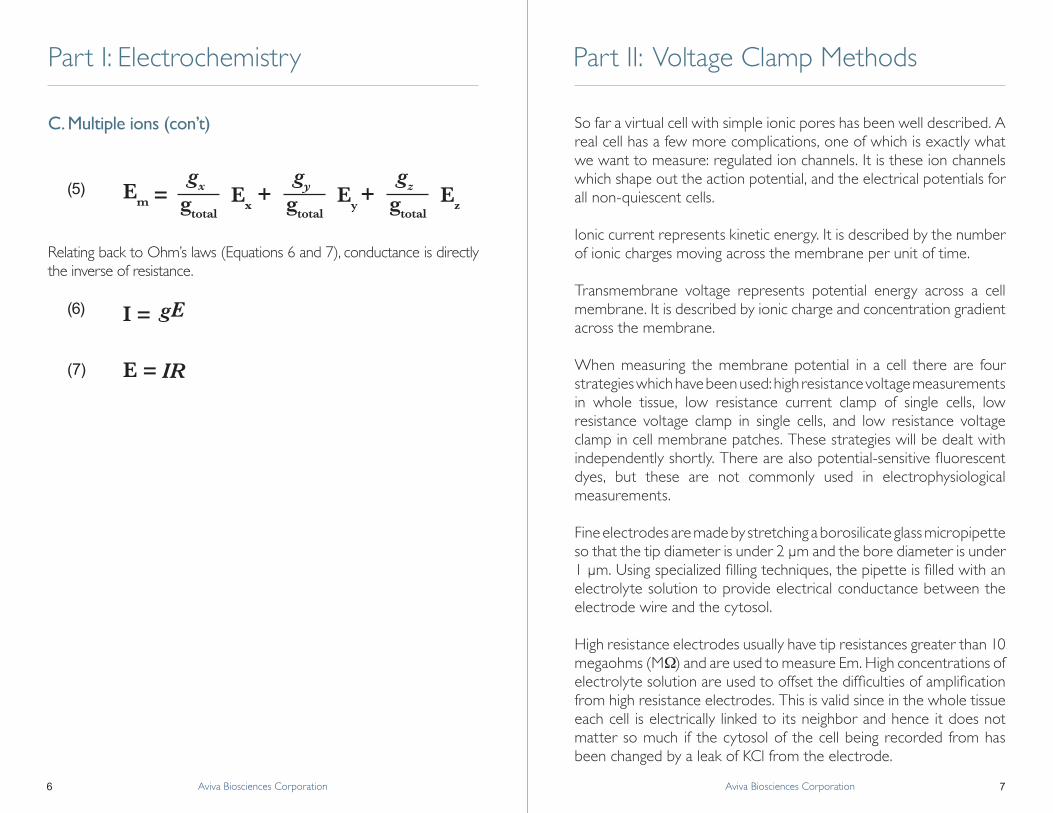
Em = + +gx gy gzEx Ey Ezgtotal gtotal gtotal
I =
E = IR
gE
Relating back to Ohm’s laws (Equations 6 and 7), conductance is directly the inverse of resistance.
So far a virtual cell with simple ionic pores has been well described. A real cell has a few more complications, one of which is exactly what we want to measure: regulated ion channels. It is these ion channels which shape out the action potential, and the electrical potentials for all non-quiescent cells.
Ionic current represents kinetic energy. It is described by the number of ionic charges moving across the membrane per unit of time.
Transmembrane voltage represents potential energy across a cell membrane. It is described by ionic charge and concentration gradient across the membrane.
When measuring the membrane potential in a cell there are four strategies which have been used: high resistance voltage measurements in whole tissue, low resistance current clamp of single cells, low resistance voltage clamp in single cells, and low resistance voltage clamp in cell membrane patches. These strategies will be dealt with independently shortly. There are also potential-sensitive fluorescent dyes, but these are not commonly used in electrophysiological measurements.
Fine electrodes are made by stretching a borosilicate glass micropipette so that the tip diameter is under 2 μm and the bore diameter is under 1 μm. Using specialized filling techniques, the pipette is filled with an electrolyte solution to provide electrical conductance between the electrode wire and the cytosol.
High resistance electrodes usually have tip resistances greater than 10 megaohms (MΩ) and are used to measure Em. High concentrations of electrolyte solution are used to offset the difficulties of amplification from high resistance electrodes. This is valid since in the whole tissue each cell is electrically linked to its neighbor and hence it does not matter so much if the cytosol of the cell being recorded from has been changed by a leak of KCl from the electrode.
8 9Aviva Biosciences Corporation Aviva Biosciences Corporation
Low resistance electrodes have tip resistances 3 to 10 MΩ, allowing sufficient current to pass through the tip so that they may be used to clamp current or voltage in single cells.
Clamp electrodes perform the functions of two electrodes: one to measure Em, and the other to inject current into the cells.The strategy of current clamp involves injecting a known quantity of current into the cell, and measuring the Em response. Voltage clamping involves measuring how much current must be injected into the cell in order to force Em to the desired value.
Voltage clamping a cell is accomplished by monitoring the voltage across a cell membrane while simultaneously injecting a metered amount of current to clamp the transmembrane voltage at a desired level. A voltage clamp amplifier performs the following tasks simultaneously and continuously:
1. Input a value from a PC describing the desired transmembrane voltage2. Read the real transmembrane voltage of a cell3. Add or remove electrons (‘inject current’) from the cell to deflect the voltage to the desired level4. Output back to the PC the amount of injected current
These types of preparations are relatively simple to set up and to understand. The procedure involves putting a high resistance tip into a single cell within a tissue. The filling solution of the tip is commonly a high concentration of electrolyte. During the measurements there is little mixing of the electrolyte with the cytosol due to the size of the tip, and any of the little mixing that does occur will not change the membrane potential measurements significantly since the cell is electrically connected to its neighboring cells via the intercalated disks.
The technique is similar to that using high resistance electrodes but with the following differences. The experiment clamps the currents across the membrane; therefore it cannot work on cells connected to each other by intercalated disks due to the amount of space which must be clamped. Hence, single cells are used.
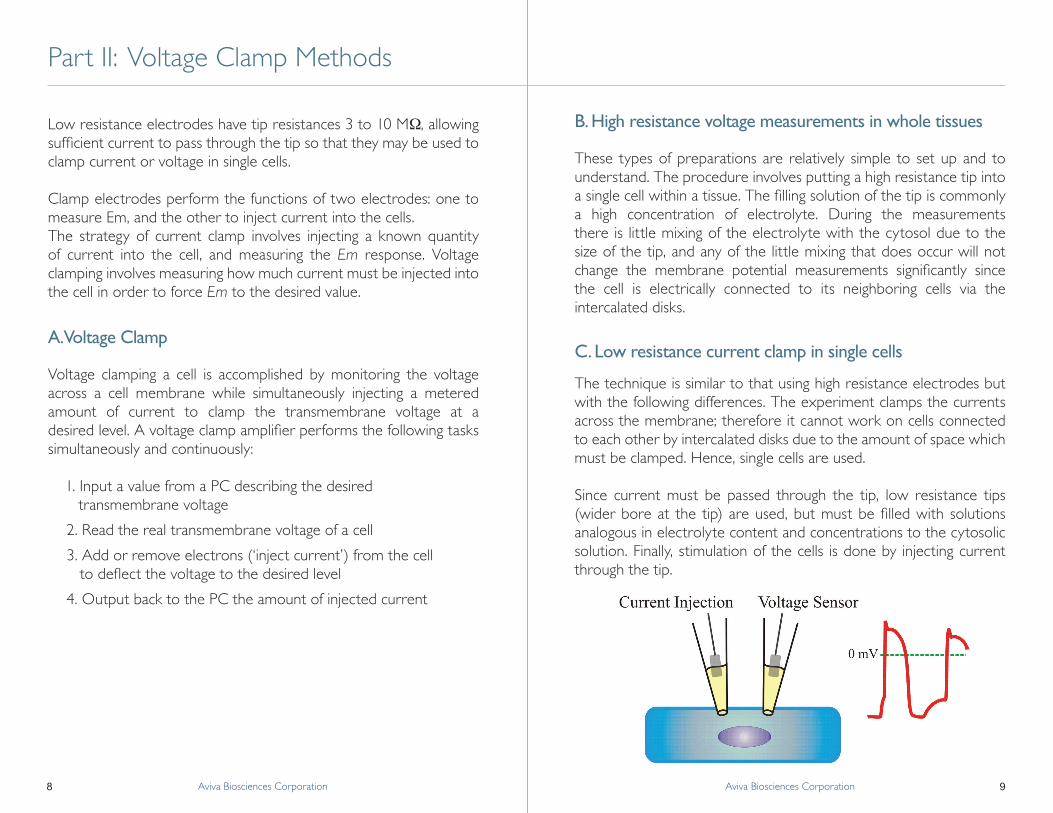
Since current must be passed through the tip, low resistance tips (wider bore at the tip) are used, but must be filled with solutions analogous in electrolyte content and concentrations to the cytosolic solution. Finally, stimulation of the cells is done by injecting current through the tip.
Part II: Voltage Clamp Methods
A. Voltage Clamp
B. High resistance voltage measurements in whole tissues
C. Low resistance current clamp in single cells

10 11Aviva Biosciences Corporation Aviva Biosciences Corporation
The electrode used in this technique may be viewed as two separate electrodes, or one switching quickly between its two separate functions. The first is for measuring the membrane voltage (voltage sensor), and the second for injecting current. The idea is that when no clamping current is applied to a cell, the membrane potential is dictated by the currents passing through the membrane. A positive current applied inside the cell represents the equivalent of positively charged ions moving into the cell across the membrane, adding more positive charges inside the cell and depolarizing the cell. Hence when a positive current is injected into the cell, the membrane is depolarized; in cardiac cells and neurons, if the membrane potential surpasses the threshold for excitation, then an action potential is elicited.
This technique provides an ideal system for measuring threshold potentials, and refractoriness to stimulation. Stimulus artifacts in this situation can be almost eliminated, and effects of drugs on the cells themselves in the absence of other cell types can be studied. Although this is not a very physiological situation, the results of these experiments do provide us with detailed information about the mechanisms of effect of drugs, and mechanisms involved in certain disease states.
In this technique, there is a feedback circuit between the voltage sensor and the current injector. This allows users to create a condition injected current increases if the membrane voltage decreases, and vice-versa, allowing for clamping of the membrane voltage by constantly readjusting the amount of current being injected so that membrane voltage remains constant at a desired value.
When the membrane voltage is clamped (not changing) then the net current (i.e.: sum of all currents) must equal zero. If current must be injected to clamp the voltage, this may be interpreted as the cell membrane itself applying a current equal in magnitude, but opposite in direction (so that the net current equals zero) to the current that is applied. Hence if one applies a negative current to clamp a cell to a voltage, then the cell has a positive current at that voltage, meaning positively charged ions moving into the cell. The current applied is thus measured, hence a negative current represents an inward membrane current, and vice versa. Note that an inward current could just as easily be carried by a positive ion moving into the cell as it could by a negative ion moving out of the cell. Likewise, if no current is applied to maintain the cell voltage constant, then no current is flowing across the membrane.
Part II: Voltage Clamp Methods
C. Low resistance current clamp in single cells (con’t) D. Low resistance voltage clamp in single cells

12 13Aviva Biosciences Corporation Aviva Biosciences Corporation
Voltage clamp measurements allow for the study not only the voltage-gated membrane ion channels, but also receptor-operated channels which have a measurable current of ions flowing through them that changes in either the presence or absence of the ligand.
Typical experimental protocols involve clamping the membrane potential at a reference potential (holding potential) then stepping the voltage to a test potential. Normally the holding potential is somewhere around RMP for studying slow time-dependent channels, or for studying low threshold channels, and around -40 mV for studying high threshold channels. The more negative holding potentials allow the cells to relax faster after a depolarizing step which causes cellular contraction.
Patch clamping a membrane patch is also referred to as single-channel studies. The advantage of this technique is that one can study drug effects on the specific channels of interest by adding the drug to the pipette filling solution, or, if second messenger effects are being studied, to the bathing solution, and measure the changes to the channels induced by the drugs. The difficulty with this technique is that the voltage dependence of the channels is hardly ever known if another electrode is not used to voltage clamp the cell in whole-cell configuration.
Em is not accurately known because the intracellular voltage is not being measured. We estimate that Em is around -75 to -80mV in a healthy, quiescent cardiac cell and voltage-clamp the patch accordingly. In order to depolarize a cell-attached patch to 0mV one must impose -80 mV in the patch since it is the voltage difference across the membrane which determines Em. Although this may cause depolarizing ion movements across the membrane, the cell does not depolarize since the inside of the patch remains at -80 mV and it’s only the outside that changes (the outside being that portion which is inside the tip).
The image shows the expected results if a step protocol was performed on a membrane with only time- and voltage-independent potassium channels (EK ≈ -80mV). The membrane current is negative at voltages negative to its equilibrium potential, meaning potassium is being attracted into the cell by the negative potential, and is positive at potentials positive to its equilibrium potential.
The reversal potential of any channel will be equal to the sum of the equilibrium potentials of the ions flowing through that channel, hence the permeability of the channel to the different ions is also measurable. Permeability (P) is usually presented as a ratio of permeabilities between two ions (PK/PNa).
Part II: Voltage Clamp Methods
D. Low resistance voltage clamp in single cells (con’t) E. Low resistance voltage clamp in cell membrane patches

14 15Aviva Biosciences Corporation Aviva Biosciences Corporation
This technique uses the same theory as that of whole-cell voltage clamp. All other techniques involve gaining access to the cytosol in an intact cell and measuring the transmembrane voltage. This technique differs from whole cell voltage clamp in that only a small patch of membrane is voltage-clamped. There are three different configurations possible with this technique:
• cell-attached • inside-out (or outside-in), • outside-out (or inside-in)
Cell-attached patch clamp involves placing the electrode tip on the membrane of the cell to form a high resistance seal between the walls of the tip and the membrane. This allows one to measure only the activity of channels incorporated in the membrane trapped on the tip of the electrode.
Since this patch of membrane is small, there are few channels in the patch of membrane being clamped. Furthermore, because the pipette filling solution is optimized so as to exclude movement of certain ions and enhance movement of others, one can use this technique to measure the activity of a single channel.
The effects of second messengers acting on the inner face of the channels can be measured using a cell-excised patch. By pulling the tip up off the cell after a seal has been formed, the patch can be excised in the same configuration in which the seal was formed, that being the inside-out (or outside-in) patch, where the outside facet of the membrane is inside the tip, and the inside facet is outside.
This configuration offers the advantage of knowing the voltage of both sides of the membrane: 0mV in the bath (ground electrode) and clamped voltage inside the tip.
With expensive drugs this is also a good technique for assessing drug effects on the outside facet of the membrane. In this case the drug is added to the pipette solution and channel activity is monitored as soon as a seal is formed and followed during the diffusion of the drug down the tip and to the membrane. Since the tip is small, only small amounts of solution are required, hence less drug is consumed for testing.
E. Low resistance voltage clamp in cell membrane patches (con’t)
Part II: Voltage Clamp Methods

16 17Aviva Biosciences Corporation Aviva Biosciences Corporation
E. Low resistance voltage clamp in cell membrane patches (con’t)
Part II: Voltage Clamp Methods
The outside-out (or inside-in) excised patch configuration is achieved by breaking the seal and gaining access to the cytosol. After access is gained, the electrode is slowly lifted away from the cell, stretching the membrane. As the membrane stretches, it breaks away leaving a portion on the tip. The cell membrane reseals itself, as does the membrane patch on the tip. The patch on the tip now has the outside membrane facet on the outside of the tip, and the inside facet on the inside of the tip.
In this configuration, in order to impose -80mV across the membrane, one would clamp the tip at -80mV since it is the inside of the membrane which is being clamped. This technique is ideal when the drug effect occurs on the outside facet of the membrane as for example, tetrodotoxin which binds to the outside opening of sodium channels.
In a typical patch clamp trace, different current levels are attained in square waves over time. Since this reflects the current required to clamp the membrane at a particular voltage, each current level reflects a different amount of ion movement across the membrane. It is known from single-channel studies that channels exist in discrete states: open or closed. If we know the ion moving and the direction in which it is moving while in the open state, we can define which if the current levels represents ion movement, and which do not (ie: which current levels represent open states and which level represents the closed state of a channel).
With this information, we can tally up the amount of time that a channel dwells at each state, closed or open, before the next transition or the total proportion of time that the channel spends at each state. After tallying up the open time and the closed time we can calculate the probability of opening (Po) or probability of closing (Pc) for that channel at that voltage level. This information can be plotted in a graph showing the current amplitude and the probability of finding the channel at that amplitude.
18 19Aviva Biosciences Corporation Aviva Biosciences Corporation
E. Low resistance voltage clamp in cell membrane patches (con’t)
Part II: Voltage Clamp Methods
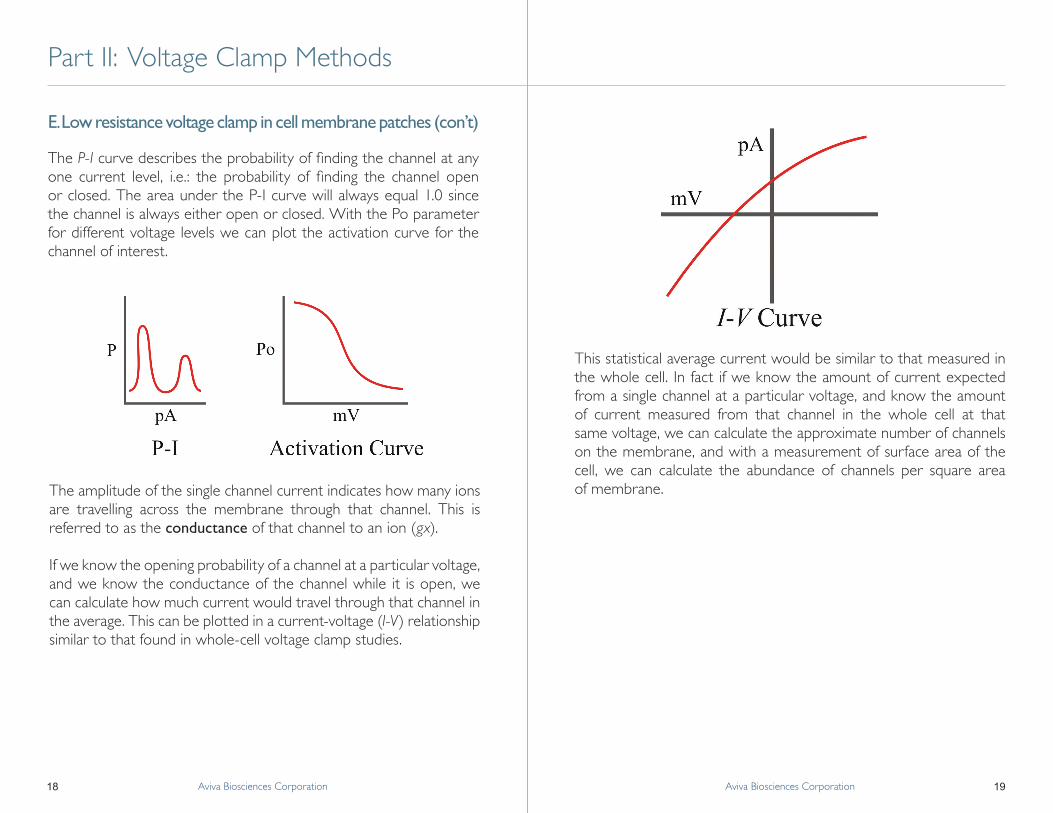
The P-I curve describes the probability of finding the channel at any one current level, i.e.: the probability of finding the channel open or closed. The area under the P-I curve will always equal 1.0 since the channel is always either open or closed. With the Po parameter for different voltage levels we can plot the activation curve for the channel of interest.
The amplitude of the single channel current indicates how many ions are travelling across the membrane through that channel. This is referred to as the conductance of that channel to an ion (gx).
If we know the opening probability of a channel at a particular voltage, and we know the conductance of the channel while it is open, we can calculate how much current would travel through that channel in the average. This can be plotted in a current-voltage (I-V) relationship similar to that found in whole-cell voltage clamp studies.
This statistical average current would be similar to that measured in the whole cell. In fact if we know the amount of current expected from a single channel at a particular voltage, and know the amount of current measured from that channel in the whole cell at that same voltage, we can calculate the approximate number of channels on the membrane, and with a measurement of surface area of the cell, we can calculate the abundance of channels per square area of membrane.

20 21Aviva Biosciences Corporation Aviva Biosciences Corporation
A. The Cardiac Action Potential
Part III: Cardiac Electrophysiology
With the electrode inserted into a cardiac cell within the tissue it is possible to measure any electrical events, of which the action potential is the most important. In a whole heart there are generator potentials (at the nodes) which can stimulate the entire heart tissue, but isolated trabeculae require electrical stimulation. Stimulation is accomplished with two metal electrodes placed so as to provide an electrical field passing through a portion of the tissue at some locus away from the site of measurement to minimize any electrical stimulus artifacts in the measurements.
The action potential (AP) is made up of five phases:
Phase 0 is the upstroke of the AP. The rate of upstroke, the rate at which the voltage changes during Phase 0, is proportional to conduction velocity, the rate of travel of the electrical stimulus within the tissue (from cell to cell, and along the cell membrane). An area of tissue where there is a decreased rate of upstroke will have slowed conduction velocity, and hence be a potential site for reentrant arrhythmias. The peak of the AP is the maximum voltage of the AP, typically reaching +20mV to +35mV. Since this value is greater than 0mV, it is also called the overshoot.
Phase 1 is the notch after the peak of the AP. In some tissues the notch is barely noticeable (e.g., guinea pig ventricle) whereas in others it is prominent (e.g., canine ventricle). The notch has been shown to be deeper in epicardial cells than in endocardial cells.
Phase 2 is the plateau of the AP where most of the calcium enters into the cells, causing calcium-induced calcium release from the sarcoplasmic reticulum, resulting in contraction. The end of Phase 2 is mixed with the beginning of Phase 3, the repolarization phase.
Phase 3 terminates the action potential at the tail of the action potential, which normally initiates the relaxation of the mechanical twitch.
Phase 4 is the diastolic membrane potential between action potentials, representing the resting membrane potential (RMP), and typically being between -70mV and -80mV.
Cardiac electrophysiology allows us to know what happens in disease states, and allows us to measure the effects of various drugs on the action potential, which ultimately translates to contraction. Various parameters are measured and reported in the literature.RMP, rate of upstroke, peak (overshoot), and APD are measured directly. The elapsed time from the start of the action potential required to attain 50% repolarization (usually near the middle of Phase 3) in milliseconds

22 23Aviva Biosciences Corporation Aviva Biosciences Corporation
is referred to as the T50 or APD50, whereas that for 90% (usually near the end of Phase 3) is T90 or APD90, and so on. Two time-points are usually used to represent the time required until the approximate end of Phase 2 (APD25) and until the approximate end of Phase 3 (APD95).
Although rarely reported, the threshold of excitation is the potential energy required to deflect the membrane potential sufficiently to initiate an action potential. Since tissues are usually excited by field stimulation, quite often the threshold of excitation is reported as the number of volts injected into the electrical field instead of the number of milivolts of membrane potential.
Refractoriness is the measure of responsiveness of the tissue to a second stimulus applied during, or after an action potential. A cell which is absolutely refractory to further stimulation has a threshold of excitation higher than the overshoot due to inactivation of the ionic channels on the membrane. Partial refractoriness is due to incomplete inactivation (or partial resetting) of some of these ionic channels.
Chronotropy is also measured in tissues containing active nodes (S-A node). It is a measure usually related to the contractions of the heart and is measured in number of beats per minute, or AP’s per minute.
As has been indicated throughout this discussion, ions moving across a biological membrane carry a current. A positive ionic current (negative applied current to oppose it of course) means positive charges moving into the cell, and vice-versa. A positive current will deflect Em in a positive direction, hence depolarize the cell, and a negative current will repolarize the cell.
The upstroke of the action potential is caused by a fast, short-lived inward movement of sodium (Na+) ions through Na+ channels ( INa). The notch is caused by a rapidly-activating and inactivating transient outward potassium (K+) current (ITO), the plateau by calcium (Ca2+) currents (ICa), and repolarization by two otherK+ currents (IK and IK1). Resting membrane potential is maintained by IK1.
A. The Cardiac Action Potential (con’t) B. Currents in the action potential
Part III: Cardiac Electrophysiology
24 25Aviva Biosciences Corporation Aviva Biosciences Corporation
B. Currents in the action potential (con’t) C. Gating of voltage-dependent channels in the cardiac action potential
Part III: Cardiac Electrophysiology
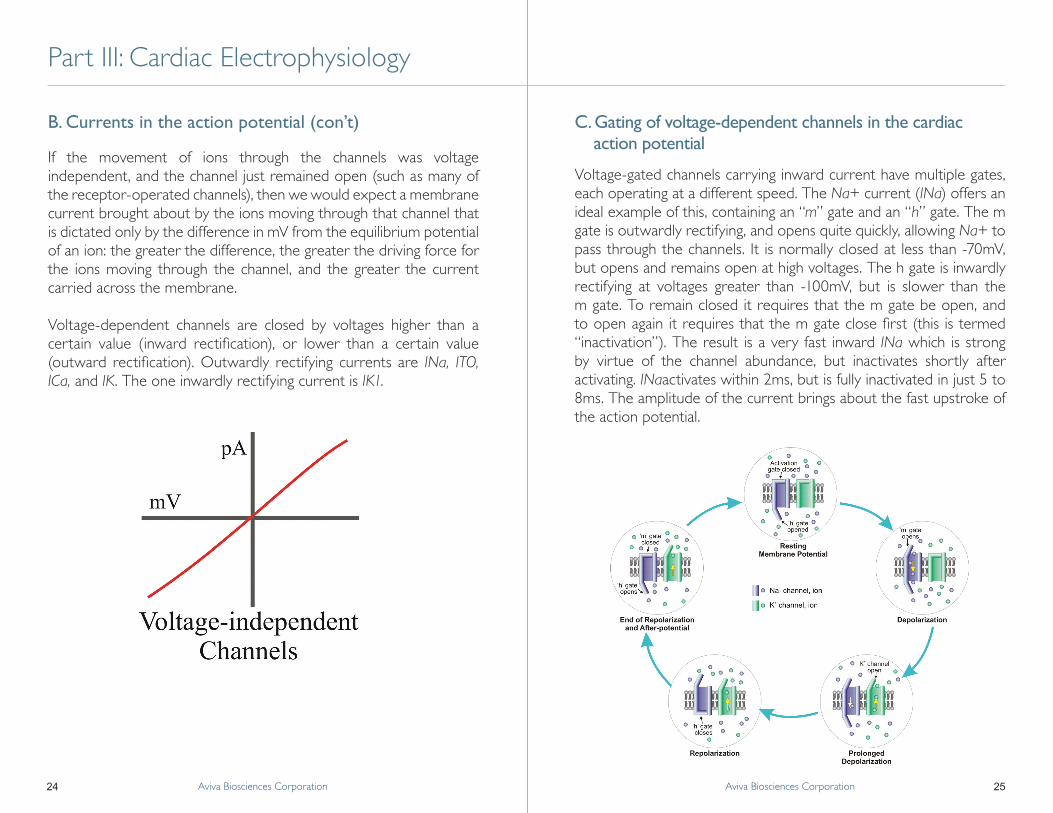
If the movement of ions through the channels was voltage independent, and the channel just remained open (such as many of the receptor-operated channels), then we would expect a membrane current brought about by the ions moving through that channel that is dictated only by the difference in mV from the equilibrium potential of an ion: the greater the difference, the greater the driving force for the ions moving through the channel, and the greater the current carried across the membrane.
Voltage-dependent channels are closed by voltages higher than a certain value (inward rectification), or lower than a certain value (outward rectification). Outwardly rectifying currents are INa, ITO, ICa, and IK. The one inwardly rectifying current is IK1.
Voltage-gated channels carrying inward current have multiple gates, each operating at a different speed. The Na+ current (INa) offers an ideal example of this, containing an “m” gate and an “h” gate. The m gate is outwardly rectifying, and opens quite quickly, allowing Na+ to pass through the channels. It is normally closed at less than -70mV, but opens and remains open at high voltages. The h gate is inwardly rectifying at voltages greater than -100mV, but is slower than the m gate. To remain closed it requires that the m gate be open, and to open again it requires that the m gate close first (this is termed “inactivation”). The result is a very fast inward INa which is strong by virtue of the channel abundance, but inactivates shortly after activating. INaactivates within 2ms, but is fully inactivated in just 5 to 8ms. The amplitude of the current brings about the fast upstroke of the action potential.

26 27Aviva Biosciences Corporation Aviva Biosciences Corporation
C. Gating of voltage-dependent channels in the cardiac action potential (con’t)
A. Significance of antiarrhythmics
Part III: Cardiac Electrophysiology Part IV: Potassium Channel Blockers as Antiarrhythmics
Similarly, ITO brings about a quick but small repolarization of the membrane during the notch of the action potential. It activates within 10 ms and inactivates after about 80 to 100ms, but since these channels are not as abundant, the current is not as strong, hence the rate of repolarization is slower. ICaturns on within 20 to 50ms, and becomes partially inactivated after 120 to 160ms. In fact, the rate of repolarization seen during the notch of the AP is partly due to the turning off of INa, partly due to the turning on of ITO, and partly due to the turning on of ICa. Toward the middle of the plateau phase of the AP the voltage deflects downward. This happens at the point where IK becomes stronger than ICa. IK activates very slowly in about 250 to 400ms, but is strong enough after only about 100ms that it will start repolarizing the membrane. The strength of the current and the fact that it does not inactivate provide a safety margin to insure repolarization of the membrane. All three of these channels (ICa, IK, and ITO) are outwardly rectifying, but only IK is called the outward rectifier channels since there are more potassium currents. These three channels are also high threshold, opening only at greater than -40mV. The biggest relevance of this is that IK turns off at voltages below -40mV; hence it cannot fully repolarize the membrane to the RMP of -80mV.
IK1 is the inwardly rectifying current. It turns off at greater than -30mV and is not time-dependent, hence it’s time for full activation is so fast that we cannot measure it reliably. The relative strength of IK1 and INa together determine the threshold voltage for an AP. A small deflection of membrane voltage may not open enough sodium channels to oppose IK1, whereas a larger deflection will open enough sodium channels so that INa is larger than IK1, which will initiate an AP. After the AP, IK will only repolarize the membrane to -40mV, but since IK1 has relatively time-independent kinetics, it will immediately take over in the outward current bringing the membrane potential back to RMP.
Bradycardia is usually treated with beta agonists which increase ICa and reduce action potential duration (APD). Tachycardia is usually of more concern since it may result in sudden death. Two approaches to relieving tachycardia include increasing refractory period or decreasing heart rate. A decreased heart rate will result in a longer APD and/or an increase in refractory period. Drugs such as digoxin stimulate cholinergic stimulation of the nodes, slowing conduction through the atrio-ventricular (AV) node, hence increasing the degree of hidden stimulation through the AV node, and producing negative chronotropy in the sino-atrial (SA) node by increasing a K+ conductance during Phase 4 of the action potential in the SA node. Although these drugs may produce relief from mild, easily controlled tachycardias, it is not favored for more difficult to control tachycardias. In fact, these drugs have not significantly increased the chances of patient survival after cardiac ischemic events.
Type I antiarrhythmics block INa, reducing the rate of upstroke of the action potential. This results in a slight prolongation of the action potential and a significant decrease in conduction velocity. The slowed conduction velocity may unmask potential re-entrant sites and produce further tachycardia. In the event that such a tachycardia is produced by type I agents there is as well the added danger of increased threshold potential to elicit n action potential: an effective methods for removing acute tachycardia is cardioversion, but the presence of type I antiarrhythmics such as flecainide or procainamide make it difficult to stimulate the tissue, therefore requiring much higher defibrillation voltages applied to the chest.
Type II antiarrhythmics block beta-adrenergic stimulation and thereby reduce the chronotropic rate. The beta blockers act as are negative inotropic agents by reducing ICa. While this may be an advantage

28 29Aviva Biosciences Corporation Aviva Biosciences Corporation
A. Significance of antiarrhythmics (con’t) B. Defining IK pharmacologically
Part IV: Potassium Channel Blockers as Antiarrhythmics
in congestive heart failure where a reduction in cardiac work will reduce oxygen requirements and improve the health of the heart, the negative inotropy will not improve tachycardia.
Type III antiarrhythmics block K+ channels. This requires a subdivision into what type of K+ channels. A blockade of ITO will produce an increased membrane voltage during the plateau phase, which will also increase the outward rectifier current (aka: delayed rectifier IK) and end the action potential earlier. This will be of no advantage to increasing the refractory period. While a blockade of the inward rectifier (i.e., IK1) will prolong the action potential in the -30 t -80 mV range, it will also weaken the repolarizing current and increase the chances of developing torsade des pointes type of arrhythmias (i.e.: early after-depolarizations). Further, IK1 maintains resting membrane potential; blocking this current will a) produce a slightly depolarized RMP and subsequently will reduce the number of Na+ channels available for opening during the upstroke of the action potential, and b) slow the rate of conduction, potentially causing re-entrant arrhythmias.
Blockers of delayed outward rectifier currents have shown 50% to 60% efficacy in preventing ischemia-related ventricular fibrillation. This is significantly better than placebo, whereas flecainide is no better than placebo. Since IK initiates the repolarization phase and is most active during Phase 3 of the action potential, it does not affect channels. Inhibition of IK results in a prolongation of the action potential, and therefore an increase in the refractory period.
Three compounds served to illustrate first the existence of two components to the outward rectifier potassium current, and next to show the efficacy of the use of IK inhibitors. Sotalol, a beta adrenergic receptor blocker, was shown to be effective in reducing tachycardia due to its inability to block IK. Since sotalol’s effects are not specific, many derivatives have since been developed and tested as potential antiarrhythmics compounds.
The compound E-4031 is a very specific blocker of IK in cardiac cells while it possesss no beta receptor blocking activity. This compound was first used as a pharmacological tool to prove the existence of two distinct channels contributing to IK.
E-4031 prolongs the action potential by a partial block of IK as seen during a voltage clamped step from -40mV to +10mV, then back to -40mV (Sanguinetti & Jurkiewicz, 1990). IK is slow to activate, but it is also slow to deactivate, hence after the voltage is returned to the holding potential of -40 mV, IK still produces a measurable current which slowly decays until the channels are closed. The current remaining after the voltage clamp step is called the tail current. In

30 31Aviva Biosciences Corporation Aviva Biosciences Corporation
B. Defining IK pharmacologically (con’t)
Part IV: Potassium Channel Blockers as Antiarrhythmics
this study, all K+ currents were blocked in the presence of a Ca2+ channel blocker.
When the current in the presence of a drug is substracted from the control (i.e.: drug-free) current, one is left with the drug-sensitive current. Sanguinetti & Jurkiewicz used voltage steps to different levels and found the difference currents, or drug-sensitive currents, for each voltage step. At each voltage step, the K+ are slowly activated; then, when the voltage is returned to the holding potential, the channels are slowly deactivated. At the very start of the deactivation process, all of the channels that were activated during the step will still be activated, imparting a larger current. A little time later, some of the channels will have inactivated, imparting a smaller current such that the current decays exponentially with time, a phenomenon which gives the tail current its characteristic shape. At the end of the voltage step, the current reflects the activity of the channels, plus the driving force of the voltage difference across the membrane. The advantage of measuring the tail current of time-dependent channels is that it indicates the activity of the channels at a constant driving force as it was at the end of the step potential. An ‘envelope of tails test’ is a protocol whereby the resulting tail currents is measured after different voltage steps.
Sanguinetti & Jurkiewicz measured the current at the end of the step potentials (time-dependent current), and the envelope of tails (tail current) before and after the application of E-4031, as well as the difference currents. They defined IK as made up of two components: IKr and IKs. IKr has comparatively more rapid activation time, hence the ‘r’ means ‘rapid’. It predominates in the voltage range of -20 to +20mV, and becomes inhibited at voltages greater than +30mV. This inhibition does not deactivate or inactivate the channels since the inhibition is removed upon repolarization such that an envelope of
tails test will still show a measureable current at higher voltages. This current was also called the drug-sensitive current. IKs has not been shown to be drug-sensitive. It has comparatively slow inactivation time, hence ‘s’ means ‘slow’. It is not inhibited by higher voltages. Although it is slow to activate, the maximum steady-steate current through IKs is about 11 times stronger than that through IKr. Since it is slow to activate, IKs plays an important role in early Phase 3 of the action potential, and more likely the overall current carried by IK during the action potential is an even split between IKr and IKs. Neither IKr nor IKs show any time-dependent inactivation. It is evident from this data that IKr would have an earlier effect during Phase 3 of the action potential, and that IKs would be more prominent during a prolonged action potential.
Since sotalol has been beneficial in preventing re-entrant tachycardias, the effects of E-4031 and sotalol were compared and found to both act on IKr. Dofetilide has also been shown to block IKr. With an IC 50 of 5-50nM, dofetilide (UK-68,798) is 500-2,000 times more potent an inhibitor of IKr than either E-4031 or d-sotalol. In vitro studies using dofetilide have shown that it does not slow the upstroke of the action potential; hence it does not affect INa. Further evidence that Na+ channels are unaffected lies in an unchanged action potential amplitude: the amplitude is dependent on the upstroke of the action potential, which is dictated by INa. It does not affect RMP, hence IK1 is also unaffected by dofetilide. The lack of effect on IK1 was also observed in voltage-clamp experiments where the holding potential of -40mV elicited an outward current due to dofetilide-insensitive IK1. More specifically, T50 (or APD 50) is most affected by dofetilide since the ratio of APD50:APD90 remains about the same. The effective refractory period is merely a slave to the increase in APD.
The increased APD is very apparent. Since dofetilide affects only IKr and not IKs, maximal prolongation is possible with its use. This further illustrates the fact that IKs is so much more potent than IKr

32 33Aviva Biosciences Corporation Aviva Biosciences Corporation
when given enough time to activate more fully. There are different effects on ventricular myocytes and on Purkinje fibers, with the prolongation being more pronounced in Purkinje fibers. The only reason for this is likely related to the length of the action potential. In fact, the shorter the APD, the less the effect of dofetilide to prolong the action potential. Since an increase in heart rate will shorten APD, this is called ‘negative rate dependency’.
The negative rate dependence of dofetilide’s effects has been confirmed in vitro. However, studies of in vitro frequency dependence must be interpreted with caution. Since the effect of the drug is measured in a tissue made to contract rhythmically at steady state but at different frequencies, then the effects being measured are those only at steady state. In order to prevent tachycardias, a compound must interfere with the initiation of a re-entrant action potential. This means that the drug must increase effective refractory period during the normal cardiac rhythm. Hence, although negative frequency dependence is not a desirable quality in a drug, the ideal test is one of actual relevance, such as in the case of ventricular tachycardia. Research has shown that, in spite of dofetilide expressing negative rate dependence, it is nevertheless effective in reducing the incidence of sustained ventricular tachycardias in dogs with induced ischemic injury of the nature seen after myocardial infarction.
Rat action potentials are less dependent on IK, but repolarize primarily using ITO. At the end of the action potential, IK1 should carry the predominant current, hence explaining the fast repolarization at the end of Phase 3. Rat action potentials do not have such a fast repolarization due to the very high activity of Na+-Ca 2+ exchanges producing an inward current at the more negative potentials. Since dofetilide was shown not to affect the rat action potential, it is inferred
that dofetilide does not affect ITO or the Na+-Ca 2+ exchangers. Furthermore, voltage clamp data was obtained in the absence of Ca2+ channel antagonists also demonstrated that dofetilide does not affect ICa. In vivo studies have shown that dofetilide does reduce the initiation of ventricular tachycardias, and reduces conduction velocity in cardiac myocytes. The net result of the addition of dofetilide in vivo on ECG parameters can be summarized as follows: only heart rate and QT interval were significantly affected. The PQ interval is dependent on the conduction velocity through the AV node. The QRS interval is dependent on the rate of upstroke of the action potential. Since these two were unaffected, then conduction velocity in Na +-dependent and Ca2+-dependent pathways are unaffected by dofetilide.
B. Defining IK pharmacologically (con’t)
Part IV: Potassium Channel Blockers as Antiarrhythmics

34 35Aviva Biosciences Corporation Aviva Biosciences Corporation
Notes

Aviva Biosciences Corporation6330 Nancy Ridge Dr., Suite 103, San Diego, CA 92121
(858) 552-0888 | www.avivabio.com


![Type of dual superconductivity for the SU 2 Yang–Mills theory · [19,20] of the lattice Yang–Mills theory by decomposing the gauge field Ux,μ into Vx,μ and Xx,μ, Ux,μ = Xx,μVx,μ,](https://static.fdocuments.us/doc/165x107/5f6e0973d5ede40ac408ebfa/type-of-dual-superconductivity-for-the-su-2-yangamills-theory-1920-of-the-lattice.jpg)
