Book of Proceedings 5th International Conference · Book of Proceedings 5th ICSD 2017 iii...
148
Book of Proceedings 5 th International Conference On Sustainable Development ICSD 2017, Rome, Italy
Transcript of Book of Proceedings 5th International Conference · Book of Proceedings 5th ICSD 2017 iii...

Book of Proceedings
5th International Conference
On
Sustainable Development
ICSD 2017, Rome, Italy

ii Book of Proceedings 5th ICSD 2017
Book Proceedings of the 5th International Conference On Sustainable Development
5th ICSD 6-7 September 2017, Rome, Italy Editing: Pierangelo Magnini Scientific Coordinator: Gihan Diab Editorial Coordinator: Cesare Anselmi Editorial Managing: Diamantina Allushaj
ISBN 979-12-200-2126-5
Publisher: European Center of Sustainable Development
© 2017 by ECSDEV All rights reserved. This work may not be translated or copied in whole or in part without the written permission of the publisher (ECSDEV, Via dei Fiori, 34, 00172 Rome, Italy), except for brief excerpts in connection with reviews or scholarly analysis. Use in connection with any form of information storage and retrieval, electronic adaptation, computer software, or by similar or dissimilar methodology now know or hereafter developed is forbidden. The use in this publication of trade names, trademarks, service marks and similar terms, even if they are not identified as such, is not to be taken as an expression of opinion as to whether or not they are subject to proprietary rights.
Printed by Gruppo Atena.net Srl Via del Lavoro, 22, 36040, Grisignano VI, Italy Tel: 0039/0444613696 Web: http://www.atena.net

Book of Proceedings 5th ICSD 2017 iii
IInnttrroodduuccttiioonn The 5th ICSD 2017 is organized by the European Center of Sustainable Development, at the Roma Eventi- Fontana di Trevi, Piazza della Pilotta, 4 Rome, Italy from: Wednesday 6 to Thursday 7 September, 2017
5th ICSD2017 will be an excellent opportunity to present your projects and discuss the latest results in the field of Sustainability Science. The general aim of the conference is to promote international collaboration in Sustainability Science and related disciplines. The Conference theme is Creating a unified foundation for the Sustainable Development: research, practice and education. This theme emphasizes the strong foundation that is provided by using research to inform our everyday practices, policies, and research approaches. The 2017 Conference will once again provide a forum for the sharing of ideas, presentation of research findings, and discussion of professional issues relevant to Sustainability Science. On behalf of the Scientific Program Committee, I have great pleasure in presenting this important event of the Scientific Community. The Conference topics are distributed in the range of the following streams within the ICSD2017 program: 1. Economic Sustainability: 2. Environmental Sustainability: 3. Socio-Cultural Sustainability: All abstracts were reviewed by members of the ICSD2017 Steering Committee for rating of abstract quality and presentation content. Selected papers are also published at the European Journal of Sustainable Development.
Further details in accordance with the instructions of the ICSD2017 are provided on the Call for Papers page at: www.ecsdev.org I would like to thank you for your scientific contribution to the Second International Conference on Sustainable Development and look forward to having the opportunity to showcase and disseminate your research. Special thanks also to the organizing committee, and all the people that worked hard, to bring in light this considerable event Yours sincerely Professor Gian Paolo Caselli Chair, 5th ICSD2017 Steering Committee

iv Book of Proceedings 5th ICSD 2017
International Steering Committee:
Gian Paolo Caselli, Chair University of Modena and Reggio Emilia Aranit Shkurti CIT, Tirana, Albania. Roberto Bianchini, CIRPS, Sapienza University of Rome. Leonardo Varvaro Tuscia University, Viterbo Vladimiro Pelliciardi Econdynamics, Univerity of Siena. Emilia Conte, Politecnico di Bari, Italy Makoto Usami, Kyoto University, Japan Filippo Pericoli Sapienza, University of Rome. Rohit Goyal MNIT, Jaipur, India.
Gihan Diab Sapienza University of Rome.
Ziad Saghir, Ryerson University, Toronto, Canada Daniel Pommier Vincelli, Sapienza University of Rome, Italy. Ante Galich, Université du Luxembourg, Luxemburg. Robert O. Dode, Univeristy of Uyo, Nigeria. Kaizar Hossain, GITAM University, Hyderabad Campus, India Saikat Kumar Basu, University of Lethbridge, AB, Canada.

Book of Proceedings 5th ICSD 2017 v
Contents
Introduction iii
International Steering Committee: iv
Contents v 1. Validating the Landscape Design Framework for Urban High-Density Neighbourhoods By Jane Chan Zi Ching, Agnieszka O. Guizzo 1 2. The Economic Impacts of the Renewable Energy Development in Turkey By Bülent Oral, Dilara Oral 13 3. Modified Cassava Barks as an Adsorbent of Copper Ions By Elio Conradi Junior, Daniel Schwantes, Affonso Celso Gonçalves Jr., Andressa Giombelli Rosenberger 23 4. Drug Situation in Albania By Klotilda Muca 35 5. Cadmium Removal from Water Using Modified Grape Stem By Juliano Zimmermann, Daniel Schwantes, Affonso Celso Gonçalves Jr., Amarilis Paula Alberti de Varennes e Mendonça 41 6. Analysis of Bioclimatic Measures on the Energy Performance of Dwellings from a Case Study of Troglodyte Architecture By Huedo, Patricia, Ruá, María José, Granell, Rocío 55 7. Practice, Practitioners and Redirection for Adapting Australian Cities By Petra Perolini 65 8. Legal Protection and Insurance by Administration as a Part of Universal Right in Albania By Arjan Gjini 73 9. Megaproject and Risk Management: A Case of Kuwait By Dr. Shaikha AlSanad 79 10. Review of Existing Approaches to Manage Sustainability and Moving Towards a Sustainability Management System Framework By Waqas Nawaz, Muammer Koҫ 89 11. Possibility of Fluoride Removal using Volcano Ash Soils and Bone Charcoal as Adsorbents By Tatsuhide Hamasaki 99

vi Book of Proceedings 5th ICSD 2017
12. Choosing the Consensus for Sustainable Economic Development By Sinan Sönmez 105 13. Nature and Identity. Agro Pontino case study By Maurizio Sibilla, Anna Barbati 121 14. Is the Renewable Energy Sector Financially Attractive? Financial Bubbles in the Wilderhill Indices By Iskra Sokolovska, Aleksandar Kešeljević 133

Book of Proceedings 5th ICSD 2017 vii

5th International Conference on Sustainable Development 6-7 September 2017, Rome, Italy
Book of Proceedings 5, 1-12 Doi: 10.14207/5ICSD2017
|1Research assistant at the National University of Singapore, under a project titled “Biophilic Town: A
Framework to Enhance the Environment of High Density Towns
2Research fellow at the National University of Singapore, under a project titled “Biophilic Town: A Framework to Enhance the Environment of High Density Towns”.
Validating the Landscape Design Framework for Urban High-Density Neighbourhoods
By Jane Chan Zi Ching1, Agnieszka O. Guizzo2
Abstract In today‟s context of urban planning, countless frameworks are developed to guide designers and policy makers to plan and build ideally sustainable cities. It is often tedious and financially improbable to validate the frameworks. In this paper we introduce the various methods of validation our framework has undergone Five methods are used: (1) design call - 3 landscape architecture studios develop design proposals of an actual site based on the framework. Feedback then were gathered from designers. (2) Delphi method– using the design schemes as targets, the research team is subjected to various rounds of evaluation to identify weak points (3) perception study of developed schemes by experts and residents (4) feedback from government agencies (5) the improved framework is shared with 100 practitioners through peer review session where practitioners from Singapore Institute of Landscape Architects and Architects attended. For framework to be usable, it has to undergo rigorous rounds of validation and revisions. Support from policy makers is necessary to implement it. This system of wide-spectrum validation attempts to bridge the chasm between academia and practice and it is worthy to share our findings with other countries. Integration of the framework into existing planning processes begins next phase.
Keywords: Neighbourhood landscapes, Singapore, high-density, ecosystem services, framework, validation
1. Introduction
The following contribution is part of a research project titled “Biophilic Town: A framework to enhance the living environment through landscape”. What inspired this project is the ubiquitous landscape of high density public housing in Singapore where 80% (Department Of Statistics Singapore, n.d.). ofresidents live. These landscape spaces, henceforth neighbourhood landscapes, take up substantial amount of land in this city state, account for about one tenth of total vegetation cover in Singapore, this is twice of the total area of parks (researcher's unpublished data). Outside of Singapore, neighbourhood landscapes also occupy large expanse of land of more than the total area occupied by a single food crop in the United States (Bryne, 2008) and about one fifth of total land in major cities in the United Kingdom (J. Gaston, H. Warren, Thompson, & M. Smith, 2005). Besides contributing to a substantial component of total vegetated area of cities (Cook et al., 2012), neighbourhood landscapes also provide the most immediate and frequent form of nature experienced by urban dwellers on a daily basis. Despite its pervasiveness and the high level of exposure residents have with the nearby nature of their

2 ICSD Book of Proceedings (2017), 5, 1-12
Published by ECSDEV, Via dei Fiori, 34, 00172, Rome, Italy http://ecsdev.org
neighbourhood, these spaces are often planned and designed in a way that does not optimize the landscape ecological quality and potential benefits that it can bring to the well-being of people. Through the concept of ecosystem services, which has been mostly applied in large scale green patches, this study aims to bring out the optimal qualities in these underutilized smaller scale landscape spaces of neighbourhoods through better planning and design. This departure point also capitalizes the „soft‟ values of landscape of socio-cultural services such as sense of place and community bonding which are often not directly associated with landscape. Applicability of the research outcomes is another dimension of this project which forms the research goal of this paper. Taking reference from one of the most comprehensive and reliable framework in landscape planning and design, Sustainable Sites Initiative (SITES), a continued collaboration among the Lady Bird Johnson Wildflower Center, the United States Botanic Garden, the American Society of Landscape Architects and a large group of contributors, including practitioners, advocacy representatives and educators. Before its actual implementation, SITES extensively reviewed public comments on their three draft reports for two years, and upon the release of version 1 in 2009, field tested it through another two years of pilot programs with more than 160 actual projects (SITES, n.d). Currently the team has revamped the framework to SITES v.2 Rating System. What makes SITES an award winning program (The Sustainable SITES Initiative, n.d.) is its nature of interdisciplinary effort as well as the continued evaluation and adjustments the team made to system throughout the last 10 years. Our team takes a leaf from the rigorous evaluation system of SITES and its intention to be a living product that evolves over time with research and experience, and applied our own multi-way validation system in the limited timeframe of this research project. Conversely, while SITES is applicable to all land uses ranging from small houses to a large recreation parks, our research framework is designed for use in the context of neighbourhood landscape. 2. Research goal
Policy making, research and practice are often seen as disintegrated spheres of serving the community. To extend the impact of the research outcomes to the practical world, this project has at the onset positioned itself as an „applied research‟ where its progress has been regularly communicated to the agency collaborators and there is an awareness among all stakeholders that the results will be integrated into existing planning policies. The open communication has allowed for a less constrained flow of information between research and policy making. Further, in order to avoid the typical bias blind spots of research, and to develop a robust framework that is usable in practice, there is a need to test its feasibility and validity with the involvement of all stakeholders in preparation for its publication and distribution. It is in this frame of mind that the validation methodology set out in this paper was conceptualized.

J. C. Z. Ching, A. O. Guizzo 3
© 2017 The Authors. ECSDEV Compilation © 2017 European Center of Sustainable Development.
3. Methodology
The methodology consists of five major steps of validation using different techniques, involving different stakeholders: designers, researchers, governmental agencies and residents of urban neighborhoods (Figure 1). The final phase of peer-review for the improved framework has not been carried out at the time of writing and will be excluded in this paper. Each of the 4 steps will be discussed separately. 3.1 Phase 1_Design Call - landscape design teams
The first validation method that was initiated early in the project, was appointing the design teams to produce the design proposals in order to assess the applicability of the framework in practice. Three international landscape architecture firms whose portfolios included neighborhood landscape scale designs were appointed. The three firms were from Taiwan (T1), from Singapore (T2) and from South Korea (T3). They were to develop design proposals of three different scales: macro plan at the site scale (720 ha), master plan of a neighbourhood (90 ha) and detailed plan for at a precinct scale (30 ha). The site is a secondary forest currently used as military training grounds and slated for development of public housing. Materials such as the draft framework, site information, maps of climate, vegetation, hydrology were first disseminated to the design firms, subsequently they were invited to Singapore for site visit, briefing by government agencies and a design workshop with the residents (Figure 2).
Figure 1. Scheme of the validation process. (FCG: Focus Group, R1, R2, R3: Round 1,2,3; VAS: Visual Analog Scale)

4 ICSD Book of Proceedings (2017), 5, 1-12
Published by ECSDEV, Via dei Fiori, 34, 00172, Rome, Italy http://ecsdev.org
Figure 2. Timeline of design call. (NLPDF: operational name of the framework; HDB: Housing Development Board)
Design teams were tasked to use the provided draft framework on all stages on their designs and to complete the scheme within 5 months. Upon submission of the design schemes, design teams were to evaluate the framework in an assessment report and to provide substantiation for their design decisions. All the comments and feedback from designers were consolidated and processed. A 2-day workshop was organized as a finale for the design teams to present their schemes to the research team and the government agencies, where feedback about the framework was gathered from the parties present 3.2 Phase 2_Delphi technique – Researchers
In the applied Delphi technique (Hsu & Sandford, 2007), we collected the responses of researchers who during 3 rounds of evaluation were to come up with the consensus about the score for each design scheme. We expected a large level of disagreement between experts will pinpoint the items from the framework that would need further modification. In the first round (R1) each researcher (n=6) was asked for a detailed evaluation of each developed design scheme. The task was to gauge to what extent each design team has incorporated the principles of the framework in their proposals (28 items per scheme, 82

J. C. Z. Ching, A. O. Guizzo 5
© 2017 The Authors. ECSDEV Compilation © 2017 European Center of Sustainable Development.
items in total), using the 1 to 5 scale, where 1= minimal, 3 = moderate, 5 = maximum level (and 0 where the principle was not apparent at all). In preparation for the second round (R2) their scores were consolidated into one table, and distributed among all experts. This time, experts, knowing the scores of their colleagues, were supposed to update their scores, with the special attention to the items with the largest disagreement. Moreover, the update of their evaluation took place during the 2-day workshop with design team members (Figure 2.), where each aspect of the proposals was carefully discussed. After collecting the experts‟ responses, they were again consolidated, and those items which remained with the large disagreement, proceeded to the third round (R3) where the final consensus was achieved through an internal discussion. On this point all experts from the panel discussed the specific item and justifying their score trying to reach the consensus. Optionally, if the consensus could not be reached, the possibility of malfunction of the framework item was considered. That would effect in the removal or modification of this item. 3.3 Phase 3_Perception study and feedback – Public agencies
The finale workshop where design teams presented their schemes received a turnout of approximately 33 participants, including representatives of four public agencies (n=13, 4 female) aged mostly between 21and 44 years old (n=11) and older 45-65 (n=2). They have reported substantial length of work experience (M=10.5, SD=7.37) in the public service connected to the area of landscape architecture (n=6), urban planning (n=5), nature conservation (n=1) and architecture (n=1) (Delbecq et al., 1975). During this event, feedback and queries from the public agencies were recorded by the research team and consolidated into items for internal discussion. At the same time, they were asked to answer three questions pertaining to the goals of the framework (Table 1). This form was a part of a perception study that was also performed in the phase 4 on another group of stakeholders – the residents. Table 1. The three questions experts are asked to answer using the VAS sheet
Part I. Quantitative input
Part II. Qualitative input
Question 1 How much do you think people would like to live in this neighbourhood? Please justify your decision Question 2 How much would each of these designs improve the ecological quality of living space? Please justify your decision
Question 3 How much would each of these designs contribute to the social and cultural aspects of individual and community well-being?
Please justify your decision
Notes: Question 1 in Phase 4 was slightly modified to sound as follows: How much would I like each of these designed spaces to be my neighbourhood?
First part of each question was designed to provide quantifiable data through the Visual Analog Scale (VAS). Subjects were asked to insert a cross mark on the 10-centimeter-long horizontal line that best represents their individual opinion about an issue. Each far left end of the line represented the most negative perception and each far right end the most positive perception of the scheme. The second part of each question is a short justification of their choice that would help us validate our quantitative data with a qualitative input. To this respect we computed

6 ICSD Book of Proceedings (2017), 5, 1-12
Published by ECSDEV, Via dei Fiori, 34, 00172, Rome, Italy http://ecsdev.org
the number of positive comments addressed to each of the panels and compared it with the number of negative comments about them. 3.4 Phase 4_Perception study by residents
In the third phase of the validation we asked Singapore residents, people who would, in the most direct way, receive the outcomes of the framework in a form of a new residential estate. We randomly recruited 40 residents (26 female) of the Singapore public housing estates (commonly called HDB) to take part in our experiment. The most participants were 21-34 year old, majority were from Chinese (n=31), other nationalities included Malay (n=7) and Indian (n=2). Large majority of participants stayed in the HDB estates for over a decade: 11-20 years (40%), 21-30 years (32%).
Figure 3. The A0 panels with the standardized representation of design schemes from (a) Team 1, (b) Team 2 (c) Team 3; d) Residents scoring these design schemes during the workshop.
Standard representations of three design schemes, developed by the international teams in Phase 1 were prepared (Figure 3.a,b,c), each of which included the neighborhood scale master plan, three panoramic visualizations and two extra elements of the designer choice inserted on the A0 panel and 200 words description. The objective was to show the essence of each concept in a way that would be most accessible for a lay-person rather than detailed depiction of all technical solutions in the design Each participant was first asked to get to know all the panels and descriptions, then without discussing with other participants, provide answers to 3 questions (Table 1), about each of the panels. Questions were composed to show the preference of the proposals as the real living space for residents, but also recognition of the

J. C. Z. Ching, A. O. Guizzo 7
© 2017 The Authors. ECSDEV Compilation © 2017 European Center of Sustainable Development.
“environmentally-friendly” values as well as the social and community values present in the schemes. Similar to the VAS sheets given to the experts, residents were asked to mark a cross on the 10-centimeter line at the point where they feel most appropriate answers each question. Similarly as in the case of agencies, residents were asked for a short justification of their choice that would help us validate our quantitative data with a qualitative input. We were about to compare the number of positive comments with the number of negative comments expressed by the residents about each of the design proposals 4. Results 4.1 Results from phase 1
First and foremost, designers were able to produce the requested design schemes on time. The feedback collected from them in the form of report let us conclude that the overall impression of working with the framework was positive, however it still required some changes and updates (Figure 4). The level of satisfaction with the design guidelines was lower than the framework overall (Figure 5a), which was reported to be caused by strict measurable requirements that designers were asked to comply with. Still, the final assessment of the framework sets it high above the average (3.99 point). We also found that designers were willing to utilize this framework in the future projects, the overall likelihood of that happening is 4 in 1 to 5 scale (Figure 5b). An interesting finding concerned the level of familiarity with the concept of ecosystem services before and after the exercise. All of design teams have reported the significant growth in understanding of this concept after working with the framework. (Figure 4c).
Figure 4. Designers feedback after the work with the framework: (a) assessment chart of the overall quality of the framework and design guidelines, (b) level of likelihood of applying the framework in team’s design practice, (c) level of understanding of the concept of ecosystem services before and after using the framework by the team 1 (T1), team 2 (T2) and team 3 (T3)
4.2 Results from phase 2
Results from this exercise show that the level of disagreement between experts was decreasing with each round. Experts were able to correct their answers while getting to know the design schemes better during the workshops. After first round 13 items of the framework was causing disagreement larger that levels of acceptability, repeating in

8 ICSD Book of Proceedings (2017), 5, 1-12
Published by ECSDEV, Via dei Fiori, 34, 00172, Rome, Italy http://ecsdev.org
the case of 2 or 3 schemes. After second round this number declined to 5 items. After third round the panel reached final consensus about the scoring and identified only 2 malfunctioning items from the framework that needed further improvements. The disagreement between raters that was occurring in the case of only 1 design scheme (not repeating) was considered coincidental, and no further action was taken (Table 3) Table 3. The quality of the framework measured by the disagreement between the raters along three rounds of Delphi evaluation, expressed with the standard deviation (SD)values across raters. The marked cells singify the cases of a disagreement between raters greater than established limits of acceptable disagreement.
4.3 Results from phase 3
The answers submitted by representatives of public authorities revealed the positive perception of all designed schemes. The mean score across all panels was 7.22 points (SD=1.57). The highest score was given to the proposal of the team 3 (8.03 points), and the lowest to the proposal of the team 2 (6.58 points); the team 1 was scored as medium-preferred (7.06 points) with the Std Err of LS Mean= .350. This data gives us a preliminary idea of how the three design schemes are perceived by the experts, and which one would probably win if it was a design competition. Disregarding subjective preferences in design aesthetics, it was of major importance to test the performance of the framework in three scales of concern reflected with three questions. And so, statistically, the scores across three questions are equivalent to one
ITM # Symbol Category Round 1
Round 2
Round 3
Items to refine T1 T2 T3
T1 T2 T3
T1 T2 T3
1 CP_1 Functioning ecosystems connected at nested scales *
*
*
2 CP_2 Social and ecological processes are intertwined
*
3 CP_3 Dynamism of urban ecosystem * * *
* *
* *
*
4 CP_4 Heterogeneity of urban ecosystem * *
5 CP_5 Enduring context
6 APP_1 Site specific design
7 APP_2 Participatory design *
8 APP_3 Integrated design * * *
9 PS1 Fresh Produce
10 PS2 Water for irrigation * *
11 RS1 Heat Mitigation
12 RS2 Erosion Control * *
*
*
13 RS3 Stormwater & domestic waste water treatment
14 RS4 Abatement of noise pollution * * *
*
*
15 RS5 Vector control * *
* *
*
16 RS6 Flood hazard mitigation
17 Sc1 Mental and physical health
18 SC2 Sense of Place *
19 SC3 Aesthetic Appreciation * *
20 SC4 Social Relations *
21 SC5 Educational Values
22 SC6 Recreation *
23 SC7 Heritage landscapes and specimen
* *
*
*
24 SC8 Spiritual and religious fulfillments * * *
* * *
* * *
* 25 SS1 Maintenance of soil quality * * *
* *
*
26 SS2 Provision of habitat for species *
*
*
*
27 SS3 Nutrient cycling * * *
* *
28 SS4 Water cycling
Notes: SDmax.R1=1.0; SDmax.R2=1.17; SDmax.R3=1.12

J. C. Z. Ching, A. O. Guizzo 9
© 2017 The Authors. ECSDEV Compilation © 2017 European Center of Sustainable Development.
another, which means that all three schemes rate high in general liveability (MQ1=7.07 points), ecological quality (MQ2=7.24) and well-being (MQ3=7.34). These findings were confirmed by qualitative data collected in a form of comments (n=40). Majority of comments (59%) of public agencies representatives were positive, while 41% were negative (Figure 6). Most of the positive comments were attributed to the liveability element of design schemes (n=12), the rest to the well-being component (n=10) and to the environmental component (n=8) (Table 4).
Figure 6. Number of positive and negative comments given to the design schemes by residents in comparison to representatives of agencies, expressed in percentage.
Table 4. Number of positive and negative comments given by residents and agencies to each of the three designs organized by Question.
Comments x Question Number of comments
Residents (n=40) Agencies (n=13)
Positive x Question 1 35 12 Positive x Question 2 25 8 Positive x Question 3 33 10 Negative x Question 1 5 7 Negative x Question 2 9 6 Negative x Question 3 4 2
4.4 Results from phase 4
The evaluation of design schemes performed by residents show rather positive reception of all design schemes by residents. The mean score across all panels was 6.53 points (SD=2.10). The highest score by residents was given to the proposal of the team 1 (7.22 points), and the lowest to the proposal of the team 3 (6.87 points). The team 2 was scored as medium-preferred (6.81 points). The analyses of the qualitative data collected from residents confirmed the positive perception of all three design panels (Figure 6). Overall number of positive comments was 93, while negative only 18. What is more, the largest number of positive comments (n=35) was attributed in the case of Question 1, which concerned the liveability of the designed spaces. The second positively commented aspect of all three designs were values associated with the individual and community well-being (n=33). Residents gave the lowest amount of positive comments to the environmental values of each of designs (n=25) (Table 4.)

10 ICSD Book of Proceedings (2017), 5, 1-12
Published by ECSDEV, Via dei Fiori, 34, 00172, Rome, Italy http://ecsdev.org
From Figure 6, we observe that agencies tend to be more critical towards the design schemes than residents, naturally so since they are the policy makers who have to ensure a high quality of living environment for the residents. On the other hand, it also implies that residents are relatively happy with the proposed neighbourhood designs relative to where they are currently residing. 5. Discussion
From the engagement with design teams, we learnt that designers are willing to be guided by a trusted set of rules which they use as a reference. While rigid numerical guidelines were met with a certain level of resistance (either too easy or too difficult to achieve), the rigorous measures in the framework were mostly perceived as positive stimulation to push the frontier of their creativity. This allows the research team to understand the dilemma of having a „checklist‟ and to better calibrate requirements in a broader scope to allow flexibility depending on context. In the expert evaluation, our research team members acted as a jury panel and used their expertise and knowledge to score each design scheme systematically according to the framework principles. The 3-round Delphi process allowed the team to compare and adjust their individual scores upon hearing the justification of other members, which left us more assured that all disagreements were understood and resolved. Through this exercise we were able to calibrate our own understanding of the framework and its guidelines through questioning the necessity and basis of what we have proposed. Several rounds of internal discussion following this exercise to refine the framework helps to ensure that the final version is assured a higher quality. Through interactions with our agency collaborators, we find that their openness to engage is a critical link from research to practice, without their support, it will be challenging to bridge the outcome from research to practice. Hence the workshop held with the design teams and agencies was an important milestone; aside from collecting feedback and scores, it serves as a platform for the research team to report the project development to the public agencies and at the same time facilitates the exchange of knowledge in research, policy making and practice. In the case of the largest stakeholders, the residents, we find that they are curious and eager to be involved at some level of decision making in their future neighbourhood. Many felt privileged to have their opinions consulted and expressed interest to participate in similar events about their living environment. The act of participation in such activities allows the residents to learn something about how their neighbourhood is planned and about conflicting needs of other residents. Research in participatory design has compelling findings that participation increases sense of belonging and hence general wellbeing of residents (Francis et al., 1984; Hester, 1990; Kaplan, 1973; White, 1982), which also makes for another agenda of this research project. By looking at our results it becomes obvious that there are certain differences in the perception of the developed proposals between agencies and residents. Experts representing the public authorities gave more generous scores to designs schemes in comparison to the residents. At the same time residents gave more positive comments in comparison to the negative ones, while this ratio was smaller in the case of agencies.

J. C. Z. Ching, A. O. Guizzo 11
© 2017 The Authors. ECSDEV Compilation © 2017 European Center of Sustainable Development.
These dynamics can be motivated by many different variables that, with such limited sample size would be hard to determine. However, for the purpose of this research, it is merely enough and as much to establish, that the applied framework met with the positive reception in both groups of stakeholders, and major goals that it aimed to achieve (high liveability, environmental and well-being levels) were found by public agencies as well as by the residents. As a final validation before the implementation of the framework, in the coming months, the research team will conduct a peer review session in to be attended by professionals in landscape and architecture. This workshop will furnish 100 practitioners with firsthand information of the revised framework and solicit their responses and feedback. Upon the conclusion of this workshop, the research team will begin to tailor the framework guidelines according to this final round of comments. Since any framework can really pretend to be a key to successful design, or to replace the missing designer skill, therefore we cannot say that out developed framework will work successfully in every conditions. What we want to underline is that it should be a tool for designers that serves for constant raising of the awareness of designers, but also, the mean of communication, establishing the dialogue between the researchers, decision makers, designers and residents. 6. Conclusion
The multi-way validation of framework covered the point of view from all the stakeholders involved in the process of neighbourhood planning and design with no conflicts among them. Four groups were let to express their opinions about overall framework as well as its detailed nuances. Our findings indicate that the framework is effective in acting as the driver behind the developed design schemes to improve the design quality of the neighbourhood landscape. Our study suggests that as practitioners rarely keep up to date with the latest research trends, providing a framework based on the concepts derived from scientific domain (such as ecosystem services) is a sensible way to inform the practice with the recent scientific findings. Policy makers, who may be aware of the latest trends, often do not have the time and resource to conduct rigorous validation and refinement of a framework. This is where research comes in to fill in the gap of generating and disseminating knowledge. Through this methodology of multi-way validation, we hope to deliver a set of guidelines based on strong principles and is applicable and reliable. With applied research we hope to circumvent the situation where a plethora of knowledge is only accessible to the academia and not being used in practice. A dialogue between science and practice is thus essential to enable the convergence of knowledge, policies and practice, which is when it starts to benefit the society at large. 7. Acknowledgements
This material is based on research/work supported by the Singapore Ministry of National Development and National Research Foundation under L2 NIC Award No.

12 ICSD Book of Proceedings (2017), 5, 1-12
Published by ECSDEV, Via dei Fiori, 34, 00172, Rome, Italy http://ecsdev.org
L2NICCFP1-2013-10 to Tan P.Y. 8. Disclaimer
The opinions expressed in this paper are those of the authors and do not necessarily reflect those of their collaborators or the grantor. References Bryne, L. (2008). Ecological landscaping: from scientific principles to public practices and policies. Cities and
the Environment, 1(2), 1-4. Cook, E. M., Hall, S. J., & Larson, K. L. (2012). Residential landscapes as social-ecological systems: A
synthesis of multi-scalar interactions between people and their home environment. Urban Ecosystems, 15(1), 19-52. doi:10.1007/s11252-011-0197-0
Delbecq, A. L., Van de Ven, A. H., & Gustafson, D. H. (1975). Group techniques for program planning (Glenview, IL: Scott, Foresman).
Department Of Statistics Singapore. (n.d.). Retrieved April 10, 2017, from http://www.singstat.gov.sg/statistics/latest-data#22
Francis, M., Cashdan, L., Paxson, L., 1984, Community open spaces: Greening neighborhoods through community action and land conservation, Island Press.
Hester, R. T., 1990, Community design primer, Ridge Times Press. Hsu, C. C., & Sandford, B. A. (2007). The Delphi technique: making sense of consensus. Practical Assessment,
Research & Evaluation, 12(10), 1-8. J. Gaston, K., H. Warren, P., Thompson, K., & M. Smith, R. (2005). Urban domestic gardens (IV): the
extent of the resource and its associated features. Biodiversity and Conservation. doi:10.1007/s10531-004-0513-6
Kaplan, R., 1973, Some Psychological Benefits of Gardening, Environment and behavior 5(2):145-162. SITES, (n.d.) SITES v2 Rating System for Sustainable Land Design and Development. The Sustainable SITES Initiative. (n.d.). Retrieved April 10, 2017, from
http://www.sustainablesites.org/about White, K., 1982, The community land trust handbook, by The Institute for Community Economics, Rodale Press,
Emmaus, PA.

5th International Conference on Sustainable Development 6-7 September 2017, Rome, Italy
Book of Proceedings 5, 13-22 Doi: 10.14207/5ICSD2017
|1Marmara University, Technology Faculty, Electrical-Electronics Engineering Department
2Marmara University, Engineering Faculty, Environmental Engineering Department
The Economic Impacts of the Renewable Energy Development in Turkey
By Bülent Oral1, Dilara Oral2
Abstract Attaining sustainability in energy use is likely to create a cleaner environment, improved energy efficiency, generation widespread electricity with renewables, and result in greater investment in cleaner technology. Thus, in the many countries, the rapid market penetration of renewable energy in recent years suggests that a fundamental revolution will come in the next decades and that renewable energy may gradually become the main energy source. Turkey is a country with significant renewable energy potential. If the share of existing potential in total electricity energy production is examined, it can be seen that only hydroelectric power plants are used through water power. However, especially in recent years, the studies for the use of solar, wind and geothermal potential have begun to prominent in Turkey. So, it is expected in the next decade a much faster process than the past ten years. The developing technology to take advantage of this potential will undoubtedly contribute to the development of the country's workforce. Many countries have made a contribution to solution on employment with progress towards the development of renewable energy technologies. In this study, Turkey's renewable energy potential, existing and developing technologies is examined in terms of economic indicators and workforce. Thus, in the context of research and practice, contribution of the sustainability of the country's economy is presented.
Keywords: Renewable Energy, Turkey, Sustainable Economy, Employment
1. Introduction
There is a great deal of interest in the employment effects resulting from the transition to a low carbon and sustainable economy. Over the last decades policies to promote renewable energy have become increasingly popular in many countries. The increase in unemployment following the financial crisis of 2007–2008 and the declared commitment of different countries to reduce environmental pressures have led together to the introduction of several policies aimed to create „„green jobs” [1]. The countries adopt support schemes for renewable energy to cure socio-economic problems, unemployment and economic development [2]. This is important for economic sustainability. In view of high and persistent unemployment levels, the renewable energy as a job creation engine can boost economic well-being [2]. With the R&D, investment and operation cost of PV and wind power can be to reduce successfully. By the deployment of renewable energy, it is possible to supply over a specific portion of their total electricity generation output in the form of renewable energy [3]. In the view of pressing unemployment and environmental problems, different policies

14 ICSD Book of Proceedings (2017), 5, 13-22
Published by ECSDEV, Via dei Fiori, 34, 00172, Rome, Italy http://ecsdev.org
have been proposed to create jobs. Known that the European Union has committed itself to increase the share of energy from renewable sources in overall energy consumption to 20 percent in 2020. There has been an intense debate on the quantification of these employment effects, especially in the European Union [1, 2]. According to studies, it has seen on the period (1995–2009) when the EU‟s energy structure went through a significant shift, away from the more carbon intensive sources, towards gas and renewables [1]. In 2009, ex-president Barack Obama visited business that manufactures components for wind power generators. At the gravest economic crises in recent history, Obama said strongly, amid deepening unemployment that renewable energy “can create millions of additional jobs and entire new industries [4].” The ex-president then defended for the exit from the economic crisis his energy subsidy package by citing examples from other countries: “And think of what‟s happening in countries like Spain, Germany and Japan, where they‟re making real investments in renewable energy. They‟re surging ahead of us, poised to take the lead in these new industries.” One estimate suggest that policies supporting renewable sources of energy to meet the 20% target by 2020 would provide 410,000 additional jobs in the EU. Another study by Cambridge Econometrics estimates that the 2050 Road Map, which requires a reduction in CO2 emissions of 80–90% from 1990 levels, would result in an increase in employment ranging from 0% to 1.5%. Similar positive results emerge from more local studies in Europe. They find slightly higher employment in a scenario with more renewables and less fossil fuel energy than the base case. There are other studies assessing the potential employment impacts of renewables [1]. Turkey has the opportunity to benefit from all renewable energy sources because of its geographical location and geopolitical structure. Especially hydraulic, geothermal, when compared to EU countries in terms of wind and solar energy potentials, it seems that Turkey has a very favourable position. However, utilization rates from these sources are low. Although there are some economic and legal constraints in front of this situation, the developments are gratifying. It is evident that Turkey attaches great importance to the future plans and especially the issue of renewable energy within the scope of the 2023 goals. As a result of the steps taken in this direction, Turkey gives priority to assessing the current renewable energy potential. Turkey is adopted to utilize all the opportunities to increase the share of domestic and renewable energy resources in energy supply, to enhance energy efficiency in energy generation and consumption process, and to provide a transition into clean production technologies by improving R&D [5]. In the long term, Renewable energy, which will significantly reduce Turkey's energy dependence and energy bill, will provide extremely important benefits in many fields from national investment to environmental factors, from energy supply security to diversification of resources. Thus, Turkey can become a self-sufficient country besides being a central country in energy trade. In this study, the current situation of the Turkish economy is expressed, and with the utilization of the potential of the renewable energy, how can be used in the development of the economy and economic dynamics. In this context, the current state of the renewable energy in the country is presented and this process is examined considering

B. Oral, D. Oral 15
© 2017 The Authors. ECSDEV Compilation © 2017 European Center of Sustainable Development.
the developments. 2. About the Economy of Turkey
Turkey, as a developing country is one of the upper middle income according to the World Bank, is the 18th largest economy in the world with the GDP of current US$ 857 billion and also is in the high human development category of the Human Development Index (HDI). Turkey, which takes place geographically between Europe, Caspian and the Middle East, is candidate country to European Union (EU) membership. According to 2016 data, the current state of Turkey's economy is presented in Table 1 with some basic parameters [6, 7]. Table 1. The view of Turkey's economy
Population (Million)
GDP (USD Billion)
Export (USD Billion)
Import (USD Billion)
FDI (USD Million)
Unemployment Rate (%)
79.53 857.75 142.6 198.6 12,300 10.9
Unemployment and economic growth are two of the most important issues of macroeconomics. Unemployment is the difference between the full employment and actual employment. Although the classical economic model assumes that there is a full-employment in economies, this assumption does not reflect the truth and all countries are faced with unemployment problem even if they have different causes. For this reason almost all countries try to keep under control the unemployment with various economic policy implementations. Economic growth is generally defined as the increase in GDP as a result of the increase in a country‟s production of goods and services in a specific period. Economic growth is the only way of raising the people‟s life standards. For that reason, fast economic growth is generally one of the most significant main macroeconomic goals of the countries [8]. Over the last two decades, despite the double increasing in world economic growth, expected decrease in unemployment is not realized. This situation can be interpreted that the relationship between growth and unemployment is getting irrelevant. For decreasing unemployment, economic growth is not enough. Instead of an economic growth not creating employment, the growth that will be provided by the sectors that will create employment will decrease unemployment. In Turkey, the change of the economic growth and the unemployment rate over the years are shown in Figure 1[6, 7].

16 ICSD Book of Proceedings (2017), 5, 13-22
Published by ECSDEV, Via dei Fiori, 34, 00172, Rome, Italy http://ecsdev.org
Figure 1. The change of the economic growth and the unemployment rate in Turkey
Thanks to the stabilization policies and structural reforms, economic growth is provided after the crises in 2001. In this period positive developments are observed in inflation, export, public debt, interest rate also. Although these positive developments in economy, unemployment stays as an important problem. There are a great number of studies on the relationship between economic growth and unemployment. An important part of these studies confirm Okun's Law while others reject it. The relationship between the unemployment and economic growth was first analysed by Arthur M. Okun‟s study in 1962. According to this approach which later named as Okun Law, high economic growth rate causes a decrease in unemployment rate or vice versa. Empirical studies generally grounds on the assumption that there is a symmetrical relationship that accept that during the cyclical fluctuations, real output has the same absolute effect on unemployment in both extension and contraction period. However, recent studies show that increasing effect of growth on unemployment in contraction period is not absolutely same as decreasing effect of growth on unemployment in extension period [8]. Unemployment rate is one of the main economic problems for Turkey. In spite of high economic growth in 2000‟s, unemployment rate is still over 10 percent. The economic growth is a factor affecting unemployment in Turkish economy but high and low rate in unemployment have no effect on the arising of economic growth. This situation brings to question why economic growth does not reduce unemployment. The obtained findings show that the variables are not cointegrated. This result means that economic growth doesn‟t adequately create employment. 3. Renewable Energy Developments in Turkey
Turkey's demand for energy has grown rapidly almost every year. Moreover it is expected that energy demand will continue to grow in the future in parallel to country's economic growth [9]. However, country's self-sufficiency ratio is very low compared to increased demand. Turkey is heavily dependent on the expensive imported energy sources that brings significant burden on the economy, balance of payment and price stability. According to the basic economic indicators presentation of the Ministry of Customs and Trade, total energy import was 27.2 billion USD and it constituted about 14 % of the total import bill in 2016 [10]. Turkey's annual energy demand growth has been 4.6% since 1990. It is also projected by Turkish Electricity Transmission Company (TEIAS) that annual growth rate of electricity demand is 6.7% in low scenario or 7.5% in high scenario Energy Market Regulatory Authority (EMRA) underlined that required investment for energy generation was about 225–280 billion USD for 2010–2020 period. The total primary energy production met around 24.08% of total primary energy demand of the country in 2015 [10, 11]. Since Turkey is heavily dependent on expensive energy imports that impose significant burden on balance of payment and economy, promotion of renewable energy sources such as biofuels, hydro, wind is key issue for the country in terms of reduction in the dependence on energy import, strengthening supply security, creation of new job
B. Oral, D. Oral 17
© 2017 The Authors. ECSDEV Compilation © 2017 European Center of Sustainable Development.
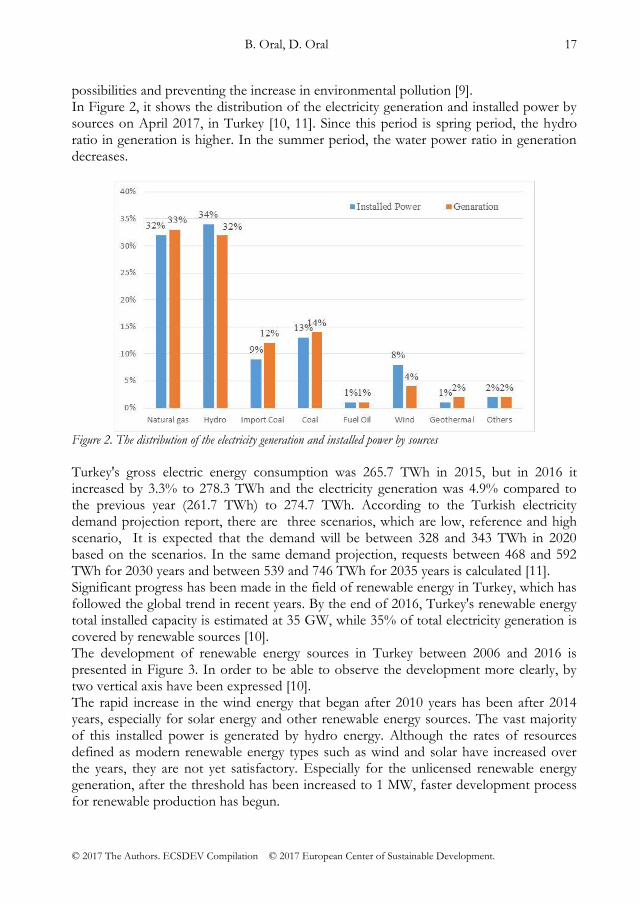
possibilities and preventing the increase in environmental pollution [9]. In Figure 2, it shows the distribution of the electricity generation and installed power by sources on April 2017, in Turkey [10, 11]. Since this period is spring period, the hydro ratio in generation is higher. In the summer period, the water power ratio in generation decreases.
Figure 2. The distribution of the electricity generation and installed power by sources
Turkey's gross electric energy consumption was 265.7 TWh in 2015, but in 2016 it increased by 3.3% to 278.3 TWh and the electricity generation was 4.9% compared to the previous year (261.7 TWh) to 274.7 TWh. According to the Turkish electricity demand projection report, there are three scenarios, which are low, reference and high scenario, It is expected that the demand will be between 328 and 343 TWh in 2020 based on the scenarios. In the same demand projection, requests between 468 and 592 TWh for 2030 years and between 539 and 746 TWh for 2035 years is calculated [11]. Significant progress has been made in the field of renewable energy in Turkey, which has followed the global trend in recent years. By the end of 2016, Turkey's renewable energy total installed capacity is estimated at 35 GW, while 35% of total electricity generation is covered by renewable sources [10]. The development of renewable energy sources in Turkey between 2006 and 2016 is presented in Figure 3. In order to be able to observe the development more clearly, by two vertical axis have been expressed [10]. The rapid increase in the wind energy that began after 2010 years has been after 2014 years, especially for solar energy and other renewable energy sources. The vast majority of this installed power is generated by hydro energy. Although the rates of resources defined as modern renewable energy types such as wind and solar have increased over the years, they are not yet satisfactory. Especially for the unlicensed renewable energy generation, after the threshold has been increased to 1 MW, faster development process for renewable production has begun.

18 ICSD Book of Proceedings (2017), 5, 13-22
Published by ECSDEV, Via dei Fiori, 34, 00172, Rome, Italy http://ecsdev.org
Figure 3. The development of renewable energy sources in Turkey between 2006 and 2016
According to Turkey's Solar Energy Potential Atlas (GEPA), the total annual sunshine duration is 2,737 hours (7.5 hours per day total), while the total solar energy output per year is 1.527 kWh / m².year (4.2 kWh / m² per day). As of the end of 2016, the total solar installed capacity solar was 832.5 MW. The licensed solar installed power is 819.6 MW and the licensed solar installed power is 12.9 MW [10]. Turkey is a country with a very high geothermal potential since it is situated on the Alpine–Himalayan belt. The geothermal potential is theoretically 31,500 MW. 94% of geothermal resources are low and medium temperature and suitable for direct applications (heating, thermal tourism, mineral waters etc.) and 6% are suitable for indirect applications (electricity energy generation). Compared to the geothermal applications in Turkey for 2002-2016, the number of sites suitable for electricity generation was 16 in 2002 and 25 in 2016. Thus, the geothermal installed capacity was 15 MW in 2002, but at the end of 2016, it reached 820.9 MW. It has been accepted that wind power plants can be installed in Turkey with a power of 5 MW per square km at 50 m above ground level and at wind speeds above 7.5 m / s. In the light of these assumptions, the Wind Energy Potential Atlas (REPA), which provides wind source information generated using a medium-scale digital weather forecast model and a micro-scale wind flow model, was prepared. According to this, Turkey has a wind energy potential of 48.000 MW. The total area corresponding to this potential corresponds to 1.30% of Turkey's area. The installed capacity of licensed wind power plants operating by the end of 2016 is 5,751.3 MW [10]. The number of electricity power generation plants in Turkey has increased to 2,321 by the end of 2016. The existing power plants are 597 hydro, 39 coal, 171 wind, 31 geothermal, 260 natural gas, 1,045 solar, 178 other power plants [11]. 4. Renewable Energy Impacts on The Economy of Turkey
Bhattacharya et al. investigated the effects of renewable energy consumption on the economic growth of major renewable energy consuming countries in the world [12]. Some of the determinations in the study are:

B. Oral, D. Oral 19
© 2017 The Authors. ECSDEV Compilation © 2017 European Center of Sustainable Development.
In recent years, the growth of renewables was faster in the developing countries compared with the OECD countries. Also, developing newly-emerging countries have been invested at a faster pace in renewables.
Global investment in renewable power increased almost fourfold (from USD $36 billion to $139 billion) for developed countries, while for developing countries the growth factor is just over 14 (from $9 billion to $131 billion), and increased from $45 billion to $270 billion between 2004 and 2014 for the whole world.
Investment in developing countries, at $131.3 billion, increased to 36% on the previous year and came the closest ever to overhauling the total for developed economies, at $138.9 billion additional to China, Brazil ($7.6 billion), India ($7.4 billion) and South Africa ($5.5 billion) were all in the top 10 of investing countries, while more than $1 billion was invested in Indonesia, Chile, Mexico, Kenya and Turkey. However, for eleven countries- Australia, Belgium, Brazil, Ireland, Japan, Mexico, Slovenia, South Africa, Sweden, Thailand and Turkey the renewables energy is not as a significant driver of the economic growth process. Deployment of renewables was in early stage for these countries.
Finally, for these countries, renewable energy sources was not a significant driver of or barrier to economic growth in the investigated period. Because of these countries was that they have not been able to make use of renewable energy sources effectively in the production process, and it therefore had almost no impact on the economic output. Therefore, the policy makers of these countries should focus on investing renewable energy effectively so the increase in demand for energy consumption from various economic activities can make use of renewable energy sources. This has been happening in recent years in most of these countries. The above determinations are important. Because the positive impact of renewable energy on the economy in countries such as Turkey will be revealed by new investments. Turkey has developed the National Renewable Energy Action Plan in achieving 30 per cent of its total installed capacity from renewable sources by 2023[10]. The installed capacity for the renewable energy is 27 GW excluding hydro. Thus, the capacity will be gradually increased in the coming years and according to the target 2023; At least 3 GW the photovoltaic power is aimed to reach to the power plant. The target power of the biomass power plant is set at 1 GW. The largest progress is planned for the wind 20 GW for installed power. Approximately US $ 29 billion for 20 GW of new renewable energy capacity needs to be invested [13]. International Renewable Energy Agency IRENA announced that in 2016 the renewable energy sector employs more than 9.8 million people worldwide. According to IRENA's employment report, the renewable energy sector employs more than 9.8 million people worldwide. The number of people working in the renewable energy sector is estimated to reach 24 million by 2030. According to the report, increased investment has increased the number of people working in the renewable energy sector thanks to falling costs and assistive policies. In the renewable energy sector, 7 million people were working in 2012, compared to 9.8 million last year. In 2016 years, the employment rate in the solar energy sector increased by 12 percent compared to the previous year to 3.1 million, wind employment increased

20 ICSD Book of Proceedings (2017), 5, 13-22
Published by ECSDEV, Via dei Fiori, 34, 00172, Rome, Italy http://ecsdev.org
by 7 percent to 1.2 million. In employment, the biofuels sector occupied with 1 million 724 thousand, followed by large scale hydroelectric power plants with 1 million 500 [14]. In the field of renewable energy, the largest employment occurred in China. Last year, 3 million 643 thousand new jobs were provided in the clean energy sector. China followed 876 thousand jobs with Brazil and 777 thousand jobs with USA. On the other hand, for the first time in this year's edition, figures related to the number of personnel working in the renewable energy sector in Turkey were also included. Accordingly, the number of people working in renewable energy totals about 94,400. Turkey employed 53,000 people in wind power and 16,600 in solar heating and cooling, and 12,700 in PV [14]. Along with the 2023 target and the investment process, other incentives and supports for renewable energy as well as the purchase guarantee tariff are provided in parallel with the domestic and renewable production support policy. Investments in the manufacture of domestic equipment for renewable energy production assets are considered "priority" in government policies. These investments is included accordingly benefit from different tax and social security premium benefits, land purchase rights and other financial support. With the new legal regulation, it is expected to pave the way for large-scale renewable energy investments in Turkey. Within the year 2017two major projects about renewable energy designated areas (REDAs) have begun to support renewable energy investments. One of them was a tender for a 1,000 MW solar power plant in Konya Karapınar. The other is the bidding for the use of renewable energy resources and the use of the connection capacities of the energy to be produced in these areas through the wind energy in the 1000 MW power to be built during the year. In this project, there are 65% domestic production and 80% domestic engineer conditions [10]. In the project of Konya Karapınar, a solar panel factory with a production capacity of 500 megawatts of photovoltaic module per year in Turkey will be installed. Karapınar will have a thousand megawatt connection capacity allocation for 10 years. It is planned to be 60 percent of domestic participation rate at the first 500 megawatt. Investments in Karapinar are expected $ 1.3 billion and about half of it to enter the country as direct foreign capital. In addition, an R&D centre will be established and 80 percent of its employees will be consisted of Turkish engineers. Thus, with a 1GW domestic solar power plant that has been operating within 36 months at the latest, there will be a domestic 500 MW PV factory that has been operating at least 21 months later [10]. This project will be a crucial leap forward for Turkey's solar energy sector thanks to such benefits as technology transfer and qualified labour force increase in the investment process. Hereby, it is expected that the country will gain a significant boost in development in this area. 5. Conclusions
Development of renewable energy sources also induces worldwide employment. Some countries record the employment rate in the field of renewable energy. However, renewable energy is often more expensive than traditional sources. Although renewable energy is often said to be more expensive than traditional sources, in recent years, by the

B. Oral, D. Oral 21
© 2017 The Authors. ECSDEV Compilation © 2017 European Center of Sustainable Development.
effects of technological developments, financial developments and new market opportunities, renewable energy sources, especially wind and solar (Photovoltaic) energy-related costs of electricity generation should not be ignored. In addition, it is necessary to pay more attention to the financing of development in the renewable energy sector. It is argued that by harmonization of instruments of mitigation against climate change with a more rational tax structure on labour markets along with macroeconomic policies to promote employment in green production activities, developing economies can achieve significant gains towards a sustainable green growth with higher employment path. In the context of the sustainable energy for all, the aim of plan for energy is to reach a competitive energy system that exploits domestic and renewable energy resources to the extent possible, supports reduction of energy intensity of the economy, and minimizes waste and environmental effects of energy. A balanced resource diversification on the basis of primary energy resources and differentiation of countries will be ensured, share of domestic and renewable energy resources in the production system will be raised to the maximum extent. In order to maximize the contribution of renewable energy in the economy, the level of domestic manufacturing will be increased and new technologies will be developed. According to state policies; Additional investments to be made at the new capacity, supply diversity (domestic and renewable resource needs) and energy efficiency increase are critical issues for Turkey, due to the increasing primary energy demand. The domestic equipment manufacturing and localization strategy; has a strategic due to the opening of new business areas, the development of businesses and, consequently, the direct positive impacts on GDP and the current account deficit. Finally, new technologies and domestic production on renewable energy will increase employment opportunities. References [1] Markandya, A.; Arto, I.; Eguino, M.G.; Román, M.V.: “Towards a green energy economy? Tracking the
employment effects of low-carbon technologies in the European Union”, Applied Energy, V. 179, pp. 1342–1350, 2016.
[2] Böhringer, C.; Keller, A.; Werf, E.V.D.: “Are green hopes too rosy? Employment and welfare impacts of renewable energy promotion”, Energy Economics, V. 36, pp. 277-285, 2013.
[3] Park, S.Y.; Yun, B.; Yun, C.Y.; Lee, D.H.; Choi, D.C.:“An analysis of the optimum renewable energy portfolio using the bottom–up model: Focusing on the electricity generation sector in South Korea”, Renewable and Sustainable Energy Reviews, V. 53, pp. 319–329, 2016.
[4] Álvarez, G.C.; Jara, R. M.; Julián, J.R.R.; Bielsa, J.I.G.: “Study of the effects on employment of public aid to renewable energy sources”, Universidad Rey Juan Carlos, March 2009.
[5] T.R. Ministry of Development “Turkey's Sustainable Development Report: Claiming the Future” Ankara, June 2012.
[6] The World Bank, http://data.worldbank.org/country/turkey?locale=tr [Retrieved 20.06.2017]. [7] Turkish Statistical Institute, http://www.tuik.gov.tr , [Retrieved 15.06.2017]. [8] Mucuk, M.; Edirnegil, A.; Gerçeker, M.: “The Relationship Between Unemployment Rate and
Economic Growth: The Case of Turkey” Research Journal Of Politics, Economics And Management, V.:5, Iss. :1, pp. 1-8, 2017.
[9] Bölük, G.;Mert, M. : “The renewable energy, growth and environmental Kuznets curve in Turkey: An ARDL approach”, Renewable and Sustainable Energy Reviews, V. 52, pp. 587-595, 2015.

22 ICSD Book of Proceedings (2017), 5, 13-22
Published by ECSDEV, Via dei Fiori, 34, 00172, Rome, Italy http://ecsdev.org
[10] Republic of Turkey Ministry of Energy and Natural Resources, www.enerji.gov.tr. , [Retrieved 15.06.2017].
[11] Turkish Electricity Transmission Company, https://www.teias.gov.tr/, [Retrieved15.06.2017]. [12] Bhattacharya, M.; Paramati, S.R.; Ozturk, I.; Bhattacharya, S.; “The effect of renewable energy
consumption on economic growth: Evidence from top 38 countries”, Applied Energy, V.:162, pp.; 733–741, 2016.
[13] Mercan, H.M.: “TürkiyeEnerjiPiyasasınınGörünümüBaşarılar, GenelBakışveFırsatlar”, Deloitte, Ekim 2016. (in Turkish)
[14] International Renewable Energy Agency-IRENA, “Renewable Energy and Jobs Annual Review 2017” https://www.irena.org/DocumentDownloads/Publications/IRENA_RE_Jobs_Annual_Review_2017.pdf , [Retrieved 01.06.2017].

5th International Conference on Sustainable Development 6-7 September 2017, Rome, Italy
Book of Proceedings 5, 23-34 Doi: 10.14207/5ICSD2017
|1Academic of the fourth year of the Agronomy course at the State University of Western Paraná
(UNIOESTE), Brasil 2Research professor at the Pontifical Catholic University of Paraná and associated with the Group of Studies on Soils and Environment (GESOMA - UNIOESTE). Brasil 3Research Professor in State University of Western Paraná (UNIOESTE) Brasil, and a Research Productivity Scholar by CNPq in the Environmental Sciences 4Graduated in Technology in Environment by the State University of Maringá - UEM and graduated in Environmental Engineering by the Pontifical Catholic University of Paraná – PUCPR and Master in Environmental Sciences (Unioeste)
Modified Cassava Barks as an Adsorbent of Copper Ions
By Elio Conradi Junior1, Daniel Schwantes2, Affonso Celso Gonçalves Jr.3, Andressa Giombelli Rosenberger4
Abstract This research aimed to develop high efficient adsorbents from cassava barks modified with H2O2, H2SO4 and NaOH for Cu(II) removal. The adsorbents were characterized by their chemical elementary composition, point of zero charge (pHPZC), infrared spectrum (FTIR), scanning electron microscopy (SEM), thermogravimetry (TG and DTG), surface area, pore volume and diameter (BET and BJH). Studies evaluating the relation between adsorbents masses (250 to 1250 mg) and pH range (3.60 to 7.00) were also conducted. The characterization demonstrates modifications in the chemical composition, change in pH PZC values (6.02 for M. in natura, 3.98 for M. H2O2, for M. H2SO4 2.05 and 7.07 for M. NaOH) and new functional groups on modified adsorbent surface, such as carboxyl and phenolic groups. The obtained SEM demonstrates materials with heterogeneous structure and with distinct characteristics from biosorbent, demonstrating different aspects in each applied chemical treatment. The highest removal rates were obtained using 5 g of adsorbents per liter of contaminant solution. The adsorption process of Cu(II) was not influenced by evaluated pH ranges. The modification with NaOH provided the best adsorption rates. Results show that, cassava barks, after modified with simple chemical treatment, generate adsorbents with great potential for copper ions removal from water.
1. Introduction
The accelerated growth in the world population has created a significant amount of solid and liquid residues, which has degraded the water bodies (Boas et al., 2012). One of those are the heavy metals, because of their toxicological characteristics, potential accumulation along the food chain and their degradation resistance, causing damage to the environment and the human health (Liu et al., 2014). Copper is a heavy metal widely used in the industrial and agricultural process, besides that, is a trace element, which is essential to the physiological functions of the body, however, it can be toxic to the environment and humans in high concentrations (Fraga, 2005; Barcelos, 2008; Boas et al., 2012). Considering this, the effective removal of these metallic ions, through accessible technologies, becomes fundamental in aquatic environments.

24 ICSD Book of Proceedings (2017), 5, 23-34
Published by ECSDEV, Via dei Fiori, 34, 00172, Rome, Italy http://ecsdev.org
The traditional methods used for the removal of these toxic metals consist of: ionic exchange, chemical precipitation, membrane filtration, electrochemical technologies, solvent extraction and sedimentation (Fu & Wang, 2011; Matouq et al., 2015). On the other hand, the application of these methods requires high costs, furthermore, they exhibit low selectivity and they do not complete the removal of metallic ions in low concentrations (Matouq et al., 2015). Despite the advantages of using biosorbents, the literature already prove the potential of improving the adsorptive capacity of these lignocellulosic materials, through the application of these chemical treatments. In this sense, there is an enormous effort not just to develop new adsorbents, but also to improve the properties of the existing ones (Demirbas, 2008; Schwantes et al., 2016). 2. Material and Methods
Cassava peels were obtained directly from a cassava processing agroindustry in Toledo, PR, Brazil. They were dried at 60°C for 48 h, crushed, and sieved (material retained between 14 and 65 mesh) to standardize particle size. For the accomplishment of the experiments, chemical modifications were made to the raw material (cassava peels) chemical modifications with 0.1 mol L−1solutions of H2O2, H2SO4 e NaOH (Dos Santos et al., 2011; Ngah&Hanafiah, 2008; Argun&Dursun, 2006). Therefore, solutions were prepared in 0.1 mol L−1 of H2O2, H2SO4, and NaOH, to which 70 mL of solution was added in 125 mL erlenmeyer flasks containing 7.0 g of material in natura (M. in natura). The erlenmeyer flasks were placed in a Dubnoff metabolic incubator, at 60°C for 6 h. The modified adsorbents were subsequently washed with distilled water to remove residual reactants still present in the material Fortified mono-elementary solutions with metallic ions Cu(II), were prepared from salts of copper nitrate [Cu(NO3)2 P.A. ≥ 99,0% Sigma-Aldrich]. Solutions were prepared from the mono-elementary solution of 1000 mg L−1, at the desired concentrations for each study, and buffered in pH rates by adding NaOH 0.1 mol L−1HCl and 0.1 mol L−1. 2.1 Characterization of biosorbents
The characterization of the adsorbents was made through nitric perchloric digestion of the adsorbents to determine the concentration of their chemical elements. The adsorbents’ point of zero charge (pHPZC), infrared spectroscopy (FTIR),scanning electron microscopy (SEM), thermal stability of adsorbents (TG/DTG), specific surface area, volume and pore diameter (BET e BJH). The morphological characterization was evaluated by scanning electron microscopy (SEM), with a FEI Quanta 200 microscope at a voltage of 30 kV. The characterization of the infrared spectrum was performed to evaluate the possible functional groups causing the binding with Cu(II) by a Shimadzu Infrared Spectrophotometer FTIR - 8300 Fourier Transform, in the region between 400 to 4000 cm-1, with resolution 4 cm-1. The spectrum was obtained using KBr tablets. According to adapted methodology (Mimura et al., 2010), the definition of point of zero

Conradi et.al. 25
© 2017 The Authors. ECSDEV Compilation © 2017 European Center of Sustainable Development.
charge (pHPZC) refers to the pH rate when the resultant of surface charges of the adsorbent is null. It is carried out by preparing a 0.1 mol L-1KCl solution with pH values of 2.00 to 8.00, by adjusting with 0.1 mol L-1 NaOH and HCl. Subsequently, 0.4 g of each adsorbent are employed in 40 ml of KCl solution, under constant stirring, for 4 hours, with final pH determination. The chemical characterization of adsorbents was performed by nitroperchloric digestion (AOAC, 2005) of adsorbent materials and concentrations of metals, potassium (K), calcium (Ca), magnesium (Mg), copper (Cu), iron (Fe), manganese (Mn), zinc (Zn), cadmium (Cd), lead (Pb), and chromium (Cr) were determined by flame atomic absorption spectrometry (FAAS) (Welz& Sperling, 1999). Thermal analysis was performed on a thermogravimetric analyzer TGA 4000 Perkin Elmer, where the materials were heated to a temperature ranging from 30°C to 900°C,under heating rate of 10ºC min-1, under nitrogen atmosphere. The surface, size and volume were calculated using the standard - Brunauer, Emmett E Teller (BET) and the pore size was obtained using the method Barrett - Joyner-Halenda (BJH). 2.2 Biosorption experiments 2.2.1 Biosorption in function of pH and adsorbent mass
A multivariable study was conducted to evaluate the effect of modified adsorbent mass and pH of mono-elementary solutions.As well as, the influence of the proportion of adsorbent to be tested with the contaminated solutionthe compound center rotational design (CCRD) was employed to determine the influence of each variable and the possible interaction between them, generating an empirical and quadratic mathematical model, which is valid within the experimentally tested range (Barros Neto et al., 2010). Adsorbents’ masses were evaluated between 250 and 1250 mg, while pH ranged between 3.00 and 7.00. In addition, a central quadruplicate was performed in order to verify a reproducibility of the assay. The adsorbent mass and pH of the Cu(II) solution were prepared and in 125 mLErlenmeyer flasks containing the mass of the modified adsorbents and subsequently placed in Dubnoff thermostatic system (25 ºC) with constant agitation at 125 rpm. After performing the sorption process, the samples were filtered and aliquots were removed to determine the concentrations of cooper (Cu) by FAAS (Welz& Sperling, 1999), To determine the amount of metal adsorbed per gram of biosorbent was employed Equation 1.
𝑄𝑒𝑞 = 𝐶0−𝐶𝑒𝑞
𝑚 .𝑉(1)
in which 𝑄eq is the amount of ions adsorbed per 1 g of adsorbent at equilibrium (mg g−1);
𝑚 is the mass of the adsorbent used (g); 𝐶0 is the initial concentration of the ion (mg
L−1); 𝐶eq is the concentration of ion in solution at equilibrium (mg L−1); 𝑉 is the volume of solution used (L). The results of the tests were tabulated and evaluated according to multivariate analysis with Statistica 5.0.

26 ICSD Book of Proceedings (2017), 5, 23-34
Published by ECSDEV, Via dei Fiori, 34, 00172, Rome, Italy http://ecsdev.org
3. Results and Discussion
The Figure 1 illustrate the material M. in natura (biosorbent native of the cassava bark) and chemically modified adsorbents with H2O2, H2SO4 and NaOH.
Figure 1. Biosorbent made with cassava bark and the modified adsorbents.
3.1 Characterization of modified biosobvents
The chemical constitution of the biosorbent used performed by nitric perchloric digestion (AOAC, 2005) and subsequent determination of the metals by EAA/Flame (Welz& Sperling, 1999) are presented in the Table 1. Table1. Medium values of the elements concentrations in the studied absorbents
Absorbent K Ca Mg Cu Zn Mn Fe Cd Pb Cr
---------- g kg-1---------- ----------mg kg-1 ----------
M. in natura(Schwantes et al., 2015) 24.10 35.03 6.83 14.33 32.00 123.33 335.66 <LQ 13.00 <LQ M. H2O2(Schwanteset al., 2016) 7.84 5.68 1.27 10.60 32.20 121.50 333.70 <LQ 10.40 <LQ M. H2SO4(Schwantes et al., 2016) 5.78 3.41 0.43 4.30 20.40 115.70 330.90 <LQ 5.10 <LQ M. NaOH(Schwantes et al., 2016) 11.22 6.52 1.49 4.80 32.60 122.00 331.60 <LQ 11.50 <LQ
LQ (Limits of quantification): K = 0.01; Ca = 0.005; Mg = 0.005; Cu = 0.005; Fe = 0.01; Mn = 0.01; Zn = 0.005; Cd = 0.005; Pb = 0.01; Cr = 0.01 (mg kg-1).
The contents of K, Ca, Mg and Cu, as can be seen in Table 1, are altered in function of the chemical modifications applied to the material in natura. The loss of these metals, occurs because of the chemical alterations that were made, who acted as extractors of this chemical elements present in the biomass in natura and in the subsequent post-modification wash. The H2O2, a powerful oxidant agent, caused some changes in the composition of the modified adsorbent M. H2O2, such as the content reduction of K (67%), Ca (84%), Mg (81%), Cu (26%) and Pb (20%). Already the H2SO4, a powerful dehydrator agent, generate the higher content reduction of K (76%), Ca (90%), Mg (93%), Cu (70%), Zn (36%), Mn (6%), Fe (1%) and Pb (60%). On the other hand, The NaOH, a strong base, highly soluble and known as corrosive, causereduction in case of the elements K (53%), Ca (81%), Mg (78%), Cu (66%), Mn (1%), Fe (1%) and Pb (11%). The point of zero charge (Figure 2), describe the pH variation, in which the balance between positive and negative charges on the material surface is null (Mimura et al., 2010). Marin et al. (2014), highlights how important is to select this variable in

Conradi et.al. 27
© 2017 The Authors. ECSDEV Compilation © 2017 European Center of Sustainable Development.
reference of the application of these materials as adsorbents, seeing that they develop loads in the interface solid-liquid, because of the dissociation or adsorption of ions in solution.
Figure 2. Determination of zero load potential (pHPZC) for the adsorbent bases on cassava barks in naturaand modified (Fonte: Schwantes, et al. 2016).
The results presented indicates the following values of pHPZC: 6.02 for M. in natura (Schwantes et al., 2015), 3.98 for M. H2O2, for M.H2SO4 close to 2.05 and 7.07 for M. NaOH (Schwantes et al., 2016). In this way, the approximation of metallic cations has to be favored for pH values above of the pHPZC, because in this case occurs the predominance of the negative loads on the adsorbent surface (Mimura et al., 2010; Tagliaferro et al., 2011; Casarin, 2014), which at first site, would favored the adsorbent M. H2SO4, which would present larger spectrum, presenting an advantage for the removal of the metals in the aquatic environment, because it would act in higher pH range. In general, the change in pHPZC was expected, since the variation of pHPZC was according to power of alkalinization or acidification of each modifying solution, protonation, deprotonation or hydroxylation of chemical groups of the cassava biomass. This way when the pH >pHPZC, the surface of the adsorbent is electronegative, favoring the adsorption of Cu(II), however, if the pH <pHPZC, the surface of the adsorbent is electropositive, in this state, H+ ions compete with Cu(II), repelling them from lowering the surface adsorption. Besides the physical-chemical properties presented, is of great value the quantification of the superficial groups responsible for desorption process, such as carboxyl, hidroxyl and others, that are capable of metallic ion sorption (Ahalya et al., 2005; Tsai et al., 2006). The FTIR analysis aimed to determine the possible functional groups on the structure after the modifications (Figure 3).
1 2 3 4 5 6 7 8 9 10
-5.0
-4.5
-4.0
-3.5
-3.0
-2.5
-2.0
-1.5
-1.0
-0.5
0.0
0.5
1.0
1.5
2.0
pHi
M. in natura
M. H2O
2
M. H2SO
4
M. NaOH
p
H

28 ICSD Book of Proceedings (2017), 5, 23-34
Published by ECSDEV, Via dei Fiori, 34, 00172, Rome, Italy http://ecsdev.org
Figure3. FTIR for adsorbents based on cassava peels in natura (Schwantes et al., 2015) and modified with H2O2, H2SO4 and NaOH.
In the infra-red spectrum presented on Figure 3, can be observed various bands features of the lignocellulosic materials, such bands are presented and characterized on Table 2. Table2. Main bands in the infrared for adsorbents M. in natura, M. H2O2, M. H2SO4 e M. NaOH on the region from 4000 cm-1 to 550 cm-1
Nº ofbands (cm-1) Vibration
3440 à 3386 O-H Carbohydrates; Oily Acid; Proteins; Ligninsand water1-2-3 2920 à 2926 C-H Alkanes4 1730 à 1743 C=O Carbonyls (aldehyde and ketone) in lignins andcellulose5-6, Carboxylic Groups1 1650 à 1639 C-O Amides and Carboxylic Groups3 1083 à 1025 C-O Functional Groups presentes in the Lignins7-8 1000 à 1300 C-O Phenolic Groups1-8-9
¹ Stuart, 2004; ² Feng et al.2011; ³ Han et al.2010; 4Barbosa, 2007; 5 Horn et al. 2011; 6Pastore et al. 2004; 7 Pascoal Neto et al. 1999; 8Guo et al. 2008; 9Taiz&Zeiger, 2004.
It can be observed on Table 2 the presence of functional groups that are present in macromolecules like lignin, proteins and carbohydrates, such as alcohol, carboxyl groups, phenolic groups, that favored the metal adsorption due to the formation of active sites capable of the adsorption of metallic ions (Pehlivan et al., 2009). However, it should be noted that the infra-red spectrum of the modified materials (M. H2O2, M. H2SO4 e M. NaOH), when overlapped with the material in natura (source material), suggest the occurrence of new aggrupations. The additional bands find on 2855 cm-1, possibly refer to the vibrational elongation of the C-H bands. That is present in aldehydes (Stuart, 2004), on 1161 cm-1, the vibration of C-O present on carboxylic acids (Stuart, 2004) and on 579 cm-1, due to the vibration on
4000 3500 3000 2500 2000 1500 1000 500
Arb
itra
ry u
nits o
f tr
ansm
itta
nce
1730M. in natura
M. NaOH
M. H2SO
4
M. H2O
2
Wavenumbers (cm-1)
3392
2920
28551743
16391387
1161
579
1025
3398
2926
2855 17361643 1019
10831161
1394 579
3386
2920 2855
1743
1639 10251161
1419
579
3440
2920 16501650
1420
1030781

Conradi et.al. 29
© 2017 The Authors. ECSDEV Compilation © 2017 European Center of Sustainable Development.
S-S bands of amino acids such as cysteine [SCH2CH(NH2)CO2H)2], lipoid acids (C8H14O2S2) and others, as product of the secondary vegetal metabolism (Taiz&Zeiger, 2004; Pereira & Cardoso, 2012). Furthermore, the results obtained with the infra-red spectrum corroborate the hypothesis in which the solutions of H2O2, H2SO4 and NaOH where effective in the modifications of the cassava barks, forming or exposing functional aggrupations, that can be favored in the adsorption process. In order to verified the difference in the material morphology after the chemical alterations, are presented in the Figure 4, the scanning electron micrographs of the modified biosorbent and in natura.
Figure 4. Scanning electron microscopes for adsorbents M. in natura (a) (Schwantes et al., 2015), M. H2O2 (b), M. H2SO4 (c) e M. NaOH (d).
According to Schwantes et al. (2015), the micrographs observed on Figure 4 (a) present a surface of spongy and fibrous appearance, with irregular structure, heterogeneous andwith little spheres possibly indicating the presence of residual starch granules of the source material. These characteristics, as stated by the author, can be beneficial to the adsorbent process. On Figure 4 (b), (c) and (d), respectively, it is noted that the modified adsorbent maintain its original characteristics derived of the biomass in natura, presenting structure which resemble the cells of the source vegetal. In the modification with H2O2, it present a heterogeneous material surface as the others, however, it can be observed a scale like surface. Instead on the other modifications the biosorbent M. H2SO2 present a plane structure, more heterogeneous than the others, with little prominent lamellae. The adsorbent M. NaOH already presents irregular

30 ICSD Book of Proceedings (2017), 5, 23-34
Published by ECSDEV, Via dei Fiori, 34, 00172, Rome, Italy http://ecsdev.org
structure, heterogeneous aspect, and with fissures along its structure. In terms of the thermic stability, for the M. H2O2 adsorbent (Figure 4), it can be observed four events, being the first one derive of the water loss and other volatile compounds on 79oC, with loss of 6% in the adsorbent material mass. In according with the illustration, on 210 oC begins the decomposition of the organic compounds constituents of the cassava bark (loss of the 39% of the adsorbent mass), such as lignin, cellulose and hemicellulose. Also, it can be observed in a third and fourth event, on 378 and 437 oC, where it is believed that the final degradation of the lignocellulosic matrices occurs as the rest of the compound ashes that weren’t incinerated, resulting in a loss close to 69% of the mass (Tserki et al., 2005). For the M. H2SO4 adsorbent (Figure 4), it is perceived the loss of water and other volatile compounds on 82oC, resulting in a loss of 7% of the total mass. With temperature gradual elevation until it reaches 341oC, a good part of the organic compounds constituents of the adsorbent are incinerated, such as cellulose, lignin and hemicellulose, resulting on a loss of 45% of the adsorbent mass. With the increase in temperature up to 485oC, occurs the incineration of other compounds, like the rest of the lignocellulosic matrix, ensuing a loss of 75% of the mass (Tserki et al., 2005). For the M. NaOH, it can be observed already at 77oC the loss of water and volatile compounds, with mass loss of 4%. From this point forward until 331oC where it occurs the incineration of the volatile compounds, like cellulose, hemicellulose and lignin (35% of the mass), leaving just the non-volatile inorganic material in temperatures above of 426oC, with mass loss in function of the volatilization of the lignocellulosic matrix (mass loss of 62%) (Penha et al., 2016).

Conradi et.al. 31
© 2017 The Authors. ECSDEV Compilation © 2017 European Center of Sustainable Development.
Figure 4. Curves of TG and DTG for thes adsorbents based on cassava peel and chemically modified (M. H2O2, M. H2SO4 e M. NaOH).
Generally, the thermogravimetric profiles presented are similar to each other and similar to the cellulose and other lignocellulosic profiles reported in the literature, both in number of events and in temperature ranges observed. (Penhas et al., 2016). The specific superficial area (ASE) of the modified adsorbents is, in general, small (Table 3). Among the values obtained we highlight the adsorbent M. H2O2, which presents the highest values for ASE (0.91 m2 g-1), follow by M. NaOH (0.70 m2 g-1) and M. H2SO4 (0.46 m2 g-
1). The superficial area of the modified cassava adsorbent is small when compare to the values obtained for activated carbon of coffee husks (130 a 391 m2 g-1) (Pereira, 2010). It is more similar to other biosorbents of low costs, such as rice husk (Chockalingam& Subramanian, 2006) which obtained 0.68 m2 g-1, or yet, Oliveira et al. (2005), who obtained 0.46 m2 g-1 for rice bran, or Penha et al. (2016) who even by chemically treating the rice husk. These autorsdid not obtain values higher than 1.13 m2 g-1, with average pore volume of 1.94 e 3 cm3g-1 and average pore diameter of 6.9 nm, which means predominance of mesopores. Table3. Textural data of modified cassava bark adsorbents
Parameters M. H2O2 M. H2SO4 M. NaOH
Surface area (m2 g-1) 0.9156 0.4637 0.7017 Pore volume (cm3 g-1) 0.00307 0.00179 0.00146 Pore diameter (nm) 1.734 3.295 1.924
The pore volumes obtained in this research (0.0031 e 0.0018 cm3 g-1 para M. H2O2 and M. NaOH), are similar to the ones obtained by Penha et al., (2016) with modified rice husks (0,0019 cm3 g-1). According Pereira (2012), pores with diameter between 2.0 and 50.0 nm are considered mesopores, therefore, the modified cassava adsorbents is predominant in micropores, and on lesser degree, mesopores (Table 3). Although the low surface area and the low pore volume, which, at first, suggests disadvantaging the adsorption process, this is not the only determining condition of an adsorbent with high remediation capacity.It is noteworthy that, the modified adsorbent characteristics put on evidence that the modification process proposed was effective on the alteration of the cassava adsorbent. The results referring to the characterizations carried out in adsorbents (chemical composition pHPZC, FTIR, MEV, TG/DTG and BET) showed great interest, because they presented how the simplest wash of vegetal biomass with chemical agents, and adition of energy to the system (the modification occurs at 60 ºC), were capable of provoking the modification on the cassava biomass. Rocker (2015) explains, that chemical modifications on biomasses have the goal of increase the adsorption capacity of the biosorbents. 3.2 Biosorption as a function of the pH of the medium and the adsorbent mass
The results illustrated on the Table 4 and Figure 5 demonstrated that, the

32 ICSD Book of Proceedings (2017), 5, 23-34
Published by ECSDEV, Via dei Fiori, 34, 00172, Rome, Italy http://ecsdev.org
efficiency of the Cu(II) removal, is intimately dependent of the quantity of adsorbent in the medium (adsorbent/adsorbed proportion). However, it is observed that the studies pH range (3.00 to 7.00) did not affected the Cu(II) removal on the liquid. Table4. Mean squares and ANOVA summary for CCRD for the relationship between the adsorbent / adsorbate mass ratio and the pH range of the Cu(II) solution
Fonts of variation Degrees of freedom Cu(II)
H2O2 H2SO4 NaOH
Mass (L) 1 1.055719 ** 1.367221 ** 1.662922 ** Mass (Q) 1 0.221361 ** 0.250762 ** 0.426612 ** pH (L) 1 0.000533ns 0.004857ns 0.00303ns pH (Q) 1 0.003123ns 0.001535ns 0.008582ns
MassversuspH 1 0.00094ns 0.000785ns 0.003454ns
Resíduo 6 0.005132 0.004301 0.029448 Total 11
**: Significant at the level of 1% of probability; ns: not statistically significant.
Figure 5. Response surfaces obtained by adsorption of Cu(II) by modified adsorbents from cassava barks, in function of adsorbent mass and pH range. M. H2O2 z = 1.72306 – 0.003105457x + 0.000001487x2 + 0.138972966y – 0.011028440y2 – 0.000030569xy R2: 97.6% M. H2SO4 z = 1.89783 – 0.003404010x + 0.000001583x2 + 0.115646845y – 0.007730795y2 – 0.000027923xy R2: 98.4% M. NaOH z = 2.54097 – 0.004679403x + 0.000002065x2 + 0.125137216y – 0.018281755y2 + 0.000058585xy R2: 92.2%
The resulted surfaces presented in Figure 5, along with the ANOVA (Table 4), confirmed that the Cu(II) adsorption process didnot varied with the pH range tested. Nevertheless, it is observed that the highest adsorption rates for this metal occurs when the adsorbent mass is close to 200 mg, which means, 5 g of adsorbent per litter of polluted solution with Cu(II). It can be seen on the Figure 5, how the smaller adsorbent masses used presented the highest removal efficiency, which is an excellent result, because it demonstrated how the highest adsorption rates occurs with 5g of adsorbent per litter of polluted solution with Cu(II), the decontamination occurs with very low adsorbent material usage per volume of polluted solution. Among the modified adsorbents, stands out the M. NaOH, with 2.0 mg Cu(II) per gram of adsorbent, follow by M. H2SO4, with1.7 mg g-1 and M. H2O2 with 1.6 mg g-1. 4. Conclusion

Conradi et.al. 33
© 2017 The Authors. ECSDEV Compilation © 2017 European Center of Sustainable Development.
From the physical and chemical characterizations performed to the studied
adsorbents, it is observed that the occurrence of modifications of the cassava barks in natura. The micrographs indicates modifications on the material surface, the infra-red spectrum demonstrated the occurrence of functional aggrupations on the modified materials, also how it were found different values for the pHPZC materials. The results demonstrated how the Cu(II) adsorption using modified biosorbents of cassava is very efficient with excellent ratio use of adsorbent mass/contaminant solution, with the use of 5 g of adsorbent per litter of solution with Cu(II). Among the modified adsorbents, stands out the modification with NaOH, higher than the others by 17 to 25%. Finally, the use of modified adsorbents, native of the agro-industrial process, it can become a viable solution, because beyond putting value to a solid waste that is commonly discarded, comes up as a new alternative way of adsorbent production, making the process of water treatment less onerous. References Ahalya, N., Kanamadi, R. D., & Ramachandra, T. V. (2005). Biosorption of chromium (VI) from aqueous
solutions by the husk of Bengal gram (Cicerarientinum). Electronic Journal of Biotechnology, 8(3), 0-0. Argun, M. E., & Dursun, S. (2006). Removal of heavy metal ions using chemically modified
adsorbents. Journal of International Environmental Application & Science, 1(1-2), 27-40. Barbosa, L. C. D. A. (2007). Espectroscopia no infravermelho na caracterização de compostos
orgânicos. Viçosa: UFV, 189. Barros Neto, B., Scarminio, I. S., & Bruns, R. E. (2010). Como Fazer Experimentos: Pesquisa e Desenvolvimento na
Ciência e na Indústria. Bookman Editora. Barcelos, T. D. J. (2008). Cobre: Vital ou prejudicial para a saúde humana (Doctoral dissertation, Dissertação).
Covilhã, Universidade da Beira Interior). Boas, N. V., Casarin, J., Caetano, J., Gonçalves Júnior, A. C., Tarley, C. R., & Dragunski, D. C. (2012).
Biossorção de cobre utilizando-se o mesocarpo e o endocarpo da macadâmia natural e quimicamente tratados. Revista Brasilieira de Engenharia Agrícolae Ambiental, 16(12), 1359-1366.
Casarin, J. (2014). Adsorção de íons metálicos utilizando a casca da semente de castanha do Brasil (Bertholletia excelsa H.B.K)como biossorvente.Dissertação (Mestrado) - Curso de Programa de Pós Graduação em Agronomia, 150 f.
Chockalingam, E., & Subramanian, S. (2006). Studies on removal of metal ions and sulphate reduction using rice husk and Desulfotomaculum nigrificans with reference to remediation of acid mine drainage. Chemosphere, 62(5), 699-708.
Demirbas, A. (2008). Heavy metal adsorption onto agro-based waste materials: a review. Journal of hazardousmaterials, 157(2), 220-229.
Dos Santos, V. C., De Souza, J. V., Tarley, C. R., Caetano, J., & Dragunski, D. C. (2011). Copper ions adsorption from aqueous medium using the biosorbent sugarcane bagasse in natura and chemically modified. Water, Air, & Soil Pollution, 216(1-4), 351-359.
Feng, N., Guo, X., Liang, S., Zhu, Y., & Liu, J. (2011).Biosorption of heavy metals from aqueous solutions by chemically modified orange peel. Journal of Hazardous Materials, 185(1), 49-54.
Fraga, C. G. (2005). Relevance, essentiality and toxicity of trace elements in human health. Molecular aspects of medicine, v. 26, n. 4, p. 235-244.
Fu, F., & Wang, Q. (2011). Removal of heavy metal ions from wastewaters: a review. Journal of environmental management, v. 92, n. 3, p. 407-418.
Guo, X., Zhang, S., & Shan, X. Q. (2008). Adsorption of metal ions on lignin. Journal of hazardous materials, 151(1), 134-142.

34 ICSD Book of Proceedings (2017), 5, 23-34
Published by ECSDEV, Via dei Fiori, 34, 00172, Rome, Italy http://ecsdev.org
Han, R., Zhang, L., Song, C., Zhang, M., Zhu, H., & Zhang, L. (2010). Characterization of modified wheat straw, kinetic and equilibrium study about copper ion and methylene blue adsorption in batch mode. Carbohydrate Polymers, 79(4), 1140-1149.
Horn, M. M., Martins, V. C., & Plepis, A. M. (2011). Effects of starch gelatinization and oxidation on the rheological behavior of chitosan/starch blends. Polymer international, 60(6), 920-923.
In, A. O. A. C. (2005). Latimer JW, Horwitz W, editors. Official methods of analysis. Liu, G., Yu, Y.,Hou, J., Xue, W., Liu, X., Liu, Y., Wang, W., Alsaedi, A., Hayat, T., & Liu, Z. (2014). An
ecological risk assessment of heavy metal pollution of the agricultural ecosystem near a lead-acid battery factory. Ecological Indicators, 47, 210-218.
Marin, P., Borba, C. E., Módenes, A. N., Oliveira, S. P. D. D., Figueiredo, L. S., & Passaia, N. (2014). Avaliação do efeito da temperatura, ph e granulometria do adsorvente na adsorção do corante azul reativo 5g. Engevista, 17(1), 59-68.
Matouq, M., Jildeh, N., Qtaishat, M., Hindiyeh, M., & Al Syouf, M. Q. (2015). The adsorption kinetics and modeling for heavy metals removal from wastewater by Moringa pods. Journal of Environmental Chemical Engineering, 3(2), 775-784.
Mimura, A. M. S., Vieira, T. D. A., Martelli, P. B., & Gorgulho, H. D. F. (2010). Aplicação da casca de arroz na adsorção dos íons Cu2+, Al3+, Ni2+ e Zn2+. Química Nova, 33(6), 1279-1284.
Neto, C. P., Rocha, J., Gil, A., Cordeiro, N., Esculcas, A. P., Rocha, S., Delgadillo, I., de Jesus, J. D.,& Correia, A. F. (1995). 13C solid-state nuclear magnetic resonance and Fourier transform infrared studies of the thermal decomposition of cork. Solid state nuclear magnetic resonance, 4(3), 143-151.
Ngah, W. W., & Hanafiah, M. A. K. M. (2008). Removal of heavy metal ions from wastewater by chemically modified plant wastes as adsorbents: a review. Bioresource technology, 99(10), 3935-3948.
Pastore, T. C., Santos, K. O., & Rubim, J. C. (2004). A spectrocolorimetric study on the effect of ultraviolet irradiation of four tropical hardwoods. Bioresource Technology, 93(1), 37-42.
Pehlivan, E., Altun, T., Cetin, S., & Bhanger, M. I. (2009). Lead sorption by waste biomass of hazelnut and almond shell. Journal of hazardous materials, 167(1), 1203-1208.
Penha, R. S., Santos, C. C., Cardoso, J. J., Silva, H. A., Santana, S. A., & Bezerra, C. W. B. (2016). Casca de arroz Quimicamente Tratada como Adsorvente de Baixo Custo para a Remoção de Íons Metálicos (Co2+ and Ni2+). Revista Virtual de Química, 8(3), 588-604.
Pereira, R. J., & das Graças Cardoso, M. (2012). Metabólitos secundários vegetais e benefícios antioxidantes. Journal of Biotechnology and Biodiversity, 3(4).
Rocker, C. (2015) Adsorção de íons cromo de solução aquosa sintética e efluente de curtume utilizando macrófitas aquáticas.
Schwantes, D., Gonçalves Jr, A. C., Miola, A. J., Coelho, G. F., Dos Santos, M. G., & Leismann, E. A. V. (2015). Removal of Cu(II) and Zn(II) from water with natural adsorbents from cassava agroindustry residues. ActaScientiarum.Technology, 37(3), 409.
Schwantes, D., Gonçalves, A. C., Coelho, G. F., Campagnolo, M. A., Dragunski, D. C., Tarley, C. R. T., Miola, A. J., &Leismann, E. A. V. (2016). Chemical Modifications of Cassava Peel as Adsorbent Material for Metals Ions from Wastewater. Journal of Chemistry, 2016.
Sharma, P., Kumari, P., Srivastava, M. M., & Srivastava, S. (2006). Removal of cadmium from aqueous system by shelled Moringaoleifera Lam. seed powder. Bioresource technology, 97(2), 299-305.
Stuart, B. H. (2004). Biological applications. Infrared spectroscopy: fundamentals and applications, 137-165. Tagliaferro, G. V., Pereira, P. H. F., Rodrigues, L. Á., & Silva, M. L. C. P. D. (2011). Cadmium, lead and
silver adsorptio in hydrous niobium oxide prepared by homogeneous solution method. Química Nova, 34(1), 101-105.
Taiz, L. & Zieger, E.(2004).Fisiologia Vegetal, ed. Porto Alegre, Artmed, p.719. Tsai, W. T., Yang, J. M., Lai, C. W., Cheng, Y. H., Lin, C. C., & Yeh, C. W. (2006). Characterization and
adsorption properties of eggshells and eggshell membrane. Bioresource technology, 97(3), 488-493. Tserki, V., Matzinos, P., Kokkou, S., & Panayiotou, C. (2005). Novel biodegradable composites based on
treated lignocellulosic waste flour as filler. Part I. Surface chemical modification and characterization of waste flour. Composites Part A: Applied Science and Manufacturing, 36(7), 965-974.
Welz, B., & Sperling, M. (1999). The techniques of atomic absorption spectrometry. Atomic Absorption Spectrometry, Third Edition, 335-475.

5th International Conference on Sustainable Development 6-7 September 2017, Rome, Italy
Book of Proceedings 5, 35-40 Doi: 10.14207/5ICSD2017
|1D
Drug Situation in Albania
By Klotilda Muca1
Abstract In the framework of implementation of the legislative reform, Republic of Albania has adopted and implemented a complete and contemporary national legislation in compliance with the international conventions that is summarized in the Law No. 7895 of 27 January 1995“On the Penal Code of the Republic of Albania”, amended by Laws No. 8279 of 15.01.1998; No. 8733, of 24.01.2001; No. 9275, of 16.09.2004. Other laws cover different aspects of drug control. The importance of drug prevention in Albania has been reflected by the endorsement of National Strategy Against Drugs 2004–2010 approved by the Decision of the Council of the Ministers No. 292 of 7 May 2004. The strategy was comprehensive and covered both the drug demand reduction and drug supply reduction. The strategy recognized the serious nature of the drug problem at national and international level and admitted that the success might be achieved only by coordinating the efforts of all acting parts, namely the government, civil society and international partners. That first National Drug Strategy was implemented over the period 2004–2010. The number of drug seizures and arrests increased, however, drug related crimes remained a serious problem in the year 2014. The fight against drugs remains one of the main priorities of the Albanian Law Enforcement Agencies. In 2014 drug related crimes remained a serious problem for Albania. The country continued to be both a country of origin (for cannabis and its derivates) and a transit route (for hard drugs). In 2014, however, the number of drug seizures and arrests increased dramatically. In the vicinity of the Southern village of Lazarat, Cannabis had been cultivated at a large scale until the summer of 2014, when massive and successful police operations were conducted to eliminate these activities. A common platform for the execution of proactive investigations has been developed in the framework of implementation of the cooperation agreement between the Prosecutor General, the Ministry of Interior and the State Intelligence Service (SHISH). However, the SHISH and its head, appointed during the term of the previous government, have been widely criticized by the recent government for their lack of cooperation with the police.
Keywords: Drug policy, Drug related crime, Criminal Justice, Prision, Legislative Reform, Penal Code, Penal sanctions, principles of lawfulness, penal-prosecuted, illegal drugs
1. Drug Policy: Legislation, Strategies and Economic Analysis
According to the Albanian State Police, a total number of 1,116 drug cases were registered during 2012 and 1,387 offenders were penal-prosecuted. These represent 5.3 % of the total number of all law offences (20,668) and 6.5 % of the total number of law offenders (21,028). While in 2011 drug cases (742) represented 4.2 % of all law offences (17,646) and drug offenders (1041) represented 5.8 % of the total no of law offenders (17,773). During 2012 there was an increase in the overall drug offences (+50.4 %) but also in the number of drug offenders (+33.2 %)and arrested ones (+19%) compared to 2011. Cannabis is the only narcotic drug cultivated in Albania. During 1993-2000, cultivation of cannabis was an issue of concern almost in the entire territory of the

36 ICSD Book of Proceedings (2017), 5, 35-40
Published by ECSDEV, Via dei Fiori, 34, 00172, Rome, Italy http://ecsdev.org
country, while recently is localised only in a few areas of the Country. Each year, the Ministry of Interior implements a special action plan for the fight against cannabis cultivation. The Action Plan No.41, date 29.03.2012 “On the prevention and fight against cultivation of cannabis” was approved and implemented during 2012. This plan was based on best practices of cooperation and coordination with the other governmental institutions, stake-holders, NGOs, international police assistance missions accredited to the Albanian State Police, international organisations, local government structures and the community. In the framework of the collaboration with Italian Inter-Force Police Mission in Albania, the Cooperation Protocol dated 16.06.2012 was draft and signed between General Directorate of ASP and Italian Ministry of Interior, where there were defined and planned joint tasks such as aerial monitoring of Albanian terrain by using Italian aircrafts equipped with high tech devices for discovering cannabis plants. The action plan “On the prevention and fight against cultivation of cannabis” was implemented in two phases, the prevention and rising the awareness phase and the operational phase. Articles 283-286/a of the Penal Code define serious sanctions for persons committing drug related crimes: 5-10 years imprisonment for production, selling, distribution and possession of drugs, and 7-15 years for trafficking. These sanctions are more severe if offences were committed in cooperation or by criminal organizations. Penal sanctions are defined for illicit cultivation of narcotic plants (3-7 years of imprisonment) and trafficking or derivation of precursors (3-7 years of imprisonment). Possession of a “day dosage” of drugs for personal use is not punishable. Very often the quantity of the drug seized can influence the judge in deciding between the minimum and maximum punishment for the offence. The main competences of the state police are: Informational activity, implying collection (secret collaboration, observation of persons and premises, tracking devices, interception etc) arrangement, assessment, analysis, distribution and use of information in order to protect public order and security, or to prevent and detection criminal offences; Inviting citizens to appear in the police to obtain necessary information; Control of identity of persons; Check on persons, luggage, vehicles; Control of premises and buildings in flagrant situation or based on court decision; Detention or flagrant arrest of person who has committed criminal offence; Provision of sources of evidence and blocking of material things and evidence; Apprehension of wanted persons; Conduction of investigative actions ex officioor delegated by the prosecutor; Conduction of secret operations upon approval of the prosecutor; Conduction of “controlled delivery” upon authorization of the prosecutor. The main National Anti-Drug Principles derive from the Constitution of the Republic of Albania, the UN Conventions, international and national legislation in this domain and from the objectives Albanian society has to meet in its membership process to EU. These main principles are: (1) principles of lawfulness; (2) principle of respecting human rights and fundamental freedoms; (3) principle of life certainty, safety and health of individuals and communities; (4) principle of implementation of an integrated and balanced approach, based on responsibilities and partnerships.

W. Nawaz, M. Koҫ 37
© 2017 The Authors. ECSDEV Compilation © 2017 European Center of Sustainable Development.
2. Universal Prevention
School At national level the prevention activities are organized by: Ministry of Health (Institute of Public Health), Ministry of Culture, Tourism, Youth and Sport, Ministry of Education and Science, etc. International agencies such as UNICEF, UNFPA, UNODC, WHO, UNAIDS, etc. The regional education departments, schools, regional public health departments, and somehow local authorities, branches of NGOs operating at national level have been involved in prevention activities on drug and alcohol. Of over one year (2010 and after), in secondary schools in Albania has been introduced a new program, part of compulsory basic curriculum, called “life skills and skills for career”. This program includes a special chapter on education on drugs and alcohol. Among other things, the program also includes practical skills, such as stress management, social skills, emotional communication, skills to cope with change, etc. The program is conducted by biology teachers and school psychologists. Also, some basic knowledge on substance abuse is given to pupils in basic education system (9 years) as part of biology and health education matters.
Community UNICEF has also worked at the local level, by piloting the establishment of a drug prevention resource center at Municipality of Tirana. The social workers of Tirana municipality are skilled to support families of adolescents and young people that are at risk of HIV infection. The center is within the municipal social services department and acts as a referral gate to wider social support for young people and adolescents injecting drugs and their families. The center also offers information and training to school doctors, school counsellors and social administrators in the other communes. This pioneer work aims at establishing the basis for a better coordination with other sectors, such as the State Social Services, the Ministry of Education and Science, and the Ministry of Interior. 3. Drug Related Crime
According to the Albanian State Police, a total number of 1,116 drug cases were registered during 2012 and 1,387 offenders were penal-prosecuted. These represent 5.3 % of the total number of all law offences (20,668) and 6.5 % of the total number of law offenders (21,028). While in 2011 drug cases (742) represented 4.2 % of all law offences (17,646) and drug offenders (1041) represented 5.8 % of the total no of law offenders (17,773). During 2012 there was an increase in the overall drug offences (+50.4 %) but also in the number of drug offenders (+33.2 %)and arrested ones (+19%) compared to 2011.

38 ICSD Book of Proceedings (2017), 5, 35-40
Published by ECSDEV, Via dei Fiori, 34, 00172, Rome, Italy http://ecsdev.org
Most of the drug cases during 2012 (444 or 39.7 %) were registered in the Capital, Tirana District (TR). Also the number of drug offenders is higher in the Capital (313 or 39.1 %). The differences in the number of drug offences and drug offenders in the 12 Regions (or Prefectures) of Albania are shown in detail in the Figure. 3.1 Interventions in the Criminal Justice System
Until May 2009, Albania lacked a special institution responsible for implementation of punishments, alternative to prison. The Probation Service is organised based on a Council of Ministers Decree No.302, date25.03.2009, while recent changes in Penal Code allowed for two alternative measures such as „half-freedom‟ and „home isolation‟. This institution, which operates under Ministry of Justice, has started to function in June 2009. The Service gives to the offenders the opportunity to start earlier the process of rehabilitation and integration in the community and on the other hand it controls and surveys the offenders. It has already started the collaboration with social local and welfare services to enhance and increase the inclusion in community. It works closely with NGOs as well. Minister of Justice has approved a detailed document (No.6325, date 31.07.2009) which regulates relations and collaboration with NGOs. In the field of alternative sentences related to drug crimes Probation Service is collaborating with specialized organisations such as Action Plus and a network for the implementation of the alternative sentence. The object of this collaboration is: psychological and social support, counseling and training through tailored therapy and care programs, coaching for social reintegration and fulfillment of social needs. Other programs include methadone therapy and prevention of drug use. Until now a number of seminars and workshops are carried out in several cities. Cities where the project is being implemented are Tirana, Fier, Durres, and Shkoder.

W. Nawaz, M. Koҫ 39
© 2017 The Authors. ECSDEV Compilation © 2017 European Center of Sustainable Development.
4. Responses to Drug-Related Health Issues in Prisons
Here I present an observation of the epidemiologic structure of persons sent by legal structures and prisons, accused of illegal substance possession at the Addictology and Clinical Toxicology Service (TUHC) with the goal of conducting an expertise to reach conclusions if the doses found on these persons are small doses kept for personal daily use or not. This study includes the period 2006–2012 and consists of a number of 118 persons, all males. Around 90% of detained persons had never any contact with the aforementioned TUHC Service, that is, there was the first time appearing, and none of them was treated by this Service relating to drug problems. Detained persons belong to 12 different country regions, where Elbasan and Durres result to be the regions with the highest percentages (42.4 % and 31.3 % respectively) of the total of the detainees.

40 ICSD Book of Proceedings (2017), 5, 35-40
Published by ECSDEV, Via dei Fiori, 34, 00172, Rome, Italy http://ecsdev.org
5. Results
The number of drug seizures and arrests increased, however, drug related crimes remained a serious problem in the year 2017. The fight against drugs remains one of the main priorities of the Albanian Law Enforcement Agencies. Albania continuously implements the National Strategy Against Drugs 2012-2016 which is based on the four pillars of strategic cooperation, supply, demand and harm reduction. The fight against drugs remains one of the main priorities of the Albanian Law Enforcement Agencies. Continuing the trend of 2013, Albania achieved tangible results fighting illegal drugs in 2014. Both the volume of drug seizures and arrests remained high. The quantity of marihuana seized in 2014(101,7 tons) exceeded the total quantity seized during the previous 9 years (96 tons). Cannabis seeds seized in 2014 made up a total of 530 thousand, thus exceeding the total quantity seized in the preceding 6 years. Furthermore, 530.177 marihuana plants were destroyed in Albania last year. The Council of Ministers approved the National Strategy Against Drugs 2012-2016 with the Council of Ministers Decision No 403, dated 20.06.2012 (Official Gazette No 85 dated 24.07.2012, page 4299). The Strategy ensures a balanced approach to drug supply and demand reduction aspects. The Strategy, which is fully in line with the EU Strategy for Drugs 2005-2012 and the Action Plan for Drugs 2009-2012 between EU and Western Balkan Countries, is based on four main pillars: strategic coordination, supply reduction, demand reduction, harm reduction. The country continued to be both a country of origin (for cannabis and its derivates) and a transit route (for hard drugs). According to the Albanian Police, in 2014 the production and trafficking of marijuana was the number one problem. Cannabis had been cultivated in various parts of the country, mostly in remote, hidden places. In the vicinity of the Southern Albanian village of Lazarat, however, cannabis had been cultivated at large scale on public and private properties throughout the whole territory of the village. The annual production of marihuana in Lazarat had been estimated up to 800 metric tons (the total quantity of seized marijuana in 2013 was 20,7 tons). Market-ready marihuana had been trafficked to Western European countries via neighboring countries (mainly Greece and Italy but also Kosovo, Macedonia, etc. References Council of Europe (1996). “Seminar on Information Systems and Applied Epidemiology of Drug Misuse for
Albanian Experts (Tirana, Hotel Rogner “Europapark” 18-20 December, 1995)”. Pompidou Group, 5 January, P-PG (96)
Institute of Public Health (2006). “Youth Risky Behavior Survey, 2005”. Institute of Public Health Report, Tirana, February 2006.
Institute of Public Health and ISOP (2008). “2008 Albania Behavioural and Biological Surveillance Study (Bio-BSS) Report; second round”. ISOP, Tirana, 2008. Institute of Public Health (2009). “Youth Risky Behaviour Survey, second round, 2009”. Institute of Public Health Report, Tirana, September 2009. ]
Institute of Public Health (2011). “2011 Albania Behavioural and Biological Surveillance Study (Bio-BSS) Report; third round”. Institute of Public Health, Tirana, 2011.

5th International Conference on Sustainable Development 6-7 September 2017, Rome, Italy
Book of Proceedings 5, 41-54 Doi: 10.14207/5ICSD2017
|1Student of the Agronomic Engineering curse at the State University of Western Paraná (UNIOESTE),
Brasil 2Research professor at the Pontifical Catholic University of Paraná and associated with the Group of Studies on Soils and Environment (GESOMA - UNIOESTE). Brasil 3Research Professor in State University of Western Paraná (UNIOESTE) Brasil, and a Research Productivity Scholar by CNPq in the Environmental Sciences 4Professor at the Technical University of Lisbon (UTL) in Portugal since 1993
Cadmium Removal from Water Using Modified Grape Stem
By Juliano Zimmermann1, Daniel Schwantes2, Affonso Celso Gonçalves Jr.3, Amarilis Paula Alberti de Varennes e Mendonça4
Abstract The research’s aim was to increase the adsorption capacity of Cd(II) by chemical modifications on grape stems. The stems were milled and sieved to result in natural adsorbent (E. in natura) which was used to develop the modified adsorbents (E. H2O2, E. H2SO4 and E. NaOH). Firstly, was performed the adsorbents characterization by the determination of its elementary constituents, pHPZC, FTIR, thermogravimetry (TG and DTG) and SEM. In a second step, adsorption tests were developed aiming to determinate the influence of the proportion of adsorbent/adsorbate, as well the pH influence for Cd(II) removal. The FTIR shows peaks in modified adsorbents, suggesting new functional groups acting in metal sorption, like carboxyl and phenolic groups. The results concluded that studied pH range did not have significance influence in adsorptive process, what demonstrate that developed adsorbents present efficient removal of Cd(II) in pH ranges from 3.60 to 7.00. The highest adsorption rates were obtained with 250 mg of adsorbent. Modified adsorbents presented increase in Cd(II) sorption rates, with 66% for E. NaOH, 33% for E. H2O2 and 8.3% for E. H2SO4. The use of grape stem as modified adsorbent is an attractive alternative, mainly because its wastes present great availability in many countries.
1. Introduction
One of the major issues related to environmental problems is the preservation of freshwater in quantity and quality for current and future human consumption. The surface and underground water resources may suffer, to a higher or lesser degree, contaminations by the most diverse pollutants (Assis & Muratori, 2007). Several techniques are used to remediation of contaminated water; however, these techniques do not always present economic viability. Among the conventional methods the most used for the treatment of effluents are chemical precipitation, oxidation or reduction, filtration, coagulation, electrochemical treatment, membrane separation processes and solid phase extraction. Some of these are restricted due to technical or economic unfeasibility, especially when referring to the removal of metals, since these are usually present in large volumes of water and in relatively low concentrations (Gadd, 2009). Among these toxic metals, cadmium (Cd) deserves attention because of its high toxicity.

42 ICSD Book of Proceedings (2017), 5, 41-54
Published by ECSDEV, Via dei Fiori, 34, 00172, Rome, Italy http://ecsdev.org
One of the main problems associated with Cd is its final destination in the food chain, as it can reach the soil or the air, by burning municipal waste or burning fossil fuels, thus polluting the environment and causing damage to the ecosystem (Pino, 2005). The problems caused by the Cd are not limited to the environmental area, causing irreparable damage to human health and may even lead to death. Inhalation of this heavy metal may cause problems in respiratory tract and kidneys, leading to death; in case of oral intoxication, when a significant amount of Cd is ingested, may occur an immediate poisoning and damage to the liver and kidneys; already in contact poisoning, genetic alterations may occur (Brady & Humiston, 1986). One of the most promising techniques in the removal of toxic metals from water is by means the use of natural adsorbents. According to Gonçalves Jr et al. (2016), to the detriment of conventional water treatments, the use of biomass as adsorbents presents advantages, due to its ability to accumulate contaminants, to withstand several cycles of sorption and desorption, and also because they require little processing and are abundant in natura, being considered of this form materials of low cost. The adsorption is the result of the electrostatic interaction and the formation of complexes between metallic ions and functional groups present in the adsorbents, when they have chemical affinity for the adsorbate. Due to this, studies report the use of chemical modifications, whose purpose to introduce functional groups into the structure of these adsorbents, or to increase their porosity and adsorption capacity (Dos Santos et al., 2010; Dos Santos et al., 2011). The grape products’ industries generates a large amount of waste, among them the bark, the seeds, the stems and in smaller quantities of residues, the fruit pulp. This whole grape production has different purposes, either for consumption in natura, or production of juices and wines. This agro-industrial complex, as mentioned previously, produces a large volume of residues, such as grape stems, fruit seeds, fruit peels, among others. It should be noted that a large part of the stem and other residues of wine origin do not have an adequate destination. Therefore, it is of great importance that these by-products be studied so that new uses are given to these agro-industrial wastes, aiming at complementing the grape production chain. In this way, the objective of the present research was to aggregate value to an agro-industrial reject of wide availability in Portugal and in the world, grape stem, grape and wine agroindustry residue, transforming it into adsorbents with high Cd(II) removal capacity of contaminated water. 2. Material and Methods 2.1 Obtaining the biosorbent material
It was used for the studies of adsorption, grape stem, by-product of the agroindustry of juice and wine production, being such biomass obtained in agrobusiness producing wine from the Superior Institute of Agronomy, located in Lisbon, Portugal. The stem was dried at 60 °C for 48 h, crushed and sieved in order to standardize the particle size, resulting in biosorbent of stem or E. in natura. Chemical modifications were made to the grape stem, aiming to increase characteristics favorable to the adsorption of metals, such as surface contact area, porosity, number of

Zimmermann et.al. 43
© 2017 The Authors. ECSDEV Compilation © 2017 European Center of Sustainable Development.
adsorption sites, and sorption energy of sites, among others. Three known chemical modifications and cited in the bibliography were applied by washing the material in natura with solutions of H2O2, H2SO4 and NaOH (Dos Santos et al., 2011; Ngah & Hanafiah, 2008; Argun & Dursun, 2006). In this way, three chemical modifications were evaluated to grape stems, totaling three chemically modified adsorbents and biosorbent in its state in natura. 2.2 Caracterization of the biosorbent and modified adsorbents
The characterization of biosorbents was performed by point of zero charge (pHPZC), infrared spectroscopy (FTIR), nitroperchloric digestion of adsorbents for determining the concentration of its chemical elements and study thermal stability of the adsorbents (TG/DTG) and scanning electron microscopy (SEM). According to an adapted methodology (Mimura et al., 2010), the definition of the point of zero charge, ie the pH at which the surface of the solid has a neutral charge, is performed by preparing a solution of KCl in a concentration of 0.1 mol L-1 with an initial pH values of 2.00 to 8.00, by adjusting with HCl and NaOH to 0.1 mol L-1. Then, 0.4 g of each adsorbent was used in 40 mL of KCl under constant stirring for 4 h. The final pH is then determined. The identification of functional groups of the biosorbents was performed by infrared spectrophotometry (FTIR), with Shimadzu Infrared Spectrophotometer FTIR-8300 Fourier Transform, with a resolution of 4 cm. The samples of the residue were macerated along with KBr crystals, in a ratio of 1 mg of sample/100 mg of KBr, and arranged in a pelletizer. The determination of the constituent elements contents of the adsorbents structure was obtained by the analysis of nitroperchloric digestion (Latimer, 2012), and FAAS (Welz & Sperling, 1999) were determined: potassium (K), calcium (Ca), magnesium (Mg), copper (Cu), zinc (Zn), manganese (Mn), iron (Fe), cadmium (Cd), lead (Pb) and chromium (Cr). The thermal analysis was performed using a TGA 4000 Perkin Elmer thermogravimetric analyzer, where the materials were heated at a temperature ranging from 30 °C to 900 °C under heating rate 10 °C min-1 in nitrogen atmosphere. The morphological characterization of the materials was evaluated by scanning electron microscopy (SEM), using a FEI Quanta 200 microscope (Holland) operating at 30 kV voltage. 2.3 Biosorption experiments
The adsorption studies were performed with solutions fortified with Cd(II), prepared from salts of cadmium nitrate [Cd(NO3)2 4H2O P.A. ≥ 99.0% Sigma-Aldrich]. In order to evaluate the influence of the modified adsorbent mass and the pH of the Cd(II) solution, a joint study (multivariate study) was carried out, since univariate mass and pH tests would not be able to determine the possible interactions between the mentioned parameters. For this purpose, the Central Composite Rotatable Design (CCRD) was used to determine the influence of each of the variables and the possible interaction between them, generating an empirical model, quadratic, with validity in the experimentally tested range (Barros Neto et al., 2010). The masses of absorbents were evaluated in the range of 250 to 1250 mg (ratio of 5 to 25 g L-1), while the pH was

44 ICSD Book of Proceedings (2017), 5, 41-54
Published by ECSDEV, Via dei Fiori, 34, 00172, Rome, Italy http://ecsdev.org
evaluated in the range 3.00 to 7.00. The prepared solutions were conditioned in 125 mL erlenmeyers containing the masses of the adsorbents, and were then conditioned in a Dubnoff with constant agitation at 200 rpm. After the sorting process was carried out in the Dubnoff system, the samples were filtered and aliquots were taken to determine the metal concentrations by EAA/Flame (Welz & Sperling, 1999). From the values obtained for the concentration at equilibrium, the amount adsorbed at equilibrium was calculated (Equation 1).
𝑄𝑒𝑞 = 𝐶0−𝐶𝑒𝑞
𝑚 .𝑉 (1)
Wherein: Qeq is the amount of adsorbed ions per g of adsorbent at equilibrium (mg g-1), m is the mass of adsorbent used (g), C0 represents the initial concentration of ion (mg L-1), Ceq is the concentration of ion in solution at equilibrium (mg L-1) and V is the volume of solution used (L). The results obtained in the aforementioned tests were tabulated and evaluated by multivariate analysis using the Statistica 5.0 program. 3. Results and Discussion 3.1 Characterization of adsorbents of modified stem
Figure 1 illustrates the grape stems, obtained directly in wine production agrobusiness and E. materials in natura (biosorbent derived from the stem) and chemically modified adsorbents with H2O2, H2SO4 and NaOH.
Figure 1. Grape stem transformation in biosorbent and modified adsorbents.
It is noted that the solutions of H2O2, H2SO4 and NaOH 0.1 mol L-1, to contact the biosorbent E. in natura at the temperature of 60 °C for 6 h, were able to changes lead to the adsorbent, causing pHPZC changes, which is shown in Figure 2.

Zimmermann et.al. 45
© 2017 The Authors. ECSDEV Compilation © 2017 European Center of Sustainable Development.
Figure 2. pHPZC for adsorbent E. in natura, E. H2O2, E. H2SO4 and E. NaOH.
The values obtained for the pHPZC of adsorbents are 4.28 to E. in natura, 4.09 for E. H2O2, 2.41 for E. H2SO4 and 7.10 for E. NaOH. The net charge on the adsorbent surface is positive to pH of solution lower than that corresponding to the pHPZC, and negative for a pH of greater than pHPZC solution (Silveira Neta et al., 2012). This change was expected, since the change in pHPZC was according to the power of acidification or alkalization solution of each modifier, protonation, deprotonation or hydroxylation of chemical groups of grapes biomass. Thus when the pH>pHPZC, the surface of the adsorbent is electronegative, favoring the adsorption of Cd(II), however, if the pH<pHPZC, the surface of the adsorbent is electropositive, in this state, the H+ ions compete with Cd(II), by repelling of reducing surface adsorption. The literature mentions that simple treatment of residual biomass with acids or bases can cause physical-chemical modifications to the material, possibly increasing the number of active sites, constituting a low-cost treatment for adsorbents formation (Schwantes et al., 2016). Figure 2 shows that the action of the modifying solution (H2O2, H2SO4 and NaOH) and added heat (65 °C) resulted in changes of pHPZC of adsorbents, showing changes of pHPZC of adsorbents compared to the source material. The adsorption of cations, such as Cd(II), will be favored by higher pH ranges than pHPZC, since in these cases, according to Tagliaferro et al. (2011), the surface of the adsorbent has a preponderance of negative charges. It is possible to observe vibrational stretching at 3395 to 3422 cm-1, 2919 to 2922 cm-1, 1735 to 1738 cm-1, 1614 to 1622 cm-1, 1513 to 1522 cm-1, 1441 to 1443 cm-1, 1390 to 1400 cm-1, 1272 cm-1, 1060 cm-1 and 408 to 435 cm-1 (Figure 3). The strong and broad band at 3395 to 3422 cm-1, may result from a stretching asymmetric hydroxyl OH groups present in water and cellulose, and the symmetrical stretching of NH bonds associated with primary (aliphatic and aromatic) and secondary amines (Dovbeshko et al., 2000; Barbosa, 2007). The peaks among 2919 to 2922 cm-1 can be referred to the stretching vibration of CH
1 2 3 4 5 6 7 8 9 10
-5
-4
-3
-2
-1
0
1
2
p
HpHi
E. in natura
E. H2O
2
E. H2SO
4
E. NaOH

46 ICSD Book of Proceedings (2017), 5, 41-54
Published by ECSDEV, Via dei Fiori, 34, 00172, Rome, Italy http://ecsdev.org
bonds, and may be symmetrical or asymmetrical, due to the presence of alkanes, acyl, aliphatic acids and lipids (Fabian et al., 1995; Abidi et al., 2014). The peaks between 1735 to 1738 cm-1, tend to be axial stretching of C=O bonds of aldehydes and esters groups, originating from polysaccharide, lipid and hemicellulose (Fabian et al., 1995; Ruiz-Chica et al., 2004; Barbosa, 2007).
Figure 3. FTIR for adsorbents E. in natura, E. H2O2, H2SO4 and NaOH.
The vibrational waves between 1614 to 1622 cm-1, may refer to C-C phenyl ring stretch, but can also be associated with nucleic acids peaks due to carbonyl and carboxyl groups (Chiriboga et al., 1998; Schulz & Baranska, 2007). The peaks among 1513 to 1522 cm-1, may be related to the N-H group, referring to secondary amide, probably of protein degradation (Paluszkiewicz & Kwiatek, 2001). The stretching vibrational around 1441 to 1443 cm-1, tend to angular deformation of CH2 or CH3, related to lipids and fatty acids, and aromatic compounds, respectively (Shetty et al., 2006; Barbosa, 2007). The wave in 1390 cm-1, can be related to carbon particles, as the peaks present E. in natura and E. H2SO4, the 1399 cm-1, arise mainly from the vibrational modes of methyl and methylene groups of proteins, lipids and amino groups being a symmetric bending mode of CH3. The adsorbent E. NaOH showed peak at 1440 cm-1, derived from symmetric stretching vibration of the COO- group linked to fatty acids and amino acids, and symmetrical stretching of CH3 protein (Fung et al., 1996; Wang et al., 1997; Chiriboga et al., 1998; Wood et al., 1998 Fujioka et al., 2004; Shetty et al., 2006). The stretching vibration at 1060 cm-1, may be related to the group CO deoxyribose from nucleic acids or cellulose and polysaccharide degradation bonds such as CO, CC and OCH (Dovbeshko et al., 2000; Hanlon et al., 2000; Yang et al., 2005). Since the peaks recorded between 408 to 435 cm-1, are related to angular chain deformations. Importantly, can observe new groups, not previously seen in adsorbent E. in natura, such
4000 3500 3000 2500 2000 1500 1000 500
E. NaOH
E. H2SO
4
Arb
rita
ry u
nits o
f tr
an
sm
itta
nce
Wavenumber (cm-1)
3395
2919 16141442 1060
418
3422
16191399
410
428
3409
3416
2919 1616 1514
1060
1060
427408
2921
2922
1622 1060435
409
1400
1399
1271
1441
1737
1735
1738
1737
1522
E. in natura
E. H2O
2
1520
1513
1443
1390

Zimmermann et.al. 47
© 2017 The Authors. ECSDEV Compilation © 2017 European Center of Sustainable Development.
as vibrational stretch in 1271 cm-1, found only in E. H2SO4, which refers to a mass balance in the CH bond (Schulz & Baranska, 2007). A peak at 1514 cm-1, is possibly related to the presence of a carotenoid structure may be a cellular pigment (Naumann, 1998). The thermogravimetric analysis (TG) and derivative thermogravimetry (DTG) were performed to verify the loss of mass of grape stems in natura and after treatment with H2O2, H2SO4 and NaOH. The TG and DTG curves can be seen in Figure 4.
Figure 4. TG and DTG curves for the grape stem adsorbents.
The adsorbent E. in natura (Figure 4) showed three events, the first at 76 °C with 6% loss of the rachis mass, possibly related to the loss of water and volatiles. In the second event, with 211 ºC and 12% of mass loss, the decomposition of hemicellulose may occur. The third event appears at 325 ºC, with a loss of 62% of the mass, which must be related to cellulose breakage (Melzer et al., 2013). For adsorbent E. H2O2, can observe the first weight loss from 64 °C, a reduction of about 9% by weight of the material, which possibly volatilization refers to molecules of water. The second event occurs at 352 °C, where it is believed that degradation of cellulose, lignin, hemicelluloses, minerals and condensed tannins occurs, losing 60% of its mass (Prozil, 2008). For adsorbent E. H2SO4 has a loss of volatiles at 75 °C and water resulting in 8% of lost mass. Another stage was found at 321 °C, with decomposition of 63% of the mass, due to the breakdown of carbohydrates, such as hemicellulose and cellulose (Rambo et al., 2015). The adsorbent E. NaOH shows three distinct events, the first, at 76 ºC, due to the

48 ICSD Book of Proceedings (2017), 5, 41-54
Published by ECSDEV, Via dei Fiori, 34, 00172, Rome, Italy http://ecsdev.org
evaporation of water and volatile compounds, with loss of 8% of the mass. The second mass loss (60%) occurs at 298 °C, with probable degradation of compounds such as cellulose and hemicellulosis. The third event occurs at 880 °C, losing 25% of mass, with the probable incineration of the remaining material, resulting in ash formation (Meireles et al., 2007). The scanning electron microscopy (Figure 5) illustrate, for the adsorbent E. in natura, an irregular and heterogeneous surface. Since the SEM for E. H2O2, arising from a change with a powerful oxidizing agent reveals an area with many cavities, heterogeneous, spongy aspect and tubular, suggesting porosity. Since the micrograph obtained for E. H2SO4, derived adsorbent treatment with strong acid, known to be a powerful dehydrating discloses a heterogeneous surface, though with numerous cavities of spongy appearance.
Figure 5. SEM to the adsorbents E. in natura at 600 (a) and 2400x (b), E. H2O2 at 600 (c) and 2400x (d), E. H2SO4 at 600 (e) and 2400x (f), and E. NaOH at 600 (g) and 2400x (h)

Zimmermann et.al. 49
© 2017 The Authors. ECSDEV Compilation © 2017 European Center of Sustainable Development.
As for the adsorbent E. NaOH, treated with a strong base, known for its corrosion and solubilization of numerous organic compounds, the SEM has a heterogeneous surface, however irregular, with numerous cavities and recesses. As noted, all of the obtained adsorbents exhibit heterogeneous morphologic characteristics that resemble the biomass origin (E. in natura), however, each applied chemical treatment adsorbents generated with particular characteristics to the modifying agent employed. According to Nacke et al. (2016) when adsorbents with irregular appearance, heterogeneity, many cavities, these are generally characteristics that generate high specific surface area, which are usually characteristic of adsorbents with high adsorption capacity of ions in solution. Rubio et al. (2015) in evaluating crambe biosorbents obtained SEM with an irregular and heterogeneous structure, which, according to the authors, was experimentally demonstrated to be a primordial characteristic for high adsorption rates of Pb(II) ions in the aqueous medium. 3.2 Adsorption experiments of Cd(II)
Table 1 shows the analysis of variance analysis for the central composite rotatable design (CCRD), for the adsorbent mass and pH of the Cd(II) solution. Table 1. Summary of the analysis of variance (ANOVA) for tests involving mass of adsorbent and modified in natura and pH of the solution Cd(II)
Sources of variation Degrees of freedom Average squares
E. in natura E. H2O2 E. H2SO4 E. NaOH
Mass (L) 1 0.658324** 1.059795** 0.563293** 1.886175** Mass (Q) 1 0.171143** 0.201129** 0.140963** 0.409658** pH (L) 1 0.002291 ns 0.010476 ns 0.078108* 0.000035 ns pH (Q) 1 0.00338 ns 0.002326 ns 0.030001 ns 0.001817 ns Mass x pH 1 0.002113 ns 0.002002 ns 0.01655 ns 0.00001 ns
Residue 6 0.00498 0.002645 0.006695 0.010799 Total 11
**: significant at the 1% probability level; *: significant at the 5% probability level; ns: not statistically significant.
Significant differences were found at 1% for adsorbent E. in natura, E. H2O2, E. H2SO4 and E. NaOH regarding the source of variation "adsorbent mass" (for linear and quadratic models), indicating that the amount of adsorbent mass influences the process of adsorption of Cd(II). It was also a significant difference at 5% for E. H2SO4 as regards the source of variation "pH of the solution Cd(II)" (for linear and quadratic models), indicating that for this specific adsorbent, that the pH range evaluated influenced the adsorption process of Cd(II). For other adsorbents was no significant difference in pH in the evaluated range, indicating that, at least in the evaluated range (3.00 to 7.00) , and the experimental conditions of this study [25 °C, 200 rpm, 1.5 h contact time 10 mg L-1 Cd(II)] hydrogenionic the potential of the solution does not cause large influence the adsorption of Cd(II).

50 ICSD Book of Proceedings (2017), 5, 41-54
Published by ECSDEV, Via dei Fiori, 34, 00172, Rome, Italy http://ecsdev.org
This result is extremely favorable because it statistically demonstrates that adsorbents based on grape buds within the pH range of 3.00 to 7.00 can remedy Cd(II) from aquatic environments with high removal capacity, without requiring any adjustment to the pH of the liquid medium (Figure 6).
Figure 6. Surfaces of response to the adsorbed amount at equilibrium (Qeq) versus pH of Cd(II) solution versus mass to adsorbent in natura and modified.
E. in natura z = 1.20239 - 0.00254378x + 0.0000013077x2 + 0.161047y - 0.0114731y2 -0.000045822xy R2:98.1% E. H2O2 z = 1.58617 - 0.00293286x + 0.000001417x2 + 0.154181y -0.00951766y2 -0.000044605xy R2:98.8% E. H2SO4 z = - 0.0634065 - 0.00188951x + 0.0000011868x2 + 0.507761y -0.0341814y2 0.00012824xy R2:94.5% E. NaOH z = 2.61556 - 0.00442359x + 0.0000020232x2 + 0.083276y -0.00841089y2+ 0.000003090xy R2:97.9%
As can be seen in Figure 6 and in Table 1, the pH ranges studied did not cause variation in the adsorption of Cd(II), except for E. H2SO4. However, in general, is observed the greater removal efficiencies of Cd(II) (measured by the adsorbed amount Qeq or Qads), were obtained for adsorbents masses next to 200 mg (ratio 5 g of adsorbent per liter of solution contaminated with Cd). According to Meneghel et al. (2013) and Rubio et al. (2013), the adsorbent mass/volume of the contaminated solution is critical. In certain cases a decrease in the amount adsorbed due to the formation of agglomerates may occur, which will reduce the total surface area and therefore the number of active sites available for the process. Modified adsorbents present are estimated using the following adsorption capacities: E. in natura 1.20, E. H2O2 1.60, E. H2SO4 1.20 and E. NaOH 2.00 mg g-1. Indicating an estimated increase in the adsorption capacity in the order of 33% for E. H2O2 and 66% for E. NaOH compared to the biosorbent E. in natura, of origin.

Zimmermann et.al. 51
© 2017 The Authors. ECSDEV Compilation © 2017 European Center of Sustainable Development.
4. Conclusion
The modified materials showed changes in their characteristics with different values for pHPZC, possible new functional groups such as 1271 and 1514 cm-1, but with similar thermal stabilities, these results suggest that treatments carried out with H2O2, H2SO4 and NaOH effectively modified biomass grape stems. The use of modifying agents in grape stems constitutes an alternative for the production of adsorbents of high adsorption capacity of Cd(II), without burdening the final product. With the removal of Cd(II) refers to water, chemically modified adsorbents are superior to the use of its precursor in natura, especially E. H2O2, with 33% of increase in adsorptive capacity, E. NaOH, with adsorption elevation by 66%. The use of such solid residues (grape stems) as raw material for the production of modified adsorbents appears as an excellent alternative for the disposal of these residues, allowing to add value to a currently discarded residue. References Abidi, N., Cabrales, L., & Haigler, C. H. (2014). Changes in the cell wall and cellulose content of developing
cotton fibers investigated by FTIR spectroscopy. Carbohydrate Polymers, 100, 9-16. Argun, M. E., & Dursun, S. (2006). Removal of heavy metal ions using chemically modified adsorbents. J.
Int. Environ. Appl. Sci, 1(1-2), 27-40. Assis, F. O., & Muratori, A. M. (2007). Poluição hídrica por dejetos de suínos: um estudo de caso na área
rural do município de Quilombo, Santa Catarina. Revista Geografar, 2(1). Barbosa, L. C. D. A. (2007). Espectroscopia no infravermelho na caracterização de compostos orgânicos.
Viçosa: UFV, 189. Barros Neto, B., Scarminio, I. S., & Bruns, R. E. (2010). Como fazer experimentos: aplicações na ciência e na
indústria. Brady, J. E., & Humiston, G. E. (1986). General chemistry: principles and structure. John Wiley & Sons. Chiriboga, L., Xie, P., Yee, H., Vigorita, V., Zarou, D., Zakim, D., & Diem, M. (1998). Infrared spectroscopy
of human tissue. I. Differentiation and maturation of epithelial cells in the human cervix. Biospectroscopy, 4(1), 47-53.
Dos Santos, V. C. G., Tarley, C. R. T., Caetano, J., & Dragunski, D. C. (2010). Assessment of chemically modified sugarcane bagasse for lead adsorption from aqueous medium. Water Science and Technology, 62(2), 457-465.
Dos Santos, V. C., De Souza, J. V., Tarley, C. R., Caetano, J., & Dragunski, D. C. (2011). Copper ions adsorption from aqueous medium using the biosorbent sugarcane bagasse in natura and chemically modified. Water, Air, & Soil Pollution, 216(1-4), 351-359.
Dovbeshko, G. I., Gridina, N. Y., Kruglova, E. B., & Pashchuk, O. P. (2000). FTIR spectroscopy studies of nucleic acid damage. Talanta, 53(1), 233-246.
Fabian, H., Jackson, M., Murphy, L., Watson, P. H., Fichtner, I., & Mantsch, H. H. (1995). A comparative infrared spectroscopic study of human breast tumors and breast tumor cell xenografts. Biospectroscopy, 1(1), 37-45.
Fujioka, N., Morimoto, Y., Arai, T., & Kikuchi, M. (2004). Discrimination between normal and malignant human gastric tissues by Fourier transform infrared spectroscopy. Cancer Detection and Prevention, 28(1), 32-36.
Fung, M. F. K., Senterman, M. K., Mikhael, N. Z., Lacelle, S., & Wong, P. T. (1996). Pressure‐tuning fourier transform infrared spectroscopic study of carcinogenesis in human endometrium. Biospectroscopy, 2(3), 155-165.
Gadd, G. M. (2009). Biosorption: critical review of scientific rationale, environmental importance and significance for pollution treatment. Journal of Chemical Technology and Biotechnology, 84(1), 13-28.

52 ICSD Book of Proceedings (2017), 5, 41-54
Published by ECSDEV, Via dei Fiori, 34, 00172, Rome, Italy http://ecsdev.org
Gonçalves Jr, A. C., Coelho, G. F., Schwantes, D., Rech, A. L., Campagnolo, M. A., & Miola Jr, A. (2016). Biosorption of Cu(II) and Zn(II) with acai endocarp Euterpe oleracea M. in contaminated aqueous solution/Biossorcao de Cu(II) e Zn(II) utilizando o endocarpo de acai Euterpe oleracea M. em solução aquosa contaminada. Acta Scientiarum. Technology, 38(3), 361-371.
Hanlon, E. B., Manoharan, R., Koo, T., Shafer, K. E., Motz, J. T., Fitzmaurice, M., Kramer, J. R., Itzkan, I., Dasari, R. R. & Feld, M. S. (2000). Prospects for in vivo Raman spectroscopy. Physics in medicine and biology, 45(2), R1.
Latimer, G. W. (2012). Official Methods of Analysis of AOAC International. Gaithersburg, Md.: AOAC International, ISBN: 978-0-935584-83-7.
Meireles, C. D. S., Guimes Filho, R., de Assunção, R., Zeni, M., & Mello, K. (2007). Blend compatibility of waste materials—cellulose acetate (from sugarcane bagasse) with polystyrene (from plastic cups): diffusion of water, FTIR, DSC, TGA, and SEM study. Journal of Applied Polymer Science, 104(2), 909-914.
Melzer, M., Blin, J., Bensakhria, A., Valette, J., & Broust, F. (2013). Pyrolysis of extractive rich agroindustrial residues. Journal of Analytical and Applied Pyrolysis, 104, 448-460.
Meneghel, A. P., Gonçalves Jr, A. C., Strey, L., Rubio, F., Schwantes, D., & Casarin, J. (2013). Biosorption and removal of chromium from water by using moringa seed cake (Moringa oleifera Lam.). Química Nova, 36(8), 1104-1110.
Mimura, A. M. S., Vieira, T. D. A., Martelli, P. B., & Gorgulho, H. D. F. (2010). Aplicação da casca de arroz na adsorção dos íons Cu2+, Al3+, Ni2+ e Zn2+. Química Nova, 33(6), 1279-1284.
Nacke, H., Gonçalves, A. C., Coelho, G. F., Schwantes, D., Campagnolo, M. A., Leismann, E. A. V., Conradi Junior, E. & Miola, A. J. (2016). Removal of Cd(II) from water using the waste of jatropha fruit (Jatropha curcas L.). Applied Water Science, 1-16.
Naumann, D. (1998, April). Infrared and NIR Raman spectroscopy in medical microbiology. In BiOS'98 International Biomedical Optics Symposium (pp. 245-257). International Society for Optics and Photonics.
Ngah, W. W., & Hanafiah, M. A. K. M. (2008). Removal of heavy metal ions from wastewater by chemically modified plant wastes as adsorbents: a review. Bioresource technology, 99(10), 3935-3948.
Paluszkiewicz, C., & Kwiatek, W. M. (2001). Analysis of human cancer prostate tissues using FTIR microspectroscopy and SRIXE techniques. Journal of Molecular Structure, 565, 329-334.
Pino, G. A. H. (2005). Biossorção de metais pesados utilizando pó da casca de coco verde (Cocos nucifera) (Doctoral dissertation, PUC-Rio).
Prozil, S. O. (2008). Caracterização química do engaço da uva e possíveis aplicações (Master's thesis, Universidade de Aveiro).
Rambo, M. K. D., Rambo, M. C. D., Almeida, K. J. C. R., & Alexandre, G. P. (2015). Estudo de análise termogravimétrica de diferentes biomassas lignocelulósicas utilizando a análise por componentes principais. Ciência e Natura, 37(3), 862.
Rubio, F., Gonçalves, A. C., Meneghel, A. P., Tarley, C. R. T., Schwantes, D., & Coelho, G. F. (2013). Removal of cadmium from water using by-product Crambe abyssinica Hochst seeds as biosorbent material. Water Science and Technology, 68(1), 227-233.
Rubio, F., Gonçalves Jr, A. C., Dragunski, D. C., Tarley, C. R. T., Meneghel, A. P., & Schwantes, D. (2015). A Crambe abyssinica seed by-product as biosorbent for lead (II) removal from water. Desalination and Water Treatment, 53(1), 139-148.
Ruiz‐Chica, A. J., Medina, M. A., Sanchez‐Jimenez, F., & Ramirez, F. J. (2004). Characterization by Raman spectroscopy of conformational changes on guanine–cytosine and adenine–thymine oligonucleotides induced by aminooxy analogues of spermidine. Journal of Raman spectroscopy, 35(2), 93-100.
Schulz, H., & Baranska, M. (2007). Identification and quantification of valuable plant substances by IR and Raman spectroscopy. Vibrational Spectroscopy, 43(1), 13-25.
Schwantes, D., Gonçalves, A. C., Coelho, G. F., Campagnolo, M. A., Dragunski, D. C., Tarley, C. R. T., Miola, A. J. & Leismann, E. A. V. (2016). Chemical Modifications of Cassava Peel as Adsorbent Material for Metals Ions from Wastewater. Journal of Chemistry, 2016.
Shetty, G., Kendall, C., Shepherd, N., Stone, N., & Barr, H. (2006). Raman spectroscopy: elucidation of biochemical changes in carcinogenesis of oesophagus. British journal of cancer, 94(10), 1460-1464.

Zimmermann et.al. 53
© 2017 The Authors. ECSDEV Compilation © 2017 European Center of Sustainable Development.
Silveira Neta, J. D. J. D., Silva, C. J. D., Moreira, G. C., Reis, C., & Reis, E. L. (2012). Removal of the Reactive Blue 21 and Direct Red 80 dyes using seed residue of Mabea fistulifera Mart. as biosorbent. Revista Ambiente & Água, 7(1), 104-119.
Tagliaferro, G. V., Pereira, P. H. F., Rodrigues, L. A., Da Silva, M. L. C. P. 2011. Cadmium, lead and silver adsorption in hydrous niobium oxide prepared by homogeneous solution method. Química Nova, 34(1), 101–105. [doi: 10.1590/S0100-40422011000100020]
Wang, H. P., Wang, H. C., & Huang, Y. J. (1997). Microscopic FTIR studies of lung cancer cells in pleural fluid. Science of the Total Environment, 204(3), 283-287.
Welz, B., & Sperling, M. (1999). The techniques of atomic absorption spectrometry. Atomic Absorption Spectrometry, Third Edition, 335-475.
Wood, B. R., Quinn, M. A., Tait, B., Ashdown, M., Hislop, T., Romeo, M., & McNaughton, D. (1998). FTIR microspectroscopic study of cell types and potential confounding variables in screening for cervical malignancies. Biospectroscopy, 4(2), 75-91.
Yang, X., & Al-Duri, B. (2005). Kinetic modeling of liquid-phase adsorption of reactive dyes on activated carbon. Journal of Colloid and Interface Science, 287(1), 25-34.

54 ICSD Book of Proceedings (2017), 5, 41-54
Published by ECSDEV, Via dei Fiori, 34, 00172, Rome, Italy http://ecsdev.org

5th International Conference on Sustainable Development 6-7 September 2017, Rome, Italy
Book of Proceedings 5, 55-64 Doi: 10.14207/5ICSD2017
|1Mechanical Engineering and Construction Department, Universitat Jaume I, Castellón de la Plana, Spain
Analysis of Bioclimatic Measures on the Energy Performance of Dwellings from a Case Study of Troglodyte Architecture
By Huedo, Patricia1, Ruá, María José1, Granell, Rocío1
Abstract In this study, the bioclimatic strategies of a cave house are examined to analyze the applicability of passive thermal conditioning strategies to modern dwellings, where high comfort conditions must be reached. Although there is some literature about cave dwellings, the references are scarce when considering the focus on one of their most important advantages, the energy performance. Passive measures such as thermal inertia or ventilation are described, together with some other sustainable measures such as the use of local materials, minimizing transport and closing the product life cycle through reuse and recycling. The research has been carried out in two phases. Firstly, a study of the state of the art on troglodyte architecture has been done. Secondly, the monitoring of a real case, located in Belerda de Guadix (Southern Spain), has been carried out to evaluate its energy efficiency performance by using passive systems. The results indicate that the hygrothermal comfort conditions are very favorable. Thus, the average inner temperature variation is under 7ºC and the inner relative humidity ranges from 50% to 60%, thorough the year. The extreme temperatures reach 16.38ºC in January and 22.53ºC in August, with external temperatures of 3 °C and 36 °C, respectively.
Keywords: Bioclimatic architecture, cave dwelling, energy performance, passive conditioning
1. Introduction
Sustainable development (Brundtland Report, 1987) should be applied to all sectors of human activity. According to different sources, buildings consume about one third of all produced energy (Pérez-Lombard et al., 2008; Boukli Hacene and Chabane Sari, 11). Achieving more energy-efficient buildings is one of the strategies that aims to reduce global energy consumption to thus achieve more sustainable environments. Designers of buildings must implement strategies to achieve sustainable products, and also bear in mind minimum requirements and functional aspects. A bioclimatic architecture considers the climatic conditions at the site, e.g., orientation, use of available natural resources like solar radiation, vegetation, rain, etc., to design enviro-friendly buildings (Garzon, 2007). Vernacular architecture has been projected by the inhabitants of a region or during a certain historic period through empirical knowledge, and by taking advantage of previous generations’ experience and generally employing the resources available in the immediate environment. Therefore, vernacular architecture perfectly matches the bioclimatic architecture philosophy; in fact it is said that vernacular architecture is the origin of bioclimatic architecture (Cañas and Martín, 2004). Examples at the international level are numerous (Zhai and Previtali, 2010; Ipekoglu, 2006; Wang

56 ICSD Book of Proceedings (2017), 5, 55-64
Published by ECSDEV, Via dei Fiori, 34, 00172, Rome, Italy http://ecsdev.org
and Zhenyu, 2006; Nguyen et al., 2011). In Spain given the high climatic diversity of its geography, we find examples of vernacular or popular architecture in many regions. Cañas and Martín, (2004) carried out an exhaustive study by including the vast variability of examples of Spanish vernacular architecture. In their work they pointed out the convenience of taking measures that work in traditional architecture in more modern buildings. In this article a construction typology, considered to be popular or vernacular architecture, is analyzed: the cave house. In this study, the bioclimatic strategies of a cave house are examined to analyze the applicability of passive thermal conditioning strategies to modern residential dwelling typologies, where high quality standards and comfort conditions must be achieved. By way of example, the bioclimatic performance of a cave house located in the province of Granada in Spain is studied. 2. Methodology
This research has been carried according to the following phases: 1. Collection of data about outer conditions: as climate is one of the key points when talking about bioclimatic architecture, the average temperatures and relative humidity from the National Meteorology Agency are collected, together with the measured data. Orography and geology conditions are also analyzed for the location of the house. 2. Collection of data about the cave house: some tasks must be performed in this stage: a. Characteristics of the site for the house b. House floor plan and section plan c. Analysis of the materials used to build the house d. Analyses of the house’s thermal envelope 3. Collection of data about inner conditions: some parameters must be measured: a. The section plan helps to establish the different depth levels of the rooms in the house to check the effect of thermal inertia of soil b. Thermal bridges are analyzed by a thermographic camera c. Ambient temperature and radiant temperature, together with relative humidity. Those measures are collected in summer and winter and for the different depth levels 4. From the observed data, the operative temperature and gradient temperature between the outer and inner conditions will be calculated. Besides, a collection of other advantages provided by this type of construction are described: environmental impact, landscape integration, etc. 3. General Features of Cave Houses
The cave housing type geographically appears in many countries around the world: Algeria, Tunisia, Morocco, Niger, China, Tibet, Mexico, California, Turkey, the Balkan Peninsula, Sicily, Spain (Gelabert, 1973; Lasaosa et al., 1989). In the Iberian Peninsula, we find 44 populations with this dwelling type dispersed throughout the territory, but it becomes more concentrated toward the eastern part of the Peninsula (Cárdenas et al., 2008). This geographic dispersion, as well as its existence at different times, suggest that this house type deserves to be considered. They are usually located in arid or semiarid regions, often next to rivers, but do not occupy floodable land, and

Huedo et.al 57
© 2017 The Authors. ECSDEV Compilation © 2017 European Center of Sustainable Development.
generally take advantage of the orography of the land. They are habitually continental climate sites, with wide daily temperature fluctuations because of the high thermal inertia of the terrain, which is an excellent mechanism for energy utilization. Many types of cave houses can be found depending on the implemented building technique, and range from superficial excavations in the ground to the modern underground houses in which the land is rebuilt on them, or they can depend on orographic or geological conditions. Type of soil and its hardness, compactness and permeability are also influential. This typology is found in limestone and clay soils because of their structural stability when dug. Besides, the very low permeability of clay protects from rain (Loubes, 1985). A thorough review of the scientific literature is seen in Table 1, which summarizes the variety of the main encountered types of cave houses. Table 1. Type of cave houses
Type Description Depth
A Lateral cavities Minimum, all the rooms face the main façade
B With cavities in depth Growing. Cavities are deeper when entering
the cave
C With cavities from a
central main room
Medium. Cavities only at two depth levels
D Staggered in the slope
Progressive. Walls and roof are wider as the cave deepens
E With an added annex The annex is not dug, but is simply added
externally to the house
F Simple with a double
access Depth is variable depending on the profile of the hill above
I Crossing the hill Intermediate. Depth is variable depending
on the profile of the hill above
J In cone Intermediate. Caves at different heights.
Caves at lower levels are deeper than upper caves
k Dug from a central
outward courtyard Superficial with only one cavity of depth

58 ICSD Book of Proceedings (2017), 5, 55-64
Published by ECSDEV, Via dei Fiori, 34, 00172, Rome, Italy http://ecsdev.org
4. Case Study 4.1 Outer conditions
The cave dwelling is located in Belerda de Guadix in the province of Granada (Andalusia, south Spain) (see Fig. 1). This small village is 1200 m over sea level with a Mediterranean continental climate. This means extreme temperatures, with cold and dry winters and hot and dry summers. Rain falls mainly in autumn with intense short showers. Extreme temperatures, scarce rain and a broad thermal night-day gradient, which make this climate perfect for such dwellings.
Figure 1. Location of the cave house (CC BY-SA 3.0, https://commons.wikimedia.org/w/index.php?curid=888485)
According to the National Meteorology Agency, the climate features of the province of Granada for the 1981-2010 period are offered in Table 2. Table 2. General climate data for the province of Granada for 1981-2010 (National Meteorology Agency)
Month Temperatures ºC
Monthly rainfall Relative humidity Mean Maximum Minimum
January 6.5 13.0 0.0 42 72
August 24.8 34.2 15.5 4 42
Average year 15.4 23.0 7.8 36.5 58
The soil in this region is called “badland” (Figure 1). This soil type can be found in arid or semiarid regions with infrequent, but intense, rain showers, sparse vegetation and soft sediments. It is a type of dry terrain where softer sedimentary rocks and clay-rich soils have been extensively eroded by wind and water (Cerdà and Bodí, 2009). This means a soil type that is soft enough to dig, but has compact layers that guarantee solidity and impermeability.

Huedo et.al 59
© 2017 The Authors. ECSDEV Compilation © 2017 European Center of Sustainable Development.
Figure 2. A badland image
Some data from a geotechnical survey conducted in this region were provided by the company “Ingeniería Geológica 71 S.L.”. They show that it is formed mainly by clay and sand (64% and 35%, respectively). The main data are summarised in Table 3. Table 3. Main soil features
Classification CL – ML (Clay-Silt)
Clay content 64.3%
Sand content 35.6%
Gravel content 0.1%
Liquid limit 30.4%
Plastic limit 22.2%
Plasticity lndex 8.2
Sulfates and plasters content 0.00%
Compression resistance 4.94 kp/cm2
Cohesion 2.47 kg/cm2
Angle of internal friction φ = 30o (estimated)
Deformation modulus E ≈ 100 kg/cm2
4.2 Cave house characteristics
Figure 3 shows the location on the hill, where other cave houses can be seen.
Figure 3. Case study location
There are no records about the exact date when the analyzed cave dwelling was dug but, according to old village inhabitants, it is more than 100 years old. It was abandoned by its first owners, farmers who emigrated to the city in the 1960s. Since then, it remained uninhabited until 2004 when a new owner upgraded it. Nowadays the layout has changed and new facilities have been added to make it habitable. Figure n shows the current layout.

60 ICSD Book of Proceedings (2017), 5, 55-64
Published by ECSDEV, Via dei Fiori, 34, 00172, Rome, Italy http://ecsdev.org
Figure 4. Sketch of the cave house
The upgraded cave dwelling presents different stages. All the partitions are protected with lime mortar, some of which are reinforced by mortar cement. The house was extended by digging a new room (nr 7) and two wardrobe, and by adding a storage room and a bathroom annexed to the kitchen (nr 8 and 9). The façade was reinforced by a concrete block wall and new windows were fitted. The roof was also upgraded with retaining walls and ceramic tiles. Electric and sanitary facilities were added. Inside there is a new ceramic floor over a leveling concrete layer,and carpentry to separate rooms and tiles, and sanitary equipment, were employed to adapt the house to dwellers’ modern necessities. A section plan of the house shows the depth levels of the different rooms. This is a relevant feature when considering the thermal inertia of the soil over the house, which strongly influences its thermal performance. In this case, four levels can be differentiated in Figure 5.
Figure 5. Depth levels where measures were taken
Table 4 is a brief description of the considered rooms at the four levels.

Huedo et.al 61
© 2017 The Authors. ECSDEV Compilation © 2017 European Center of Sustainable Development.
Table 4. Depth levels and rooms
Level Features Room Depth from façade (m)
Depth from roof (m)
N1 Surface level, wall comes into contact with the outer environment. An artificial 20-cm concrete wall has been added and a 30-cm slab covered with ceramic tiles
8, 9, 10 2.45 0.00
N2 Partially comes into contact with the outer environment through a window or through another room
1, 2, 3, 4 5.72 1.63
N3 There is no direct connection with outer conditions 5, 7 9.29 5.05
N4 There is no direct connection with outer conditions 6 12.39 9.17
Another influential feature of the house’s thermal performance has to do with the thermal bridges that might be present depending on the constructive solutions of the envelope. They can be detected by a thermographic camera. 5. Results
The results obtained in the studied cave house are provided in Table 5, as follows: 1. Outer conditions: a. RH (%): relative humidity according to the National Meteorology Agency (AEMET) for the province of Granada b. T1: according to AEMET, extreme temperatures are selected, which are the maximum temperature for summer and the minimum temperature for winter c. T2: actual extreme outer temperature taken at the site 2. Inner conditions at each depth level: a. Surface temperature (ts): radiant temperature measured on walls b. Air temperature (ta): measured in a representative room at each level c. Operative temperature (to): this temperature is calculated using the following expression: to= (ts+ta)/2 (ANSI/ASHRAE Standard 55-2010, Thermal Environmental Conditions for Human Occupancy) d. RHm (%): actual values measured for relative humidity 3. Gradient per season: a. G1: it compares the difference between to and T1 b. G2: it compares the difference between to and T2 Table 5. Measurement of outer and inner conditions
RHT1 ºC
(AEMET )
T2 ºC
(measured) ts (ºC) ta (ºC) to (ºC)
RHm
(measured)G1 G2
N1 24.69 25.21 24.95 51.49 -9.25 -11.05
N2 23.30 21.50 22.40 59.85 -11.80 -13.60
N3 20.40 24.00 22.20 54.49 -12.00 -13.80
N4 18.50 22.60 20.55 59.24 -13.65 -15.45
22.53 56.27
N1 13.50 16.50 15.00 60.50 15.00 12.00
N2 15.00 17.80 16.40 58.62 16.40 13.40
N3 15.30 18.40 16.85 56.81 16.85 13.85
N4 15.50 19.00 17.25 52.21 17.25 14.25
16.38 57.04
Inner average variation 6.15
SEASON
(Month)
DEPTH
LEVEL
OUTER CONDITIONS INNER CONDITIONS GRADIENT
SUMMER
(August)42.00 34.20 36.00
Average summer
WINTER
(January)72.00 0.00 3.00
Average winter

62 ICSD Book of Proceedings (2017), 5, 55-64
Published by ECSDEV, Via dei Fiori, 34, 00172, Rome, Italy http://ecsdev.org
From the results, it can be concluded that: - In summer, the inner temperature ranges from 24.95 to 20.55ºC from the most superficial to the deepest level, with a measured outer temperature of 36ºC. Therefore, deeper rooms remain cooler than superficial ones, which reflects the passive performance for cooling due to soil. This can also be seen when comparing the gradient of the temperature between outer and inner conditions G1 and G2. The average temperature inside the house is 22.53ºC - In winter, the inner temperature ranges from 15.00 to 17.25ºC from the most superficial to the deepest level, with a measured outer temperature of 3ºC. In this case, deeper rooms remain warmer than superficial ones, which indicates the passive performance for heating soil. The gradient of the temperature between outer and inner conditions G1 and G2 reaches its maximum in the deepest rooms. The average temperature inside the house is 16.38ºC - The inner average variation of temperature throughout the year is 6.15ºC - The inner conditions maintain the RH inside the dwelling at around 50-60% despite outer RH varying from 40-72% between summer and winter, respectively Figure 6 shows the thermographies taken at those points in the thermal envelope where the potential thermal bridges are detected. They show the windows and door as the weakest points in the thermal envelope. In these pictures, thermal bridges are detected in the new added walls, but not in the natural mountain profile.
Figure 6. Termographies
6. Conclusions
Cave houses are examples of vernacular architecture that can be found worldwide. Therefore, the experience of many inhabitants in different regions has proved the livability of such dwellings. They all respond to similar external conditions, which are arid-semiarid regions with a continental climate, which means that there is a high gradient of temperatures when comparing winter and summer conditions, and even between day and night conditions. The orography is also an important feature because it is the slope of the hills or mountains that is used as the house’s structure and envelope.

Huedo et.al 63
© 2017 The Authors. ECSDEV Compilation © 2017 European Center of Sustainable Development.
This type of constructions perfectly matches the principles of the bioclimatic architecture, which adapts the house to the outer environment conditions to reduce energy consumption, among other advantages. The thermal inertia of natural soil is one of the characteristics that strongly influences the thermal performance of this construction. Inner temperature and RH were measured for both the summer and winter seasons by taking into account the depth level dug in soil in the rooms more closely located to the façade. The results show that the maximum gradient of temperature reached was under 7ºC. Extreme temperatures reached 16.38ºC in January and 22.53ºC in August, with external temperatures of 3°C and 36°C, respectively. Thermal envelope homogeneity also results in thermal bridges being almost absent, which are detected only in windows. The inner RH ranges from 50% on the driest days to 60% on the corresponding rainy days, so it presents an acceptable value all year long. Besides the observed favourable hygrothermal conditions, many other advantages are encountered in this type of dwellings in the present study, described as: 1. Landscape integration: the esthetics of the house perfectly match the natural environment as the slope of the hill or mountain where the house is located is used as part of the envelope 2. Use of natural resources. Cave houses are constructions with a very low environmental impact. They are built into mountains, which saves many materials such as concrete. The same occurs with insulation materials, which are totally unnecessary. Local materials are used and the house is integrated completely into the surrounding environment 3. The artificial or external materials for the building’s structure and envelope are almost unnecessary. This entails saving a considerable amount of money when estimating the building budget 4. The natural roof, usually with vegetation, perfectly soaks rain water, thus avoiding flooding in nearby rivers and confers soil consistence and prevents erosion. It is the natural example of green roof constructive solutions 5. As it is logical, none of these materials impact the environment or need extra energy when analyzing their life cycle, neither in their production, nor in their transportation to the site, as they are totally recyclable. The dug soil is used very often to create an access to the house by compressing it in front of the main entrance, which thus minimizes construction waste 6. Other added environmental advantages to be considered are: acoustic insulation, protection against storms and earthquakes due to the round shapes adopted in construction. Protection against fire is another feature that is worthy of mention as the soil is the main material involved 7. Discussion
The good performance of this construction type is an example to be applied to modern buildings, especially in relation to the envelope’s thermal characteristics. However, some basic principles must be observed to achieve this performance; e.g. the south, or even slightly south east, orientation (for the latitude considered in the case

64 ICSD Book of Proceedings (2017), 5, 55-64
Published by ECSDEV, Via dei Fiori, 34, 00172, Rome, Italy http://ecsdev.org
study) of the main façade is a must to gain maximum solar radiation and natural lighting. Windows must be designed with the biggest possible size to gain enough ventilation and to avoid high humidity. This type of houses usually has a chimney to help inner environment ventilation. It permits acceptable air circulation to the deepest level. The most widely used rooms tend to be those closest to the façade because of their optimum light, ventilation and solar radiation conditions. To protect against excess of sun in summer, other bioclimatic strategies could be implemented; e.g., vegetation and trees with fallen leaves for protection in summer and to capture solar radiation in winter. Beside, vegetation acts as a powder and pollution catcher, and improves the surrounding air quality. References Boukli Hacene and Chabane Sari, 11, The evaluation of global warming’s effects on soil temperature – case
of Tlemcen (North Africa), Journal of Water and Land Development, 15, 145–155. Cañas I. and Martín S., 2004, Recovery of Spanish vernacular construction as a model of bioclimatic
architecture, Building and Environment, 39(12), 1477-1495. Cárdenas y Chávarri J., Maldonado L., Barbero M.M., Gil I.J., 2008, Sostenibilidad y mecanismos bioclimáticos de la
arquitectura vernácula española: el caso de las construcciones subterráneas. In: Memorias de la 14 Convención Científica de Ingeniería y Arquitectura. Primer Congreso Medio Ambiente Construido y Desarrollo Sustentable MACDES. Ministerio de Educación Superior, La Habana.
Cerdà A. and Bodí M.B., 2009, El proceso de infiltración en los badlands del este de la Península Ibérica. Avances y retos, Cuadernos de Investigación Geográfica, 35(1), pp. 7-42.
Gelabert D., 1973, Turquía: Arquitectura troglodita de Capadocia, Cuadernos de Arquitectura y Urbanismo, Col.legi d’Arquitectes de Catalunya, nº 99, pp 40-45.
Ipekoglu, 2006, An architectural evaluation method for conservation of traditional dwellings, Building and Environment, 41, 386–394
Lasaosa M.J., Ros A., Santiago J.A., de Torres R., 1989. Arquitectura Subterránea, Consejeria de Obras Públicas y Transportes, Junta de Andalucía. Gráficas Rosso, Sevilla.
Loubes J.P., 1985, Arquitectura subterránea. Aproximación a su hábitat natural, Editorial Gustavo Gili S.A., Barcelona.
Pérez-Lombard L., Ortiz J. and Pout C., 2008, A review on buildings energy consumption information, Energy and Buildings, 40, 394-398.
Nguyen A.T., Trau Q, Trang D., Reiter S., 2011, An investigation on climate responsable design strategies of vernacular houses in Vietnam, Building and Environment, 46(10), 2088-2106.
United Nations Organization, 1987, Bruntland, Report of the World Commission on Environment and Development. Wang and Zhenyu, 2006, An ecological assessment of the vernacular architecture and of its embodied energy
in Yunnan, China, Building and Environment 41, 687–697 Zhai and Previtali, 2010, Ancient vernacular architecture: characteristics categorization and energy
performance evaluation, Energy and Buildings, 42(3), 357-365.

5th International Conference on Sustainable Development 6-7 September 2017, Rome, Italy
Book of Proceedings 5, 65-72 Doi: 10.14207/5ICSD2017
|1 PhD candidate and researcher at Griffith University.
Practice, Practitioners and Redirection for Adapting Australian Cities
By Petra Perolini1
Abstract Rapid growth and climate change will challenge some of the fundamental assumptions on which our cities have been built. Australian cities will have a huge task ahead of themselves: to accommodate significant climatic change while maintaining their liveability and functioning as an urban system. Governments are currently getting ready to transform our cities to make them ready for the future. Current attempts to only physically engage with this transformation process will not be adequate. What is needed is a project that can propose a new and different model of transforming and adapting our cities to prepare them for the changing climate and population growth. Metrofitting, a term used to describe the transformation many cities need to undertake to ensure long-term vitality could provide some urgent answers. This paper offers a critical perspective on the concepts of metrofitting and re-directive practice. It puts forward a contextually dynamic view of urban futures. Overall, the argument and ideas presented seek to reframe how we engage with city planning. Metrofitting requires a level of activism currently absent in design practice and culture.
Keywords: Design practice, metrofitting, retrofitting, adaptation, urban, redirection
1. Introduction
Rapid urban growth is not unique to Australia, but in no other Western country are cities growing as fast as in Australia (Colebatch, 2016). Although not unique to our time, it poses unique challenges. Figures published by the 2011 Census (ABS, 2011) reveal that 88.9% of the population live in urban Australia. In some states, New South Wales and Victoria, over 90 per cent are urbanised. In the Australian Capital Territory, almost 100 per cent are urbanised due to almost the entire population living in Canberra and its suburban areas. In the past five years Australia‘s biggest cities, Melbourne and Sydney, have grown by 2 per cent and 1.6 per cent respectively, estimating that by 2050 they will have doubled in their size; both Melbourne and Sydney to nine million people (Colebatch, 2016). This sharp population increase is a combination of net overseas migration (more people staying than leaving) and a natural increase (birth minus death). However, as the population ages, the natural increase will shrink but migration will increase (Colebatch, 2016). The rapid growth presents these cities with countless complex challenges. Urban designers are confronted with the task to redesign cities that are projected to double their size in the next 40 years. A study commissioned by the Victorian Department of Transport and the City of Melbourne (The City of Melbourne Project Team,2010) to establish the potential to transform metropolitan Melbourne to meet the projected population of 8 million by 2050, talks of the enormity of the daunting challenge of

66 ICSD Book of Proceedings (2017), 5, 65-72
Published by ECSDEV, Via dei Fiori, 34, 00172, Rome, Italy http://ecsdev.org
building the equivalent city and infrastructure that has taken 185 years in under 30 years. Add to this the fact that these cities will increasingly be exposed to cyclones and other extreme weather events brought on by a changing climate. These events are predicted by scientists to worsen with global warming. Climate change will challenge some of the fundamental assumptions on which our cities have been built. According to Fuenfgeld (2011), Australian cities will have a huge task ahead of themselves: to accommodate significant climatic change while maintaining their liveability and functioning as an urban system. Heat Islanding, inadequate structures not able to withstand unprecedented high winds, cyclones and prolonged rainfall and draughts are just some of the conditions they will have to overcome in the coming decades. Current attempts to only physically engage with this transformation process will not be adequate. What is needed is a project that can propose a new and different model of adapting our cities to prepare them for the changing climate and population growth. Metrofitting, a term used to describe the transformation many cities need to undertake to ensure long-term vitality could provide some urgent answers (Fry, 2011). 2. The Project of Metrofitting
Currently, Australian cities are literally exploding with road, rail, metro, business and leisure hubs and housing projects, springing up at record speed. The Federal Government has committed $50 billion to infrastructure investment between 2013-14 and 2019-20, pushing Australia‘s top cities to compete on an international scale; offering thriving urban centres with fast transport links between home and work countless options for sport, culture, drinking and dining. As discussed, the challenge will be transforming cities to cater for a growing population is a doubling of the population by 2050, something that traditionally took over two centuries to develop, while at the same time preparing cities to become climate defensive. Although our cities are highly adaptable systems, climate change will challenge the business-as-usual activities of urban centres in many ways (Fuenfgeld, 2011). Arguably, Australian cities are well prepared to respond to a range of climate-related hazards. A recent cyclone in March/April 2017 has brought devastation to many eastern costal cities, leaving a trail of destruction to lives, homes, infrastructure, business, livestock and the environment. The associated floods in Queensland and New South Wales have yet again highlighted the importance for residents to be prepared rather than react once a disaster unfolds. Undeniably, Australian cities have been at the forefront of driving these developments (Fuenfgeld, 2011). Fuenfgeld (2011) states that many local Council have begun to assess and plan for the impacts of climate change. Likewise, residents in affected cities are well prepared for extreme events like floods, bushfires, heatwaves, hail, cyclones etc. They know how to access vital information and have emergency plans in place. However, these weather events will intensify and become more frequent due to population growth and surging migration. The World Bank (2010) has issued a warning to all major cities globally that we are unprepared and currently unable to cope with what will confront us. Ultimately with climate change, population growth and food shortages predicted, our cities will need to adapt to a difficult future. The practice of Metrofitting discusses a new

P. Perolini 67
© 2017 The Author. ECSDEV Compilation © 2017 European Center of Sustainable Development.
and different model of adapting our cities. The concept of Metrofitting is taking the idea of retrofitting (which is a technological response) and making urban strategies by addressing all that is at risk in the city, structurally, socially economically and culturally and develops a transformative approach to give a city a viable future (Fry, 2011). The practice presents ideas and actions for the retrofitting on an urban scale, a new practise for planners, architects and urban designers. As such it is presented to overarch and redirect all that is urban and will modify or remodel existing structures, communities, neighbourhoods, cities, and urban cultures, to respond to the challenges and issues of unsustainability (Perolini, 2009). Importantly, Metrofitting acknowledges that a city is always circumscribed by a complex mix of relational determinates: its topography, climate, demographics, infrastructure, by-laws and ordinance and so on (Perolini, 2009). Metrofitting accepts that no matter how well designed a city may seem it will always be a mixture of the functional and dysfunctional. Furthermore, the practice of Metrofitting acknowledges that the structures of cities are always formed in response to the physical, natural, economic, political, social and cultural. Dealing with all these elements relationally is what distinguishes Metrofitting from retrofitting. The relational approach understands that cities are a diverse and dense web of economic, political, social and cultural structures and need to be understood and challenged as one entity. Within this entity and according to the socio-economic circumstances of its population and environment, the city delivers positive or negative ways of life (Perolini, 2009). Almost everywhere, as urban populations grow, and problems of the unsustainable deepen, inherent problems of the city increase. Problems associated with transport infrastructure, disconnected suburbs, energy supply, homelessness, poverty, a lack of affordable housing, unemployment, crime and violence all fold into each other. The architectural landscape is often incoherent; a historical sense of place is erased and not replaced by the new. The amount of exposed thermal mass in so many CBD‘s make them feel unpleasantly hot in summer and icy cold in winter. Fundamentally, the practice of Metrofitting recognises that we mostly don‘t need to add to the existing urban infrastructure by adding more material fabric. Rather, it asserts the priority of dealing with existing elements, especially by modifying their structure, operation and use so they are able to contribute to a city‘s long-term vitality. It is based on the proposition that to make the city a better place environmentally, economically, socially and culturally to live and work in, it is necessary to deal with what is already there, in every respect (Perolini, 2009). 3. Adapting to a New Approach
Currently architects, planners and urban designers are not educated to attempt the named transformative approach (Metrofitting) of adapting our existing cities and prepare them for the future. As professionals they are trained to function and to exist in a narrow disciplinary field. Often they only consult with other design professionals within limited and instrumental contexts — which is to say that they do not learn to view and engage with the cities relational complexity (Perolini, 2009). As such, they see the city and engage with it pragmatically and technically. In terms of affirmative change, the division of knowledge of their specific disciplines intellectually restricts them and in this

68 ICSD Book of Proceedings (2017), 5, 65-72
Published by ECSDEV, Via dei Fiori, 34, 00172, Rome, Italy http://ecsdev.org
aspect, Metrofitting requires a new kind of architecture, design and planning education liberated from past priorities and preoccupations (Perolini, 2009). In addition to a new educating approach for professionals in the fields of architecture, planning and design, what is required is a design agenda and practice beyond service provision — Metrofitting is a domain of designer leadership. A position paper written as part of a Master course requirement at Griffith University in 2009 on ‗Retrofitting Cities‘ outlines a number of strategies necessary for implementing the concept of Metrofitting. Overarching, Metrofitting requires a level of activism currently absent in design practice and culture (Perolini, 2009). While able to be viewed as the politicisation of design it also needs to be seen as a domain of economic opportunity and as a context in which all the design practices can realise a greater potential. This means for design and designers to be less preoccupied with style but to engage on a heightened level in social and environmental responsibility. Together this has the potential of making design practices powerful drivers of sustainment, a term used to describe the role of design and the responsibility of designers to facilitating the ability to make and sustain viable futures (Fry, 1999). In contrast to environmental building rating systems and green building initiatives, what is being identified here is a comprehensive approach that engages absolutely every area of urban structure - form, socio-cultural fabric, economy and use (Perolini,2009). In contrast to existing ways of designing that only address symptoms of unsustainability, and thereby so often act to maintain the status quo, Metrofitting approaches change based on ‗futuring the city‘ in terms of what it will have to confront and deal with in coming decades. ‗Futuring‘ is a term used by Fry (1999) to explain a different design practice, an alternative method needed to negate the current ineffective, weak and fragmented approach taken by industry professionals and to expand and become a more ethical and professional practice able to respond to ethical, political, social and ecological concerns of today and tomorrow. However, the starting point is not with the city itself but with those practices that bring it into realization and animate it. Put simply, for cities to change and be able to become thriving urban centers offering sustainable, functioning and livable communities, the existing practice model has to transform. 4. Re-directive Practice
The concept of re-directive practice is not detached from established design practices but is a turning towards a focus of designing a way of engaging design and sustainability/unsustainability relationally. Fry (2007) defines re-directive practice as ―adaptation in face of what has to change to counter the unsustainable; the elimination of what threatens sustainment by designing ‗ things ‘away; and prefiguration, which is designing in order to re-detractively deal with what is coming.‖ Metrofitting a city would name a re-directive project. So while changing a city through Metrofitting seems and is, an extremely complex and enormous task, the following questions thus arises: who are the practitioners willing to rise to the challenge. Who is going to get involved? Who will lead? Who will be the catalytic leaders of the change community? Realistically, most projects that would be of interest to re-directive practitioners need to be initiated by the practitioners themselves. Every project affords the means to gain new knowledge. Every

P. Perolini 69
© 2017 The Author. ECSDEV Compilation © 2017 European Center of Sustainable Development.
project arrives as an experimental learning exercise. With more knowledge and more exposure, existing clients would be re-directed, new clients created and the environmental and economic benefits of a re-directive approach realised. What is proposed would be totally unrealistic if it were not for two things: the problems of unsustainability already intrinsic to most cities and, more significantly, the inevitable crisis heading their way, climate change and the effect it will have on cities. As the history of the architecture of the modern movement affirms, urban dreams so quickly can (and have) become disasters. In the face of this situation, Metrofitting and re-directive practice make one clear and powerful statement: act now rather than waiting for the problems to arrive. Metrofitting provides a conceptual and organisational approach that invites engagement by the varied policy, planning and design elements of government, industry and community — this so they may take broader responsibility for the coming situation. The cost of doing so will be significant, but negligible in comparison to allowing an ad hoc response to occur (which would effectively mean giving way to breakdown and crisis management). The mess in our urban centers that is unsustainability in large part, arrived by urban design, architecture and planning and the only way to overcome this situation is by design becoming a re-directive practice as the basis of leadership by design. 5. Re-educating Designers - Writing Metrofitting into the Curriculum
Metrofitting is actually situated in an essential major reform of the curriculum in higher education. While, over a broad range of disciplines, a concern with ‗sustainability arrived mostly over the last decade the issue mainly appeared as an ‗add-on‘ to existing areas of knowledge and practice. Today, design professionals, planners, architects and educators generally recognise and acknowledge that securing viable futures requires something far more substantial than what has been on offer thus far. The foundation of a process that can lead to sustainment becoming the directional stimulus of humankind actually requires a major reform of a great deal of what is taught, and its underlying assumptions and values (Fry, 2009). It requires the fact to be faced that structural unsustainability arrives because of what we have learnt — effective people are taught how to be unsustainable in the very process of learning to maintain, develop and function within the modern world. Even ‗sustainable development‘ is locked onto this trajectory. The direction that actually has to be followed is the ‗development of sustainment‘ (Fry, 2009). Table 1: Example Content
Architecture (building removal, adaptation, climate defensive structures, fire protection, water harvesting, energy architecture, designing for materials and component recovery and reuse)
Landscape architecture (shade, wind protection, fire risk reduction, food production)
Planning (flood risk elimination, solar orientation, fire risk reduction, vehicle kilometers travelled reduction, refugee influx accommodation)
Building construction (storm reinforcement and impact protection (indoor and outdoor including glazing), external heat insulation, fire protection, water harvesting, new storm

70 ICSD Book of Proceedings (2017), 5, 65-72
Published by ECSDEV, Via dei Fiori, 34, 00172, Rome, Italy http://ecsdev.org
protective structures and storm water management, renewable energy, damaged and ‘at risk’ building demolition, materials recovery, storage and reuse, emergency workforce training)
Interior design (emergency facilities design — power, food, water; internal weatherproofing, etc.)
Visual communications (the promotion of Metrofitting, building safety classification signage, storm protection shelter signage, evacuation route signage)
Civil engineering (structures reinforcement (bridges, towers etc.); storm water management, detention and retention; built environment damage removal, emergency structures construction, emergency water supply
Services engineering (warning systems, emergency services supply (to and beyond vital services), emergency workforce)
Sociology/social work (public education and emergency shelter provision, food and clothing, counseling, community preparedness development and reformation, emergency workforce)
Medicine (emergency services including field hospitals)
Law (emergency measures review and development, Metrofitting key measures enforcement)
Management (overall Metrofitting action management and coordination) –all of above
Research – all of above and all related trades industry, education
Professional development
Campaigns (general and on specific issues)Exhibitions (general and on specific issues)To undertake all these measures would be a true educational revolution!
Public education
Retrieved from Design Futures Working Paper No 1. 2009 by Queensland College of Art Griffith University. 6. Concluding Comments
Metrofitting is about putting the city in a position to adapt to climate change and population growth; it is about recognising and creating the mechanisms to enable the existing social ecology of the city (how decisions are made, who makes them, and how community is formed or revitalised) to change; it is about the transformation of the city‘s economy; it is about social justice, equity and cultural sustainment; and predicted problem management (for instance, the doubling of its residents). Above all Metrofitting is about how we live and work together to secure a viable future. References City of Melbourne and Victoria Department of Transport, City of Melbourne Project Team. (2010).
Transforming Australian Cities. Melbourne, Australia: Author. Colebatch, T. (2016). Australia’s urban boom: the latest evidence. Retrieved from
http://nsidestory.org.au/australias-urban-boom-the-latest-evidence Fry, T. (1999). A New Design Philosophy: An Introduction to Defuturing. Sydney, Australia, UNSW Press. Fry, T. (2007). Redirective Practice: An Elaboration. Design Philosophy Papers, 5 (1) 2007. Fry, T. (2011). Urban Futures in the Age of Unsettlement. Futures: The Journal of Politics, Planning and Future
Studies, 43(4),432 – 439. Fry, T. (2009). Education, sustainment and change. Metrofitting: Adaptation, the City and Impacts of the Coming
Climate. Position Paper No 1, 44-46. Table retrieved Fuenfgeld, H. (2011). As the climate shifts, are Australian cities ready? Retrieved from
http://theconversation.com/as-the-climate-shifts-are-australian-cities-ready-2698

P. Perolini 71
© 2017 The Author. ECSDEV Compilation © 2017 European Center of Sustainable Development.
Perolini, P. (2009). Practice, Practitioners and Redirection. Metrofitting: Adaptation, the City and Impacts of the Coming Climate. Position Paper No 1, 13-16.
The International Bank for Reconstruction and Development/The World Bank. (2010). World Development Report 2010: Development and climate change. Washington DC, USA: Author

72 ICSD Book of Proceedings (2017), 5, 65-72
Published by ECSDEV, Via dei Fiori, 34, 00172, Rome, Italy http://ecsdev.org
.

5th International Conference on Sustainable Development 6-7 September 2017, Rome, Italy
Book of Proceedings 5, 73-78 Doi: 10.14207/5ICSD2017
|1PhD. Candidate, Albanian University of Tirana
Legal Protection and Insurance by Administration as a Part of Universal Right in Albania
By Arjan Gjini1
Abstract The public administration has a primary role in a healthy governance. Human rights are the basic principles and without them people cannot live in dignity. These rights constitute the base of liberty, justice and peace. By respecting them the individual and society progress is made possible. The development of human rights and corresponding guarantees have deep roots of effort to gain freedom and equality all over the world. The basis of human rights, such as the respect to human life and dignity, is to be found in the main part of the philosophies. They are stated in the Universal Declaration of Human Rights and in other documents such as “International Convention of Human Rights” which also define what governments should and should not do in order to respect the rights of their citizens. Albania is now in a phase of integrating into the euro-atlantic structures and its administration is facing various changes. The legal framework is releasing its first effects in the efficient consolidation and protection of the legal security of its citizens.
Keywords: Human rights; convention; law; rehabilitation institutions; solidarity.
1. General Classification of the Rights
The civil and political essential rights. The rights have to do with freedom and include the right of life, individual liberty and security, freedom from torture and slavery, political participation, freedom of belief, expression, thought, awareness and religion, freedom of gathering and attendance in associations. The socio-economic rights. These rights are about vital security, such as the rights to work, educate, feed, have a normal standard of living, to be accommodated and to get health care. The rights of wellbeing. These include the rights to live in a wealthy and protected environment as well as the rights to have a cultural, politic and economic development. When we say that everyone has their human rights, we mean that they are responsible of respecting the rights of other people. A primary role is played by public administration. This is an inclusive challenge in the actual reality of Albania. Legal rights are those that are decreed by law and can be defended in law court. Mention the right of qualitative service from public services, the equal chance of these services, the legal guarantee not to be unfairly affected from administrative acts of the state administration bodies. Nowadays, not all theoreticians defend the same theory of the legal right, some of them even defend the idea that human rights are worthless unless they are included in laws and unless they are executed without the interference of state.

74 ICSD Book of Proceedings (2017), 5, 73-78
Published by ECSDEV, Via dei Fiori, 34, 00172, Rome, Italy http://ecsdev.org
1.1 The Universal Declaration of Human Rights The Universal Declaration of Human Rights (UDHR) is the Declaration widely
approved of human rights. Its fundamental message is the inherited value of human beings. The declaration was approved on 10 December 1947 by United Nations (even though 8 of them disagreed). It declares the list of fundamental rights of each person despite its race, color, gender, language, religion, political or any other belief, nationality or society class, property, birth status etc. The declaration states loudly that governments promise to protect specific rights, not only of their citizens but, also those of citizens in other countries. In other words, national borders are not barrier of others enjoying these rights. Since 1948, the Universal Declaration has served as the international model of human rights. In 1993, the global conference, with participation of 171 states representing 99% of world popularity, reassured its engagement towards human rights. European Union incarnates even today this belief by creating a positive climate and a large trade of free movement for people, goods and high legal insurances. General Declaration of Human Rights approved on December, 10 1948 states that: GENERAL ASSEMBLY names this GENERAL DECLARATION OF HUMAN RIGHTS as a general ideal that people of all nations should get in order to help in respecting these rights and through national progressive measures to ensure their real knowledge and implementation, both among member states and those that are under their administration. Article 1. All people are born free and equal in dignity and rights. They have reason and logic and must have a spirit of brotherhood with each other. Article 2. Each one enjoys the rights and freedom stated on this Declaration with no restrictions as far as race, color, gender, language, religion, politic belief, nationality, wealth, birth status or any other aspect are concerned. Article 7. Each one is equal under law and has the right to be defended by law without discrimination. Everyone has the right to defend themselves against any kind of discrimination that violates this Declaration, as well as against any incitement to such discrimination. Article 8. Everyone has the right of judicial tools in front of a national competent court about the actions with which fundamental rights guaranteed by constitution or laws are treaded on. Article 30. Nothing in this Declaration can be interpreted as a right of the state, group or person that carries out any kind of activity or releases any act towards any right or liberty stated on this Declaration: So, it is obvious that there are chances and premises for a legal and efficient insurance. The Constitution of Albania Republic has achieved this in one of its chapters. Particular laws are decreed in order to realize these obligations and an entire reform is being undertaken so as a healthy public administration is attained. 1.1.1 Some Important Conventions of Uno on Human Rights
- The Universal Declaration of Human Rights (1948)
- The International Pact of Economic, Social and Cultural Rights (1966)
- The International Pact of Civil and Politic Rights (1966)
- The Convention of Prevention and Punishment of Genocide Crime (1948)
- The Convention against Torture or other Cruel, Inhuman and Humiliating Punishment(1984)

A. Gjini 75
© 2017 The Authors. ECSDEV Compilation © 2017 European Center of Sustainable Development.
- The International Convention of Elimination of all Racial Discrimination Forms (1965)
- The Convention of all Discrimination Forms against Women (1979)
- The Convention of Children Rights (1989) 2. European Institutions and Instruments of Human Rights
Council of Europe: Bearing in mind the universal Convention of Human Rights of UNO, the Council of Europe in Rome in 4 November 1950 has approved the Convention of Human Rights and Fundamental Freedom Protection. This convention has later on been improved by signatory states with some protocols that further amend the rights and liberties of human.
The European Court of Human Rights (as a single court since 1998)
The European Committee of Social Rights (revised in 1999)
The European Committee of Torture Prevention and Inhuman or Humilitating Punishment (CPT 1989)
The Commissioner Committee of Frame Convention about National Minorities (ECRI 1993)
The European Committee of Human Rights (1999)
The Committee of the Ministers of Europe Council. OSBE
The Office of Democratic Institutions and Human Rights (ODIHR, 1990)
The High Commissioner of National Minorities (OSCE, 1992)
The Representative of Media Freedom (OSCE, 1997) EU
European Court of Justice
The European Monitoring Center of Racism and Xenophobia (2000)
The EU Card of Fundamental Rights (2000) The Council of Europe in 1999, also founded “The Commissioner of Human Rights”, who informs on his/her work in annual report. Despite this, to the work of the members from different fields of human rights, there exists “the system of confidential monitoring” to which, based on prepared reports by the secretarial, the responsible is the council. The European Court of Human Rights The European Court of Human Rights in Strasbourg, the mandatory jurisdiction of which is now accepted by all member states of European Council, is the main instrument of the defense of human rights and freedom. The number of judges is equal to the number of represented member states of European Council. Albania and its insurances in the implementation of positive rights The issue of human rights has long been stable in Albania. The reason lies not only on the commitment of Albanian society to respect human rights but, also on the liabilities created within the international agreements ratified by it. Albania signed the stability-association agreement and this brought many engagements that are happening with acceptable rates and this, in turn, brought an important dimension in the realization of socio-economic rights. Article 116 of the Constitution states that: 1. Normative acts that are in power all over the Albanian Republic are:

76 ICSD Book of Proceedings (2017), 5, 73-78
Published by ECSDEV, Via dei Fiori, 34, 00172, Rome, Italy http://ecsdev.org
a. Constitution b. Ratified international agreements c. Laws d. Normative acts of Ministers Council Article 122 states that: 1. Each international ratified agreement constitutes a part of internal judicial system after it is published in the official notebook. 2. An international ratified agreement by law has dominance over laws that do not agree with it. Freedom and economic, social and cultural rights are treated in articles 49-58, in the chapter with the same title. Here it is included: the right of each one to make a living by doing legal jobs and the freedom of profession, the right of social defense of the job, the right to be employed in order to join freely the trade union organizations to protect their job interests etc. An important place in Constitution holds the social objectives that are treated in the article 59 of it. In this article there are stated the intentions of Albanian state “within constitutional competences and means that possess”, in order to employee in appropriate conditions all the individuals able to work, helping citizens in need of accommodation, getting the highest standard of health both physical and mental, creating a healthy environment and ecologically appropriate for new generation and what will come. Fulfillment of social objectives cannot be directly required in law court. An innovation in the field of human rights is also the creation of People’s Lawyer who protects legal rights, freedom and interests of the individual from illegal and incorrect actions or inactions of the public administration bodies. Inclusion of human rights in the Constitution is an important move ahead in the field of respect and protection to them. However, their transformation into tangible reality remains a permanent task of the social activity of each one. 2.1 Engaged Institutions in Respecting Universal Rights in Albania
Institutions that guarantee and protect human rights are those constitutional such as: the president, the parliament, the government, law courts, people’s lawyer, non-governmental organizations as Albanian Committee of Helsinki etc, the Institution of People’s Lawyer. The People’s Lawyer is the only national institution that has constitutional status on human rights and freedom defense in Albania. This institution was founded in 1998, approved by the Constitution of Albania Republic, decreed by law no 8417, on 21.10.1998, whereas on 04.021999 the Parliament of Albania Republic decreed the law no 8454, “To People’s Lawyer”. The People’s Lawyer supports impartiality principles, confidentiality, professionalism and independence, acts as the defender of legal rights, freedom and interests of the citizens from illegal and incorrect action or inactions of the public administration bodies, as well as third parties under their control. In the same way, the institution of People’s Lawyer must be engaged in a proactive role helping in promotion of the highest standards of man in country, as well as the creation and development of a good governance culture which are necessary elements of internal function of democracy. The constitution predicts an independent court. However, the politic pressure, threat, widespread corruption and limited sources

A. Gjini 77
© 2017 The Authors. ECSDEV Compilation © 2017 European Center of Sustainable Development.
hinder at times the court independent and efficient function. Some agencies often used to ignore the laws of the court. It is to be emphasized that sometimes judges, being affected by different corruptive factors, take unfair decisions which, in turn, violate human liberties and rights. 2.1.1 Corruption and Transparency Lack, Premises of an Ineffective Governance
The public administration in country in trying seriously to respect the law, to increase efficient services and to bring a positive climate in a fair governance. It remains vulnerable the perception of public opinion on some main agencies and sections in an analysis of non-respect to efficient laws and practices. These practices, seeing the approach of legislation to EU countries, began to minimize. Even though the law predicts penal punishments to official corruption, practically, according to reliable reports, the court does not obey to this law efficiently and often the officials find themselves in corrupted unpunishable practices. Corruption in executive field is wide spread and is all inclusive. Many sections in country are involved in massive corruption and a distinctive feature is unpunishment. This seriously damages the society and violates human rights. If we are to refer to reports of international organizations and Albanian reality, there are a lot other human rights and liberties violated in Albania. Despite the constitution and decreed laws, Albania remains a vulnerable democracy where a lot more work and time is needed in order to increase the standards of rights and liberties, as we already know that we come from a society of totalitarian communist regime with great challenges. 3. Conclusions With importance is the reformation of local administrative legislation in Albania, that means the creation of legal rules and practices which public administration is based on. Its organization and function is required to be observed under a wide sphere within which can be found serious but manageable challenges. The administrative legislation, as a main part of public right, should take into consideration the public interests: human rights cannot be bought, cannot be gained nor can they be inherited, they belong to people because they have judicial proficiency- human rights are born with him. All people are born free and equal as far as dignity and rights are concerned- human rights are universal and guaranteed by Albanian Constitution. To live in dignity, everyone has the right of liberty, security and worthy vital standards- human rights are inseparable and the role of public administration must be coherent, it must also accomplish expectations of a fair all inclusive governance. The foundation of administrative courts in our country and justice reform, which is being implemented, are bringing a climate of good efficiency and possibility in a democratic and developed society. Lastly, the increase of public awareness about law implementation in its highest possible degree would cause them, the laws, be part of a virtual world unrelated to practical reality. Formation of a public administration with professions would be a necessary condition of the realization of these realms as the legislation itself is important in achieving a good standard of its approval. The lack in real and correct approaches would avoid purposely the address of reality concerns and would

78 ICSD Book of Proceedings (2017), 5, 73-78
Published by ECSDEV, Via dei Fiori, 34, 00172, Rome, Italy http://ecsdev.org
create a justification to the continuance of them. References Albanian Academy of Sciences, The history of Albanian people,Publishing House Toena, 2002. Anastas A., Political institutions and constitutional right in Albania (1912-1939), Publishing House Luarasi, Tirane,
1998. Ballanca Z., Administrative Right of RPSSH, Dispense 1, Printing House of Polygraphic Combine, Tirane, 1984 Çani (Methasani) E., Work Relationships in Public Administration; Analysis of Albanian Legislation, AKSES center,
Albania, Publishing House albPaper, December 2009. Çani E. and Faskaj A., Public Service, in Balbe, Zganjori and Padros, Çani of (Methasani) ed.s, Issues of
Administrative Right in a Comparative View, publishment of Spanish Agency. AECID in Albania and Magistrate School, Tirane 2010. Çani (Methasani) E., Necessary legal transplants of integrity process and internal necessary institutional and administrative
conditions of their success, Albanian Magazine of Legal Studies, Volume 1, 2011. DAP, ”Conceptual draft-document on a new law of civil service in Albania” _
http://www.pad.gov.al/sigma/Dokument_Koncepti_mbi_ligjin_per_SherbiminCivil.pdf and the text of the bill in: http://www.pad.gov.al/LigjiSHc.html
Dobjani E., The Administrative Right 1, The Publishing House Perlat Voshtina, Tirane, 2007. Floqi K., The Administration or Research Right (Hukkuki-Idare), theoretic and practical treatment in help to
Albanian emlpoyees and citizens, Publishing House Vlora, Vlore 1923, page 92. Goetz, K.H. (2006), ”Territory and Europeanization”, in P.Graziano/ M.Vink (eds.) Europeanization: New
Research Agenda, Basingstoke: Palgrave Gjilani F., Brozi Z., Hysi G., Omari L., Nova K., Elezi I., Zaganori Xh and Luarasi A. http://www.pad.gov.al/LigjiSHc.html http://ec.europa.eu/enlargement/pdf/press_corner/key-documents/reports_nov_2008/albania_progress
_report_en.pdf http://eeas.europa.eu/delegations/albania/documents/eu_albania/2009_progress_report_en.pdf http://ec.europa.eu/enlargement/pdf/key_documents/2010/package/al_rapport_2010_en.pdf http://ec.europa.eu/enlargement/pdf/key_documents/2011/package/al_rapport_2011_en.pdf

5th International Conference on Sustainable Development 6-7 September 2017, Rome, Italy
Book of Proceedings 5, 79-88 Doi: 10.14207/5ICSD2017
|1Sustainability & Reliability of Infrastructure Program; Energy and Building Research Center Kuwait
Institute for Scientific Research Kuwait
Megaproject and Risk Management: A Case of Kuwait
By Dr. Shaikha AlSanad1
Abstract Mega construction projects are extremely large-scale investment projects that typically cost more than one billion dollars, demanding resources that run into millions of man hours, with numerous stakeholders with an extraordinary amount of interlink. Latterly, the notion of mega project evolving significance in the Kuwait industry, due to the innovative strategies development plan for the country. Evidence from research shows that identical poor performance for megaprojects in worldwide country. This research endeavor aims to identify, prioritize and categorize assess risks perceived for the construction of a mega project in in Kuwait. A total of 54 perceived risk factors which categories into six groups have been identified and prioritized on the basis of criticality in the construction mega project. A structured questionnaire survey was employed as a key tool for assessing the respondents' perception of the level of impact and the probability of occurrence for each of the identified risk factors. A total of 700 questionnaires were distributed and 536 completed questionnaires were received. A significant difference is observed in the perception of stakeholder‟s professionals from the type of organization and their experience on the criticality of these factors. This study will assist the construction stockholders practitioners to develop plans to achieve their goals and improve the megaproject process on the basis of these outlined concepts.
Keywords: Mega construction projects, project management, risk identification, risk assessment, project life cycle, risk management
1. Introduction
Risk is an vital aspect to consider in any project as it can affect several key factors of any project, such as the cost-benefit analysis during the project lifecycle and the demand, production costs, execution time, and financial variables (De Palma, Picard, & Andrieu, 2012). The notion of risk analysis has been established as an imperative procedure in any project (Sanderson, 2012). However the crucial necessity of risk analysis is amplified further when it is put in to the realm of megaprojects where each risk has significantly more impact and ramifications for the stakeholders involved (Irimia-Diéguez, Sanchez-Cazorla, & Alfalla-Luque, 2014). Any construction activity fundamentally carries with it certain level of risk. The level of the risk is directly correlated to size and complexity of the construction project (Flyvbjerg, Bruzelius, & Rothengatter, 2003; Irimia-Diéguez et al., 2014; Perry & Hayes, 1985; Smith, Merna, & Jobling, 2009). Consequently, understanding and managing the wide array of risks associated with construction projects has been recognized as an important management process in order to maximize the chances of achieving project objectives in terms of time, cost, quality, safety and environmental sustainability (Tipili

80 ICSD Book of Proceedings (2017), 5, 79-88
Published by ECSDEV, Via dei Fiori, 34, 00172, Rome, Italy http://ecsdev.org
& Ibrahim, 2015). The concept of risk analysis has been established as an imperative procedure in any project (Sanderson, 2012). The essential for identifying and managing risk is even more important when viewed from the perspective of Mega Construction Projects (MCP). In a MCP the risks involved are amplified significantly due to the sheer size and complexities MCP‟s projects involve. The construction of megaprojects requires resources that run into millions of man hours and have massive budgets with a vast array of stakeholders from the construction sector. These unique factors introduce complexities and other unclear risks into their execution. As megaprojects, are occasionally implemented when compared to general construction projects, the knowledge with regards to the risks associated with them is very limited. Kuwait is planning to implement huge infrastructure and development projects through its long-term strategies from 2007 until 2035 to elevate the country is position to the region‟s top commercial and financial hub (Helmy, 2011). Therefore, understanding the risks associated with megaproject is crucial for the successful implementation of the planned developments. Historically, outputs of construction megaprojects have garnered a bad reputation largely due to regularly actual poor project management performances, cost and time escalations, and poor outcome quality. Previous studies have reported that despite their growing popularity and adoption, construction of megaprojects are associated with enormously poor performance and design consisting of poor outcome quality, benefits shortfall, time and cost escalation, and fail to deliver in the terms used to justify the need for the project (Flyvbjerg et al., 2003). Also, a number of researchers have reported that megaprojects poor performance are due their inherent characteristics such as uncertainty, high complexity, high risk, huge project size, large variety and number of people involved, political influence (van Marrewijk, Clegg, Pitsis, & Veenswijk, 2008). Moreover, decision maker operates within limited rationality and decisions are based on incomplete information or incorrect data. Consequently, it is important to establish a method and system to manage these risk factors effectively in advance. Additionally, it is essential to manage the probability of such risk factors causing failures in the project by implementing models or mitigation measures (Locatelli, Mancini, & Ishimwe, 2014). Although there is a wide body of general research on megaprojects, the current literature fails to provide a frameworks/guidelines for construction industry practitioners which advise on the risks of megaprojects and how best to mitigate them (Walker, 2015) This type of research is even more limited when put in to the context of addressing the risks associated with megaprojects in Kuwait and the wider region. Moreover, very little research has probed risks from the perspectives of project stakeholders groups (Tipili & Ibrahim, 2015). This study demonstrates results of an ongoing research endeavour. Consequently, initial results of this on-going study reveal the challenges and risks associated to megaprojects perceived by Kuwait‟s construction industry stakeholders. Initial phase results analysis has revealed 54 perceived risks in total, which are grouped under six categories; namely political, economic, technical, environmental and social risks. The results show that there is a significant difference in the perception of the criticality of these factors based on the stakeholder‟s level of experience and sector of organization. Kuwait finds itself in a unique position in the construction world as many megaproject ‟s

S. AlSanad 81
© 2017 The Author. ECSDEV Compilation © 2017 European Center of Sustainable Development.
have been given the greenlight by the government with the aim of improving and enhancing the country‟s infrastructure and regional standing. Therefore it is crucial to better understand the risks involved in this sort of construction activity. Moreover, it is absolutely imperative to garner first-hand insight from local construction industry stakeholders who know the state of the construction sector in Kuwait in order to devise accurate and feasible roadmaps and action plans to minimize and mitigate the reverberations of said risks. This research seeks to highlight the differences in stakeholder‟s perceptions towards the potential and significance of the risks involved with conducting mega project construction in Kuwait. 2. Methodology
Survey method is general for of data collection in field of construction management and logistics research and assists as a broad method for obtaining raw data (El-Sayegh, 2008; Prasitsom & Likhitruangsilp, 2015). In this study, structural questionnaire survey was used as a key tool for gauging the respondents' perception of probability of occurrence and the level of impact for each of the identified risk factors. The literature review and the semi structure interviews assisted as the basis and guidelines for designing the questionnaire survey. A pilot study was conducted in order to verify that the instructions, language, scale items, and understanding of the questions used in the questionnaire were clear (Pallant., 2010). The first draft of questionnaire was delivered to a list of 15 stakeholders involved in the construction industry to observe difficulty and problems during the response process. The group was asked to comment on the readability, accuracy, and comprehensiveness of the questionnaire. According to the replies made by all 15 members, minor comments were made, except that some slight mistakes were found, which were corrected as a result. Importantly, the final version of the questionnaire included all amends suggested by the respondents. The questionnaire in its final version, including question based on the Likert scale questions. Risk assessment in terms of the perceived level of impact and probability of the occurrence of a list of 54 risk factors in relation to the construction a mega project within the Kuwait construction Industry using a five-point Likert scale (1 = very low; 2= low, 4 moderate; 4= high; 5 = very high probability and impact). The survey was distributed to local construction stakeholders with experience in Kuwait's building and construction industry. Nonprobability sampling techniques were used to maintain a high degree of legitimacy of the received data. To assist respondents and improve the response rate, a web based questionnaire was designed and the link was sent by email to all respondents. To maintain high degree of legitimacy of received data, out of 700 questionnaires were administered, 536 questionnaires were filled and returned. This represents 76.5% of the total questionnaires sent out which is considered sufficient for the study based on the perception of Oke and Ogunsemi (2009) that the result of a survey could be considered as biased and of little significance if the return rate was lower than 20-30 % . The data collected from the questionnaires was then collated and analysis. Data gathered from the survey was analyzed using the Relative Importance Index (RII). For this nature of data, the standard deviation and mean of each risk factor are not

82 ICSD Book of Proceedings (2017), 5, 79-88
Published by ECSDEV, Via dei Fiori, 34, 00172, Rome, Italy http://ecsdev.org
appropriate to determine the whole results because they do not reflect any relationship between the risk factors (Ghosh & Jintanapakanont, 2004). An RII value was calculated for the probability and impact of each risk factor. The same approach has been used by many researchers to analyses the probability and impact of risk factors (El-Sayegh, 2008; Ghosh & Jintanapakanont, 2004; Gündüz, Nielsen, & Özdemir, 2013). Relative Importance Index (RII) is calculated using the following equation (Karim, Rahman, Memmon, Jamil, & Azis, 2012):
(1) Where a = the weight assigned to each response, N = total number of responses, n = frequency of each response, 5 = the greatest weight The probability and impact of each factor is multiplied to obtain the degree of risk. The prioritized risk factors can be assessed further in order to conduct a quantitative analysis of the degree of risks. "The specific combinations of probability and impact lead to a risk being rated as „high‟, „moderate‟, or „low‟ significance” (Project Management Institute, 2008) 3. Results of Analysis
Expert judgment was elicited through the distribution of a survey questionnaire to government and private sector construction industry stakeholders in Kuwait. To maintain high degree of legitimacy of received data, a total of 700 questionnaires were distributed to the sample population and 536 questionnaires were collected from the respondents with a response rate of 76.5%. . This represents 76.5% of the total questionnaires sent out which is considered sufficient for the study based on the perception of Oke and Ogunsemi (2009) that the result of a survey could be considered as biased and of little significance if the return rate was lower than 20-30 %. Table 1 below illustrates the respondents‟ profile.The survey question comprised of questions which were designed to ascertain the respondents‟ perceptions on the risks and risk significance of conducting mega projects construction in Kuwait. This research specifically collated information from the aforementioned stakeholder groups based on their academic qualification, years in service, the likely number of projects they have handled with the value of the project. Other data that was collected includes information about their perception of risk factors, likelihood of occurrence of risk factors and its impact on the performance of the projects.

S. AlSanad 83
© 2017 The Author. ECSDEV Compilation © 2017 European Center of Sustainable Development.
Table 1: Respondents‟ Profile
Category Number %
Business category
Developer/Client 24 5% Contractor 63 14% Supply chain 39 8% Owner 37 8% Research institute 55 12% Facility Manager 14 3% Subcontractor 39 8% Consultant 107 23% Other 83 18%
Types of Megaprojects involved in
Oil Sector 54 12% Industrial 43 9% Electricity & water 66 14% Educational 58 13% Health 33 7% Tourism 16 3% Services 82 18% Sport 20 4% others 89 19%
Type of organization
Government sector 214 46% Private sector 247 54%
Table 1 illustrates the respondents‟ profile. The outcomes results reveal that the majority of participants (54%) belonged to the private sector, whereas 48% of the participants belonged to the government sector. The majority of survey participants, 23%, were consultants, while14% were contractors, 12 % worked for research institute, 8 % were supply chain, 8% for owner, 8% subcontractor, 5 % were developers, and 3 % were facility managers. The richer the experience of participants in the construction sector results in getting better information about the perceptions of risk for the construction and implementing the practices of megaprojects in Kuwait. The results specified that the majority of the respondents had been complicated in different natures of megaprojects project. 3.1 Risk Identification & Analysis
A total 54 risk factors been identified from the Literature review and interview survey, which been categorized into six risk category such as : political risk , the supply chain risk social risk, Environmental Safety and Health risk, environmental risk, technical risk , and lastly economical risk. The survey participants were asked to rate probability of occurrence and the level of impact of each risk factors according to the following Likert scale: „1‟ very low , „2‟ denoting low, „3‟ denoting medium , „4‟ high, and „5‟ very high.

84 ICSD Book of Proceedings (2017), 5, 79-88
Published by ECSDEV, Via dei Fiori, 34, 00172, Rome, Italy http://ecsdev.org
3.2 Reliability Test To certify the reliability of individually risk factor, Cronbach‟s coefficient alpha
was performed to test the internal consistency amongst the items included in each factor (Pallant., 2010). The results show that the internal consistency is 0.968 for the probability of risk factors whereas 0.962 is for the impact of risk factors. According to Pallant. (2010), the internal consistency is considered to be confirmed at the Cronbach Alpha of 0.7 or above. Therefore, both the values are at an acceptable level for making all factors reliable. 3.3 Risk Identification & Analysis
The survey endorsed participants to delivered numerical scores that conveyed their perception on probability of occurrence and level of impact of each factor to deliver mega project. For this nature of data, the mean and standard deviation of each factor are not appropriate to determine the generally results because they do not reflect any association between the risk factors (Ghosh & Jintanapakanont, 2004). Instated, the risk factors collected from the survey were analyzed statistically using Relative Important Index (RII). According to the RII, the risks indicated by the stakeholders were then ranked as the results are shown in the Table 2. According to risk rating values, the most significant risk identified was „The length documentary cycle‟ (also known as Project Initiation Documentation) in the life cycle of the project (RII = 0.80) followed by „Variation order to project during the construction phase‟ (RII= 0.73). Other important risk factors were „Delay in paying subcontractors invoices‟ (RII= 0.71), „Technical difficulties in obtaining utility permits‟ (RII= 0.69), and „Lack of financial resources and Cash flow problem of partners„ (RII = 0.69). Table 2: Overall Ten Most Significant Risks According To Interview Participants
Risk RII Ranking
T.1 The length of the documentary cycle during the project lifecycle 0.80 1 T.6 Variation order to project during the construction phase 0.73 2 T.19 Delay in paying subcontractors invoices 0.71 3 T.9 Technical difficulties in obtaining utility permits 0.69 4 E.1 Lack of financial resources and Cash flow problem of partners 0.69 5 T.7 Incorrect project cost & time estimation. 0.68 5 SC.1 Delay of materials & equipment supply. 0.67 7 P.1 Bureaucracy and corruption practices 0.67 8 SC.3 Shortage in manpower availability 0.67 9 E.3 Material price changes 0.66 10
3.3.1 Inferential Statistics
Inferential test performed to explore the differences and/or relationships if any in the data in order to test the hypotheses. The Mann-Whitney U test was used to test the following hypotheses: H1: There is a difference in stakeholders' perception of the risk factors affecting the delivery of mega projects based on their organization type.

S. AlSanad 85
© 2017 The Author. ECSDEV Compilation © 2017 European Center of Sustainable Development.
3.3.2 Results of Hypothesis 1 3.3.2.1 Mann-Whitney U test for Impact level for group of Risk.
Before presenting the results of Mann-Whitney U test, it is vital to oversee the purpose for the selection of this test from the non-parametric tests. The Mann-Whitney U test is used when the two independent groups are involved in the data collection, which can be seen in this situation. Two independent groups such as private and government sectors are involved in the data presented in the table below. Table 3: Result of the Mann-Whitney U Test for the level of impact risk.
Ranks
Mann-Whitney U Test Statistics a
Mann-Whitney
U Wilcoxon
W Z
Asymp. Sig. (2-tailed)
Technical 30534.500 69037.500 -3.162 .002
Economical 32966.000 66119.000 -1.599 .110
Social 30306.500 68809.500 -3.136 .002
Political 30877.500 69380.500 -2.786 .005
Supply Chain 31820.000 70323.000 -2.244 .025
Environmental , Safety and Health risk 31667.000 70170.000 -2.318 .020
The following Mann-Whitney Test was performed between impact level for risk group and organization type to find out any statistical significance. The results are suggested as significant if the p-value is less than 0.05. Evidently the p-value for all group expect „economic risk’ are less than 0.05, which meant that there is a difference between the stakeholders‟ perception about the impact level for the group of risk expect „economical risk‟ based on their organizational type and as the confidence level is greater than 95%. So for these factors H1 is accepted. Noticeably those respondents from „government sector‟ discipline provide more importance to the impact level of risk factors associated with construction mega project in Kuwait. This is further elucidated with the help of mean rank values generated by the same test. Since the significance values in table 12 are less than 0.05 hence a significant difference can be seen in the mean rank values between working for all the risk category except economic risk and its group average. The mean rank values for „government sector‟ discipline aerospace industries are more than those of „private sector” which means that „government sector‟ are facing more problems in the implementation of megaproject in Kuwait construction industry. 4. Conclusion
This study identified the risks associated with construction of a mega project. Following to a thorough mixed research method, literature review which was conducted to shortlist potential risks related to megaprojects, the identified risks were evaluated and ranked using a mixed method approach which entailed qualitative semi structured interviews and qualitative questionnaires involving Kuwait‟s construction industry

86 ICSD Book of Proceedings (2017), 5, 79-88
Published by ECSDEV, Via dei Fiori, 34, 00172, Rome, Italy http://ecsdev.org
stakeholders. The results of the study demonstrate that although there is some consensus, fundamentally there are stark differences in the risk perceived to be most significant by the two stakeholder groups. The results show that every risk listed in the survey was perceived by the respondents as a significant risk. However, the differences occur when the focusing on the risks that the different stakeholder groups deem to be the most significant. The results highlight that the private sector stakeholders perceive the risks related to the economic aspects of mega project to be more significant. Whereas the Government sector stakeholders give more precedence to the technical, political, social, environmental, safety and health risks associated with mega projects. Understandably, the private sector emphases on economic risk such as “Lack of financial resources and cash flow problem of partners” and “Global economic recession”, since the private firms are profit orientated and look to make the most financial gain and the least financial loss. The vast majority of the private sector respondents indicated that their organizations focus on the financial risk involved in mega project construction more than other risk factors. Respondents representing the government sector stated that the risk they perceived to be the most significant was the technical risk. Both groups reach a consensus with relation to the general lack of experts available in the field of mega construction project. This result coincides other research conducted by, who also conclude that the lack of experts available to manage mega construction project has a detrimental impact on the project itself leading to financial loss. A mega project due to its size and critical nature necessitates expert management in order to minimize risk occurrence for the private sector some the risks can be managed through internal resources and experts, other more complex risk require the need for external intervention in several alternative forms such as contractors and outsourcing. References De Palma, André, Picard, Nathalie, & Andrieu, Laetitia. (2012). Risk in transport investments. Networks and
Spatial Economics, 12(2), 187-204. El-Sayegh, Sameh Monir. (2008). Risk assessment and allocation in the UAE construction industry.
International Journal of Project Management, 26(4), 431-438. Flyvbjerg, Bent, Bruzelius, Nils, & Rothengatter, Werner. (2003). Megaprojects and risk: An anatomy of ambition:
Cambridge University Press. Ghosh, Sid, & Jintanapakanont, Jakkapan. (2004). Identifying and assessing the critical risk factors in an
underground rail project in Thailand: a factor analysis approach. International Journal of Project Management, 22(8), 633-643.
Gündüz, M., Nielsen, Y., & Özdemir, M. (2013). Quantification of Delay Factors Using the Relative Importance Index Method for Construction Projects in Turkey. Journal of management in engineering, 29(2), 133-139. doi: doi:10.1061/(ASCE)ME.1943-5479.0000129
Helmy, Mohamed Ahmed. (2011). Investigating the critical success factors for PPP projects in Kuwait. Irimia-Diéguez, Ana I, Sanchez-Cazorla, Alvaro, & Alfalla-Luque, Rafaela. (2014). Risk management in
megaprojects. Procedia-Social and Behavioral Sciences, 119, 407-416. Karim, N. A. A., Rahman, I. A., Memmon, A. H., Jamil, N., & Azis, A. A. A. (2012). Significant risk factors in
construction projects: Contractor's perception. Paper presented at the Humanities, Science and Engineering (CHUSER), 2012 IEEE Colloquium on.
Locatelli, Giorgio, Mancini, Mauro, & Ishimwe, Alice. (2014). How can system engineering improve supplier management in megaprojects? Procedia-Social and Behavioral Sciences, 119, 510-518.

S. AlSanad 87
© 2017 The Author. ECSDEV Compilation © 2017 European Center of Sustainable Development.
Oke, AE, & Ogunsemi, DR. (2009). Competencies of quantity surveyors as value managers in a developing economy. Paper presented at the The Construction and Building Research Conference of the Royal Institutions of Chattered Surveyor.
Pallant., Julie. (2010). SPSS survival manual: a step by step guide to data analysis using SPSS (4th edn ed.): Maidenhead : McGraw-Hill 2010.
Perry, JG, & Hayes, RW. (1985). Risk and its Mangement in Construction Projects. Proceedings of the Institution of Civil Engineers, 78(3), 499-521. doi: 10.1680/iicep.1985.859
Prasitsom, Apichart, & Likhitruangsilp, Veerasak. (2015). Managing Risks in Forming International Construction Joint Ventures in Thailand. International Journal of Construction Engineering and Management, 4(4), 106-121.
Project Management Institute, PMI. (2008). A guide to the project management body of knowledge (PMBOK® GUIDE) (4th ed. ed.). Newtown Square, PA: Project Management Institute.
Sanderson, Joe. (2012). Risk, uncertainty and governance in megaprojects: A critical discussion of alternative explanations. International Journal of Project Management, 30(4), 432-443. doi: http://dx.doi.org/10.1016/j.ijproman.2011.11.002
Smith, Nigel J, Merna, Tony, & Jobling, Paul. (2009). Managing risk: in construction projects: John Wiley & Sons. Tipili, Luka Goji, & Ibrahim, Y. (2015). Identification and assessment of key risk factors affecting public
construction projects in Nigeria: stakeholders’ perspectives In: Ogunsemi, DR, Awodele, OA, and Oke, AE. Paper presented at the Proceedings of the 2nd Nigerian Institute of Quantity Surveyors Research Conference Federal University of Technology, Akure.
van Marrewijk, Alfons, Clegg, Stewart R., Pitsis, Tyrone S., & Veenswijk, Marcel. (2008). Managing public–private megaprojects: Paradoxes, complexity, and project design. International Journal of
Project Management, 26(6), 591-600. doi: http://dx.doi.org/10.1016/j.ijproman.2007.09.007 Walker, Derek. (2015). Risk managing complex projects through alliancing. The Journal of Modern Project
Management, 2(3).

88 ICSD Book of Proceedings (2017), 5, 79-88
Published by ECSDEV, Via dei Fiori, 34, 00172, Rome, Italy http://ecsdev.org

5th International Conference on Sustainable Development 6-7 September 2017, Rome, Italy
Book of Proceedings 5, 89-98 Doi: 10.14207/5ICSD2017
|1Division of Sustainable Development (DSD), College of Science and Engineering (CSE), Hamad Bin
Khalifa University (HBKU), Qatar Foundation (QF), Education City, Doha, Qatar
Review of Existing Approaches to Manage Sustainability and Moving Towards a Sustainability Management System Framework
By Waqas Nawaz1, Muammer Koҫ1
Abstract Sustainable development is the world‟s most ambitious goal at present and organizations have made many efforts in the last two decades to achieve this objective through appropriate management of sustainability. There are numerous studies which argue that the integration of environment, economics and social systems can be adequate to address the sustainability challenges of present era however, a holistic method for the management of sustainability is still lacking. On one hand, the integration of the multidisciplinary goals is essential for sustainable development of organizations but at the same time the integration of complex systems to manage sustainability may not be completely effective and such an effort may raise a number of presently unknown concerns. Some researchers have argued that since the shift towards sustainable development must not be trivial rather fundamental, we should focus on the sustainability issues as an independent matter, which cannot entirely be addressed by the integration of existing systems. In an effort to propose holistic sustainability management system we will discuss and combine the literature on the integration of existing management systems, ISO standardized guidelines for developing management systems (particularly sustainability management system), and the literature on sustainability assessment methods. Our contribution is different from other authors in two ways: (1) we have looked into the management of sustainability as a distinct concept rather than the integration of existing management systems, which many authors have done in the past, and (2) the proposed framework for sustainability management establishes clear connections between the processes required to systematically manage sustainability. The multi-dimensional focus of sustainability management framework (SMF) is one of its key strengths. Economic, quality, environmental, health and safety, and social challenges can all be managed through the application of this standalone framework. However, the large investment of time and resources is its weakness. In future, we aim to extend the proposed SMF to address the time and resource issues and further explore the implementation challenges.
Keywords: Sustainability management system, integration of management systems, ISO guidelines for development of sustainability management system, sustainability assessment.
1. Introduction
Sustainable development (SD), being the most challenging goal of the current century, has been the focus of discussion of various authors and commentators. Several definitions, explanations, and frameworks of sustainability have been proposed in the last two decades. Some argue that the environmental management may be sufficient to manage sustainability (Vnoučková, Hyršlová, & Tomšík, 2014; Winn & Pogutz, 2013), as environment is the most compromised element, while others believe that the integration

90 ICSD Book of Proceedings (2017), 5, 89-98
Published by ECSDEV, Via dei Fiori, 34, 00172, Rome, Italy http://ecsdev.org
of existing management systems (MS) may be an effective way of managing organizational sustainability (Samy, Samy, & Ammasaiappan, 2015; M. Rebelo, Santos, & Silva, 2014). Some authors have noted that the individual management system standards (MSS) may be extended to incorporate the sustainability objectives which may avoid the need of a standalone sustainability management system (SMS). However, these individual MSS may not be sufficient to effectively address the holistic sustainability needs of organizations1, which will be explained in detail later in this paper. We aim to review and understand the existing methods for sustainability management. Based on this review, we attempt to develop a sustainability management framework (SMF) at a general level, coherent with the existing approaches. Our work has its uniqueness in two ways; first, we aim to bring the isolated sustainability concepts in a single framework, and second, we highlight the processes which are required to be systematically undertaken to ensure effective application of any SMS. The standalone SMF is robust in its structure due to its three-fold methodological basis. First, the proposed SMF is consistent with the academic literature on sustainability management systems to ensure that it is fundamentally correct. Secondly, it is in line with the ISO standardized guidelines to assure its global acceptability. Third, the proposed SMF incorporates a systematic assessment mechanism which guides the overall system in the right direction. 2. Background Review
McKinsey and Company conducted a survey to explore why and how companies are undertaking sustainability (Bonini, Gorner, & Jones, 2010). The results of this study indicate that even though organizations recognize the critical importance of sustainability, most of them do not practically engage in the management of sustainability. This trend is primarily due to the uncertainties associated with the return on investment and is partly due to the inability of organizations to understand the holistic perspective of sustainability (P. J. T. Domingues, Sampaio, & Arezes, 2011; Naudé, 2011). In a similar study carried out by the UN Global Compact, similar conclusions were drawn (Hayward et al., 2013). The UN Global compact reported the opinion of more than 1000 CEOs on sustainability management, and surprisingly, only 33% of the CEOs were reported to believe that the businesses are doing enough to touch the core of sustainable development. On the other hand, 84% of the CEOs were reported to opine that businesses should set the example in addressing the global sustainability challenges. It implies that although organizations fully understand the significance of sustainability management, it tends to ignore sustainability at the operational level. From Spenner and Freeman's (2013) study, we can argue that the organizations tend to ignore sustainability in its operations mainly due to its lack of understanding of sustainable development. Also, the availability of a large number of isolated sustainability management options leave the organizations confused as ever about the „best choice‟ specific to their case.
1 „Organization‟ in this paper include companies, businesses, municipalities, local governments, non-
governmental organizations etc.

W. Nawaz, M. Koҫ 91
© 2017 The Authors. ECSDEV Compilation © 2017 European Center of Sustainable Development.
While the integration of multidisciplinary objectives is indispensable for creating a balance between the pillars of sustainability (Esquer-Peralta, Velazquez, & Munguia, 2008), the integration of existing standards to manage sustainability may not be a feasible solution. As the scope and construct of these standards are mostly different from each other (Karapetrovic 2002), the integration of these systems may not synchronize well, rather it may raise a number of presently unknown concerns. Another issue with integration of standards, largely argued in literature, is that it is the natural human tendency to resist change in status quo and therefore, humans tend to move backwards – towards the pre-integration zone (J. P. T. Domingues, Sampaio, & Arezes, 2014; Raišienė, 2011). Our sustainability aspirations demand more than integration. “No problem can be solved from the same level of consciousness that created it – Albert Einstein”. A three-way literature search has been carried out to cover the depths of this topic and ultimately combine these ideas in a new sustainability management framework (SMF). The first part of literature review discuss the schemes for sustainability management that have been presented in the academic literature. The second part explains the requirements of the ISO guidelines dealing with the management system structure and sustainability management in the standards (guide 72. Annex SL, guide 82) while the third part talks about the sustainability drive in the MS through sustainability assessment mechanism. A keyword search for “sustainability management system”, “sustainability management framework”, “integrated sustainability management”, and “non-financial system management” has been carried out in Google, Google Scholar, Elsevier, Emerald, JSTOR, John Wiley Publications, Proquest, Sage Publications, Springer-Verlag, and Taylor and Francis. Journal and magazine articles, and organizational reports have been critically reviewed. The type of work, methodology and important learnings have been shown in Table 1. Table 1: Literature review of managing sustainability through integrated or standalone systems
Reference Type of Work Methodology Important Learning
Asif et al. (2011)
Integration of MSS
Integration based on Deming wheel process cycle, i.e., plan-do-check-act
(PDCA)
The requirements of an Integrated Management System (IMS) have to come from stakeholders, however,
these should be scanned and prioritization based on their
legitimacy
Jørgensen (2008)
Integration of MSS
Transverse connections between the
standards
Instead of standardizing standalone MSs for sustainability management, it is effective to integrate existing MSSs

92 ICSD Book of Proceedings (2017), 5, 89-98
Published by ECSDEV, Via dei Fiori, 34, 00172, Rome, Italy http://ecsdev.org
Reference Type of Work Methodology Important Learning
Jørgensen et al. (2006)
Integration of MSS Partial integration
and total integration
Partial integration is usually effective at basic level but the integration of
overall systems may require application of multiple approaches
together, for example, strategic management approach, system based
approach, and process based approach
MacDonald (2004)
Integration of sustainability goals
within the minimum requirements of a
single MSS (ISO14001)
Back casting method
There are five levels of planning which can incorporate sustainability
goals within an established ISO14001 standard. These are constitutional, objective, strategic, action, and tool
Keysar (2005)
Procedural integration of sustainability tools
U.S. army case study
The integration of various tools, such as comprehensive system planning
and Environmental Impact Assessment (EIA), can tremendously
improve the overall sustainability performance compared to when
these tools are applied independently
Jonker & Karapetrovic
(2004) Integration of MSS
Systems based approach
The function of existing MSS is only to address the needs of the stakeholders and therefore,
synchronizing the needs, rather than the MSS, can enhance the overall
performance of the system.
Rebelo et al. (2016)
Integration of MSS Process based
integration
The formulation and implementation of coherent policy is the most crucial phase in the integration process since the shortcoming of these two system
elements may have significant adverse consequences.
Mustapha et al. (2016)
Integration of MSS Cross-linkages between the
elements of MSSs
The proposed sustainable green management system provides
guideline for the implementation of IMS according to the standard ISO criteria, however, the focus of the
study has largely been „greening‟ and environmental management, similar to (Keysar, 2005; MacDonald, 2004)
Grunda (2011)
Transformation of business model
Cyclic model
Systematic learning from the existing processes is a prerequisite for
effective management of sustainability

W. Nawaz, M. Koҫ 93
© 2017 The Authors. ECSDEV Compilation © 2017 European Center of Sustainable Development.
Reference Type of Work Methodology Important Learning
Azapagic (2003)
Standalone Corporate Sustainability
Management System (CSMS)
In collaboration with various
industries
Involvement of stakeholders and adoption of risk based approach may
effectively help to address the sustainability issues of corporations
The structure of any new system should also be aligned with already established standardized guidelines to ensure its wide acceptability. We have briefly discussed the requirements of ISO standardized guidelines with regards to the structuring of standards and systems in Table 2. Table 2: Review of the requirements of ISO standardized guidelines for the development of MSSs
Guideline Purpose Important Learning
ISO Guide72 (ISO, 2001)
Guidelines for the justification and
development of MSSs
The main components of new MSS include the identification of affected parties, the need for an MSS, sector-specific MSS proposals, value of an MSS, and risk of incompatibility, redundancy and proliferation.
The standard common elements of ISO MSSs include policy, planning, implementation and operation, performance assessment, improvement and management review.
Annex SL (ISO/IEC Directive,
2012)
Consistency in high level structure, core text,
common terms and core definitions of different
MSSs
The 10 elements of high level structure are following: 1- Scope | 2- Normative Reference 3- Terms and Definition | 4- Context of Organization 5- Leadership | 6- Planning | 7- Support | 8- Operation 9- Performance Evaluation | 10- Improvement
The 8 principles for justification of new MSSs include: 1- Market Relevance | 2- Compatibility | 3- Topic Coverage 4- Flexibility | 5- Free Trade 6- Applicability of Conformity assessment | 7- Exclusions 8- Ease of Use
Guide82 (ISO, 2014)
The guidelines for addressing sustainability
in standards
Guide82 suggests various methods to approach sustainability right from the planning phase of the system. These methods include the systematic approach, life cycle approach, precautionary approach, risk-based approach, and stakeholder approach.
Guide82 emphasize to include only those „sustainability principles‟ and „sustainability issues‟ which are relevant to the type of the business
Guide82 suggest to establish trade-off rules
Similar to the „risk assessment‟ of health and safety, and „environmental impact assessment (EIA)‟ of environmental management, sustainability management also needs

94 ICSD Book of Proceedings (2017), 5, 89-98
Published by ECSDEV, Via dei Fiori, 34, 00172, Rome, Italy http://ecsdev.org
an assessment mechanism that steers the direction of development in the right direction. The assessment methods for sustainability proposed in the literature include environmental impact assessment (EIA), Strategic Impact Assessment (SIA), Triple Bottom Line (TBL), Integrated Assessment (IA), and Sustainability Assessment (SA). Without going into the details of these individually, we will discuss the comparison between the advantages and disadvantages of these methods. Hacking & Guthrie (2008) have compared these assessment methods based on the strategic focus, comprehensiveness of coverage, and integration of themes. The results shown in Table 3 suggest that SA method cover all the essential features expected from sustainability assessment method. Table 3: Comparision of the elements of various assessment processes for sustainability (Hacking & Guthrie, 2008)
Assessment method
Strategic focus
Comprehensiveness of coverage
Integration of the themes
EIA No No No
SIA Yes May be May be
TBL May be Yes No
IA May be May be Yes
SA Yes Yes Yes
We have summarized the features of an expert SA framework as following:
Ensure three-dimensional focus.
Conceive sustainability principles.
Establish trade-off rules.
Use indicators to measure the performance of the system.
Establish short and long-term goals.
Involve stakeholders.
Assess various options before selecting the sustainability strategy.
Report the outcomes. 3. Sustainability Management Framework (SMF)
In this section we have combined the work presented in the literature review to formulate a holistic sustainability management framework (SMF), shown in Figure 1. The framework is based on the PDCA cycle and has six basic elements. At first, the organization2 needs to understand the relevance of its business with sustainability, or in other words, organizations should be able to understand how sustainability can be incorporated into its systems. This understanding should then be reflected in the vision and scope of organization. The vision and scope outlines the roadmap of the sustainability journey and hence we suggest that these should be documented right at the beginning to always look back and gauge the extent of
2 In this section, organization, although has been used as a noun, refers to the top management of the
organization or the board of directors or other authorities which hold the managing powers of an organization.

W. Nawaz, M. Koҫ 95
© 2017 The Authors. ECSDEV Compilation © 2017 European Center of Sustainable Development.
development. The organizations, based on its developed understanding of sustainability, should also establish clear sustainability principles which form the basis of sustainability goals and cannot be compromised. The second element of SMF emphasize on defining the boundary criteria and objectives, or simply, what an organization wants and what it does not want. Doing so is not an easy task since the actions of the organization directly affect its stakeholders and hence their input is also compulsory in this process. Organizations should form a scheme to interact with its stakeholders in order to identify relevant and important sustainability issues (materiality matrix may be used for this purpose). The prioritized sustainability issues should then be translated to the boundary criteria which reflects the unwanted state of the system. Building on this criteria, a risk assessment should be carried out to cover the defined scope and the operations of the organization. The risk assessment will not only help the organization in setting up the objectives but also the quantitative indicators for measuring those objectives. More detail on the processes to be carried out at this stage has been provided in Figure 1. The third element of SMF is to compliment the sustainability objectives of organization through appropriate sustainability initiative. At first, the organization should identify various sustainability initiatives that can attain a certain goal and later, these choices should be analysed relatively to assess their capacity to achieve the objectives. Once the suitable selection of sustainability initiative has been made, the management should start preparation and organization, which is the fourth element of SMF. A complete timeline should be defined for the execution of suitable sustainability initiative. Most importantly, the organization must build its capacity and extend its resources to assure effective implementation of the sustainability initiative. Furthermore, the data gathering procedures and guidelines, and the responsibilities and authorities must clearly be communicated at the relevant levels to make sure that everyone knows what is expected from them.

96 ICSD Book of Proceedings (2017), 5, 89-98
Published by ECSDEV, Via dei Fiori, 34, 00172, Rome, Italy http://ecsdev.org
Figure 1: Proposed sustainability management system framework (SMSF)
The fifth element of SMF is the implementation, monitoring and analysis phase. The overall plan has to be implemented at this level, at the same time, the organization should continuously monitor all activities and analyse the obtained data. Adaptive monitoring is essential to ensure effective implementation. Monitoring the system‟s performance in the light of mid-point indicators and boundary criteria can be extremely helpful in steering the direction of development. Once the results of the system are obtained at the end of the SMS cycle, the effectiveness of the sustainability initiative should be critically evaluated and reported, which is the final step of SMF. This will help the organization to identify improvement opportunities in the subsequent cycle of SMS that may even include the revision of sustainability vision, scope and principles. The reported parameters should be compared with the peers to set the benchmarks. Furthermore, all activities, evaluations, assessments, and analysis should be subjected to internal and external audits to ensure transparency and integrity of the system. 4. Conclusion and Future Work
This paper present an analysis on the sustainability management system for organizations. The discussion presented in this study highlight that although organizations and top-management recognize the importance of managing sustainability, the vague definition and lack of robust framework impede organizations from sustainability management at operational level. Efforts have been made to address the

W. Nawaz, M. Koҫ 97
© 2017 The Authors. ECSDEV Compilation © 2017 European Center of Sustainable Development.
latter through the integration of environment, economics and social systems but a holistic method for sustainability management is still lacking. We have tried to fill this gap by proposing a holistic framework for sustainability management, named sustainability management framework (SMF), which combines the literature on the integration of MSs, MSS, and SMS, ISO standardized guidelines for developing management systems, and the literature on sustainability assessment methods. The advantages of this framework include improved transparency, adaptive management, and systematic approach to sustainable development. On the other side, the implementation of such a system demands extensive investment of time and resources. In future, we aim to improve the time and resource constraint along with the validation of this framework. 5. Acknowledgement
An expanded version of this paper, titled „Review of Existing Approaches to Manage Sustainability and Moving towards a Sustainability Management System
Framework‟, by W Nawaz and M Koҫ, has been in preparation for a journal publication. It details the individual aspects of SMF. References Asif, M., Searcy, C., Zutshi, A., & Ahmad, N. (2011). An integrated management systems approach to
corporate sustainability. European Business Review, 23(4), 353–367. Azapagic, A. (2003). Systems Approach To Corporate Sustainability: A General Management Framework.
Process Safety and Environmental Protection, 81(5), 303–316. Bonini, S., Gorner, S., & Jones, A. (2010). How Companies Manage Sustainability. McKinsey Global Survey. Darnall, N., Henriques, I., & Sadorsky, P. (2008). Do environmental management systems improve business
performance in an international setting? Journal of International Management, 14, 364–376. Domingues, J. P. T., Sampaio, P., & Arezes, P. M. (2014). Analysis of integrated management systems from
various perspectives. Total Quality Management & Business Excellence, 26(11–12), 1311–1334.
Domingues, P. J. T., Sampaio, P., & Arezes, P. M. (2011). Management Systems Integration : A 3 - Dimensional Organisational Perspective. Journal of Quality and Reliability Management, 25(3), 292–312.
Esquer-Peralta, J., Velazquez, L., & Munguia, N. (2008). Perceptions of core elements for sustainability management systems (SMS). Sustainability Management Decision, 46(7).
Grunda, R. (2011). Strategic Corporate Sustainability Management Model. In Proceedings of the 1st World Sustainability Forum (pp. 1–30). MDPI.
Hacking, T., & Guthrie, P. (2008). A framework for clarifying the meaning of Triple Bottom-Line, Integrated, and Sustainability Assessment. Environmental Impact Assessment Review, 28(2), 73–89.
Hayward, R., Lee, J., Keeble, J., McNamara, R., Hall, C., Cruse, S., … Robinson, E. (2013). The UN Global Compact-Accenture CEO Study on Sustainability 2013: Architects of a Better World.
ISO. (2001). Guide 72: Guidelines for Justification and Development of Management System Standards. Geneva: International Organization for Standardization.
ISO. (2014). ISO Guide 82: Guidelines for addressing sustainability in standards. Geneva: International Organization for Standardization.
ISO/IEC Directive. (2012). Consolidated ISO Supplement: Annex SL (Proposals for management system standards). Geneva: International Organization for Standardization.
Jonker, J., & Karapetrovic, S. (2004). Systems thinking for the integration of management systems. Business Process Management Journal, 10(6), 608–615.

98 ICSD Book of Proceedings (2017), 5, 89-98
Published by ECSDEV, Via dei Fiori, 34, 00172, Rome, Italy http://ecsdev.org
Jørgensen, T. H. (2008). Towards more sustainable management systems: through life cycle management and integration. Journal of Cleaner Production, 16, 1071–1080.
Jørgensen, T. H., Remmen, A., & Mellado, M. D. (2006). Integrated management systems – three different levels of integration. Journal of Cleaner Production, 14, 713–722.
Jørgensen, T. H., & Simonsen, G. (2002). Prospects of a unified management system. Corporate Social Responsibility and Environmental Management, 9, 91–98.
Karapetrovic, S. (2002). Strategies for the integration of management systems and standards. The TQM Magazine. 14(1), 61–67.
Keysar, E. (2005). Procedural Integration in Support of Environmental Policy Objectives: Implementing Sustainability. Journal of Environmental Planning and Management, 48(4).
MacDonald, J. P. (2004). Strategic sustainable development using the ISO 14001 Standard. Journal of Cleaner Production, 13(6), 631–643.
Mežinska, I., Lapiņa, I., & Mazais, J. (2015). Integrated management systems towards sustainable and socially responsible organisation. Total Quality Management & Business Excellence, 26(5), 469–481.
Mustapha, M. A., Manan, Z. A., & Alwi, S. R. W. (2016). Sustainable Green Management System (SGMS) – An integrated approach towards organisational sustainability. Journal of Cleaner Production.
Naudé, M. (2011). Sustainable development in companies: Theoretical dream or implementable reality? Corporate Ownership & Control, 8(4), 352–364.
Raišienė, A. G. (2011). Advantages and Limitations of Integrate Management System: The Theoretical Viewpoint. Social Technologies, 1(1), 25–36.
Rebelo, M. F., Santos, G., & Silva, R. (2016). Integration of management systems: Towards a sustained success and development of organizations. Journal of Cleaner Production, 127.
Rebelo, M., Santos, G., & Silva, R. (2014). Integration of Individualized Management Systems (MSs) as an Aggregating Factor of Sustainable Value for Organizations: An Overview Through a Review of the Literature. Journal of Modern Accounting and Auditing, 10(3), 356–383.
Samy, G. M., Samy, C. P., & Ammasaiappan, M. (2015). Integrated Management Systems for Better Environmental Performance and Sustainable Development – A Review. Environmental Engineering and Management Journal, 14(5), 985–1000.
Spenner, P., & Freeman, K. (2013). To keep your customers, keep it simple. IEEE Engineering Management Review, 41(3), 67–72.
Vnoučková, L., Hyršlová, J., & Tomšík, P. (2014). How does implementation of environmental management system contribute to corporate sustainability management. Acta Universitatis Agriculturae et Silviculturae Mendelianae Brunensis, 62, 1499–1508.
Winn, M. I., & Pogutz, S. (2013). Business, Ecosystems, and Biodiversity: New Horizons for Management Research. Organization & Environment, 26(2), 203–229.
Zutshi, A., & Sohal, A. S. (2005). Integrated management system: The experiences of three Australian organisations. Journal of Manufacturing Technology Management, 16(2), 211–232.

5th International Conference on Sustainable Development 6-7 September 2017, Rome, Italy
Book of Proceedings 5, 99-104 Doi: 10.14207/5ICSD2017
|1Osaka Sangyo University
Possibility of Fluoride Removal using Volcano Ash Soils and Bone Charcoal as Adsorbents
By Tatsuhide Hamasaki1
Abstract In some regions of Southern Asia and Western Africa, it has been observed that groundwater used as a drinking water source contains more than 1.5 mg/L of fluoride, which is the standard value approved by the World Health Organization. Adsorption is one of the methods widely used for easy fluoride removal; therefore, adsorption and flow tests were conducted using volcano ash soils and bone charcoal as adsorbents. Bone charcoal has already been examined as a fluoride adsorbent; however, volcano ash soils have not been studied previously. The following results were obtained using adsorption tests: the fluoride adsorption coefficients of bone charcoal, Kanuma volcano ash soil, and Akadama volcano ash soil were 1,500, 700, and 490 mL/g, respectively. As the first step for use in a water purification plant, flow tests were conducted assuming a fixed bed adsorption tower. For a water flow rate of 2.0 m/day, 1.8 mg/L of fluoride was reduced to 0.2 and 1.0 mg/L using bone charcoal and Akadama soil, respectively. However, for the water flow rates of 3.0 or 4.0 m/day, 1.8 mg/L of fluoride was reduced to 0.2 and 1.7 mg/L using bone charcoal and Akadama soil, respectively. Therefore, it was observed that the adsorption of the Akadama soil is strongly affected by the water flow rate.
Keywords: Fluoride, Groundwater, Volcano Ash soil, Bone Charcoal, Adsorption
1. Introduction
In Japan, few groundwater sources contain over 0.8 mg F/L of fluoride, which is the tap water quality standard; groundwater containing higher fluoride content than that specified by the standard is not used for tap water. Therefore, the amount of the fluoride in the water is not particularly important. However, in Southern Asia and Western Africa, for technical and economic reasons, groundwater containing a high concentration of fluoride is often used for tap water, which may have a harmful effect on the bones of human beings The following methods are typically used for fluoride removal: 1) Calcium fluoride method: calcium hydroxide is added to produce calcium fluoride and flocculants are then added to precipitate calcium fluoride. 2) Hydroxide coprecipitation method: aluminum salt is added to produce aluminum hydroxide; then fluorine ions are adsorbed onto and coprecipitated with aluminum hydroxide. 3) Adsorption method: fluorine ions are adsorbed on a selective ion exchange resin made from rare-earth hydroxides. Recently, the adsorption method using bone charcoal and the separation method using a

100 ICSD Book of Proceedings (2017), 5, 99-104
Published by ECSDEV, Via dei Fiori, 34, 00172, Rome, Italy http://ecsdev.org
nanofiltration (NF) membrane have been studied for fluoride removal. A study of the adsorption method performed using bone charcoal focused on chicken bones due to the absence of religious issues involved while working with chicken bones. A previous study investigated the removal of fluoride in groundwater in Sri Lanka and examined the manufacturing process of bone charcoal based on the heating temperature and investigated the batch adsorption process1), 2). Another study focused on the separation method using nanofiltration membrane and examined the removal of fluoride in groundwater in Thailand using an NF membrane 3). Fluoride adsorption in the soils has been studied4), 5), and this study aims to examine fluoride adsorption of soils with different physicochemical characteristics. 2. Objectives and Methods 2.1 Objective
Following the previous studies mentioned above, adsorption tests of fluoride removal using bone charcoal and soils were examined and flow tests were performed to examine the feasibility of the use of these materials as the adsorbents in an applied fluoride removal system. 2.2 Adsorption Tests 2.2.1 Materials
The following materials are used as adsorbents in this study. 1) Bone charcoal Bone charcoal used in this study was obtained from Wako Chemicals Inc., Japan. Calcium phosphate is the main component of the bone charcoal. 2) Volcano ash soil Volcano ash soils have been studied for adsorption of phosphorus and organics for wastewater and ambient water treatment. Akadama soil and Kanuma soil in Tochigi Prefecture, Japan, are porous and contain iron and aluminum. The specific surface area, iron content, and aluminum content of Akadama soil are 34 cm2/g, 6.4%–7.8%, and 8.1%–12.9%, respectively. The specific surface area, iron content, and aluminum content of Kanuma soil are 112 cm2/g, 2.1%–2.3%, and 13.4%–16.8%, respectively. Iron and aluminum are some of the high-performance elements for coagulation and adsorption. Akadama and Kanuma soils are used for home gardening and are available in do-it-yourself stores in Japan. 3) Sludge from water purification plant used for iron reduction bacteria (henceforth called “sludge”) The sludge from the water purification plant using the iron reduction bacteria purification method has a high iron content. The sludge was produced by the water purification plant in Hyogo Prefecture, Japan, and was dried and levigated. The iron content of the sludge is 41%. 4) Filter sand for water purification plant (henceforth called “sand”) The sand used for the sand filtration in water purification plants was used as the control material in our tests. The sand used in this study is obtained from Kagoshima Prefecture, Japan.

T. Hamasaki 101
© 2017 The Author. ECSDEV Compilation © 2017 European Center of Sustainable Development.
2.2.2 Methods The test water used in this study was the commercially available natural mineral
water produced in France with a fluoride standard solution (Wako Chemicals Inc., Japan) mixed into the water; this was used to simulate the groundwater. 0–10 mg/L of fluoride with 50 mL of water was placed into each plastic bottle, along with 0–5.0 grams, respectively, of materials. All bottles were sealed and stored for one week at 25°C in the dark. Then, the water was filtrated using a paper filter (5C, Advantec Inc., Japan), and the fluoride concentration was analyzed via an ion chromatograph (Dionex ICS-1100 with AS23 column). The pH of the water is equal to 7.2. It was assumed that fluoride was sufficiently adsorbed to the materials after one week. Hence, the fluoride concentration after one week was considered to be the equilibrium concentration. The mass of fluoride initially present in the water in the plastic bottle is calculated as
𝑀0 = 𝐶0 × 𝑉, (1) where M0 = Mass of fluoride initially present in the water (mg) C0 = Initial fluoride concentration (mg/L) V = Mass of water in the plastic bottle (L) The mass of fluoride in the water at adsorption equilibrium in the plastic bottle is calculated as
𝑀 = 𝐶 × 𝑉, (2) where M = Mass of fluoride in the water at adsorption equilibrium (mg) C = Equilibrium concentration of fluoride (mg/L). The mass of the fluoride adsorbed on the material is calculated by
𝑀𝑐 = 𝑀0 −𝑀, (3) where Mc = Mass of the fluoride adsorbed on the material (mg) Adsorption quantity of the material is calculated as
𝑞𝑐 =𝑀𝑐
𝑚=
𝑉
𝑚 𝐶0 − 𝐶 , (4)
where qc = Adsorption amount (mg/g) m = Mass of the material (g). The adsorption is evaluated using the Freundlich adsorption isotherm with qc and C. The adsorption coefficient is calculated as
𝐾𝑑 =𝑞𝑐
𝐶=
𝑉
𝑚 𝐶0−𝐶
𝐶 =
𝑉
𝑚 𝐶0
𝐶− 1 , (5)
where Kd = Adsorption coefficient (L/g) Fluoride removal fraction is calculated as
𝑅 =𝐶0−𝐶
𝐶0× 100, (6)
where R = Fluoride removal fraction (%). 2.3 Flow Test

102 ICSD Book of Proceedings (2017), 5, 99-104
Published by ECSDEV, Via dei Fiori, 34, 00172, Rome, Italy http://ecsdev.org
The adsorption tower process is more suitable for the continuous water purification necessary to obtain stable water resources than the batch adsorption process. Therefore, flow tests using laboratory size column were performed for bone charcoal and volcano ash soil. Akadama soil was selected from volcano ash soils for the test. A schematic of the flow test is shown in Figure 1. The column is made from glass, has a diameter and height of 25 and 200 mm, respectively, and was manufactured by BIO-RAD Inc. The height of each material is 100 mm, and its volume is approximately 49 cm3. The raw water used for the test was groundwater that exceeds the Japanese environmental standard for fluoride, with a fluoride concentration of approximately 1.8 mg/L. Its pH was 7.3. Raw water was flowed in the sealed column using the constant rate pump at the rates of 2.0, 3.0, or 4.0 m/day; then the water flowed out of the column as treated water. Fluoride concentrations were analyzed following the same procedure as in the adsorption test.
Figure 1: Schematic of the flow test
3. Results and Discussion 3.1 Adsorption Test
The results of the adsorption tests are expressed in the Freundlich adsorption isotherm and are shown in Figure 2. The adsorption isotherm is given by
𝑞𝑐 = 𝑘𝐶𝑛 , (7) and can also written as
log 𝑞𝑐 = log 𝑘 + 𝑛 log𝐶 , (8) where k = constant; If k is larger, adsorption ability is higher. n = constant; If n is smaller, fluoride can be similarly adsorbed in a large range of concentrations. Table 1 shows the values of the k, n, chi-square value, and average coefficient of adsorption for each Freundlich adsorption isotherm.

T. Hamasaki 103
© 2017 The Author. ECSDEV Compilation © 2017 European Center of Sustainable Development.
Figure 2: Adsorption isotherm graph of adsorption test
Table 1: Results of adsorption tests
Material Constant k Constant n Chi-square value Average coefficient of adsorption (L/g)
Bone charcoal 1000 0.69 0.69 1.50
Akadama soil 360 0.68 0.72 0.49
Kanuma soil 630 0.85 0.99 0.70
Sludge 33 0.94 0.96 0.03
Sand 14 0.51 0.97 0.06
The adsorption coefficient of bone charcoal was the highest among the five materials examined in the adsorption test. The Kanuma and Akadama volcano ash soils also showed high fluoride adsorption coefficients. Thus, it was found that these materials may be used as the fluoride adsorbents. 3.2 Flow Tests
Figure 3 shows the flow test results. For the water flow rate of 2.0 m/day, bone charcoal could remove approximately 90% of fluoride and Akadama soil could remove approximately 50% of fluoride. For water flow rates of 3.0 and 4.0 m/day, the amount of removed fluoride was the same for bone charcoal as that removed at the flow rate of 2.0 m/day. On the contrary, for these flow rates, the Akadama soil was almost entirely incapable of removing fluoride. Thus, it was found that the performance of the Akadama soil is affected by the water flow rate.

104 ICSD Book of Proceedings (2017), 5, 99-104
Published by ECSDEV, Via dei Fiori, 34, 00172, Rome, Italy http://ecsdev.org
Figure 3: Flow test results
4. Conclusion
According to the results of both tests, bone charcoal was the best fluoride adsorbent in groundwater. Bone charcoal can be produced from food waste and is, therefore, easily available everywhere. However, religious issues must be taken into account. On the contrary, the obtained adsorption test results for Akadama soil were not as poor as expected. However, in the case of high water flow rate, Akadama soil was almost totally incapable of removing the fluoride. Therefore, the water flow rate must be considered if Akadama soil is used as the fluoride adsorbent. References Motoyama, A., Kawamaki, T., Weragoda, S. K., Okugawa K., Serikawa, Y., Masamoto, T., & Takamatsu, S.
(2012) Fluoride Contamination in Drinking Water in Sri Lanka and Fluoride Removal by Using Chicken Bone Char. Journal of Japan Society of Civil Engineers, 68(7), III_517–III_523.
Miyazaki, H., Nagasawa, S., Motoyama, A., & Kawakami, T. (2014) Chemical Reaction of Fluoride Removal by Chicken Bone Char. Journal of Japan Society of Civil Engineers, 70(7), III_527–III_534.
Matsui, Y, Takeda, T., Takizawa, S., Wongrueng, A., & Wattanachira, S. (2006) Evaluation of Nanofiltration Process for Fluoride Removal from Groundwater in the Ching Mai Basin. Journal of Japan Society of Civil Engineers, 62(4), 403–414.
Sugita, H., Komai, T., Okita, S., Tokunaga, S., & Matsunaga, I. (2005) Analysis on Adsorption Behavior of Fluorine on Clay Minerals using Freundlich’s Adsroption Equation. Journal of the Mining and Materials Processing Institute of Japan, 121(9), 416–422.
Sugita, H., Komai, T. & Imoto, Y. (2011) Fundamental Investigation on Soil Adsorption of Fluorine and Boron, Journal of the Mining and Materials Processing Institute of Japan, 127(4_5), 202–212.

5th International Conference on Sustainable Development 6-7 September 2017, Rome, Italy
Book of Proceedings 5, 105-120 Doi: 10.14207/5ICSD2017
|1Professor, Department of Economics, Department of Public Finance, Atilim University, 06836 Incek,
Ankara-Turkey
Choosing the Consensus for Sustainable Economic Development
By Sinan Sönmez1
Abstract The term consensus seems to be a good sales word and calls for a unifying principle for development and macroeconomic policy. But too much consensus has been formulated in a way that the term consensus “has become a fashionable and therefore less than reliable indicator of anything significant”. Nevertheless, the Washington consensus was the most influential in the 1990s. On the contrary, the Beijing consensus is considered as a challenge to the previous one and questioned whether it represents an appropriate solution and/or model for the Periphery. In fact, the Beijing Consensus is the term for the state-led capitalist development under a socialist regime in China. The Mumbai Consensus signifies the development experience of India which is characterized by the combination of the neoliberal reforms with government involvement in the economy. The Brazilian neo-developmentalism combines the neoliberal policy principles with the state intervention. It seems to be difficult to put all the experiences in a melting pot and construct a unique model for the emerging and developing countries. Nevertheless, the market driven reforms and the economic role of the state in the big emerging economies could offer an opportunity to find a common denominator for the development models or paradigms.
Keywords: Washington consensus, Beijing Consensus, Mumbai Consensus, development model, global value chain, high tech industry
1. Introduction
The emerging economies have different strategies and trajectories in different phases of the economic cycles. The study of the three big emerging economies (Brazil, India and China (BIC), subgroup of BRICS, in this paper shows that these countries, in the past and at present have specific macroeconomic policy regimes, industrialization strategies, mode of industrialization and development models. The problem consists in defining the common features of the macroeconomic and development policy in this group. It is also important to know whether the BIC countries have different or similar institutional frameworks. Nevertheless, the market driven reforms and the economic role of the state in the big emerging economies offer an opportunity to make a meaningful comparison between the models or paradigms. The study of the Brazilian, Indian and Chinese cases would permit to evaluate the level of rupture or compromise of the economic models with the Washington (and post-Washington Consensus) policy
1 Professor, Department of Economics, Department of Public Finance, Atilim University, 06836 Incek, Ankara-Turkey

106 ICSD Book of Proceedings (2017), 5, 105-120
Published by ECSDEV, Via dei Fiori, 34, 00172, Rome, Italy http://ecsdev.org
principles. The correlation with or deviation from the Washington Consensus would permit to make a final remark on the basic principles of the economic policy and development process and/or models in the above referred emerging economies. 2. The Original and ‘Augmented’ Washington Consensus
The Washington Consensus principles presented by John Williamson in 1989 are: fiscal discipline; reordering of public expenditure priorities; tax reform; liberalizing interest rates; competitive exchange rate; trade liberalization; liberalization of inward foreign direct investment; privatization; deregulation; secure property rights.These principles introduce a new macroeconomic policy and development model inspired by the neoliberal approach(Williamson,1990a; 1990b;2000; 2003a; 2003b; 2004; 2008). Liberalization of the economy is the focal point of the consensus and the priorities consist in reducing inflation and restoring growth. Successive reforms seem to be necessary for achieving the objectifs. The broad spectrum of reforms include tight macroeconomic rules, less state involvement, reducing the size and scope of the public sector, adopting a liberal trade regime by eliminating protectionnism and radical cuts in social subsidies. The typical instruments in use are budget cuts, price liberalization, deregulation, privatization, “creation of social „emergency‟ bypassing social ministries” (Moises, 2000). Some years later, Williamson has given a new interpretation of the original version of the consensus. He proposed the options of a fully fixed or a freely floating exchange rate. He is more cautious on the speed of liberalization of the foreign trade regime. In his new interpretation liberalization of the foreign direct investment did not include liberalization of the capital account. He proposed to deregulate the regulations to protect people‟s safety and environment and the regulation of public goods and utilities by means of public tariffs. Williamson rejected the idea of identifying the Washington Consensus recommendations with the policy prescriptions of the Bretton Woods Institutions. The last interpretation and/or version of the previous statement of Williamson did not change the essence of the original Washington Consensus. In fact, the first-generation reforms introduced by the original Washington Consensus were augmented and completed by the second-generation reforms (institutional reforms) known as the post-Washington Consensus (Rodrik, 2006). The macroeconomic stabilization, privatization and liberalization which are the principal policy instruments proposed by the original version are kept intact: “This approach recommends that governments should reform their policies and in particular: (a) pursue macroeconomic stability by controlling inflation and reducing fiscal deficits; (b) open their economies to the rest of the world through trade and capital account liberalization; and (c) liberalize domestic product and factor markets through privatization and deregulation” (Gore, 2000). The policy principles of the consensus have been propagated through the stabilization and structural adjustment policies of the International Monetary Fund (IMF) with the support of the World Bank. The policies guided by the Washington Consensus are implemented in the 1980s and 1990s in Latin America, Asia, Africa and in transition economies. The development strategies were focused on achieving macroeconomic stability. In this context achieving and maintaning price stability, reducing the role of the state in the economic sphere by strenhgening the liberalization and privatization policies were the

S. Sönmez 107
© 2017 The Author. ECSDEV Compilation © 2017 European Center of Sustainable Development.
best practices (Moises, 2000; Stiglitz, 2008; Lopes, 2011). 3. Alternative ‘Consensuses’ or Models
The original Washington Consensus has been followed by a variety of consensuses: Monterrey, Copenhagen, Beijing, Seoul, Mexico, Mumbai and the others. In fact, it is controversial whether the term consensus reveals the policy principles and/or concrete homogenous policy packages. The term consensus seems to be a good “sales word” and calls for a unifying principle for economic development policy. On the other hand, the term consensus “has become a fashionable and therefore less than reliable indicator of anything significant” (Dirlik, 2010). Washington consensus was the most influential in the 1990s. The 2008-2009 global financial crisis and ensuing recession have discredited the essence of the Washington Consensus and upset the neoliberal model. In the G20 London Summit in April 2009, the UK Prime-Minister Gordon Brown announced that the old Washington Consensus had come to an end; the Washington Consensus is out and now the Beijing Consensus is in. In the G20 Seoul Summit in November 2010 the Seoul Consensus of Development was on the agenda. In April 2011, Dominique Strauss-Kahn came out with a statement that Washington Consensus with its simplified economic ideas has collapsed during the world economic crisis and was left behind (Arapov, 2012). The problem consists in determining the appropriate type of the consensus for the periphery. In this regard, the experiences of the three big economies as Brazil, India and China are instructive. Each country is a specific case and it is not possible to adopt a “one model fits all approach”. Nevertheless, the structural adjustment programs reinforced by the Washington Consensus policy principles have been implemented in a large number of the peripheral countries. But the BIC countries -and the BRICS group- have rejected the shock therapy and the -neoliberal- structural adjustment programs. The experience of each country is sui generis but China is considered as the global pacesetter of the BRICS (Gereffi, 2014). It would be interesting to question whether the basic principles of the Beijing Consensus represent an appropriate solution and/or a model for the periphery Kennedy, 2010). For Ramo, who coined the term of Bejing Consensus, “China, once intent on practicing „Communism with Chinese Characteristics‟, is now intent on practicing Globalisation with Chinese Characteristics” (Ramo, 2004). An eminent Chinese specialist, Arif Dirlik (2010), argues that the Beijing Consensus, is “a notion, rather than a concept or an idea, because it does not have any of the coherence that we associate with either of those terms”. Another approach consists in describing the Chinese model as the socialist market economy with Chinese characteristics or Chinese style socialism (Xin et al., 2009). On the contrary, Nye (2005) remarks that the essence of Beijing Consensus is authoritarian government and the state permeated market economy. China‟s economy is also perceived as a distinctive form of market-liberal state capitalism -or a non-liberal, heterogeneous, competition- driven variant of state-permeated capitalism (ten Brink, 2011, 2013, 2014). This takes the form of extensive state intervention with a specific competition- driven, corporate spirit. Wade instead refers to “governed market theory of East Asian economic success” (1990),

108 ICSD Book of Proceedings (2017), 5, 105-120
Published by ECSDEV, Via dei Fiori, 34, 00172, Rome, Italy http://ecsdev.org
which suggests a deeply different approach to development than that of the pro-privatization, free-market liberalists (Serra, & Stiglitz, 2008). Two other challenges to Washington Consensus are formulated by the concept of UNDP‟s sustainable human approach and the Southern Consensus. The last term is reserved for the countries undertaking late industrialization. Therefore the Latin American neostructuralism and the East Asian developmentalism are considered as the strands of the consensus (Li-Wen, & Milhaupt 2013) on the contrary argue that China‟s variety of capitalism has the characteristics of the state capitalism) or the system is a state-led market economy. On the other hand, Valli and Saccone argue that China and India represent the third wave of the Fordist model of growth (2009). 4. Macroeconomic Policies and Industrialization in the BIC Countries
The countries under investigation are characterized by different growth and development paths and macroeconomic policy regimes. The economic profiles of the countries are different; the agriculture and mining sectors are dominant in Brazil, the software and business services in India and the manufacturing industry in China (Barbosa, & Jenkins, 2012). Important differences exist within the group regarding the political and social systems and the labor markets as well as capital markets. Then the problem consists in discovering the principal points of convergence rather than the divergences accross the referred economies. One of the reference criteria is the role of the state in the economy. This approach permits to reveal the properties of the BIC “variety of capitalism” and to assess the common points of compromise or the level of rupture with the Washington Consensus (Hall, & Soskice, 2001; Amable, 2003; Crouch, 2005). The end of the 1970s or the early 1980s correspond grosso modo to the beginning of the last wave of globalization and the rapid transition to neoliberal policies. In 1978 China and India were characterised by a low level of per capita GDP, with respectively $ 305 and $426 (in constant 2010 US dollars). China, by the end of the 1970s adopted an outward-oriented model under the control and the guidance of the communist party and initiated the market-driven reforms in 1978. Deng Xiaoping by his speech at the end of 1978 has announced the oncoming reforms. China since 1980 has dramatically changed the economic landscape and performed a sustainable high economic growth in the period 1980-2014 with an average GDP growth of 9.8 percent. GDP per capita with constant US dollars has been increased 21 times and was recorded at 6416 US dollars in 20152 (http://www.theglobaleconomy.com;http://www.imf.org/external/ns/cs.aspx?id=28). The successive wave of radical market-friendly reforms has contributed to the profound socio-economic changes in China. The term Beijing Consensus, through the concrete policy principles reveals the main policy orientations in China. As such the Beijing Consensus is considered as an alternative model of development to Washington Consensus. 4.1 China’s Reform Process and The Beijing Consensus
2 The East Asian crisis has negative impact on the economy; GDP growth in the period 1989-1990 has
dropped to 4.2 and 3.9 percent, respectively.

S. Sönmez 109
© 2017 The Author. ECSDEV Compilation © 2017 European Center of Sustainable Development.
The reform process is closely related to the iniative and the influence of Deng Xiaoping and his open door policy. Truth from Facts speech was folllowed by the Communique of the Third Plenary Session of the 11th Central Committee of the Chinese Communist Party (CCCPC) initiating four modernizations (Hoffman, & Wu, 2009). The reforms would be developed gradually in four areas: agriculture reform in the rural area with township and village enterprises; initial steps to open up the economy to foreign direct investment (FDI) and the financial sector to foreign capital. The reforms have been conducted through three different policy phases with two different policy models. During the 1980s, from 1979 to 1988 under the leadership of Hu Yaobang and Zhao Ziyang the government has been engaged in financial liberalization, private entrepreneurship and there was a certaizonen move towards „political liberalism‟. In the 1990s, from 1989 to 2002, China was engaged in a more statist policy. The party and the government put emphasis on financial and political controls and favored the State-Owned Enterprises (SOEs). Since 2003 to present, a gradual use of the market mechanism is observed without eliminating the state sector and its control over the economy. The logic behind the use of market is considered as a necessity to bring competition for an efficient allocation of resources. This policy orientation fits as well to Deng Xiaoping‟s famous saying „crossing the river by groping the stones‟. Deng Xiaoping instead of discussing whether a policy is capitalist or socialist, rather takes into account “whether such a policy is helpful for developing socialist productivity, for enhancing socialist comprehensive national power, and for improving people‟s living standard” (Xin et al., 2009). Finally the properties of the production system, the nature of proprietorship and the properties of the polity permit to adopt the state- led capitalist developmentalism as an appropriate term to describe and explain the development model in China. The main problem in the 1980s was to increase the efficiency of the SOEs. Precisely the reform and opening up policies which were introduced since the late 1970s prepared a favourable environment for high levels of economic growth both in rural and urban sectors in the following decades. The gradual shift to market economy and privatization started in the mid-1990s. China has adopted the dual-track approach as the guiding principle of the reform strategy which could be reduced to the principle of making reforms without making losers. China‟s reform process is characterised by the institutional changes in the market, firms and the government. (Lau et al., 2000; Qian, 2000; 2002; Tao,& Xu, 2006; Hofman,& Wu,2009). The factors contributing to Chinese growth and development are the technological and institutional innovation, combination and coordination of the public and the private entrepreneurship, macroeconomic stability, external opening, financial development, cautious liberalization and politics. The Beijing Consensus is constructed around three theorems; first, innovation-based growth/development; second, priority given to sustainability and equality over the GDP per capita in measuring overall economic performance; third, self-determination in international relations (Ramo, 2004). The theorems of the Beijing Consensus establish the following ten basic principles: the localization of best practices borrowed, combination of market and plan, flexible means to common end, policy rights, stable political environment, self -reliance, constantly upgrading industry, indigenous innovation, prudent financial liberalization and economic growth for social harmony (Xin et al., 2009). The Beijing Consensus which predicts both

110 ICSD Book of Proceedings (2017), 5, 105-120
Published by ECSDEV, Via dei Fiori, 34, 00172, Rome, Italy http://ecsdev.org
the economic and the social change is pragmatic and has the ideological aspects as well. The ultimate goal is to improve the society by means of economics and governance; this is the main objectif of the development economics ignored by the Washington Consensus. China has realized the rapid transition from a closed and state commanded economy to a technologically advanced, export-oriented economy which is highly competitive in the last three decades (Jaguaribe, 2013). In this context the 12th Chinese Five Year Plan which has projected a reorientation of the growth and development model, acquires particular relevance. The plan emphasized the final objective as the “economic transformation to improve people's lives, which could only be achieved by improving social welfare system, giving priority to transform to job creation, providing equal public services to every citizen and stepping up reform of the income distribution system… In transforming the economic development mode, the importance of building are source- saving and environment-friendly society should be stressed to save energy, reduce greenhouse emissions and actively tackle global climate change. We should develop circular economy and low carbon technologies through striking a balance between economic development and population growth, sustainable development will be enhanced” (http://www.cbichina.org.cn/cbichina/full%20Tran).The development of strategic industries (SEI) and scientific and technological modernisation will play the main role in the transformation of China into an innovation-driven economy. Technology policy will be implemented parallel to educational objectives and market reforms. In the last thirty-five years China has experienced a great economic and industrial transformation. At the beginning of the reforms China was an agrarian economy but towards the end of the first decade of the 2000s the country progressed rapidly in industrialization and in expansion of services sector. In the early 1980s, industrial activities were concentrated in textiles, clothing, food and beverage, bicycles, etc. There was a certain and limited production in steel, chemicals and fertilizers (Valli, & Saccone, 2009). The situation has been radically changed by the rise of the production of electrical and nonelectrical machines, chemicals, PCs and mobile phones. Meanwhile “the rapid growth in household electrical appliances, telecommunication, and then PC, steel, means of transportation and finance led to the rise and consolidation of a middle and upper middle class, concentrated mainly in the great urban coastal zones. Thus social and economic inequalities strongly increased. In particular there was a marked increase in overall inequality indexes, such as the Gini index, which surpassed the levels of the US and of most industrialized countries, and a strong rise in regional inequalities among provinces” (Valli, & Saccone, 2009). The gradual but rapid growth of the manufacturing sector is impressive; about 90 percent of the exports are manufactured goods while the traditional industries such as clothing, textiles and leather with easier access into world markets have a preponderant place in exports. The expansion of medium-and high-tech and standart technology industres is largely due to joint-ventures and foreign firms operating in China. China has been transformed to “a low-cost assembly platform of many global value chains” or the “low value-added workshop of the world” (Poon, 2014; Koopman et al., 2008). In other words, the engagement of the country in global value chains and the inflow of foreign direct investments played a major role in development

S. Sönmez 111
© 2017 The Author. ECSDEV Compilation © 2017 European Center of Sustainable Development.
of industry and expanded the products‟ access to global markets by means of multilateral free trade system. China is transformed to a center of exports for the foreign-affiliated compagnies (Akyüz, 2011;Brakman et al., 2015; Los et al., 2015; Gereffi, 2014; Abouraki, 2013). The transformation of the command economy into a competition-driven one is concretized through the combination and cooperation between the state and the private sector. But it is necessary to emphasize once more that the state has the main role and the current political economy could be interpreted as a state guided and controlled system using market mechanism and incentives. The linkage between the state and the corporations is complex; close links are observed between the state apparatus at different administration levels and corporations. The system is the symbiosis of the dominant state preferences in the economy, the Chinese Communist Party (CCP) guidance and the Asian developmental state model with Chinese characteristics (McNally, 2012; Li-Wen & Milhaupt, 2013). 4.2 The Neo-developmentalism in Brazil
The 1980s represents the lost decade for Brazil and the Latin American world. Brazil tried to overcome the financial bottleneck due to an unsustainable debt burden. The solution to the foreign debt crisis (1982) could be found through the access to new international credits and the restructuring of the debt. In the Brazilian context, the military govenment has adopted a stabilization program under the auspices of the IMF. The program includes the devaluation of the local currency, strict cuts in public spending, reduction in social subsidies and the subsidized credits, increase in taxes and cuts in the external borrowing of SOEs (Carascao, & Williams, 2012). Although the austerity regime imposed by the IMF in 1982 has reduced the fiscal deficit and engaged the economy on a growth path in 1984, it was not successful in reducing the high inflation rate which has been quadrupled between 1982 and 1986. The government has introduced the famous Cruzado Plan in early 1986; with the new currency cruzado the prices and exchange rates were frozen. But this plan was not successful in curbing inflation; monthly inflation rate was about 80 percent at the end of the decade. After an interval of thirty years, the first democratically-elected president, Fernando Collor de Mello (1990) focused on a neo-orthodox solution: price stabilization, privatisation and improving competition. Important steps were taken towards the liberalization of the foreign trade regime (Mollo, & Saad- Filho, 2006). However the Real Plan designed by Fernando Henrique Cardoso, minister of finance in the cabinet of new president Itamaar Franco, was successful in curbing hyperinflation (Clements, 1997; Dornbusch, 1997; Amadeo, & Neri, 2000). The Plan introduced a new currency (real), tight monetary policy and floating currency but with a floor for U.S. dollar exchange rate; deindexation of the economy and public-sector price freeze; public spending cuts and tax increases (Clements, 1997; Carrasco, & Williams, 2012; De Souza, & Ferreira, 2012). The new measures have a positive impact on economy and social issues. The hyperinflation was stopped and declined sharply to 66 percent in 1995. The 2 percent inflation in 1998 was accompanied by a revival of the economic activity and induced an increase in real wages and reduced income inequality. (http://www.indexmundi.com/brazil/inflation_rate_ (consumer_prices).html).

112 ICSD Book of Proceedings (2017), 5, 105-120
Published by ECSDEV, Via dei Fiori, 34, 00172, Rome, Italy http://ecsdev.org
Nevertheless, the stabilization program did not correct income inequality and reduce poverty. The objective of combining tight monetary policy and high interest rates with trade liberalization and privatization was to attract foreign capital and finance the current account deficit. The positive outcome of the Plan enabled Cordoso to be elected in the 1994 presidential election. However, the Plan was not successful in adjusting the fiscal balance. The growing fiscal deficit and high interest rates resulted in a dramatic rise in domestic debt stock. The overvaluation of the echange rate was an another problem which reduced the competitivity of the domestic products in the global markets. On the other side, “one of the most frequent criticisms of the stabilization policy adopted in 1994 is that, when analysed five years after its application, it is noted that it continued to be basically just a stabilization programme. There was a lack of a medium- and longterm strategy, and economic policy continued to be subordinated to that main objective, which naturally had its costs” (Baumann, 2001:162). Brazil began to suffer from the financial contagion of the Asian (1997) and the Russian financial crisis (1998). The Investors began to withdraw their funds from Brazil and the Central Bank of Brazil raised interest rates in order to maintain the pegged exchange rate and to stop the outflow of the foreign funds. However, the sharp increase in interest rates caused a decline in industrial production and the volume of exports but did not help to stop the economic hemorrhage triggered by the flight of foreign investors and dollars. The Central Bank used half of the reserves in order to defend the local currency but it could not prevent the devaluation. The reserves which were over 70 billion dollars at the beginning of 1998, dropped by half at the end of the year (Federal Reserve Bank of Dallas, 1999). The Cordoso‟s administration was engaged to new reforms for overcoming the crisis, as the Central Bank adopted the floating exchange rate system and inflation-targeting policies. The effort to break the speculative attack on the Brazilian real was supported by the IMF, the World Bank and the United States by a $41.5 billion loan with additional measures under conditionality. Cardoso‟s macroeconomic policy, including banking sector reforms were successful, the crisis is stabilized (Gruben, & Welch, 2001). The benefits of the reforms became concrete with the president Lula de Silva elected in 2002. Brazil accomplished the major macroeconomic and social progress in the last twenty or twenty five years. The economic policy is focused on macro economic stability and primary surplus for the control of the public debt. The price stabilization and the liberal reforms in the late 1990s followed by the adjustment of the fiscal and external imbalances during the 2000‟s engaged the economy on a new growth path after decades of stagnation. Inflation targeting has facilitated the conduct of a tight monetary policy to control the general price level but “the Lula/Roussef administrations have continued with inflation targeting which has been more of a „soft‟ target than under Cardoso‟s administration with the priority to employment growth objectives. The expansionary monetary policy in 2009 and then in late 2011 should not be interpreted as a questionning of the Washington Consensus because the cut was small enough to be consistent with inflation targets” (Ban, 2013). Sustainability of growth thanks to favorable international economic environment, the inflow of capital and China. The growth process is sustained also by reducing inequity in income distribution and the

S. Sönmez 113
© 2017 The Author. ECSDEV Compilation © 2017 European Center of Sustainable Development.
poverty. The credit expansion and the emerging middle class boost the increase in domestic demand (Reis, 2014). These measures are completed by a gradual increase in minimum wages (Morais, & Saad- Filho, 2011) . State has played a preponderant role in the conduct of the industrialization and the innovation policies. The rapid emergence of the Brazilian economy took place with an active intervention of the state and by an expansion of public ownership in the strategic sectors. In this context, privatization, financial liberalization and deregulation were implemented with caution. Lula‟s administration has adopted the old statist model to a competitive open economy in which the state sector employing high technology is also highly competitive. The transformation of the economy is accompanied by the important institutional changes necessary for R&D and technological innovation (Dahl et al., 2014; Bastos, 1992; Velho, & Saenz, 2002; OECD, 2013). The macroeconomic policy and the model of industrialization in Brazil call for a neo- developmentalism (Bresser-Perreira, 2007; Kerstenetzky, 2011) characterised by a national development program with an active state involvement and intervention (Ban, 2013: 300). Nevertheless, the Brazilian model does not reject all the policy principles of the Washington Consensus; the model is rather characterised by a compromise between the neo-developmentalism and the Washington Consensus. 4.3 The Mumbai Consensus in India
The balance of payment crisis in 1991 prepared the end of the state-led import substitution. The government has made a radical brake with the past by adopting a new economic model and/or paradigm characterised by liberalization and deregulation. But the economic growth already accelerated in the post-1980 period before the implementation of the liberalization program which does not exactly fit to the neo-orthodoxy. The reforms have two objectives: (a) The reorientation of the economy from dirigisme to so-called „market friendly economy‟, (b) The macro-economic stabilization through reducing fiscal deficits and the high levels of economic efficiency. These policies have produced a positive impact. The period of high economic growth was accompanied by some aspects of the Fordist model. The growth stemmed from a rapidly expanding service sector. The production and export of a variety of software services and banking, transports and telecommunication played an important role in the economic growth process. The average growth rate of the economy in the period 1992-2008 was about 7 percent per annum. The current account deficit was moderate, the foreign exchange reserves were at a largely satisfying level, the external debt (as a percentage of GDP) and the debt service were on decline. There is also evidence of considerable restructuring in the corporate sector with attention being given to cost-competitiveness and financial viability. The rate of inflation has also come down sharply (Bhagwati, 1998; Singh, 2007; Valli, & Saccone, 2009; Mukherji, 2007; Banga, & Das, 2012). Is it true that while China is considered as the „factory of the world‟, India is becoming the„office of the world‟? In India several industrial sectors such as vehicles, motorcycles and machinery, chemicals, steel, pharmaceutics, three wheel vehicles and more reccently microelectronics hardware and automobiles have experienced an accelerated growth (Valli, & Saccone, 2009). In India the spatial concentration has increased in the service

114 ICSD Book of Proceedings (2017), 5, 105-120
Published by ECSDEV, Via dei Fiori, 34, 00172, Rome, Italy http://ecsdev.org
sector which benefits from the ICT. This is not the case for the manufacturing industry. As such Indian‟s spatial concentration is very different from the United States and Europe (Desmet et al., 2015). The Washington Consensus policy has been adjusted to India‟s specific conditions. Therefore the new paradigm has some convergency points with the Washington Consensus (Mukherji, 2013). The liberalization process is slow and gradual; it did not imply the total „retreat of the state‟ from the economy. The retreat from state monopoly in cerain sectors has been accomplished in a controlled manner and some of the SOEs have been privatized but the public sector operates in some fields like oil and banking. On the contrary, the cooperation between the state and the private sector seems to be successful in the global competition. The Removal of the high protective tariffs did not imply the abolition of the protective foreign trade regime. Capital movements have also been progressively liberalized. “This gradual and calibrated, and in some respects restricted, nature of Indian liberalization contributed to checking foreign acquisition of Indian assets, facilitated the adaptation and adjustment of Indian big business to the new competition for investment between states that liberalization has forced into. At the same time large business firms which have established themselves in key sectors have increased their clout and thus influence on regulatory policy in them” (Mazumdar, 2010, 2011). The economic reforms were accompanied with a neoliberal shift in monetary and fiscal policies. The monetary policy was targeted at price stability and the fiscal policy is designed to ensure sound public finances. The neoliberal political theory argues for the power of market and the diminishing role of the state and it is expressed by the ineffectiveness of fiscal policy, the neutrality of money and the automatic and quick return of the real economy to full employment following negative demand shocks. Within this context the fiscal policy is reduced to a strict fiscal discipline and/or fiscal rules. In India it is not a surprise that the government inspired by the neoliberalism has implemented a contractionary fiscal policy. The deregulation of the financial sector opened the door to foreign capital: in the 2011–2013 period, the net capital inflows amounted, on an annual basis, to $20.8 billion as FDI and $22.0 billion as portfolios (Sen, & DasGupta, 2014). In India the financialization of the economy matches the austerity in a way that the contraction of credits and fiscal deficits together with the austerity measures pave the way to the financialization by offering opportunities for the investments in financial assets portfolios. In fact, investments in financial sector, compared to real sector, is promising because of new opportunities for future profits. Is it possible to integrate the economic reforms and new economic polices in a development model? The critics of the theory of Beijing consensus -Larry Summers and Arif Dirlik- have emphasized that Chinese economy is reliant on foreign markets and the exploitation of the labour force by the foreign companies is very intensive. The term “Mumbai Consensus” was coined by Larry Summers (Key Advisor of Obama Administration, in discussions of economic relationships between the USA and India), as an alternative to Washington and Beijing Consensuses. India‟s growth and development process, which does not rely exclusively on external demand and exports but on domestic demand, has inspired Summers to use the term Mumbai Consensus for the case of India. Experts of the Research Center Gateway House in 2010 announced the six principle of the Mumbai Consensus as pluralistic democracy; strategy of gradual

S. Sönmez 115
© 2017 The Author. ECSDEV Compilation © 2017 European Center of Sustainable Development.
achievement of the result and decentralization (in political practice); development and strengthening of broad masses of population (as socio-economic purpose); dominating production of goods and services oriented to internal market (in economic sphere); private entrepreneurship and innovations (in business); non-expansionism international policy oriented to cooperation (in geopolitics)” (The Mumbai Consensus. Gateway House, November 18, 2010). 5. Conclusion
The Beijing Consensus represents an alternative model of development characterised by the state-led capitalist developmentalism under a socialist regime in China. The Brazilian neo -developmentalism combines the neoliberal policy principles with the state intervention. The Mumbai Consensus corresponds to the development experience of India which is characterised by the combination of the neoliberal reforms with government involvement in the economic sphere. Nevertheless, the policy recommendations of the original Washington Consensus are more or less integrated in the proposed alternative consensuses. The first three rules of Williamson are fiscal discipline, reordering public expenditure priorities away from non-merit subsidies but toward public goods, tax reform that combines broad tax base with moderate marginal rates. These rules are satisfied by China and the rules 2 and 3 partially by the others. The rule 4 stipulates liberalized interest rates. This rule is satisfied by India and Brazil but China did not adopt the rule of competitive exchange rate. Nevertheless, the successive devaluations of the RMB in the recent past seem to be in accordance to this rule. The rules 6 and 7 are on liberalization of trade and FDIs; the whole group implement rather liberal policies concerning the foreign trade and investments. Privatization, rule 8, is used as an efficent tool for the conduct of the “market-friendly” reforms. Nevertheless, privatization did not eliminate the public ownership in several sectors: there is a large SOE sector in China and public enterprises operate in India and Brazil. The rule 9 introduces deregulation which is implemented at various levels in these economies. But a strict regulation is practised in a number of sectors (price controls in energy inputs, banks, etc.) in China. Some sectors or activities are subject to a regulation in India. The last rule stipulates the protection of the property rights. In China private property rights remain relatively secure (ten Brink, 2013; McKinnon, 2010). Finally, despite some common sharacteristics, the experiences of the BIC do not provide a unique model for economic development; it is not possible to adopt “one model fits all approach”.

116 ICSD Book of Proceedings (2017), 5, 105-120
Published by ECSDEV, Via dei Fiori, 34, 00172, Rome, Italy http://ecsdev.org
References Abouraki, K. (2013). China‟s competitiveness, analysis and policy implications. A Report of the CSIS HILLS
Program on Governance. Washington DC: CSIS/Center for Strategic & International Studies. Akyüz, Y. (2011). Export dependence and sustainability of growth in China. China and World Economy, 19 (1),
1-23. Amable, B. (2003). Diversity of Modern Capitalism. New York: Oxford University Press. Arapov, A. V. (2012). Three sets of recommendations for developing economies. World Applied Sciences
Journal (Special Issue of Economics), 18, 175-178. Retrieved from http://www.idosi.org/wasj/wasj18(Economics)12/29.pdf
Amadeo, E., & Neri, M. (2000). Macroeconomic policy and poverty in Brazil. UNDP Project on Macroeconomics and Poverty in Seven Latin American Countries, New York: United Nations Development Programme.
Ban, C. (2013). Brazil‟s liberal neo-developmentalism: New paradigm or edited orthodoxy, Review of International Political Economy, 20 (2),298-331.
Ban,C., & Blyth, M. (2013). The BRICs and the Washington Consensus: An introduction. Review of International Political Economy, 20 (2),241-255.
Banga, R., & Das. (Eds). (2012). Twenty Years of Indian’s Liberalization, Experiences and Lessons. Geneva: U.NCTAD, United Nations Publication, UNCTAD/OSG/20.
Barbosa, A.F., & Jenkins, R. (2012). Fear for manufacturing? China and the future of industry in Brazil and Latin America. The China Quarterly, (209), 59-81.
Bhagwati, J. (1998). The design of Indian development”, In I.J. Ahluwalia & I.M.D. Little (Eds), India’s Economic Reforms and Development: Essays for Marmohan Singh (pp.23-39). New Delhi: Oxford University Press.
Bastos, M-I. (1992).The interplay of domestic and foreign political constraints on the informatics policy of Brazil. UNU/INTECH Working Paper no:6. Maastricht: The United Nations University. Retrieved from http://www.intech.unu.edu
Baumann, R. (2001).Brazil in the 1990s: an economy in transition. CEPAL Review, 73 (147-169). Brakman, S., Van Marrewijk, Ch., & Partridge, M. (2015). Local consequences of global production process.
Journal of Regional Science, 55 (1), 1-9. Bresser-Pereira, L.C. (2007). The new developmentalism and conventional orthodoxy. Iberoamericana: Nordic
Journal of Latin American and Caribbean Studies, XXXVII(1), 31-58. Carrasco, E. R., & Williams, S. (2012) Emerging economies after the global financial crisis: The case of
Brazil. Nortwestern Journal of Internatonal Law and Business, 33 (19),80-119. Clements, B. (1997). The Real Plan, poverty and income distribution in Brazil. Finance & Development, (44),
44-46. Cong, C., Suttmeier, R. P., & Fred S.D. (2006). China‟s 15-year science and technology plan. Physics Today, 59
(12), 38-43. Crouch, C. (2005). Capitalist Diversity and Change. New York: Oxford University Press. Dahl Andersen, A., Andersen, P.D., Byeongwan,P., & Cagnen,C. (2014). Sectoral Innovation Sysyems Foresight in
Brazil and Korea: Competences for Innovation System Transformation. DTU Management Engineering. De Souza, P., & Ferreira, H.G. (2012). Poverty, Inequality and Social Policies in Brazil, 1995-2009. Working paper
87, International Policy Centre for Inclusive Growth, UNDP. Retrieved from http://www.ipc-undp.org
Desmet, K., Ghani, E., O‟Connell, S., & Rossi-Hansberg, E. (2015). The spatial development of India. Journal of Regional Science,55(1),10-30. Retrieved from https://ideas.repec.org/s/bla/jregsc.html
Dirlik, A. (2010). Beijing Consensus: Beijing "Gongshi." Who recognizes whom and to what end? Globalization and Autonomy Online Compendium (1-8). Retreved from www.ids-uva.nl/wordpress/wp-content/.../9_Dirlik1.pdf
Dornbusch, R. (1997). Brazil‟s incomplete stabilization and reform. Brookings Papers on Economic Activity, 28 (1), 367-404
Gereffi, G. (2014). A global value chain perspective on industrial policy and development in emerging markets. Duke Journal of Comparative and International Law, (24), 433-458.

S. Sönmez 117
© 2017 The Author. ECSDEV Compilation © 2017 European Center of Sustainable Development.
Retrieved from http://scholarship.law.duke.edu/djcil/vol24/iss3/2/Gore, Ch. (2000). The rise and fall of of the Washington Consensus as a paradigm for developing countries. World Development,28(5), 787-804.
Gruben, W.C., & Welch, J.H. (2001, Fourth Quarter ). Banking and currency crises recovery: Brazil‟s turnaround of 1999. Economic and Financial Review, Federal Reserve Bank of Dallas, 12-23.
Hall, Peter A., & . Soskice, D. (2001). Varieties of Capitalism. New York: Oxford University Press. Hofman, B., & Wu, J. (2009). Explaining China‟s development and reforms. Working Paper no:50, Washington
DC: The World Bank. Jaguaribe, A. (2013). Innovation policies and development strategies: Implications from the Chinese mode.
In The Harmonious Superpower? China’s Role in a Multi-polar World (pp.13- 16), Berlin: Fore Sight, Kennedy, S. (2010). The Myth of the Beijing Consensus. Journal of Contemporary China, 19(65), 461–477. Kerstenetzky, C.L. (2010). Social development in Latin America? Working paper,CEDE no:26. Retrived from
http://www.proac.uff.br/cede/sites/default/files/TD026.pdf Koopman, R., Wang, Z., & We, S. (2008). How much of Chinese exports really made in China? Assessing
domestic value- added when processing trade is pervasive. NBER Working Paper No. 14109, Cambridge, MA:National Bureau of Economic Research.
Lau, L.J., Qian, Y., & Roland, G. (2000). Reform without loosers: An interpretation of China‟s dual-track approach to transition. Journal of Political Economy, 108 (1), 120-143.
Li, X.,. Brodsgaard, K. E., & Jakobsen, M.(2009). Redefining Beijing Consensus: Ten economic principles. China Economic Journal, 3 (2), 297-311. Or: Asia Research Centre, CBS, Copenhagen Discussion Papers 2009 – 29.
Lin, L-W., Milhaupt, C.J. (2013). We are the (national) champions: Understanding the mechanisms of state apitalism in China. Stanford Law Review, 65 (4), 697-756.
Los, B., Timmer, M. P., Gaaitzen, J., & de Vries, J. (2015). How global are global value chains? A new approach to measure international fragmentation. Journal of Regional Science, 55 (1). 66-92. Retrieved from https://www.researchgate.net/publication/261476895
Lopes, C. (2011,Septembre,). Economic growth and ineaquality: The new post-Washington Consensus. COMBRA RCSS 94. Retrieved from https://rccsar.revues.org/426
Mazumder, S. (2010). Indian capitalism: A case that doesn‟t fit? ISID Working Paper No. 2010/10, New Delhi.retrieved from https://mpra.ub.uni-muenchen.de/28162
Mazumdar, S. (2011). Continuity and change in Indian capitalism. MPRA Paper No. 38907. Retrieved from https://mpra.ub.uni-muenchen.de/38907
McKinnon, R. I. (2010). China in Africa: the Washington Consensus versus the Beijing Consensus. International Finance Review, 16 (2), 495–506.
McNally, C.A. (2013). How Emerging Forms of Capitalism are Cchanging the Global Economic Order. AsiaPacific Analysis from the East-West Center, February. Retrieved from http://www.eastwestcenter.org/publications/how-emerging-forms-capitalism-are-changing-the-global-economic-order
Moises, N. (2000).Fads and fashion in economic reforms: Washington Consensus or Washington confusion? Third World Quarterly, 21 (3),505-528.
Mollo, M.L.R., & Saad-Filho, A., (2006). Neoliberal economic policies in Brazil (1994-1995):Cordoso, Lula and the need for a democratic alternative. New Politic Economy, 11 (1), 99-122.
Morais, L., & Saad-Filho, A. (2011).Brazil beyond Lula, forging ahead or pausing for breath. Latin American Perspectives, 38 (2), 31-44.
Mukherji, R. (2007). Economic transition in a plural polity: India. In R. Mukherji (Ed.), India’s Economic Transition (pp.117-145), New Delhi: Oxford University Press.
Mukherji, R. (2013). Ideas, interests, and the tipping point: Economic change in India. Review of International Political Economy, 20 (2), 363-389.
Nally, C.A. (2012). Sino-capitalism: China‟s reemergence and the international political economy. World Politics (64). 741-776.
OECD (2013). OECD Economic Surveys: Brazil. Paris: OECD Publication. Poon, D. (2014). China‟s development trajectory: A strategic opening for Industrial policy in the south.
UNCTAD Discussion Papers no. 218, UNCTAD/OSG/DP/2014/4.

118 ICSD Book of Proceedings (2017), 5, 105-120
Published by ECSDEV, Via dei Fiori, 34, 00172, Rome, Italy http://ecsdev.org
Qian,Y. (2000). The Institutional Foundations of Market Transition in the People‟s Republic of China. ADB Institute Working paper, no: 9, Asian Development Bank Institute. Retrieved from https://think-asia.org/handle/11540/4116
Qian, Y. (2002). How reform worked in China. William Davidson Working Paper, no: 473, William Davidson Institute, University of Michigan Business School. Retrieved from https://deepblue.lib.umich.edu/handle/2027.42/39858
Ramo, J. C. (2004). The Beijing Consensus. London: Foreign Policy Centre. Ray, R., & Gallagher, K. (2015). LAC trade with China. China-Latin America Economic Bulletin, 2015 Edition,
MA: Boston University, Global Economic Governance Initiative. Retrieved from https://www.bu.edu/pardeeschool/files/2015/02/Economic-Bulletin-2015.pdf
Reis, E. (2014). Recent macroeconomic trends in emerging economies and implications for development. DESA Working Paper: 134, ST/ESA/2014/DWP/134, New York, N.Y: United.
Rodrik, D. (2006). Goodbye Washington Consensus, hello Washington confusion? A Review of the World Bank‟s Economic Growth in the 1990s:Learning from a Decade of Reform. Journal of Economic Literature, 44 (4), 973–987.
Schwaagserger, S., & Breidne, M. (2006). China‟s fifteen-year plan for science and technology: An assessment. Asia, Policy, (4), 135-164.
Sen, S., & Dasgupta, Z. (2014). Economic policy in India: For economic stimulus, or for austerity and volatility? Working Paper No. 813, Amandale-on-Hudson, NY: Levy Economics Institute of Bard College.
Singh, A. (2007). Globalisation, industrial revolutions in India and China and labour markets in advanced countries: Implications for national and international economic policy. Working Paper No: 81, Geneva: Policy Integration Department, International Labour Office,
Stiglitz, J. E. (2008). Is there a Post-Washington Consensus Consensus. In N.Serra & E. JosephStiglitz (Eds), The Washington Consensus Reconsidered: Towards a New Global Governance, Oxford U.K: Oxford University Press
ten Brink, T. (2011). “Institutional change in market-liberal state capitalism: An integrative perspective on the development of the private business sector in China”, MPIfG Discussion Paper 11/2.
ten Brink, T. (2013). Paradoxes of prosperity in China‟s new capitalism. Journal of Current Chinese Affairs, 42 (4), 17–44.
ten Brink, T. (2014). The challenges of China's Non-liberal capitalism for the liberal economic order, Harvard Asia Quarterly,16 (2), 36-44.
Tao, R., & Z. Xu. (2006). Groping for stones to cross the river versus coordinated policy reforms: The case of two reforms in China. The Journal of Policy Reform, 9 (3),177-201, Retrieved from http://dx.doi.org/10.1080/13841280600911568
Valli, V., & Saccone, D. (2009). Structural change and economic development in China and India. The European Journal of Comparative Economics, 6 (1), 101-129.
Velho, K., & Saenz, T.W. (2002). R&D in the public and private sector in Brazil: Complements or Substitutes. Discussion Paper Series, No. 2002-8, Maastriht: The United Nations University. Retrieved from http://www.intech.unu.edu
Williamson, J. (1990a). What Washington means by policy reform. In J. Williamson (Ed.), Latin American Adjustment :How Much Has Happened? Washington, DC: Institute for International Economics.
Williamson, J. (1990b). What Washington means by policy reform”. In J. Williamson (Ed.), Latin American Adjustment: How Much Has Happened? Washington, DC: Institute for International Economics.
Williamson, J. (2000). What should World Bank think about the Washington Consensus. World Bank Research Observer, 15 (2), 251-264.
Williamson, J. (2003a). Our agenda and the Washington Consensus”. In P-P. Kuczynski and J. Williamson (Eds.), After the Washington Consensus: Restarting Growth and Reform in Latin America,Washington DC: Institute for International Economics.
Williamson, J. (2003b). Reform Agenda A short history of the Washington Consensus and suggestions for what to do next. Finance & Development, 40(3) ,10-13.
Williamson, J. (2004). The Washington Consensus as policy prescription for sevelopment. A Lecture in the Series "Practitioners of Development". Delivered at the World Bank on January13. Retrieved from http://www.iie.com/publications/papers/williamson0201.pdf.

S. Sönmez 119
© 2017 The Author. ECSDEV Compilation © 2017 European Center of Sustainable Development.
Williamson, J. (2008). A short history of the Washington Consensus. In N. Serra & J.E. Stiglitz (Eds.), The Washington Consensus Reconsidered: Towards a New Global Governance (pp.14–30), Oxford: Oxford University Press,
Wade, R. (1990). Governing the Market. Economic Theory and the Role of the Government in East Asian Industrialization (2nd paperback edition). Princeton: Princeton University Press.
Xiaolan, F., & Rongping, M. (2014). Enchancing Chinese innovation performance: the policy choice. China & World, 22 (2), 42-60.
Xin L., Brodsgaard, K.E., &.Jakobsen, M. (2009). Redefining Beijing Consensus: Ten economic principles. China Economic Journal, 3 (2), 297-311.
Full Translation of the 12th Five-Year Plan. Retrieved from http://www.cbichina.org.cn/cbichina/full%20Tran
Gateway House, November 18, 2010. Retrieved from http://www.gatewayhouse.in/publication/gateway-house/features/mumbai-consensus

120 ICSD Book of Proceedings (2017), 5, 105-120
Published by ECSDEV, Via dei Fiori, 34, 00172, Rome, Italy http://ecsdev.org

5th International Conference on Sustainable Development 6-7 September 2017, Rome, Italy
Book of Proceedings 5, 121-132 Doi: 10.14207/5ICSD2017
|1Research fellow at the Sapienza University of Rome in the department of Planning Design and
Technology of Architecture
2 Associate Professor at the Department for Innovation in Biological, Agro-Food and Forest Systems of the University of Tuscia (Viterbo, Italy)
Nature and Identity. Agro Pontino case study
By Maurizio Sibilla1, Anna Barbati2
Abstract Ecological issues are becoming increasingly important in urban planning and management. An integrated approach is needed in order to enhance the natural elements of the landscape within the built environment. The present research project shows a methodological approach aimed at supporting a landscape regeneration process. The methodology is applied to the case study of Agro Pontino, more specifically in the Latina municipality where the urban sprawl is progressively dissolving both the ecological quality of the territory and its original agricultural matrix. The methodological approach of this research project is structured following the purposes enumerated below. 1)Identification of the structural elements of the landscape identity. 2)Assessment of the level of conservation of the landscape in the Latina municipality. 3)Stratification of the Latina municipality into homogeneous Environmental Territorial Units (UTA). 4)Assessment of the level of isolation of residual natural fragments in the agricultural matrix. The results show how the methodological approach adopted is useful to set targets and priorities to regenerate the landscape structural and identity features. In conclusion, this interdisciplinary study is a significant contribution to the integrated approach because it faces the neighborhood requalification in ecological key and supports the urban reforestation project.
Keywords: Integrated Project; Environmental Design; Hydrographic Network, Potential Heterogeneity, Index of Landscape Conservation
1. Introduction
Ecological issues are becoming increasingly important in urban planning and management. An integrated approach is needed in order to enhance the natural elements of the landscape within the built environment. The natural elements of the landscape are often impoverished because of the urban transformations that are disrespectful towards the local geographical conditions. One of the main results of such an indifferent attitude consists in the landscape loss of naturalness and identity. At the present moment, the competence and the operative tools to preserve the landscape qualities, as projected by the European Landscape Convention are in progress (Council of Europe, 2000; De Montis, 2014). This study focuses on the rural landscape whose naturalness and identity are compromised by the urban sprawl. The urban sprawl is principally determined by the speculative dynamics of property market, and it represents one of the main challenges to the sustainable development (European Environment Agency, 2006; Johnson, 2001).The case study proposed here is representative of this particular condition. In fact, the Latina municipality has a surface

122 ICSD Book of Proceedings (2017), 5, 121-132
Published by ECSDEV, Via dei Fiori, 34, 00172, Rome, Italy http://ecsdev.org
of 278 kmq and it is part of the bigger lowland of Agro Pontino. While the natural vegetation is well protected and preserved within the natural adjacent areas ofthe Circeo National Park and the Forest Reserve of Nettuno, Latina naturalness represents the “lowest point” of the Agro Pontino. Here, the urban sprawl is progressively altering both the natural vegetation and the original rural matrix of the landscape. Agro Pontino results from a drastic work of landscape transformation, known as “the Great Reclamation” implemented in the 1920s. In few years, the large territory, formerly occupied by marshlands, has been rapidly transformed in arable land and then divided in “Poderi” (little pieces of arable land) and “Borghi” (little rural settlements). In addition, a complex network of water-channels has been built in order to preserve the dry land. Along these water-channels river side “Eucalypti” have been planted as windbreak barriers. Even now, the arable matrix characterizes the Latina landscape, but this matrix and its own natural and identity elements are disappearing because the original “Borghi” are actually merging, becoming a unique undifferentiated entity. This study proposes a methodological interdisciplinary approach, based on an innovative application of ILC index, in order to enhance the urban landscape natural and identity elements. The results show how the methodological approach adopted is useful to set targets and priorities to regenerate the landscape structural and identity features. By doing so, it has been possible to develop a significant contribution towards the implementation of operative tools to support the Landscape European Convention. In addition, this interdisciplinary methodological approach is useful to face the neighborhood requalification in ecological key as well as to support the urban reforestation project (Dierna & Orlandi, 2005). 2. Methodology
The methodological approach of the research project is structured following the aims enumerated below: 1. Identifying the structuring elements of the landscape identity in an area characterized by a strong anthropization, starting from:
- A survey of anthropogenic conversions which has highlighted the landscape features throughout the ancient and recent history (Branchetti & Sinisi, 2005).
- Mapping the actual heterogeneity of the landscape mosaic; in order to reach this purpose the methodological approach has required a new use of ground map which has been necessary since the existing cartography did not provide adequate thematic details for a satisfying depiction of the local mosaic heterogeneity aimed at planning urban requalification interventions. Therefore, starting from the visual interpretation of the IT2000 Ortofoto and the other available data, CLC cartography of Lazio has been enriched by introducing new thematic classes for forests and woody plants cultivation.
- Identifying the potential heterogeneity of the area (the so-called naturalist imprinting), through the mapping of the area vegetation series. 2. Defining an assessment scale of the Latina district state of preservation through a new calibration of the ordinary scale, based on an acknowledged scientific index which is the Index of Landscape Conservation (ILC) (Pizzolotto & Brandmayr, 1996); the new

M. Sibilla, A. Barbati 123
© 2017 The Authors. ECSDEV Compilation © 2017 European Center of Sustainable Development.
measurement has been conceived in order to denote exactly the different intensities of the Latina district anthropogenic conversions. 3. Assessing the state of preservation of territorial units with environmental homogeneity located in the district area; the territorial units mentioned above have been named Environmental Territorial Units (UTA-Unità Territoriali Ambientali). The Latina district area has been divided in environmental homogeneity territorial units named Environmental Territorial Units; despite the hierarchical categorisation of the area as methodological benchmark, UTA definition is based on more refined environmental variability factors than the ones usually used in great-scale projects (bioclimate, geomorphology) (C Blasi, 1996). UTA definition has complied with the criteria mentioned below:
- Lithological boundaries. This criterion has been adopted for a level ground separation of the district area, particularly Littoria and S. Michele - Rio Martino UTA have been separated from Latino Scalo and Faiti UTA.
- Territory morphology. This criterion has been essential to separate Astura UTA river valley, which is mainly a river valley, from the rest of the Pontina plain.
- Use of predominant ground (natural elements, arable lands and urbanization grade in particular way). This criterion has been adopted to separate Littoria, Sabotino, Grappa-Lago di Fogliano and S. Michele Rio Martino UTA.
- Elevation boundaries. Thanks to this criterion Faiti UTA has been separated, being a hollow within Latina district.
- Survey of the historical matrix.This criterion has been adopted in order to confirm the boundaries mentioned above and to prove the identity features of every single UTA (for instance, Astura UTA has historically been a separated unit distinguished by landscape features preceding the land improvement initiatives). 4. Survey of the landscape matrix:
- Survey of the structural features of the residual natural fragments located in the area;
- Survey of the landscape isolation and the environmental matrix permeability, which is ensured by the presence of consistent formations in several UTA. 5. Evaluation of the survey outcomes and definition of the landscape quality objectives. 6. Defining and programming reclamation interventions of the land structural and identity features, planning them in the short, medium and long term. 3. Results and Discussion 3.1 Identifying the structuring elements of the landscape identity 3.1.1 Survey of the area anthropogenic conversions
The main aim of this survey stage is the historical reconstruction of the area structuring process connected to the anthropogenic conversions. Starting from the contemporary period, it has been possible to point up the area conversions matrixes that have come to the present day from different historical periods, representing the area memory and identity after which future conversions process can be patterned. The most meaningful phases of the Latina district structuring process can be connected to three macro historical periods: Pre and post Roman (before 312-756 AD); “Popes

124 ICSD Book of Proceedings (2017), 5, 121-132
Published by ECSDEV, Via dei Fiori, 34, 00172, Rome, Italy http://ecsdev.org
conversions” (756 AD- 1927); “The Great Reclamation” (1927-1936). Thanks to “The Great Reclamation”, the land contemporary configuration has been structured around three main elements: the hydrographic network, the agricultural matrix and the urban settlements (Figure 1).
Figure 1 a) Large area occupied bya forest marshland; b) Rural communities settled in the new-born Agro Pontino; c) Territorial structure of the podere Latina 1936; d) City growth lacking any differentiation and recognisability.
3.1.2 The landscape mosaic actual heterogeneity
Thanks to the historical facts and the dynamics described above, the rural areas reclamation has been acknowledged as the key point of the recovering process of the Latina district identity features. Consequently, a fact-finding survey phase has been fulfilled in the district area in order to estimate the environmental quality of the district landscape mosaic, starting from a detailed land cover mapping. The current mosaic of the Latina area landscape is composed of a landscape matrix of irrigated arable lands and of urban settlements - 58% and 22% of the district area respectively. Here, scant (in terms of number and extent) residual nature fragments (natural vegetation and moist areas) scatter, currently covering the 3% of the district area surface. Another landscape identity feature of the Latina district, which has been mapped in detail, is showed in Figure 2.

M. Sibilla, A. Barbati 125
© 2017 The Authors. ECSDEV Compilation © 2017 European Center of Sustainable Development.
Figure 2. a) Riparian formations alongside the canals and rivers of the district hydrographic network b) Eucalyptus windbreak barriers located on the borders of farmed fields or alongside the reclamation trenches.
3.1.3 The potential heterogeneity of the landscape mosaic
The area potential heterogeneity is outlined by mapping the landscape structuring environmental features and the source of the vegetation sequences map. As far as the local and the environmental planning is concerned, the vegetation sequences map is a reference tool aimed at understanding the ecology, the biodiversity, the naturalistic value, the vegetation potentiality and recovery speed (resilience and resistance connected to each sequence stage) that characterizea given territory (Figure 3). 3.2 Assessment scale definition of the state of preservation
The land cover and consistent formations map has been used as a database in order to estimate on a district and UTA scale the local state of preservation, on the basis of the Index of Landscape Conservation (ILC) (Pizzolotto & Brandmayr, 1996). In its original formulation, the ILC index is obtained by conferring an ordinal value of state of preservation to every class of the Corine Land Cover legend, this value being growing and shifting from the classes of artificial surfaces to the farming areas, the natural and semi natural areas up to the moist areas. Within each macro-class the index value varies depending on specific criteria such as waterproofing (artificial surfaces), hemeroby condition (farming areas), proximity to mature stage vegetation (natural and semi natural areas). In this methodological perspective, a new ILC ordinal scale has been outlined (Table 1) for the land use classes in the Latina district by diversifying in particular way, on the basis of the available data and a strictly typological approach, the different hemeroby level of the farming areas, these being the predominant elements of the landscape mosaic and, consequently, the areas which mostly affect the ILC.

126 ICSD Book of Proceedings (2017), 5, 121-132
Published by ECSDEV, Via dei Fiori, 34, 00172, Rome, Italy http://ecsdev.org
Figure 3. Latina vegetation sequences map includes 7 cartographic units (Biondi, 1996) and it was drawn up by means of the territory hierarchical classification (Carlo Blasi, Carranza, Frondoni, & Rosati, 2000; C Blasi & Smiraglia, 2003).
3.3 Assessing the preservation conditions (ILC) of Environmental Homogeneity Territorial Units (UTA)
The total ILC of the Latina district territory and its UTA are showed in Figure 4. As it is possible to infer from the estimation, the ILC index proves the low quality state of preservation of the district territory, but in this case, since the urbanization level is very high in such a territory, the index can be considered synthetic and indicative, but not complete in its contribution. Therefore, it has been necessary to complete the ILC calculation with additional specific surveys on the area, in order to mould the landscape matrix actual features. 3.4 Landscape matrix survey
The surveys implemented are the following. 3.4.1 Structural survey of the residual nature fragments
The patches concerning the land cover typologies with greater environmental quality (ranking ILC 8 and 9) have been observed from a structural point of view. The survey outcome has showed that beyond being distinguished by a limited extension, the patches have a prevailing lengthened structure, including the non-riparian vegetation typology, hence their being subjected to an edge effect. In addition, the vegetation typologies are mainly represented by several small-sized patches, rather than single patches with bigger dimensions, thus proving the habitat fragmentation problem. 3.4.2 Survey of the matrix permeability and the distances from mature stage fragments
As mentioned above, the consistent vegetation areas (riparian vegetation and windbreak barriers) play a pivotal role in such a simplified agro-ecosystem. The forest areas can functionas real corridors through which fauna moves to more beneficial areas, by passing through little bio-porous barriers, such as the farming arable matrix. By comparing the consistent development of the hydrographic network with the riparian formation one, it is possible to assess, on each UTA scale, the size of the vegetation areas which the hydrographic network, through the formation of permeability lines, preserves as areas potentially functioning like ecological corridors. In order to provide additional tools aimed at estimating, in the district area, the spatial

M. Sibilla, A. Barbati 127
© 2017 The Authors. ECSDEV Compilation © 2017 European Center of Sustainable Development.
arrangement of the recognisable structural elements of the ecological network,two different kinds of surveys on GIS environment have been implemented; the main aim has been to assess:
Table 1. ILC ordinal scale of the land use classes of Latina municipality and the correspondingranking criteria adopted.
ILC Class
Land Cover Cod.
Nomenclature RankingCriteria
1 11 Urban fabric
Almost total waterproofing of the soil
1 12 Industrial, commercial and transport units
1 131 MineralExstractionsites
1 1321 Solid wastedumpsites
1 1322 Liquid wastedumpsites
1 1331 Constrcutionsites
1 1332 Reworkedsoilsand artifacts
1 5112 Channels Artificialhydrography
1 5122 Artificialreservoirs
2 141 Green urbanareas
Partially waterproofed soils in the urban and agricultural (greenhouses)field
2 1421 Sport facilities
2 1422 Sportareas
2 1423 Leisureareas
2 143 Cemeteries
2.5 2123 Vegetable crops in open fields, in greenhouses and under plastic in irrigated areas
3 2111 Arable landmainly withoutdispersed vegetation
Annual intensive crops 3 2121 Permanentlyirrigated land
3 2122 Nurseries in irrigatedareas
3 242 Complexcultivationpatterns
4 221 Vineyards
Permanent intensive crops, frequently realized with no nativespecies(e.g. Actinidiachinensisorchardsand Eucalypti)
4 222 Fruit trees and berry plantations
4 2242 Eucalipteti from woodarboriculture
4 2243 Eucaliptetiaswindbreaks
4 2241 Wood Arboriculture
5 223 Olivesgroves Permanent crops realized with species ecologically consistent with the area (olives groves), extensive crops or crops with spatial micro-heterogeneity. Farming areas with a considerable presence of uncultivated land and spontaneous vegetation units; arboreal vegetation features far from the mature stage.
5 231 Pastures
5 241 Annual crops associated with permanent crops
6 243 Landoccupiedprincipally by agriculture with significant areas of natural vegetation
6 312 Coniferousforest
7 313 Mixed forest
Vegetation in a strong and dynamic recovery(presence of native species), potential natural herbaceous vegetation; hydrographic network and partially deteriorated moist areas
7 3243 Bushywoodlands
7 331 Beaches, dunes, sands
7 5111 Rivers
7 411 Inlandmarshes
7 321 Natural grassland
7 4121 Exploredpeatbogs
8 322 Moors and heathland
Potential natural shrubby vegetation
8 3221 Heathlands and moorlands
8 323 Sclerophyllousvegetation
8 3231 Sclerophyllous vegetation: bushy Sclerophyllous vegetation
9 521 Coastallagun
Potential natural vegetation (mature stage) and moist areas in a good state of preservation.
9 421 Salt marshes
9 311 Broad-leavedforests
9 3115 Plantation of broad-leaved forest
9 3116 (Quercus spp., Ostryacarpinifolia, Carpinusbetulus)

128 ICSD Book of Proceedings (2017), 5, 121-132
Published by ECSDEV, Via dei Fiori, 34, 00172, Rome, Italy http://ecsdev.org
Figure 4. The total ILC of the Latina district territory and its UTA
- The distance of each point of the district territory from the mature stage vegetation existing fragments; the distance has been evaluated by devising a function of distance from the fragments. (Figure 5).
- The current permeability of the arable matrix; this permeability has been evaluated by dividing the matrix surface in sample units of 10 hectares uniform surface, and by estimating the percentage of units where the consistent formations cross the surface. The surveys outcomes are summarized in Table 2, 3 and 4. 3.5 Evaluation of the survey outcomes and definition of the landscape quality objectives
The outcomes point out different criticalities connected with the natural and structural elements of Latina landscape. These criticalities are synthesized below:
- high artificialization and poor quality of the hydrographic network;
- low environmental quality of the agricultural matrix;
- high level of fragmentation of the natural vegetation patches and limited natural areas;
- growth of the urban sprawl and consequent loss of identity of the original settlements (Borghi). In such a situation, it is difficult to face and solve all the criticalities identified here with a single planning horizon; therefore, it seems proper to formulate a proposal of environmental planning to begin the process of reclamation and/or development of the landscape structural and identity elements, thus settinga significant trend reversal. The proposal is based on the guiding principle of introduction of natural patches in the agricultural matrix. This kind of intervention fulfils synergetic and cross functions since:
- It begins a process of reclamation of the landscape naturalistic identity through the planting in the agricultural matrix of small-sized patches of mature stage forest

M. Sibilla, A. Barbati 129
© 2017 The Authors. ECSDEV Compilation © 2017 European Center of Sustainable Development.
vegetation in order to respect the already existing agricultural activities.
- It enhances, through new structural elements, the functionality of the local ecological network, currently composed of riparian vegetation, windbreak barriers and mature stage residual fragments. Such an enhancement is possible by means of:
- a spatial distribution of the interventions aimed at limiting the isolation level of the mature stage residual fragments and at favouring the areas with a scarce or null domination of consistent formations
- the interventions able to reduce the distance between the structural junctions of the existing ecological network. Table 2. Percent arrangement of the distances from the mature stage closer fragment in different UTA.
UTA 0-0.5 km 0.5 -1 km 1-2 km 2-5 km 5-10 km Totale
Latino Scalo 0 0 3 40 57 100
Faiti 3 9 32 57 0 100
Astura 37 28 23 13 0 100
Littoria 24 29 41 7 0 100
S. Michele-Rio Martino 17 25 53 6 0 100
Sabotino 21 39 35 4 0 100
Grappa-Lago di Fogliano 29 40 31 0 0 100
More than a half of Latina Scalo UTA and Faiti UTA territory shows a wide distance (at least 2 km) from the Mature Stage existing fragments, contrary to more than 40% of the other UTA territory whose distance from the above mentioned fragments is less than a kilometre. Table 3. Farming matrix permeability due to riparian formations. UTA Farming matrix not
crossed byriparian formations (surface
sample unit, ha)
Farming matrix with riparian
formations(surface sample unit, ha)
Total surface of the
farming matrix (ha)
Farming matrix permeability due to
riparian formations.(%)
S. Michele-Rio Martino 896.923 514.568 1411.491 36
Faiti 1380.961 690.526 2071.487 33
Sabotino 1480.832 709.141 2189.973 32
Grappa-Lago di Fogliano 341.465 142.147 483.612 29
Astura 1833.065 646.936 2480.001 26
Littoria 1647.331 516.828 2164.159 24
Latino Scalo 3161.253 413.821 3575.074 12
Borderlands 825.119 614.335 1439.454 43
Totale Latina 11566.949 4248.302 15815.251 27
From the assessment of the overall matrix permeability (see alsoTable 4), it was possible to infer that: in S. Michele-Rio Martino, Faiti and Sabotino UTA, more than one third of the farming matrix is pervaded by the consistent formations. In Latina Scalo UTA the worst levels of permeability are observed. The windbreak barriers help in completing these levels of permeability; particularly in Littoria and Sabotino UTA, these barriers contribute considerably.

130 ICSD Book of Proceedings (2017), 5, 121-132
Published by ECSDEV, Via dei Fiori, 34, 00172, Rome, Italy http://ecsdev.org
Table 4. Farming matrix permeability due to windbreak barriers.
UTA
Farming matrix not crossed by
windbreaks (surface sample unit, ha)
Farming matrix crossed by
windbreaks (surface sample unit, ha)
Total surface of the
farming matrix (ha)
Farming matrix permeability due to
windbreaks.(%)
Littoria 1592,89 571,27 2164,16 26
Sabotino 1665,07 524,90 2189,97 24
Latino Scalo 2901,55 673,53 3575,07 19
S. Michele-Rio Martino 1146,10 265,39 1411,49 19
Astura 2053,07 426,93 2480,00 17
Faiti 1798,12 273,37 2071,49 13
Grappa-Lago di Fogliano 480,25 3,36 483,61 1
Borderlands 1187,22 252,24 1439,45 18
Totale Latina 12824.265 2990,986 15815.251 19
- It attenuates the urban sprawl diffusion in the agricultural matrix and makes the “Borghi” recognisability stronger since the natural areas, if appropriately placed within the agricultural-urban interface, represent a sort of defence against the risk of obstruction from new buildings, thus lessening the level of convertibility of the agricultural matrix and bringing out its noticeability by using new technological tools linked to water (phytodepuration). 3.6 Programming and planning reclamation interventions of the land structural and identity features in the short, medium and long term.
Based on the guiding principle just described, the proposal of environmental planning suggests scenarios of interventionin the short and medium term in order to improve the single UTA landscape quality. The short-term scenario envisages doubling the mature stage surface (land cover classes with ranking ILC 9) present in the local area, for a total surface of intervention equal to 424, 26 hectares (1% of the local area surface). The medium-long term scenario sets out to plant large-sized and mature stage woody trees such as Quercus cerris and Quercus frainetto (30 hectares) for a total extension of 1385 hectares equal to 5% of the Latina municipality surface, this being beneficial to the naturalistic requalification of Pontina plain.
Figure 5. Left: distribution of distances in the local area surface from the nearest fragment of mature stage vegetation. Right: distribution of distances in the local area surface from the nearest fragment of mature stage vegetation after the supposed interventions.

M. Sibilla, A. Barbati 131
© 2017 The Authors. ECSDEV Compilation © 2017 European Center of Sustainable Development.
4. Conclusions
As showed above, the recent historical identity of the Latina municipality area is closely related to three elements structurally and functionally integrated with the Agro Pontino features: the landscape agricultural matrix, the hydrographic network and the urban settlement of rural “Borghi”. In the latest years, the increase of urban and industrial settlements, the change of the agricultural productive systems and a disrespectful use towards the morphological and natural features of the area have caused the loss of ecological functionality. Therefore, it is considered necessary that the reclamation process of the Latina municipality specific nature and identity should start exactly from the re-introduction of natural patches, that is, mature stage fragments spread out in the farming matrix since:
- it permits the preservation and enhancement of the matrix that protects the area from a further urbanization, thus reflecting the area peculiar identity;
- it allow seven the “Borghi” requalification, since their origins are closely related to the rural landscape, so it would avoid their further merger into the urban formations developed alongside the arterial roads;
- it enables the re-introduction of potential woody plants typical of the Agro Pontino through interventions on small-sized surfaces in the short-time and on more sizeable surfaces in the medium-long term;
- it entails an improvement of the agricultural farming permeability, with positive consequences on the hydrographic network functionality of the Pontina plain, a local area that, in spite of all its potentialities, is now considered unsuitable for some animal species. In conclusion, it has been highlighted that starting from the main pattern of the territory hierarchical classification it is possible to define some specific sub-patterns applicable to each area, able to provide concise and significant answers about the state of preservation of the territory and its structural features. This proves to be a necessary knowledge to formulate environmental design proposals aimed at implementing several practices of requalification and reclamation of the environmental quality of the landscape on this specific area. In addition, the methodological approach adopted is also applicable to a wide range of different landscape typologies through the continuous updating of ILC ordinal scale in order to develop urban reforestation projects. References Biondi, E. (1996). La geobotanica nello studio ecologico del paesaggio. Ann. Acc. It. Sc. Forestali, XLV, 3–39. Blasi, C. (1996). II fitoclima d’Italia. Plant Biosystem, 130(1), 166–176.
Blasi, C., Carranza, M. L., Frondoni, R., & Rosati, L. (2000). Ecosystem classification and mapping : a proposal for Italian landscapes. Applied Vegetation Science, 3(2), 233–242.
Blasi, C., & Smiraglia, D. (2003). Analisi multitemporale del paesaggio e classificazione gerarchica del territorio: il caso dei Monti Lepini (Italia centrale). Informatore Botanico, 35(1), 31–40.
Branchetti, M., & Sinisi, D. (2005). Lazio pontificio tra terra e mare: storia e immagini dai documenti dell’Archivio di Stato di Roma (secoli XVI-XIX). Roma: Gangemi.
Council of Europe. (2000). European Landscape Convention. Report and Convention Florence, ETS No. 17(176), 8.

132 ICSD Book of Proceedings (2017), 5, 121-132
Published by ECSDEV, Via dei Fiori, 34, 00172, Rome, Italy http://ecsdev.org
De Montis, A. (2014). Impacts of the European Landscape Convention on national planning systems: A comparative investigation of six case studies. Landscape and Urban Planning, 124, 53–65.
Dierna, S., & Orlandi, F. (2005). Buone pratiche per il quartiere ecologico. Firenze: Alinea. European Environment Agency. (2006). Urban sprawl in Europe - The ignored challenge. EEA report (Vol.
10). Johnson, M. P. (2001). Environmental impacts of urban sprawl: A survey of the literature and proposed
research agenda. Environment and Planning A, 33(4), 717–735. Pizzolotto, R., & Brandmayr, P. (1996). An index to evaluate landscape conservation state based on land-use
pattern analysis and Geographic Information System techniques. Coenoses, 11, 37–44.

5th International Conference on Sustainable Development 6-7 September 2017, Rome, Italy
Book of Proceedings 5, 133-142 Doi: 10.14207/5ICSD2017
|1Faculty of Economics, University of Ljubljana, Slovenia.
Is the Renewable Energy Sector Financially Attractive? Financial Bubbles in the Wilderhill Indices
Iskra Sokolovska1, Aleksandar Kešeljević1
Abstract Renewable energy will have an ever more important role in the green energy transition. The latter needs private sector involvement in terms of finance. However, the sector has been inherently volatile which makes it less attractive for investors. We aim to test one reason for this proposition on the WilderHill clean energy indices by testing for financial bubbles. Namely, renewable energy has been on the market for a while which might mean that the previous hindering factors might not be at play today, or at least not to such a strong extent. The results provide evidence for a bubble in only one of the indices. Specifically, we identify two bubble episodes prior to the crisis in the WilderHIll New Energy Global Innovation Index only. There is not enough statistical evidence to identify a bubble in the WilderHIll Progressive Energy Index or the WidlerHill Eco Index. This might indicate better prospects for the sector as a whole as it implies that its riskiness, at least when observed in terms of bubbles has decreased.
Keywords: Financial bubbles, clean energy, green transition
1. Introduction
Sustainable development entails three concepts and they have been operationalized in the narrower term which is a green economy. A key issue within the green economy is the issue of power generation. Economies seek to decarbonize and provide clean power. Renewable energy is thus crucial for a green economy transition. Indeed, it features in the EU 2020 policy goals. Although it is a source of clean energy and thus suitable for the green economy transition, it is also a source of risk. This is due to the sector’s novelty as well as inherent policy risks related to policy makers’ long term commitments. Both contribute to the sector’s riskiness. Indeed, renewable energy sectoral indices are volatile and risky. This implies that they are not as attractive financially. This has likely been the case over the past decade. However, stronger policy commitments and improved green growth prospects may have made the sector more attractive. On the other hand, volatile energy prices, in particular oil prices may have contributed to larger volatility. We aim to test this proposition by testing for financial bubbles in the Wilderhill clean energy indices. Our first contribution is a test for financial bubbles in the renewable sector in general. In addition, the indices focus on different aspects of clean energy generation, thus enabling a qualitative judgement as to which segment of the renewable energy sector is more sensitive to volatility. The paper is organized as follows: Section 2 summarizes the

134 ICSD Book of Proceedings (2017), 5, 133-142
Published by ECSDEV, Via dei Fiori, 34, 00172, Rome, Italy http://ecsdev.org
literature on energy and the stock market, Section 3 describes the data and methodology, Section 4 presents the results and Section 5 presents the concluding remarks. 2. Literature review
Numerous studies have analyzed the link between oil prices and the stock market (Arouri, 2011;Basher & Sadorsky, 2006;Elyasiani, Mansur & Odusami, 2011;Hammoudeh, Bhar & Thompson, 2010). In theory, there are several channels as to why oil prices may affect the economy and through it the stock market such as GDP or inflation. Liquidity changes in the commodity market are positively correlated to liquidity changes in the broader equity market (Marshall, Nguyen & Visaltanachoti, 2013). However, the relationship between commodity/energy markets and the stock market need not always be positive. A low oil price works to stimulate the economy and the business cycle and therefore the stock market, which implies a negative relationship between stock prices and the oil price. A positive relationship appears as well, due to financial bubbles affecting the overall stock market negatively and consequently the business cycle, depressing oil prices as well (Gatfaoui, 2016). In general, studies find that energy price increases are negatively linked to the stock market (Sadorsky, 1999;Zhou & Wang, 2012). However, some authors find that the effect is conditional on the source of the shock. Namely, Bastianin, Conti, and Manera (2016) find that the stock market in advanced economies does not respond to oil supply shocks, but to oil demand shocks only. This contrasts with Cunado and Perez de Gracia (2014) who study European stock markets and find a negative effect of oil price increases which is mostly driven by oil supply shocks. Broadstock and Filis (2014) find that both types of shocks affect stock market returns, but the effects are time-varying and both positive and negative. Whereas many studies have focused on the general energy market, comparatively fewer studies have focused on the renewable energy stock segment. Oil prices tend to affect renewable energy stocks positively, as they reflect higher demand for energy, making them de facto complements. Managi and Okimoto (2013) study the Wilderhill clean energy index and find a significant positive relationship between renewable energy stocks and the oil price. In contrast, Wen et al. (2014) report that that fossil fuel and renewables are viewed as competing assets. Moreover, renewable energy stocks are riskier than fossil fuel stocks since they are more volatile. The literature is thus inconclusive as to the relationship between the oil price and renewables. An important finding is that renewable energy is risky. One potential explanation for this is its correlation with technology stocks. Henriques and Sadorsky (2008) find that technology shocks and oil price shocks cause alternative energy stock prices. This is corroborated in Inchauspe, Ripple, and Trück (2015) who apply a multi-factor asset pricing model on renewable energy stock indices between 2001 and 2014, among which the stock market, technology prices and oil prices. Kumar, Managi, and Matsuda (2012) report similar findings for three alternative energy indices between 2005 and 2008, namely that the volatility in oil prices, general technology stock prices and interest rates account for 30% of the variability in total alternative energy source variability. Sadorsky reports that not only are stock prices of US clean energy companies correlated with

I. Sokolovska, A. Kešeljević 135
© 2017 The Authors. ECSDEV Compilation © 2017 European Center of Sustainable Development.
technology prices, but they are more highly correlated with technology stocks than with oil prices. This finding appears in Inchauspe, Ripple, and Trück (2015) as well. Another avenue in researching renewables is through the CAPM finance model. Indeed, some authors have applied this model. For example, Bohl, Kaufmann, and Stephan (2013) apply the four-factor Carhart (1997) CAPM to a sample of German renewable stocks between 2004 and 2011. They report a negative four-factor alpha after the financial crisis and a bubble in renewable indices prior to the crisis. The CAPM allows inference on the beta coefficient as well, which is reported to be high as well (Henriques & Sadorsky, 2008). Thus, a brief glance on the literature of energy and stock prices reveals that much of the work done so far has focused on oil prices. This is understandable in so far as renewable indices did not have a long enough history. However, there are now several market providers of clean energy indices, which allows for more in-depth quantitative analysis. We have chosen to apply the recent financial bubble test to several of the most representative clean energy indices, the WilderHill indices. The issue of stock volatility is always pernicious and in light of the green transition, ever more relevant for the renewable energy sector. 3. Data and Methodology
We use data from the WilderHill clean energy indices, obtained from the Bloomberg database. We test for financial bubbles in all three indices. The three indices covered include the WilderHill progressive energy index (WHPRO), the New Energy Global Innovation Index (NEX) and the Wilderhill Clean Energy index (ECO). The second is the most progressive of all, as it aims to include firms that are technologically innovative in the clean energy sector. The first includes firms who are more advanced in their clean energy practices in terms of applying transitional technologies. Namely, it includes companies which contribute to “improving near term-use of fossil fuel resources by progressively reducing carbon and other pollution reflecting transitional technologies”(WilderHill, 2017). The ECO index is similar to the NEX index in that they both focus on clean technologies. They differ in that the ECO index covers firms listed only in the US, whereas the NEX index includes firms listed outside the U.S. as well. The following table shows the descriptive statistics for the three indices. Table 1. Descriptive statistics
Index No. of obs Average St.dev Min. Max.
WilderHill NEX 4120 196.258 77.088 88.03 462.48
WilderhHill ECO 4028 118.645 62.31 36.53 297.05
WilderHill PRO 2573 232.651 41.353 100.22 318.61
The methodology used is the rolling window stationarity test described in Phillips, Shi, and Yu (2012). As is familiar in the literature, there is a bubble when the series is not stationary, i.e. there is a unit root. Thus, the following rho coefficient should be zero under the null hypothesis (number of lags is not fixed to one).

136 ICSD Book of Proceedings (2017), 5, 133-142
Published by ECSDEV, Via dei Fiori, 34, 00172, Rome, Italy http://ecsdev.org
𝑦𝑡 = 𝜌𝑦𝑡−1 + 𝑒𝑡 (1) A non-zero rho indicates a non-stationary series and thus the presence of a unit-root. An autoregressive process in turn indicates an explosive process, i.e. a bubble. This is the concept of stationarity applied in testing for bubbles. However, it is possible that there is more than one bubble in the series. Oftentimes, it is the case that the stationarity null hypothesis cannot be rejected in such cases due to the length of the series which appears to be stationary in the long-run. To overcome this issue, Phillips, Shi, and Yu (2012) suggest the use of rolling windows which will enable easier rejection of the null, in the presence of multiple bubbles. Thus, an initial window is chosen and the null is tested on the sample from the first observation until the initial window observation (if the initial window is 10% of the observations, then the null is initially tested on the first 10% of the data). The sample is extended with each subsequent observation, thus ranging from the minimum initial window to the full sample. This is a preferable option in the presence of multiple bubbles. What is obtained are ADF statistics at each sample, i.e. observation. The SADF sequence is a sequence of the value of the classical ADF test statistic at each tested sample, i.e. observation. Critical values are obtained using Monte Carlo simulations. Since the test builds on the initial stationarity test which is the ADF test, by taking the maximum test ADF statistic from each sample, it is referred to as the supremum ADF test (SADF test). We use this test and apply it to the three WilderHill series. The results are presented in the next Section. 4. Results
With the exception of one index, the indices are not discouraging for renewable energy. We find bubbles only in the WilderHill NEX index which is the index most exposed to clean energy innovation. It thus represents the essence of renewable energy, or contains market leaders (producers), whereas the other two include market followers as well. We identify two bubbles in the WilderHill NEX index and none in the other two indices. a) Wilderhill Progressive Index The Wilderhill PRO index is an index that focuses on transitional technologies. As can be observed from the graph, there seems to be a spike prior to the financial crisis. Similar spikes can be observed in the other two indices as well.

I. Sokolovska, A. Kešeljević 137
© 2017 The Authors. ECSDEV Compilation © 2017 European Center of Sustainable Development.
Figure 1. Wilderhill Progressive index
However, these spikes are not statistically significant for most of the sample as can be seen from Figure 2 below. Namely, statistical significance for rejecting the null requires that the SADF sequence crosses the critical value. This occurs only during the financial crisis of 2009, thus indicating a market crash and not a bubble. Peculiarly, in the period where we observe the largest spikes, we do not get any crossing. What is encouraging is that the volatility of the spikes seems to have decreased in the past half-decade to decade. This indicates that the sector is maturing.
Figure 2. WilderHill Progressive SADF sequence (test statistic and critical values)
100
150
200
250
300
whp
ro
2006 2008 2010 2012 2014 2016 2018date1
WilderhillPro Index
-3-2
-10
12
2006 2008 2010 2012 2014 2016 2018date1
sadf_whpro sadf_cv
WilderhillPro SADF sequence

138 ICSD Book of Proceedings (2017), 5, 133-142
Published by ECSDEV, Via dei Fiori, 34, 00172, Rome, Italy http://ecsdev.org
b) WilderHill NEX Index As stated earlier, the Wilderhill NEX Index is the most representative of the sector in terms of innovation. Thus, it represents its revolutionary essence. It is the one index for which we identify bubbles. Figure 3 shows the values of the index, whereas Figure 4 shows the test statistic sequence and the critical values.
Figure 3. WilderHill NEX index
Figure 4. WilderHill NEX SADF sequence (test statistic and critical values)
Both periods for which we identify a financial bubble occur prior to the crisis. Since the periods are very close to each other and do not have a period of at least 6 months between them, we may treat it as one bubble. Statistically, the first bubble starts in December 2005 and lasts until June 2006, the second bubble starts in November 2006 and lasts until July 2008.

I. Sokolovska, A. Kešeljević 139
© 2017 The Authors. ECSDEV Compilation © 2017 European Center of Sustainable Development.
Post-crisis there is a substantial decrease in volatility in the SADF test statistic. This is similar to the observation for the Wilderhill Pro index. c) Wilderhill ECO index The Wilderhill ECO is the index which is similar to the NEX index in that they both focus on the clean energy technologies, but lists only U.S. firms. Applying the SADF test to the sequence shown in Figure 5 does not produce statistically significant results.
Figure 5. WilderHill ECO index
Figure 6 shows the SADF test sequence and the critical values. This finding implies that the financial bubble identified for the NEX index is not geographically limited to, indeed it does not emanate from the U.S.
Figure 6. SADF sequence

140 ICSD Book of Proceedings (2017), 5, 133-142
Published by ECSDEV, Via dei Fiori, 34, 00172, Rome, Italy http://ecsdev.org
Overall, these results are not discouraging for renewable energy. First of all, it seems to be that the sector is gaining firmer ground as the volatility has gone down, as observed through a less volatile test statistic in the SADF test. This can be observed upon visual inspection of the values of the indices as well. Second, we identified financial bubbles in only one out of three indices, which is also encouraging. It is also intuitively plausible that the bubble emanates from the sector which is most representative of the renewable energy sector in essence, which is innovation and its disruptive power on society for better or worse. Conclusion
This paper focused on an empirical application to a field that is of growing importance- the finance of the green energy transition. A key aspect of the green energy transition is the aspect of energy generation through renewable energy sources. However, since the sector is nascent and by default exposed to policy risks, it is plausible that it will be, indeed it has been more prone to volatility. This is particularly evident prior to the financial crisis. This is discouraging for the clean energy transition as it gives a rationale to investors to refrain from renewable energy. Our paper focused on one aspect of this volatility, namely the existence and identification of financial bubbles. We have applied a recent methodology to three representative indices of the sector. The breadth of all three covered several aspects such as the thematic aspect of clean energy technologies or transitional technologies as well as the geographical aspect of U.S. or global stocks. The results indicated bubbles in only one of the indices. This was the WilderHill NEX index, which is intuitively plausible as well as it includes the clean energy innovators. This reflects the uncertain nature of the sector. Encouragingly, the volatility of the sector has gone down as can be observed through the indices, as well as the test statistics. We did not identify any bubble following the financial crisis. Our results confirm the finding in previous studies about the existence of a bubble in the renewable energy sector prior to the crisis and particularly in the mid-2000s (Bohl, Kaufmann & Stephan, 2013). Future research directions include broadening the scope of testing for financial bubbles by testing for bubbles in the different renewable energy sectors (solar or wind for example). Moreover, the financial attractiveness of renewable energy remains an unexplored niche. Thus, studying renewables’ risk through volatility modelling or returns through the CAPM model remain directions for future research. To sum up, our results show that the sector stands on firmer footing in the past decade compared to the 2000s. This implies that it is getting more financially attractive, although bubbles might act as an impediment. In light of the green transition though, these bubbles were identified in the innovation sector and not in the transitional technology sector. This provides room for more optimism for the green energy transition itself and its financing.

I. Sokolovska, A. Kešeljević 141
© 2017 The Authors. ECSDEV Compilation © 2017 European Center of Sustainable Development.
Bibliography Arouri, M. E. H. (2011). Does crude oil move stock markets in Europe? A sector investigation. Economic
Modelling, 28(4), 1716-1725. Basher, S. A., & Sadorsky, P. (2006). Oil price risk and emerging stock markets. Global Finance Journal, 17(2),
224-251. doi: 10.1016/j.gfj.2006.04.001 Bastianin, A., Conti, F., & Manera, M. (2016). The impacts of oil price shocks on stock market volatility:
Evidence from the G7 countries. Energy Policy, 98, 160-169. doi: 10.1016/j.enpol.2016.08.020 Bohl, M. T., Kaufmann, P., & Stephan, P. M. (2013). From hero to zero: Evidence of performance reversal
and speculative bubbles in German renewable energy stocks. Energy Economics, 37, 40-51. doi: 10.1016/j.eneco.2013.01.006
Broadstock, D. C., & Filis, G. (2014). Oil price shocks and stock market returns: New evidence from the United States and China. Journal of International Financial Markets, Institutions and Money, 33, 417-433. doi: 10.1016/j.intfin.2014.09.007
Carhart, M. (1997). On Persistence in Mutual Fund Performance. Journal of Finance, 52, 57-82. Cunado, J., & Perez de Gracia, F. (2014). Oil price shocks and stock market returns: Evidence for some
European countries. Energy Economics, 42, 365-377. doi: 10.1016/j.eneco.2013.10.017 Elyasiani, E., Mansur, I., & Odusami, B. (2011). Oil price shocks and industry stock returns. Energy Economics,
33(5), 966-974. doi: http://dx.doi.org/10.1016/j.eneco.2011.03.013
Gatfaoui, H. (2016). Linking the gas and oil markets with the stock market: Investigating the U.S. relationship. Energy Economics, 53, 5-16. doi: 10.1016/j.eneco.2015.05.021
Hammoudeh, S., Bhar, R., & Thompson, M. A. (2010). Re-examining the dynamic causal oil–macroeconomy relationship. International Review of Financial Analysis, 19(4), 298-305. doi: 10.1016/j.irfa.2010.09.002
Henriques, I., & Sadorsky, P. (2008). Oil prices and the stock prices of alternative energy companies. Energy Economics, 30(3), 998-1010. doi: 10.1016/j.eneco.2007.11.001
Inchauspe, J., Ripple, R. D., & Trück, S. (2015). The dynamics of returns on renewable energy companies: A state-space approach. Energy Economics, 48, 325-335. doi: 10.1016/j.eneco.2014.11.013
Kumar, S., Managi, S., & Matsuda, A. (2012). Stock prices of clean energy firms, oil and carbon markets: A vector autoregressive analysis. Energy Economics, 34(1), 215-226. doi: 10.1016/j.eneco.2011.03.002
Managi, S., & Okimoto, T. (2013). Does the price of oil interact with clean energy prices in the stock market? Japan and the World Economy, 27, 1-9. doi: 10.1016/j.japwor.2013.03.003
Marshall, B. R., Nguyen, N. H., & Visaltanachoti, N. (2013). Liquidity commonality in commodities. Journal of Banking & Finance, 37(1), 11-20. doi: 10.1016/j.jbankfin.2012.08.013
Phillips, P. C. B., Shi, S.-P., & Yu, J. (2012). Testing for Multiple Bubbles. Cowles Foundation Discussion Paper No.1843.
Sadorsky, P. (1999). Oil price shocks and stock market activity. Energy Economics, 21(5), 449-469. Wen, X., Guo, Y., Wei, Y., & Huang, D. (2014). How do the stock prices of new energy and fossil fuel
companies correlate? Evidence from China. Energy Economics, 41, 63-75. doi: 10.1016/j.eneco.2013.10.018
WilderHill. (2017). All Available Indexes. Retrieved 8.8.2017, from
http://www.whprogressive.com/indexes.php
Zhou, S., & Wang, D. (2012). The macroeconomic and financial effects of oil price shocks. MPRA working paper 43731.