BONUS-MALUS SYSTEMS IN AUTOMOBILE INSURANCE978-94-011-0631-3/1.pdf · Klugman, Stuart A.: Bayesian...
24
BONUS-MALUS SYSTEMS IN AUTOMOBILE INSURANCE
Transcript of BONUS-MALUS SYSTEMS IN AUTOMOBILE INSURANCE978-94-011-0631-3/1.pdf · Klugman, Stuart A.: Bayesian...

BONUS-MALUS SYSTEMS IN AUTOMOBILE INSURANCE
Huebner International Series on Risk, Insurance, and Economic Security
J. David Cummins, Editor The Wharton School University of Pennsylvania Philadelphia, Pennsylvania, USA
Series Advisors:
Dr. Phelim P. Boyle University of Waterloo, Canada
Dr. Jean Lemaire University of Pennsylvania, USA
Professor Akihiko Tsuboi Kagawa University, Japan
Dr. Richard Zeckhauser Harvard University, USA
Other books in the series:
Cummins, J. David and Derrig, Richard A.: Classical Insurance Solvency Theory
Borba, Philip S. and Appel, David: Benefits, Costs, and Cycles in Workers' Compensation
Cummins, J. David and Derrig, Richard A.: Financial Models of Insurance Solvency
Williams, C. Arthur: An International Comparison of Workers' Compensation
Cummins, J. David and Derrig, Richard A.: Managing the Insolvency Risk of Insurance Companies
Dionne, Georges: Contributions to Insurance Economics Dionne, Georges and Harrington, Scott E.: Foundations of
Insurance Economics Klugman, Stuart A.: Bayesian Statistics in Actuarial Science Durbin, David and Borba, Philip: Workers' Compensation Insurance:
Claim Costs, Prices and Regulation Cummins, J. David: Financial Management of Life Insurance
Companies Gustavson, Sandra G. and Harrington, Scott E.: Insurance,
Risk Management, and Public Policy

BONUS-MALUS SYSTEMS IN AUTOMOBILE INSURANCE
by
Jean Lemaire
of
The Wharton School at The University of Pennsylvania
.... " Springer Science+13usiness Media, LLC

Library of Congress Cataloging~in-Publication Data Bonus-malus systems in aUiomobile insurance 1 [Jean Lemaire, editor).
p . cm. -- (Huebner international series on risk, insurance and economic security : 19)
Includes bibliographical references and index.
I. Insurance , Automobile--Rates and tables. I. Lemaire, Jean. II. Series HG9970.2.B66 1995 368'.092--dc20 94-41825
CIP
Copyright It' 1995 by Springer Sciencc+Business Media New York Originally published by Kluwer Academic Publishers in 1995 Softcover reprint of the hardcover I st edition 1995
All rights reserved . No pan of this publication may be reproduced, stored in a retrieval system or transmitted in any form or by any means, mechanical , photo-copying, recording, or otherwise, without the prior written permission of the publisher, Springer Science+Business Media, LLC.
Primed on acid-free paper.
ISBN 978-94-010-42758 ISBN 978-94-011-0631-3 (eBook) DOI 10.1007/978-94-011-0631-3

Contents
List of Figures ix
List of Tables xi
Preface xv
Main Notations xxv
Part 1 Introduction: Models for Claim Number Distributions
Introduction: Definition of a Bonus-Malus System 3
2 A Typical Bonus-Malus Evolution: The Belgian Case 11
3 Models for the Claim Number Distribution 21
Appendix A Applications in Other Disciplines 43
Part 2 Evaluation of Bonus-Malus Systems 57
4 Tool I: The Relative Stationary Average Level 59

VI
5 Tool 2: The Coefficient of Variation of the Insured's Premiums
6 Tool 3: The Elasticity of the Bonus-Malus System
7 Tool 4: The Average Optimal Retention
8 An Index of Toughness
9 Comments for Specific Countries. Rate of Convergence
Appendix B Description of All Bonus-Malus Systems
Part 3 The Design of an Optimal Bonus-Malus System
10
CONTENTS
67
71
91
103
117
133
153
Construction of an Optimal System. Expected Value Principle 155
11 Other Loss Functions. Other Premium Calculation Principles 183
12 Penalization of Overcharges 197
13 Allowance for the Severity of Claims 205
14 The Effect of Expense Loadings 211

CONTENTS Vll
Part 4 An Alternative Proposal: A High Deductible 221
15 A High-Deductible System 223
16 Empirical Determination of the Deductible 245
References 257
Author Index 271
Subject Index 277
About the Author 285

List of Figures
Figure 2-1. Development of the Average BMS Discount, Belgium 15 Figure 4-1. Evolution of Mean Premium Level for Four BMS 63 Figure 5-1. Evolution of Coefficient of Variation 68 Figure 5-2. Coefficient of Variation as a Function of the Claim
Frequency 69 Figure 6-1. Increase of Premium with Claim Frequency 73 Figure 6-2. Geometrical Calculation of the Elasticity 74 Figure 6-3. Elasticity of the Four Selected Systems 84 Figure 7-1. Algorithm to Compute Optimal Retentions 98 Figure 8-1. Factor Loading Plot 109 Figure 8-2. Factor Loading Plot After Rotation 110 Figure 8-3. Factor Scores 114 Figure 9-1. Optimal Retention as a Function of Claim Frequency 119 Figure 9-2. Optimal Retention as a Function of Claim Frequency:
Effect of Special Transition Rule 120 Figure 9-3. Optimal Retention as a Function of the Discount
Factor 121 Figure 9-4. Total Variation for Four Systems 127 Figure 9-5. Total Variation of the Japanese BMS for Three
Starting Classes 128 Figure 9-6. Total Variation of the Japanese BMS for Three
Sets of Transition Rules 129 Figure 9-7. Rate of Convergence for Switzerland and Japan 131 Figure 12-1. A Posteriori Distributions of Claim Frequency 198 Figure 13-1. Estimates of the Proportion of Claims with Bodily
Injury 209 Figure IS-I. Evolution of Coefficient of Variation over Time 230 Figure 15-2. Coefficient of Variation as a Function of the Claim
Frequency 231
x
Figure 15-3. Figure 15-4. Figure 15-5. Figure 15-6.
LIST OF FIGURES
Elasticity as a Function of the Claim Frequency Effect of Expenses on Elasticity Effect of Expenses on Coefficient of Variation Elasticity for Various Deductibles
232 241 242 243

List of Tables
Table 1-1. Belgian BMS 8 Table 1-2. Belgian BMS: Markovian Presentation 10 Table 2-1. 1971 Belgian BMS 12 Table 2-2. Development of the Average BMS Discount 14 Table 2-3. Distribution of Policyholders by Class 16 Table 3-1. Observed Distribution of Number of Claims in a
Portfolio 25 Table 3-2. Observed and Fitted Distribution of Number of
Claims: Poisson Model 26 Table 3-3. Observed and Fitted Distribution of Number of
Claims: Negative Binomial Model. Moments Method 33 Table 3-4. Observed and Fitted Distribution of Number of
Claims: Negative Binomial Model, Maximum Likelihood Method 34
Table 3-5. Observed and Fitted Distribution of Number of Claims: Poisson-Inverse Gaussian Model, Moments Method 36
Table 3-6. Observed and Fitted Distribution of Number of Claims: Poisson-Inverse Gaussian Model, Maximum Likelihood Method 37
Table 3-7. Observed and Fitted Distribution of Number of Claims: Good-Risk/Bad-Risk Model, Moments Method 39
Table 3-8. Skewness Coefficient for the Various Models 40 Table A-I. Example I 44 Table A-2. Example 2 45 Table A-3. Example 3 46 Table A-4. Example 4 48 Table A-5. Example 5 49 Table A-6. Example 6 50

xii LIST OF TABLES
Table A-7. Example 3: Exact Maximum Likelihood Estimators 53 Table A-8. Loglikelihoods and K statistics for All Examples 55 Table 4-1. Relative Stationary Average Level for All Systems 65 Table 4-2. Implicit Surcharge for Newcomers 66 Table 5-1. Coefficient of Variation of Premiums 70 Table 6-1. Elasticity 85 Table 7-1. Average Optimal Retentions 100 Table 8-1. Correlations Between the Four Measures of Toughness 103 Table 8-2. Variance Explained by Each Factor 107 Table 8-3. Factor Pattern: Correlations Between Variables and
Factors 108 Table 8-4. Factor Pattern After Rotation: Correlations Between
Variables and Factors 110 Table 8-5. First Factor Scores for All Systems: An Index of
Toughness 112 Table 9-1. Optimal Retentions: Belgian BMS 118 Table 9-2. Optimal Retentions: Japanese BMS 122 Table 9-3. Optimal Retentions: Taiwanese BMS 123 Table 9-4. Optimal Retentions: Swiss BMS 125 Table 9-5. Total Variation for Four Systems 126 Table B-1. Old Belgian System 134 Table B-2. New Belgian System 135 Table B-3. Brazilian System 136 Table B-4. Danish System 136 Table B-5. Old Finnish System 137 Table B-6. New Finnish System 138 Table B-7. Old German System 139 Table B-S. New German System 140 Table B-9. Hong Kong System 141 Table B-IO. Old Italian System 141 Table B-l1. New Italian System 142 Table B-12. Old Japanese System 143 Table B-13. Kenyan System 144 Table B-14. Old Luxembourg System 145 Table B-15. Malaysian System 146 Table B-16. Dutch System 146 Table B-17. Old Norwegian System 147 Table B-18. Spanish System 148
LIST OF TABLES Xl1)
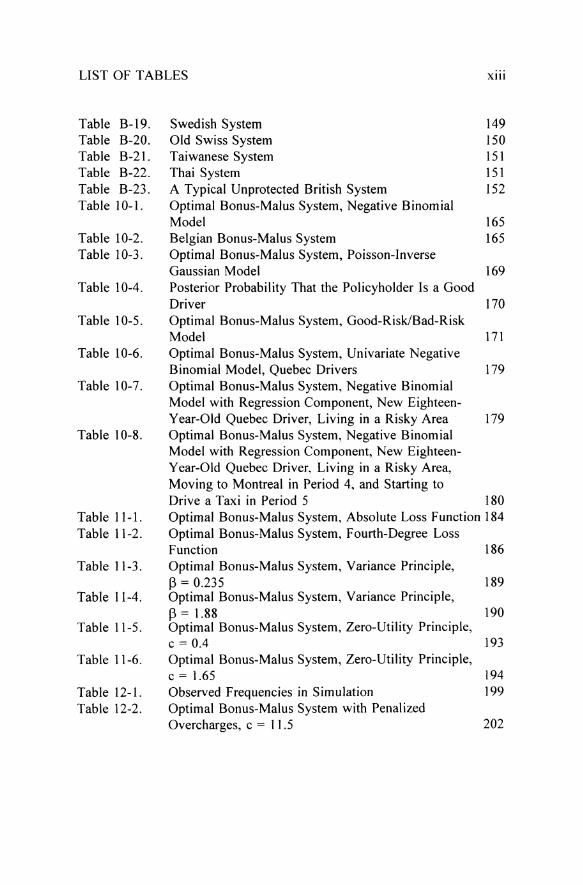
Table B-19. Table B-20. Table B-21. Table B-22. Table B-23. Table 10-1.
Table 10-2. Table 10-3.
Table 10-4.
Table 10-5.
Table 10-6.
Table 10-7.
Table 10-8.
Table II-I. Table 11-2.
Table 11-3.
Table 11-4.
Table 11-5.
Table 11-6.
Table 12-1. Table 12-2.
Swedish System 149 Old Swiss System 150 Taiwanese System 151 Thai System 15 1 A Typical Unprotected British System 152 Optimal Bonus-Malus System, Negative Binomial Model 165 Belgian Bonus-Malus System 165 Optimal Bonus-Malus System, Poisson-Inverse Gaussian Model 169 Posterior Probability That the Policyholder Is a Good Driver 170 Optimal Bonus-Malus System, Good-RiskiBad-Risk Model 171 Optimal Bonus-Malus System, Univariate Negative Binomial Model, Quebec Drivers 179 Optimal Bonus-Malus System, Negative Binomial Model with Regression Component, New Eighteen-Year-Old Quebec Driver, Living in a Risky Area 179 Optimal Bonus-Malus System, Negative Binomial Model with Regression Component, New EighteenYear-Old Quebec Driver, Living in a Risky Area, Moving to Montreal in Period 4, and Starting to Drive a Taxi in Period 5 180 Optimal Bonus-Malus System, Absolute Loss Function 184 Optimal Bonus-Malus System, Fourth-Degree Loss Function 186 Optimal Bonus-Malus System, Variance Principle, f3 == 0.235 189 Optimal Bonus-Malus System, Variance Principle, f3 == 1.88 190 Optimal Bonus-Malus System, Zero-Utility Principle, c == 0.4 193 Optimal Bonus-Malus System, Zero-Utility Principle, c == 1.65 194 Observed Frequencies in Simulation 199 Optimal Bonus-Malus System with Penalized Overcharges, c == 11.5 202

Preface
The story of people and their motor cars is one of the great love affairs of this century. The number of motor vehicles was estimated to exceed 400 million in 1994, as compared with a few thousand at the turn of the century. An unfortunate consequence has been the parallel growth of accidents and casualties, with over 100,000 deaths annually. Automobile third-party liability insurance has consequently been made compulsory in most developed countries, and actuaries from all over the world face the problem of designing tariff structures that will fairly distribute the burden of claims among policyholders.
The fundamental principle of insurance consists in forming a pool in which the policyholders put their risks. If these risks are not all equal to each other, it is fair to ask each member to pay a premium that is proportional to the risk that he imposes on the pool. When constructing a set of rates, it is of crucial importance to estimate the underlying risk of each insured party so that the costs of claims can be shared fairly. The main task of the actuary in the design of a new tariff structure is to make it as fair as possible, by partitioning all policies into homogeneous classes, with all policyholders belonging to the same class paying the same premium (for a survey of the most classical rate-making techniques, see van Eeghen, Greup and Nijssen, 1983.) In automobile third-party liability insurance, classification variables -a priori variables- introduced to partition risks into cells commonly include the age and gender of the policyholders, the type and use of their cars, and the place where they reside.
If all the factors influencing the risk could be detected, measured, and introduced in the rates, tariff classes would be homogeneous. Fluctuations of individual results around their average would exist only by chance and could not lead to a readjustment of the premium. There is

xvi PREFACE
nothing unfair in having the policyholders who make no claim subsidize the others, if all of them are equally exposed to risk: this is the very principle of insurance. But this conclusion no longer holds if the rates disregard important factors, whose considerable importance is acknowledged by common sense and experience: individual driving abilities such as accuracy of judgment, swiftness of reflexes, aggressiveness behind the wheel, knowledge of the highway code, and drinking behavior, are not taken into account in auto insurance rating, a priori, as these variables are impossible to measure in a cost-efficient way. Consequently tariff cells are still quite heterogeneous. Two teenage females, driving the same vehicle model in the same city, may exhibit very different accident patterns, due to differences in individual behavior. Hence the idea of trying to account for these differences a posteriori, by adjusting the premium from individual claims experience.
Rating systems that penalize insureds responsible for one or more accidents by premium surcharges or maluses, and that reward claim-free policyholders by awarding them discounts or bonuses, are now in force in most developed countries. Their main purpose, besides encouraging policyholders to drive carefully, is to better assess individual risks, so that everyone will pay, in the long run, a premium corresponding to his own claim frequency. Depending on the country, insurers will mention no-claim discounts, experience-rated premiums, personalized premiums, merit-rating systems, driving penalty points. In many European and Asian countries, the adopted terminology is bonus-malus systems (BMS). The study of bonusmalus systems is the object of this book. Thirty systems, in force in twentytwo countries, are presented and analyzed. Statistical tools are designed to compare them and evaluate their "toughness" to policyholders. Probabilistic models are developed to construct "optimal" bonus-malus systems.
The regulatory environments in the countries studied here are very different. To make comparisons possible, and to avoid having to devote lengthy paragraphs to nonessential material, the scope of this work had to be limited:
* Only BMS used in automobile third-party liability insurance are discussed. Some countries also use BMS in collision and comprehensive coverage, and sometimes the BMS used in collision is

PREFACE XVII
*
*
*
not the same as the one used in third-party.
Only BMS applied to "regular" passenger cars are analyzed. Some countries have special BMS for taxis, motorcycles, even ambulances.
In some countries with complete rating freedom, different BMS may coexist. In these cases only one or two typical systems are presented.
Several countries have recently drastically modified their BMS. When the changes were significant, both the old and the new systems are discussed. When only minor changes were introduced, only one system is analyzed.
While BMS used in collision coverage or for special types of cars are not mentioned in this study, they can, of course, be analyzed with the models that will be developed.
To avoid numerous repetitions, the words policyholders, insureds, and drivers are used interchangeably in the sequel. So are the words insurer, company, and carrier, and accidents, claims, and losses. "Accident" means an accident at fault that triggers a premium increase in the BMS. Note that different countries have different definitions of an accident. While in most cases any auto accident in which the insured driver is at least partially at fault leads to a surcharge, in some countries damages need to exceed a given monetary threshold, or the percentage of responsibility in the accident has to exceed a given limit.
Part 1 (chapters 1 to 3) provides an introduction to the book and presents the major probability distributions usually advocated to represent the number of claims. Chapter 1 begins with an overall presentation of the concepts underlying the idea of bonus-malus and a mathematical definition of a BMS. This definition requires the system to be Markovian, or "memory-less": the knowledge of the present class and the number of accidents during the policy year are sufficient to determine the class for the next year. For several BMS in force, this condition is not satisfied; in these cases it is shown how a subdivision of the bonus-malus classes can be used to analyze the systems within the framework of the theory of finite Markov chains.

XVlll PREFACE
Chapter 2 tells the story of Belgium, a typical country as far as the evolution of BMS is concerned. A first-generation system was introduced by market leaders in the mid-1960s and by all companies in 1971. The major decrease in claim frequencies observed around 1975 led to a huge clustering of policies in the high-discount classes and a total loss of purpose of the system. This, and changing consumer attitudes, forced insurance carriers to modify their philosophy toward a posteriori rating and to recently introduce a second-generation BMS.
Chapter 3 presents the negative binomial distribution, the main probabilistic model used to compare the different BMS in force and to design an ideal system. First the Poisson distribution is shown to provide an inadequate fit of observed claim number distributions in auto insurance portfolios. Since the Poisson distribution is noncontagious, this result alone justifies the introduction of BMS rating. A mixed Poisson distribution is needed to reflect the contagiousness of the claim process, which is due to portfolio heterogeneity (or, equivalently, to imperfect underwriting). The negative binomial distribution is obtained when the mixing distribution is a Gamma. It produces good fits of observed loss distributions. Competing models are also presented: a mixed Poisson with a two-point discrete mixing distribution, and the Poisson-inverse Gaussian. Appendix A shows that these models not only compete in insurance modeling but also in military, medical, and sports applications.
Part 2 (chapters 4 to 9) is a comparison of most of the BMS currently in force around the world. Thirty different systems, from twentytwo countries, are simulated, under the Poisson assumption. The main goal of the part is to rank all systems according to an Index of Toughness. Four chapters first define the tools that are to be used in the comparison. Chapter 4 presents the relative stationary average level (RSAL), a measure of the degree of clustering of the policies in the lowest classes of a BMS. The RSAL relates the average simulated premium level, once the BMS has reached the steady-state condition, to the minimum and maximum levels. A simple comparison of the RSAL with the starting level enables an evaluation of the treatment of new policyholders. For all systems, young drivers have to start their driving career at a level that is much higher than the average level for experienced drivers. They thus pay an implicit surcharge, which can reach 200 percent for the first year and which is often added to an
PREFACE XIX
explicit penalty or a deductible.
The coefficient of variation of the insured's premiums is another measure of the severity of a BMS, computed in chapter 5. The variability of payments inherent in all experience rating systems has been used by their critics, who argue that it goes against one of the basic principles of insurance: economic stability. The analysis shows that. even for the toughest systems, insureds are requested to retain only a small fraction of the loss process variability.
Chapter 6 presents the concept of elasticity of policyholders' payments with respect to their claim frequency. Two versions of this measure of the response of the system to a change in the number of claims are presented. The asymptotic concept necessitates the calculation of the stationary probability class distribution of the Markov chain; several computation techniques are detailed. The transient concept requires the calculation of the discounted expectation of lifetime payments.
The final tool to evaluate BMS, the average optimal retention, is analyzed in chapter 7. It has been known since the introduction of early BMS that this form of rating would induce policyholders to pay small claims themselves, in order to avoid future premium increases. The optimal strategy of the policyholder -the limiting claim amount (the retention) under which he should indemnify his victims, and above which he should report the accident to his company- depends on numerous factors, the most important being his present BMS class, his claim frequency, and his discount rate. An algorithm to compute optimal retentions is presented and applied to all systems. A currency conversion factor is introduced to enable the comparison of the average optimal retention across countries.
The four measures of toughness defined in chapters 4 to 7 are positively correlated. A BMS that penalizes claims heavily will exhibit high relative stationary average level, high coefficient of variation of premiums, high elasticity, and high average optimal retentions. In chapter 8, factor analysis is used to summarize the data. The use of a single principal component retains most of the information contained in the data. Scores along this first component define an Index of Toughness, our summary measure to evaluate the severity of all systems. Standardized scores are
xx PREFACE
assigned to each BMS, which enables us to rank all systems according to toughness. Obviously, the ranking of all BMS according to their toughness does not imply any judgment about their quality. Tough is not to be considered as a synonym of good (or bad).
Four countries (Belgium, Japan, Switzerland, and Taiwan) have been singled out in chapter 9 for specific comments and to illustrate the type of analysis that the preceding chapters provide. In addition, an analysis of the powers of the transition matrix of the four BMS allows a comparison of the rate of convergence of the systems to their steady-state condition. It shows that some sophisticated systems take more than sixty years to stabilize. Appendix B provides a full description of all the systems analyzed.
While the main goal of part 2 is the comparison of systems currently in force, part 3 (chapters 10 to 14) aims at constructing an ideal or optimal system, defined as a BMS that is obtained with Bayesian analysis. In chapter 10, the different models presented in chapter 3 to model claim number distributions are applied to the design of an optimal BMS that only penalizes the number of claims caused by a policyholder, disregarding their amount. Bayesian analysis is used to compute the posterior distribution of the claim frequency for policyholders who experienced similar claim histories. A major advantage of the negative binomial model is its stability: the predictive distribution of the number of claims in each subgroup remains negative binomial, with updated parameters.
The problem of the construction of an optimal BMS is presented in the form of a sequence of statistical games between the actuary and nature. When the actuary's estimation errors are penalized by a quadratic loss function, the estimate of the revised claim frequency is the a posteriori expectation. The resulting BMS, constructed according to the expected value premium calculation principle, is fair to the policyholders and financially balanced for the insurance companies. Year after year, in a closed group of policies, the average premium level remains stable. The optimal BMS, which is proved to be a special application of a credibility formula, turns out to be markedly more severe than all BMS in force around the world.
The optimal BMS is also computed for the Poisson-inverse Gaussian and the good-risk/bad-risk model. Computations are however more

PREFACE XXI
complicated in these two cases.
Other premium calculations principles (the variance principle and the exponential utility principle) and other loss functions (first-degree absolute loss and fourth-degree loss) are introduced in chapter II. The resulting BMS are established. They do not differ much from the BMS computed with the expected value principle. However, the financial stability property is lost, as premium income is not constant over time.
All the models developed in chapters 10 and II consider estimation errors in a symmetric way: all loss functions penalize an overcharge just as much as an undercharge. This symmetry is broken in chapter 12, where a suggestion of the control authorities of the Commonwealth of Massachusetts is implemented to bonus-malus theory. From a social perspective, it may be argued that requiring a policyholder to pay too much is a much more severe error than undercharging him. An exponential utility function is introduced to represent this social choice, under the condition that the BMS remains financially stable. A less severe system results.
With the exception of Korea, all BMS around the world penalize claims independently of their amount. This may be considered as unfair. People living in large cities. for instance, are more likely than rural drivers to be involved in accidents, due to traffic density, but usually less severe accidents. The probability to cause an accident with bodily injury is higher for drivers who were already involved in such an accident in the past. Drivers at fault in a claim with property damage only are more prone to provoke another accident, but that accident is less likely to have bodily injury implications. In chapter 13 the negative binomial model is extended to construct a BMS that makes allowance for the severity of claims. Each policyholder is now characterized by a pair of parameters: claim frequency and bodily injury claim frequency. A Beta distribution is introduced for the conditional distribution of the bodily injury claim frequency. The stability property of the negative binomial model extends to the generalized model, and a BMS that takes claim severity into account is built. It penalizes each bodily injury claim about as much as four property damage claims.
All preceding chapters deal with the determination of the risk premium only (net premium and safety loading). The influence of expense

xxii PREFACE
loadings is neglected, a common feature (and drawback) of the vast majority of actuarial papers, which usually assume, without much discussion, that loadings are simply added as a constant percentage of the risk premium. Chapter 14 argues that this procedure may not be quite fair. Brokers should not be paid more for signing up a bad risk. Young drivers should not pay higher taxes than experienced policyholders. Using the case of the Belgian BMS, the chapter shows that purely proportional loadings may have a significant influence on the fairness of a rating system. A linear formula for the computation of loadings is introduced, using coefficients that we consider realistic. It is shown that the use of proportional loadings overcharges the high-risk cells, which makes the BMS more severe than it apparently is.
Insurers have introduced BMS in automobile insurance for two main reasons: to have the bad drivers pay, in the long run, more premiums than the good drivers, and to induce policyholders to drive more carefully. BMS is not the only technique insurance companies have designed to implement these two goals. A deductible, for instance, essentially achieves the same purposes. In part 4, (chapters 14 and 15) we investigate the consequences of the introduction of a straight deductible and compare them to bonus-malus rating. In chapter 14, we comment ona recent proposal made by Holtan (1994): the introduction of a very high deductible (maybe $3,000), financed by a loan from the insurance carrier. With this intriguing application of the "bancassurance" concept, two of the main disadvantages of BMS (premium income decrease in early years and severe bonus hunger in some cases) would disappear. A simple compound Poisson model, with exponential or Gamma claim severity, is presented to analyze the consequences of this proposal, using the tools developed in part 2. Compared to a traditional BMS, a high-deductible system reaches stationarity much faster, increases premium income during early years, and has a higher elasticity for the most common values of the claim frequency. However, it results in such a high variability of policyholders' payments that it will be very difficult to implement. Replacing a straight deductible by a less abrupt form of c1aimsharing does not seem to reduce the variability of payments significantly. It is also shown that the deductible that maximizes the elasticity for a claim frequency of 10 percent is $2,941, very close to the value arbitrarily selected by Holtan.
Chapter 16 IS a utility theory analysis that aims at determining

PREFACE XXlll
empirically an optimal value for the deductible. Models developed earlier in the actuarial and insurance economics literatures are extended to be applicable to automobile colJision insurance situations. Both exponential and logarithmic utilities are considered, as well as three different distributions for the claim severity. Using data from a Belgian insurer, and parameter values that we consider the most realistic, optimal deductibles are found to be in the $1,000 to $2,500 range, much higher than the values commonly offered by Belgian insurers. It is concluded that either utility theory fails to grasp some crucial component of policyholder behavior or insurers should offer much higher deductibles to their policyholders. It is interesting to notice that two extremely different approaches and maximization criteria lead to optimal deductibles that are quite close and much higher than values observed in practice.
The present work is the natural evolution of my book "Automobile Insurance: Actuarial Models", published in 1985 by Kluwer and currently out of print. Only the French (Lemaire, 1983a) and Spanish (Lemaire, 1995) versions of this book are still available. Parts J (Third-Party Liability Automobile Insurance in the World), 2 (A Priori Classification Criteria), and 4 (Some Statistical Methods of Evaluating Claims Provisions) of the former book have been entirely deleted, while Part 3 (A Posteriori Classification: Bonus-Malus Systems) has been considerably expanded. Part 2 has been deleted, as it used data that are now obsolete. Moreover, regression analysis was the only technique used to select classification variables, and many other methods have since been presented in the actuarial literature. They are reviewed in van Eeghen, Greup and Nijssen (1983) and Brockman and Wright (1992), among others. Part 4 has become unnecessary, due to the recent publication of outstanding books devoted exclusively to claims reserving (among others Taylor, 1985). Part 3 needed extensive revisions, due to recent work by me and others and to modifications in BMS used in many countries. The practice of auto insurance is changing so rapidly that the use of several BMS discussed here will most probably have been discontinued by the time this work is published. Of course, new systems can be analyzed using the models presented here. In particular, the application of the factor analysis formula developed in chapter 8 would enable the designer of any new BMS to compare it to systems in force around the world.

xxiv PREFACE
A scientific book is always a biased summary of the creative work of many researchers, sometimes improved by the author's contributions. It was impossible to summarize here all the fine articles devoted to the topic of bonus-malus systems. Many excellent contributions could not be included. Bibliographical notes at the end of many chapters attempt to do (some) justice to them, while reducing my guilty feelings about these deletions. I am definitely biased toward simplicity. I have attempted to write a book that can be read be the entire ASTIN membership, not by its academic subset. An unavoidable consequence of this approach is that the level of mathematics will tend to be somewhat uneven.
It is customary for book prefaces to end up with lengthy acknowledgments. While readers are usually totally uninterested, they constitute for the author of a book the only way to partially express his indebtedness to many. And I suspect every book author to feel guilty while writing this paragraph for having to leave out so many persons who contributed to their thinking. I wish to let my colleagues of the Statistics Department of the Universite Libre de Bruxelles and the Department of Insurance and Risk Management of the Wharton SchooL and numerous ASTIN friends and academic colleagues, know that their support and contributions have been appreciated. I also wish to offer thanks to all of those who have provided detailed information about the systems in force in their country. I am especially indebted to Ted Chung and Chen Yeh-Lai for having provided me with extensive loss data from the Institute of Actuaries of the Republic of China. This work would not have been possible without the extraordinary programming work ofHongmin Zi. The book also greatly benefitted from the superb reviewing work done by Stuart Klugman and Gordon Willmot. Many thanks to Krupa Subramanian, who performed the calculations on pages 51 to 53. Many chapters have been written while I visited the Department of Mathematical Sciences of the University of Tokyo and the Forschungsinstitut fur Mathematik of the Eidgenossische Technische Hochschule in Zi.irich. The support of these institutions is gratefully acknowledged. Finally, I would like to thank the Wharton School of the University of Pennsylvania for providing me the opportunity to pursue a career that I love under ideal conditions.
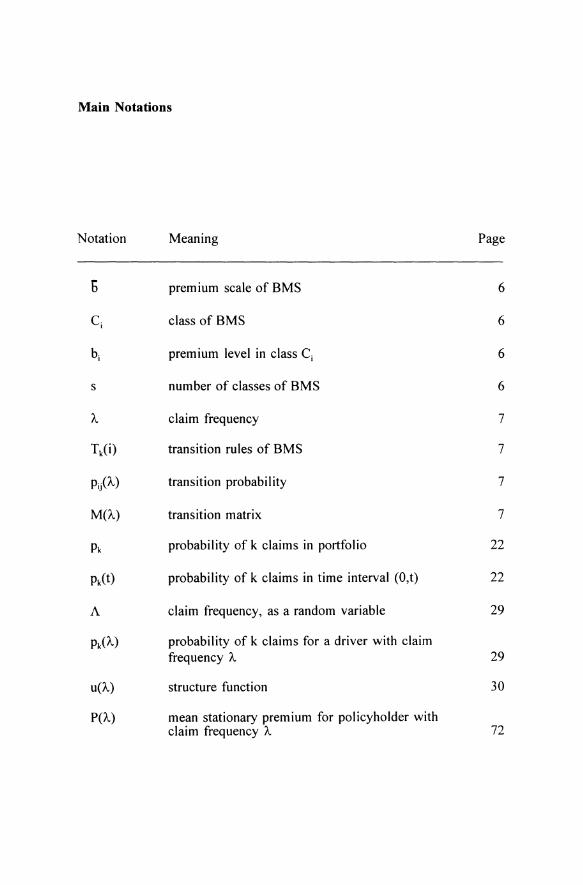
Main Notations
Notation Meaning Page
6 premium scale of BMS 6
Ci class of BMS 6
bi premium level in class Ci 6
s number of classes of BMS 6
A claim frequency 7
TkO) transition rules of BMS 7
Pij(A) transition probability 7
M(A) transition matrix 7
Pk probability of k claims in portfolio 22
Pk(t) probability of k claims in time interval (O,t) 22
A claim frequency, as a random variable 29
Pk(A) probability of k claims for a driver with claim frequency A 29
U(A) structure function 30
peA) mean stationary premium for policyholder with claim frequency A 72
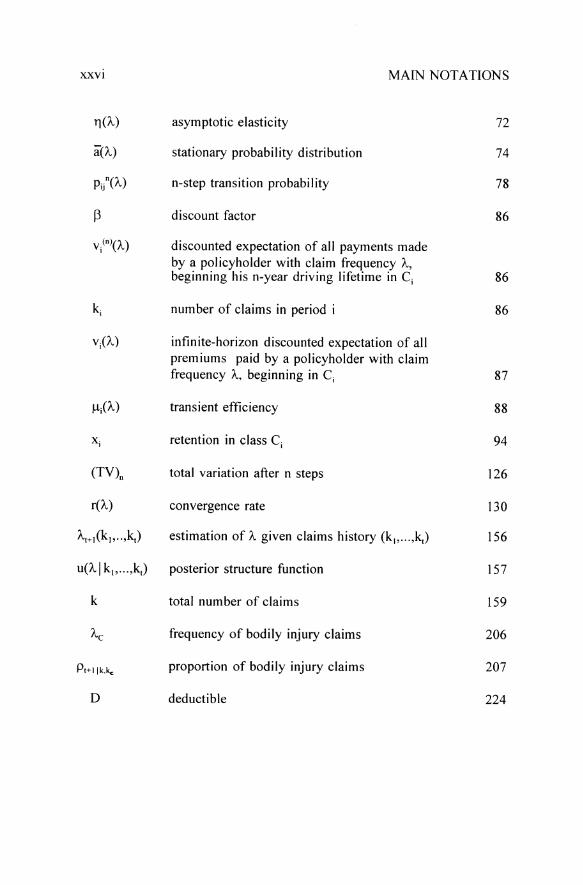
XXVI MAIN NOTATIONS
D(A) asymptotic elasticity 72
a(A) stationary probability distribution 74
Pi/(A) n-step transition probability 78
13 discount factor 86
Vi(n)(A) discounted expectation of all payments made by a policyholder with claim frequency A, beginning his n-year driving lifetime in Ci 86
ki number of claims in period i 86
Vi(A) infinite-horizon discounted expectation of all premiums paid by a policyholder with claim frequency A, beginning in Ci 87
J..llA) transient efficiency 88
Xi retention in class Ci 94
(TV)n total variation after n steps 126
rCA) convergence rate 130
u(Alk1, ... ,kt) posterior structure function 157
k total number of claims 159
AC frequency of bodily injury claims 206
Pt+llk,kc proportion of bodily injury claims 207
D deductible 224