Bonn 2010 - · PDF fileBonn 2010 . Hans-Dieter Evers, Ramli Nordin, Pamela Nienkemper ....
31
Bonn 2010 Hans-Dieter Evers, Ramli Nordin, Pamela Nienkemper Knowledge Cluster Formation in Peninsular Malaysia: The Emergence of an Epistemic Landscape ZEF Working Paper Series 62 Center for Development Research Department of Political and Cultural Change ISSN 1864-6638 Zentrum für Entwicklungsforschung Center for Development Research
Transcript of Bonn 2010 - · PDF fileBonn 2010 . Hans-Dieter Evers, Ramli Nordin, Pamela Nienkemper ....

Bonn 2010 Hans-Dieter Evers, Ramli Nordin, Pamela Nienkemper
Knowledge Cluster Formation in Peninsular Malaysia:
The Emergence of an Epistemic Landscape
ZEF Working Paper Series 62
Center for Development Research
Department of Political and Cultural Change
ISSN 1864-6638
Zentrum für Entwicklungsforschung Center for Development Research

ZEF Working Paper Series, ISSN 1864-6638 Department of Political and Cultural Change Center for Development Research, University of Bonn Editors: H.-D. Evers, Solvay Gerke, Conrad Schetter
Authors address Prof. Dr. Hans-Dieter Evers; Ramli Nordin, M.sc.; Pamela Nienkemper, Dipl.Geogr. Center for Development Research (ZEF), University of Bonn Walter-Flex-Str. 3 53113 Bonn, Germany Tel. Sec. 0228-731970: Fax 0228-731972 E-mail: [email protected] www.zef.de
i
Knowledge Cluster Formation in Peninsular Malaysia:
The Emergence of an Epistemic Landscape
Hans-Dieter Evers, Ramli Nordin and Pamela Nienkemper
Abstract ii
1 Introduction: Knowledge Clusters for Development 1
2 Malaysia’s Cluster Formation from the Development Planning Perspective 2
2.1 Industrial Estates and Free Trade Zones 2
2.2 Corridors and Knowledge Clusters 3
2.3 MSC Malaysia 5
2.4 Cyber Cities and Cyber Centres 5
3 Knowledge Clusters in Malaysia 6
3.1 Spatial patterns of knowledge clusters 6
4 Case Study: Cyberjaya 14
5 Conclusion 16
Appendix A: A Note on Applied GIS Methods for Cluster Mapping 18
Appendix B: Development Corridors, Cybercities and Cybercentres in Malaysia 19
References 22

ii
Abstract
Knowledge clusters are central places within an epistemic landscape, i.e. in a wider structure of knowledge production and dissemination. They have the organisational capability to drive innovations and create new industries. Examples of such organisations in knowledge clusters are universities and colleges, research institutions, think tanks, government research agencies and knowledge-intensive firms with their respective knowledge workers.
The following paper will look at Malaysia and its path towards a Knowledge-based economy. We first describe the development strategy of the Malaysian government which has emphasized cluster formation as one of its prime targets. We then provide evidence of the current state of knowledge cluster formation in Peninsular Malaysia and try to answer the following questions. If the formation of a knowledge cluster (especially in the ICT and multimedia industry) has been the government policy, what has been the result? Has Malaysia developed an epistemic landscape of knowledge clusters? Has the main knowledge cluster really materialised in and around Cyberjaya in the MSC Malaysia?
Data collected from websites, directories, government publications and expert interviews have enabled us to construct the epistemic landscape of Peninsular Malaysia. Several knowledge clusters of a high density of knowledge producing institutions and their knowledge workers have been identified and described. The analysis of the knowledge output, measured in terms of scientific publications, patents and trademarks show that existing knowledge clusters have, indeed, been productive as predicted by cluster theory. On the other hand government designed development corridors do not always coincide with the distribution of knowledge assets. The analysis of our data pertaining to Cyberjaya, the MSC Malaysia and the “corridors” needs to be developed further to produce more robust results.
Keywords: MSC Malaysia, Cyberjaya, knowledge and development, knowledge-based economy (KBE), knowledge clusters, knowledge corridors, epistemic landscape, development strategy.

1 Introduction: Knowledge Clusters for Development
International agencies, governments and experts have identified industrial cluster formation as a prime strategy to induce innovations, increase the GDP and to develop a nation (OECD, 1996). The beneficial effects of the formation of industrial clusters have already been investigated by Alfred Marshall (Marshall, 1920) and Alfred Weber (Weber, 1909). As Michael E. Porter has argued in his well-known book, the competitive advantage of nations is greatly enhanced by the formation of industrial clusters. “The phenomenon of industry clustering is so pervasive that it appears to be a central feature of advanced national economies” (Porter, 1990:149). Clusters are defined as follows: “A cluster is a geographically proximate group of interconnected companies and associated institutions in a particular field, linked by commonalities and complementarities.” (Porter, 2000:16).
Whereas the reduction of transaction costs because of proximity has been formerly emphasised, the ease of distributing information and of sharing knowledge has been identified as essential for emerging knowledge-based economies (KBEs). “Clusters are concentrations of highly specialized skills and knowledge, institutions, rivals, related businesses, and sophisticated customers in a particular nation or region. Proximity in geographic, cultural, and institutional terms allows special access, special relationships, better information1
Knowledge clusters, more specifically, “are agglomerations of organizations that are production-oriented. Their production is primarily directed to knowledge as output or input. Knowledge clusters have the organisational capability to drive innovations and create new industries. They are central places within an epistemic landscape, i.e. in a wider structure of knowledge production and dissemination. Examples for organisations in knowledge clusters are universities and colleges, research institutions, think tanks, government research agencies and knowledge-intensive firms” (Evers, 2010).
, powerful incentives, and other advantages in productivity and productivity growth that are difficult to tap from a distance. As a result, in a cluster, the whole is greater than the sum of the parts” (Porter 2000:32).
If indeed, as Porter has argued, the formation of industrial clusters is the outcome of successful economic development and a signifier of the competitive advantage of a nation, then the formation of knowledge clusters should be a measure of the degree a nation has advanced towards a knowledge-based economy (KBE). The following paper will look at Malaysia and its path towards a KBE. We will first describe the development strategy of the Malaysian government which has used cluster formation as one of its prime targets. We shall then provide evidence of the current state of knowledge cluster formation in Peninsular Malaysia. This will then be checked against the current measures to form “corridors” of development and answer the question whether or not these planned “corridors” have already developed into knowledge clusters or, in other words, how far “natural” clustering conforms to regional cluster planning. As an explanation of corresponding and differences in cluster creation we shall look both at economic rationality and political power. By forming innovative knowledge clusters resources become available on a local level either through channelling of government funds and corporate investments into the “epistemic landscape” or through the benefits produced by effective cluster policies. After painting the overall picture of a Malaysian “epistemic landscape” we shall then focus on one of the long established knowledge cluster of Cyberjaya.
We shall then try to answer the following question. If the formation of a knowledge cluster (especially in the ICT and multimedia industry) has been the government policy, what has been the result? Has Malaysia developed an epistemic landscape of knowledge clusters? Has the main knowledge cluster really materialized in and around Cyberjaya in the Multimedia Super Corridor (MSC)?
1 Whether or not knowledge and information is, indeed, transferred more easily in clusters is assumed by Porter and others, but needs to be verified empirically. Some studies have produced contrary evidence (see Evers, 2009, Menkhoff , Evers, Chay 2010).
2 Malaysia’s Cluster Formation from the Development Planning Perspective
2.1 Industrial Estates and Free Trade Zones
In Malaysia the first systematic approach to development planning emerged in the form of the First Five Year (Federation of Malaya) Plan 1956-1960 (Leete, 2007: 43). The Plan laid the foundation for an organised development planning process in the Federation of Malaya and later Malaysia. During this period the Federal Land Development Authority (FELDA) was founded. It is a land development agency which relocates the people from poor areas to new areas which were provided with arable land and basic infrastructures. The main focus of these land development scheme was low level rubber related industries. Organised commercial agriculture and land development became the basis of the cluster formation and can be considered as the first economic based cluster in Malaysia. The earlier Malaysia Development plan mainly focuses on rural development and providing basic amenities to the people. The period also saw the oil palm and timber becoming an important supplement to rubber and the importance of agricultural education and research in the development planning (Leete, 2007).
In the1960s, Malaysia’s policy makers realised the importance of having the industrial clusters to gain economic agglomeration benefits from the first industrial estate that was developed in Petaling Jaya, Selangor. The success of the industrial estate has encouraged the government to establish other industrial estates in Johore, Perak, Penang and Negeri Sembilan. The focus now shifted from low level agricultural base industries to light and heavy industries.The growth oriented economic development of Malaysia was awakened by a racial riot in 1969. The riot was considered as a serious structural problem confronting Malaysia due to its past history (Faaland et al., 2003). This has contributed towards the creation of the New Economic Policy (NEP) in 1970. The NEP has two main objectives i.e. the first was to reduce and eventually eradicate poverty and to restructure the society to correct economic imbalance (Leete, 2007). The NEP which became the central pillar of Malaysia’s development planning appears to utilise the racial component into practical use by the ruling elites. In all aspects of development, race has become the main element. The political elites start to strengthen their position to maximise material and immaterial gains and profit (Evers & Gerke, 2009).
The Second Malaysia Plan (2MP) covering the period of 1971-1975 was the first Malaysia Plan that incorporates the objectives of the NEP. The establishment of manufacturing activities in the less developed areas represents an important dimension of the industrialisation programme. The strategy was to modernise the less developed areas by modernising the rural areas where the majority of the population is ethnic Malay. The government provides incentives for the labour-intensive industries to locate their plants outside of the main urban areas. Research Institution related to industrial development such as Standards Institution of Malaysia (SIRIM) was established to compliment the manufacturing industries.
The potential of new forms of industries related to tourism and export oriented was introduced. Traditional handicraft related to the tourism industries was utilised with the setting up of Lembaga Kraftangan Malaysia in 1974. The tourism industry indirectly created a new form of smaller clusters in the rural and less developed areas; whereas, in the developed areas the Free Trade Zones (FTZs) were developed to encourage the development of export oriented industries. The FTZs were located in Malacca, Penang, Selangor, Johor, Kedah, Kelantan and Pahang, with a concentration; however, still in the developed states i.e. Penang, Selangor, Malacca and Johor. Tourism and export oriented industries are the two examples which the ruling elite treat as the new resources to maintain their power in the name of development and the formation of the small and medium enterprises (SMEs), mainly among the ethnic Malay to support both the industries.
The period from 1986 to 1995 marked a different orientation in the industrial development in Malaysia. The first Industrial Master Plan (IMP) was launched to supplement the Malaysia Plan. In addition to type of industries, location and workforce; the IMP also stressed on private sectors involvement in the development of industrial estates. The private sectors role in the development process was also encouraged through privatisation of government entities. Two of the biggest was Telekom Malaysia and

Tenaga Nasional Berhad in 1985 and 1990. The era marked the strong formation of Government Linked Companies (GLCs) which are defined as:
“companies that have a primary commercial objective and in which the Malaysian Government has a direct controlling stake. Controlling stake refers to the Government’s ability (not just percentage ownership) to appoint BOD members, senior management, make major decisions (e.g. contract awards, strategy, restructuring and financing, acquisitions and divestments etc.) for GLCs either directly or through GLICs” (Khazanah Nasional Berhad, 2010).
The GLCs and their managers form a new strategic group created by the ruling elites to utilise new resources. The GLCs cover all major economic, transportation, infrastructure and technology fields in Malaysia2
2.2 Corridors and Knowledge Clusters
. The GLCs also created a new group of Malays that benefited from the NEP. We will later discuss the function of the GLCs in executing the agenda of the political elites i.e. MSC Malaysia and Cyberjaya.
A long term development goal was formulated in 1991 by Prime Minister Mahathir during his premiership. The goal was to be an industrialised and developed country by the year 2020 in its ‘own mould’ (Mahathir, 1991: 21). The year 2020, according to Mahathir was the logical, convenient and appropriate time frame; furthermore Malaysian needed to have a perfect vision3
In the Seventh (7MP) and Eight Malaysia Plan (8MP), covering the period from 1996-2005, two main developments emerged in Malaysia. The Government moved the Federal Administrative machinery from Kuala Lumpur to Putrajaya and development focus shifted to a knowledge base. The first act has decreased the escalating pressure to Kuala Lumpur, and extended the urban growth to a wider geographical area, whereas, knowledge-based development started with the utilisation of information and communication technology (ICT) in all sectors of the economy to increase productivity. The MSC Malaysia and Cyberjaya were created to set into practice the vision of making Malaysia a knowledge-based economy (KBE) by utilising ICT. The government also encouraged the growth of companies related to biotechnology, advanced electronics and software development. Technology based incubator centres were set up by Malaysian Technology Development Corporation (MTDC) and Technology Park Malaysia (TPM)
of their future and had 30 years to achieve the status (Mahathir, 2009). The aim and challenges highlighted by Mahathir were implemented in the Sixth Malaysia Plan (6MP) to the Ninth Malaysia Plan (9MP). The vision still tailored towards achieving the objectives of the NEP which was formulated in 1970s.
4
In the 9MP, that covers the period of 2006-2010, apart from the requirement of “knowledge”, strong emphasis was also specified on innovation. The establishment of high-tech and technology based clusters were suggested to shift from low end industries to high end technology. Regional development was given a new ‘branding’. The implementation of economic corridor or cluster development was spearheaded by the major GLCs (Government Linked Companies). The economic regions are clustered based on the strength of the respective states as shown in Fig.1; however three states in the Peninsular Malaysia i.e. Selangor, Negeri Sembilan and Melaka are not covered by the respective corridors. These states are located within the Klang Valley Development Region and have benefitted through the development of Kuala Lumpur and Putrajaya.
to facilitate industries related to high technology base. MSC Malaysia and TPM are examples of the formation of groups utilising the technology to strengthen their power with new resources.
Nineteen years after Mahathir’s celebrated speech, on the 30th March 2010, Malaysian Prime Minister, Najib Razak unveiled the New Economic Model (NEM). The NEM was to ensure Malaysia would be able to achieve the target set by Mahathir. The Vision 2020 and NEM suggested the formation of cluster and corridor based economic activities. The focus was on innovation and productivity growth, in addition to 2 Currently there are 95 GLCs, and the top 20 GLCs aggregate earnings are forecasted at RM17.7bn for the 2010 financial year (Khazanah Nasional Berhad, 2010). 3 In one interview, Mahathir was asked why 2020? He answered; for an optometrist 2020 is a perfect vision. 4 TPM is one of the GLCs involved in technology base industries.

technological advancement and entrepreneurial development. The planning of economic corridors further strengthens the power of the political elite by re-emphasising their dominance. Regional development planning is being used as a tool to manipulate and control the resources in the respective states. The GLCs managing the corridors represent the ruling elites in the form of economic organisations.
Figure 1: Development Regions and Corridors, Peninsular Malaysia
Source: Northern Corridor Economic Region (www.ncer.com.my) dated 19th May 2010; Iskandar Malaysia (www.iskandarmalaysia.com.my) dated 19th May 2010; East Coast Economic Region (www.ecerdc.com) dated 19th May 2010.

2.3 MSC Malaysia
On 7th January 2008, Multimedia Super Corridor Malaysia (MSC) celebrated its tenth anniversary and was renamed MSC Malaysia (MDeC, 2009). The MSC Malaysia was designed to intensify the knowledge content in various economic activities (K-Based Master Plan, 1993). It was originally a 15x50km zone, stretching from the Kuala Lumpur City Centre (KLCC) to Kuala Lumpur International Airport (KLIA) (Ramasamy, B.et al., 2002). The plan for a Multimedia Super Corridor (MSC Malaysia) was announced by Prime Minister Mahathir in 1995 and implemented in 1996. It includes Putrajaya, the new administrative capital and Cyberjaya the ICT hub, in addition to the Kuala Lumpur Conference Centre (KLCC) and the Kuala Lumpur International Airport (KLIA). The MSC Malaysia was the physical visualisation of Mahathir’s vision towards transforming Malaysia into a knowledge-based economy. MSC Malaysia offers various incentives and privileges, to encourage the development of the ICT industries. The number of companies with the MSC Malaysia status has shown a steady increase from the year it was launched, as can be seen in Fig.2
Figure 2: Growth of Companies with MSC Malaysia Status, 1997-2008
Source: MSC Malaysia, 2009
The revenue from MSC Malaysia rose from RM12.99billion in 2006 to RM17.06billion in 2007 with total employment created at 63,883 (MSC Malaysia, 2009).
2.4 Cyber Cities and Cyber Centres
The potential of creating new sources of growth has encouraged the political establishment to designate areas in different parts of the country as Cybercities and Cybercentres. Cybercities and cybercentres are based on a development strategy that locates industrial companies of similar technology within the same geographical area (Malaysian Business, 2009a)
These are locations designed and developed to integrate three key elements – man, nature and technology to promote the concept of industry clustering by locating similar technology companies within the same geographical areas (Neo,W.H et.al, 2008). Appendix 2 and 3, show that most of the Cybercities and Cybercentres are located in the developed states of Peninsular Malaysia.
Cyberjaya, opened in 1999 was the first and leading cyber city development in MSC Malaysia. The city covers an area of 7000 acres and was designed as a cutting edge multimedia centre to attract world class multimedia and ICT companies (Neo, W.H et.al. 2008). The city is located adjacent to Putrajaya and
94 197 300429
621812
9731.163
1.421
1.7281.994
2.173
1997 1998 1999 2000 2001 2002 2003 2004 2005 2006 2007 2008
Growth of MSC Malaysia Status Companies from 1997-2008
Number of Companies

between Kuala Lumpur International Airport (KLIA) and Kuala Lumpur. There are 4145 companies which provide employment to 35,000 people (MDeC, 2009). There are three universities located in Cyberjaya i.e Multimedia University, Limkokwing University of Creative Technology and Cyberjaya University College of Medical Science catering for 15,000 students6
The aim of this section has been to recapture chronologically the path of development planning in Malaysia since independence. As the analysis has shown, the political elite ensures their political survival at different levels of the development process in Malaysia. Their formation has had a considerable impact on the development of the country. The political elite has manipulated economic disparities and used racial pressure to gain power and control over the country’s resources through the New Economic Policy (NEP). They have used different themes of development strategies such as race, regional development, technology and ICT to strengthen their power position. The formation and demand of different groups within the elites has caused the planners of development in Malaysia trapped in a dilemma of pure economic benefit, or the quest to strengthen the power of their political masters. In the next section, we will discuss further on the formation of knowledge clusters in Peninsular Malaysia.
.
3 Knowledge Clusters in Malaysia
3.1 Spatial patterns of knowledge clusters
The establishment of knowledge producing institutions in Malaysia was fundamentally related to the colonial needs. The first recorded institution was the Meteorological Department, established in 1820. The department collects data on air pressure, temperatures and precipitation (Malaysia Meteorological Department, 2010). Nine other R&D institutions were established between the years 1900 to 1957. The institutions were established to support the colonial economic interest related to rubber, mineral, forestry, veterinary and wildlife. The only R&D institutions directly related to the local needs was the Institute of Medical Research which was established in 1900. The Institute was to “carry out scientific and sustained research into the causes, treatment and prevention of such scourges as beri-beri and all forms of malaria fevers”. The setting up of the institute was made following the resolution in Europe of the Conference of Berlin in 1885 to undertake such activities as “to promote the moral and material well-being of the native population and to explore the great and unknown field of tropical medicine” (Institute of Medical Research Malaysia, 2010).
After independence, R&D in Malaysia focused on the main economic activities i.e. agricultural sector. These correlate with the government policy to upgrade and modernise the agriculture sector. The Mahathir’s era has brought a new dimension to R&D activities in Malaysia. The focus has shifted from agriculture to commercial crops and high technology R&Ds; ICT, automobile, aeronautic and space related research. New businesses and groups aligned to the ruling party emerged in the form of board members and advisory panels. The R&D activities from the colonial period are continued primarily either by government owned or government linked institutions. As can be seen in Fig.3, the R&D activities from 1800s to 1950s are dominated by the government owned institutions. Private owned knowledge producing institutions start with the establishment of Goon Institute, Kuala Lumpur in 1936. The Institute is the longest serving private own institute offering post secondary education in Malaysia (Goon Institute, 2010). The number of Private Higher Learning Institutes (PvHLIs) increased significantly beginning from the late 1970s due to the demands and limited capacity of the public institutions. Total numbers of R&D institutes pre independence were only 14 but the number rose to 101 in 2009. From 1970s to 1980s, the numbers increased more than double, since the government depended highly on R&D institutes to support the main economic activities.
5 This was the official figure given by MDeC but the fieldwork done between April-December 2009, only manage to locate 348 companies in Cyberjaya. 6 The unpublished figure of the total number of students was provided by the Ministry of Higher Education during the fieldwork, 2009.

Figure 3: Number of Knowledge Producing Organisations by Year of Establishment, Malaysia 1820 to 2009
Source: Malaysian Science and Technology Information Centre (MASTIC), 2009 (unpublished data), Ministry of Higher Education, 2008, Ani Asmah (eds), 2009 and field data, 20097
PHLi=Public Higher Learning Institutions, PvHLi=Private Higher Learning Institutions, R&D=Government Owned Research & Development Institutions
.
The 1990s saw a policy shift in line with the global higher education restructuring (Lee, 2004; Sivalingam, 2006). The numbers of public university almost tripled from merely eight before 1990 to twenty in 2009. Apart from universities, the government also increased the number of polytechnics and community colleges to cater for the needs of the industries. Private universities saw the number grow from none in 1990s to 37 in 20078
The outcome of decades of regional development planning is the formation of knowledge clusters with different degrees of “knowledge density”. By this we mean that certain areas show a disproportionately high number of knowledge producing institutions and knowledge workers.
and other form of private institutions grew from 156 in 1992 to 460 in 2009. The expansion of these institutions has created different groups of ownership i.e. individual proprietors, private companies, consortium of companies, public listed companies, government corporations, foundations, philanthropic organisations and community financing (Lee, 2004: 1). The formation of these different groups is derived from the lucrative business of higher education in Malaysia. Looking at the past 200 years of Malayan history it becomes clear that the establishment of research institutes, colleges and universities was not only motivated by the quest for knowledge but has formed different groups and usually also strengthened the respective power elites.
The knowledge cluster map.(Fig. 4, refer to Appendix for explanation) shows that knowledge clusters in Peninsular Malaysia are still concentrated on the west coast with three main locations having the highest concentration of knowledge producing institutions and knowledge workers, namely Kelang Valley, Johor Bahru and Penang. The concentration correlates with the number of HLIs and some of the earliest public universities in Peninsular Malaysia namely University Malaya, Universiti Kebangsaan Malaysia and Universiti Putra Malaysia in Kelang Valley, University Science Malaysia in Penang and University Technology Malaysia in Johore. The most dense and active location of knowledge clusters in Peninsular Malaysia are the areas from Tanjung Malim where Universiti Pendidikan Idris is located in the North to Malacca in the South. Penang has the most dense knowledge clusters in the Northern Region of Peninsular Malaysia. Interestingly, the area in Northern Kedah and Perlis bordering Southern Thailand has a strong presence of knowledge clusters even though both areas are economically less developed in
7 Data were gathered through individual web pages during field research from April-December, 2009. 8 The numbers comprise of Private Universities (18), College Universities (15) and Foreign Branch Campuses (4).
0
10
20
30
40
50
60
Numbers of Knowledge Producing Organisations in Malaysia Based on Year of Establishment
PHLi R&D PvHLi

comparison to the other areas in the West Coast. The concentration of the knowledge clusters in the West Coast also correlates with the major infrastructures and economic development.
The East Coast of Peninsular Malaysia is still less developed in terms of knowledge clusters. Knowledge clusters are only found at the main cities in the region i.e. Kota Bahru, Kuala Terengganu, Dungun and Kuantan. Based on our data set, Kuantan has the highest density of knowledge workers in comparison to the other three cities. Comparing the clusters to the West Coast, the knowledge clusters did not spread along the major highways but rather within the main urban areas, where most economic and social activities are concentrated. Also kernel density tends to be much lower than on the West coast.
The ICT clusters in Peninsular Malaysia also correlate with the knowledge clusters as shown in Fig.5. Kelang Valley has the highest concentration of ICT based institutions, forming a distinct ICT cluster. Perlis, Northern Kedah, Penang and Johor Bahru are three main areas with significant numbers of ICT institutions. Most of the institutions of higher learning (HLIs) and R&D institutions, concentrated in these areas, are involved in ICT related activities. HLIs offering ICT courses can also be found scattered in major cities in Peninsular Malaysia, without forming knowledge clusters. This is in line with the government plan to encourage ICT based development throughout the country.

Figure 4: Knowledge Clusters in Peninsular Malaysia9
Sources: Ministry of Higher Education, 2008a, 2008b, 2009, 2010(unpublished data); Ani Asmah(eds), 2009 and field data, 2009
10
9 The map is based on number of employee as of 31 December 2008.
.
10 Data of employee for some of the R&D Institutions were collected through telephone survey between April-December, 2009.

Figure 5: Distribution of Research Institutes and Institutions of Higher Learning with or without ICT, Peninsular Malaysia 200
Sources: Ministry of Higher Education, 2008a, 2008b, 2009; Ani Asmah(eds), 2009; Ministry of Higher Education, 2009 (unpublished data) and fieldata, 200911
11 Data of courses offered by Private Higher Learning Institutions were collected from individual web pages from April – December 2009.
.

Recognising that knowledge clusters have emerged, the most important question remains whether this clustering process has also resulted in higher knowledge production, as predicted by clustering theory. We try to measure knowledge output by using scientific publications, patents and trademarks as indicators of innovation and knowledge output.
Figure 6: Knowledge Output: Number of Publications of Malaysian University Staff, 2000 to 2009
Source: Web of Science, 2010
Based on data collected from the ISI Web of Science as shown in Fig.6, from 2000 to 2009, Public Universities produce more publications in comparison to the Private. On average, the public universities produce 90% more publication yearly than the private’s institutions. Public universities publication numbers increase more than 80% from year 2000 to 2009. The government policy to rank the universities starting from the year 2007 saw a drastic increase in the number of publication between the years 2008 to 2009 because the number of publication by university staff are listed as one of the main ranking criteria (Malaysian Qualification Agency, 2010).
As can be seen in Fig. 7, at the individual institutions level, UM, USM, UKM and UPM show the highest numbers of publication from the year 2000 to 2009. UM being the oldest university in Malaysia produced the highest number of publications, followed by USM which is also the only APEX12
12 The Accelerated Programme for Excellence (Apex) university programme is proposed in the National Higher Education Strategic Plan. Under the programme, the Apex university was promised autonomy in finance, service scheme, management, student intake, study fees and determining the top leadership (Bernama, 2008)
University in Malaysia. The five universities with the highest numbers of publications are also the universities which the Ministry of Higher Education (MOHE) has granted the research university status (MOHE, 2010). UM, UKM and UPM are located in the Kelang Valley knowledge cluster, USM in Penang and UTM in Johor Bahru. The East Coast knowledge clusters are represented by the UMT and UMP which are located in Terengganu and Pahang respectively. One interesting finding from the publication data is that, even though Northern Kedah and Perlis has created a knowledge cluster based on the density of knowledge workers it fails to produce a commendable output. UUM, which was established in 1984, has one of the lowest numbers of publication in comparison to a new university in the same cluster i.e. UNIMAP which
796 897 9111030
12151410
1633
1970
2935
4453
18 23 51 81 99 159 194 274 330465
2000 2001 2002 2003 2004 2005 2006 2007 2008 2009
Year
Number of Publications by Public and Private Universities in Malaysia based on ISI Web of Science Data from the year 2000 - 2009 as at 31st April 2010
Public
Private

is located in Perlis. UMT which is located at the East Coast cluster is the only university in the cluster which has a comparable publication to the rest of the clusters in Peninsular Malaysia. UMS and UNIMAS, which are both new universities, established in the 1990s, produce more publications in comparison to UUM, which was established in 1984. This shows that location in a knowledge cluster does not always mean a higher output. The physical location alone does not determine the output of knowledge institutions; the human element in the form of social networks is the major contributing factor, as can be seen in the case of UMS and UNIMAS13
Figure 7: Knowledge Output: Publications by Staff of Public Universities, 2000-2009
.
Source: Web of Science, 2010.
Data for the Private Universities as shown in Fig.8, except for IMU, most government linked private universities show the highest numbers of publications i.e. MMU, PETRONAS and UNITEN. MMU is the most active private university in terms of publications. The university has two campuses one each in Malacca and Cyberjaya. The University also has a very strong political connection. The Vice Chancellor of MMU is the wife of PM Mahathir who started the MSC Malaysia project. The university is also a subsidiary of one of the largest GLCs in Malaysia i.e. Telekom Malaysia. UTAR and AIMST, two of the private university established by political parties MCA and MIC respectively also have a high number of publications. All the universities with the highest numbers of publication are science and technology based universities. Foreign universities with branch campuses in Malaysia are also active in publication work such as Curtin, Monash and Nottingham universities.
13 Most academic staff in both universities have previously taught at more established universities such as UM and UKM.
0 1000 2000 3000 4000 5000 6000
UM
USM
UKM
UPM
UTM
UIAM
UUM
UNIMAS
UMS
UPSI
UiTM
UDIM
USIM
UMT
UTHM
UTeM
UMP
UNIMAP
UniKel
UPNM
Publications
Uni
vers
ity
Publications by Staff of Public Universities based on Web of Science 2000-2009

Figure 8: Knowledge Output: Publications of Staff of Private Universities, 2000-2009
Source: Web of Science,2010.
Data were also collected on another form of knowledge output i.e. patents and trademarks. As shown in Fig.9, Selangor and Kuala Lumpur have the most numbers of applications for both from the year 2005 to 2009. Penang and Johor, located in the south and north knowledge cluster in Peninsular also have high numbers of patents and trademarks application followed by Perak, Malacca and Negeri Sembilan which are located in the most concentrated knowledge clusters in Peninsular Malaysia. The data for Kedah shows that the total number of application is significant in comparison to data for the state of Perlis. This again shows that the density of knowledge clusters does not necessarily contribute towards the knowledge output. Data from all the states in the East Coast have the lowest number of applications for both patents and trademarks. As evidenced by our data, Kelang Valley still dominates the knowledge output in Peninsular Malaysia.
0 100 200 300 400 500 600
UNITENMMU
PETRONASUNITAR
MUSTNottingham(M'sia)
Monash(M'sia)Curtin(M'sia)
UNISELIMU
AIMSTOUM
UTARUniKL
MSUINFRAUni
LUCTSEDAYA
TWINTECHSUNWAY
APIITKUISHELP
BINARYSwinburne(M'sia)
CUCMSINTI
METROPOLITANINSANIAH
TAYLORAL MADINAH (M'sia)
INCEIFAsia e Uni
NilaiTATI
WawasanAlBukhari
MasterskillSEGI
BERJAYA
Publications
Uni
vers
ityNumber of Publications by Private Universities
2000-2009

Figure 9: Applications for Patents and Trademarks, Peninsular Malaysia 2005 to 2009
Source: MyIPO, 2010
4 Case Study: Cyberjaya
Cyberjaya was conceptualised as a model intelligent city and designed to attract world class multimedia and ICT companies (MDeC, 2008). It was supposed to attract the best and the biggest ICT companies in the world and create an atmosphere conducive to promote creativity and innovation, similar to the Silicon Valley (Mahathir, 1998). The planning of the city follows a vision by former Prime Minister Mahathir and the architecture of Cyberjaya are envisaged as a symbol for the developed Malaysian society. The city itself is designed as an image of a Malay or at least Malaysian city in which Malay conceptions of space are translated into urban planning (Evers & Korff, 2000). Almost all the main stakeholders in the development of Cyberjaya are members of the Malay elite, from the land owners, local authorities to the master developer14
Cyberjaya was also supposed to create new breed of entrepreneurs with ICT or new technologies as the main business. This new group is known as ‘technoprenuers’ and benefits directly from the existence of Cyberjaya. The emergence of this group was due to special policies, and programmes of the government and in a way also in connection to physical buildings constructed in Cyberjaya. ICT as a new form of resource has encouraged the political elite to translate it into spatial existence which in return benefited
. The most prominent building in Cyberjaya currently is the MDeC building with a sort of Neo-Malay architecture and roof. The city is an attempt to reconstruct the meaning of ‘developed’ based on the interpretation of the Malay political elite. This is done in the form of the planning guidelines (Jabatan Perancangan Bandar dan Desa, 2006), which clearly prescribe the architectural forms and the land use, and therefore regulate the meaning of space.
14 The landowner is Cyberview Sdn Bhd (subsidiary of the Ministry of Finance), Master Developer is Setia Haruman Sdn Bhd (the Chairman (Malay) has a strong link with the political elites) and the Local Authority is Majlis Perbandaran Sepang (as of 26 August 2010, out of the total 23 head of department or unit listed on the web page only one is from a non Malay ethnic background).
0
5000
10000
15000
20000
25000
Patents and Trademarks Application in Peninsular Malaysia from2005 - 2009
2009 Trademarks
2009 Patents
2008 Trademarks
2008 Patents
2007 Trademarks
2007 Patents
2006 Trademarks
2006 Patents
2005 Trademarks
2005 Patents

from it. This is an example of how the political establishment manages to maintain relevancy and use new resources available within the society to strengthen their own power position.
After ten years of its development there are only less than 400 companies located in Cyberjaya and the opening of other cybercities and cybercentres will also have an impact on the future development. Most of the companies located in Cyberjaya currently focus on call centres and data processing activities. The activities do not create the environment in which creativity and creative thinking can develop (King, 2008). Patent data registration with The Malaysian Intellectual Property Organisation (MyIPO) data base record less than 10 percent of the companies have ever registered a patent until December, 2008 (MyIPO, 2010) which shows the low level of creativity and innovativeness among the companies.
The limited ‘soft’ infrastructure has also impacted on the number of people staying in Cyberjaya. The total number of housing units in Cyberjaya currently is 2,800 (Jabatan Perancangan Bandar dan Desa, 2009) and with the assumption of 5 people living in a household, the total population residing in Cyberjaya is only 14,000. The total number of people working in Cyberjaya is estimated at 35,000 (MDeC, 2009); based on this figure, about 60 percent of the population commute to Cyberjaya on a daily basis. The original plan of the city was to accommodate 210,000 people by the year 2014 (Setia Haruman Sdn. Bhd., 2010). Tun Mahathir in an interview on the 15 May 2009, agreed that the plan for the creation of a community of foreigners working and living in Cyberjaya had not materialised. He blamed the slow progress of the development and suggested the development to move ‘faster, better and sometimes more expensive’ (The Star, 2009: B6).
Publication data based on the ISI Web of Science for Cyberjaya show a better output. The number of publication by institutions located in Cyberjaya shows a stable increase from 2000 to 2009 with a slight decrease in 2008 as shown in Fig.10. MMU records more than 80 percent of the publication, followed by CMUCM. TM R&D is the only company with publication recorded in the ISI data base. None of the other institutions in Cyberjaya has recorded any publication apart from those mentioned. It has to be noted that MMU and TM R&D is a subsidiary of one of the biggest telecommunication company in Malaysia i.e Telekom Malaysia which is a GLCLUCT which is also located in Cyberjaya has no records of publication in the ISI data base, even though it claims to be ‘The Global University’(Limkokwing, 2010).
Figure 10: Publications by Staff of Universities and Companies in Cyberjaya, 2000-2009
Source: Web of Science, 2010
This section has provided data on the formation and development of Cyberjaya based on new resources i.e. education, ICT and city development. There remains, however, the possibility that Cyberjaya will evolve into a ‘cybercolony’ of transnational capital (King, 2008: 146).
2000 2001 2002 2003 2004 2005 2006 2007 2008 2009
Record 12 17 19 38 45 76 92 105 84 108
0
20
40
60
80
100
120
Chart 6: Publication By Year In Cyberjaya

5 Conclusion
Data collected from websites, directories, government publications and expert interviews have enabled us to construct the epistemic landscape of Peninsular Malaysia. Several knowledge clusters of a high density of knowledge producing institutions and their knowledge workers have been identified and described. A preliminary analysis of the knowledge output, measured in terms of scientific publications, patents and trademarks show that knowledge clusters have, indeed, been productive as predicted by cluster theory. The results are, however, not as clear cut once the output is disaggregated by institutions. Politically motivated development planning as well as social networks has probably influenced both the epistemic landscape as well as the results of knowledge clustering. This is evident, when the distribution of knowledge workers and the government planned development corridors are compared (see fig. 11). Several corridors do not have the high level manpower to bring about development, whereas other areas with a good knowledge base have not been designated as corridors.
The corridors planned by the policy makers mostly centred on the natural resources available in the respective states. Agriculture and natural resources such as petroleum and tourist site are the main catalyst for the corridors. The GLCs selected to spearhead the respective corridor is also a reflection of these i.e. Sime Darby, PETRONAS and Khazanah Berhad. The GLCs are primarily involved in plantation, oil and gas and property development. None of the corridors are planned for ICT or knowledge based industry apart from the electric and electronic cluster in the northern corridor. The corridors in ECER, do not correlate with the government aim to become a knowledge economy. The industries planned are mostly on tourism and agriculture. As observed by Fatimah (2009), progress in the Malaysian agriculture and plantation in general has not lead to invention and innovation but rather high dependence on foreign labour. The creation of development corridors which neglect the human capital factor will definitely produce the unintended results as can be seen in the development of Cyberjaya. Physical infrastructure alone will never produce the innovative and knowledge outcome.
The preliminary analysis of our data pertaining to Cyberjaya, the MSC Malaysia and the “corridors” has yielded some outcomes, but needs to be developed further to produce more robust results.

Figure 11: Knowledge Clusters and Development Corridors
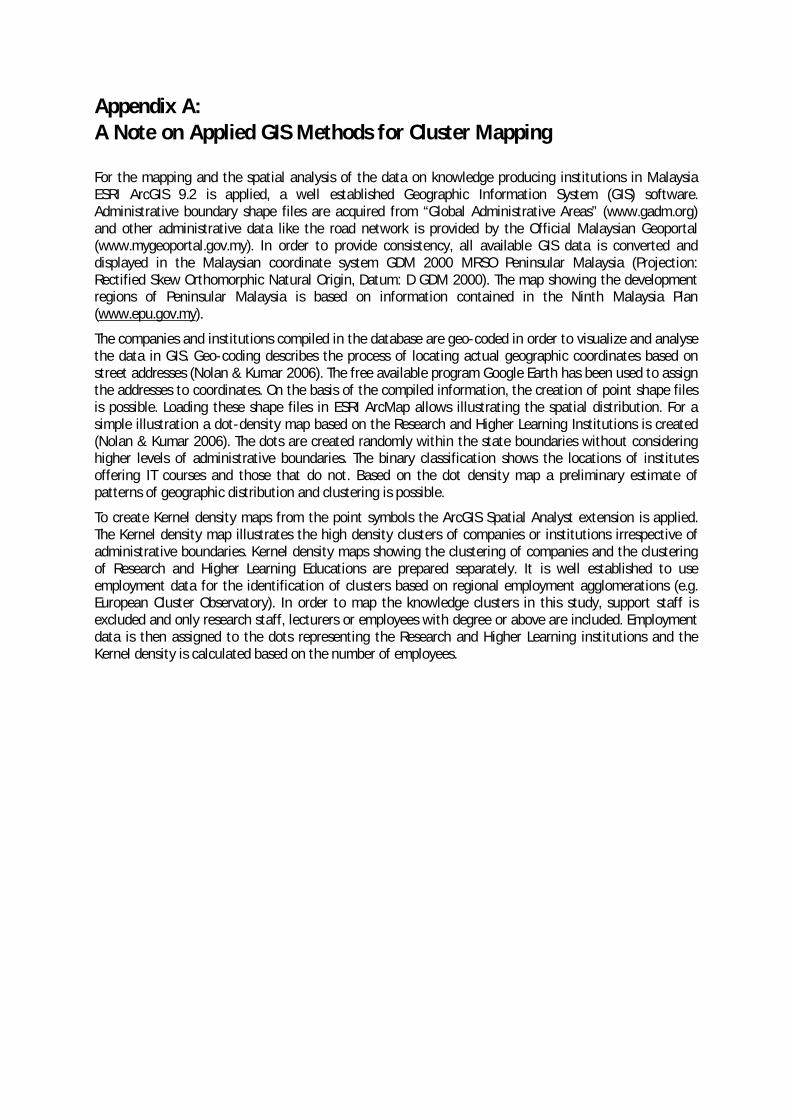
Appendix A: A Note on Applied GIS Methods for Cluster Mapping
For the mapping and the spatial analysis of the data on knowledge producing institutions in Malaysia ESRI ArcGIS 9.2 is applied, a well established Geographic Information System (GIS) software. Administrative boundary shape files are acquired from “Global Administrative Areas” (www.gadm.org) and other administrative data like the road network is provided by the Official Malaysian Geoportal (www.mygeoportal.gov.my). In order to provide consistency, all available GIS data is converted and displayed in the Malaysian coordinate system GDM 2000 MRSO Peninsular Malaysia (Projection: Rectified Skew Orthomorphic Natural Origin, Datum: D GDM 2000). The map showing the development regions of Peninsular Malaysia is based on information contained in the Ninth Malaysia Plan (www.epu.gov.my).
The companies and institutions compiled in the database are geo-coded in order to visualize and analyse the data in GIS. Geo-coding describes the process of locating actual geographic coordinates based on street addresses (Nolan & Kumar 2006). The free available program Google Earth has been used to assign the addresses to coordinates. On the basis of the compiled information, the creation of point shape files is possible. Loading these shape files in ESRI ArcMap allows illustrating the spatial distribution. For a simple illustration a dot-density map based on the Research and Higher Learning Institutions is created (Nolan & Kumar 2006). The dots are created randomly within the state boundaries without considering higher levels of administrative boundaries. The binary classification shows the locations of institutes offering IT courses and those that do not. Based on the dot density map a preliminary estimate of patterns of geographic distribution and clustering is possible.
To create Kernel density maps from the point symbols the ArcGIS Spatial Analyst extension is applied. The Kernel density map illustrates the high density clusters of companies or institutions irrespective of administrative boundaries. Kernel density maps showing the clustering of companies and the clustering of Research and Higher Learning Educations are prepared separately. It is well established to use employment data for the identification of clusters based on regional employment agglomerations (e.g. European Cluster Observatory). In order to map the knowledge clusters in this study, support staff is excluded and only research staff, lecturers or employees with degree or above are included. Employment data is then assigned to the dots representing the Research and Higher Learning institutions and the Kernel density is calculated based on the number of employees.

Appendix B: Development Corridors, Cybercities and Cybercentres in Malaysia
Table 2.1: Economic Development Corridors in Peninsular Malaysia
Cluster Name
Main Investor
Region/States Focus Industry Specialisation Major Infrastructure
Northern Corridor Economic Region (NCER)
Sime Darby Berhad
Perlis Kedah Penang Perak
Agriculture Manufacturing Tourism
Paddy cultivation Electrical & electronic s Medical tourism
Penang Port Penang International Airport Sultan Abdul Halim Airport Langkawi International Airport
Iskandar Malaysia
Khazanah Nasional Berhad
Johore
Services Manufacturing
Financial advisory & consulting Creative industries Logistics Tourism Education Healthcare Electrical & Electronics Petrochemicals & Oleo chemical Food and agro processing
Port of Tanjung Pelepas Port of Pasir Gudang Senai International Airport
East Coast Economic Region (ECER)
Petronas Berhad
Kelantan Terengganu Pahang District of Mersing(part of Johore State)
Tourism Oil, Gas & Petrochemical Manufacturing Agriculture Education
Ecotourism, Coastal and Island, Cultural heritage tourism Propylene and ethylene based industries Boat-building and repair, automotive assembly and distribution, handicraft and textile Large-scale commercial farming. Wood, latex and palm oil-based products. Logistics and distribution services
Kuantan Port Kuala Terengganu Airport Sultan Ismail Petra Airport Sultan Ahmad Shah Airport
Source: www.ncer.com.my dated 19th May 2010; www.iskandarmalaysia.com.my dated 19th May 2010; www.ecerdc.com dated 19th May 2010

Table 2.2: List of Cybercities in Peninsular Malaysia
Location Region Size Status
attained Niche sector Other Facilities
Cyberjaya Klang Valley
7,000 acres 1998 ICT Hotels 3 Universities
KLCC Klang Valley
4,104,404 sq ft.
1997 MNCs Shopping complex Convention centre Petronas Philharmonic Hall Petronas Art Gallery Science Discovery centre Fitness centre Aquaria KLCC
Technology Park Malaysia (TPM)
Klang Valley
92.7 ha (230 acres) R&D space is 2 million sq feet.
1996 R&D 12 buldings i.e. Innovation house, Incubator Centres and Enterprise Houses. Centre for Technology Commercialization (CTC) Conference and Training Facilities 2 Private Colleges( TPM College and APIIT College)
UPM-MTDC Technology Centre
Klang Valley
15.7ha (39acres)
1998 ICT, Multimedia and Agro business
1 Public University (UPM) Theatre Hall Training room
Penang Cybercity 1
North 753.1ha (1,861 acres)
2004 Semiconductor and electronics
1 Public University(USM)
Kulim Hi-Tech Park
North 1700ha (4000 acres)
2004 IC Design and Waterfab
Business centre International School Hospital 1 Private University 1 Public Polytechnic 1 Golf and Country Resort
Source: Based on MSC Malaysia Webpage, 20 May 2010, Malaysian Business, 2009 and MDeC, 2008.

Table 2.3: List of Cybercentres in Peninsular Malaysia
Location Region Size Status
attained Niche sector Other Facilities
KL Sentral Klang Valley 72 acres 2006 Creative content Main Transportation Hub 1 Private College Sooka Sentral(6 storey lifestyle centre) 2 hotels Residential tower Mall Media and Technology Park
Menara MSC Cyberport
South 359,035 sq.ft. (8 acres)
2006 Logistics, electronics and shared services
Hotel Golf Club Health Facilities Institute of higher learning
Meru Raya Central (Perak)
209 acres 2007 Education, SSO and creative contents
Business centre Convention centre Training centre
Melaka International Trade Centre
South (Malacca)
187 acres 2006 Bio-informatics, SSO, e-tourism and healthcare
Hotel Golf Club Health Facilities Institute of higher learning
i-City Klang Valley 72 acres 2008 Web 2.0 content development
Shopping centre
Mid Valley City
Klang Valley 50.15 acres
2008 n.a Hotel Shopping complex Leisure facilities
Bandar Utama
Klang Valley 1,000 acres
2008 n.a Hotel Shopping complex Leisure facilities
TM Cybercenter Complex
Klang Valley 7.6 acres 2008 Telecommunications Multipurpose Hall Gymnasium Medical center
Putra Square East 0.56 acres 2009 Education, defence, logistics, integrated content, agro bio
Bangsar South
Klang Valley 27.5 acres 2009 n.a Shopping complex Leisure facilities
KL Tower Klang Valley 7,770 sq m 1997 Telecommunication Telecommunication tower
Source: Based on MSC Malaysia Webpage , 20 May 2010; Malaysian Business, 2009 and MDeC, 2008.

References
Ani Asmah and Aminuddin Hamdan (Eds). 2009. Quick Facts: Department of Polytechnic and Community College Education. Selangor: Department of Polytechnic and Community College Education, Ministry of Higher Education Malaysia.
Bernama. 2008. ‘USM Is Malaysia's Apex University’, 3 September available at www.bernama.com/bernama/v3/news_lite.php?id=356958 accessed on 30 August 2010.
Bunnel, T. 2006. Malaysia, Modernity and the Multimedia Super Corridor a Critical Geography of Intelligent Landscapes. Abingdon Ox: Routledge.
East Coast Development Region, available at www.ecerdc.com accessed on 19 May 2010. European Cluster Observatory, available at: http://www.clusterobservatory.eu Evers, Hans-Dieter , and Tatjana Bauer. 2009. "Emerging Epistemic Landscapes: Knowledge Clusters in Ho
Chi Minh City and the Mekong Delta. ZEF Working Paper Series 48. Bonn: Centre for Development Research (ZEF), University of Bonn.
Evers, Hans-Dieter and Solvay Gerke. 2009. “ Strategic Group Analysis”. ZEF Working Paper Series 34. Bonn: Centre for Development Research (ZEF), University of Bonn.
Evers, Hans-Dieter, and Rüdiger Korff. 2000. Southeast Asian Urbanism. Singapore: ISEAS Evers, Hans-Dieter, Solvay Gerke, and Thomas Menkhoff. 2010. "Knowledge Clusters and Knowledge
Hubs: Designing Epistemic Landscapes for Development." Journal of Knowledge Management 14:forthcoming.
Faaland, Just, Jack Parkinson, and Rais Saniman. 2003. Growth and ethnic inequality: Malaysia's new economic policy. Kuala Lumpur: Utusan Publications & Distributors.
Fatimah Mohamed Arshad. 2009. “The Agriculture Development Path in Malaysia: Experiences and Challenges for the Future.” Pp. 39-100 in Malaysia at 50 & Beyond, edited by Abdul Razak Baginda. Kuala Lumpur: Malaysian Strategic Research Centre.
Goon Institute, available at www.goon.edu.my/ accessed on 19 May 2010. Institute of Medical Research (IMR), available at www.imr.gov.my accessed on 19 May 2010. Iskandar Malaysia Development, available at www.iskandarmalaysia.com.my accessed on 19 May 2010. Jabatan Perancangan Bandar dan Desa Negeri Selangor [Department of Town and Country Planning of
Selangor]. 2009. Rancangan Tempatan Daerah Sepang 2015 [District of Sepang Local Plan 2015]. Selangor (to be published).
Jabatan Perancangan Bandar dan Desa Semenanjung Malaysia [Federal Town and Country Planning Department]. 2006. Garis Panduan Rekabentuk Fizikal Senibina Cyberjaya [Cyberjaya Physical Architecture Planning Guidelines]. Kuala Lumpur: Kementerian Perumahan dan Kerajaan Tempatan.
Jomo, K.S. 2009. “What can the Developing World Learn from Post-Colonial Malaysia’s Development Experience?” Pp. 263-272 in Readings on Development: Malaysia 2057 Uncommon Voices, Common Aspirations, edited by Nungsari Ahmad Radhi and Suryani Senja Alias. Kuala Lumpur: Khazanah Nasional.
Kementerian Pengajian Tinggi [Ministry of Higher Education]. 2008b. Statistik Maklumat Asas Pelajar dan Tenaga Pengajar IPTS [Basic Statistics of Students and Lecturers in Private Higher Learning Institutes]. Putrajaya: Pusat Data dan Maklumat, Jabatan Pngajian Tinggi, Kementerian Pengajian Tinggi [Data and Information Centre, Department of Higher Education, Minsitry of Higher Education].
Khazanah Nasional Berhad, available at www.khazanah.com.my accessed on 30 August 2010. King, R. 2008. Kuala Lumpur and Putrajaya: Negotiating Urban Space in Malaysia, Singapore: NUS Press. Lee, M.N.N. 2004. Restructuring Higher Education in Malaysia. Available at: www.cshe.nagoya-
u.ac.jp/seminar/kokusai/lee.pdfwww.cshe.nagoya-u.ac.jp/seminar/kokusai/lee.pdf accessed on 30 August 2010.

Leete, Richard. 2007. Malaysia from Kampung to Twin Towers 50 Years of Economic and Social Development. Shah Alam: Oxford Fajar Sdn Bhd.
Limkokwing University of Creative Technology, Available at www.limkokwing.net/malaysia accessed on 30 August 2010.
Mahathir Mohamad. 1998. Excerpts from the Speeches of Mahathir Mohamad on the Multimedia Super Corridor, Subang Jaya: Pelanduk Publications.
Mahathir Mohamad. 2009. “Revisiting Vision 2020: New Challenges for Malaysia” Pp.3-10 in Readings on Development: Malaysia 2057 Uncommon Voices, Common Aspirations edited by Nungsari Ahmad Radhi and Suryani Senja Alias, Kuala Lumpur: Khazanah Nasional.
Malaysia. 1966. First Malaysia Plan 1966-1970. Kuala Lumpur: Government Printer available at www.epu.gov.my accessed on 30 July 2010.
Malaysia. 1971. Second Malaysia Plan 1971-1975. Kuala Lumpur: Government Printer available at www.epu.gov.my accessed on 30 July 2010.
Malaysia. 1976. Third Malaysia Plan 1976-1980. Kuala Lumpur: Government Printer available at www.epu.gov.my accessed on 30 July 2010.
Malaysia. 1981. Fourth Malaysia Plan 1981-1985. Kuala Lumpur: Government Printer available at www.epu.gov.my accessed on 30 July 2010.
Malaysia. 1986. Fifth Malaysia Plan 1986-1990. Kuala Lumpur: Government Printer available at www.epu.gov.my accessed on 30 July 2010.
Malaysia. 1991. Sixth Malaysia Plan 1991-1995. Kuala Lumpur: Government Printer available at www.epu.gov.my accessed on 30 July 2010.
Malaysia. 1991. Terjemahan teks ucapan YAB Datuk Seri Dr. Mahathir b. Mohamad, Perdana Menteri Malaysia pada 28 Februari 1991 sempena persidangan pertama Majlis Perdagangan Malaysia di Kuala Lumpur [Translation of Prime Minister Mahathir Mohamad Speech on the 28 February 1991 at the First Malaysian Trade Conference]. Kuala Lumpur: Percetakan Nasional Malaysia Berhad.
Malaysia. 1996. Seventh Malaysia Plan 1996-2000. Kuala Lumpur: Government Printer available at www.epu.gov.mywww.epu.gov.my
Malaysia. 2001. Eight Malaysia Plan 2001-2005. Kuala Lumpur: Government Printer available at accessed on 30 July 2010.
www.epu.gov.mywww.epu.gov.myMalaysia. 2006. Ninth Malaysia Plan 2006-2010. Kuala Lumpur: Government Printer available at
accessed on 30 July 2010.
www.epu.gov.my accessed on 30 July 2010. Malaysia. 2006. Ninth Malaysia Plan 2006-2010. Kuala Lumpur: Government Printer available at
www.epu.gov.my accessed on 30 July 2010. Malaysia. 2002. Knowledge-Based Economy Master Plan. Kuala Lumpur: Institute of Strategic and
International Studies. Malaysian APEX and Research University available at www.portal.mohe.gov.my/ accessed on 28 May
2010. Malaysian Business. 2009a. “The Race is On” in Malaysian Business, 1 – 15 April, 2009: 20. Malaysian Business. 2009b. ‘Green Calling at Cyberjaya’, Housing & Property, 1 -15 December: 4. Malaysian Meteorological Department (MMD), available at www.met.gov.my accessed on 30 August
2010 Malaysian Science and Technology Information Centre (MASTIC). Public and Private Research and
Development Institute in Malaysia, 2009 (unpublished) Malaysian University Ranking, Available at www.mqa.gov.my accessed on 30 July 2010. Marshall, Alfred. 1920. Principles of Economics. London: McMillan. Menkhoff, Thomas, Hans-Dieter Evers, and Yue Wah Chay (Eds.). 2010. Governing and Managing
Knowledge in Asia, 2nd revised edition. New Jersey, Singapore and London: World Scientific Publishing.
Ministry of Higher Education, available at www.mohe.gov.my accessed on 30 July 2010.

Ministry of Higher Education. 2008a. Malaysia Higher Education Statistics 2007. Putrajaya: Planning and Research Division, Ministry of Higher Education.
Ministry of Higher Education. 2009. Malaysia Higher Education Statistics 2008. Putrajaya: Planning and Research Division, Ministry of Higher Education.
Ministry of International Trade and Industry. 2006. Third Industrial Master Plan 2006-2020: Malaysia Towards Global Competitiveness. Kuala Lumpur : Government Printer.
Mohan, A.V. 2004. The Multimedia Super Corridor (MSC) Project A Note on the Progress and Prognosis of a Policy Driven ICT Cluster paper presented at the MIER National Economic Outlook 2005 Conference, Kuala Lumpur, 7th to 8th December.
MSC Malaysia, available at www.mscmalaysia.my accessed on 20 May 2010. Multimedia Development Corporation Sdn Bhd (MDeC). 2008. Facts & Figures: MSC Malaysia Cybercities
& Cybercentres Creating an Environment that Empowers (Third Edition). Cyberjaya: Multimedia Development Corporation Sdn Bhd (MDeC).
National Economic Advisory Council (NEAC). 2010. New Economic Model for Malaysia. Kuala Lumpur: Government Printer.
Neo, Wee Huay et.al. 2008. Cyberjaya: The Heart of A Nation’s ICT Agenda (Second Edition). Cyberjaya: Multimedia Development Corporation Sdn Bhd (MDeC).
Nolan, C. & I. Kumar. 2006. Geographic Information Systems (GIS) in Business and Industry Cluster Analysis: A Case Study of Indiana. ESRI International User Conference, 2006. Available at: http://www.pcrd.purdue.edu/documents/publications/ESRI_2006_Conference.pdf
Northern Corridor Development Region, available at www.ncer.com.my accessed on 19 May 2010. OECD. 1996. "The knowledge-based economy." Paris: OECD. Perbadanan Harta Intelek Malaysia[Intellectual Property Corporation of Malaysia (MyIPO)], Permohonan
dan Pendaftaran Cap Dagangan Bagi Negeri-Negeri di Semenanjung Malaysia Dari Tahun 2005 -2009 [Application and Registration of Trademarks and Patents for States in Peninsular Malaysia from 2005-2009] (unpublished data).
Porter, Michael E. 1990. The Competitive Advantage of Nations. New York: The Free Press. Porter, Michael E. 2000. "Location, Competition, and Economic Development: Local Clusters in a Global
Economy." Economic Development Quarterly 14:15-34.
Ramasamy, B. et.al. 2002. “ Malaysia’s Leap into the Future: An Evaluation of the Multimedia Super Corridor” in Nottingham University Business School Research Paper Series No. 0872002. Kuala Lumpur: University of Nottingham, Malaysia.
Saleem, M.Y. 2008. “Federalism: Origin and Applications” Pp. 63-81 in Government and Politics in Malaysia edited by Moten, A.R. Singapore: Cenage Learning Asia Pte Ltd.
Setia Haruman Sdn. Bhd. Available at www.cyberjaya-msc.comwww.cyberjaya-msc.com
Sivalingam,G. 2006. Privatization of Higher Education in Malaysia. Forum on Public Policy. Available at:
accessed on 30 August 2010.
www.forumpublicpolicy.com/archive07/sivalingam.pdfwww.forumpublicpolicy.com/archive07/sivalingam.pdf
The Star. 2009. ‘Dr M on drawing foreign investors to Cyberjaya’, 15 May (Business Section): 6. accessed on 30 August 2010.
Weber, Alfred. 1909. Reine Theorien des Standortes. Tübingen: Mohr Siebeck.
Yusuf, Shahid and Kaoru Nabeshima. 2009. Tiger Economies under Threat: a Comparative Analysis of Malaysia’s Industrial Prospects and Policy Options. Washington D.C: World Bank

ZEF Working Paper Series, ISSN 1864-6638 Department of Political and Cultural Change Center for Development Research, University of Bonn Editors: H.-D. Evers, Solvay Gerke, Conrad Schetter 1 Evers, Hans-Dieter and Solvay Gerke (2005). Closing the Digital Divide: Southeast Asia’s Path Towards a Knowledge Society. 2 Bhuiyan, Shajahan and Hans-Dieter Evers (2005). Social Capital and Sustainable Development: Theories and Concepts. 3 Schetter, Conrad (2005). Ethnicity and the Political Reconstruction of Afghanistan. 4 Kassahun, Samson (2005). Social Capital and Community Efficacy. In Poor Localities of Addis Ababa Ethiopia. 5 Fuest, Veronika (2005). Policies, Practices and Outcomes of Demand-oriented Community Water Supply in Ghana: The National
Community Water and Sanitation Programme 1994 – 2004. 6 Menkhoff, Thomas and Hans-Dieter Evers (2005). Strategic Groups in a Knowledge Society: Knowledge Elites as Drivers of
Biotechnology Development in Singapore. 7 Mollinga, Peter P. (2005). The Water Resources Policy Process in India: Centralisation, Polarisation and New Demands on Governance. 8 Evers, Hans-Dieter (2005). Wissen ist Macht: Experten als Strategische Gruppe. 8a Evers, Hans-Dieter and Solvay Gerke (2005). Knowledge is Power: Experts as Strategic Group. 9 Fuest, Veronika (2005). Partnerschaft, Patronage oder Paternalismus? Eine empirische Analyse der Praxis universitärer
Forschungskooperation mit Entwicklungsländern. 10 Laube, Wolfram (2005). Promise and Perils of Water Reform: Perspectives from Northern Ghana. 11 Mollinga, Peter P. (2004). Sleeping with the Enemy: Dichotomies and Polarisation in Indian Policy Debates on the Environmental and
Social Effects of Irrigation. 12 Wall, Caleb (2006). Knowledge for Development: Local and External Knowledge in Development Research. 13 Laube, Wolfram and Eva Youkhana (2006). Cultural, Socio-Economic and Political Con-straints for Virtual Water Trade: Perspectives
from the Volta Basin, West Africa. 14 Hornidge, Anna-Katharina (2006). Singapore: The Knowledge-Hub in the Straits of Malacca. 15 Evers, Hans-Dieter and Caleb Wall (2006). Knowledge Loss: Managing Local Knowledge in Rural Uzbekistan. 16 Youkhana, Eva, Lautze, J. and B. Barry (2006). Changing Interfaces in Volta Basin Water Management: Customary, National and
Transboundary. 17 Evers, Hans-Dieter and Solvay Gerke (2006). The Strategic Importance of the Straits of Malacca for World Trade and Regional
Development. 18 Hornidge, Anna-Katharina (2006). Defining Knowledge in Germany and Singapore: Do the Country-Specific Definitions of Knowledge
Converge? 19 Mollinga, Peter M. (2007). Water Policy – Water Politics: Social Engineering and Strategic Action in Water Sector Reform. 20 Evers, Hans-Dieter and Anna-Katharina Hornidge (2007). Knowledge Hubs Along the Straits of Malacca. 21 Sultana, Nayeem (2007). Trans-National Identities, Modes of Networking and Integration in a Multi-Cultural Society. A Study of
Migrant Bangladeshis in Peninsular Malaysia. 22 Yalcin, Resul and Peter M. Mollinga (2007). Institutional Transformation in Uzbekistan’s Agricultural and Water Resources
Administration: The Creation of a New Bureaucracy. 23 Menkhoff, T., Loh, P. H. M., Chua, S. B., Evers, H.-D. and Chay Yue Wah (2007). Riau Vegetables for Singapore Consumers: A
Collaborative Knowledge-Transfer Project Across the Straits of Malacca. 24 Evers, Hans-Dieter and Solvay Gerke (2007). Social and Cultural Dimensions of Market Expansion. 25 Obeng, G. Y., Evers, H.-D., Akuffo, F. O., Braimah, I. and A. Brew-Hammond (2007). Solar PV Rural Electrification and Energy-Poverty
Assessment in Ghana: A Principal Component Analysis. 26 Eguavoen, Irit; E. Youkhana (2008). Small Towns Face Big Challenge. The Management of Piped Systems after the Water Sector
Reform in Ghana. 27 Evers, Hans-Dieter (2008). Knowledge Hubs and Knowledge Clusters: Designing a Knowledge Architecture for Development 28 Ampomah, Ben Y., Adjei, B. and E. Youkhana (2008). The Transboundary Water Resources Management Regime of the Volta Basin. 29 Saravanan.V.S.; McDonald, Geoffrey T. and Peter P. Mollinga (2008). Critical Review of Integrated Water Resources Management:
Moving Beyond Polarised Discourse. 30 Laube, Wolfram; Awo, Martha and Benjamin Schraven (2008). Erratic Rains and Erratic Markets: Environmental change, economic
globalisation and the expansion of shallow groundwater irrigation in West Africa. 31 Mollinga, Peter P. (2008). For a Political Sociology of Water Resources Management. 32 Hauck, Jennifer; Youkhana, Eva (2008). Histories of water and fisheries management in Northern Ghana. 33 Mollinga, Peter P. (2008). The Rational Organisation of Dissent. Boundary concepts, boundary objects and boundary settings in the
interdisciplinary study of natural resources management. 34 Evers, Hans-Dieter; Gerke, Solvay (2009). Strategic Group Analysis. 35 Evers, Hans-Dieter; Benedikter, Simon (2009). Strategic Group Formation in the Mekong Delta - The Development of a Modern
Hydraulic Society. 36 Obeng, George Yaw; Evers, Hans-Dieter (2009). Solar PV Rural Electrification and Energy-Poverty: A Review and Conceptual
Framework With Reference to Ghana. 37 Scholtes, Fabian (2009). Analysing and explaining power in a capability perspective. 38 Eguavoen, Irit (2009). The Acquisition of Water Storage Facilities in the Abay River Basin, Ethiopia. 39 Hornidge, Anna-Katharina; Mehmood Ul Hassan; Mollinga, Peter P. (2009). ‘Follow the Innovation’ – A joint experimentation and
learning approach to transdisciplinary innovation research. 40 Scholtes, Fabian (2009). How does moral knowledge matter in development practice, and how can it be researched? 41 Laube, Wolfram (2009). Creative Bureaucracy: Balancing power in irrigation administration in northern Ghana. 42 Laube, Wolfram (2009). Changing the Course of History? Implementing water reforms in Ghana and South Africa.

43 Scholtes, Fabian (2009). Status quo and prospects of smallholders in the Brazilian sugarcane and ethanol sector: Lessons for development and poverty reduction.
44 Evers, Hans-Dieter, Genschick, Sven, Schraven, Benjamin (2009). Constructing Epistemic Landscapes: Methods of GIS-Based Mapping. 45 Saravanan V.S. (2009). Integration of Policies in Framing Water Management Problem: Analysing Policy Processes using a Bayesian
Network. 46 Saravanan V.S. (2009). Dancing to the Tune of Democracy: Agents Negotiating Power to Decentralise Water Management. 47 Huu, Pham Cong, Rhlers, Eckart, Saravanan, V. Subramanian (2009). Dyke System Planing: Theory and Practice in Can Tho City,
Vietnam. 48 Evers, Hans-Dieter, Bauer, Tatjana (2009). Emerging Epistemic Landscapes: Knowledge Clusters in Ho Chi Minh City and the Mekong
Delta. 49 Reis, Nadine; Mollinga, Peter P. (2009). Microcredit for Rural Water Supply and Sanitation in the Mekong Delta. Policy
implementation between the needs for clean water and ‘beautiful latrines’. 50 Gerke, Solvay; Ehlert, Judith (2009). Local Knowledge as Strategic Resource: Fishery in the Seasonal Floodplains of the Mekong Delta,
Vietnam 51 Schraven, Benjamin; Eguavoen, Irit; Manske, Günther (2009). Doctoral degrees for capacity development: Results from a survey
among African BiGS-DR alumni. 52 Nguyen, Loan (2010). Legal Framework of the Water Sector in Vietnam. 53 Nguyen, Loan (2010). Problems of Law Enforcement in Vietnam. The Case of Wastewater Management in Can Tho City. 54 Oberkircher, Lisa et al. (2010). Rethinking Water Management in Khorezm, Uzbekistan. Concepts and Recommendations. 55 Waibel, Gabi (2010). State Management in Transition: Understanding Water Resources Management in Vietnam. 56 Saravanan V.S., Mollinga, Peter P. (2010). Water Pollution and Human Health. Transdisciplinary Research on Risk Governance in a
Complex Society. 57 Vormoor, Klaus (2010). Water Engineering, Agricultural Development and Socio-Economic Trends in the Mekong Delta, Vietnam. 58 Hornidge, Anna-Katharina, Kurfürst, Sandra (2010). Envisioning the Future, Conceptualising Public Space. Hanoi and Singapore
Negotiating Spaces for Negotiation. 59 Mollinga, Peter P. (2010). Transdisciplinary Method for Water Pollution and Human Health Research. 60 Youkhana, Eva (2010). Gender and the development of handicraft production in rural Yucatán/Mexico. 61 Naz, Farhat, Saravanan V. Subramanian (2010). Water Management across Space and Time in India. 62 Evers, Hans-Dieter, Nordin, Ramli, Nienkemoer, Pamela (2010). Knowledge Cluster Formation in Peninsular Malaysia: The Emergence
of an Epistemic Landscape. 63 Mehmood Ul Hassan, Hornidge, Anna-Katharina (2010). ‘Follow the Innovation’ – The second year of a joint experimentation and
learning approach to transdisciplinary research in Uzbekistan. 64 Mollinga, Peter P. (2010). Boundary concepts for interdisciplinary analysis of irrigation water management in South Asia. 65 Noelle-Karimi, Christine (2006). Village Institutions in the Perception of National and International Actors in Afghanistan.
(Amu Darya Project Working Paper No. 1) 66 Kuzmits, Bernd (2006). Cross-bordering Water Management in Central Asia.
(Amu Darya Project Working Paper No. 2) 67 Schetter, Conrad, Glassner, Rainer, Karokhail, Masood (2006). Understanding Local Violence. Security Arrangements in Kandahar,
Kunduz and Paktia. (Amu Darya Project Working Paper No. 3)
68 Shah, Usman (2007). Livelihoods in the Asqalan and Sufi-Qarayateem Canal Irrigation Systems in the Kunduz River Basin. (Amu Darya Project Working Paper No. 4)
69 ter Steege, Bernie (2007). Infrastructure and Water Distribution in the Asqalan and Sufi-Qarayateem Canal Irrigation Systems in the Kunduz River Basin. (Amu Darya Project Working Paper No. 5)
70 Mielke, Katja (2007). On The Concept of ‘Village’ in Northeastern Afghanistan. Explorations from Kunduz Province. (Amu Darya Project Working Paper No. 6)
71 Mielke, Katja, Glassner, Rainer, Schetter, Conrad, Yarash, Nasratullah (2007). Local Governance in Warsaj and Farkhar Districts. (Amu Darya Project Working Paper No. 7)
72 Meininghaus, Esther (2007). Legal Pluralism in Afghanistan. (Amu Darya Project Working Paper No. 8)
73 Yarash, Nasratullah, Smith, Paul, Mielke, Katja (2010). The fuel economy of mountain villages in Ishkamish and Burka (Northeast Afghanistan). Rural subsistence and urban marketing patterns. (Amu Darya Project Working Paper No. 9)
74 Oberkircher, Lisa (2011). ‘Stay – We Will Serve You Plov!’. Puzzles and pitfalls of water research in rural Uzbekistan. 75 Shtaltovna, Anastasiya, Hornidge, Anna-Katharina, Mollinga, Peter P. (2011). The Reinvention of Agricultural Service Organisations in
Uzbekistan – a Machine-Tractor Park in the Khorezm Region. 76 Stellmacher, Till, Grote, Ulrike (2011). Forest Coffee Certification in Ethiopia: Economic Boon or Ecological Bane?
http://www.zef.de/workingpapers.html

ZEF Development Studies edited by Solvay Gerke and Hans-Dieter Evers
Center for Development Research (ZEF), University of Bonn
Shahjahan H. Bhuiyan Benefits of Social Capital. Urban Solid Waste Management in Bangladesh Vol. 1, 2005, 288 p., 19.90 EUR, br. ISBN 3-8258-8382-5
Veronika Fuest Demand-oriented Community Water Supply in Ghana. Policies, Practices and Outcomes Vol. 2, 2006, 160 p., 19.90 EUR, br. ISBN 3-8258-9669-2
Anna-Katharina Hornidge Knowledge Society. Vision and Social Construction of Reality in Germany and Singapore Vol. 3, 2007, 200 p., 19.90 EUR, br. ISBN 978-3-8258-0701-6
Wolfram Laube Changing Natural Resource Regimes in Northern Ghana. Actors, Structures and Institutions Vol. 4, 2007, 392 p., 34.90 EUR, br. ISBN 978-3-8258-0641-5
Lirong Liu Wirtschaftliche Freiheit und Wachstum. Eine international vergleichende Studie Vol. 5, 2007, 200 p., 19.90 EUR, br. ISBN 978-3-8258-0701-6
Phuc Xuan To Forest Property in the Vietnamese Uplands. An Ethnography of Forest Relations in Three Dao Villages Vol. 6, 2007, 296 p., 29.90 EUR, br. ISBN 978-3-8258-0773-3
Caleb R.L. Wall, Peter P. Mollinga (Eds.) Fieldwork in Difficult Environments. Methodology as Boundary Work in Development Research Vol. 7, 2008, 192 p., 19.90 EUR, br. ISBN 978-3-8258-1383-3
Solvay Gerke, Hans-Dieter Evers, Anna-K. Hornidge (Eds.) The Straits of Malacca. Knowledge and Diversity Vol. 8, 2008, 240 p., 29.90 EUR, br. ISBN 978-3-8258-1383-3
Caleb Wall Argorods of Western Uzbekistan. Knowledge Control and Agriculture in Khorezm Vol. 9, 2008, 384 p., 29.90 EUR, br. ISBN 978-3-8258-1426-7
Irit Eguavoen The Political Ecology of Household Water in Northern Ghana Vol. 10, 2008, 328 p., 34.90 EUR, br. ISBN 978-3-8258-1613-1
Charlotte van der Schaaf Institutional Change and Irrigation Management in Burkina Faso. Flowing Structures and Concrete Struggles Vol. 11, 2009, 344 p., 34.90 EUR, br. ISBN 978-3-8258-1624-7
Nayeem Sultana The Bangladeshi Diaspora in Peninsular Malaysia. Organizational Structure, Survival Strategies and Networks Vol. 12, 2009, 368 p., 34.90 EUR, br. ISBN 978-3-8258-1629-2
Peter P. Mollinga, Anjali Bhat, Saravanan V.S. (Eds.) When Policy Meets Reality. Political Dynamics and the Practice of Integration in Water Resources Management Reform Vol. 13, 216 p., 29.90 EUR, br., ISBN 978-3-643-10672-8
Irit Eguavoen, Wolfram Laube (Eds.) Negotiating Local Governance. Natural Resources Management at the Interface of Communities and the State Vol. 14, 248 p., 29.90 EUR, br., ISBN 978-3-643-10673-5
William Tsuma Gold Mining in Ghana. Actors, Alliances and Power Vol. 15, 2010, 256 p., 29.90 EUR, br., ISBN 978-3-643-10811-1
Thim Ly Planning the Lower Mekong Basin: Social Intervention in the Se San River Vol. 16, 2010, 240 p., 29.90 EUR, br., ISBN 978-3-643-10834-0
http://www.lit-verlag.de/reihe/zef