Bone-anchored maxillary protraction in patients with ...ORIGINAL ARTICLE Bone-anchored maxillary...
13
ORIGINAL ARTICLE Bone-anchored maxillary protraction in patients with unilateral complete cleft lip and palate and Class III malocclusion Yijin Ren 1 & Ralph Steegman 2 & Arjan Dieters 2 & Johan Jansma 3 & Harry Stamatakis 2 Received: 7 March 2018 /Accepted: 10 September 2018 /Published online: 10 October 2018 # The Author(s) 2018 Abstract Objective This prospective controlled study evaluated the effect of bone-anchored maxillary protraction therapy in cleft children with Class III malocclusion using CBCT-derived 3D surface models. Materials and subjects Eighteen cleft patients between 10 and 12 years old were included. Intermaxillary elastics were worn after the placement of four zygoma bone plates for 18 months. Uniquely, three age-matched untreated groups including both cleft subjects and non-cleft subjects with Class III malocclusion served as controls. Profile photos and CBCT scans for each patient were taken before (T0) and 18 months after the protraction (T1). 3D measurements were made on CBCT surface models from the treatment group using tomographic color mapping method. Cephalometric measurements were made on lateral cephalogram reconstructed from the CBCT scans and were compared with those obtained from the control groups. Results Two thirds of the treatment subjects showed improved lip projection towards more convex facial profile. The most significant skeletal changes on 3D surface models were observed at the zygomatic regions (mean 1.5-mm forward, downward, and outward displacement) and at the maxillary complex (mean 1.5-mm forward displacement). Compared with the control groups, the treatment subjects showed significant increase in the SNA and ANB angles, increased Wits appraisal, a more forward movement of point A and overjet improvement (p < 0.05). Conclusions BAMP in cleft patients gives a significant forward displacement of the zygomaxillairy complex in favor of the Class III treatment. Clinical relevance This treatment method shows clearly favorable outcome in cleft patients after 1.5 years of BAMP. Keywords CBCT . Bone anchored . Maxillofacial protraction . Color mapping . Superimposition . Cleft . Orthodontics . Class III malocclusion Introduction Class III malocclusion is a common anomaly in children with cleft lip and or palate mainly due to maxillary deficiency. Conventionally, growing subjects with maxillary deficiency were treated with a facemask (FM) with a heavy anterior traction applied on the maxilla to stimulate its forward and downward movement and to restrain and redirect mandibular growth. There is some evidence showing more favorable re- sults with facemask therapy on early age [1, 2]. However, the best treatment timing and duration for facemask therapy re- mains controversial, and the skeletal and dental changes were adequately tested only in the short term. Long-term results and stability of this treatment modality remain debatable [3, 4]. Moreover, undesirable treatment outcomes of face mask have been reported such as dental compensations as a consequence of the application of forces on the teeth and an increased facial vertical dimension as a result of posterior rotation of the man- dible. Additionally, facemask wear heavily relies on patient compliance and is usually limited to 12–14 h/day due to the social barrier [1, 5, 6]. The addition of rapid maxillary expan- sion (RME) showed enhanced effect of the FM therapy. Less dental compensations are demonstrated when a facemask used in combination with a Hybrid Hyrax, a rapid palatal expansion * Yijin Ren [email protected] 1 Department of Orthodontics, W.J. Kolff Institute, University Medical Center Groningen, University of Groningen, BB72 300001, Hanzeplein 1, 9700RB Groningen, The Netherlands 2 Department of Orthodontics, University Medical Center Groningen, University of Groningen, Groningen, The Netherlands 3 Department of Oral Maxillofacial Surgery, University Medical Center Groningen, University of Groningen, Groningen, The Netherlands Clinical Oral Investigations (2019) 23:2429–2441 https://doi.org/10.1007/s00784-018-2627-3
Transcript of Bone-anchored maxillary protraction in patients with ...ORIGINAL ARTICLE Bone-anchored maxillary...
ORIGINAL ARTICLE
Bone-anchored maxillary protraction in patients with unilateralcomplete cleft lip and palate and Class III malocclusion
Yijin Ren1& Ralph Steegman2
& Arjan Dieters2 & Johan Jansma3 & Harry Stamatakis2
Received: 7 March 2018 /Accepted: 10 September 2018 /Published online: 10 October 2018# The Author(s) 2018
AbstractObjective This prospective controlled study evaluated the effect of bone-anchored maxillary protraction therapy in cleft childrenwith Class III malocclusion using CBCT-derived 3D surface models.Materials and subjects Eighteen cleft patients between 10 and 12 years old were included. Intermaxillary elastics were worn afterthe placement of four zygoma bone plates for 18 months. Uniquely, three age-matched untreated groups including both cleftsubjects and non-cleft subjects with Class III malocclusion served as controls. Profile photos and CBCT scans for each patientwere taken before (T0) and 18months after the protraction (T1). 3Dmeasurements were made on CBCTsurface models from thetreatment group using tomographic color mapping method. Cephalometric measurements were made on lateral cephalogramreconstructed from the CBCT scans and were compared with those obtained from the control groups.Results Two thirds of the treatment subjects showed improved lip projection towards more convex facial profile. The mostsignificant skeletal changes on 3D surface models were observed at the zygomatic regions (mean 1.5-mm forward, downward,and outward displacement) and at the maxillary complex (mean 1.5-mm forward displacement). Compared with the controlgroups, the treatment subjects showed significant increase in the SNA and ANB angles, increasedWits appraisal, a more forwardmovement of point A and overjet improvement (p < 0.05).Conclusions BAMP in cleft patients gives a significant forward displacement of the zygomaxillairy complex in favor of the ClassIII treatment.Clinical relevance This treatment method shows clearly favorable outcome in cleft patients after 1.5 years of BAMP.
Keywords CBCT .Boneanchored .Maxillofacial protraction .Colormapping .Superimposition .Cleft .Orthodontics .Class IIImalocclusion
Introduction
Class III malocclusion is a common anomaly in children withcleft lip and or palate mainly due to maxillary deficiency.Conventionally, growing subjects with maxillary deficiencywere treated with a facemask (FM) with a heavy anterior
traction applied on the maxilla to stimulate its forward anddownward movement and to restrain and redirect mandibulargrowth. There is some evidence showing more favorable re-sults with facemask therapy on early age [1, 2]. However, thebest treatment timing and duration for facemask therapy re-mains controversial, and the skeletal and dental changes wereadequately tested only in the short term. Long-term results andstability of this treatment modality remain debatable [3, 4].Moreover, undesirable treatment outcomes of face mask havebeen reported such as dental compensations as a consequenceof the application of forces on the teeth and an increased facialvertical dimension as a result of posterior rotation of the man-dible. Additionally, facemask wear heavily relies on patientcompliance and is usually limited to 12–14 h/day due to thesocial barrier [1, 5, 6]. The addition of rapid maxillary expan-sion (RME) showed enhanced effect of the FM therapy. Lessdental compensations are demonstrated when a facemask usedin combination with a Hybrid Hyrax, a rapid palatal expansion
* Yijin [email protected]
1 Department of Orthodontics, W.J. Kolff Institute, University MedicalCenter Groningen, University of Groningen, BB72 300001,Hanzeplein 1, 9700RB Groningen, The Netherlands
2 Department of Orthodontics, University Medical Center Groningen,University of Groningen, Groningen, The Netherlands
3 Department of Oral Maxillofacial Surgery, University MedicalCenter Groningen, University of Groningen,Groningen, The Netherlands
Clinical Oral Investigations (2019) 23:2429–2441https://doi.org/10.1007/s00784-018-2627-3
appliance which is both tooth- and bone-borne. [7]. Protocolsof maxillary expansion and protraction, such as the AlternateRapid maxillary Expansions and Constrictions protocol(Alt-RAMEC), proposed by Liou et al., showed favorable skeletalresults up to 17 to 21 years of age in some patient, but withevident dental compensation [8, 9].
In recent years, titanium miniplates used for anchorage hasbeen advocated as an alternative treatment modality to applybone-borne orthopedic forces between the maxilla and themandible, therewith minimizing dentoalveolar compensations[10, 11]. Compared with treatment with facemask in combi-nation with rapid maxillary expansion, bone-anchored maxil-lary protraction produced 2- to 3-mm larger maxillary ad-vancement with similar mandibular sagittal changes, bettervertical control, and a lack of posterior rotation of the mandi-ble demonstrated by both 3D CBCT images and 2Dcephalograms [12, 13]. Compared with untreated non-cleftsubjects with Class III malocclusions, bone-anchored pro-traction induced an average increment of 4 mm on maxil-lary advancement and favorable mandibular changes ex-ceeding 2 mm based on cephalometric analyses [14].Though anchored maxillary protraction has showed favor-able results in non-cleft growing subjects, no previousstudy has investigated the effect of this treatment modalityon maxillofacial complex in cleft patients until very recent-ly [15]. In that study, Yatabe et al. (2017) compared agroup of Brazilian cleft patients with a group of Belgiannon-cleft subjects on CBCT models and reported compa-rable efficacy in maxillary displacement in the two groups.Till date, no studies have compared the outcome of bone-anchored protraction therapy in cleft patients with that inuntreated Class III non-cleft patients or Class I or II cleftsubjects, nor have any studies investigated the lip projec-tion changes on facial profiles.
Growth trends are intrinsically different in different fa-cial types and skeletal anomalies [16]. Facial growth incleft children showed different patterns from non-cleftsubjects with similar malocclusions [17]. In the develop-ment of Class III malocclusion, non-cleft and cleft sub-jects bear different etiologies [18, 19]. These observationspoint out the importance of including both non-cleft andcleft subjects as controls in order to illustrate the treatmentoutcome of a specific intervention. Comparisons only withnon-cleft subjects undergoing the same therapy or withuntreated non-cleft subjects may obscure the actual cranio-facial response of cleft subjects to an intended therapy.
Therefore, the aim of this prospective controlled trial(National Trial Registration TC 6559) is to evaluate the treat-ment efficacy of bone-anchored maxillary protraction ingrowing unilateral complete cleft lip and palate patients withClass III malocclusion on 3D surface models derived from aCone Beam CT, and on 2D cephalograms in comparison withthree cleft and non-cleft control groups.
Subjects and methods
This clinical study is conducted in agreement with the rulesestablished by the Ethics Committee at the UniversityMedicalCentre Groningen (Clinical Study Register no.: 201700423,Ethical approval no.: METc 2017/318, The NetherlandsNational Trial Registration TC 6559).
Study subjects
All patients with unilateral complete cleft lip and palate be-tween 10 and 12 years were included. The last included pa-tient started maxillary protraction in June 2015, when theminimally required sample size was reached based on a poweranalysis. This group is named as Treatment Group - Cleft(TG-C). All patients have been under treatment by one ortho-dontist at Department of Orthodontics of University MedicalCenter Groningen, the Netherlands, and have undergone aseries of interdisciplinary treatments within the same medicalcenter. The clinical decision for treatment with maxillary pro-traction was primarily based on the skeletal relationship. Theinclusion criteria were (1.) All patients had previously a sec-ondary bone transplantation procedure by the same surgeon;(2.) Both lower permanent canines have erupted; (3.) Sagittaloverjet was between + 2 mm and − 5 mm or with an ANBangle < 0°or a WITs < 0 mm; (4.) Prior to bone-anchoredprotraction, the patients had undergone no or only mild dentalalignment in the upper jaw in preparation for bonetransplantation.
Three untreated control groups with two cephalogramsavailable were matched with the treatment group by age. Anon-cleft group with Class III malocclusion (UG-nonC,ANB < 0° or WITs < 0 mm) was collected from theGroningen Longitudinal Elementary Growth Study [20].A cohort of untreated subjects with cleft, collected fromthe university clinical archives, was assigned to either aClass III malocclusion group (UG-C1 when ANB < 0° orWITs < 0 mm) or a Class I or II malocclusion group (UG-C2 when ANB ≥ 0° or WITs ≥ 0 mm). These cleft subjectshad undergone no or only mild dental alignment in theupper jaw during the observation period.
Bone-anchored maxillary protraction
Four Bollard bone plates were placed by the same surgeon atthe age of 11 years under general anesthesia according toprevious studies [21]. Maxillary protraction withintermaxillary elastics was started 3 weeks after the placementwith an initial force of 150 g each side which was increased to200–250 g after 2–3 months. All patients were instructed towear the elastics 24 h per day including meal time and changethe elastics once a day.
2430 Clin Oral Invest (2019) 23:2429–2441
CBCT imaging acquisition
The Cone Beam Computed Tomography (CBCT) scans wereperformed using the KaVo 3D eXam CBCT unit (KaVoDental GmbH, Bismarckring, Germany) for scans beforeApril 2016, and the Planmeca ProMax 3D Mid (PlanmecaOy, Helsinki, Finland) for scans after April 2016. The formerused a 170 × 230-mm field of view (FoV), set at 120 kV and42.5 mAs with an isotropic voxel size of 0.3 mm. ThePlanmeca ProMax 3D was set at 90 kVand 20.25 mAs usinga 170 × 200-mm field of view with an isotopic voxel size of0.3 mm. The patients were placed in the scanner with theFrankfurt Horizontal (FH) plane parallel to the ground andcentrally positioned in the FoV with the aid of the laser align-ment lights of the unit. The presence of a functional shift isexamined prior to the acquisition of the CBCT scan by theorthodontist (YR). No functional shift appeared present in thetreatment group. All scans were made at the centric occlusion.The CBCT scans were performed before the start of maxillaryprotraction (T0) and approximately 18 months after (T1),BAMP continued after T1. The scan data were exported toDICOM format and imported to specialized software(Mimics10.01 Materialize, V10.2.1.2) for segmentation ofthe hard tissues. The segmentation technique was based onpixel intensity differentiation thresholding and active contourtracing. Following this technique, the segmented hard tissuedata are finally exported as a polygon 3D surface model in theindustry standard STL format. Additionally, out of the CBCTscans of each patient, a 2D lateral cephalogram was recon-structed according to previous studies [22, 23] at T0 and T1for the cephalometric comparisons with the control groups.
Facial profile photos and lip projection analysis
A standardized facial profile photo was taken for eachpatient at T0 and T1 during the same session when theCBCT scan was made, all by the same specialized techni-cian (AD). Patients were seated and were asked to lookinto the mirror in front when the photo was taken. Themost outer points of the upper and lower vermilion wereidentified putting the photo on a full screen size and a lipline was then drawn between the two points. Lip projec-tion was measured as the upper angle between the lip lineand the true vertical line, with inward angles denoted asnegative (concave) and outward angles denoted as positive(convex).
Superimposition of the CBCT 3D surface models
The 3D models were imported in Geomagic (version2013.0.1.1206, Geomagic Solutions®, USA) for a three-dimensional comparison between T0 and T1 for each patient.The anterior cranial fossa and the occipital area posterior of
the foramen magnum were selected as stable structures forsuperimposition. Automatic best-fit matching was performedon the selected areas for cranial base superimposition of theT1model over the T0 (reference) model. Besides visualizationof the surface discrepancies by means of color mapping, skel-etal differences were also quantified at selected regions ofinterest (ROIs) surrounding the Nasion (N), the right and leftzygomatic processes (Zyg), the A point (A), the B point (B),and the Pogonion (Pg). The ROIs had an area of 4.5 mm2
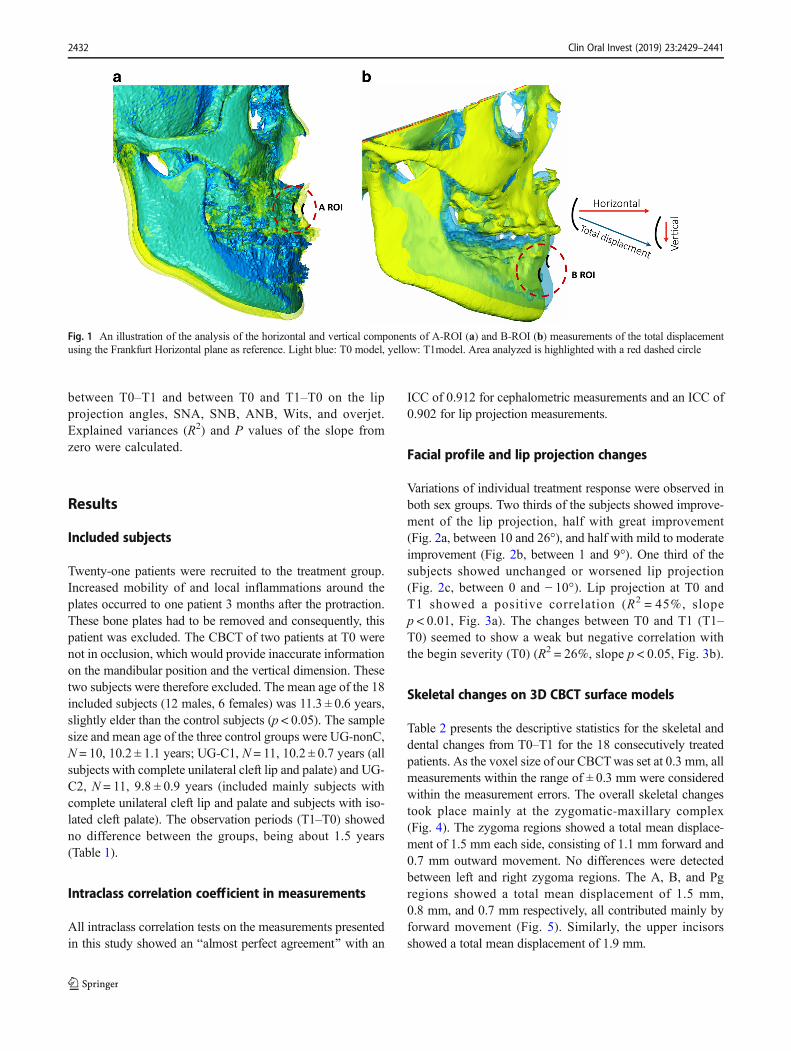
around every anatomic point, containing approximately 70polygons each according to previous studies [18]. The use ofROIs instead of single points was chosen in order to avoidfalse measurements due to a potentially outlying single poly-gon caused by, e.g., an artifact. Instead, the mean difference inmillimeter of all individual polygons within the selected ROIswas measured, which translate into the total displacement ofthe ROIs. Furthermore, by using the FH plane as the referenceplane, the horizontal, vertical, or transversal component ofeach ROI displacement could be calculated (Fig. 1).
Cephalometric measurements and superimposition
The lateral cephalograms of all four groups at T0 and T1 werescaled to the same magnification and were traced andsuperimposed on the anterior cranial base using the Viewboxsoftware (version 10.1 dHal, Kifissia, Greece). The total dis-placement of the Nasion, A, B, and Pg was measured andanalyzed to their vertical and horizontal components.
Statistics
Prior to the research, a power analysis was performed withan effect size of ρ = 0.5 with a power of 0.8, resulting in atotal sample size of 21 patients. The same observer (RS)did all lip projection measurements randomly three timeswith an interval of at least 1 week. Intraclass correlation onthese measurements was calculated. 3D cephalomericlandmarks and their surrounding ROIs were defined andthe differences were measured by the same experiencedexaminer (RS), who performed also all cephalometric trac-ings and superimposition with both 3D surface models and2D cephalograms assigned randomly. For the intraclasscorrelation, 3D ROI measurements and superimposion,and 2D cephalometrics were performed twice with 1-week interval. The statistical analyses were performed withSPSS (version 23.0; IBM U.S.A.). For cephalometric anal-ysis, a one way ANOVA test was performed with a post-hoc Bonferroni correction. For the 3D superimposionROIs, the mean and standard deviations ware calculated.The level of significance of all tests was set at P < 0.05. Forthe Intraclass correlation, a Cronbach’s alpha test was usedwith a kappa of 0.81 to 1.00 indicating an Balmost perfectagreement.^ Linear regression tests were performed
Clin Oral Invest (2019) 23:2429–2441 2431
between T0–T1 and between T0 and T1–T0 on the lipprojection angles, SNA, SNB, ANB, Wits, and overjet.Explained variances (R2) and P values of the slope fromzero were calculated.
Results
Included subjects
Twenty-one patients were recruited to the treatment group.Increased mobility of and local inflammations around theplates occurred to one patient 3 months after the protraction.These bone plates had to be removed and consequently, thispatient was excluded. The CBCT of two patients at T0 werenot in occlusion, which would provide inaccurate informationon the mandibular position and the vertical dimension. Thesetwo subjects were therefore excluded. The mean age of the 18included subjects (12 males, 6 females) was 11.3 ± 0.6 years,slightly elder than the control subjects (p < 0.05). The samplesize and mean age of the three control groups were UG-nonC,N = 10, 10.2 ± 1.1 years; UG-C1, N = 11, 10.2 ± 0.7 years (allsubjects with complete unilateral cleft lip and palate) and UG-C2, N = 11, 9.8 ± 0.9 years (included mainly subjects withcomplete unilateral cleft lip and palate and subjects with iso-lated cleft palate). The observation periods (T1–T0) showedno difference between the groups, being about 1.5 years(Table 1).
Intraclass correlation coefficient in measurements
All intraclass correlation tests on the measurements presentedin this study showed an Balmost perfect agreement^ with an
ICC of 0.912 for cephalometric measurements and an ICC of0.902 for lip projection measurements.
Facial profile and lip projection changes
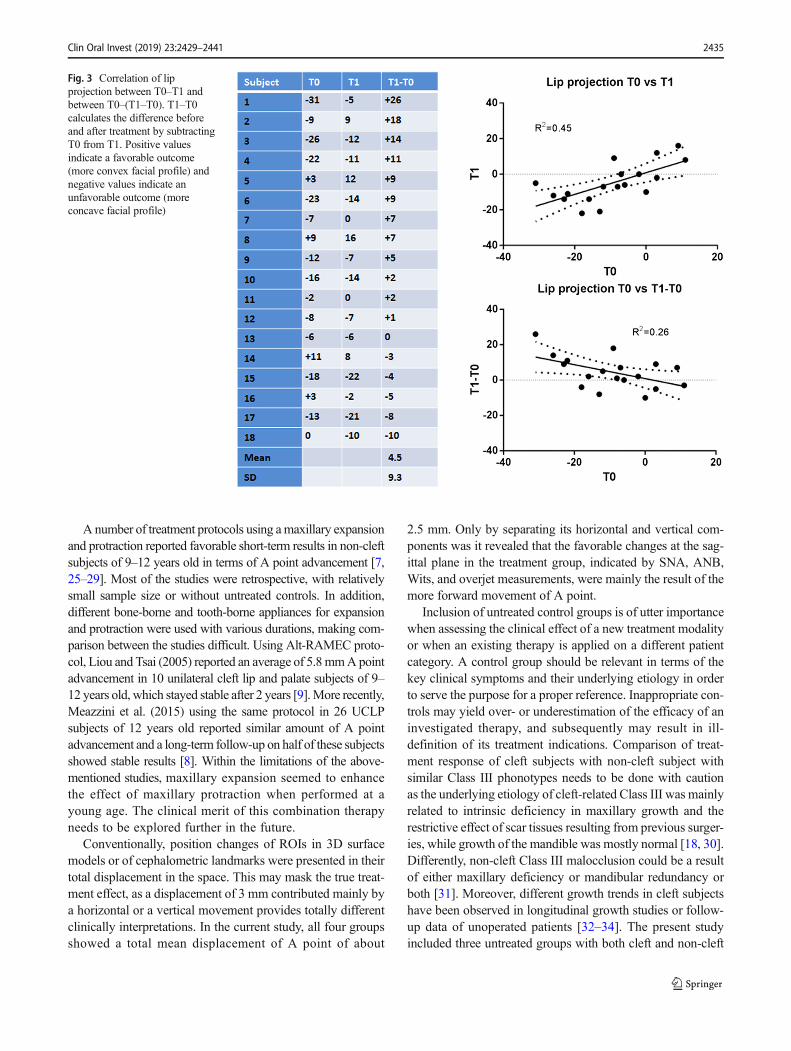
Variations of individual treatment response were observed inboth sex groups. Two thirds of the subjects showed improve-ment of the lip projection, half with great improvement(Fig. 2a, between 10 and 26°), and half with mild to moderateimprovement (Fig. 2b, between 1 and 9°). One third of thesubjects showed unchanged or worsened lip projection(Fig. 2c, between 0 and − 10°). Lip projection at T0 andT1 showed a positive correlation (R2 = 45%, slopep < 0.01, Fig. 3a). The changes between T0 and T1 (T1–T0) seemed to show a weak but negative correlation withthe begin severity (T0) (R2 = 26%, slope p < 0.05, Fig. 3b).
Skeletal changes on 3D CBCT surface models
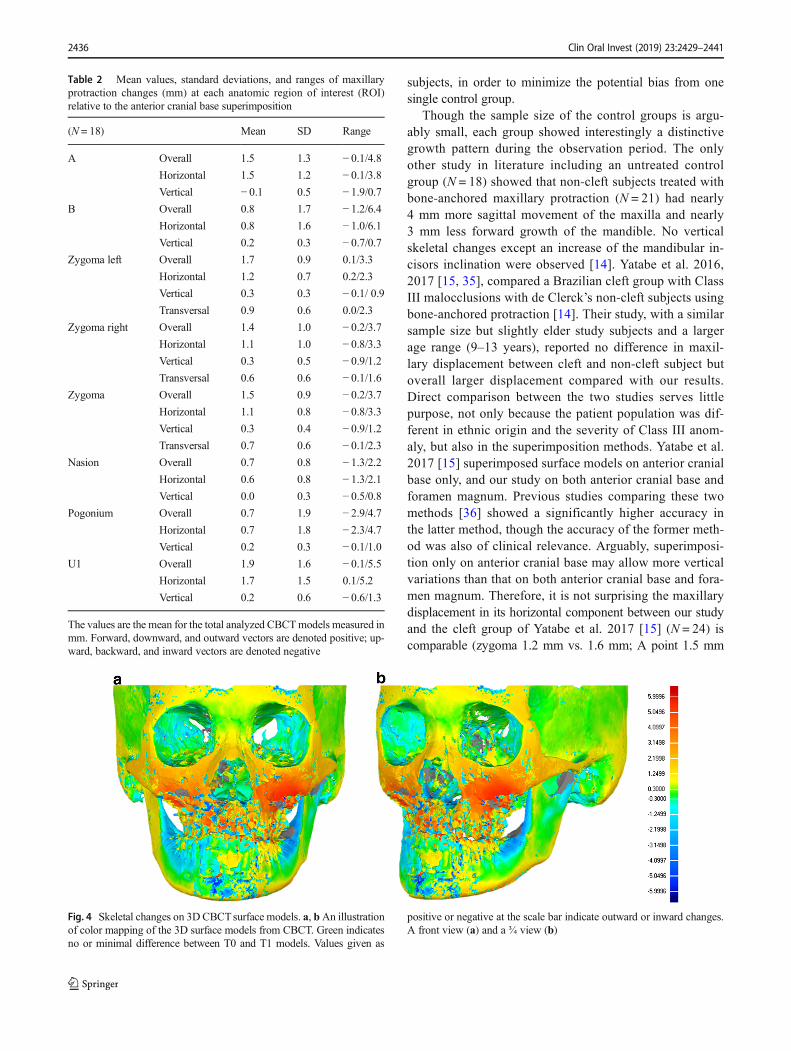
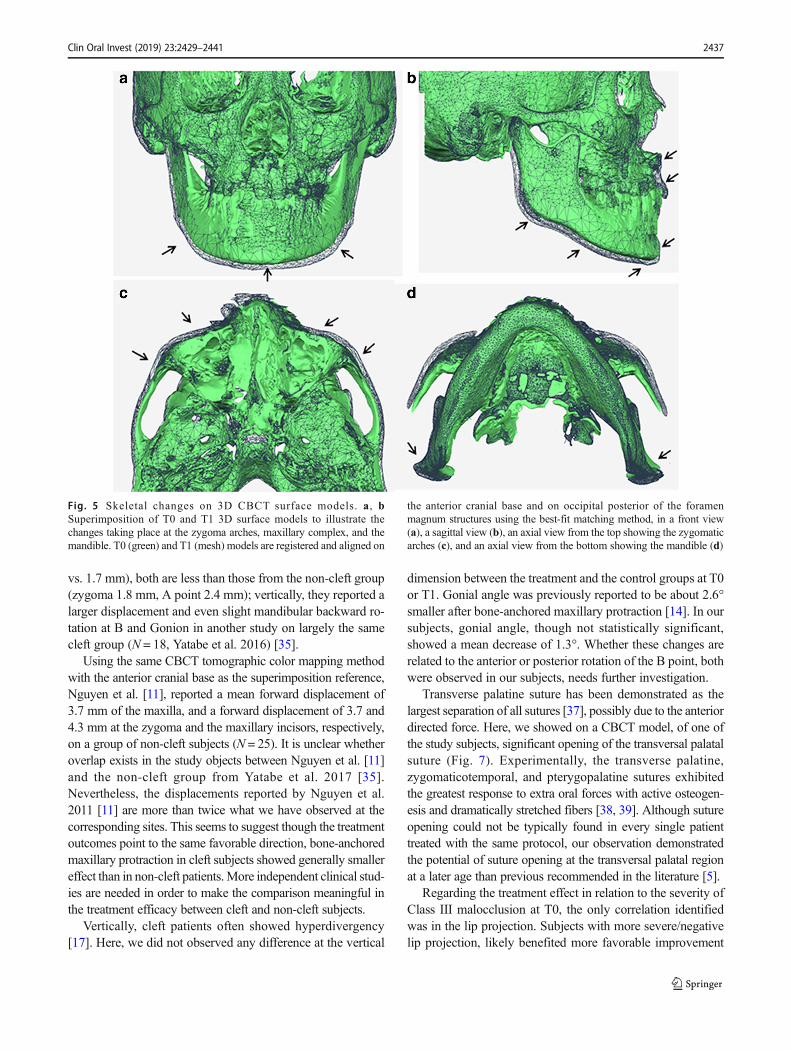
Table 2 presents the descriptive statistics for the skeletal anddental changes from T0–T1 for the 18 consecutively treatedpatients. As the voxel size of our CBCTwas set at 0.3 mm, allmeasurements within the range of ± 0.3 mm were consideredwithin the measurement errors. The overall skeletal changestook place mainly at the zygomatic-maxillary complex(Fig. 4). The zygoma regions showed a total mean displace-ment of 1.5 mm each side, consisting of 1.1 mm forward and0.7 mm outward movement. No differences were detectedbetween left and right zygoma regions. The A, B, and Pgregions showed a total mean displacement of 1.5 mm,0.8 mm, and 0.7 mm respectively, all contributed mainly byforward movement (Fig. 5). Similarly, the upper incisorsshowed a total mean displacement of 1.9 mm.
Fig. 1 An illustration of the analysis of the horizontal and vertical components of A-ROI (a) and B-ROI (b) measurements of the total displacementusing the Frankfurt Horizontal plane as reference. Light blue: T0 model, yellow: T1model. Area analyzed is highlighted with a red dashed circle
2432 Clin Oral Invest (2019) 23:2429–2441

Overall changes at the sagittal plane on CBCT surfacemodels and cephalograms
Table 3 illustrated the differences in cephalometric measure-ments between T0–T1 in the treatment and control groups.Analysis at T0 showed significant difference between ANBand Wits’value between UG-C2 and all the other groups (TG-C/UG-non-C and UG-C1 <UG-C2, p < 0.05), which confirmedthe distinctive sagittal characteristics between the groups.
Significant improvement in overjet was only observed inthe treatment group (p < 0.05). Compared with the controls,the treatment group showed significant increase in SNA andANB angles, a more forward movement of point A (+2.0 mm) and more overjet improvement (2.3 ± 3.1 mm)(p < 0.05 with all three controls), and increased Wits (+1.33 mm). No unfavorable change at the vertical dimensionwere observed, nor in the incisor inclinations. Mandibulargrowth at the sagittal and vertical dimensions appeared com-parable with all untreated groups (p > 0.05).
None of the parameters indicating treatment effect at thesagittal dimension (SNA, SNB, ANB, Wits, and overjet)showed a correlation between T1–T0 and T0. When the totalmean displacement of Nasion, A, B, and Pg was analyzed inits horizontal and vertical components, the only significantchange was at the A point, indicating a 2-mm forward move-ment (p < 0.05 from all three controls).
Since the bone anchor group had a relatively large samplesize than the control groups, it could possibly lead to falsepositive results. As there was minor difference at T0 betweenthe cleft and non-cleft control groups with Class III malocclu-sion (UG-non-C and UG-C1), an additional analysis was per-formed by combining these two control groups resulting in asample size of 21. The results showed no change in the levelof significance in comparison with the analyses on two sepa-rate control groups.
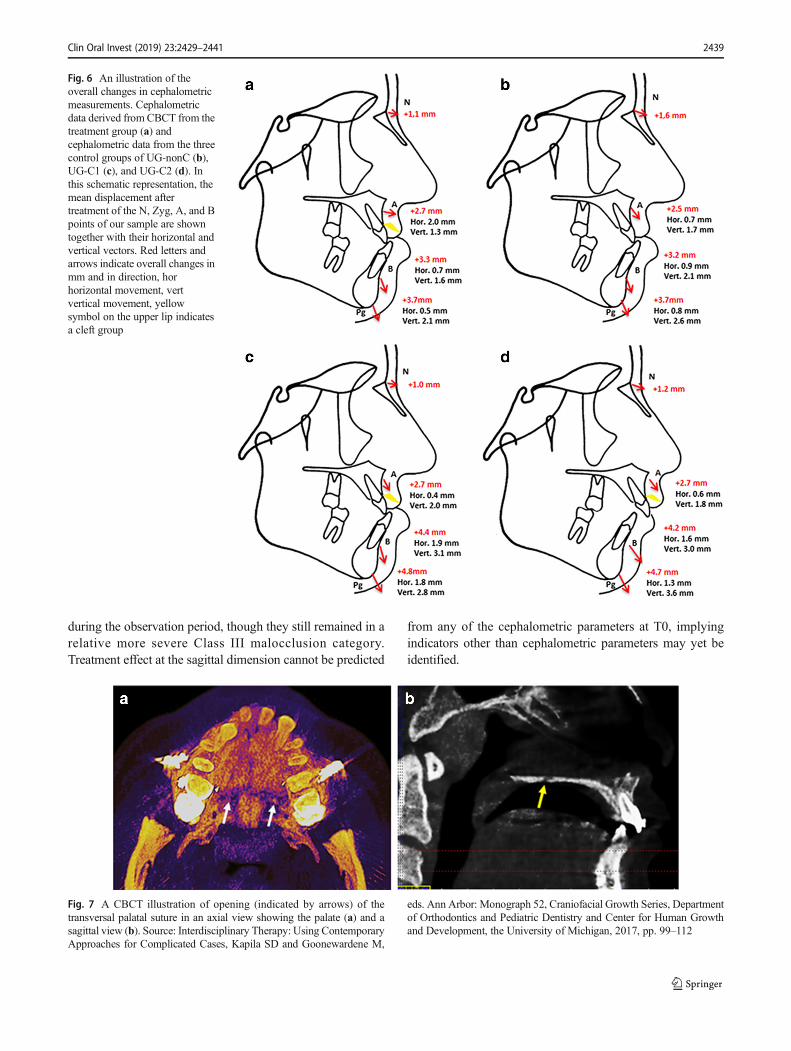
Figure 6 summarizes the mean displacement at the sagittalplane during the observation period of the N, A, B, and Pgpoints together with their horizontal and vertical components.
Here, it shows clearly that the total mean displacement ofthese anatomical points was fairly comparable between thefour groups. The variations were manifested only in its hori-zontal (A point) or vertical (B point) components.
Discussion
Evidence is lacking in the literature regarding the effective-ness of different treatment options for growing subjects withcleft lip and palate and Class III malocclusion. Inappropriatecamouflage dental compensation compromises the treatmentoutcome skeletally and esthetically, and may moreover resultin a lengthy secondary orthodontic treatment in preparationTa
ble1
Characteristicsof
thetreatm
entg
roup
andcontrolg
roups
Group
N(m
ale/female)
Age
T0
Age
T1
Angleclassificatio
nANBangle
Wits’in
mm
Treatment
Treatmentg
roup
TG-C
18(12/6)
11.3
±0.6
12.8
±0.8
Class
III
−1.2±2.7
−2.2±3.6
Bone-anchored
maxillaryprotraction
bywearing
interm
axillaryelastics
24hperdayof
200–250gperside
Untreated
groupnon-cleft1
UG-non-C
10(8/2)
10.2
±1.1
11.6
±1.4
Class
III
−1.0±1.4
−4.9±2.3
Notreatm
ent
Untreated
groupcleft1
UG-C1
11(10/1)
10.2
±0.7
11.8
±0.6
Class
III
−0.7±3.4
−3.1±2.2
Notreatm
ento
ravery
short
period
ofdentalalignm
ent
Untreated
groupcleft2
UG-C2
10(6/4)
9.8±0.9
11.5
±1.1
Class
Ior
II6.5±2.5
2.2±3.1
Notreatm
ent
Clin Oral Invest (2019) 23:2429–2441 2433

for an orthognathic surgery. To our knowledge, this is the firststudy evaluating the treatment efficacy of bone-borne maxil-lary protraction in growing cleft patients with Class III mal-occlusion, in comparison with both untreated cleft and non-cleft controls.
In the present study, bone-anchored maxillary protractiontherapy showed favorable results in cleft children with ClassIII malocclusion. Improvement was observed in lip projectionand facial convexity in two thirds of the subjects. Skeletalchanges were most significant at the zygomatic regions in aforward and outward direction, and at the maxillary complexin a forward direction. Sagittally, forward displacement of Apoint and limited forward displacement of B point contributedto the less concave profile and improvement of the Class IIImalocclusion. No unfavorable change at the vertical dimen-sion or in the incisor inclinations was observed. Mandibular
growth at the sagittal and vertical dimensions appeared com-parable between the treatment and all control groups duringthe observation period.
Facemask therapy has been considered an effective treat-ment modality for Class III malocclusion before the age of 10[2, 24]. However, long-term effect and stability of this treat-ment remain debatable [1]. Mandell et al. reported reducedneed for orthognathic surgery in patients with an early FMtherapy [24]. Comparison of short-term results betweenfacemask therapy and BAMP is not reliable due to distinctage differences of the subjects at the start of treatment. Arecent systematic review showed the age range of face masktreatment was between 5.85 and 10.1 in the included studies[1], while for BAMP treatment the age range was 10–12 [14].Importantly, comparison of the long-term results of early FMtherapy and BAMP, when available, will be very interesting.
Fig. 2 Facial profile and lipprojection before and aftermaxillary protraction. aImprovement of lip projectionbetween 10 and 26°, bimprovement between 1° and 9°,c improvement between 0 and −10°
2434 Clin Oral Invest (2019) 23:2429–2441
Anumber of treatment protocols using amaxillary expansionand protraction reported favorable short-term results in non-cleftsubjects of 9–12 years old in terms of A point advancement [7,25–29]. Most of the studies were retrospective, with relativelysmall sample size or without untreated controls. In addition,different bone-borne and tooth-borne appliances for expansionand protraction were used with various durations, making com-parison between the studies difficult. Using Alt-RAMEC proto-col, Liou and Tsai (2005) reported an average of 5.8mmApointadvancement in 10 unilateral cleft lip and palate subjects of 9–12 years old, which stayed stable after 2 years [9].More recently,Meazzini et al. (2015) using the same protocol in 26 UCLPsubjects of 12 years old reported similar amount of A pointadvancement and a long-term follow-up on half of these subjectsshowed stable results [8]. Within the limitations of the above-mentioned studies, maxillary expansion seemed to enhancethe effect of maxillary protraction when performed at ayoung age. The clinical merit of this combination therapyneeds to be explored further in the future.
Conventionally, position changes of ROIs in 3D surfacemodels or of cephalometric landmarks were presented in theirtotal displacement in the space. This may mask the true treat-ment effect, as a displacement of 3 mm contributed mainly bya horizontal or a vertical movement provides totally differentclinically interpretations. In the current study, all four groupsshowed a total mean displacement of A point of about
2.5 mm. Only by separating its horizontal and vertical com-ponents was it revealed that the favorable changes at the sag-ittal plane in the treatment group, indicated by SNA, ANB,Wits, and overjet measurements, were mainly the result of themore forward movement of A point.
Inclusion of untreated control groups is of utter importancewhen assessing the clinical effect of a new treatment modalityor when an existing therapy is applied on a different patientcategory. A control group should be relevant in terms of thekey clinical symptoms and their underlying etiology in orderto serve the purpose for a proper reference. Inappropriate con-trols may yield over- or underestimation of the efficacy of aninvestigated therapy, and subsequently may result in ill-definition of its treatment indications. Comparison of treat-ment response of cleft subjects with non-cleft subject withsimilar Class III phonotypes needs to be done with cautionas the underlying etiology of cleft-related Class III was mainlyrelated to intrinsic deficiency in maxillary growth and therestrictive effect of scar tissues resulting from previous surger-ies, while growth of the mandible was mostly normal [18, 30].Differently, non-cleft Class III malocclusion could be a resultof either maxillary deficiency or mandibular redundancy orboth [31]. Moreover, different growth trends in cleft subjectshave been observed in longitudinal growth studies or follow-up data of unoperated patients [32–34]. The present studyincluded three untreated groups with both cleft and non-cleft
Fig. 3 Correlation of lipprojection between T0–T1 andbetween T0–(T1–T0). T1–T0calculates the difference beforeand after treatment by subtractingT0 from T1. Positive valuesindicate a favorable outcome(more convex facial profile) andnegative values indicate anunfavorable outcome (moreconcave facial profile)
Clin Oral Invest (2019) 23:2429–2441 2435
subjects, in order to minimize the potential bias from onesingle control group.
Though the sample size of the control groups is argu-ably small, each group showed interestingly a distinctivegrowth pattern during the observation period. The onlyother study in literature including an untreated controlgroup (N = 18) showed that non-cleft subjects treated withbone-anchored maxillary protraction (N = 21) had nearly4 mm more sagittal movement of the maxilla and nearly3 mm less forward growth of the mandible. No verticalskeletal changes except an increase of the mandibular in-cisors inclination were observed [14]. Yatabe et al. 2016,2017 [15, 35], compared a Brazilian cleft group with ClassIII malocclusions with de Clerck’s non-cleft subjects usingbone-anchored protraction [14]. Their study, with a similarsample size but slightly elder study subjects and a largerage range (9–13 years), reported no difference in maxil-lary displacement between cleft and non-cleft subject butoverall larger displacement compared with our results.Direct comparison between the two studies serves littlepurpose, not only because the patient population was dif-ferent in ethnic origin and the severity of Class III anom-aly, but also in the superimposition methods. Yatabe et al.2017 [15] superimposed surface models on anterior cranialbase only, and our study on both anterior cranial base andforamen magnum. Previous studies comparing these twomethods [36] showed a significantly higher accuracy inthe latter method, though the accuracy of the former meth-od was also of clinical relevance. Arguably, superimposi-tion only on anterior cranial base may allow more verticalvariations than that on both anterior cranial base and fora-men magnum. Therefore, it is not surprising the maxillarydisplacement in its horizontal component between our studyand the cleft group of Yatabe et al. 2017 [15] (N = 24) iscomparable (zygoma 1.2 mm vs. 1.6 mm; A point 1.5 mm
Table 2 Mean values, standard deviations, and ranges of maxillaryprotraction changes (mm) at each anatomic region of interest (ROI)relative to the anterior cranial base superimposition
(N = 18) Mean SD Range
A Overall 1.5 1.3 − 0.1/4.8Horizontal 1.5 1.2 − 0.1/3.8Vertical − 0.1 0.5 − 1.9/0.7
B Overall 0.8 1.7 − 1.2/6.4Horizontal 0.8 1.6 − 1.0/6.1Vertical 0.2 0.3 − 0.7/0.7
Zygoma left Overall 1.7 0.9 0.1/3.3
Horizontal 1.2 0.7 0.2/2.3
Vertical 0.3 0.3 − 0.1/ 0.9Transversal 0.9 0.6 0.0/2.3
Zygoma right Overall 1.4 1.0 − 0.2/3.7Horizontal 1.1 1.0 − 0.8/3.3Vertical 0.3 0.5 − 0.9/1.2Transversal 0.6 0.6 − 0.1/1.6
Zygoma Overall 1.5 0.9 − 0.2/3.7Horizontal 1.1 0.8 − 0.8/3.3Vertical 0.3 0.4 − 0.9/1.2Transversal 0.7 0.6 − 0.1/2.3
Nasion Overall 0.7 0.8 − 1.3/2.2Horizontal 0.6 0.8 − 1.3/2.1Vertical 0.0 0.3 − 0.5/0.8
Pogonium Overall 0.7 1.9 − 2.9/4.7Horizontal 0.7 1.8 − 2.3/4.7Vertical 0.2 0.3 − 0.1/1.0
U1 Overall 1.9 1.6 − 0.1/5.5Horizontal 1.7 1.5 0.1/5.2
Vertical 0.2 0.6 − 0.6/1.3
The values are the mean for the total analyzed CBCTmodels measured inmm. Forward, downward, and outward vectors are denoted positive; up-ward, backward, and inward vectors are denoted negative
Fig. 4 Skeletal changes on 3DCBCTsurface models. a, bAn illustrationof color mapping of the 3D surface models from CBCT. Green indicatesno or minimal difference between T0 and T1 models. Values given as
positive or negative at the scale bar indicate outward or inward changes.A front view (a) and a ¾ view (b)
2436 Clin Oral Invest (2019) 23:2429–2441
vs. 1.7 mm), both are less than those from the non-cleft group(zygoma 1.8 mm, A point 2.4 mm); vertically, they reported alarger displacement and even slight mandibular backward ro-tation at B and Gonion in another study on largely the samecleft group (N = 18, Yatabe et al. 2016) [35].
Using the same CBCT tomographic color mapping methodwith the anterior cranial base as the superimposition reference,Nguyen et al. [11], reported a mean forward displacement of3.7 mm of the maxilla, and a forward displacement of 3.7 and4.3 mm at the zygoma and the maxillary incisors, respectively,on a group of non-cleft subjects (N = 25). It is unclear whetheroverlap exists in the study objects between Nguyen et al. [11]and the non-cleft group from Yatabe et al. 2017 [35].Nevertheless, the displacements reported by Nguyen et al.2011 [11] are more than twice what we have observed at thecorresponding sites. This seems to suggest though the treatmentoutcomes point to the same favorable direction, bone-anchoredmaxillary protraction in cleft subjects showed generally smallereffect than in non-cleft patients.More independent clinical stud-ies are needed in order to make the comparison meaningful inthe treatment efficacy between cleft and non-cleft subjects.
Vertically, cleft patients often showed hyperdivergency[17]. Here, we did not observed any difference at the vertical
dimension between the treatment and the control groups at T0or T1. Gonial angle was previously reported to be about 2.6°smaller after bone-anchored maxillary protraction [14]. In oursubjects, gonial angle, though not statistically significant,showed a mean decrease of 1.3°. Whether these changes arerelated to the anterior or posterior rotation of the B point, bothwere observed in our subjects, needs further investigation.
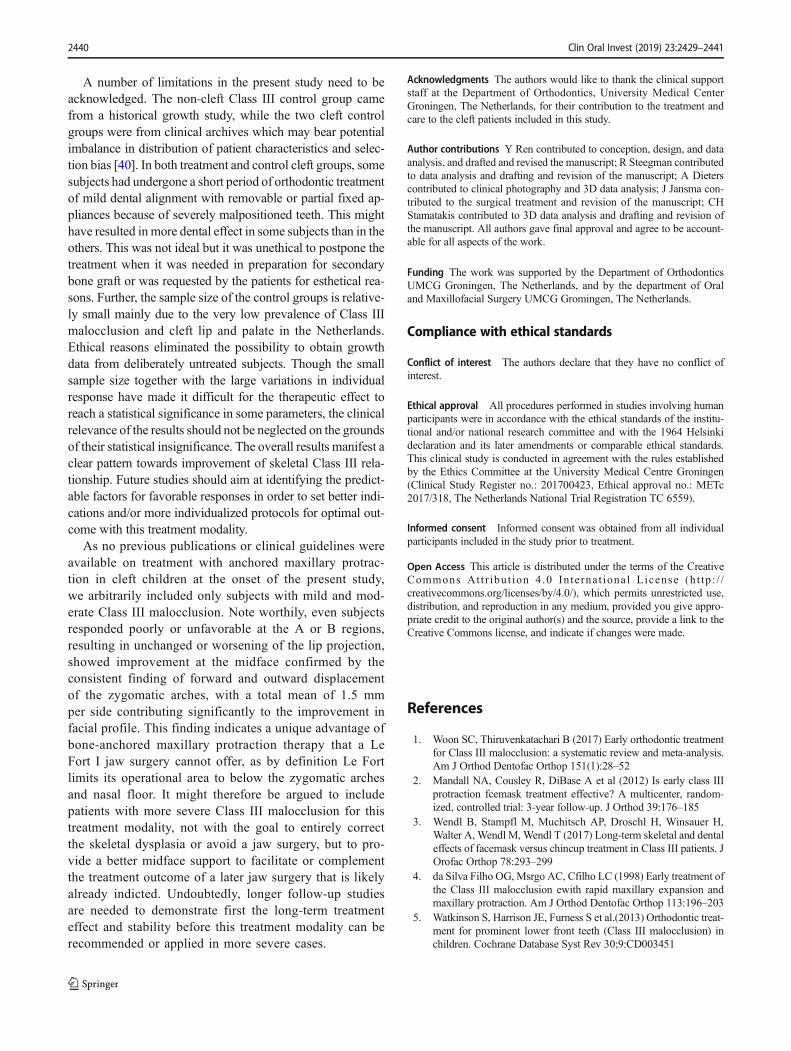
Transverse palatine suture has been demonstrated as thelargest separation of all sutures [37], possibly due to the anteriordirected force. Here, we showed on a CBCT model, of one ofthe study subjects, significant opening of the transversal palatalsuture (Fig. 7). Experimentally, the transverse palatine,zygomaticotemporal, and pterygopalatine sutures exhibitedthe greatest response to extra oral forces with active osteogen-esis and dramatically stretched fibers [38, 39]. Although sutureopening could not be typically found in every single patienttreated with the same protocol, our observation demonstratedthe potential of suture opening at the transversal palatal regionat a later age than previous recommended in the literature [5].
Regarding the treatment effect in relation to the severity ofClass III malocclusion at T0, the only correlation identifiedwas in the lip projection. Subjects with more severe/negativelip projection, likely benefited more favorable improvement
Fig. 5 Skeletal changes on 3D CBCT surface models. a, bSuperimposition of T0 and T1 3D surface models to illustrate thechanges taking place at the zygoma arches, maxillary complex, and themandible. T0 (green) and T1 (mesh) models are registered and aligned on
the anterior cranial base and on occipital posterior of the foramenmagnum structures using the best-fit matching method, in a front view(a), a sagittal view (b), an axial view from the top showing the zygomaticarches (c), and an axial view from the bottom showing the mandible (d)
Clin Oral Invest (2019) 23:2429–2441 2437
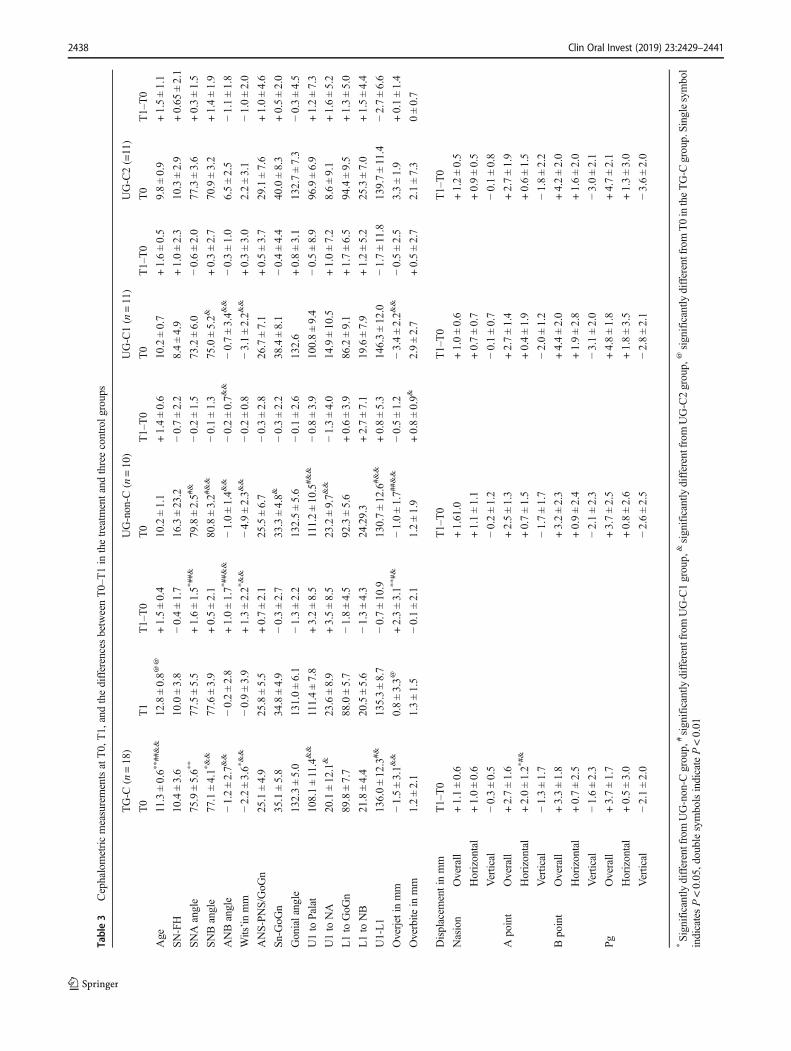
Table3
CephalometricmeasurementsatT0,T1,andthedifferencesbetweenT0–T1in
thetreatm
entand
threecontrolg
roups
TG-C
(n=18)
UG-non-C
(n=10)
UG-C1(n=11)
UG-C2(=11)
T0
T1
T1–T0
T0
T1–T0
T0
T1–T0
T0
T1–T0
Age
11.3±0.6*
*##&&
12.8±0.8@
@+1.5±0.4
10.2±1.1
+1.4±0.6
10.2±0.7
+1.6±0.5
9.8±0.9
+1.5±1.1
SN-FH
10.4±3.6
10.0±3.8
−0.4±1.7
16.3±23.2
−0.7±2.2
8.4±4.9
+1.0±2.3
10.3±2.9
+0.65
±2.1
SNAangle
75.9±5.6*
*77.5±5.5
+1.6±1.5*
##&
79.8±2.5#
&−0.2±1.5
73.2±6.0
−0.6±2.0
77.3±3.6
+0.3±1.5
SNBangle
77.1±4.1*
&&
77.6±3.9
+0.5±2.1
80.8±3.2#
&&
−0.1±1.3
75.0±5.2&
+0.3±2.7
70.9±3.2
+1.4±1.9
ANBangle
−1.2±2.7&
&−0.2±2.8
+1.0±1.7*
##&&
−1.0±1.4&
&−0.2±0.7&
&−0.7±3.4&
&−0.3±1.0
6.5±2.5
−1.1±1.8
Wits’inmm
−2.2±3.6*
&&
−0.9±3.9
+1.3±2.2*
&&
−4.9±2.3&
&−0.2±0.8
−3.1±2.2&
&+0.3±3.0
2.2±3.1
−1.0±2.0
ANS-PN
S/GoG
n25.1±4.9
25.8±5.5
+0.7±2.1
25.5±6.7
−0.3±2.8
26.7±7.1
+0.5±3.7
29.1±7.6
+1.0±4.6
Sn-G
oGn
35.1±5.8
34.8±4.9
−0.3±2.7
33.3±4.8&
−0.3±2.2
38.4±8.1
−0.4±4.4
40.0±8.3
+0.5±2.0
Gonialangle
132.3±5.0
131.0±6.1
−1.3±2.2
132.5±5.6
−0.1±2.6
132.6
+0.8±3.1
132.7±7.3
−0.3±4.5
U1to
Palat
108.1±11.4&&
111.4±7.8
+3.2±8.5
111.2±10.5#&
&−0.8±3.9
100.8±9.4
−0.5±8.9
96.9±6.9
+1.2±7.3
U1to
NA
20.1±12.1&
23.6±8.9
+3.5±8.5
23.2±9.7&
&−1.3±4.0
14.9±10.5
+1.0±7.2
8.6±9.1
+1.6±5.2
L1to
GoG
n89.8±7.7
88.0±5.7
−1.8±4.5
92.3±5.6
+0.6±3.9
86.2±9.1
+1.7±6.5
94.4±9.5
+1.3±5.0
L1to
NB
21.8±4.4
20.5±5.6
−1.3±4.3
24.29.3
+2.7±7.1
19.6±7.9
+1.2±5.2
25.3±7.0
+1.5±4.4
U1-L1
136.0±12.3#&
135.3±8.7
−0.7±10.9
130.7±12.6#&&
+0.8±5.3
146.3±12.0
−1.7±11.8
139.7±11.4
−2.7±6.6
Overjetin
mm
−1.5±3.1&
&0.8±3.3@
+2.3±3.1*
*#&
−1.0±1.7#
#&&
−0.5±1.2
−3.4±2.2&
&−0.5±2.5
3.3±1.9
+0.1±1.4
Overbite
inmm
1.2±2.1
1.3±1.5
−0.1±2.1
1.2±1.9
+0.8±0.9&
2.9±2.7
+0.5±2.7
2.1±7.3
0±0.7
Displacem
entinmm
T1–T0
T1–T0
T1–T0
T1–T0
Nasion
Overall
+1.1±0.6
+1.61.0
+1.0±0.6
+1.2±0.5
Horizontal
+1.0±0.6
+1.1±1.1
+0.7±0.7
+0.9±0.5
Vertical
−0.3±0.5
−0.2±1.2
−0.1±0.7
−0.1±0.8
Apoint
Overall
+2.7±1.6
+2.5±1.3
+2.7±1.4
+2.7±1.9
Horizontal
+2.0±1.2*
#&
+0.7±1.5
+0.4±1.9
+0.6±1.5
Vertical
−1.3±1.7
−1.7±1.7
−2.0±1.2
−1.8±2.2
Bpoint
Overall
+3.3±1.8
+3.2±2.3
+4.4±2.0
+4.2±2.0
Horizontal
+0.7±2.5
+0.9±2.4
+1.9±2.8
+1.6±2.0
Vertical
−1.6±2.3
−2.1±2.3
−3.1±2.0
−3.0±2.1
PgOverall
+3.7±1.7
+3.7±2.5
+4.8±1.8
+4.7±2.1
Horizontal
+0.5±3.0
+0.8±2.6
+1.8±3.5
+1.3±3.0
Vertical
−2.1±2.0
−2.6±2.5
−2.8±2.1
−3.6±2.0
*Significantly
differentfromUG-non-C
group,
#significantly
differentfromUG-C1group,
&significantly
differentfromUG-C2group,
@significantly
differentfromT0intheTG-C
group.Singlesymbol
indicatesP<0.05,doublesymbolsindicateP<0.01
2438 Clin Oral Invest (2019) 23:2429–2441
during the observation period, though they still remained in arelative more severe Class III malocclusion category.Treatment effect at the sagittal dimension cannot be predicted
from any of the cephalometric parameters at T0, implyingindicators other than cephalometric parameters may yet beidentified.
Fig. 6 An illustration of theoverall changes in cephalometricmeasurements. Cephalometricdata derived from CBCT from thetreatment group (a) andcephalometric data from the threecontrol groups of UG-nonC (b),UG-C1 (c), and UG-C2 (d). Inthis schematic representation, themean displacement aftertreatment of the N, Zyg, A, and Bpoints of our sample are showntogether with their horizontal andvertical vectors. Red letters andarrows indicate overall changes inmm and in direction, horhorizontal movement, vertvertical movement, yellowsymbol on the upper lip indicatesa cleft group
Fig. 7 A CBCT illustration of opening (indicated by arrows) of thetransversal palatal suture in an axial view showing the palate (a) and asagittal view (b). Source: Interdisciplinary Therapy: Using ContemporaryApproaches for Complicated Cases, Kapila SD and Goonewardene M,
eds. Ann Arbor: Monograph 52, Craniofacial Growth Series, Departmentof Orthodontics and Pediatric Dentistry and Center for Human Growthand Development, the University of Michigan, 2017, pp. 99–112
Clin Oral Invest (2019) 23:2429–2441 2439
A number of limitations in the present study need to beacknowledged. The non-cleft Class III control group camefrom a historical growth study, while the two cleft controlgroups were from clinical archives which may bear potentialimbalance in distribution of patient characteristics and selec-tion bias [40]. In both treatment and control cleft groups, somesubjects had undergone a short period of orthodontic treatmentof mild dental alignment with removable or partial fixed ap-pliances because of severely malpositioned teeth. This mighthave resulted in more dental effect in some subjects than in theothers. This was not ideal but it was unethical to postpone thetreatment when it was needed in preparation for secondarybone graft or was requested by the patients for esthetical rea-sons. Further, the sample size of the control groups is relative-ly small mainly due to the very low prevalence of Class IIImalocclusion and cleft lip and palate in the Netherlands.Ethical reasons eliminated the possibility to obtain growthdata from deliberately untreated subjects. Though the smallsample size together with the large variations in individualresponse have made it difficult for the therapeutic effect toreach a statistical significance in some parameters, the clinicalrelevance of the results should not be neglected on the groundsof their statistical insignificance. The overall results manifest aclear pattern towards improvement of skeletal Class III rela-tionship. Future studies should aim at identifying the predict-able factors for favorable responses in order to set better indi-cations and/or more individualized protocols for optimal out-come with this treatment modality.
As no previous publications or clinical guidelines wereavailable on treatment with anchored maxillary protrac-tion in cleft children at the onset of the present study,we arbitrarily included only subjects with mild and mod-erate Class III malocclusion. Note worthily, even subjectsresponded poorly or unfavorable at the A or B regions,resulting in unchanged or worsening of the lip projection,showed improvement at the midface confirmed by theconsistent finding of forward and outward displacementof the zygomatic arches, with a total mean of 1.5 mmper side contributing significantly to the improvement infacial profile. This finding indicates a unique advantage ofbone-anchored maxillary protraction therapy that a LeFort I jaw surgery cannot offer, as by definition Le Fortlimits its operational area to below the zygomatic archesand nasal floor. It might therefore be argued to includepatients with more severe Class III malocclusion for thistreatment modality, not with the goal to entirely correctthe skeletal dysplasia or avoid a jaw surgery, but to pro-vide a better midface support to facilitate or complementthe treatment outcome of a later jaw surgery that is likelyalready indicted. Undoubtedly, longer follow-up studiesare needed to demonstrate first the long-term treatmenteffect and stability before this treatment modality can berecommended or applied in more severe cases.
Acknowledgments The authors would like to thank the clinical supportstaff at the Department of Orthodontics, University Medical CenterGroningen, The Netherlands, for their contribution to the treatment andcare to the cleft patients included in this study.
Author contributions Y Ren contributed to conception, design, and dataanalysis, and drafted and revised the manuscript; R Steegman contributedto data analysis and drafting and revision of the manuscript; A Dieterscontributed to clinical photography and 3D data analysis; J Jansma con-tributed to the surgical treatment and revision of the manuscript; CHStamatakis contributed to 3D data analysis and drafting and revision ofthe manuscript. All authors gave final approval and agree to be account-able for all aspects of the work.
Funding The work was supported by the Department of OrthodonticsUMCG Groningen, The Netherlands, and by the department of Oraland Maxillofacial Surgery UMCG Gromingen, The Netherlands.
Compliance with ethical standards
Conflict of interest The authors declare that they have no conflict ofinterest.
Ethical approval All procedures performed in studies involving humanparticipants were in accordance with the ethical standards of the institu-tional and/or national research committee and with the 1964 Helsinkideclaration and its later amendments or comparable ethical standards.This clinical study is conducted in agreement with the rules establishedby the Ethics Committee at the University Medical Centre Groningen(Clinical Study Register no.: 201700423, Ethical approval no.: METc2017/318, The Netherlands National Trial Registration TC 6559).
Informed consent Informed consent was obtained from all individualparticipants included in the study prior to treatment.
Open Access This article is distributed under the terms of the CreativeCommons At t r ibut ion 4 .0 In te rna t ional License (h t tp : / /creativecommons.org/licenses/by/4.0/), which permits unrestricted use,distribution, and reproduction in any medium, provided you give appro-priate credit to the original author(s) and the source, provide a link to theCreative Commons license, and indicate if changes were made.
References
1. Woon SC, Thiruvenkatachari B (2017) Early orthodontic treatmentfor Class III malocclusion: a systematic review and meta-analysis.Am J Orthod Dentofac Orthop 151(1):28–52
2. Mandall NA, Cousley R, DiBase A et al (2012) Is early class IIIprotraction fcemask treatment effective? A multicenter, random-ized, controlled trial: 3-year follow-up. J Orthod 39:176–185
3. Wendl B, Stampfl M, Muchitsch AP, Droschl H, Winsauer H,Walter A, Wendl M, Wendl T (2017) Long-term skeletal and dentaleffects of facemask versus chincup treatment in Class III patients. JOrofac Orthop 78:293–299
4. da Silva Filho OG,Msrgo AC, Cfilho LC (1998) Early treatment ofthe Class III malocclusion ewith rapid maxillary expansion andmaxillary protraction. Am J Orthod Dentofac Orthop 113:196–203
5. Watkinson S, Harrison JE, Furness S et al.(2013) Orthodontic treat-ment for prominent lower front teeth (Class III malocclusion) inchildren. Cochrane Database Syst Rev 30;9:CD003451
2440 Clin Oral Invest (2019) 23:2429–2441
6. Toffol LD, Pavoni C, Baccetti T, Franchi L et al. (2008) Orthopedictreatment outcomes in Class III malocclusion. A systematic review.Angle Orthod 78(3):561–73
7. Ngan P, Wilmes B, Drescher D, Martin C, Weaver B, Gunel E(2015) Comparison of two maxillary protraction protocols: tooth-borne versus bone-anchored protraction facemask treatment. ProgOrthod 16:26
8. Meazzini MC, Zappia LB, Tortora C et al (2018) Short- and long-term effects of late maxillary protocol in unilateral cleft lip andpalate. Cleft Palate-Craniofacial J:1–9
9. Liou EJW, Tsai WC (2005) A new protocol for maxillary protrac-tion in cleft patients: repetitive weekly protocol of alternate rapidmaxillary expansions and constrictions. Cleft Palate-Craniofacial J42(2):121–127
10. de Clerck HJ, Proffit WR (2015) Growth modification of the face: acurrent perspective with emphasis on Class III treatment. Am JOrthod Dentofac Orthop 148(1):37–46
11. Nguyen T, Cevidanes L, Cornelis MA, Heymann G, de Paula LK,de Clerck H (2011) Three-dimensional assessment of maxillarychanges associated with bone anchored maxillary protraction. AmJ Orthod Dentofac Orthop 140(6):790–798
12. Hino CT, Cevidanes LH, Nguyen TT et al (2013) Three-dimensional analysis of maxillary changes associated withfacemask and rapid maxillary expansion compared with bone an-chored maxillary protraction. Am J Orthod Dentofac Orthop144(5):705–714
13. Cevidanes L, Baccetti T, Franchi L et al (2010) Comparison of twoprotocols for maxillary protraction: bone anchors versus face maskwith rapid maxillary expansion. Angle Orthod 80(5):799–806
14. De Clerck H, Cevidanes L, Baccetti T (2010) Dentofacial effects ofbone-anchored maxillary protraction: a controlled study of consec-utively treated Class III patients. Am J Orthod Dentofac Orthop138(5):577–581
15. Yatabe M, Garib DG, Faco RAS et al (2017) Bone-anchored max-illary protraction therapy in patients with unilateral complete cleftlip and palate: 3-dimensional assessment of maxillary effects. Am JOrthod Dentofac Orthop 152(3):327–335
16. Baccetti T, Franchi L, Mc Namara JA Jr. (2007) Growth in theuntreated Class III. Seminars Orthod 13(3):130–142
17. Will LA (2000) Growth and development in patients with untreatedclefts. Cleft Palate Craniofac J 37(6):523–526
18. Chen Z, Qin Y, Wang G, Shen G (2009) Sagittal maxillary growthin patients with unoperated isolated cleft palate. Cleft Palate-Craniofacial J 46(6):664–667
19. Lambrecht JT, Kreusch T, Schulz L (2000) Position, shape, anddimension of the maxilla in unoperated cleft lip and palate patients:review of the literature. Clin Anat 13(2):121–133
20. Dibbets JMH(1995) Applicability of cephalometric standards. Anappraisal of atlases. In: Trotman C-A, McNamara JA, eds.Orthodontics treatment: Outcome and effectiveness. Ann Arbor:Center for Human Growth and Devekopment, University ofMichigan 297–317
21. Cornelis M, Scheffler N, De Clerck H et al (2007) Systematic re-view of the experimental use of temporary skeletal anchorage de-vices in orthodontics. Am J OrthodDentofac Orthop 131((4):52–58
22. Moshiri M, Scarfe WC, Hilgers ML, Scheetz JP, Silveira AM,Farman AG (2007) Accuracy of linear measurements from imagingplate and lateral cephalometric images derived from cone-beamcomputed tomograph. Am J Orthod Dentofac Orthop 132(4):550–560
23. Liedke GS, Delamare EL, Vizzotto MB, da Silveira HLD, PrietschJR, Dutra V, da Silveira HED (2012) Comparative study betweenconventional and cone beam CT-synthesized half and total skullcephalograms. Dentomaxillofacial Radiology 41:136–142
24. Mandall N, Cousley R, DiBase A et al (2016) Early Class III pro-traction facemask treatment reduces the need for orthognatic sur-gery: a multi-centre, two-arm parallel randomized controlled trial. JOrthod 43:164–175
25. Isci D, Turk T, Elekdag-Turk S (2010) Activation-deactivation rap-id palatal expansion and reverse headgear in Class III cases. Eur JOrthod 32(6):706–715
26. Al-Mozany S (2011). Treatment of Class III malocclusions usingtemporary anchorage devices (TADs), the Alt-RAMEC protocoland intermaxillary Class III elastics in the growing patient. A pro-spective clinical study. Sydney, Australia: University of Sydney
27. Kaya D, Kocadereli I, Kan B, Tasar F (2011) Effects of facemasktreatment anchored with miniplates after alternate rapid maxillaryexpansions and constrictions; a pilot study. Angle Orthod. 81(4):639–646
28. Canturk BH, Celikoglu M (2015) Comparison of the effects of facemask treatment started simultaneously and after the completion ofthe alternate rapid maxillary expansion and constriction procedure.Angle Orthod. 85(2):284–291
29. Nienkemper M, Wilmes B, Franchi L, Drescher D (2015)Effectiveness of maxillary protraction using a hybrid hyrax-facemask combination: a controlled clinical study. Angle Orthod85(5):764–770
30. Zheng ZW, FangYM, Lin CX (2016) Isolated influences of surgeryrepair on maxillofacial growth in complete unilateral cleft lip andpalate. J Oral and Maxillofac Surg 74(8):1649–1657
31. Proffit W, Fields H, Sarver D(2012) Contemporary orthodontics 5thEdition, : Mosby
32. Doğan S, Önçağ G, Akin Y (2005) Craniofacial development inchildren with unilateral cleft lip and palate. Br J Oral andMaxillofacSurg 44:28–33
33. Shetye PR (2004) Facial growth of adults with unoperated clefts.Clin Plast Surg 31(2):361–371
34. Capelozza Filho L, Normando AD, da Silva Filho OG (1996)Isolated influences of lip and palate surgery on facial growth: com-parison of operated and unoperated male adults with UCLP. CleftPalate Craniofac J 33(1):51–56
35. Yatabe M, D Garib, R Facor et al. (2017) Bone-anchored maxillaryprotraction therapy in patients with unilateral complete cleft lip andpalate: 3-dimensional assessment of maxillary effects. Am J OrthodDentofacial Orthop 152(3): 327
36. Gkantidis N, Schauseil M, Pawel P et al (2015) Evaluation of 3-dimensional superimposition techniques on various skeletal struc-tures of the head using surface models. PlosONE 10(2):e0118810
37. Kambara T (1977) Dentofacial changes produced by extraoral for-ward force in the Macaca irus. Am J Orthod 71:249–277
38. Zhao N, Xu Y, Chen Y, Xu YH, Han XL, Wang LY (2008) Effectsof Class II magnetic orthopedic forces on the craniofacial sutures ofrhesus monkeys. Am J Orthod Dentofac Orthop 133:401–409
39. Jackson G, Kokich V, Shaprio P (1979) Experimental and post –experimental response to anteriorly directed extraoral force inyoung Macaca nemstrine. Am J Orthod 75:318–333
40. Papageorgiou SN, Koretsi V, Jäger A (2017) Bias from historicalcontrol groups used in orthodontic research: a meta-epidemiological study. Eur J Orthod 39(1):98–105
Clin Oral Invest (2019) 23:2429–2441 2441