Bonding between high strength rebar and reactive powder ... · PDF fileINTRODUCTION. Reactive...
16
Bonding between high strength rebar and reactive powder concrete *Deng Zong-cai 1) , Jumbe R. Daud 2) and Yuan Chang-xing 3) The Key Laboratory of Urban Security and Disaster Engineering, Ministry of Education. Beijing University of Technology, Beijing 100124 China. [email protected] 1 Abstract: A central pullout test was conducted to investigate the bonding properties between high strength rebars and reactive powder concrete(RPC), which covered ultimate pullout load, ultimate bonding stress, free end initial slip, free end slip at peak load, and load-slip curve characteristics. The effects of varying rebar buried length, thickness of protective layer and diameter of rebars on the bonding properties were studied, and how to determine the minimum thickness of protective layer and critical anchorage length was suggested according the test results. The results prove that: 1) Ultimate pull out load and free end initial slip load increases with increase in buried length, while ultimate bonding stress and slip corresponding to the peak load reduces. When buried length is increased from 3d to 4d(d is the diameter of rebar), after peak load, the load-slip curve descending segment declines faster, but later the load rises again exceeding the ultimate load. When buried length reaches 5d, rebar pull fracture occurs. 2) As thickness of protective layer increases, the ultimate pull out load, ultimate bond stress, free end initial slip load and the slip corresponding to the peak load increase, and the descending section of the curve becomes gentle. The recommended minimum thickness of protective layer for plate type members should be the greater value between d and 10mm, and for beams or columns the greater value between d and 15mm. 3) Increasing the diameter of HRB500 rebars leads to a gentle slope in the descending segment of the pullout curve. 4) The bonding properties between high strength steel HRB500 and RPC is very good. The suggested buried length for test determining bonding strength between high strength rebars and RPC is 4d and a formula to calculate the critical anchorage length is established. The relationships between ultimate bonding stress and thickness of protective layer or the buried length was obtained. Keywords: HRB500 rebar; reactive powder concrete; bonding; critical anchorage length 1) professor 2) post graduate 3) post gradaute Note: Copied from the manuscript submitted to “Computers and Concrete, An International Journal” for presentation at ASEM13 Congress 489
Transcript of Bonding between high strength rebar and reactive powder ... · PDF fileINTRODUCTION. Reactive...
Bonding between high strength rebar and reactive powder concrete
*Deng Zong-cai1), Jumbe R. Daud2) and Yuan Chang-xing3)
The Key Laboratory of Urban Security and Disaster Engineering, Ministry of
Education. Beijing University of Technology, Beijing 100124 China. [email protected]
Abstract: A central pullout test was conducted to investigate the bonding properties between high strength rebars and reactive powder concrete(RPC), which covered ultimate pullout load, ultimate bonding stress, free end initial slip, free end slip at peak load, and load-slip curve characteristics. The effects of varying rebar buried length, thickness of protective layer and diameter of rebars on the bonding properties were studied, and how to determine the minimum thickness of protective layer and critical anchorage length was suggested according the test results. The results prove that: 1) Ultimate pull out load and free end initial slip load increases with increase in buried length, while ultimate bonding stress and slip corresponding to the peak load reduces. When buried length is increased from 3d to 4d(d is the diameter of rebar), after peak load, the load-slip curve descending segment declines faster, but later the load rises again exceeding the ultimate load. When buried length reaches 5d, rebar pull fracture occurs. 2) As thickness of protective layer increases, the ultimate pull out load, ultimate bond stress, free end initial slip load and the slip corresponding to the peak load increase, and the descending section of the curve becomes gentle. The recommended minimum thickness of protective layer for plate type members should be the greater value between d and 10mm, and for beams or columns the greater value between d and 15mm. 3) Increasing the diameter of HRB500 rebars leads to a gentle slope in the descending segment of the pullout curve. 4) The bonding properties between high strength steel HRB500 and RPC is very good. The suggested buried length for test determining bonding strength between high strength rebars and RPC is 4d and a formula to calculate the critical anchorage length is established. The relationships between ultimate bonding stress and thickness of protective layer or the buried length was obtained.
Keywords:HRB500 rebar; reactive powder concrete; bonding; critical anchorage length
1) professor 2) post graduate 3) post gradaute Note: Copied from the manuscript submitted to “Computers and Concrete, An International
Journal” for presentation at ASEM13 Congress
489

INTRODUCTION
Reactive powder concrete (RPC) is a new building material with high-strength, good crack resistance, high toughness and good durability, a promising future material of high performance cement-based composites [1-2]. When high strength reinforced steel rebar is used along with RPC, the excellent performance such as high strength of both materials will be utilized, and would significantly improve the safety and durability of the structure, economize steel and enhance construction low-carbon buildings. The articles [3-8] investigate interfacial bonding properties between high strength reinforced steel rebar and ordinary strength concrete or high strength concrete; articles [9-11] compares the interface bonding properties between RPC and ordinary strength rebar or fiber reinforced polymer(FRP), but the articles on researches revolving around bonding properties between high strength steel rebar and RPC have not yet been covered by most researchers.
The effects of steel rebar diameter , the thickness of the protective layer c , and rebar buried length l on the bonding properties are covered in this research. A reasonable buried length for specific bonding strength and the minimum thickness of the RPC specimens’ protective layer are suggested in this article. The critical anchorage length formula, the relationships between the ultimate bond stress and thickness of the protective layer or the buried length were established herein. All these will provide a reference for engineering application and structural design. 1 EXPERIMENT INTRODUCTION 1.1 Test materials and performance HRB500 high-strength steel rebar was from Hebei Iron and Steel Group; rebar diameter and strength listed in Table 1.
Table 1 Diameter and strength of rebars
Diameter /mm Rebar yield strength/MPa Rebar ultimate strength/MPa
8 588.0 736.0
10 576.0 738.9
16 566.7 682.0
18 589.4 712.0
The mixing ratio of RPC: cement 705.0kg/m3, slag 471.0kg/m3, quartz sand
1070.5kg/m3, steel fiber 157kg/m3, water 167.7kg/m3 and admixture 60.1kg/m3. Steel fiber length is 13mm, diameter 0.22mm, tensile strength 2800MPa. Six cubic specimens, three of side 70mm for measuring the compressive strength and three of side 150mm to measure the split tensile strength, were prepared under the same conditions as the pull out specimens, where the average compressive strength was 147.1MPa and split
490

tensile strength 19.8MPa. 1.2 Specimen Specimens listed in Table 2 are divided into two categories according to the aim of the test. (1) influence of buried length of rebar group: the letters represent the form of specimens (L represents standard cubic specimens of side 150mm, Z represents the central pullout test) and the first number after "-" represents rebar diameter, the number after the second "-" represents buried length of rebar. i.e. LZ-16-48 is central pullout test of cubic specimen with diameter 16mm and buried length 48mm. (2) Influence of thickness of the protective layer group: NZ represents prismatic specimen central pullout test, BZ represents plate type specimens central pullout test. The number after the first "-" represents rebar diameter, the number after the second "-" represents thickness of protective layer yet, i.e. LZ-16-32 is central pullout test 80mm×80mm×150mm prismatic specimen, rebar diameter 16mm, thickness of the protective layer 32mm; BZ-8-6 represents plate type central pullout test specimen of length 150mm, width 150mm and thickness 20mm, rebar diameter 8mm and thickness of protective layer 6mm. 1.3 Testing method
Fig.1 Schematic Representation of Pull-out Test Setup
491
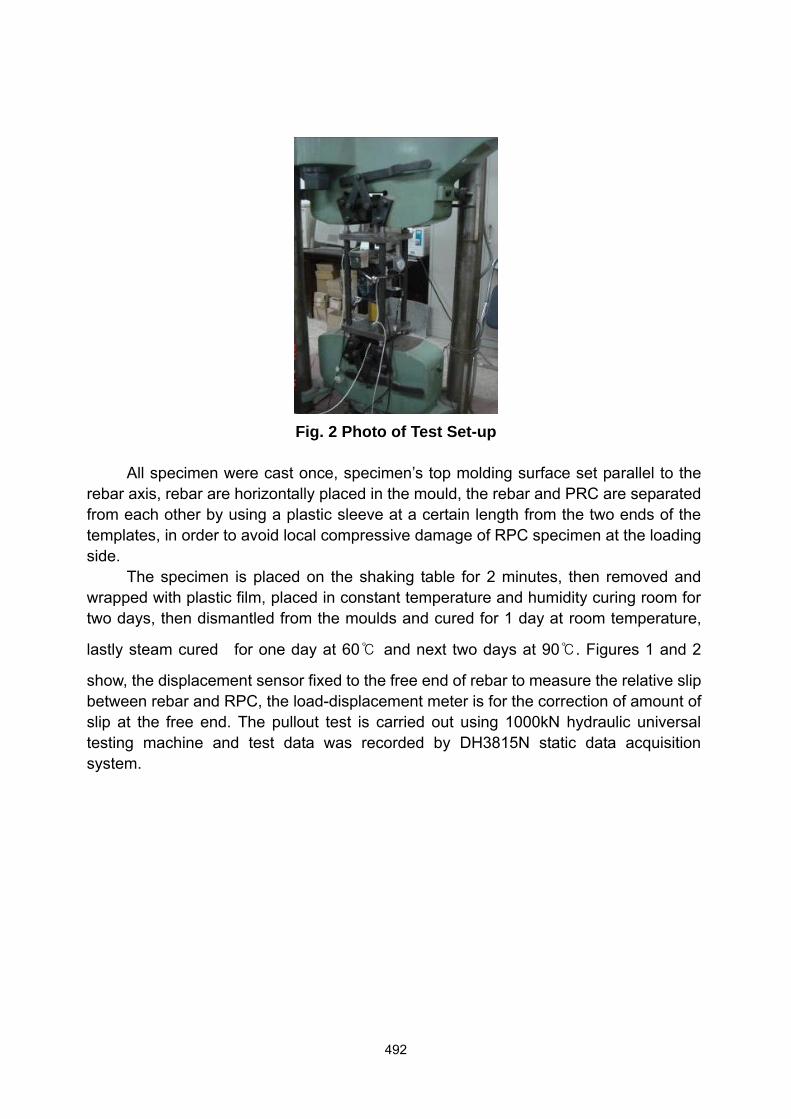
Fig. 2 Photo of Test Set-up
All specimen were cast once, specimen’s top molding surface set parallel to the rebar axis, rebar are horizontally placed in the mould, the rebar and PRC are separated from each other by using a plastic sleeve at a certain length from the two ends of the templates, in order to avoid local compressive damage of RPC specimen at the loading side. The specimen is placed on the shaking table for 2 minutes, then removed and wrapped with plastic film, placed in constant temperature and humidity curing room for two days, then dismantled from the moulds and cured for 1 day at room temperature,
lastly steam cured for one day at 60℃ and next two days at 90℃. Figures 1 and 2
show, the displacement sensor fixed to the free end of rebar to measure the relative slip between rebar and RPC, the load-displacement meter is for the correction of amount of slip at the free end. The pullout test is carried out using 1000kN hydraulic universal testing machine and test data was recorded by DH3815N static data acquisition system.
492

Table 2 Pull-out test results
Specimen
no
l
/mm
uF
/kN
m /
MPa
crF
/kN
us
/mm
/% Failure mode
LZ-8-24 30 37.8 50.2 28.6 0.38 2 Pull off LZ-10-30 30 51.7 54.9 24.0 1.52 2 Pull off
LZ-16-48 48 135.4 56.1 63.0 1.96 2 Pull out, vertical cracks
LZ-16-48 48 115.0 47.7 59.9 2.33 2 Pull out
LZ-16-48 48 131.0 54.3 70.2 3.15 2 Pull out, vertical cracks
LZ-16-64 64 136.3 42.4 101.3 1.04 2 Pull out, vertical cracks
LZ-16-64 64 136.1 54.3 111.3 1.24 2 Pull out, vertical cracks
LZ-16-64 64 141.0 43.9 109.0 1.11 2 Pull out, vertical cracks
LZ-16-80 80 137.1 34.1 - - 2 Pull out, vertical cracks
LZ-16-80 80 132.8 33.0 120.3 0.02 2 Pull out,splitting
LZ-16-80 80 141.7 35.3 - - 2 Pull off LZ-18-54 54 170.0 55.7 102.6 1.87 2 Pull out, vertical
cracks LZ-18-54 54 168.5 55.2 89.0 1.96 2 Pull out, vertical
cracks LZ-18-54 54 164.8 54.0 29.9 2.01 2 Pull out, vertical
cracks LZ-18-72 72 172.5 42.4 141.6 1.81 2 Pull out, vertical
cracks LZ-18-72 72 170.0 41.8 118.4 1.62 2 Pull out, vertical
cracks LZ-18-72 72 173.2 42.6 125.9 1.71 2 Pull out, vertical
cracks LZ-18-90 90 181.0 35.6 162.4 0.55 2 Pull off
493

LZ-18-90 90 178.5 35.1 158.7 0.1 2 Pull off
LZ-18-90 90 182.7 35.9 180.6 0.02 2 Pull off
NZ-16-12 48 75.0 31.1 36.4 - 2 Pull out, splitting
NZ-16-22 48 86.8 36.0 38.7 0.16 2 Vertical through cracks
NZ-16-32 48 101.0 41.9 43.6 0.38 2 Pull out, vertical cracks
NZ-16-42 48 115.0 47.7 79.9 0.42 2 Pull out, vertical cracks
NZ-16-52 48 117.6 48.8 80.6 1.37 2 Pull out, vertical cracks
NZ-16-62 48 127.3 52.8 64.3 1.23 2 Pull out, vertical cracks
BZ-8-6 40 33.6 33.4 - 1.4 2 Pull out, scraped damage
BZ-8-8 40 35.2 35.0 - - 2 Pull out, scraped damage
BZ-8-11 40 36.0 35.8 - - 2 Pull out
BZ-10-10 50 49.8 31.7 - - 2 Pull out,
BZ-10-12 50 53.0 33.8 - - 2 Pull out, annular cracks
BZ-10-15 50 55.8 35.5 - - 2 Pull out
2 TEST RESULTS ANALYSIS
The pullout test results are shown in Table 2, where cr
F is the free end initial slip load, us is the slip of the free end corresponding to the first peak load, and is volume fraction of steel fibers. The ultimate bonding stress between rebar and RPC is calculated as follows:
um
F
dl
(1)
494

where: u
F is ultimate pullout load value (kN), m is the ultimate bonding stress (MPa), d rebar diameter (mm), l is buried length of rebar (mm). 2.1 Rebar buried length bonding properties Buried length directly influences the bond stress distribution between rebar and RPC and the pull-out failure mode. The load-slip curves are shown in Figure 3. Figures 3 (a), (b) shows, as buried length increases from 3d to 4d, pullout load after the peak decreases faster, then increases again. Later load reaches secondary peak, which is higher than the first peak load, and the slip corresponding to the second peak load is bigger, therefore the first peak load is defined as ultimate load. When the diameter remains constant, changing rebar buried length from 3d to 4d, the load-slip curves descend steeply at the descending stage, but later the load increases and the curve ascends again. The “gripping effect” between the rebar ribs and RPC undergoes local damage from the loading end to the free end. Stress distribution is uneven, since the tensile stress of rebar is slowly transferred from the pulling end towards the free end. Once the stress is evenly distributed in the rebar, stress redistribution effect causes the load to increase thus the curve rises again.
0
20
40
60
80
100
120
140
160
0 2 4 6 8 10 12 14 16 18 20 22 24
Free end initial slip/mm
Lo
ad
/kN
LZ-16-48LZ-16-64LZ-16-80
(a) LZ-16
495

0
50
100
150
200
0 2 4 6 8 10 12 14 16 18 20 22 24
Free end initial slip/mm
Lo
ad
/kN
LZ-18-54LZ-18-72LZ-18-90
(b)LZ-18 Fig.3 Load-slip curves for different rebar buried lengths
After the peak load, local damage increases until it causes block failure, the bond stress between rebar and RPC decreases. The longer the buried length, the more uneven bond stress becomes, and the longer the time of uniform stress redistribution process takes, which causes the post-peak pullout load to decrease more significantly. After the load decrease, the bond stress gets redistributed more evenly along the rebar, which makes the pullout load to increase again. From Table 2 we see: (1) when the buried length is 3d, 4d, the rebar were pulled out; when buried length is 5d, rebar exhibit tensile fracture failure. (2) For the same rebar diameter, increasing buried length leads to increase in the free end initial slip load
crF , while the free end slip us corresponding to ultimate load
uF decreases. This is
because pullout load is transferred from the loading point to the free end. The longer the rebar buried length, the longer the load transfer path from the loading end to the free end. When the buried length increases, the free end initial slip load
crF increases. As
the free end begins to slip, the RPC between the rebar ribs is not completely damaged, the load is borne by the rebar throughout the buried length.
crF /
uF increases with
increase in buried length, and the free end initial slip increases faster from zero to u
s , so the cumulative value of
us in this process decreases.
For the same diameter of rebar, although the pullout load increases with buried length, the ultimate bond stress decreases, as seen in LZ-18 specimens, where pullout ultimate load increased by 2.5% when buried length increased from 3d to 4d, but the ultimate bond stress reduced by 30%. By integration of the balance equation + =0
4
sdd
dx
(Along the rebar buried length
496

direction), we get = (0)4
s
d
l , where (0)s is the rebar stress at the loading end,
indicating that the ultimate bond stress and rebar buried length are inversely proportional, which is almost a linear relationship. From the experimental statistical regression we obtain: ( 2R = 0.96) (2) where m is the ultimate bond stress;
,t sf is RPC splitting tensile strength; l is rebar
buried length; d is rebar diameter. 2.2 Effect of thickness of the protective layer on the bonding properties Two types specimen were prepared to investigate the effect of thickness of the protective layer on the bonding properties. (1) Central pullout experiment on prismatic specimens to determine the relationship between thickness of the protective layer and the ultimate bond stress. (2) Central pullout test on plate-type specimens to determine the minimum thickness of the protective layer. Minimum thickness of the protective layer is mainly to ensure that the rebar strength is completely utilized when working together with RPC. The plate type central pullout test specimens are used to determine minimum thickness of the protective layer before the specimen scrap or split, also ensure maximum utilization the strengths of rebar and RPC when working jointly. 2.2.1 Central pullout test of prismatic specimens 7 groups of prismatic type central pullout specimens were prepared, where diameter of rebar is 16mm, buried length 48mm, variable parameter is thickness of the protective layer, from 12mm to 67mm. Test data and failure modes are all shown in Table 2, central pullout load-slip curves are shown in Figure 3, where overall splitting occurs for specimen NZ-16-22 since the protective layer thickness is too small, and the descending segment of the curve is not abstained.
,
0.46 4.51m
t s
l
f d
497

0
20
40
60
80
100
120
140
0 2 4 6 8 10 12 14 16 18 20 22 24
Free end initial slip/mm
Lo
ad
/kN
H2-NZ-16-22H2-NZ-16-32H2-NZ-16-42H2-NZ-16-52
H2-NZ-16-62H2-LZ-16-48
Fig.4 Load slip curves for different thicknesses of protective layer
From Table 2 and Figure 4, it’s observed that increase in the thickness of protective layer leads to increase in crF and uS , the descending segment of load-slip curve becomes gentler. The different segments of the descending section are: (1) a smaller thickness of the protective layer c <32mm, (as in specimen NZ-16-22, NZ-16-32), after the peak load, load-slip curve descending segment becomes steep as load decreases rapidly. When the free end slip reaches 2 mm, the loads of the two specimens decrease by 14.3% and 11.9% respectively. (2) Moderate thickness of protective layer 42mm <c <52mm (specimens NZ-16-42, NZ-16-52, and NZ-16-62), the effect of thickness of protective layer on the load-slip curve is small, the load-slip curves are similar, and after peak load the curve descends slowly. (3) For larger thickness of the protective specimens(such as LZ-16-48), after peak load, load-slip curve descends slightly; the free end slip reaches 5.7mm, and the load begins to increase again and the curve ascends; when the free end slip exceeds 18mm, the load begins to decrease. The failure mode of cubic central pullout specimens group is shown in Table 2. When c >22mm, the specimens do not undergo splitting failure, but cracks form inside the specimen along the rebar extending towards the outside, crack width decreases with increase in thickness of the protective layer, cracks do not penetrate to the outer surface of the specimen. When c >42mm, cracks do not extend to the specimen surface but only develop around the rebar. Increasing thickness of the protective layer leads to decrease in the number of cracks and crack width. When thickness of the protective layer is small, cracks appear more easily because during rebar pull out, tension is borne by the friction between the rebar ribbed surface and RPC, thus the ribs exert pressure on RPC, causing tensile stress in RPC. When the split stress exceeds RPC tensile strength, radial cracks form along the rebar extending to the surface of the specimen.
498
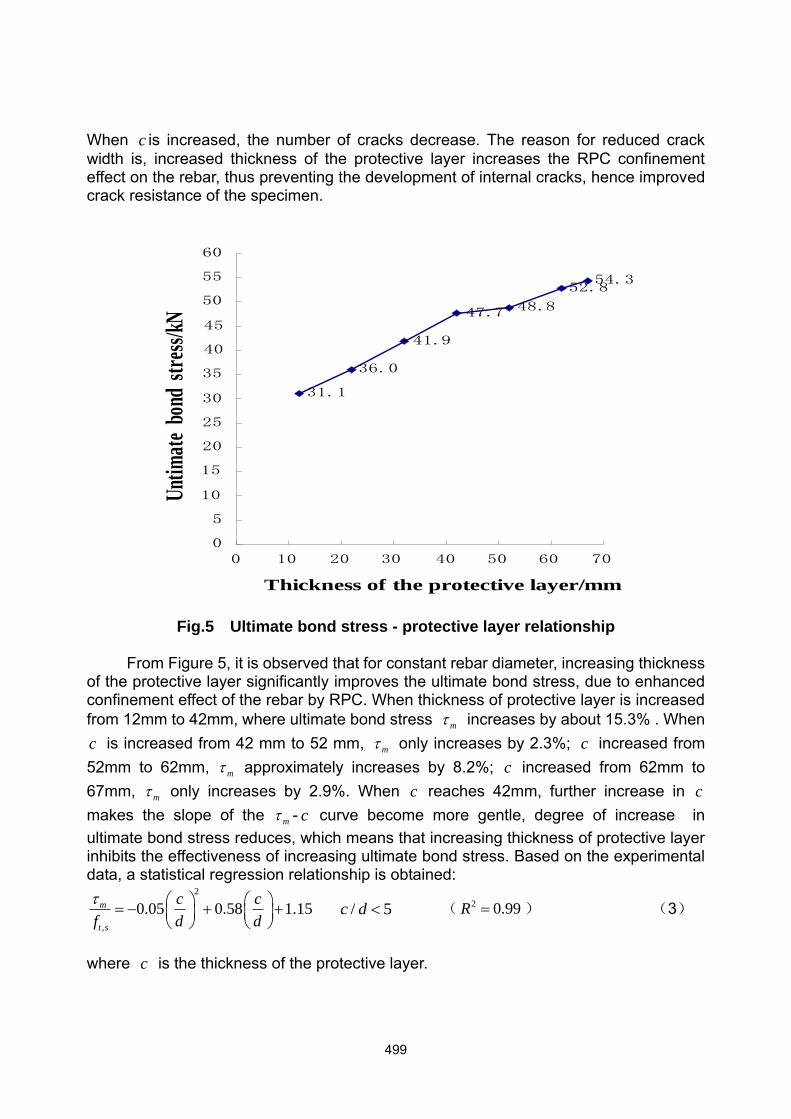
When c is increased, the number of cracks decrease. The reason for reduced crack width is, increased thickness of the protective layer increases the RPC confinement effect on the rebar, thus preventing the development of internal cracks, hence improved crack resistance of the specimen.
0
5
10
15
20
25
30
35
40
45
50
55
60
0 10 20 30 40 50 60 70
31.1
36.0
41.9
47.7 48.8
52.854.3
Thickness of the protective layer/mm
Unt
imat
e b
ond
str
ess/
kN
Fig.5 Ultimate bond stress - protective layer relationship From Figure 5, it is observed that for constant rebar diameter, increasing thickness of the protective layer significantly improves the ultimate bond stress, due to enhanced confinement effect of the rebar by RPC. When thickness of protective layer is increased from 12mm to 42mm, where ultimate bond stress m increases by about 15.3% . When c is increased from 42 mm to 52 mm, m only increases by 2.3%; c increased from 52mm to 62mm, m approximately increases by 8.2%; c increased from 62mm to 67mm, m only increases by 2.9%. When c reaches 42mm, further increase in c makes the slope of the m - c curve become more gentle, degree of increase in ultimate bond stress reduces, which means that increasing thickness of protective layer inhibits the effectiveness of increasing ultimate bond stress. Based on the experimental data, a statistical regression relationship is obtained:
2
,
0.05 0.58 1.15m
t s
c c
f d d
/ 5c d ( 2 0.99R ) (3)
where c is the thickness of the protective layer.
499

2.2.2 Plate type axial pull-out test Plate type central pullout specimens: rebar buried lengths are all 5d. When rebar diameter is 8mm, the thickness of the protective layer 6mm, 8mm, 11mm; when diameter is 10mm, the thickness of protective layer10mm, 12mm, 15mm. Pullout test for BZ-8 group specimens: specimens with 11mm thickness of protective layer exhibit higher ultimate pull out load more than that of 6mm thickness specimens by 7.1%. BZ-10 specimen group: specimens with protective layer thickness 15mm improved ultimate pullout load by 12% more than that of 10mm thick specimens. Two groups specimen thickness of the protective layers increased by 5mm, but since the c/d of 8mm rebar diameter specimens is from 0.75 to 1.38 and c/d of 10mm rebar diameter specimens is from 1 to 1.5, the degree of load increment by the latter is higher than that of the former. This means that when cd, increasing the protective layer thickness leads to more significantly improved load capacity, and the bonding performance of rebar and RPC is greatly improved. From the failure pattern it is observed that in BZ-8 specimen group, specimens with 6mm and 8mm thickness of protective layer exhibit scraping failure when the rebar are pulled out. The specimens crack along the longitudinal steel bars penetrating internally, resulting to internal damage of RPC and exposure of rebar. When 11c mm, no through cracks are observed on the specimen surface. For BZ-10 group specimens, 10c mm, rebar pulls out , annular cracks appear along the rebar but do not penetrate to extend through the specimen. According to the test results, the minimum thickness of protective layer should be greater than the rebar diameter. Based on the above analysis, and in reference to China "Design of concrete structures”, GB 50010-2010 [12], it is recommended that the minimum thickness of the protective layer c , of plate type members should be 10mm, when d <10mm; or c d , when d 10mm. Since the rebar diameter in column or beam is generally large and the failure model of prismatic type central pull-out specimen with c =12mm is complete splitting, it is recommended that the minimum thickness of protective layer should be the greater value between d and 15mm. 2.3 Effect of rebar diameter on bonding properties
When rebar buried length increases to 3d, the ultimate bond stress does not decrease with increasing diameter. From Figure 6, bond stress at descending segment of bond-slip curve decrease slows with increase in diameter. When diameter d 16mm, post peak bond stress decreases slightly, and then increases again with increase in the amount of slip, but to a lesser extent. This shows that when rebar diameter is greater than 16mm, bonding properties between high strength steel rebar and RPC are greatly improved.
500

2
y4
y s y
dF f A f
0
10
20
30
40
50
60
0 2 4 6 8 10 12 14 16 18 20
Free end initial slip/mm
Lo
ad
/MP
a LZ-8-24LZ-10-30LZ-16-48LZ-18-54
Fig. 6 Varying diameters bond-slip curves 3 CRITICAL ANCHORAGE LENGTH Steel rebar reaches the yield strength and the free end slip is zero, the corresponding buried length is defined as critical anchorage length. Rebar yield tension force Fy is: (4) The total bonding force at critical anchorage length is:
m a uF dl (5) With y mF F , the critical anchorage length al is :
4
y
a
u
f dl
(6)
where
yf is yield strength of HRB500, sA is section-area of rebar, mF total bond force
at critical anchorage length, al critical anchorage length, u bond strength.
501
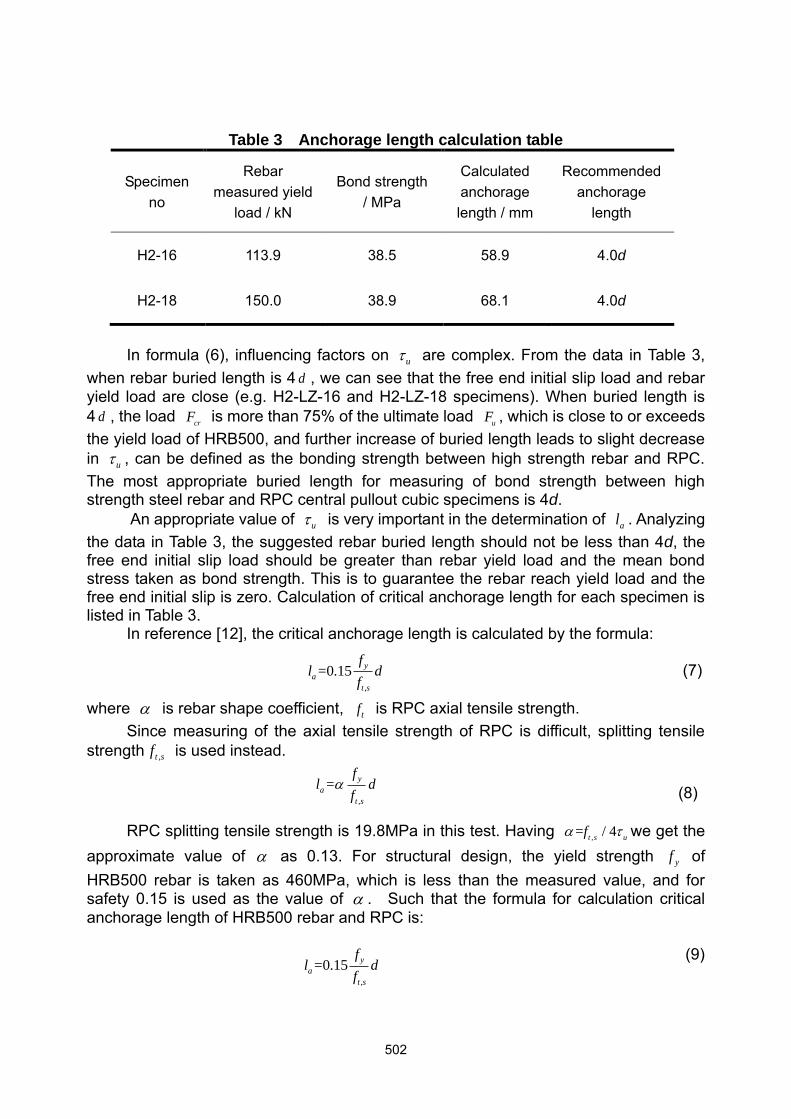
Table 3 Anchorage length calculation table
Specimen no
Rebar measured yield
load / kN
Bond strength / MPa
Calculated anchorage length / mm
Recommended anchorage
length
H2-16 113.9 38.5 58.9 4.0d
H2-18 150.0 38.9 68.1 4.0d
In formula (6), influencing factors on u are complex. From the data in Table 3, when rebar buried length is 4 d , we can see that the free end initial slip load and rebar yield load are close (e.g. H2-LZ-16 and H2-LZ-18 specimens). When buried length is 4 d , the load
crF is more than 75% of the ultimate load
uF , which is close to or exceeds
the yield load of HRB500, and further increase of buried length leads to slight decrease in u , can be defined as the bonding strength between high strength rebar and RPC. The most appropriate buried length for measuring of bond strength between high strength steel rebar and RPC central pullout cubic specimens is 4d. An appropriate value of u is very important in the determination of al . Analyzing the data in Table 3, the suggested rebar buried length should not be less than 4d, the free end initial slip load should be greater than rebar yield load and the mean bond stress taken as bond strength. This is to guarantee the rebar reach yield load and the free end initial slip is zero. Calculation of critical anchorage length for each specimen is listed in Table 3. In reference [12], the critical anchorage length is calculated by the formula: (7) where is rebar shape coefficient, tf is RPC axial tensile strength. Since measuring of the axial tensile strength of RPC is difficult, splitting tensile strength ,t sf is used instead. (8) RPC splitting tensile strength is 19.8MPa in this test. Having
,= / 4
t s uf we get the
approximate value of as 0.13. For structural design, the yield strength yf of HRB500 rebar is taken as 460MPa, which is less than the measured value, and for safety 0.15 is used as the value of . Such that the formula for calculation critical anchorage length of HRB500 rebar and RPC is:
(9)
,
=0.15y
a
t s
fl d
f
,
=y
a
t s
fl d
f
,
=0.15y
a
t s
fl d
f
502

4 CONCLUSIONS
(1) Rebar buried length is the main factor that influences the bonding properties between high strength rebar and RPC. Increase in rebar buried length leads to increase in ultimate pull-out load
uF and the free end initial slip load
crF , while ultimate bond
stress m and peak load slip us reduce. When buried length increases from 3d to 4d, load decreases faster after peak load, and then increases again. when buried length increases to 5d, the rebar exhibits pull fracture module.
(2) The central pullout test results of prismatic specimen shows that: when the thickness of the protective layer is increased, the number of cracks and crack width reduce, load-slip curves descending segment becomes gentle, and
uF and us
increase. The plate-type central pull-out test is used to determine the minimum thickness of the protective layer, and the protective layer thickness should be more than the rebar diameter, in order to guarantee good bonding between rebar and RPC.
(3) As rebar diameter increases, load-slip curve descending segment becomes gentle, then a secondary ascending segment appears when diameter exceeds 16mm, the tension force can be maintained at a high level, which displays better performance of bonding properties.
(4) Compared with ordinary strength concrete, the load-slip curve of high strength rebar and RPC, the ascending segment is quite steep while the descent stage is a little gentle.
(5) The relationships between ,
/m t s
f and /l d , and ,
/m t s
f and /c d were established through statistical analysis of the experimental data and the formula for critical anchorage length was suggested. The most appropriate buried length for the test measurement of bonding strength is 4d.
References
[1] Roux N, Andrade C, and San Juan M. (1996), “Experimental study of durability of reactive powder concretes,” J Mat. Civil Eng ASCE, 8(1), 1–6.
[2] Liu Juanhong, Song Shaomin, Wang Lin (2009), “Durability and micro-structure of reactive powder concrete,” J Wuhan Univ Technol(Materials Science Edition), 24 (3):506-509.
[3] Saleem M,Mirmiran A,Xia J and Mac kie K (2012), “Development length of high-strength steel rebar’s in ultra-high performance concrete,” J Mat. Civil Eng., 129(6):725 -732.
[4] Harajli M H (2004), “Comparison of bond strength of steel barsin normal and high strength concrete,” J Mat. Civil Eng., 16(4) : 365-374.
[5] Mahesh Maroliya(2012), “Bond strength of reactive powder concrete containing steel fiber and silica fume,” IJETAE., 2(10):2250-2459.
[6] A. Toree- Cassanova , L. Jason, L Davenne, X. Pinelli (2013), “Confinement effect on the steel concrete bond strength and pull out failure,” Eng Frac Mech., 97: 92-104.
503

[7] W. Yeih, R. Huang, J. Chang, C. Yang(1997), “A pullout test for determining interface properties between rebar and concrete,” Adv Cem Based Mat.,5:57-65.
[8] Victor Y. Garas, Lawrence F. Kahn, Kimberly E. Kurtis(2009). “Short-term tensile creep and shrinkage of ultra-high performance concrete,” Cement Concrete Comp, 31:147–152.
[9] A Mingji, Zhang Meng (2007), “Experimental research of bond capability between deformed bars and reactive powder concrete,” China Railway Science, 28(2):50-54(in Chinese).
[10] Mahesh K Maroliya, Chetan D Modhera (2010), “A comparative study of reactive powder concrete containing steel fibers and recron 3S fibers,” J Eng Res Stud., 1 (1):83-89.
[11] Richard Andrew Barnes, Geofrey Charles Mays(2001), “The transfer of stress through a steel to concrete adhesive bond,” Int J Adhes Adhes., 21(6):495–502.
[12] GB 50010-2010 code for design of concrete structures, China Architecture &
Building Press(in Chinese).
Acknowledgement
This research is sponsored by the State Key Laboratory of Simulation and Regulation of Water Cycle in River Basin, China Institute of Water Resources and Hydropower Research.
504