Bondholder Wealth Effects in Joint Ventures and … ANNUAL MEETINGS/2017-Athens...Bondholder Wealth...
51
1 Bondholder Wealth Effects in Joint Ventures and Strategic Alliances Around the World Jun Chen, North Dakota State University, Email: [email protected] Tao-Hsien Dolly King, University of North Carolina at Charlotte, Email: [email protected] Xinxin Li, University of North Carolina at Charlotte, Email: [email protected]
Transcript of Bondholder Wealth Effects in Joint Ventures and … ANNUAL MEETINGS/2017-Athens...Bondholder Wealth...
1
Bondholder Wealth Effects in Joint Ventures and Strategic Alliances
Around the World
Jun Chen, North Dakota State University,
Email: [email protected]
Tao-Hsien Dolly King, University of North Carolina at Charlotte,
Email: [email protected]
Xinxin Li, University of North Carolina at Charlotte,
Email: [email protected]

2
Bondholder Wealth Effects in Joint Ventures and Strategic Alliances
Around the World
Abstract
This paper examines the bondholder wealth effects in international collaborations in the form of joint ventures and strategic alliances. Based on a sample of 3,070 Joint venture and strategic alliance event-firm observations from 2009 to 2015, we find positive and significant abnormal returns for bondholders. The average three-month abnormal bond return is 1.53% for foreign participants and 1.38% for U.S. participants. We focus on the wealth effects for the foreign bondholders and find that country level governance and national culture are dominant drivers of bondholder gain. Results of various robustness tests and subsample analyses confirm the main findings. Additionally, we find little evidence for a wealth transfer between stockholders and bondholders of the foreign participants. However, when a joint venture or strategic alliance leads to a loss for the participant, it is likely to be shared between the bondholders and stockholders.
3
1. Introduction
Literature suggests that ownership restructuring activities, such as mergers and
acquisitions, spin-offs, or privatizations, play an important role in business operations. A
growing line of research focuses on another type of organizational restructuring, namely joint
ventures (JV) and strategic alliances (SA), which have been recognized to exert substantial
impacts on firm performance and create significant value. Joint ventures are established
through formal arrangements involving equity ties (Amici et al., 2013), resulting a separate legal
entity. On the other hand, strategic alliances are voluntary arrangements among firms involving
exchanges, sharing, or co-development of products, technologies, or services (Gulati, 1998).
Both forms of collaboration allow firms to utilize resources from cooperative partners without
giving up control of their own operations (Chan et al., 1997). The motivations for international
JV and SA, similar to the motivations for capital flows between countries (Keown et al., 2015),
are to obtain returns that are higher than those that could be obtained in the domestic markets
and to reduce risk through international diversification. While past research has advanced the
idea that national culture and country-level governance matter in corporate decisions on
financing and operations (e.g., LaPorta et al. (1997, 1998) and Stulz and Williamson (2003)),
what remains unknown is whether and how these country-level mechanisms play a role in
international JV and SA. Particularly, in this paper we empirically examine how national culture
and country-level governance affect the value creation of international JV and SA activities.
A substantial body of previous research focuses on shareholder wealth effects in
domestic joint ventures and strategic alliances. McConnell and Nantell (1985) and Johnson and
Houston (2000) document positive stockholder wealth effects associated with joint venture
announcements. Chan et al. (1997) find that strategic alliances create shareholder value at the

4
announcement and that the participants experience an improvement in operating performance
afterwards. Allen and Phillips (2000) demonstrate that strategic alliances, joint ventures, and
other product market relationships, in conjunction with block ownership lead to a significant
increase in stock price, profitability, and operating performance. Krishnaswami et al. (2004)
show that strategic alliances alleviate the capital constraints of small, high-growth firms and
that the partnership announcements lead to significantly positive market reactions. Ivanov and
Lewis (2009) find that IPO firms with alliances that commence before the offering tend to
obtain greater IPO valuations, invest more, and have higher growth than other IPO firms.
Merchantt and Schendel (2000) examine the conditions under which the announcements of
international joint ventures lead to increases in shareholder value of U.S. participants. They find
that partner-venture business relatedness, the pursuit of R&D-oriented activity, greater equity
ownership, and larger firm size, have a positive impact on value creation. However, no support
is found for the hypothesized effect of cultural relatedness and political risk. Chang et al. (2008)
investigate the wealth impacts for Japanese and US firms in strategic alliances and find that on
average, both Japanese and U.S. shareholders benefit from the formation of international
alliances. They also find that shareholders earn larger abnormal returns when the partnering
firms are smaller in size, have higher growth opportunities, or are less profitable. Chiou and
White (2005) examine the shareholder wealth effects of financial institutions’ strategic alliances
and present evidence of value creation, especially for smaller partners. However, they do not
find a significant difference in abnormal return between domestic-foreign and domestic-
domestic alliances. Interestingly, Amici et al. (2013) find that international strategic alliances
tend to destroy shareholder value. Using a sample of European and US banks, they find that the
abnormal stock returns associated with these joint ventures and strategic alliances vary: joint
5
ventures involving non-financial partners or those allowing banks to expand abroad are able to
create shareholder value.
As a stark contrast, little research has been done to examine bondholder reaction
associated with JV and SA deals. Chen et al. (2015) is the one of a few studies that focus on
bondholder wealth effects and find positive and significant bond price reactions to JV and SA
announcements, suggesting an increase in bondholder wealth. They find that bond abnormal
returns can be explained by synergy, alleviation of financial constraints, and real option effects.
Chou et al. (2014) examine the yield spreads of newly issued bonds for SA firms.
In this study, we examine the bondholder wealth effects for non-U.S. (foreign)
companies in global collaborative activities of JV and SA. To our knowledge, very few studies
have examined the wealth effects for foreign participants, and they are limited to shareholder
reactions. To be specific, Amici et al (2013) use US and European banks, while Chiou and White
(2005) use data from the Japanese financial sector. To our knowledge, we are the first to
explore the claimholder wealth effects of foreign participating firms in JV and SA. With the
inclusion of foreign-U.S. and foreign-foreign deals, we are able to conduct a comprehensive
study of global business collaborations by examining their impacts on claimholder returns and
the channels of such value creation. In addition, we explore a sample of companies that span
across various industries, rather than limited to financial institutions. This paper examines
claimholder reactions to announcements of international JV and SA, with the emphasis on
bondholder wealth effects. We aim to explore the following research questions: 1) Do
international joint ventures and strategic alliances create value for investors, especially,
bondholders? 2) If there are significant wealth effects, what are the determinants? We
particularly focus on whether country-level cultural and governance dimensions are drivers of

6
wealth effects, and 3) What role does wealth transfer effect play, if any, in value creation?
We first document significantly positive abnormal returns for bondholders and
stockholders of foreign companies following the announcements of global JV and SA.
Interestingly, bondholders experience larger abnormal returns than stockholder: for example,
the average 3-month abnormal return is 1.53% for bondholders and 0.64% for stockholders.
Next, we focus on bondholder reaction and its determinants. We test two main determinants:
country-level governance using the world governance and investor protection indices, and
national culture using the Hofstede’s cultural dimension and trust. We find that a country’s
cultural and governance dimensions explain a significant portion of the bondholders gain. More
specifically, bondholders benefit more from JV and SA if they are from countries with poorer
country-level governance, stronger creditor protection, and lower shareholders protection. In
addition, bondholders gain more when they are from countries with a culture characterized
with a higher level of trust, greater individualism, more short-term orientation, more
masculinity, and less power distant. Lastly, we test for potential wealth transfer between
bondholders and stockholders. It is possible that some of the bondholder gain can be attributed
to a wealth transfer from stockholders. We find a positive significant correlation between
bondholder and stockholder abnormal returns, indicating little support for a wealth
redistribution effect from shareholders to bondholders. However, a closer examination reveals
an interesting phenomenon: The correlation between abnormal bond and stock returns is low
for firms with a positive bondholder gain, while the correlation between abnormal bond and
stock returns is high for firms with a negative abnormal bond return. In other words, when
bondholders experience a loss, shareholders are very likely to experience a loss as well. On the
other hand, when bondholders gain, there is a small likelihood that stockholders also have a

7
favorable reaction.
We contribute to the finance literature in the following ways. First, this paper is the one
of first studies to employ a large sample of international JV and SA activities spanning across 24
countries and multiple industries to examine the bondholder wealth effects, especially for the
foreign participants. Second, domestic firms now look beyond country borders in the search of
profits. With a rising globalization of international portfolio and direct investment, two
unanswered, urgent questions need to be addressed: study for foreign participants in JV and SA
activities, and study of how bondholders behave in the cooperative activities. Both are essential
to the matter of globalization. With the focus on bondholder wealth for foreign participants,
our paper tries to provide answers to the questions and explores them in depth. Third, our
paper adds evidence that institutional environment, i.e., culture and country-level governance
matter in corporate restructuring, in particular, JV and SA activities.
The remainder of the paper is structured as follows. In Section 2, we propose the
testable hypotheses. Section 3 describes the sample collection process, model specification,
and the construction of main variables of interest. Section 4 presents the multivariate results.
Section 5 concludes.
2. Hypotheses development
2.1. Impacts of international business cooperation on bondholders
Corporate governance at the country level: In the literature on institutional
environment, Williamson (2000) focuses on the roles of institutions, i.e., new institutional
economics. He defines institutions as structures or mechanisms of social order, rules, and
processes that establish boundaries of behavior and specify environment in which economic
8
activities occur. Williamson (2000) argues that institutions matter. LaPorta et al. (1997, 1998)
show that countries with poorer investor protection, measured by the legal environment and
the quality of law enforcement, have smaller and limited capital markets. These finding apply to
both equity and debt markets. In particular, French civil law countries, compared to common
law countries, have both the weakest investor protection and the least developed capital
markets. Corporate governance consists of both country-level and firm-level mechanisms. Firm-
level or internal governance mechanisms are those that operate within the firm. Klock et al.
(2005) find that shareholder protection provisions at the firm level lower the cost of debt.
Country-level governance mechanisms include a country’s laws and the institutions that
enforce the laws. Aggarwal et al. (2009) construct a firm-level governance index that increases
with minority shareholder protection. For each country, they calculate the country-level
governance score by averaging the firm-level governance indices. Their findings suggest that in
non-U.S. countries, foreign institutions from countries with strong shareholder protection play
a role in promoting and improving governance. Desai et al. (2004) argue that tax penalties in
foreign countries are one of the reasons that US firms hesitate to engage in international
partnerships.
Following the literature, we adopt three measures for country level governance: the
World Governance Index (WGI) published by the World Bank (Kaufmann et al. (2010)), the
corrected Anti-director Rights Index (ADRI) introduced by Spamann (2010), and the Strength of
Legal Rights Index (SLRI) from the World Bank. We hypothesize as follows. A higher WGI
indicates stronger country-level governance, implying a less risky business environment and
stronger protection for claimholders. As JV and SA are anticipated by investors to reduce firm

9
risk1, we hypothesize that bondholders of firms from a low-WGI nation benefit more from JV
and SA activities than those from a high-WGI countries. Similarly, bondholder gain should be
positively related to the difference in WGI between the participant’s nation and the nation in
which the JV or SA is set up. For the Anti-director Rights Index, previous literature suggests that
the effects of shareholder protection on bondholder reaction are mixed. Miller et al. (2011) find
that strong country-level shareholder rights do not necessarily lead to unfavorable effects for
bondholders. Using a sample of bank mergers, Ongena et al. (2009) suggest that bondholders
experience higher abnormal returns when the country of the partner bank has stricter rules in
relation to the forbearance of prudential regulations than its own country. Focusing on U.S.,
firms, Cremers et al. (2007) and Li and Wang (2016) investigate the effects of shareholder
governance mechanisms on bond returns and find that without bond covenants shareholder
and bondholder interests diverge. We hypothesize that for foreign firms involving in
international JV and SA deals, stronger shareholder protection (higher ADRI) should be
associated with lower bondholder returns. SLRI measures the degree to which collateral and
bankruptcy laws protect the rights of borrowers and lenders. We use SLRI as a proxy for
country-level bondholder protection. We expect that stronger creditor protection should lead
to higher abnormal bond returns at the announcements of international collaborations.
Culture: A growing body of research shows that culture has a strong impact on
corporate decisions and exhibits a causal link to economic outcomes of such decisions. Stulz
1 A fundamental motivation for cooperative alliances is the reduction of risk through risk
sharing (Harrigan 1988; Sheth and Parvatiyar 1992; Pan and Tse 1996). Kogut and Singh
(1988) shows that when culture difference is large, firms tend to choose JVSA over
mergers.
10
and Williamson (2003) argue that the cultural dimension, proxied by religion and language,
cannot be ignored when one examines the cross-country variation in investor protection. They
show that a country’s principal religion predicts the cross-sectional variation in creditor rights
better than a country’s natural openness to international trade, language, income per capita, or
the origin of its legal system. Catholic countries protect the rights of creditors to a lesser extent
than protestant countries. Zheng et al. (2012) investigate the influence of national culture on
the structure of corporate debt maturity and find robust evidence that firms located in
countries with high levels of uncertainty avoidance, collectivism, power distance, or masculinity
tend to use more short-term debt. In other words, they show that national culture helps explain
the cross-country variation in debt maturity structure. Bryan et al. (2015) focus on how national
culture can be linked to the cross-country differences in the structure of executive
compensation contracts. They suggest that culture is a significant determinant of the structure
of executive compensation. Owen and Yawson (2013) use the geographic distance as a proxy
for information asymmetry cost, and find information asymmetry affects the formation of
cross-border strategic alliances by US firms. Kogut and Singh (1988) find that national culture
influences a firm’s decision on the type of cross-border partnerships: The greater the cultural
differences, the more likely a firm chooses JV or SA than merger. Another aspect of the cultural
dimension is trust. Guiso et al. (2008) indicate that lack of trust is an important factor in
explaining the puzzle of limited participation in cross-country collaborations. Duarte et al.
(2012) find that borrowers appearing more trustworthy have a higher probability of having
their loans funded, better credit scores, and lower default risk. They suggest that the
impression of trustworthiness matters in financial transactions as they predict borrower
behaviors.

11
Following the literature (e.g. Bryan et al. 2015, Ahern et al. 2015, Pevzner et al. 2015,
and Li et al. 2013), we adopt two sets of proxies to measure the cultural dimension: Hofstede’s
culture dimensions and Trust from World Values Survey. We have the following predictions for
the measures of culture. According to Hofstede (2001), Power Distance (PDI) is defined as the
extent to which the less powerful institutions and organizations within a society expect and
accept that power is distributed unequally. Individualism (IDV) stands for a society in which the
ties between individuals are loose. Uncertainty Avoidance (UAI) is defined as the extent to
which the members of institutions and organizations within a society feel threatened by
uncertain, unknown, ambiguous, or unstructured situations. Long Term Orientation stands for a
society that fosters virtue orientation towards future rewards, in particular, adaptation,
perseverance and thrift. Masculinity (MAS) stands for a society in which social gender roles are
clearly distinct: men are supposed to be assertive, tough, and focused on material success;
women are assumed to be modest, tender, and concerned with the quality of life. Collectivist
(as opposed to Individualism) societies emphasize strong informal ties among in-groups and
rely on informal networks and relationships rather than formal institutions to protect against
opportunism (Li and Zahra (2012)). Li et al. (2013) find that Individualism has a positive and
significant impact on corporate risk-taking. Zheng et al. (2012) suggest that firms located in
countries with high collectivism tend to use more short-term debt. In other words, firms from
an individualistic culture prefer risk while those from a collectivistic culture dislike risks. In
addition, Fauver and McDonald (2015) show that a higher level of individualism is associated
with greater use of debt and a lower cost of capital. Chen et al. (2015) argue that joint ventures
and strategic alliances can be viewed as a real option. Firms are able to explore potential
investments involving great uncertainty. Chan et al. (1997) suggest that strategic alliances offer

12
the participating firms an intermediary step before further commitment. Joint ventures and
strategic alliances as a relatively temporary strategy may be more attractive to firms that are
from a short-term orientated or individualistic culture. As literature suggests, we expect a
culture of less power distance, stronger individualism, more masculinity, less uncertainty
avoidance, and less long-term orientation (or short-term orientation) is associated with more
risk. Therefore, we hypothesize that bondholders of firms that are from less power distant,
individualistic, masculine, less uncertainty avoidance, and short-term orientated culture benefit
more in JV and SA activities, since investors anticipant these collaborations help reduce risk. As
to Trust, Pevzner et al. (2015) find that investor reaction to earnings announcements is
significantly higher in more trusting countries. We expect participants from more trusting
countries achieve greater bondholder gains in JV and SA activities.
2.2. Other drivers of bondholder wealth effects in JV and SA
In addition to our main two hypotheses relevant to the international deals, we include
other explanations for bondholder wealth effects in JV and SA as documented in prior
literature: synergy effect, alleviation of financial constraints, real option, and wealth transfer
effect.
Synergy effect: Previous literature has documented that synergy is attributable to
positive shareholder value (McConnell and Nantell (1985), Johnson and Houston (2000), and
Chan et al. (1997)). On the bondholders’ side, Chen et al. (2015) find that financial synergy is a
main driver of bondholder wealth effects in joint ventures, while operating synergy is a
dominant factor in strategic alliances. To test whether synergy influences bondholders gain in
international JV and SA activities. Following the literature, we adopt two measure of synergy:

13
business proximity and geographical distance. We posit that the synergy effect from JV and SA
should create value for bondholders. To be specific, greater business proximity or shorter
geographic distance should lead to larger abnormal bond returns.
Alleviation of financial constraints: Literature indicates that financial constraints are one
of the major reasons for corporate restructuring activities. Boone and Ivanov (2012) suggest
that one of the benefits of JV and SA is the alleviation of financial constraints. Through such
activities, partnering firms share resources and have a lighter burden in raising external
financing, resulting in an alleviation of financial constraints. The financial flexibility embedded
in JV and SA is valuable to bondholders because participating firms can refrain from issuing
additional debt to finance investments, which is especially valuable for financially constrained
companies. In this study, we use low dividend payout as a proxy for financial constraints, and
we posit that the abnormal bond returns due to joint venture and strategic alliances are
positively related to the extent of financial constraints.
Real option effect: Chen et al. (2015) identified JV and SA as real options as they offer
firms with the opportunity to explore potential investments involving high uncertainty with no
upfront cost and low termination cost. Such managerial flexibility embedded in the cooperative
activities “grants the participating firms a real option to delay, expand, contract, or abandon
their investments in an efficient way,” therefore the real option feature of JV and SA creates
value for bondholders of US participating firms. With such real option, JV and SA participants
can take part in risky investments without increasing its downside risk. Mansi and Reeb (2002)
suggest that a reduction in downside risk decreases the shareholder’s option value and thereby
increases the bondholder value. We test the real options hypothesis using two measures that
are positively related to risk and the value of real options: uncertainty of investment and
14
industry concentration. We expect the real option effect crease bondholder value for firms in
global JV and SA.
Wealth transfer effect: Although several papers have studied shareholders’ gain around
JV and SA, only a few studies examine both shareholder and bondholder reactions and the
potential wealth transfer between these claimholders. Despite the lack of empirical support in
the literature on JV and SA activities, wealth transfer (wealth redistribution) effect has been
vastly tested in other corporate events. Billett et al. (2004) examine the wealth effects of
mergers and acquisitions on target and acquiring bondholders in the 1980s and 1990s. They
find no evidence of wealth transfers between stocks and bonds of either target or acquiring
firms, and only a faint trace of a wealth transfer between the combined (target and acquirer)
stocks and bonds. Chow (1983) studies the impact of accounting regulations on bondholder and
stockholder wealth. He finds that the '33 Act enhances bondholder wealth. However, this effect
does not appear to be attributed to a wealth transfer from shareholders. Maxwell and Rao
(2003) find evidence consistent with the wealth expropriation hypothesis regarding
shareholders’ gain on the announcements of spin-offs. Maxwell and Stephens (2003) explore
the bondholder wealth effects associated with share repurchases, and suggest that the positive
abnormal stock returns are attributable to a signaling effect and wealth redistribution from
bondholders to stockholders. Handjinicolaou and Kalay (1984) examine the information content
and wealth redistribution explanations for the shareholder gains around dividend
announcements. They present evidence consistent with the information content hypothesis,
and that the gain from positive information is mainly captured by shareholders while the loss
associated with negative information is shared with bondholders. Given the extensive literature
on wealth redistribution between shareholders and bondholders in major corporate events, we

15
explore the possibility of wealth redistribution from stockholders to bondholders in our study of
international collaborations.
3. Sample construction, model specification, and univariate analysis
3.1. Sample selection
We employ multiple databases in this research. International joint venture and strategic
alliance announcements, deal information, and deal characteristics are from SDC platinum. For
foreign firms, bond prices, bond characteristics, benchmark indices, and equity prices are
collected from Datastream. Financial information is collected from Bloomberg. For US firms,
bond prices and characteristics are obtained from FISD and TRACE, and stock price data and
firm financial data are from CRPS and Compustat, respectively. We retrieve all JV and SA deals
for the period from 2009 to 2015 to arrive at the initial sample of 21,113 JV and SA deals. To be
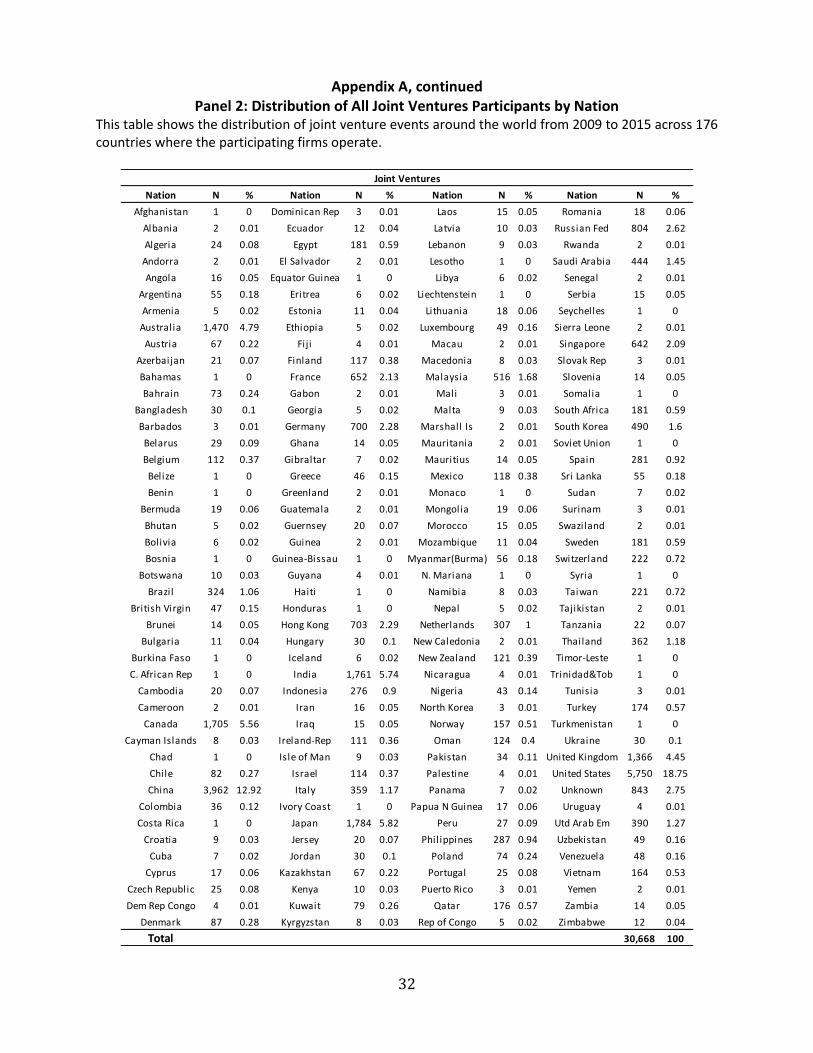
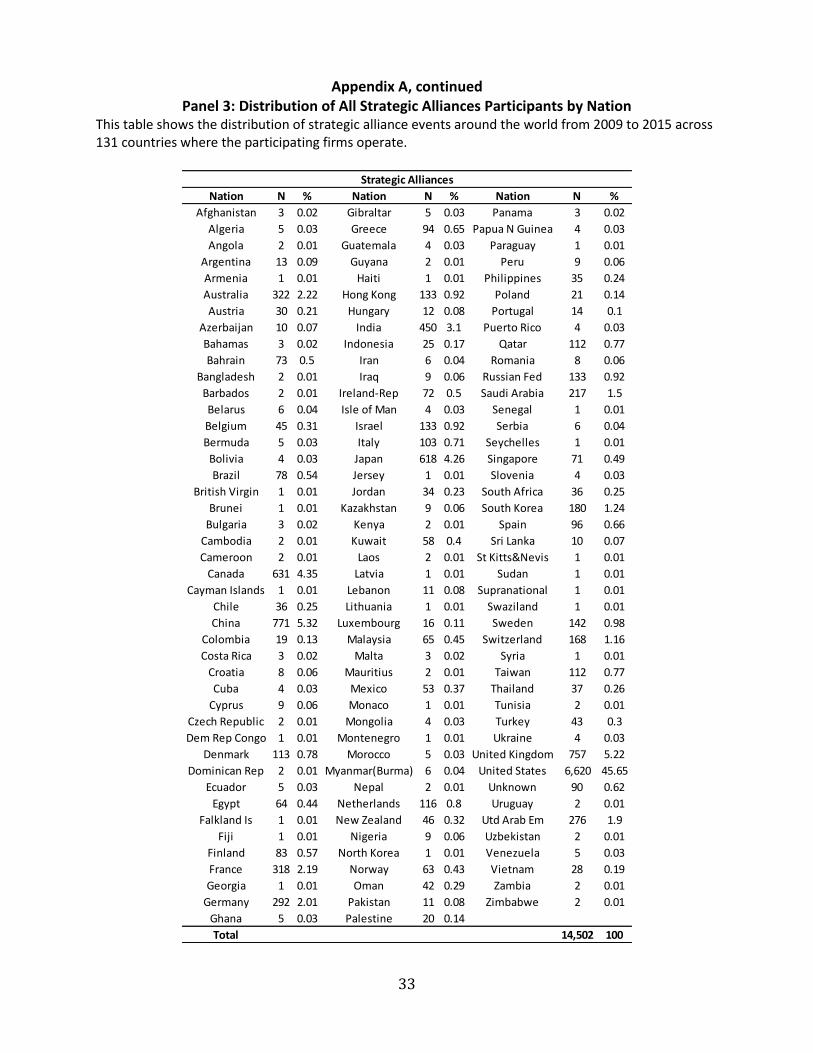
specific, 30,668 event-firm observations for joint ventures from 176 countries, and 14,502
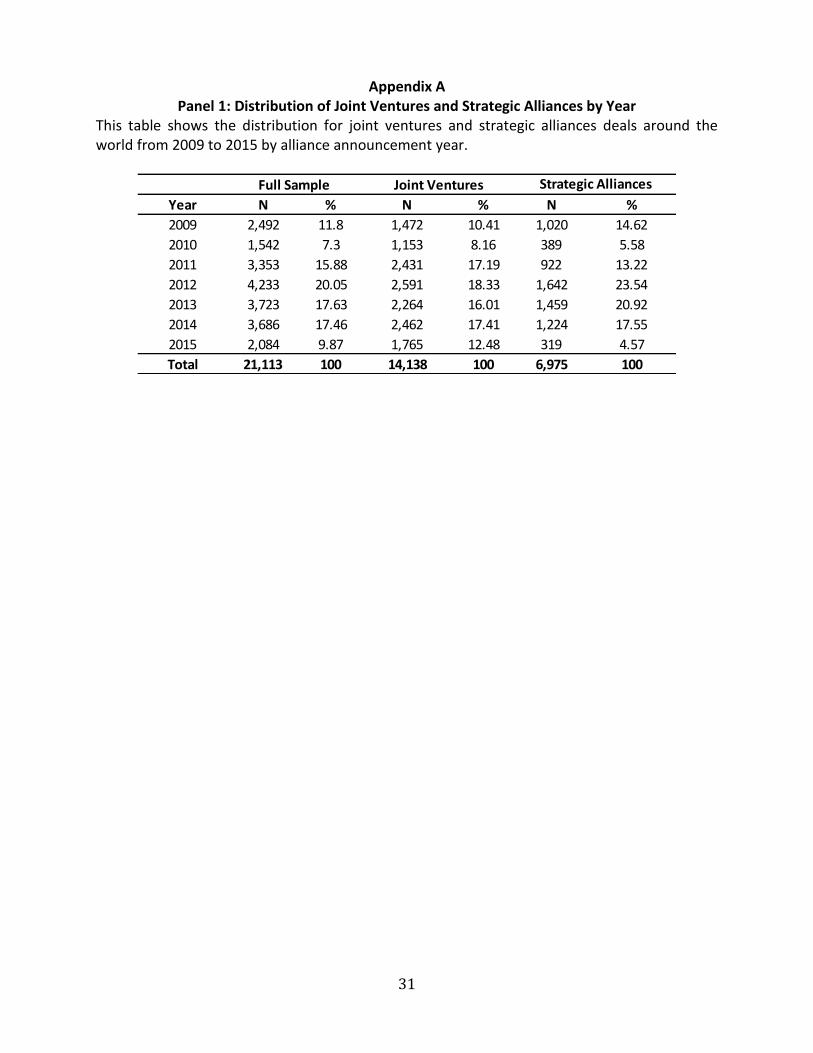
event-firm observations for strategic alliances from 131 countries. Panel 1 in A shows the
distribution at the event level by announcement year, and Panels 2 and 3 show the distribution
of event-firm observations of JV and SA by country. By requiring valid 3-month bond abnormal
returns around announcement, we arrive at 3,910 JV and SA deals of 4,889 event-firm
observations associated with 1,860 unique firms from 24 countries. Table 1 shows the
distribution of the cooperative activities in our sample. Panel A reports the number of events
by year, and Panel B shows the number of event-firms by country.
3.2. Model specification
16
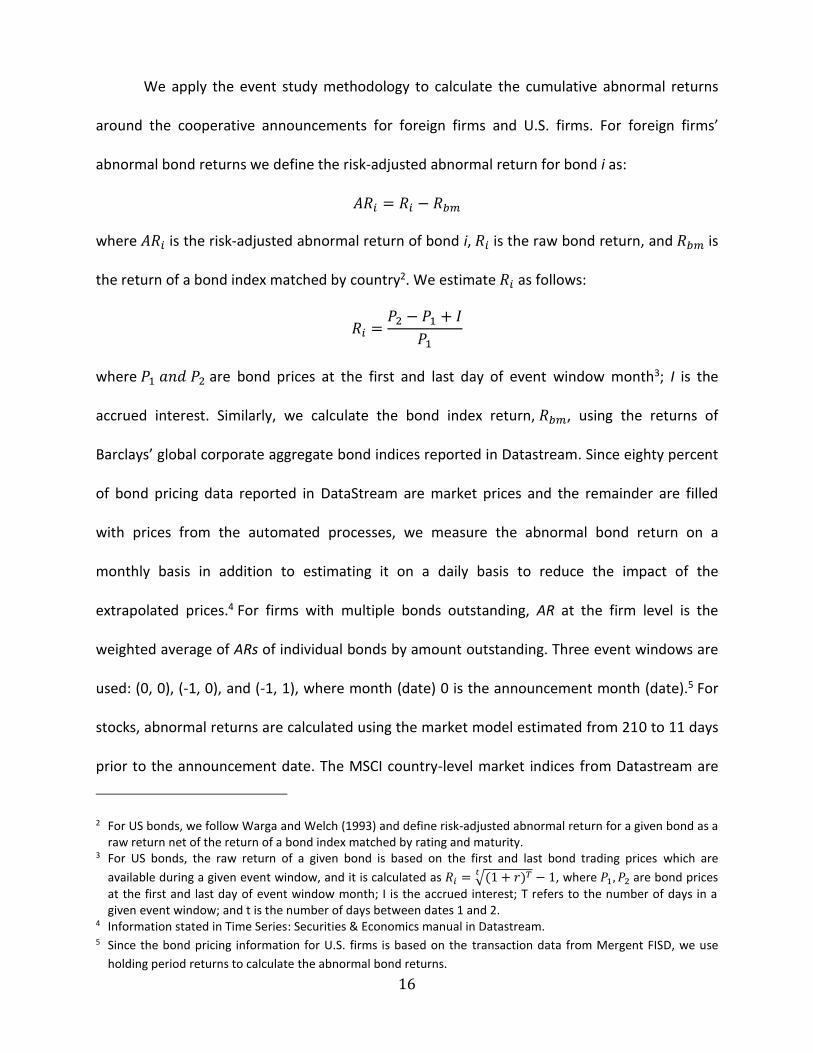
We apply the event study methodology to calculate the cumulative abnormal returns
around the cooperative announcements for foreign firms and U.S. firms. For foreign firms’
abnormal bond returns we define the risk-adjusted abnormal return for bond i as:
𝐴𝑅𝑖 = 𝑅𝑖 − 𝑅𝑏𝑚
where 𝐴𝑅𝑖 is the risk-adjusted abnormal return of bond i, 𝑅𝑖 is the raw bond return, and 𝑅𝑏𝑚 is
the return of a bond index matched by country2. We estimate 𝑅𝑖 as follows:
𝑅𝑖 =𝑃2 − 𝑃1 + 𝐼
𝑃1
where 𝑃1 𝑎𝑛𝑑 𝑃2 are bond prices at the first and last day of event window month3; I is the
accrued interest. Similarly, we calculate the bond index return, 𝑅𝑏𝑚, using the returns of
Barclays’ global corporate aggregate bond indices reported in Datastream. Since eighty percent
of bond pricing data reported in DataStream are market prices and the remainder are filled
with prices from the automated processes, we measure the abnormal bond return on a
monthly basis in addition to estimating it on a daily basis to reduce the impact of the
extrapolated prices.4 For firms with multiple bonds outstanding, AR at the firm level is the
weighted average of ARs of individual bonds by amount outstanding. Three event windows are
used: (0, 0), (-1, 0), and (-1, 1), where month (date) 0 is the announcement month (date).5 For
stocks, abnormal returns are calculated using the market model estimated from 210 to 11 days
prior to the announcement date. The MSCI country-level market indices from Datastream are
2 For US bonds, we follow Warga and Welch (1993) and define risk-adjusted abnormal return for a given bond as a raw return net of the return of a bond index matched by rating and maturity.
3 For US bonds, the raw return of a given bond is based on the first and last bond trading prices which are
available during a given event window, and it is calculated as 𝑅𝑖 = √(1 + 𝑟)𝑇𝑡− 1, where 𝑃1, 𝑃2 are bond prices
at the first and last day of event window month; I is the accrued interest; T refers to the number of days in a given event window; and t is the number of days between dates 1 and 2.
4 Information stated in Time Series: Securities & Economics manual in Datastream. 5 Since the bond pricing information for U.S. firms is based on the transaction data from Mergent FISD, we use
holding period returns to calculate the abnormal bond returns.

17
used to calculate ARs for foreign firms, and CRSP value-weighted index is used for U.S. firms. To
be consistent with bonds, we use the same monthly and daily event windows.
In the multivariate regressions, we focus on abnormal bond returns for foreign
participants and include hypotheses variables, deal characteristics, firm characteristics, bond
characteristics, and other control variables. The model is formulated as follows:
𝐶𝐴𝑅𝑖,𝑡 = 𝑏0 + 𝑏1 ∗ (𝑔𝑜𝑣𝑒𝑟𝑛𝑎𝑛𝑐𝑒)𝑖,𝑡 + 𝑏2 ∗ (𝑐𝑢𝑙𝑡𝑢𝑟𝑒)𝑖,𝑡 + 𝑏3 ∗ (𝑠𝑦𝑛𝑒𝑟𝑔𝑦)𝑖,𝑡 + 𝑏4
∗ (𝑎𝑙𝑙𝑖𝑒𝑣𝑖𝑎𝑡𝑖𝑜𝑛 𝑜𝑓 𝑓𝑖𝑛𝑎𝑛𝑐𝑖𝑎𝑙 𝑐𝑜𝑛𝑠𝑡𝑟𝑎𝑖𝑛𝑡𝑠)𝑖,𝑡 + 𝑏5 ∗ (𝑟𝑒𝑎𝑙 𝑜𝑝𝑡𝑖𝑜𝑛)𝑖,𝑡 + 𝑑
∗ 𝐷𝑒𝑎𝑙𝐶ℎ𝑎𝑟 + 𝑓 ∗ 𝐹𝑖𝑟𝑚𝐶ℎ𝑎𝑟 + 𝑏 ∗ 𝐵𝑜𝑛𝑑𝐶ℎ𝑎𝑟 + 𝑐 ∗ 𝐶𝑜𝑛𝑡𝑟𝑜𝑙𝑠 + 𝑒𝑖,𝑡
where 𝐶𝐴𝑅𝑖,𝑡 is the 3-month cumulative abnormal bond return of firm i at time t.
3.3. Abnormal bond and stock returns for foreign and U.S. participants
Table 2 reports the cumulative abnormal returns of claimholders at the announcements
of JV and SA deals. Panels A and B present the results for foreign and U.S. firms respectively.
Across the three monthly event windows, CARs for bondholders are significantly positive for
both foreign and US samples. For example, the average three-month CAR is 1.53% for foreign
firms and 1.38% for U.S. firms. These are comparable to the three-month abnormal bond return
of 1.13% for the U.S. bonds reported in Chen et al. (2015). For the foreign bonds, we also report
the results for the daily windows.6 The three-day foreign bond CAR is 0.05%, which is
insignificant7. For stockholder returns, except for the 3-month CAR for the U.S. firms, we have
positive and significant CARs across all event windows and for both foreign and U.S. firms. For
6 Note that for US firms we are not able to calculate CARs for daily windows since US bond transaction data is not
on a daily basis. 7 To be specific, the 3-day CAR of foreign bond for JV is 0.12% (significantly at the 10% level) and -0.14% for SA
(insignificant).
18
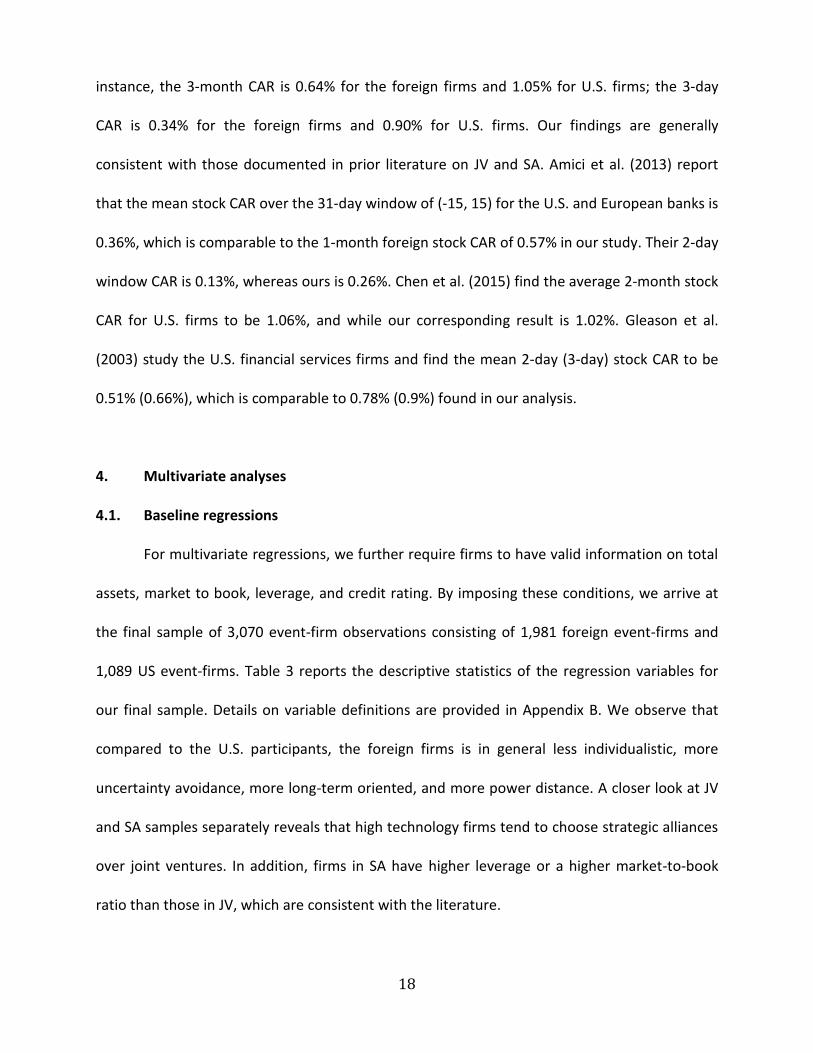
instance, the 3-month CAR is 0.64% for the foreign firms and 1.05% for U.S. firms; the 3-day
CAR is 0.34% for the foreign firms and 0.90% for U.S. firms. Our findings are generally
consistent with those documented in prior literature on JV and SA. Amici et al. (2013) report
that the mean stock CAR over the 31-day window of (-15, 15) for the U.S. and European banks is
0.36%, which is comparable to the 1-month foreign stock CAR of 0.57% in our study. Their 2-day
window CAR is 0.13%, whereas ours is 0.26%. Chen et al. (2015) find the average 2-month stock
CAR for U.S. firms to be 1.06%, and while our corresponding result is 1.02%. Gleason et al.
(2003) study the U.S. financial services firms and find the mean 2-day (3-day) stock CAR to be
0.51% (0.66%), which is comparable to 0.78% (0.9%) found in our analysis.
4. Multivariate analyses
4.1. Baseline regressions
For multivariate regressions, we further require firms to have valid information on total
assets, market to book, leverage, and credit rating. By imposing these conditions, we arrive at
the final sample of 3,070 event-firm observations consisting of 1,981 foreign event-firms and
1,089 US event-firms. Table 3 reports the descriptive statistics of the regression variables for
our final sample. Details on variable definitions are provided in Appendix B. We observe that
compared to the U.S. participants, the foreign firms is in general less individualistic, more
uncertainty avoidance, more long-term oriented, and more power distance. A closer look at JV
and SA samples separately reveals that high technology firms tend to choose strategic alliances
over joint ventures. In addition, firms in SA have higher leverage or a higher market-to-book
ratio than those in JV, which are consistent with the literature.
19
As discussed above, we focus on the foreign participants in our multivariate regressions
due to the fact that our main hypotheses refer to country-level governance and cultural
dimensions. We exclude the U.S. participants from the analysis for two reasons. First, CARs, as
the dependent variable, are calculated differently for US and foreign participants due to data
limitation. Second, we want to minimize the possible bias that could be introduced by including
a large sample of U.S. firms with the same country-level governance and cultural measures.
Considering the hypothesis measures, especially those for the governance and culture
hypotheses, we are cautious of the potential concern for multicollinearity. Table 4 reports the
correlation matrix for all hypothesis and control variables. The results show that the country-
level governance measures and some of culture proxies have relatively high correlations, which
is consistent with LaPorta et al. (1997, 1998). For example, SLRI is highly correlated with 4 out
of 5 culture measures. As a result, so we orthogonalize SLRI by regressing SLRI on each of the 4
culture measures, and use the residual of SLRI in the regressions. In addition, we employ six
regression models with each model containing a different set of proxies.
Table 5 reports the results of the baseline regressions of abnormal bond returns for
foreign participants in JV and SA activities. The dependent variable is the three-month
cumulative abnormal bond return. Model 1 through 5 each adopts one of the five culture
measures along with SLRI, while Model 6 uses ADRI. For the country-level governance
hypothesis, we find strong evidence supporting our predications. In particular, we find a
significant and negative coefficient on the World Governance Index (WGI3), a significant and
positive coefficient on SLRI across Model 1 through 5, and a significantly negative coefficient on
ADRI in Model 6. Bondholders of participants from countries with poor governance benefit
more in JV or SA deals than those from countries with strong governance. The insignificant
20
results on WGI_diff suggest that for the effects of country-level governance, the difference in
governance strength between the participant country and the country where JV or SA resides
does not matter, whilst the governance strength of the participant country matters in a
significant manner.
For the culture hypothesis, we first observe positive and significant coefficients on Trust
across all regression models, indicating that bondholders from more trusting countries gain
more in JV and SA, which is consistent with our prediction. For culture proxies, we find
significant coefficients on four out of six models. More specifically, bond abnormal returns are
negatively related to power distance and long-term orientation, and positively related to
individualism and masculinity. These findings are consistent with our culture hypothesis that
bondholders of firms from a more risk-loving culture are likely to enjoy greater gains in
international collaborative activities. For the remaining hypotheses of synergy effect, alleviation
of financial constraint, and real option, we find little evidence suggesting that any of these
factors help explain the abnormal bond returns of foreign participants after we consider the
country-level governance and culture measures. The results suggest that for foreign firms in
international JV and SA deals, bondholder wealth effects are mainly driven by country-level
institutional environment.
4.2. Subsample analyses
In this section, we divide the foreign sample into different sets of subgroups base on
certain deal, firm, and bond characteristics. In particular, we perform the following subsample
analyses: same- versus multiple-nation deals, frequent versus infrequent participants, and
speculative- versus investment-grade bonds.
21
Same- versus multiple-nation deals: Same-nation deals are those in which all
participants are from the same country, whereas multiple-nations deals are the remainder. The
aforementioned results on the country-level governance measures suggest that bondholder
wealth effects are mainly driven by the governance strength of the participant’s country rather
than the difference in governance strength between the participant country and the country in
which JV or SA is established. Therefore, we expect that country-level governance should have
more pronounced impacts on bondholder wealth in the same-nation deals than in the multiple-
nations deals. In addition, we expect the culture dimension to play an important role in the
multiple-nation deals, but not in the same-nation deals. Table 6 reports the regression results
for the same-nation deals and multiple-nation deals separately. Consistent with our
conjectures, the results suggest that the drivers of the abnormal bond returns differ between
the two subgroups. Country-level governance proxies are more prominent in the same-nation
deals and Trust is more prominent in the multiple-nation deals. Interestingly, we observe that
the culture measures are more pronounced in the same-nation deals than in the multiple-
nation deals, which is contrary to what we expect. One possible explanation is that the culture
of the participant’s country is a more influential driver of bondholder wealth effects than the
difference in culture among JV or SA participants –similar to what we found of that in country
governance.
Frequent versus infrequent participants: A common phenomenon in the joint venture
and strategic alliance activities is that some firms are frequent players that participate in
cooperative activities multiple times. The median number of times a firm participates in either
JV or SA is 6 in our sample. Lindsey (2008) finds that alliances are more frequent among
companies sharing a common venture capitalist. We conjecture that the firm characteristics or

22
motives of the frequent participants may be different from those of the infrequent participants.
As a result, the determinants for bondholder wealth effects could vary between the two
subsamples. We define the frequent participants as the firms that appear in more than six deals
during our sample period, and the remaining firms are regarded as the infrequent participants.
For frequent participants, its country governance may not matter as much as for the infrequent
participants who are novice in the JV and SA markets. On the other hand, trust may exert a
strong influence on frequent participants as reputation has been established from past
participation. Therefore, we expect that country-level governance measures have a more
pronounced impact for infrequent participants, while Trust is more prominent for frequent
participants. Table 7 presents results that are mostly consistent with our predictions. In
particular, WGI3 and ADRI are important for infrequent participants but not for frequent
participants, SLRI matters in both subsamples but has larger coefficients in infrequent
participants. Trust plays a significant role in determining bondholder gain in frequent
participants but not in infrequent participants.
Speculative- versus investment-grade: Bond rating has been well documented to have
influence on bond value (e.g., Kliger and Sarig (2000) and Elliott et al. (2009)). It serves as an
important measure of credit quality. We hypothesize that country-level governance matters
more in speculative grade than investment grade firms because speculative grade bondholders
benefit more from the additional protection that the country-level governance provides. Table
8 repots the results for the speculative-grade bonds and investment-grade bonds separately.
We see that WGI3 is significant at the 1% level across 5 models in the speculative-grade
subsample, but not significant for investment-grade subsample. SLRI is significant in both
subsamples but the magnitude of the coefficients is much larger for the speculative-grade
23
regressions than those for the investment-grade models. These findings are consistent with our
predictions stated above.
4.3. Robustness tests
We conduct several robustness tests on the baseline regressions of bondholder wealth
effects around the announcements of JV and SA. First, in the baseline regression, we use the
bond information of the parent company if the participant bond(s) has missing return data.
Panel A of Table 9 reports the baseline regressions after excluding the observations using
parent companies. We find that the results on the two main hypotheses remain robust. The
coefficients on the three governance measures and Trust remain significant and are larger in
magnitude. Second, in the above analysis we employ the governance measure WGI3, which
consists of three out of six estimates in the World Governance Index (WGI) reported by the
World Bank. These three estimates (Government Effectiveness, Regulatory Quality, and Rule of
Law) are chosen as we conjecture them to be most relevant to bondholder wealth effects. As a
robustness check, we extract the first principal component (Prin1) of the six estimates of WGI
and replace WGI3 with Prin1.8 Panel B report the results, which are very similar to those of the
baseline regressions reported in Table 5. Third, when constructing the final sample, we delete
all bonds with missing credit ratings. As a robustness check, we replace the missing credit
ratings with “Not Rated” and include these observations in the regressions reported in Panel C.
Results remain generally robust across models. Forth, we include the Fama-French 49 industry
and year fixed effects. Lastly, since 50% of the firms participate in more than one JV or SA deal
during the sample period, we test to see if the results remain robust if we include each
8 We also use the average of the six estimates as an alternative measure and results remain robust.
24
participant only once. Both of the last two robustness checks yield results that are similar to
those in the baseline regressions. For reference, we report these results in Appendix C.
4.4. Wealth transfer effects
To explore the wealth transfer effects, we run a baseline regression analysis for
stockholders and present the results in Table 10. We see that for the country-level governance
measures, creditor rights (SLRI) and shareholder rights (ADRI) have significant effects on
shareholder wealth, but WGI do not seem to be a significant driver. In particular, stronger
shareholder protections and less creditor protection are associated with greater shareholder
gain. For the culture measures, Trust matters in determining shareholders’ abnormal returns.
Stockholders of firms from more trusting countries experience larger abnormal returns. Other
culture measures are significant factors as well. In general, the results are comparable to those
for bondholder wealth effects.
Section 3.3 and Table 2 show that the abnormal bond and stock returns of foreign
participants are positive and significant, however, the abnormal stock returns are smaller in
magnitude than the abnormal bond returns. It is curious that the smaller gain to shareholders
may be due to wealth redistribution to bondholders. Table 11 presents the correlations
between the cumulative abnormal bond returns and cumulative abnormal stock returns for
each of the three monthly event windows. Panel A suggests that the correlations between bond
CARs and stock CARS are positive and significant across all event windows and samples,
indicating that wealth redistribution is not likely to be a factor for bondholder gains in JV and SA
deals. We further divide the sample into a subgroup where bondholders experience a gain, and

25
a subgroup where bondholders have a loss9. The results shown in Panel B indicate that the
correlation between cumulative abnormal bond returns and cumulative abnormal stock returns
is lower for firms in the “Gain” subgroup (0.053) than that in the “Loss” subgroup (0.24). In
other words, when bondholders experience a loss, stockholders are more likely to experience a
loss along with the bondholders. On the other hand, when bondholders enjoy a gain,
stockholders are less likely to experience a gain. Similar to Handjinicolaou and Kalay (1984), our
findings suggest that when a JV or SA deal results in a loss for the claimholders of participating
firms, the loss is likely to be shared between the bondholders and stockholders. On the other
hand, when a JV or SA leads to a gain for the participants, bondholders may capture most of the
gain.
5. Conclusion
In this paper, we empirically examine the bondholders wealth effects associated with
international business collaborations in the form of joint ventures and strategic alliances. We
investigate the determinants of value creation for bondholders, and test for possible wealth
redistribution between stockholders and bondholders. Based on a comprehensive sample of
international JV and SA deals over the period of 2009-2015, we show that the cooperative
agreements create significant value for bondholders. We find that joint ventures and strategic
alliances lead to positive and significant bondholder wealth effects, which are mainly driven by
the country level governance and culture dimensions. Bondholders gain more in stronger
country-level governance and creditor protection. In addition, bondholder wealth effects are
9 We use the three-month abnormal bond return to determine the “Gain” and “Loss” subgroups.

26
larger for participants from a risk-loving culture that is more individualistic, masculine, short-
term oriented, and less power distant. We perform a variety of robustness checks and
subsample analyses and our main findings remain robust. We find little evidence for wealth
redistribution between stockholders and bondholders. Nonetheless, the results suggest when a
JV or SA deal results in a loss for the participants, the loss is likely to be shared by the
bondholders and stockholders.
To the best of our knowledge, this paper is the one of first studies to employ a large
sample of international JV and SA activities spanning across 24 countries and multiple industries
to examine the bondholder wealth effects, especially for the foreign participants. Our findings
contribute to the literature on international cooperative agreements, country-level governance,
and national culture. This study provides new and important insights into the impacts of joint
ventures and strategic alliances on claimholders and the determinants of value creation in
global joint ventures and strategic alliances.
27
References
Aggarwal, R., Erel, I., Ferreira, M. and Matos, P., 2011. Does governance travel around the world? Evidence from institutional investors. Journal of Financial Economics, 100(1), pp.154-181.
Ahern, K.R., Daminelli, D. and Fracassi, C., 2015. Lost in translation? The effect of cultural values on mergers around the world. Journal of Financial Economics, 117(1), pp.165-189.
Amici, A., Fiordelisi, F., Masala, F., Ricci, O. and Sist, F., 2013. Value creation in banking through strategic alliances and joint ventures. Journal of Banking & Finance, 37(5), pp.1386-1396.
Billett, M.T., King, T.H.D. and Mauer, D.C., 2004. Bondholder wealth effects in mergers and acquisitions: New evidence from the 1980s and 1990s. The Journal of Finance, 59(1), pp.107-135.
Bodnaruk, A., Massa, M. and Simonov, A., 2013. Alliances and corporate governance. Journal of Financial Economics, 107(3), pp.671-693.
Boone, A.L. and Ivanov, V.I., 2012. Bankruptcy spillover effects on strategic alliance partners. Journal of Financial Economics, 103(3), pp.551-569.
Bryan, S., Nash, R. and Patel, A., 2015. The effect of cultural distance on contracting decisions: The case of executive compensation. Journal of Corporate Finance, 33, pp.180-195.
Chan, S.H., Kensinger, J.W., Keown, A.J. and Martin, J.D., 1997. Do strategic alliances create value?. Journal of Financial Economics, 46(2), pp.199-221.
Chang, S.C., Chen, S.S. and Lai, J.H., 2008. The Wealth Effect of Japanese‐US Strategic Alliances. Financial Management, 37(2), pp.271-301.
Chen, J., King, T.H.D. and Wen, M.M., 2015. Do joint ventures and strategic alliances create value for bondholders? Journal of Banking & Finance, 58, pp.247-267.
Chiou, I. and White, L.J., 2005. Measuring the value of strategic alliances in the wake of a financial implosion: Evidence from Japan’s financial services sector. Journal of Banking & Finance, 29(10), pp.2455-2473.
Chou, T.K., Ou, C.S. and Tsai, S.H., 2014. Value of strategic alliances: Evidence from the bond market. Journal of Banking & Finance, 42, pp.42-59.
Chow, C.W., 1983. The Impacts of Accounting Regulation on Bondholder and Shareholder Wealth: The Case of the Securities Acts, 58Acct. REV, 485, pp.489-502.
Claessens, S. and Klapper, L.F., 2005. Bankruptcy around the world: Explanations of its relative use. American Law and Economics Review, 7(1), pp.253-283.
Cremers, K.M., Nair, V.B. and Wei, C., 2007. Governance mechanisms and bond prices. Review of Financial Studies, 20(5), pp.1359-1388.
28
Djankov, S., Hart, O., McLiesh, C. and Shleifer, A., 2006. Debt enforcement around the world (No. w12807). National Bureau of Economic Research.
Djankov, S., McLiesh, C. and Shleifer, A., 2007. Private credit in 129 countries. Journal of financial Economics, 84(2), pp.299-329.
Duarte, J., Siegel, S. and Young, L., 2012. Trust and credit: the role of appearance in peer-to-peer lending. Review of Financial Studies, 25(8), pp.2455-2484.
Elliott, W.B., Prevost, A.K. and Rao, R.P., 2009. The announcement impact of seasoned equity offerings on bondholder wealth. Journal of Banking & Finance, 33(8), pp.1472-1480.
Fang, Y., Francis, B., Hasan, I. and Wang, H., 2012. Product market relationships and cost of bank loans: Evidence from strategic alliances. Journal of Empirical Finance, 19(5), pp.653-674.
Fauver, L. and McDonald, M.B., 2015. Culture, agency costs, and governance: International evidence on capital structure. Pacific-Basin Finance Journal, 34, pp.1-23.
Gleason, K.C., Mathur, I. and Wiggins III, R.A., 2003. Evidence on value creation in the financial services industries through the use of joint ventures and strategic alliances. Financial Review, 38(2), pp.213-234.
Guiso, L., Sapienza, P. and Zingales, L., 2008. Trusting the stock market. Journal of Finance, 63(6), pp.2557-2600.
Handjinicolaou, G. and Kalay, A., 1984. Wealth redistributions or changes in firm value: An analysis of returns to bondholders and stockholders around dividend announcements. Journal of Financial Economics, 13(1), pp.35-63.
Hofstede, G. and Bond, M.H., 1988. The Confucius connection: From cultural roots to economic growth. Organizational dynamics, 16(4), pp.5-21.
Hofstede, G.H. and Hofstede, G., 2001. Culture's consequences: Comparing values, behaviors, institutions and organizations across nations. Sage.
Ivanov, V. and Lewis, C.M., 2008. The determinants of market-wide issue cycles for initial public offerings. Journal of Corporate Finance, 14(5), pp.567-583.
Johnson, S.A. and Houston, M.B., 2000. A Reexamination of the Motives and Gains in Joint Ventures. Journal of Financial and Quantitative Analysis, 35(01), pp.67-85.
Kaufmann, D., Kraay, A. and Mastruzzi, M., 2011. The worldwide governance indicators: methodology and analytical issues. Hague Journal on the Rule of Law, 3(02), pp.220-246.
Kliger, D. and Sarig, O., 2000. The information value of bond ratings. The journal of finance, 55(6), pp.2879-2902.
Klock, M.S., Mansi, S.A. and Maxwell, W.F., 2005. Does corporate governance matter to bondholders?. Journal of Financial and Quantitative Analysis, 40(4), p.693.
29
Kogut, B., 1991. Joint ventures and the option to expand and acquire. Management science, 37(1), pp.19-33.
Li, H. and Wang, Y., 2016 How do Corporate Governance Decisions Affect Bondholders?. Quarterly Journal of Finance, p.1650011.
Li, K., Griffin, D., Yue, H. and Zhao, L., 2013. How does culture influence corporate risk-taking?. Journal of Corporate Finance, 23, pp.1-22.
Li, Y. and Zahra, S.A., 2012. Formal institutions, culture, and venture capital activity: A cross-country analysis. Journal of Business Venturing, 27(1), pp.95-111.
Licht, A.N., Goldschmidt, C. and Schwartz, S.H., 2005. Culture, law, and corporate governance. International review of law and economics, 25(2), pp.229-255.
Lindsey, L., 2008. Blurring firm boundaries: The role of venture capital in strategic alliances. The Journal of Finance, 63(3), pp.1137-1168.
Malloy, C.J., 2005. The geography of equity analysis. The Journal of Finance, 60(2), pp.719-755.
Mansi, S.A. and Reeb, D.M., 2002. Corporate diversification: what gets discounted?. The Journal of Finance, 57(5), pp.2167-2183.
Mantecon, T., Liu, I. and Gao, F., 2012. Empirical evidence of the value of monitoring in joint ownership. Journal of Banking & Finance, 36(4), pp.1045-1056.
Maxwell, W.F. and Rao, R.P., 2003. Do Spin‐offs Expropriate Wealth from Bondholders?. The Journal of Finance, 58(5), pp.2087-2108.
Maxwell, W.F. and Stephens, C.P., 2003. The wealth effects of repurchases on bondholders. The Journal of Finance, 58(2), pp.895-920.
McConnell, J. and Nantell, T.J., 1985. Corporate combinations and common stock returns: The case of joint ventures. The Journal of Finance, 40(2), pp.519-536.
Miller, D.P. and Reisel, N., 2011. Do country-level investor protections affect security-level contract design? Evidence from foreign bond covenants. Review of Financial Studies, p.hhr097.
Ongena, S. and Penas, M.F., 2009. Bondholders’ wealth effects in domestic and cross-border bank mergers. Journal of Financial Stability, 5(3), pp.256-271.
Owen, S. and Yawson, A., 2013. Information asymmetry and international strategic alliances. Journal of Banking & Finance, 37(10), pp.3890-3903.
Palia, D., Ravid, S.A. and Reisel, N., 2008. Choosing to cofinance: Analysis of project-specific alliances in the movie industry. Review of Financial Studies, 21(2), pp.483-511.
Pangarkar, N., 2003. Determinants of alliance duration in uncertain environments: The case of the biotechnology sector. Long Range Planning, 36(3), pp.269-284.
30
Park, S.H. and Russo, M.V., 1996. When competition eclipses cooperation: An event history analysis of joint venture failure. Management Science, 42(6), pp.875-890.
Pevzner, M., Xie, F. and Xin, X., 2015. When firms talk, do investors listen? The role of trust in stock market reactions to corporate earnings announcements. Journal of Financial Economics, 117(1), pp.190-223.
Porta, R., Lopez‐de‐Silanes, F., Shleifer, A. and Vishny, R.W., 1997. Legal determinants of external finance. Journal of Finance, 52(3), pp.1131-1150.
Porta, R.L., Lopez-de-Silane, F., Shleifer, A. and Vishny, R.W., 1996. Law and finance (No. w5661). National Bureau of Economic Research.
Qiu, L.D., 2010. Cross-border mergers and strategic alliances. European Economic Review, 54(6), pp.818-831.
Spamann, H., 2010. The “antidirector rights index” revisited. Review of Financial Studies, 23(2), pp.467-486.
Stahl, G.K. and Voigt, A., 2008. Do cultural differences matter in mergers and acquisitions? A tentative model and examination. Organization Science, 19(1), pp.160-176.
Stulz, R.M. and Williamson, R., 2003. Culture, openness, and finance. Journal of Financial Economics, 70(3), pp.313-349.
Tosi, H.L. and Greckhamer, T., 2004. Culture and CEO compensation. Organization Science, 15(6), pp.657-670.
Uysal, V.B., Kedia, S. and Panchapagesan, V., 2008. Geography and acquirer returns. Journal of Financial Intermediation, 17(2), pp.256-275.
Zheng, X., El Ghoul, S., Guedhami, O. and Kwok, C.C., 2012. National culture and corporate debt maturity. Journal of Banking & Finance, 36(2), pp.468-488.
31
Appendix A Panel 1: Distribution of Joint Ventures and Strategic Alliances by Year
This table shows the distribution for joint ventures and strategic alliances deals around the world from 2009 to 2015 by alliance announcement year.
Year N % N % N %
2009 2,492 11.8 1,472 10.41 1,020 14.62
2010 1,542 7.3 1,153 8.16 389 5.58
2011 3,353 15.88 2,431 17.19 922 13.22
2012 4,233 20.05 2,591 18.33 1,642 23.54
2013 3,723 17.63 2,264 16.01 1,459 20.92
2014 3,686 17.46 2,462 17.41 1,224 17.55
2015 2,084 9.87 1,765 12.48 319 4.57
Total 21,113 100 14,138 100 6,975 100
Joint Ventures Strategic AlliancesFull Sample
32
Appendix A, continued Panel 2: Distribution of All Joint Ventures Participants by Nation
This table shows the distribution of joint venture events around the world from 2009 to 2015 across 176 countries where the participating firms operate.
Nation N % Nation N % Nation N % Nation N %
Afghanistan 1 0 Dominican Rep 3 0.01 Laos 15 0.05 Romania 18 0.06
Albania 2 0.01 Ecuador 12 0.04 Latvia 10 0.03 Russian Fed 804 2.62
Algeria 24 0.08 Egypt 181 0.59 Lebanon 9 0.03 Rwanda 2 0.01
Andorra 2 0.01 El Salvador 2 0.01 Lesotho 1 0 Saudi Arabia 444 1.45
Angola 16 0.05 Equator Guinea 1 0 Libya 6 0.02 Senegal 2 0.01
Argentina 55 0.18 Eritrea 6 0.02 Liechtenstein 1 0 Serbia 15 0.05
Armenia 5 0.02 Estonia 11 0.04 Lithuania 18 0.06 Seychelles 1 0
Australia 1,470 4.79 Ethiopia 5 0.02 Luxembourg 49 0.16 Sierra Leone 2 0.01
Austria 67 0.22 Fiji 4 0.01 Macau 2 0.01 Singapore 642 2.09
Azerbaijan 21 0.07 Finland 117 0.38 Macedonia 8 0.03 Slovak Rep 3 0.01
Bahamas 1 0 France 652 2.13 Malaysia 516 1.68 Slovenia 14 0.05
Bahrain 73 0.24 Gabon 2 0.01 Mali 3 0.01 Somalia 1 0
Bangladesh 30 0.1 Georgia 5 0.02 Malta 9 0.03 South Africa 181 0.59
Barbados 3 0.01 Germany 700 2.28 Marshall Is 2 0.01 South Korea 490 1.6
Belarus 29 0.09 Ghana 14 0.05 Mauritania 2 0.01 Soviet Union 1 0
Belgium 112 0.37 Gibraltar 7 0.02 Mauritius 14 0.05 Spain 281 0.92
Belize 1 0 Greece 46 0.15 Mexico 118 0.38 Sri Lanka 55 0.18
Benin 1 0 Greenland 2 0.01 Monaco 1 0 Sudan 7 0.02
Bermuda 19 0.06 Guatemala 2 0.01 Mongolia 19 0.06 Surinam 3 0.01
Bhutan 5 0.02 Guernsey 20 0.07 Morocco 15 0.05 Swaziland 2 0.01
Bolivia 6 0.02 Guinea 2 0.01 Mozambique 11 0.04 Sweden 181 0.59
Bosnia 1 0 Guinea-Bissau 1 0 Myanmar(Burma) 56 0.18 Switzerland 222 0.72
Botswana 10 0.03 Guyana 4 0.01 N. Mariana 1 0 Syria 1 0
Brazil 324 1.06 Haiti 1 0 Namibia 8 0.03 Taiwan 221 0.72
British Virgin 47 0.15 Honduras 1 0 Nepal 5 0.02 Tajikistan 2 0.01
Brunei 14 0.05 Hong Kong 703 2.29 Netherlands 307 1 Tanzania 22 0.07
Bulgaria 11 0.04 Hungary 30 0.1 New Caledonia 2 0.01 Thailand 362 1.18
Burkina Faso 1 0 Iceland 6 0.02 New Zealand 121 0.39 Timor-Leste 1 0
C. African Rep 1 0 India 1,761 5.74 Nicaragua 4 0.01 Trinidad&Tob 1 0
Cambodia 20 0.07 Indonesia 276 0.9 Nigeria 43 0.14 Tunisia 3 0.01
Cameroon 2 0.01 Iran 16 0.05 North Korea 3 0.01 Turkey 174 0.57
Canada 1,705 5.56 Iraq 15 0.05 Norway 157 0.51 Turkmenistan 1 0
Cayman Islands 8 0.03 Ireland-Rep 111 0.36 Oman 124 0.4 Ukraine 30 0.1
Chad 1 0 Isle of Man 9 0.03 Pakistan 34 0.11 United Kingdom 1,366 4.45
Chile 82 0.27 Israel 114 0.37 Palestine 4 0.01 United States 5,750 18.75
China 3,962 12.92 Italy 359 1.17 Panama 7 0.02 Unknown 843 2.75
Colombia 36 0.12 Ivory Coast 1 0 Papua N Guinea 17 0.06 Uruguay 4 0.01
Costa Rica 1 0 Japan 1,784 5.82 Peru 27 0.09 Utd Arab Em 390 1.27
Croatia 9 0.03 Jersey 20 0.07 Philippines 287 0.94 Uzbekistan 49 0.16
Cuba 7 0.02 Jordan 30 0.1 Poland 74 0.24 Venezuela 48 0.16
Cyprus 17 0.06 Kazakhstan 67 0.22 Portugal 25 0.08 Vietnam 164 0.53
Czech Republic 25 0.08 Kenya 10 0.03 Puerto Rico 3 0.01 Yemen 2 0.01
Dem Rep Congo 4 0.01 Kuwait 79 0.26 Qatar 176 0.57 Zambia 14 0.05
Denmark 87 0.28 Kyrgyzstan 8 0.03 Rep of Congo 5 0.02 Zimbabwe 12 0.04
Total 30,668 100
Joint Ventures
33
Appendix A, continued Panel 3: Distribution of All Strategic Alliances Participants by Nation
This table shows the distribution of strategic alliance events around the world from 2009 to 2015 across 131 countries where the participating firms operate.
Nation N % Nation N % Nation N %
Afghanistan 3 0.02 Gibraltar 5 0.03 Panama 3 0.02
Algeria 5 0.03 Greece 94 0.65 Papua N Guinea 4 0.03
Angola 2 0.01 Guatemala 4 0.03 Paraguay 1 0.01
Argentina 13 0.09 Guyana 2 0.01 Peru 9 0.06
Armenia 1 0.01 Haiti 1 0.01 Philippines 35 0.24
Australia 322 2.22 Hong Kong 133 0.92 Poland 21 0.14
Austria 30 0.21 Hungary 12 0.08 Portugal 14 0.1
Azerbaijan 10 0.07 India 450 3.1 Puerto Rico 4 0.03
Bahamas 3 0.02 Indonesia 25 0.17 Qatar 112 0.77
Bahrain 73 0.5 Iran 6 0.04 Romania 8 0.06
Bangladesh 2 0.01 Iraq 9 0.06 Russian Fed 133 0.92
Barbados 2 0.01 Ireland-Rep 72 0.5 Saudi Arabia 217 1.5
Belarus 6 0.04 Isle of Man 4 0.03 Senegal 1 0.01
Belgium 45 0.31 Israel 133 0.92 Serbia 6 0.04
Bermuda 5 0.03 Italy 103 0.71 Seychelles 1 0.01
Bolivia 4 0.03 Japan 618 4.26 Singapore 71 0.49
Brazil 78 0.54 Jersey 1 0.01 Slovenia 4 0.03
British Virgin 1 0.01 Jordan 34 0.23 South Africa 36 0.25
Brunei 1 0.01 Kazakhstan 9 0.06 South Korea 180 1.24
Bulgaria 3 0.02 Kenya 2 0.01 Spain 96 0.66
Cambodia 2 0.01 Kuwait 58 0.4 Sri Lanka 10 0.07
Cameroon 2 0.01 Laos 2 0.01 St Kitts&Nevis 1 0.01
Canada 631 4.35 Latvia 1 0.01 Sudan 1 0.01
Cayman Islands 1 0.01 Lebanon 11 0.08 Supranational 1 0.01
Chile 36 0.25 Lithuania 1 0.01 Swaziland 1 0.01
China 771 5.32 Luxembourg 16 0.11 Sweden 142 0.98
Colombia 19 0.13 Malaysia 65 0.45 Switzerland 168 1.16
Costa Rica 3 0.02 Malta 3 0.02 Syria 1 0.01
Croatia 8 0.06 Mauritius 2 0.01 Taiwan 112 0.77
Cuba 4 0.03 Mexico 53 0.37 Thailand 37 0.26
Cyprus 9 0.06 Monaco 1 0.01 Tunisia 2 0.01
Czech Republic 2 0.01 Mongolia 4 0.03 Turkey 43 0.3
Dem Rep Congo 1 0.01 Montenegro 1 0.01 Ukraine 4 0.03
Denmark 113 0.78 Morocco 5 0.03 United Kingdom 757 5.22
Dominican Rep 2 0.01 Myanmar(Burma) 6 0.04 United States 6,620 45.65
Ecuador 5 0.03 Nepal 2 0.01 Unknown 90 0.62
Egypt 64 0.44 Netherlands 116 0.8 Uruguay 2 0.01
Falkland Is 1 0.01 New Zealand 46 0.32 Utd Arab Em 276 1.9
Fiji 1 0.01 Nigeria 9 0.06 Uzbekistan 2 0.01
Finland 83 0.57 North Korea 1 0.01 Venezuela 5 0.03
France 318 2.19 Norway 63 0.43 Vietnam 28 0.19
Georgia 1 0.01 Oman 42 0.29 Zambia 2 0.01
Germany 292 2.01 Pakistan 11 0.08 Zimbabwe 2 0.01
Ghana 5 0.03 Palestine 20 0.14
Total 14,502 100
Strategic Alliances
34
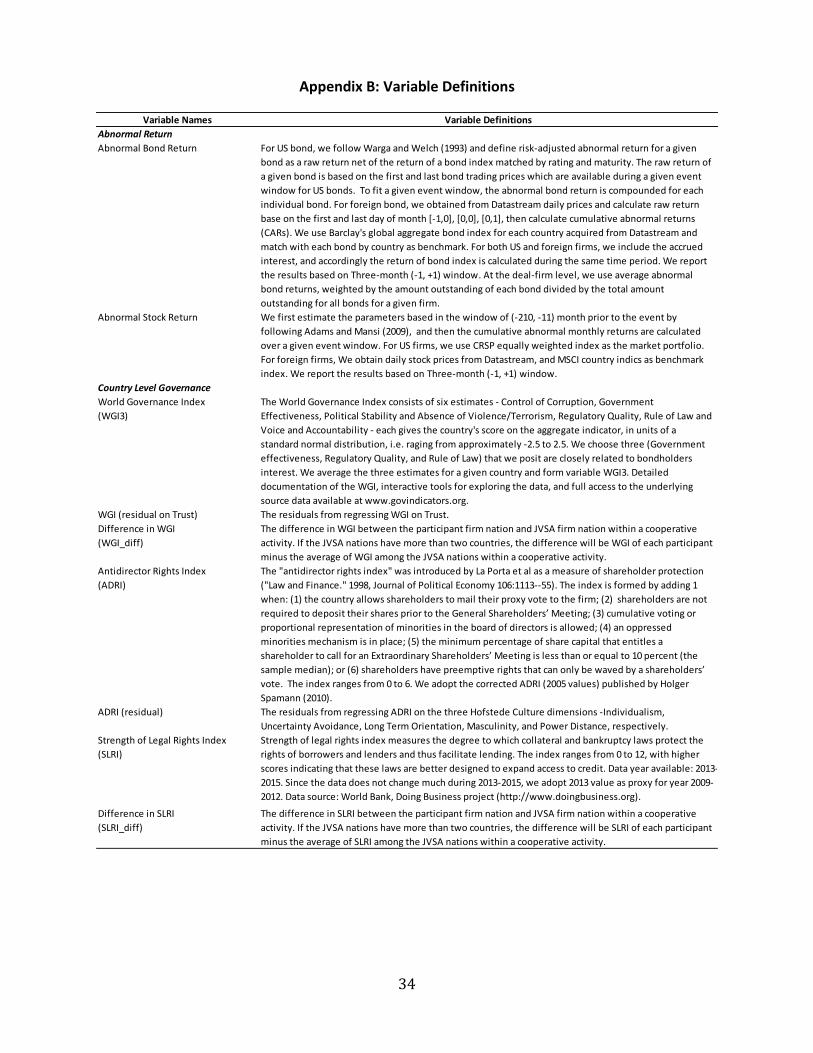
Appendix B: Variable Definitions
Variable Names Variable Definitions
Abnormal Return
Abnormal Bond Return For US bond, we follow Warga and Welch (1993) and define risk-adjusted abnormal return for a given
bond as a raw return net of the return of a bond index matched by rating and maturity. The raw return of
a given bond is based on the first and last bond trading prices which are available during a given event
window for US bonds. To fit a given event window, the abnormal bond return is compounded for each
individual bond. For foreign bond, we obtained from Datastream daily prices and calculate raw return
base on the first and last day of month [-1,0], [0,0], [0,1], then calculate cumulative abnormal returns
(CARs). We use Barclay's global aggregate bond index for each country acquired from Datastream and
match with each bond by country as benchmark. For both US and foreign firms, we include the accrued
interest, and accordingly the return of bond index is calculated during the same time period. We report
the results based on Three-month (-1, +1) window. At the deal-firm level, we use average abnormal
bond returns, weighted by the amount outstanding of each bond divided by the total amount
outstanding for all bonds for a given firm.
Abnormal Stock Return We first estimate the parameters based in the window of (-210, -11) month prior to the event by
following Adams and Mansi (2009), and then the cumulative abnormal monthly returns are calculated
over a given event window. For US firms, we use CRSP equally weighted index as the market portfolio.
For foreign firms, We obtain daily stock prices from Datastream, and MSCI country indics as benchmark
index. We report the results based on Three-month (-1, +1) window.
Country Level Governance
World Governance Index
(WGI3)
The World Governance Index consists of six estimates - Control of Corruption, Government
Effectiveness, Political Stability and Absence of Violence/Terrorism, Regulatory Quality, Rule of Law and
Voice and Accountability - each gives the country's score on the aggregate indicator, in units of a
standard normal distribution, i.e. raging from approximately -2.5 to 2.5. We choose three (Government
effectiveness, Regulatory Quality, and Rule of Law) that we posit are closely related to bondholders
interest. We average the three estimates for a given country and form variable WGI3. Detailed
documentation of the WGI, interactive tools for exploring the data, and full access to the underlying
source data available at www.govindicators.org.
WGI (residual on Trust) The residuals from regressing WGI on Trust.
Difference in WGI
(WGI_diff)
The difference in WGI between the participant firm nation and JVSA firm nation within a cooperative
activity. If the JVSA nations have more than two countries, the difference will be WGI of each participant
minus the average of WGI among the JVSA nations within a cooperative activity.
Antidirector Rights Index
(ADRI)
The "antidirector rights index" was introduced by La Porta et al as a measure of shareholder protection
("Law and Finance." 1998, Journal of Political Economy 106:1113--55). The index is formed by adding 1
when: (1) the country allows shareholders to mail their proxy vote to the firm; (2) shareholders are not
required to deposit their shares prior to the General Shareholders’ Meeting; (3) cumulative voting or
proportional representation of minorities in the board of directors is allowed; (4) an oppressed
minorities mechanism is in place; (5) the minimum percentage of share capital that entitles a
shareholder to call for an Extraordinary Shareholders’ Meeting is less than or equal to 10 percent (the
sample median); or (6) shareholders have preemptive rights that can only be waved by a shareholders’
vote. The index ranges from 0 to 6. We adopt the corrected ADRI (2005 values) published by Holger
Spamann (2010).
ADRI (residual) The residuals from regressing ADRI on the three Hofstede Culture dimensions -Individualism,
Uncertainty Avoidance, Long Term Orientation, Masculinity, and Power Distance, respectively.
Strength of Legal Rights Index
(SLRI)
Strength of legal rights index measures the degree to which collateral and bankruptcy laws protect the
rights of borrowers and lenders and thus facilitate lending. The index ranges from 0 to 12, with higher
scores indicating that these laws are better designed to expand access to credit. Data year available: 2013-
2015. Since the data does not change much during 2013-2015, we adopt 2013 value as proxy for year 2009-
2012. Data source: World Bank, Doing Business project (http://www.doingbusiness.org).
Difference in SLRI
(SLRI_diff)
The difference in SLRI between the participant firm nation and JVSA firm nation within a cooperative
activity. If the JVSA nations have more than two countries, the difference will be SLRI of each participant
minus the average of SLRI among the JVSA nations within a cooperative activity.
35
Variable Names Variable Definitions
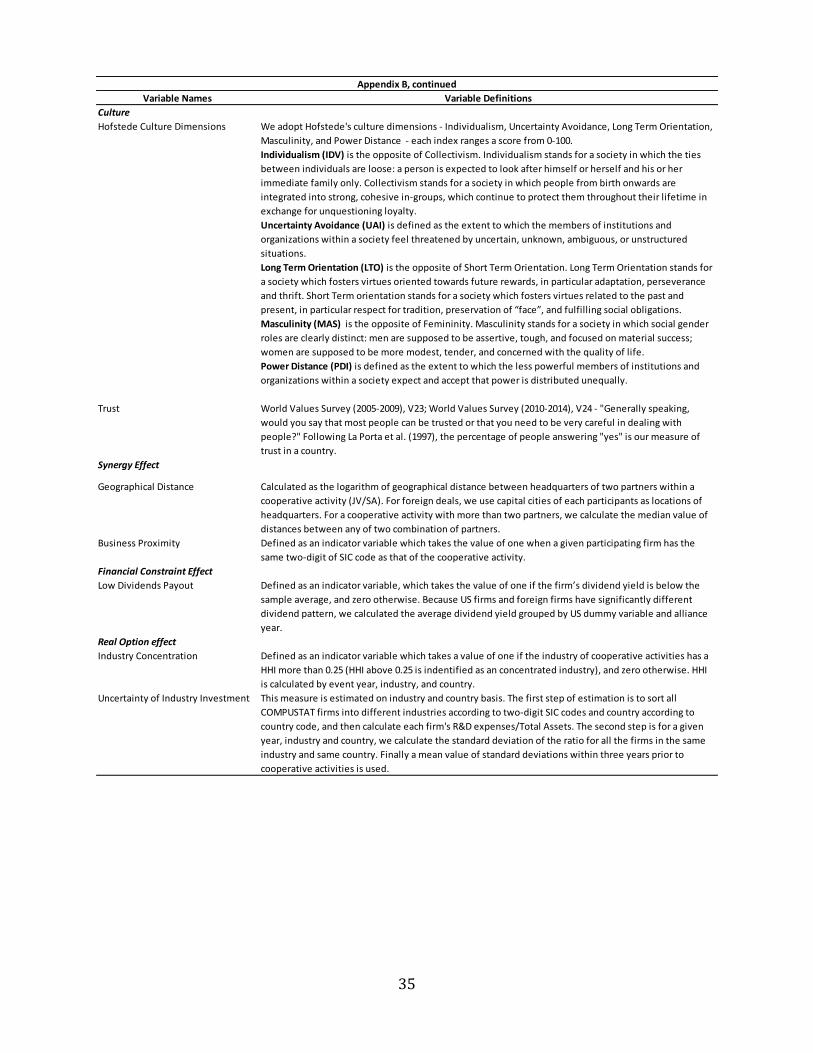
Culture
Hofstede Culture Dimensions We adopt Hofstede's culture dimensions - Individualism, Uncertainty Avoidance, Long Term Orientation,
Masculinity, and Power Distance - each index ranges a score from 0-100.
Individualism (IDV) is the opposite of Collectivism. Individualism stands for a society in which the ties
between individuals are loose: a person is expected to look after himself or herself and his or her
immediate family only. Collectivism stands for a society in which people from birth onwards are
integrated into strong, cohesive in-groups, which continue to protect them throughout their lifetime in
exchange for unquestioning loyalty.
Uncertainty Avoidance (UAI) is defined as the extent to which the members of institutions and
organizations within a society feel threatened by uncertain, unknown, ambiguous, or unstructured
situations.
Long Term Orientation (LTO) is the opposite of Short Term Orientation. Long Term Orientation stands for
a society which fosters virtues oriented towards future rewards, in particular adaptation, perseverance
and thrift. Short Term orientation stands for a society which fosters virtues related to the past and
present, in particular respect for tradition, preservation of “face”, and fulfilling social obligations.
Masculinity (MAS) is the opposite of Femininity. Masculinity stands for a society in which social gender
roles are clearly distinct: men are supposed to be assertive, tough, and focused on material success;
women are supposed to be more modest, tender, and concerned with the quality of life.
Power Distance (PDI) is defined as the extent to which the less powerful members of institutions and
organizations within a society expect and accept that power is distributed unequally.
Trust World Values Survey (2005-2009), V23; World Values Survey (2010-2014), V24 - "Generally speaking,
would you say that most people can be trusted or that you need to be very careful in dealing with
people?" Following La Porta et al. (1997), the percentage of people answering "yes" is our measure of
trust in a country.
Synergy Effect
Geographical Distance Calculated as the logarithm of geographical distance between headquarters of two partners within a
cooperative activity (JV/SA). For foreign deals, we use capital cities of each participants as locations of
headquarters. For a cooperative activity with more than two partners, we calculate the median value of
distances between any of two combination of partners.
Business Proximity Defined as an indicator variable which takes the value of one when a given participating firm has the
same two-digit of SIC code as that of the cooperative activity.
Financial Constraint Effect
Low Dividends Payout Defined as an indicator variable, which takes the value of one if the firm’s dividend yield is below the
sample average, and zero otherwise. Because US firms and foreign firms have significantly different
dividend pattern, we calculated the average dividend yield grouped by US dummy variable and alliance
year.
Real Option effect
Industry Concentration Defined as an indicator variable which takes a value of one if the industry of cooperative activities has a
HHI more than 0.25 (HHI above 0.25 is indentified as an concentrated industry), and zero otherwise. HHI
is calculated by event year, industry, and country.
Uncertainty of Industry Investment This measure is estimated on industry and country basis. The first step of estimation is to sort all
COMPUSTAT firms into different industries according to two-digit SIC codes and country according to
country code, and then calculate each firm's R&D expenses/Total Assets. The second step is for a given
year, industry and country, we calculate the standard deviation of the ratio for all the firms in the same
industry and same country. Finally a mean value of standard deviations within three years prior to
cooperative activities is used.
Appendix B, continued
36
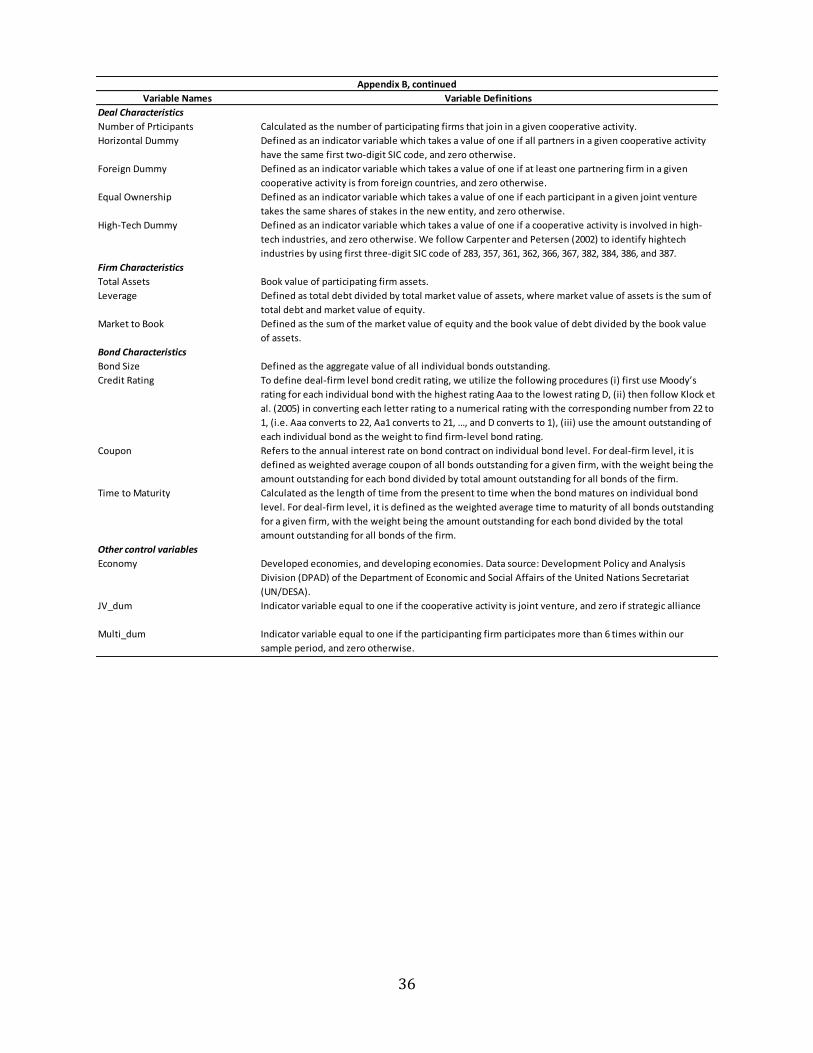
Variable Names Variable Definitions
Deal Characteristics
Number of Prticipants Calculated as the number of participating firms that join in a given cooperative activity.
Horizontal Dummy Defined as an indicator variable which takes a value of one if all partners in a given cooperative activity
have the same first two-digit SIC code, and zero otherwise.
Foreign Dummy Defined as an indicator variable which takes a value of one if at least one partnering firm in a given
cooperative activity is from foreign countries, and zero otherwise.
Equal Ownership Defined as an indicator variable which takes a value of one if each participant in a given joint venture
takes the same shares of stakes in the new entity, and zero otherwise.
High-Tech Dummy Defined as an indicator variable which takes a value of one if a cooperative activity is involved in high-
tech industries, and zero otherwise. We follow Carpenter and Petersen (2002) to identify hightech
industries by using first three-digit SIC code of 283, 357, 361, 362, 366, 367, 382, 384, 386, and 387.
Firm Characteristics
Total Assets Book value of participating firm assets.
Leverage Defined as total debt divided by total market value of assets, where market value of assets is the sum of
total debt and market value of equity.
Market to Book Defined as the sum of the market value of equity and the book value of debt divided by the book value
of assets.
Bond Characteristics
Bond Size Defined as the aggregate value of all individual bonds outstanding.
Credit Rating To define deal‐firm level bond credit rating, we utilize the following procedures (i) first use Moody’s
rating for each individual bond with the highest rating Aaa to the lowest rating D, (ii) then follow Klock et
al. (2005) in converting each letter rating to a numerical rating with the corresponding number from 22 to
1, (i.e. Aaa converts to 22, Aa1 converts to 21, …, and D converts to 1), (iii) use the amount outstanding of
each individual bond as the weight to find firm-level bond rating.
Coupon Refers to the annual interest rate on bond contract on individual bond level. For deal-firm level, it is
defined as weighted average coupon of all bonds outstanding for a given firm, with the weight being the
amount outstanding for each bond divided by total amount outstanding for all bonds of the firm.
Time to Maturity Calculated as the length of time from the present to time when the bond matures on individual bond
level. For deal-firm level, it is defined as the weighted average time to maturity of all bonds outstanding
for a given firm, with the weight being the amount outstanding for each bond divided by the total
amount outstanding for all bonds of the firm.
Other control variables
Economy Developed economies, and developing economies. Data source: Development Policy and Analysis
Division (DPAD) of the Department of Economic and Social Affairs of the United Nations Secretariat
(UN/DESA).
JV_dum Indicator variable equal to one if the cooperative activity is joint venture, and zero if strategic alliance
Multi_dum Indicator variable equal to one if the participanting firm participates more than 6 times within our
sample period, and zero otherwise.
Appendix B, continued
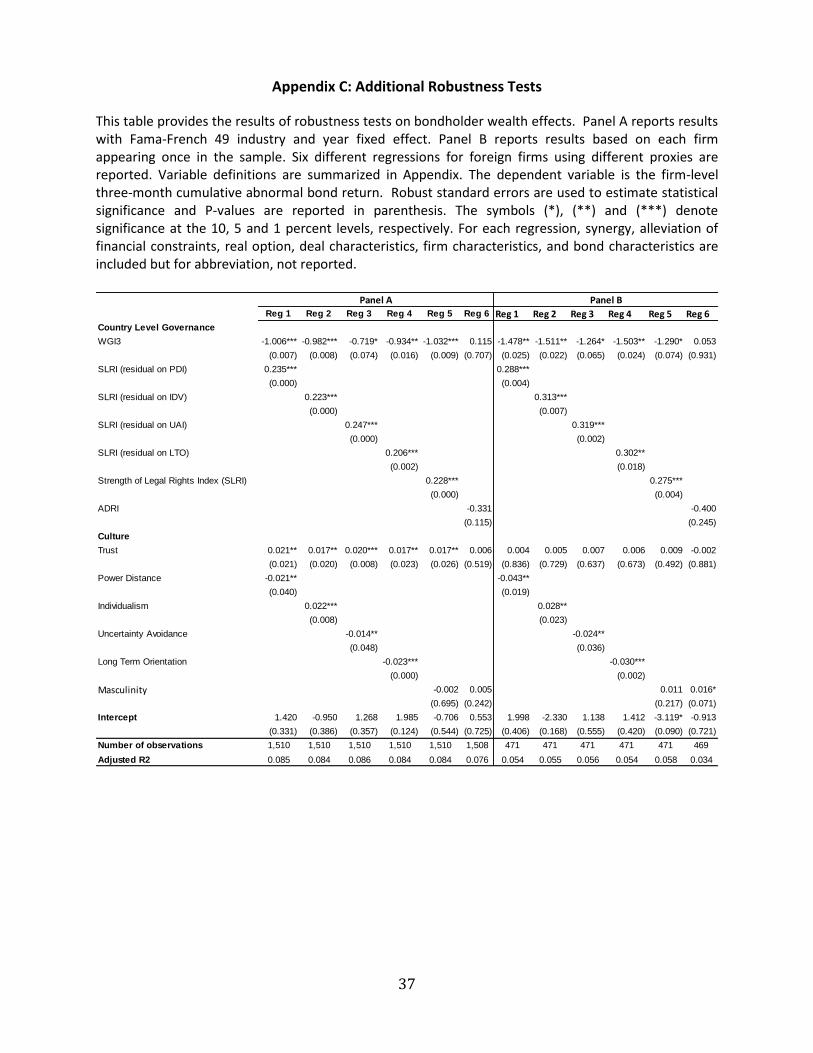
37
Appendix C: Additional Robustness Tests
This table provides the results of robustness tests on bondholder wealth effects. Panel A reports results with Fama-French 49 industry and year fixed effect. Panel B reports results based on each firm appearing once in the sample. Six different regressions for foreign firms using different proxies are reported. Variable definitions are summarized in Appendix. The dependent variable is the firm-level three-month cumulative abnormal bond return. Robust standard errors are used to estimate statistical significance and P-values are reported in parenthesis. The symbols (*), (**) and (***) denote significance at the 10, 5 and 1 percent levels, respectively. For each regression, synergy, alleviation of financial constraints, real option, deal characteristics, firm characteristics, and bond characteristics are included but for abbreviation, not reported.
Reg 1 Reg 2 Reg 3 Reg 4 Reg 5 Reg 6 Reg 1 Reg 2 Reg 3 Reg 4 Reg 5 Reg 6
Country Level Governance
WGI3 -1.006*** -0.982*** -0.719* -0.934** -1.032*** 0.115 -1.478** -1.511** -1.264* -1.503** -1.290* 0.053
(0.007) (0.008) (0.074) (0.016) (0.009) (0.707) (0.025) (0.022) (0.065) (0.024) (0.074) (0.931)
SLRI (residual on PDI) 0.235*** 0.288***
(0.000) (0.004)
SLRI (residual on IDV) 0.223*** 0.313***
(0.000) (0.007)
SLRI (residual on UAI) 0.247*** 0.319***
(0.000) (0.002)
SLRI (residual on LTO) 0.206*** 0.302**
(0.002) (0.018)
Strength of Legal Rights Index (SLRI) 0.228*** 0.275***
(0.000) (0.004)
ADRI -0.331 -0.400
(0.115) (0.245)
Culture
Trust 0.021** 0.017** 0.020*** 0.017** 0.017** 0.006 0.004 0.005 0.007 0.006 0.009 -0.002
(0.021) (0.020) (0.008) (0.023) (0.026) (0.519) (0.836) (0.729) (0.637) (0.673) (0.492) (0.881)
Power Distance -0.021** -0.043**
(0.040) (0.019)
Individualism 0.022*** 0.028**
(0.008) (0.023)
Uncertainty Avoidance -0.014** -0.024**
(0.048) (0.036)
Long Term Orientation -0.023*** -0.030***
(0.000) (0.002)
Masculinity -0.002 0.005 0.011 0.016*
(0.695) (0.242) (0.217) (0.071)
Intercept 1.420 -0.950 1.268 1.985 -0.706 0.553 1.998 -2.330 1.138 1.412 -3.119* -0.913
(0.331) (0.386) (0.357) (0.124) (0.544) (0.725) (0.406) (0.168) (0.555) (0.420) (0.090) (0.721)
Number of observations 1,510 1,510 1,510 1,510 1,510 1,508 471 471 471 471 471 469
Adjusted R2 0.085 0.084 0.086 0.084 0.084 0.076 0.054 0.055 0.056 0.054 0.058 0.034
Panel A Panel B
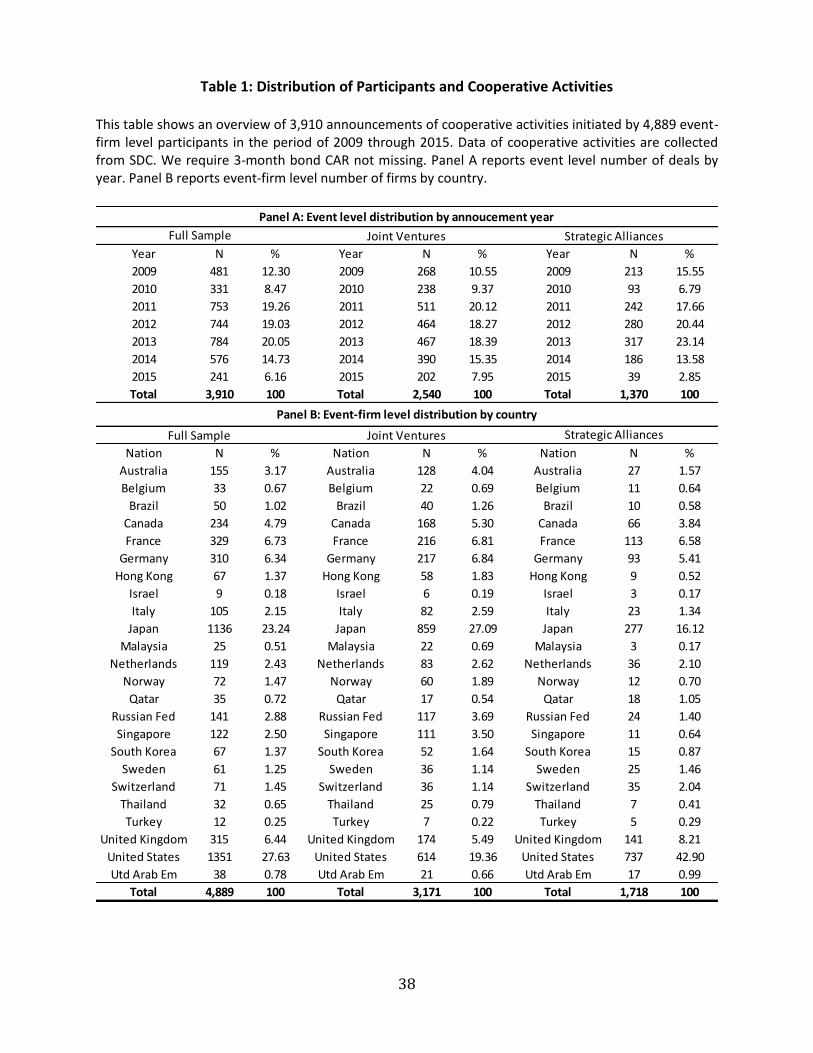
38
Table 1: Distribution of Participants and Cooperative Activities
This table shows an overview of 3,910 announcements of cooperative activities initiated by 4,889 event-firm level participants in the period of 2009 through 2015. Data of cooperative activities are collected from SDC. We require 3-month bond CAR not missing. Panel A reports event level number of deals by year. Panel B reports event-firm level number of firms by country.
Year N % Year N % Year N %
2009 481 12.30 2009 268 10.55 2009 213 15.55
2010 331 8.47 2010 238 9.37 2010 93 6.79
2011 753 19.26 2011 511 20.12 2011 242 17.66
2012 744 19.03 2012 464 18.27 2012 280 20.44
2013 784 20.05 2013 467 18.39 2013 317 23.14
2014 576 14.73 2014 390 15.35 2014 186 13.58
2015 241 6.16 2015 202 7.95 2015 39 2.85
Total 3,910 100 Total 2,540 100 Total 1,370 100
Nation N % Nation N % Nation N %
Australia 155 3.17 Australia 128 4.04 Australia 27 1.57
Belgium 33 0.67 Belgium 22 0.69 Belgium 11 0.64
Brazil 50 1.02 Brazil 40 1.26 Brazil 10 0.58
Canada 234 4.79 Canada 168 5.30 Canada 66 3.84
France 329 6.73 France 216 6.81 France 113 6.58
Germany 310 6.34 Germany 217 6.84 Germany 93 5.41
Hong Kong 67 1.37 Hong Kong 58 1.83 Hong Kong 9 0.52
Israel 9 0.18 Israel 6 0.19 Israel 3 0.17
Italy 105 2.15 Italy 82 2.59 Italy 23 1.34
Japan 1136 23.24 Japan 859 27.09 Japan 277 16.12
Malaysia 25 0.51 Malaysia 22 0.69 Malaysia 3 0.17
Netherlands 119 2.43 Netherlands 83 2.62 Netherlands 36 2.10
Norway 72 1.47 Norway 60 1.89 Norway 12 0.70
Qatar 35 0.72 Qatar 17 0.54 Qatar 18 1.05
Russian Fed 141 2.88 Russian Fed 117 3.69 Russian Fed 24 1.40
Singapore 122 2.50 Singapore 111 3.50 Singapore 11 0.64
South Korea 67 1.37 South Korea 52 1.64 South Korea 15 0.87
Sweden 61 1.25 Sweden 36 1.14 Sweden 25 1.46
Switzerland 71 1.45 Switzerland 36 1.14 Switzerland 35 2.04
Thailand 32 0.65 Thailand 25 0.79 Thailand 7 0.41
Turkey 12 0.25 Turkey 7 0.22 Turkey 5 0.29
United Kingdom 315 6.44 United Kingdom 174 5.49 United Kingdom 141 8.21
United States 1351 27.63 United States 614 19.36 United States 737 42.90
Utd Arab Em 38 0.78 Utd Arab Em 21 0.66 Utd Arab Em 17 0.99
Total 4,889 100 Total 3,171 100 Total 1,718 100
Strategic AlliancesJoint VenturesFull Sample
Panel B: Event-firm level distribution by country
Panel A: Event level distribution by annoucement year
Full Sample Joint Ventures Strategic Alliances
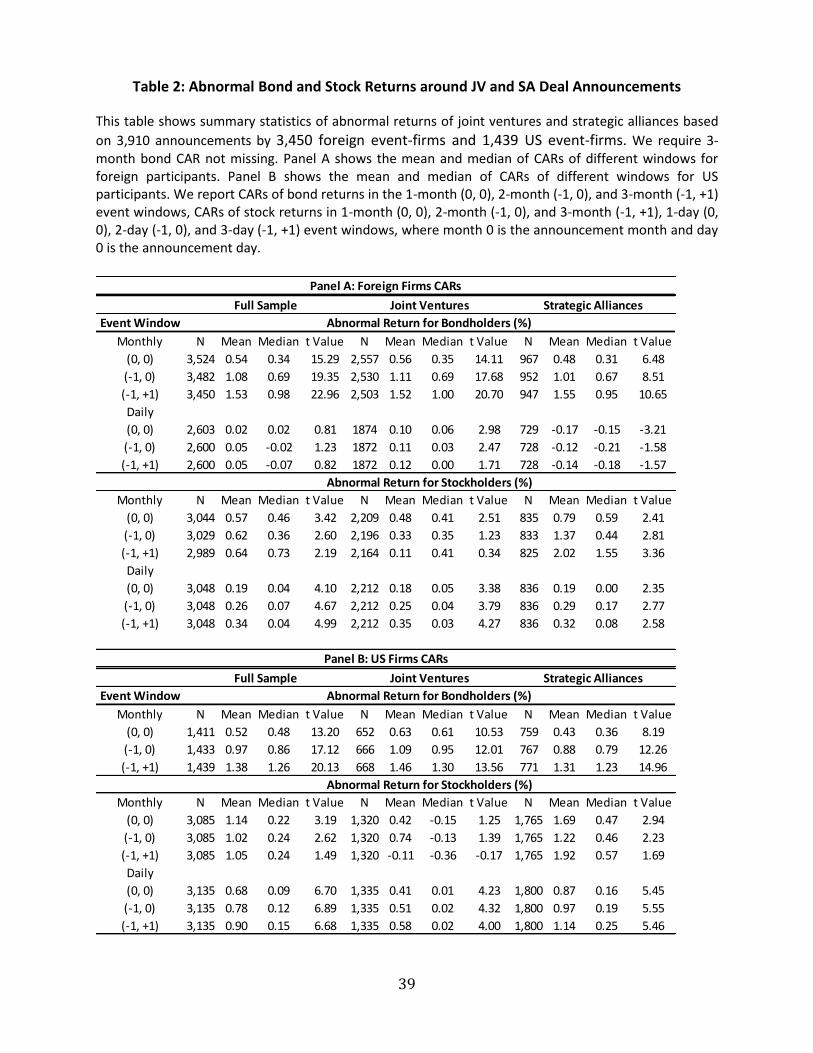
39
Table 2: Abnormal Bond and Stock Returns around JV and SA Deal Announcements
This table shows summary statistics of abnormal returns of joint ventures and strategic alliances based
on 3,910 announcements by 3,450 foreign event-firms and 1,439 US event-firms. We require 3-month bond CAR not missing. Panel A shows the mean and median of CARs of different windows for foreign participants. Panel B shows the mean and median of CARs of different windows for US participants. We report CARs of bond returns in the 1-month (0, 0), 2-month (-1, 0), and 3-month (-1, +1) event windows, CARs of stock returns in 1-month (0, 0), 2-month (-1, 0), and 3-month (-1, +1), 1-day (0, 0), 2-day (-1, 0), and 3-day (-1, +1) event windows, where month 0 is the announcement month and day 0 is the announcement day.
Event Window
Monthly N Mean Median t Value N Mean Median t Value N Mean Median t Value
(0, 0) 3,524 0.54 0.34 15.29 2,557 0.56 0.35 14.11 967 0.48 0.31 6.48
(-1, 0) 3,482 1.08 0.69 19.35 2,530 1.11 0.69 17.68 952 1.01 0.67 8.51
(-1, +1) 3,450 1.53 0.98 22.96 2,503 1.52 1.00 20.70 947 1.55 0.95 10.65
Daily
(0, 0) 2,603 0.02 0.02 0.81 1874 0.10 0.06 2.98 729 -0.17 -0.15 -3.21
(-1, 0) 2,600 0.05 -0.02 1.23 1872 0.11 0.03 2.47 728 -0.12 -0.21 -1.58
(-1, +1) 2,600 0.05 -0.07 0.82 1872 0.12 0.00 1.71 728 -0.14 -0.18 -1.57
Monthly N Mean Median t Value N Mean Median t Value N Mean Median t Value
(0, 0) 3,044 0.57 0.46 3.42 2,209 0.48 0.41 2.51 835 0.79 0.59 2.41
(-1, 0) 3,029 0.62 0.36 2.60 2,196 0.33 0.35 1.23 833 1.37 0.44 2.81
(-1, +1) 2,989 0.64 0.73 2.19 2,164 0.11 0.41 0.34 825 2.02 1.55 3.36
Daily
(0, 0) 3,048 0.19 0.04 4.10 2,212 0.18 0.05 3.38 836 0.19 0.00 2.35
(-1, 0) 3,048 0.26 0.07 4.67 2,212 0.25 0.04 3.79 836 0.29 0.17 2.77
(-1, +1) 3,048 0.34 0.04 4.99 2,212 0.35 0.03 4.27 836 0.32 0.08 2.58
Event Window
Monthly N Mean Median t Value N Mean Median t Value N Mean Median t Value
(0, 0) 1,411 0.52 0.48 13.20 652 0.63 0.61 10.53 759 0.43 0.36 8.19
(-1, 0) 1,433 0.97 0.86 17.12 666 1.09 0.95 12.01 767 0.88 0.79 12.26
(-1, +1) 1,439 1.38 1.26 20.13 668 1.46 1.30 13.56 771 1.31 1.23 14.96
Monthly N Mean Median t Value N Mean Median t Value N Mean Median t Value
(0, 0) 3,085 1.14 0.22 3.19 1,320 0.42 -0.15 1.25 1,765 1.69 0.47 2.94
(-1, 0) 3,085 1.02 0.24 2.62 1,320 0.74 -0.13 1.39 1,765 1.22 0.46 2.23
(-1, +1) 3,085 1.05 0.24 1.49 1,320 -0.11 -0.36 -0.17 1,765 1.92 0.57 1.69
Daily
(0, 0) 3,135 0.68 0.09 6.70 1,335 0.41 0.01 4.23 1,800 0.87 0.16 5.45
(-1, 0) 3,135 0.78 0.12 6.89 1,335 0.51 0.02 4.32 1,800 0.97 0.19 5.55
(-1, +1) 3,135 0.90 0.15 6.68 1,335 0.58 0.02 4.00 1,800 1.14 0.25 5.46
Panel A: Foreign Firms CARs
Full Sample Joint Ventures Strategic Alliances
Abnormal Return for Bondholders (%)
Abnormal Return for Stockholders (%)
Abnormal Return for Bondholders (%)
Abnormal Return for Stockholders (%)
Panel B: US Firms CARs
Full Sample Joint Ventures Strategic Alliances
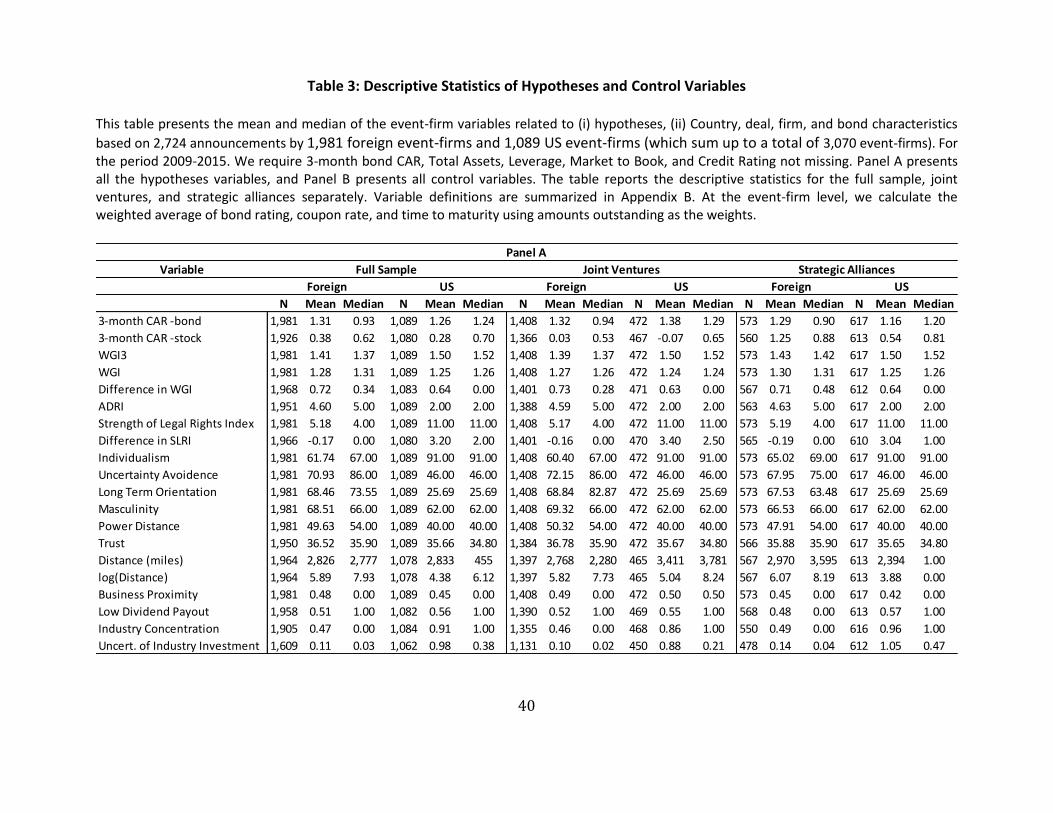
40
Table 3: Descriptive Statistics of Hypotheses and Control Variables
This table presents the mean and median of the event-firm variables related to (i) hypotheses, (ii) Country, deal, firm, and bond characteristics
based on 2,724 announcements by 1,981 foreign event-firms and 1,089 US event-firms (which sum up to a total of 3,070 event-firms). For the period 2009-2015. We require 3-month bond CAR, Total Assets, Leverage, Market to Book, and Credit Rating not missing. Panel A presents all the hypotheses variables, and Panel B presents all control variables. The table reports the descriptive statistics for the full sample, joint ventures, and strategic alliances separately. Variable definitions are summarized in Appendix B. At the event-firm level, we calculate the weighted average of bond rating, coupon rate, and time to maturity using amounts outstanding as the weights.
Variable
N Mean Median N Mean Median N Mean Median N Mean Median N Mean Median N Mean Median
3-month CAR -bond 1,981 1.31 0.93 1,089 1.26 1.24 1,408 1.32 0.94 472 1.38 1.29 573 1.29 0.90 617 1.16 1.20
3-month CAR -stock 1,926 0.38 0.62 1,080 0.28 0.70 1,366 0.03 0.53 467 -0.07 0.65 560 1.25 0.88 613 0.54 0.81
WGI3 1,981 1.41 1.37 1,089 1.50 1.52 1,408 1.39 1.37 472 1.50 1.52 573 1.43 1.42 617 1.50 1.52
WGI 1,981 1.28 1.31 1,089 1.25 1.26 1,408 1.27 1.26 472 1.24 1.24 573 1.30 1.31 617 1.25 1.26
Difference in WGI 1,968 0.72 0.34 1,083 0.64 0.00 1,401 0.73 0.28 471 0.63 0.00 567 0.71 0.48 612 0.64 0.00
ADRI 1,951 4.60 5.00 1,089 2.00 2.00 1,388 4.59 5.00 472 2.00 2.00 563 4.63 5.00 617 2.00 2.00
Strength of Legal Rights Index 1,981 5.18 4.00 1,089 11.00 11.00 1,408 5.17 4.00 472 11.00 11.00 573 5.19 4.00 617 11.00 11.00
Difference in SLRI 1,966 -0.17 0.00 1,080 3.20 2.00 1,401 -0.16 0.00 470 3.40 2.50 565 -0.19 0.00 610 3.04 1.00
Individualism 1,981 61.74 67.00 1,089 91.00 91.00 1,408 60.40 67.00 472 91.00 91.00 573 65.02 69.00 617 91.00 91.00
Uncertainty Avoidence 1,981 70.93 86.00 1,089 46.00 46.00 1,408 72.15 86.00 472 46.00 46.00 573 67.95 75.00 617 46.00 46.00
Long Term Orientation 1,981 68.46 73.55 1,089 25.69 25.69 1,408 68.84 82.87 472 25.69 25.69 573 67.53 63.48 617 25.69 25.69
Masculinity 1,981 68.51 66.00 1,089 62.00 62.00 1,408 69.32 66.00 472 62.00 62.00 573 66.53 66.00 617 62.00 62.00
Power Distance 1,981 49.63 54.00 1,089 40.00 40.00 1,408 50.32 54.00 472 40.00 40.00 573 47.91 54.00 617 40.00 40.00
Trust 1,950 36.52 35.90 1,089 35.66 34.80 1,384 36.78 35.90 472 35.67 34.80 566 35.88 35.90 617 35.65 34.80
Distance (miles) 1,964 2,826 2,777 1,078 2,833 455 1,397 2,768 2,280 465 3,411 3,781 567 2,970 3,595 613 2,394 1.00
log(Distance) 1,964 5.89 7.93 1,078 4.38 6.12 1,397 5.82 7.73 465 5.04 8.24 567 6.07 8.19 613 3.88 0.00
Business Proximity 1,981 0.48 0.00 1,089 0.45 0.00 1,408 0.49 0.00 472 0.50 0.50 573 0.45 0.00 617 0.42 0.00
Low Dividend Payout 1,958 0.51 1.00 1,082 0.56 1.00 1,390 0.52 1.00 469 0.55 1.00 568 0.48 0.00 613 0.57 1.00
Industry Concentration 1,905 0.47 0.00 1,084 0.91 1.00 1,355 0.46 0.00 468 0.86 1.00 550 0.49 0.00 616 0.96 1.00
Uncert. of Industry Investment 1,609 0.11 0.03 1,062 0.98 0.38 1,131 0.10 0.02 450 0.88 0.21 478 0.14 0.04 612 1.05 0.47
Full Sample
Foreign US Foreign US Foreign US
Joint Ventures Strategic Alliances
Panel A
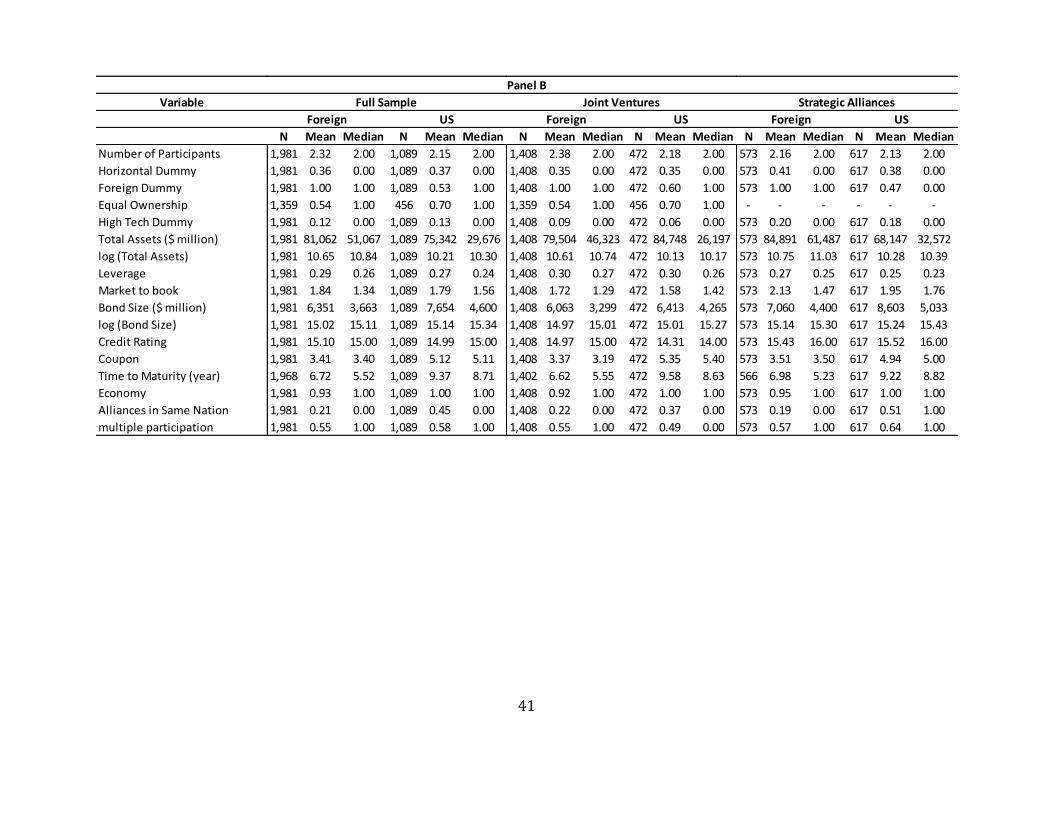
41
Variable
N Mean Median N Mean Median N Mean Median N Mean Median N Mean Median N Mean Median
Number of Participants 1,981 2.32 2.00 1,089 2.15 2.00 1,408 2.38 2.00 472 2.18 2.00 573 2.16 2.00 617 2.13 2.00
Horizontal Dummy 1,981 0.36 0.00 1,089 0.37 0.00 1,408 0.35 0.00 472 0.35 0.00 573 0.41 0.00 617 0.38 0.00
Foreign Dummy 1,981 1.00 1.00 1,089 0.53 1.00 1,408 1.00 1.00 472 0.60 1.00 573 1.00 1.00 617 0.47 0.00
Equal Ownership 1,359 0.54 1.00 456 0.70 1.00 1,359 0.54 1.00 456 0.70 1.00 - - - - - -
High Tech Dummy 1,981 0.12 0.00 1,089 0.13 0.00 1,408 0.09 0.00 472 0.06 0.00 573 0.20 0.00 617 0.18 0.00
Total Assets ($ million) 1,981 81,062 51,067 1,089 75,342 29,676 1,408 79,504 46,323 472 84,748 26,197 573 84,891 61,487 617 68,147 32,572
log (Total Assets) 1,981 10.65 10.84 1,089 10.21 10.30 1,408 10.61 10.74 472 10.13 10.17 573 10.75 11.03 617 10.28 10.39
Leverage 1,981 0.29 0.26 1,089 0.27 0.24 1,408 0.30 0.27 472 0.30 0.26 573 0.27 0.25 617 0.25 0.23
Market to book 1,981 1.84 1.34 1,089 1.79 1.56 1,408 1.72 1.29 472 1.58 1.42 573 2.13 1.47 617 1.95 1.76
Bond Size ($ million) 1,981 6,351 3,663 1,089 7,654 4,600 1,408 6,063 3,299 472 6,413 4,265 573 7,060 4,400 617 8,603 5,033
log (Bond Size) 1,981 15.02 15.11 1,089 15.14 15.34 1,408 14.97 15.01 472 15.01 15.27 573 15.14 15.30 617 15.24 15.43
Credit Rating 1,981 15.10 15.00 1,089 14.99 15.00 1,408 14.97 15.00 472 14.31 14.00 573 15.43 16.00 617 15.52 16.00
Coupon 1,981 3.41 3.40 1,089 5.12 5.11 1,408 3.37 3.19 472 5.35 5.40 573 3.51 3.50 617 4.94 5.00
Time to Maturity (year) 1,968 6.72 5.52 1,089 9.37 8.71 1,402 6.62 5.55 472 9.58 8.63 566 6.98 5.23 617 9.22 8.82
Economy 1,981 0.93 1.00 1,089 1.00 1.00 1,408 0.92 1.00 472 1.00 1.00 573 0.95 1.00 617 1.00 1.00
Alliances in Same Nation 1,981 0.21 0.00 1,089 0.45 0.00 1,408 0.22 0.00 472 0.37 0.00 573 0.19 0.00 617 0.51 1.00
multiple participation 1,981 0.55 1.00 1,089 0.58 1.00 1,408 0.55 1.00 472 0.49 0.00 573 0.57 1.00 617 0.64 1.00
Panel B
Full Sample Joint Ventures Strategic Alliances
Foreign US Foreign US Foreign US
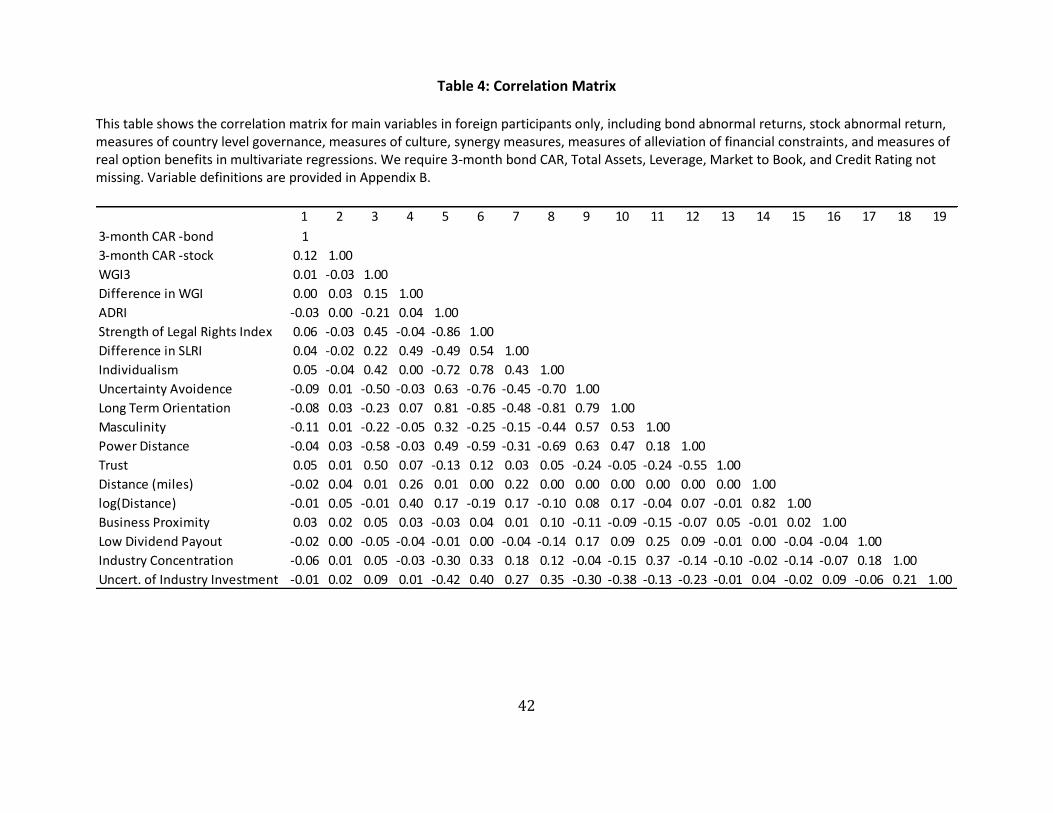
42
Table 4: Correlation Matrix
This table shows the correlation matrix for main variables in foreign participants only, including bond abnormal returns, stock abnormal return, measures of country level governance, measures of culture, synergy measures, measures of alleviation of financial constraints, and measures of real option benefits in multivariate regressions. We require 3-month bond CAR, Total Assets, Leverage, Market to Book, and Credit Rating not missing. Variable definitions are provided in Appendix B.
1 2 3 4 5 6 7 8 9 10 11 12 13 14 15 16 17 18 19
3-month CAR -bond 1
3-month CAR -stock 0.12 1.00
WGI3 0.01 -0.03 1.00
Difference in WGI 0.00 0.03 0.15 1.00
ADRI -0.03 0.00 -0.21 0.04 1.00
Strength of Legal Rights Index 0.06 -0.03 0.45 -0.04 -0.86 1.00
Difference in SLRI 0.04 -0.02 0.22 0.49 -0.49 0.54 1.00
Individualism 0.05 -0.04 0.42 0.00 -0.72 0.78 0.43 1.00
Uncertainty Avoidence -0.09 0.01 -0.50 -0.03 0.63 -0.76 -0.45 -0.70 1.00
Long Term Orientation -0.08 0.03 -0.23 0.07 0.81 -0.85 -0.48 -0.81 0.79 1.00
Masculinity -0.11 0.01 -0.22 -0.05 0.32 -0.25 -0.15 -0.44 0.57 0.53 1.00
Power Distance -0.04 0.03 -0.58 -0.03 0.49 -0.59 -0.31 -0.69 0.63 0.47 0.18 1.00
Trust 0.05 0.01 0.50 0.07 -0.13 0.12 0.03 0.05 -0.24 -0.05 -0.24 -0.55 1.00
Distance (miles) -0.02 0.04 0.01 0.26 0.01 0.00 0.22 0.00 0.00 0.00 0.00 0.00 0.00 1.00
log(Distance) -0.01 0.05 -0.01 0.40 0.17 -0.19 0.17 -0.10 0.08 0.17 -0.04 0.07 -0.01 0.82 1.00
Business Proximity 0.03 0.02 0.05 0.03 -0.03 0.04 0.01 0.10 -0.11 -0.09 -0.15 -0.07 0.05 -0.01 0.02 1.00
Low Dividend Payout -0.02 0.00 -0.05 -0.04 -0.01 0.00 -0.04 -0.14 0.17 0.09 0.25 0.09 -0.01 0.00 -0.04 -0.04 1.00
Industry Concentration -0.06 0.01 0.05 -0.03 -0.30 0.33 0.18 0.12 -0.04 -0.15 0.37 -0.14 -0.10 -0.02 -0.14 -0.07 0.18 1.00
Uncert. of Industry Investment -0.01 0.02 0.09 0.01 -0.42 0.40 0.27 0.35 -0.30 -0.38 -0.13 -0.23 -0.01 0.04 -0.02 0.09 -0.06 0.21 1.00
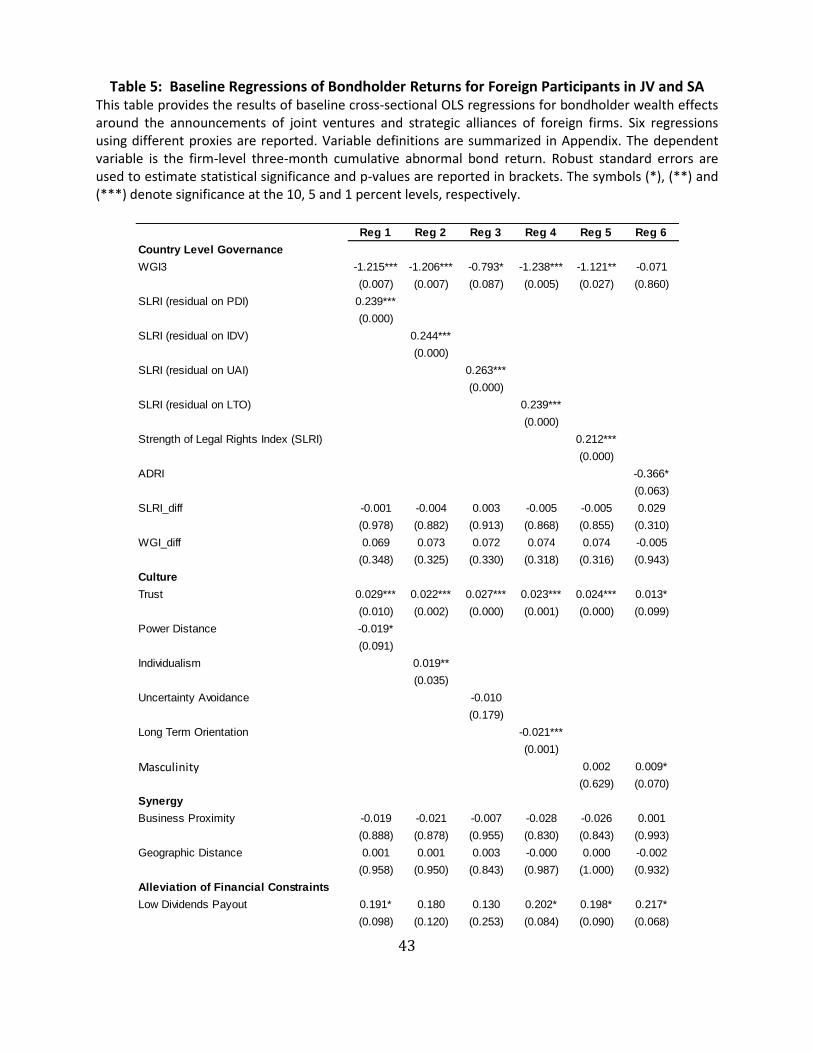
43
Table 5: Baseline Regressions of Bondholder Returns for Foreign Participants in JV and SA This table provides the results of baseline cross-sectional OLS regressions for bondholder wealth effects around the announcements of joint ventures and strategic alliances of foreign firms. Six regressions using different proxies are reported. Variable definitions are summarized in Appendix. The dependent variable is the firm-level three-month cumulative abnormal bond return. Robust standard errors are used to estimate statistical significance and p-values are reported in brackets. The symbols (*), (**) and (***) denote significance at the 10, 5 and 1 percent levels, respectively.
Reg 1 Reg 2 Reg 3 Reg 4 Reg 5 Reg 6
Country Level Governance
WGI3 -1.215*** -1.206*** -0.793* -1.238*** -1.121** -0.071
(0.007) (0.007) (0.087) (0.005) (0.027) (0.860)
SLRI (residual on PDI) 0.239***
(0.000)
SLRI (residual on IDV) 0.244***
(0.000)
SLRI (residual on UAI) 0.263***
(0.000)
SLRI (residual on LTO) 0.239***
(0.000)
Strength of Legal Rights Index (SLRI) 0.212***
(0.000)
ADRI -0.366*
(0.063)
SLRI_diff -0.001 -0.004 0.003 -0.005 -0.005 0.029
(0.978) (0.882) (0.913) (0.868) (0.855) (0.310)
WGI_diff 0.069 0.073 0.072 0.074 0.074 -0.005
(0.348) (0.325) (0.330) (0.318) (0.316) (0.943)
Culture
Trust 0.029*** 0.022*** 0.027*** 0.023*** 0.024*** 0.013*
(0.010) (0.002) (0.000) (0.001) (0.000) (0.099)
Power Distance -0.019*
(0.091)
Individualism 0.019**
(0.035)
Uncertainty Avoidance -0.010
(0.179)
Long Term Orientation -0.021***
(0.001)
Masculinity 0.002 0.009*
(0.629) (0.070)
Synergy
Business Proximity -0.019 -0.021 -0.007 -0.028 -0.026 0.001
(0.888) (0.878) (0.955) (0.830) (0.843) (0.993)
Geographic Distance 0.001 0.001 0.003 -0.000 0.000 -0.002
(0.958) (0.950) (0.843) (0.987) (1.000) (0.932)
Alleviation of Financial Constraints
Low Dividends Payout 0.191* 0.180 0.130 0.202* 0.198* 0.217*
(0.098) (0.120) (0.253) (0.084) (0.090) (0.068)
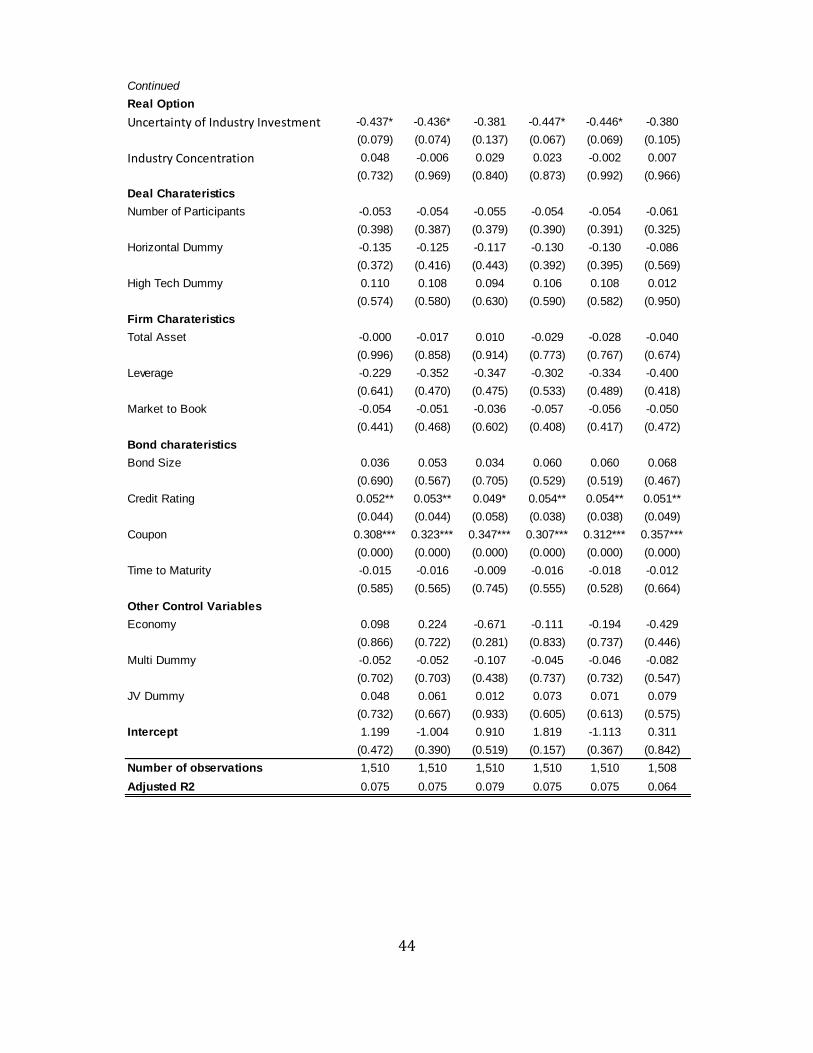
44
Continued
Real Option
Uncertainty of Industry Investment -0.437* -0.436* -0.381 -0.447* -0.446* -0.380
(0.079) (0.074) (0.137) (0.067) (0.069) (0.105)
Industry Concentration 0.048 -0.006 0.029 0.023 -0.002 0.007
(0.732) (0.969) (0.840) (0.873) (0.992) (0.966)
Deal Charateristics
Number of Participants -0.053 -0.054 -0.055 -0.054 -0.054 -0.061
(0.398) (0.387) (0.379) (0.390) (0.391) (0.325)
Horizontal Dummy -0.135 -0.125 -0.117 -0.130 -0.130 -0.086
(0.372) (0.416) (0.443) (0.392) (0.395) (0.569)
High Tech Dummy 0.110 0.108 0.094 0.106 0.108 0.012
(0.574) (0.580) (0.630) (0.590) (0.582) (0.950)
Firm Charateristics
Total Asset -0.000 -0.017 0.010 -0.029 -0.028 -0.040
(0.996) (0.858) (0.914) (0.773) (0.767) (0.674)
Leverage -0.229 -0.352 -0.347 -0.302 -0.334 -0.400
(0.641) (0.470) (0.475) (0.533) (0.489) (0.418)
Market to Book -0.054 -0.051 -0.036 -0.057 -0.056 -0.050
(0.441) (0.468) (0.602) (0.408) (0.417) (0.472)
Bond charateristics
Bond Size 0.036 0.053 0.034 0.060 0.060 0.068
(0.690) (0.567) (0.705) (0.529) (0.519) (0.467)
Credit Rating 0.052** 0.053** 0.049* 0.054** 0.054** 0.051**
(0.044) (0.044) (0.058) (0.038) (0.038) (0.049)
Coupon 0.308*** 0.323*** 0.347*** 0.307*** 0.312*** 0.357***
(0.000) (0.000) (0.000) (0.000) (0.000) (0.000)
Time to Maturity -0.015 -0.016 -0.009 -0.016 -0.018 -0.012
(0.585) (0.565) (0.745) (0.555) (0.528) (0.664)
Other Control Variables
Economy 0.098 0.224 -0.671 -0.111 -0.194 -0.429
(0.866) (0.722) (0.281) (0.833) (0.737) (0.446)
Multi Dummy -0.052 -0.052 -0.107 -0.045 -0.046 -0.082
(0.702) (0.703) (0.438) (0.737) (0.732) (0.547)
JV Dummy 0.048 0.061 0.012 0.073 0.071 0.079
(0.732) (0.667) (0.933) (0.605) (0.613) (0.575)
Intercept 1.199 -1.004 0.910 1.819 -1.113 0.311
(0.472) (0.390) (0.519) (0.157) (0.367) (0.842)
Number of observations 1,510 1,510 1,510 1,510 1,510 1,508
Adjusted R2 0.075 0.075 0.079 0.075 0.075 0.064
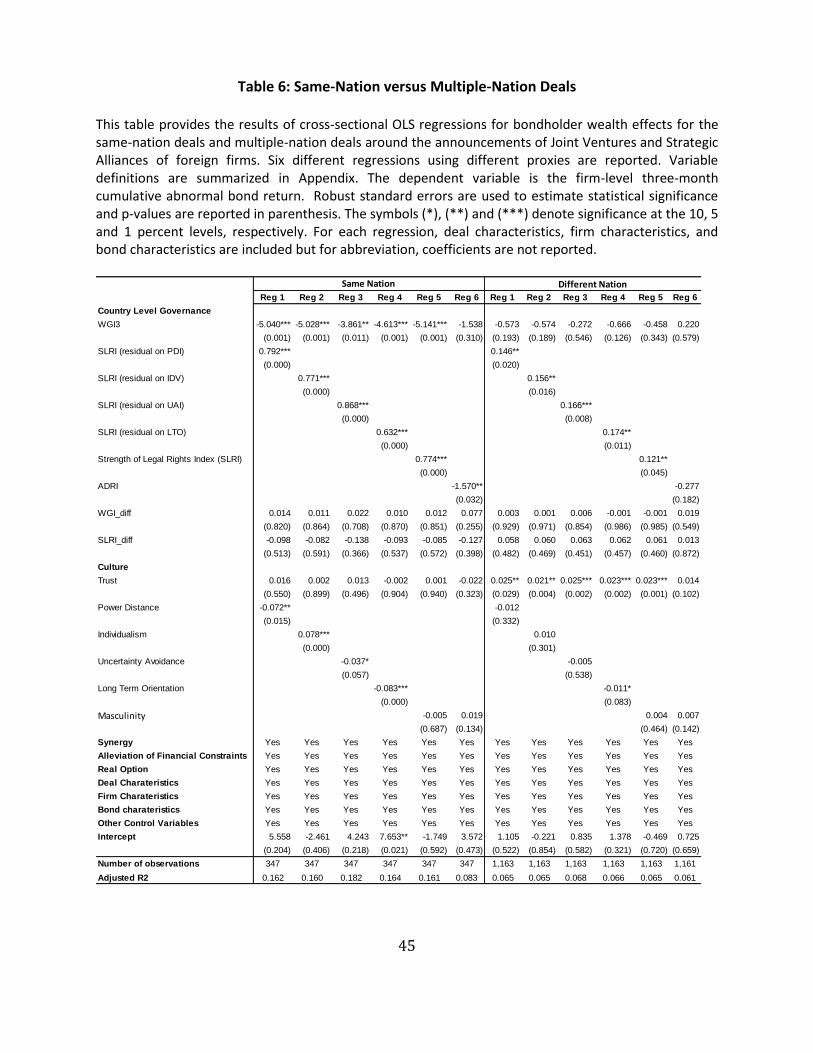
45
Table 6: Same-Nation versus Multiple-Nation Deals
This table provides the results of cross-sectional OLS regressions for bondholder wealth effects for the same-nation deals and multiple-nation deals around the announcements of Joint Ventures and Strategic Alliances of foreign firms. Six different regressions using different proxies are reported. Variable definitions are summarized in Appendix. The dependent variable is the firm-level three-month cumulative abnormal bond return. Robust standard errors are used to estimate statistical significance and p-values are reported in parenthesis. The symbols (*), (**) and (***) denote significance at the 10, 5 and 1 percent levels, respectively. For each regression, deal characteristics, firm characteristics, and bond characteristics are included but for abbreviation, coefficients are not reported.
Reg 1 Reg 2 Reg 3 Reg 4 Reg 5 Reg 6 Reg 1 Reg 2 Reg 3 Reg 4 Reg 5 Reg 6
Country Level Governance
WGI3 -5.040*** -5.028*** -3.861** -4.613*** -5.141*** -1.538 -0.573 -0.574 -0.272 -0.666 -0.458 0.220
(0.001) (0.001) (0.011) (0.001) (0.001) (0.310) (0.193) (0.189) (0.546) (0.126) (0.343) (0.579)
SLRI (residual on PDI) 0.792*** 0.146**
(0.000) (0.020)
SLRI (residual on IDV) 0.771*** 0.156**
(0.000) (0.016)
SLRI (residual on UAI) 0.868*** 0.166***
(0.000) (0.008)
SLRI (residual on LTO) 0.632*** 0.174**
(0.000) (0.011)
Strength of Legal Rights Index (SLRI) 0.774*** 0.121**
(0.000) (0.045)
ADRI -1.570** -0.277
(0.032) (0.182)
WGI_diff 0.014 0.011 0.022 0.010 0.012 0.077 0.003 0.001 0.006 -0.001 -0.001 0.019
(0.820) (0.864) (0.708) (0.870) (0.851) (0.255) (0.929) (0.971) (0.854) (0.986) (0.985) (0.549)
SLRI_diff -0.098 -0.082 -0.138 -0.093 -0.085 -0.127 0.058 0.060 0.063 0.062 0.061 0.013
(0.513) (0.591) (0.366) (0.537) (0.572) (0.398) (0.482) (0.469) (0.451) (0.457) (0.460) (0.872)
Culture
Trust 0.016 0.002 0.013 -0.002 0.001 -0.022 0.025** 0.021** 0.025*** 0.023*** 0.023*** 0.014
(0.550) (0.899) (0.496) (0.904) (0.940) (0.323) (0.029) (0.004) (0.002) (0.002) (0.001) (0.102)
Power Distance -0.072** -0.012
(0.015) (0.332)
Individualism 0.078*** 0.010
(0.000) (0.301)
Uncertainty Avoidance -0.037* -0.005
(0.057) (0.538)
Long Term Orientation -0.083*** -0.011*
(0.000) (0.083)
Masculinity -0.005 0.019 0.004 0.007
(0.687) (0.134) (0.464) (0.142)
Synergy Yes Yes Yes Yes Yes Yes Yes Yes Yes Yes Yes Yes
Alleviation of Financial Constraints Yes Yes Yes Yes Yes Yes Yes Yes Yes Yes Yes Yes
Real Option Yes Yes Yes Yes Yes Yes Yes Yes Yes Yes Yes Yes
Deal Charateristics Yes Yes Yes Yes Yes Yes Yes Yes Yes Yes Yes Yes
Firm Charateristics Yes Yes Yes Yes Yes Yes Yes Yes Yes Yes Yes Yes
Bond charateristics Yes Yes Yes Yes Yes Yes Yes Yes Yes Yes Yes Yes
Other Control Variables Yes Yes Yes Yes Yes Yes Yes Yes Yes Yes Yes Yes
Intercept 5.558 -2.461 4.243 7.653** -1.749 3.572 1.105 -0.221 0.835 1.378 -0.469 0.725
(0.204) (0.406) (0.218) (0.021) (0.592) (0.473) (0.522) (0.854) (0.582) (0.321) (0.720) (0.659)
Number of observations 347 347 347 347 347 347 1,163 1,163 1,163 1,163 1,163 1,161
Adjusted R2 0.162 0.160 0.182 0.164 0.161 0.083 0.065 0.065 0.068 0.066 0.065 0.061
Same Nation Different Nation
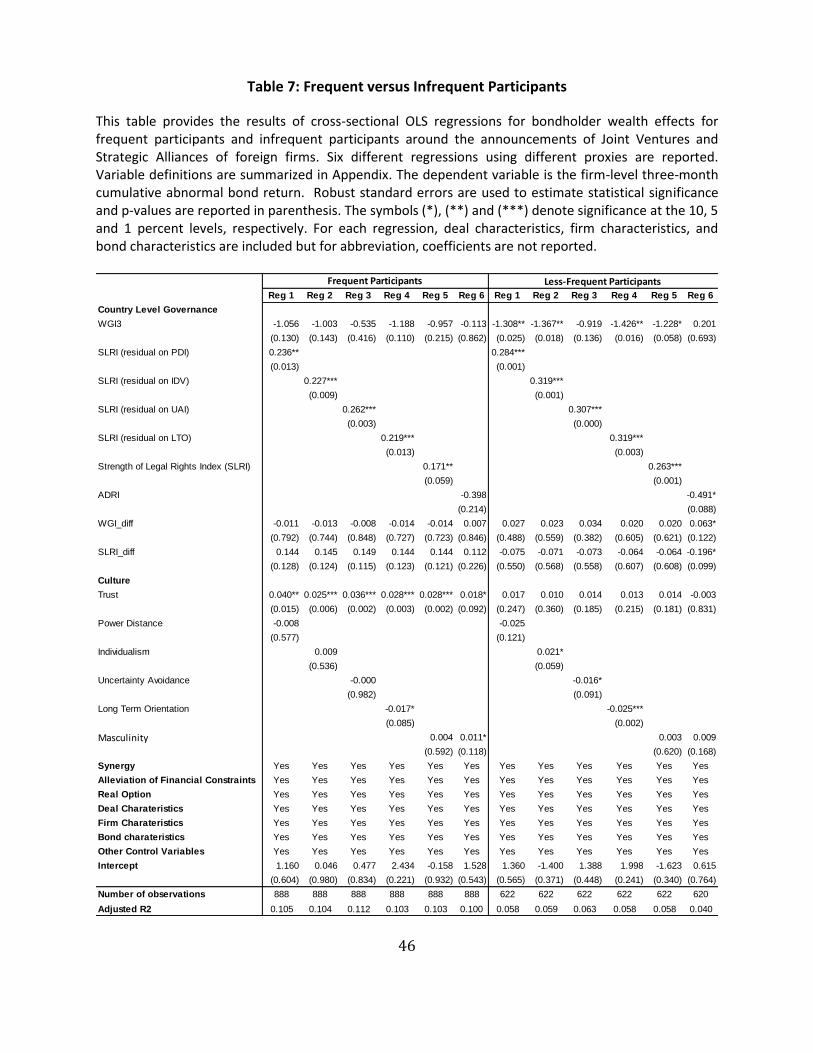
46
Table 7: Frequent versus Infrequent Participants
This table provides the results of cross-sectional OLS regressions for bondholder wealth effects for frequent participants and infrequent participants around the announcements of Joint Ventures and Strategic Alliances of foreign firms. Six different regressions using different proxies are reported. Variable definitions are summarized in Appendix. The dependent variable is the firm-level three-month cumulative abnormal bond return. Robust standard errors are used to estimate statistical significance and p-values are reported in parenthesis. The symbols (*), (**) and (***) denote significance at the 10, 5 and 1 percent levels, respectively. For each regression, deal characteristics, firm characteristics, and bond characteristics are included but for abbreviation, coefficients are not reported.
Reg 1 Reg 2 Reg 3 Reg 4 Reg 5 Reg 6 Reg 1 Reg 2 Reg 3 Reg 4 Reg 5 Reg 6
Country Level Governance
WGI3 -1.056 -1.003 -0.535 -1.188 -0.957 -0.113 -1.308** -1.367** -0.919 -1.426** -1.228* 0.201
(0.130) (0.143) (0.416) (0.110) (0.215) (0.862) (0.025) (0.018) (0.136) (0.016) (0.058) (0.693)
SLRI (residual on PDI) 0.236** 0.284***
(0.013) (0.001)
SLRI (residual on IDV) 0.227*** 0.319***
(0.009) (0.001)
SLRI (residual on UAI) 0.262*** 0.307***
(0.003) (0.000)
SLRI (residual on LTO) 0.219*** 0.319***
(0.013) (0.003)
Strength of Legal Rights Index (SLRI) 0.171** 0.263***
(0.059) (0.001)
ADRI -0.398 -0.491*
(0.214) (0.088)
WGI_diff -0.011 -0.013 -0.008 -0.014 -0.014 0.007 0.027 0.023 0.034 0.020 0.020 0.063*
(0.792) (0.744) (0.848) (0.727) (0.723) (0.846) (0.488) (0.559) (0.382) (0.605) (0.621) (0.122)
SLRI_diff 0.144 0.145 0.149 0.144 0.144 0.112 -0.075 -0.071 -0.073 -0.064 -0.064 -0.196*
(0.128) (0.124) (0.115) (0.123) (0.121) (0.226) (0.550) (0.568) (0.558) (0.607) (0.608) (0.099)
Culture
Trust 0.040** 0.025*** 0.036*** 0.028*** 0.028*** 0.018* 0.017 0.010 0.014 0.013 0.014 -0.003
(0.015) (0.006) (0.002) (0.003) (0.002) (0.092) (0.247) (0.360) (0.185) (0.215) (0.181) (0.831)
Power Distance -0.008 -0.025
(0.577) (0.121)
Individualism 0.009 0.021*
(0.536) (0.059)
Uncertainty Avoidance -0.000 -0.016*
(0.982) (0.091)
Long Term Orientation -0.017* -0.025***
(0.085) (0.002)
Masculinity 0.004 0.011* 0.003 0.009
(0.592) (0.118) (0.620) (0.168)
Synergy Yes Yes Yes Yes Yes Yes Yes Yes Yes Yes Yes Yes
Alleviation of Financial Constraints Yes Yes Yes Yes Yes Yes Yes Yes Yes Yes Yes Yes
Real Option Yes Yes Yes Yes Yes Yes Yes Yes Yes Yes Yes Yes
Deal Charateristics Yes Yes Yes Yes Yes Yes Yes Yes Yes Yes Yes Yes
Firm Charateristics Yes Yes Yes Yes Yes Yes Yes Yes Yes Yes Yes Yes
Bond charateristics Yes Yes Yes Yes Yes Yes Yes Yes Yes Yes Yes Yes
Other Control Variables Yes Yes Yes Yes Yes Yes Yes Yes Yes Yes Yes Yes
Intercept 1.160 0.046 0.477 2.434 -0.158 1.528 1.360 -1.400 1.388 1.998 -1.623 0.615
(0.604) (0.980) (0.834) (0.221) (0.932) (0.543) (0.565) (0.371) (0.448) (0.241) (0.340) (0.764)
Number of observations 888 888 888 888 888 888 622 622 622 622 622 620
Adjusted R2 0.105 0.104 0.112 0.103 0.103 0.100 0.058 0.059 0.063 0.058 0.058 0.040
Frequent Participants Less-Frequent Participants
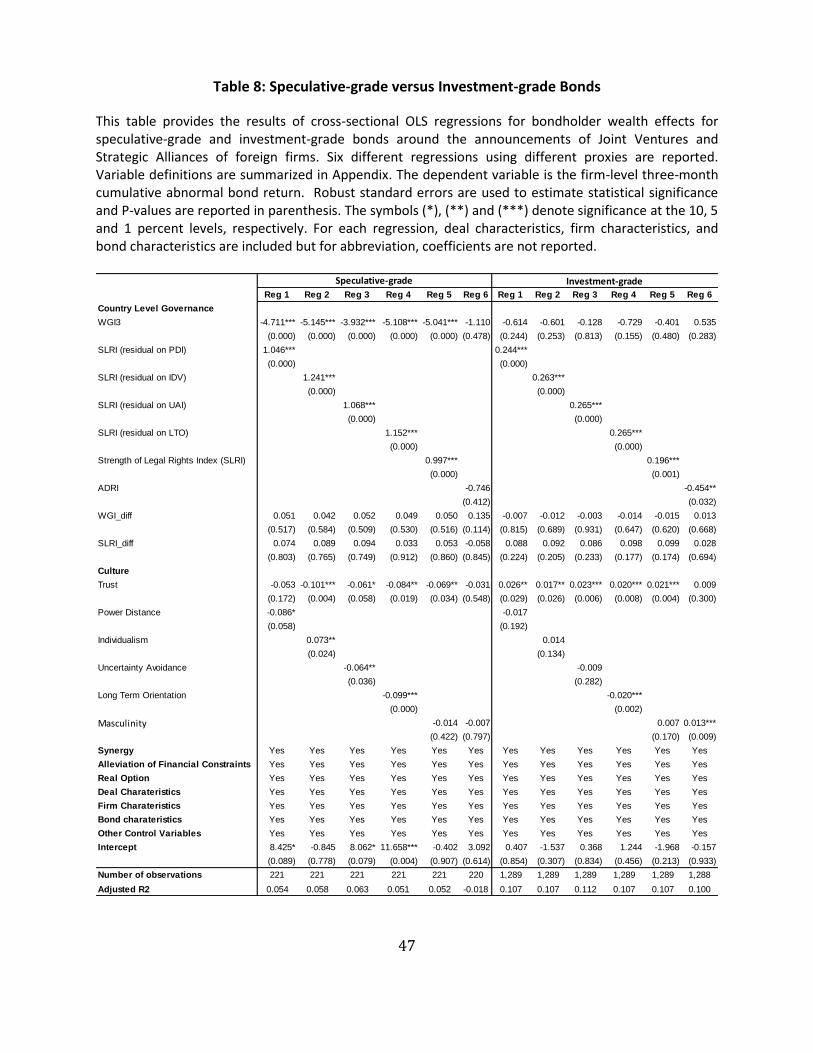
47
Table 8: Speculative-grade versus Investment-grade Bonds
This table provides the results of cross-sectional OLS regressions for bondholder wealth effects for speculative-grade and investment-grade bonds around the announcements of Joint Ventures and Strategic Alliances of foreign firms. Six different regressions using different proxies are reported. Variable definitions are summarized in Appendix. The dependent variable is the firm-level three-month cumulative abnormal bond return. Robust standard errors are used to estimate statistical significance and P-values are reported in parenthesis. The symbols (*), (**) and (***) denote significance at the 10, 5 and 1 percent levels, respectively. For each regression, deal characteristics, firm characteristics, and bond characteristics are included but for abbreviation, coefficients are not reported.
Reg 1 Reg 2 Reg 3 Reg 4 Reg 5 Reg 6 Reg 1 Reg 2 Reg 3 Reg 4 Reg 5 Reg 6
Country Level Governance
WGI3 -4.711*** -5.145*** -3.932*** -5.108*** -5.041*** -1.110 -0.614 -0.601 -0.128 -0.729 -0.401 0.535
(0.000) (0.000) (0.000) (0.000) (0.000) (0.478) (0.244) (0.253) (0.813) (0.155) (0.480) (0.283)
SLRI (residual on PDI) 1.046*** 0.244***
(0.000) (0.000)
SLRI (residual on IDV) 1.241*** 0.263***
(0.000) (0.000)
SLRI (residual on UAI) 1.068*** 0.265***
(0.000) (0.000)
SLRI (residual on LTO) 1.152*** 0.265***
(0.000) (0.000)
Strength of Legal Rights Index (SLRI) 0.997*** 0.196***
(0.000) (0.001)
ADRI -0.746 -0.454**
(0.412) (0.032)
WGI_diff 0.051 0.042 0.052 0.049 0.050 0.135 -0.007 -0.012 -0.003 -0.014 -0.015 0.013
(0.517) (0.584) (0.509) (0.530) (0.516) (0.114) (0.815) (0.689) (0.931) (0.647) (0.620) (0.668)
SLRI_diff 0.074 0.089 0.094 0.033 0.053 -0.058 0.088 0.092 0.086 0.098 0.099 0.028
(0.803) (0.765) (0.749) (0.912) (0.860) (0.845) (0.224) (0.205) (0.233) (0.177) (0.174) (0.694)
Culture
Trust -0.053 -0.101*** -0.061* -0.084** -0.069** -0.031 0.026** 0.017** 0.023*** 0.020*** 0.021*** 0.009
(0.172) (0.004) (0.058) (0.019) (0.034) (0.548) (0.029) (0.026) (0.006) (0.008) (0.004) (0.300)
Power Distance -0.086* -0.017
(0.058) (0.192)
Individualism 0.073** 0.014
(0.024) (0.134)
Uncertainty Avoidance -0.064** -0.009
(0.036) (0.282)
Long Term Orientation -0.099*** -0.020***
(0.000) (0.002)
Masculinity -0.014 -0.007 0.007 0.013***
(0.422) (0.797) (0.170) (0.009)
Synergy Yes Yes Yes Yes Yes Yes Yes Yes Yes Yes Yes Yes
Alleviation of Financial Constraints Yes Yes Yes Yes Yes Yes Yes Yes Yes Yes Yes Yes
Real Option Yes Yes Yes Yes Yes Yes Yes Yes Yes Yes Yes Yes
Deal Charateristics Yes Yes Yes Yes Yes Yes Yes Yes Yes Yes Yes Yes
Firm Charateristics Yes Yes Yes Yes Yes Yes Yes Yes Yes Yes Yes Yes
Bond charateristics Yes Yes Yes Yes Yes Yes Yes Yes Yes Yes Yes Yes
Other Control Variables Yes Yes Yes Yes Yes Yes Yes Yes Yes Yes Yes Yes
Intercept 8.425* -0.845 8.062* 11.658*** -0.402 3.092 0.407 -1.537 0.368 1.244 -1.968 -0.157
(0.089) (0.778) (0.079) (0.004) (0.907) (0.614) (0.854) (0.307) (0.834) (0.456) (0.213) (0.933)
Number of observations 221 221 221 221 221 220 1,289 1,289 1,289 1,289 1,289 1,288
Adjusted R2 0.054 0.058 0.063 0.051 0.052 -0.018 0.107 0.107 0.112 0.107 0.107 0.100
Speculative-grade Investment-grade
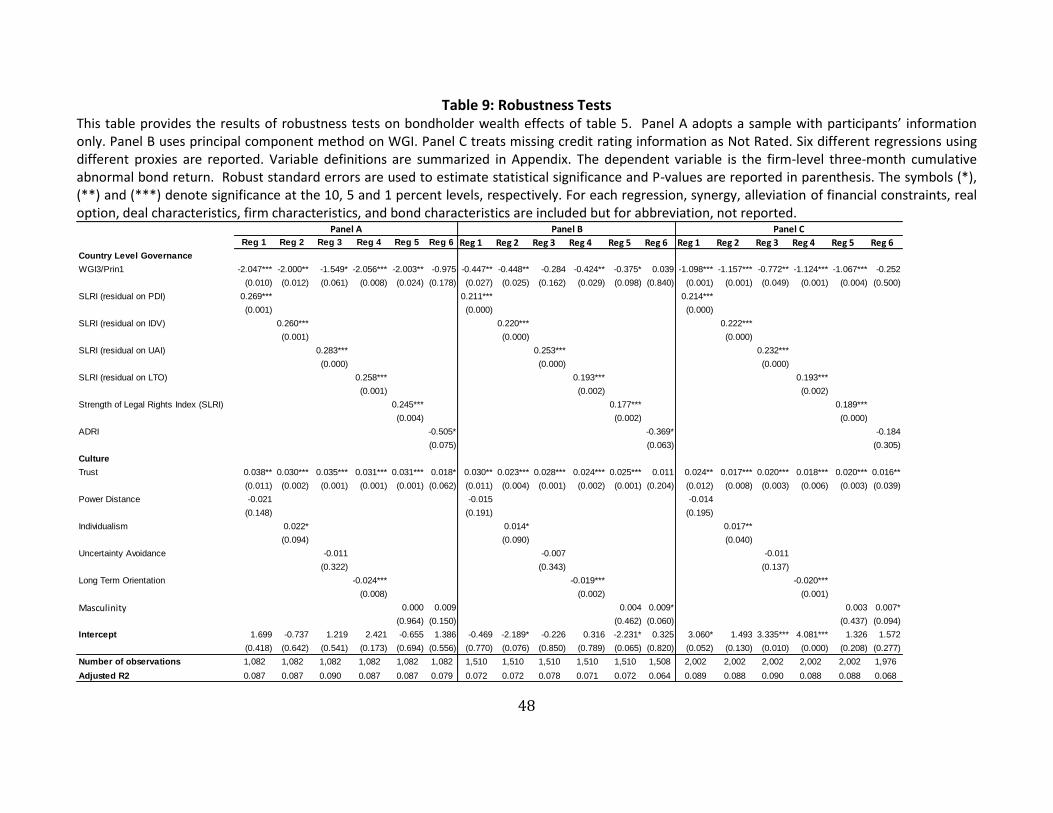
48
Table 9: Robustness Tests This table provides the results of robustness tests on bondholder wealth effects of table 5. Panel A adopts a sample with participants’ information only. Panel B uses principal component method on WGI. Panel C treats missing credit rating information as Not Rated. Six different regressions using different proxies are reported. Variable definitions are summarized in Appendix. The dependent variable is the firm-level three-month cumulative abnormal bond return. Robust standard errors are used to estimate statistical significance and P-values are reported in parenthesis. The symbols (*), (**) and (***) denote significance at the 10, 5 and 1 percent levels, respectively. For each regression, synergy, alleviation of financial constraints, real option, deal characteristics, firm characteristics, and bond characteristics are included but for abbreviation, not reported.
Reg 1 Reg 2 Reg 3 Reg 4 Reg 5 Reg 6 Reg 1 Reg 2 Reg 3 Reg 4 Reg 5 Reg 6 Reg 1 Reg 2 Reg 3 Reg 4 Reg 5 Reg 6
Country Level Governance
WGI3/Prin1 -2.047*** -2.000** -1.549* -2.056*** -2.003** -0.975 -0.447** -0.448** -0.284 -0.424** -0.375* 0.039 -1.098*** -1.157*** -0.772** -1.124*** -1.067*** -0.252
(0.010) (0.012) (0.061) (0.008) (0.024) (0.178) (0.027) (0.025) (0.162) (0.029) (0.098) (0.840) (0.001) (0.001) (0.049) (0.001) (0.004) (0.500)
SLRI (residual on PDI) 0.269*** 0.211*** 0.214***
(0.001) (0.000) (0.000)
SLRI (residual on IDV) 0.260*** 0.220*** 0.222***
(0.001) (0.000) (0.000)
SLRI (residual on UAI) 0.283*** 0.253*** 0.232***
(0.000) (0.000) (0.000)
SLRI (residual on LTO) 0.258*** 0.193*** 0.193***
(0.001) (0.002) (0.002)
Strength of Legal Rights Index (SLRI) 0.245*** 0.177*** 0.189***
(0.004) (0.002) (0.000)
ADRI -0.505* -0.369* -0.184
(0.075) (0.063) (0.305)
Culture
Trust 0.038** 0.030*** 0.035*** 0.031*** 0.031*** 0.018* 0.030** 0.023*** 0.028*** 0.024*** 0.025*** 0.011 0.024** 0.017*** 0.020*** 0.018*** 0.020*** 0.016**
(0.011) (0.002) (0.001) (0.001) (0.001) (0.062) (0.011) (0.004) (0.001) (0.002) (0.001) (0.204) (0.012) (0.008) (0.003) (0.006) (0.003) (0.039)
Power Distance -0.021 -0.015 -0.014
(0.148) (0.191) (0.195)
Individualism 0.022* 0.014* 0.017**
(0.094) (0.090) (0.040)
Uncertainty Avoidance -0.011 -0.007 -0.011
(0.322) (0.343) (0.137)
Long Term Orientation -0.024*** -0.019*** -0.020***
(0.008) (0.002) (0.001)
Masculinity 0.000 0.009 0.004 0.009* 0.003 0.007*
(0.964) (0.150) (0.462) (0.060) (0.437) (0.094)
Intercept 1.699 -0.737 1.219 2.421 -0.655 1.386 -0.469 -2.189* -0.226 0.316 -2.231* 0.325 3.060* 1.493 3.335*** 4.081*** 1.326 1.572
(0.418) (0.642) (0.541) (0.173) (0.694) (0.556) (0.770) (0.076) (0.850) (0.789) (0.065) (0.820) (0.052) (0.130) (0.010) (0.000) (0.208) (0.277)
Number of observations 1,082 1,082 1,082 1,082 1,082 1,082 1,510 1,510 1,510 1,510 1,510 1,508 2,002 2,002 2,002 2,002 2,002 1,976
Adjusted R2 0.087 0.087 0.090 0.087 0.087 0.079 0.072 0.072 0.078 0.071 0.072 0.064 0.089 0.088 0.090 0.088 0.088 0.068
Panel A Panel B Panel C
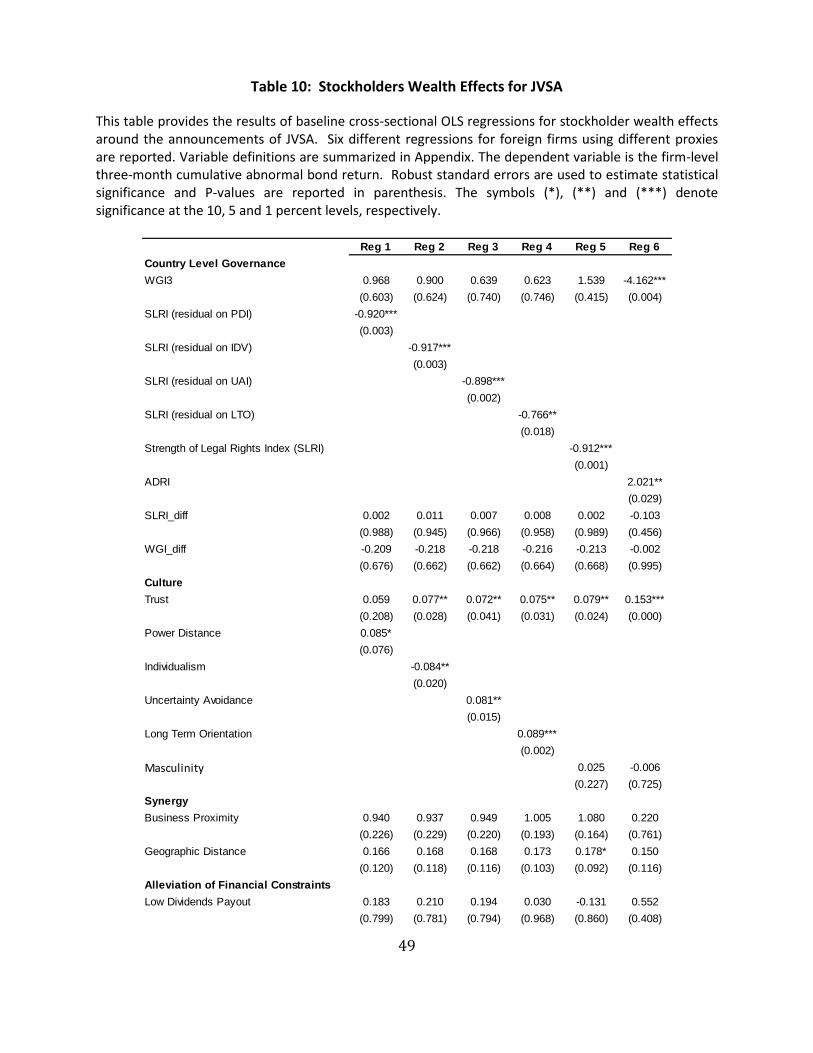
49
Table 10: Stockholders Wealth Effects for JVSA
This table provides the results of baseline cross-sectional OLS regressions for stockholder wealth effects around the announcements of JVSA. Six different regressions for foreign firms using different proxies are reported. Variable definitions are summarized in Appendix. The dependent variable is the firm-level three-month cumulative abnormal bond return. Robust standard errors are used to estimate statistical significance and P-values are reported in parenthesis. The symbols (*), (**) and (***) denote significance at the 10, 5 and 1 percent levels, respectively.
Reg 1 Reg 2 Reg 3 Reg 4 Reg 5 Reg 6
Country Level Governance
WGI3 0.968 0.900 0.639 0.623 1.539 -4.162***
(0.603) (0.624) (0.740) (0.746) (0.415) (0.004)
SLRI (residual on PDI) -0.920***
(0.003)
SLRI (residual on IDV) -0.917***
(0.003)
SLRI (residual on UAI) -0.898***
(0.002)
SLRI (residual on LTO) -0.766**
(0.018)
Strength of Legal Rights Index (SLRI) -0.912***
(0.001)
ADRI 2.021**
(0.029)
SLRI_diff 0.002 0.011 0.007 0.008 0.002 -0.103
(0.988) (0.945) (0.966) (0.958) (0.989) (0.456)
WGI_diff -0.209 -0.218 -0.218 -0.216 -0.213 -0.002
(0.676) (0.662) (0.662) (0.664) (0.668) (0.995)
Culture
Trust 0.059 0.077** 0.072** 0.075** 0.079** 0.153***
(0.208) (0.028) (0.041) (0.031) (0.024) (0.000)
Power Distance 0.085*
(0.076)
Individualism -0.084**
(0.020)
Uncertainty Avoidance 0.081**
(0.015)
Long Term Orientation 0.089***
(0.002)
Masculinity 0.025 -0.006
(0.227) (0.725)
Synergy
Business Proximity 0.940 0.937 0.949 1.005 1.080 0.220
(0.226) (0.229) (0.220) (0.193) (0.164) (0.761)
Geographic Distance 0.166 0.168 0.168 0.173 0.178* 0.150
(0.120) (0.118) (0.116) (0.103) (0.092) (0.116)
Alleviation of Financial Constraints
Low Dividends Payout 0.183 0.210 0.194 0.030 -0.131 0.552
(0.799) (0.781) (0.794) (0.968) (0.860) (0.408)
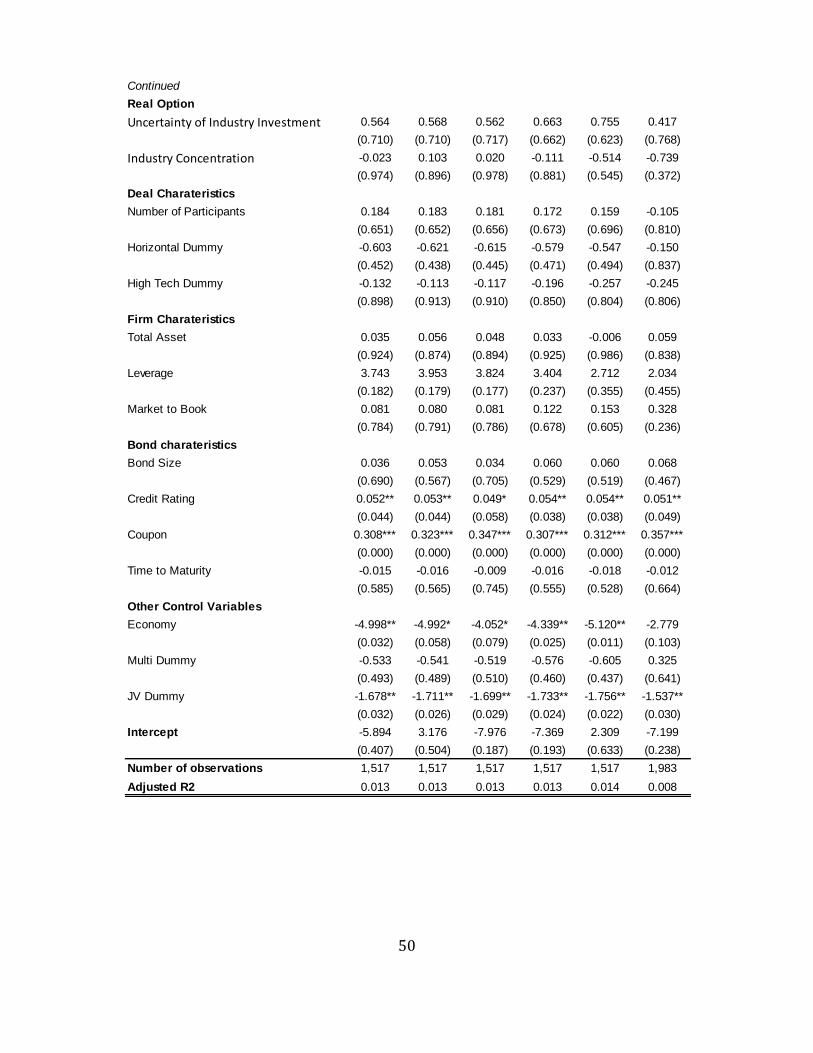
50
Continued
Real Option
Uncertainty of Industry Investment 0.564 0.568 0.562 0.663 0.755 0.417
(0.710) (0.710) (0.717) (0.662) (0.623) (0.768)
Industry Concentration -0.023 0.103 0.020 -0.111 -0.514 -0.739
(0.974) (0.896) (0.978) (0.881) (0.545) (0.372)
Deal Charateristics
Number of Participants 0.184 0.183 0.181 0.172 0.159 -0.105
(0.651) (0.652) (0.656) (0.673) (0.696) (0.810)
Horizontal Dummy -0.603 -0.621 -0.615 -0.579 -0.547 -0.150
(0.452) (0.438) (0.445) (0.471) (0.494) (0.837)
High Tech Dummy -0.132 -0.113 -0.117 -0.196 -0.257 -0.245
(0.898) (0.913) (0.910) (0.850) (0.804) (0.806)
Firm Charateristics
Total Asset 0.035 0.056 0.048 0.033 -0.006 0.059
(0.924) (0.874) (0.894) (0.925) (0.986) (0.838)
Leverage 3.743 3.953 3.824 3.404 2.712 2.034
(0.182) (0.179) (0.177) (0.237) (0.355) (0.455)
Market to Book 0.081 0.080 0.081 0.122 0.153 0.328
(0.784) (0.791) (0.786) (0.678) (0.605) (0.236)
Bond charateristics
Bond Size 0.036 0.053 0.034 0.060 0.060 0.068
(0.690) (0.567) (0.705) (0.529) (0.519) (0.467)
Credit Rating 0.052** 0.053** 0.049* 0.054** 0.054** 0.051**
(0.044) (0.044) (0.058) (0.038) (0.038) (0.049)
Coupon 0.308*** 0.323*** 0.347*** 0.307*** 0.312*** 0.357***
(0.000) (0.000) (0.000) (0.000) (0.000) (0.000)
Time to Maturity -0.015 -0.016 -0.009 -0.016 -0.018 -0.012
(0.585) (0.565) (0.745) (0.555) (0.528) (0.664)
Other Control Variables
Economy -4.998** -4.992* -4.052* -4.339** -5.120** -2.779
(0.032) (0.058) (0.079) (0.025) (0.011) (0.103)
Multi Dummy -0.533 -0.541 -0.519 -0.576 -0.605 0.325
(0.493) (0.489) (0.510) (0.460) (0.437) (0.641)
JV Dummy -1.678** -1.711** -1.699** -1.733** -1.756** -1.537**
(0.032) (0.026) (0.029) (0.024) (0.022) (0.030)
Intercept -5.894 3.176 -7.976 -7.369 2.309 -7.199
(0.407) (0.504) (0.187) (0.193) (0.633) (0.238)
Number of observations 1,517 1,517 1,517 1,517 1,517 1,983
Adjusted R2 0.013 0.013 0.013 0.013 0.014 0.008
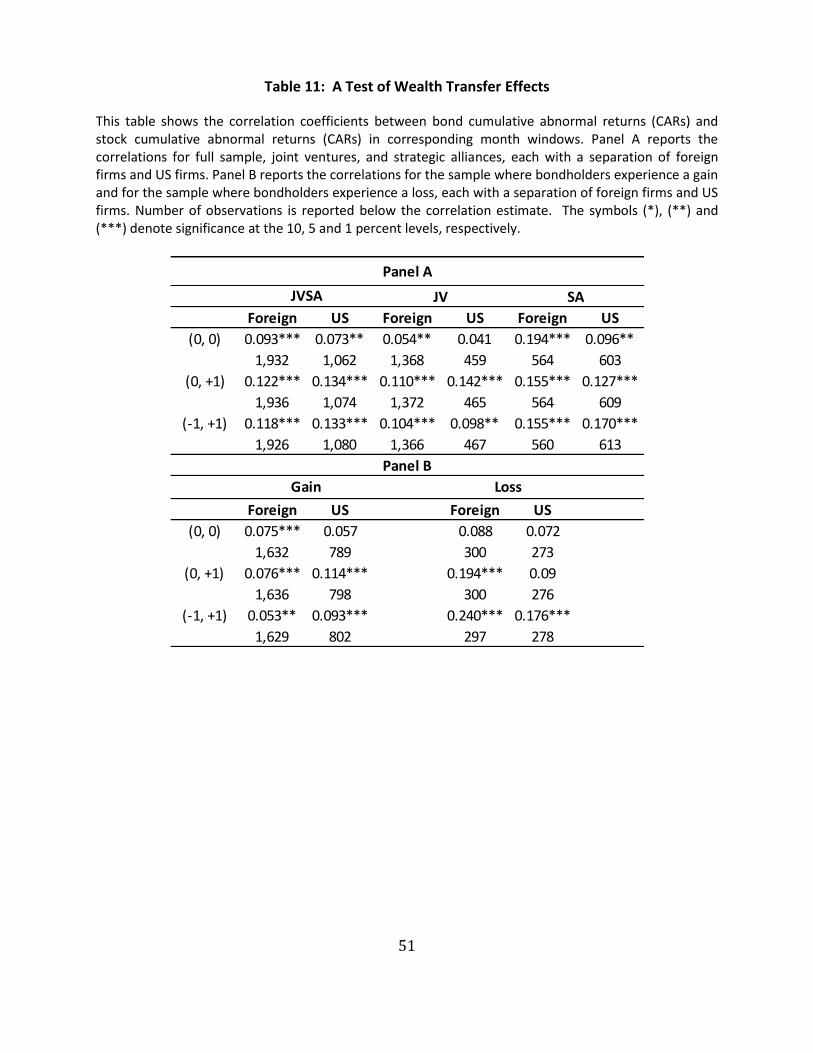
51
Table 11: A Test of Wealth Transfer Effects
This table shows the correlation coefficients between bond cumulative abnormal returns (CARs) and stock cumulative abnormal returns (CARs) in corresponding month windows. Panel A reports the correlations for full sample, joint ventures, and strategic alliances, each with a separation of foreign firms and US firms. Panel B reports the correlations for the sample where bondholders experience a gain and for the sample where bondholders experience a loss, each with a separation of foreign firms and US firms. Number of observations is reported below the correlation estimate. The symbols (*), (**) and (***) denote significance at the 10, 5 and 1 percent levels, respectively.
Foreign US Foreign US Foreign US
(0, 0) 0.093*** 0.073** 0.054** 0.041 0.194*** 0.096**
1,932 1,062 1,368 459 564 603
(0, +1) 0.122*** 0.134*** 0.110*** 0.142*** 0.155*** 0.127***
1,936 1,074 1,372 465 564 609
(-1, +1) 0.118*** 0.133*** 0.104*** 0.098** 0.155*** 0.170***
1,926 1,080 1,366 467 560 613
Foreign US Foreign US
(0, 0) 0.075*** 0.057 0.088 0.072
1,632 789 300 273
(0, +1) 0.076*** 0.114*** 0.194*** 0.09
1,636 798 300 276
(-1, +1) 0.053** 0.093*** 0.240*** 0.176***
1,629 802 297 278
Panel A
Panel B
Gain Loss
JVSA JV SA