BOND OF LAP SPLICED BARS IN SELF-COMPACTING CONCRETE...
98
BOND OF LAP SPLICED BARS IN SELF-COMPACTING CONCRETE A THESIS SUBMITTED TO THE GRADUATE SCHOOL OF NATURAL AND APPLIED SCIENCE OF MIDDLE EAST TECHNICAL UNIVERSITY BY MEHRAN GHASABEH IN PARTIAL FULLFILMENT OF THE REQUIREMENTS FOR THE DEGREE OF MASTER OF SCIENCE IN CIVIL ENGINEERING JANUARY 2013
Transcript of BOND OF LAP SPLICED BARS IN SELF-COMPACTING CONCRETE...
BOND OF LAP SPLICED BARS IN SELF-COMPACTING CONCRETE
A THESIS SUBMITTED TO
THE GRADUATE SCHOOL OF NATURAL AND APPLIED SCIENCE
OF MIDDLE EAST TECHNICAL UNIVERSITY
BY
MEHRAN GHASABEH
IN PARTIAL FULLFILMENT OF THE REQUIREMENTS
FOR
THE DEGREE OF MASTER OF SCIENCE
IN CIVIL ENGINEERING
JANUARY 2013


Approval of the thesis:
Submitted by MEHRAN GHASABEH in partial fulfillment of the requirements for
the degree of Master of Science in Civil Engineering Department, Middle East
Technical University, by,
Prof. Dr. Canan Özgen ____________________
Dean, Graduate School of Natural and Applied Sciences
Prof. Dr.Ahmet Cevdet Yalçıner ____________________ Head of Department, Civil Engineering
Assoc. Prof. Dr. Erdem Canbay ____________________
Supervisor,Civil Engineering Department, METU
Examining Committee Members
Prof. Dr. Güney Özcebe ____________________
Civil Engineering Department, METU
Assoc. Prof. Dr. Erdem Canbay ____________________
Civil Engineering Department, METU
Prof. Dr. Barış Binici ____________________
Civil Engineering Department, METU
Assoc. Prof. Dr. Özgür Anıl ____________________
Civil Engineering Department, Gazi University
Asst. Prof. Dr. Burcu Burak ____________________
Civil Engineering Department, METU
Date: 01.02.2013

iv
I hereby declare that all information in this document has been obtained and presented in accordance with academic rules and ethical conduct. I also
declare that, as required by these rules and conduct, I have fully cited and
referenced all material and results that are not original to this work.
Name, Last Name: Mehran Ghasabeh
Signature :

v
ABSTRACT
BOND OF LAP-SPLICED BARS
IN SELF-COMPACTING CONCRETE
GHASABEH, Mehran
M.S., Department of Civil Engineering
Supervisor: Assoc. Prof. Dr. Erdem CANBAY
January 2013, 82 Pages
Self-compacting concrete is an innovative construction material; its priority to
normal vibrated concrete is that there is not any vibration requirement. Bond
strength of reinforcement is one of the key factors that ensures the usefulness of
any reinforced concrete structure. In this study, 6 full-scale concrete beams spliced at the mid-span were tested under two-point symmetrical loading. Test variables
were bottom cover, side cover, free spacing between longitudinal reinforcement, lap-
splice length and presence of transverse reinforcements within the lap-splice
region.
Specimen SC_22_44_88_800 had cover dimensions close to the code limits and had 36db lap splice length. This specimen showed flexural failure. Specimen
SC_44_44_44_710 had 32db lap splice and cover dimensions greater than code
minimums. This specimen showed yielding primarily. With the increasing loading,
however, bond failure occurred with side splitting.
ACI 408 descriptive equation for normal vibrated concrete predicted bar stresses of the unconfined specimens produced with self-compacting concrete acceptably well.
The predicted values were lower than the measured values to be on the safe side.
The error varied between 3.4% and 6.5%.
All predictions of the ACI408 descriptive equation was higher than the measured
bar stresses of the confined specimens produced with SCC. All the calculated values were unsafe. The error varied between 10.6% and 34.5%.
Specimen SC_44_22_22_530_T4 with 24db lap splice length had side cover and
spacing between bars 63.3% and 56.7% less than the ACI 318 limits. The
calculated bar stress was 21.6% higher than the measured value. The main reason
of the deviation was inadequate cover dimensions.
In specimen SC_44_22_22_530_T6, number transverse reinforcement was
increased to 6 stirrups to overcome the small cover and spacing problem. However,
increased number of stirrups inside a small side and face cover caused weak plane
and measured bar stress decreased.
Keywords: Self-Compacting Concrete, Full-scale beam test, Bond, Lap Splice,
Transverse Reinforcement.

vi
ÖZ
KENDİNDEN YERLEŞEN BETONDA
BİNDİRMELİ EKLERİN ADERANSI
GHASABEH, Mehran
Yüksek Lisans, İnşaat Mühendisliği Bölümü
Danışman: Doç. Dr. Erdem CANBAY
Ocak 2013, 82 Sayfa
Kendinden yerleşen beton yenilikçi bir inşaat malzemesidir; normal betona göre
üstünlüğü vibrasyon ihtiyacı göstermemesidir. Donatının aderansı betonarme
yapıların kullanılabilirliğin anahtar etmenlerindendir. Bu çalışmada 6 tam ölçekli
orta açıklığında bindirmeli ek yapılmış kiriş simetrik iki nokta altında test edilmiştir. Deney değişkenleri alt beton pas payı, yan beton pas payı, boyuna donatı
arasındaki serbest açıklık, bindirmeli eklerin uzunluğu ve bindirmeli ek boyunca
yatay donatının bulunup bulunmamasıdır.
SC_22_44_88_800 deney elemanının şartname limitlerine yakın pas payı vardır ve 36db bindirme boyu vardır. Bu elemanda eğilme kırılması olmuştur. SC_44_44_44_710 deney elemanının 32db bindirme boyu ve şartname
minimumlarından daha büyük pas payı vardır. Bu elemanda ilk önce akma
gerçekleşmiştir. Ancak artan yüklemeyle yan yüz aderans kırılması gerçekleşmiştir.
ACI 408 normal vibrasyonlu beton için olan denklemi, sargılanmamış kendinden
yerleşen beton ile imal edilmiş deney elemanlarının donatı gerilmelerini kabul edilir sınırlarda tahmin etmiştir. Hesaplanan değerler ölçülen değerlerin altında güvenli
taraftadır. Hesap hatası %3,4 ile %6,5 arasındadır.
ACI 408 denkleminin kendinden yerleşen betonla üretilmiş sargılı elemanlarla ilgili
tüm tahminleri ölçülen değerlerin üstündedir. Tüm hesaplanan değerler güvensiz
yöndedir. Hata %10,6 ile %34,5 arasında değişmektedir. 24db bindirme boyu olan deney elemanı SC_44_22_22_530_T4 yan pas payı ile
donatı arası mesafeleri ACI 318 limitlerine göre %63,3% ve %56,7 azdır.
Hesaplanan donatı gerilmesi ölçülen değere göre %21.6 fazladır. Bu sapmanın ana
sebebi yetersiz pas payıdır.
SC_44_22_22_530_T6 deney elemanında enine donatı sayısı 6’ya çıkarılarak
yetersiz pas payı problem aşılmaya çalışılmıştır. Ancak, yetersiz beton pas payı
içinde artırılan yatay donatı zayıf bir yüzey oluşturmuştur ve ölçülen gerilme
değerleri daha da düşmüştür.
Anahtar Kelimeler: Kendinden Yerleşen Beton, Tam Boyutlu Kiriş Deneyi, Aderans,
Bindirmeli Ek, Enine Donatı.

vii
DEDICATED TO MY DEAR PARENTS
Rahim Ghasabeh and Noras Eskandari

viii
ACKNOWNLEDGMENT
“Learning never exhausts the mind.” ― Leonardo da Vinci
Foremost, I wish to express my sincere thanks and appreciation to my master thesis supervisor, Assoc. Prof. Dr. Erdem Canbay for his continuous support,
patience and motivation in all the time of research and writing this thesis.
I would like to thank the examining committee members, Prof. Dr. Güney Özcebe,
Prof. Dr. Barış Binici, Asst. Prof. Dr. Burcu Burak, Dr. Özgür Anıl and other faculty
members with whom I have taken courses, in particular, Prof. Dr. Tanvir Wasti for his motivated suggestions.
I would like to thank the staff of the structural mechanics laboratory who were
helped and supported me throughout my experimental study.
I would like to thank all my friends both in Iran and Turkey, particularly Aynaz
Lotfata.
Moreover, I would like to give my especially deepest gratitude to my dear patents,
during these two and half years, I have lived away from them. I am deeply indebted
to them for their supports in my whole life.

ix
TABLE OF CONTENTS
ABSTRACT ............................................................................................................ v ÖZ ....................................................................................................................... vi
ACKNOWNLEDGMENT ....................................................................................... viii
LIST OF TABLES .................................................................................................. xi
LIST OF FIGURES ............................................................................................... xii
LIST OF SYMBOLS ............................................................................................. xiv CHAPTERS
1. INTRODUCTION ............................................................................................ 1
1.1. General ............................................................................................... 1
1.2. Fresh and hardened properties of self-compacting concrete .................. 2
1.3. Bond Behavior .................................................................................... 2
1.4. Research Needs ................................................................................... 4
1.5. Objective and Scope ............................................................................ 4
2. Literature Review .......................................................................................... 5 3. EXPERIMENTAL PROGRAM ........................................................................ 11
5.1 General ................................................................................................ 11
5.1 Material................................................................................................ 11
3.3. Formwork ......................................................................................... 14
3.4. Test methods for SCC ........................................................................ 16
3.5. Stress Calculation ............................................................................. 20
3.6. Details of beam specimens ................................................................ 20
3.7. Test set up and loading ..................................................................... 28
3.8. Instrumentation ................................................................................ 28
4. OBSERVED BEHAVIOR OF TEST SPECIMENS ............................................ 33
4.1. General ............................................................................................. 33
4.2. Information of Graphs ....................................................................... 33
4.2.1. Deflection and Support Settlement ................................................. 33
4.2.2. Strain Graphs ................................................................................ 34
4.3. Observed Behavior of Specimens ....................................................... 35
4.3.1. Specimen SC_22_44_88_530 .......................................................... 35
4.3.2. Specimen SC_22_44_88_800 .......................................................... 38
4.3.3. Specimen SC_44_44_44_710 .......................................................... 41
4.3.4. Specimen SC_44_44_44_530_T4 .................................................... 44
4.3.5. Specimen SC_44_22_22_530_T4 .................................................... 47
4.3.6. Specimen SC_44_22_22_530_T6 .................................................... 50
5. ANALYSIS AND DISCUSSION OF RESULTS ................................................. 55
5.1. General ............................................................................................. 55
5.3. Comparison of the Load-Deflection Curves ......................................... 56
5.4. Strain Profiles on Longitudinal Reinforcement .................................... 65
5.5. Strain Profiles on Transverse Reinforcement ...................................... 70

x
5.6. Comparison of the Measured and Calculated Ultimate Stresses .......... 72
6. CONCLUSIONS ........................................................................................... 75 REFERENCES .................................................................................................... 77
A. THEORETICAL MOMENT CURVATURE DIAGRAMS OF SPECIMENS ............ 80

xi
LIST OF TABLES
TABLES
Table 3.1 Concrete mix design ................................................................... 11 Table 3.2 Concrete strength of specimens .................................................. 13 Table 3.3 Geometrical properties of reinforcing bars ................................... 14 Table 3.4 Properties of reinforcing bars ...................................................... 14 Table 3.5 Result for fresh SCC ................................................................... 20 Table 3.6 Dimensions of Specimens ........................................................... 21
Table 5.1 Measured and Calculated Cracking Loads …………………………… 56
Table 5.2 Tests results…………………………………………………………………. 73
xii
LIST OF FIGURES
FIGURES
Figure 1.1 Bond force transfer mechanism (ACI 408R-03, 2003) .................... 3 Figure 1.2 Bond crack ................................................................................... 4
Figure 3.1 Bleeding observed during pouring of concrete ............................. 12 Figure 3.2 Concrete casting ......................................................................... 12 Figure 3.3 Detail of framework .................................................................... 15 Figure 3.4 Finished view of formwork .......................................................... 15 Figure 3.5 Formwork with reinforcement cage ............................................. 16 Figure 3.6 Base plate with the cone ............................................................. 16 Figure 3.7 Slump and T500 test method for fresh SCC ................................ 17 Figure 3.8 T500 test method .......................................................................... 17 Figure 3.9 Slump flow test method ............................................................. 17 Figure 3.10 V-funnel test method .................................................................. 18 Figure 3.11 L-Box test method ...................................................................... 19 Figure 3.12 Side cover, bottom cover and free spacing between lap spliced bars
.................................................................................................. 21 Figure 3.13 Details of specimen SC_22_44_88_530 ........................................ 22 Figure 3.14 Details of specimen SC_22_44_88_800 ...................................... 23 Figure 3.15 Details of specimen SC_44_44_44_710 ........................................ 24 Figure 3.16 Details of specimen SC_44_44_44_530_T4 .................................. 25 Figure 3.17 Details of specimen SC_44_22_22_530_T4 .................................. 26 Figure 3.18 Details of specimen SC_44_22_22_530_T4 .................................. 27 Figure 3.19 Test set up for all beam specimens ............................................. 28 Figure 3.20 Schematic view of instrumentation ............................................. 29 Figure 3.21 Load cell used in test .................................................................. 30 Figure 3.22 Locations of strain gauges on the longitudinal reinforcements ..... 31 Figure 3.23 Locations of strain gauges on the transverse reinforcements ........ 31
Figure 4.1 Schematic view of measuring instruments set up ....................... 34 Figure 4.2 Strain gauges instrumentation for longitudinal reinforcing bars.. 34 Figure 4.3 Strain gauges instrumentation for transverse reinforcement ....... 35 Figure 4.4 Load versus Deflection Charts ................................................... 36 Figure 4.5 Load versus Support Displacement ............................................. 36 Figure 4.6 Load versus Longitudinal Strain Charts ..................................... 37 Figure 4.7 Cracks formation on the side and bottom cover within the splice
region ........................................................................................ 38 Figure 4.8 Load versus Deflection Charts .................................................... 39 Figure 4.9 Load versus Support Displacement ............................................. 39 Figure 4.10 Load versus Longitudinal Strain ................................................. 40 Figure 4.11 Cracks formation on the side and bottom cover of the specimen .. 41 Figure 4.12 Load versus Deflection Charts .................................................... 42 Figure 4.13 Load versus Support Displacement ............................................. 42 Figure 4.14 Load versus Longitudinal Strain Charts ...................................... 43 Figure 4.15 Cracks formation and side splitting occurrence ........................... 44 Figure 4.16 Load versus Deflection Charts .................................................... 45 Figure 4.17 Load versus Support Displacement ............................................. 45 Figure 4.18 Load versus Longitudinal Strain Charts ...................................... 46 Figure 4.19 Load versus Transverse Strain Chart .......................................... 46
xiii
Figure 4.20 Cracks formation and side splitting on the side cover of the
specimen ................................................................................... 47 Figure 4.21 Load versus Deflection Charts .................................................... 48 Figure 4.22 Load versus Support Displacement ............................................. 48 Figure 4.23 Load versus Longitudinal Strain Charts ...................................... 49 Figure 4.24 Load versus Transverse Strain Charts ......................................... 49 Figure 4.25 Cracks formation and side splitting occurrence on the side cover of
the specimen ............................................................................. 50 Figure 4.26 Load versus Deflection Charts .................................................... 51 Figure 4.27 Load versus Support Displacement ............................................. 51 Figure 4.28 Load versus Longitudinal Strain Charts ...................................... 52 Figure 4.29 Load versus Transverse Strain .................................................... 52 Figure 4.30 Cracks formation and side splitting occurrence on the side cover of
the specimen ............................................................................. 53
Figure 5.1 Real and Transformed Cross Section ........................................... 55 Figure 5.2 Experimental cracking load determination ................................. 56 Figure 5.3 Moment Diagram of test specimens ............................................ 57 Figure 5.4 Curvature and Deflection Diagrams of test specimens ................ 58 Figure 5.5 Load versus Total Deflection curves for SC_22_44_88_530 .......... 59 Figure 5.6 Moment-Curvature Diagram for SC_22_44_88_530 ..................... 59 Figure 5.7 Load versus Total Deflection curves for SC_22_44_88-800 ........... 60 Figure 5.8 Moment-Curvature Diagram for SC_22_44_88_800 ..................... 60 Figure 5.9 Load versus Total Deflection curves for SC_44_44_44_710 .......... 61 Figure 5.10 Moment-Curvature Diagram for SC_44_44_44_710 ..................... 61 Figure 5.11 Load versus Total Deflection curves for SC_44_44_44_530_T4 ..... 62 Figure 5.12 Moment-Curvature Diagram for SC_44_44_44_530_T4 ................ 62 Figure 5.13 Load versus Total Deflection curves for SC_44_22_22_530_T4 ..... 63 Figure 5.14 Moment-Curvature Diagram for SC_44_22_22_530_T4 ................ 63 Figure 5.15 Load versus Total Deflection curves for SC_44_22_22_530_T6 ..... 64 Figure 5.16 Moment-Curvature Diagram for SC_22_db_24_T6 ....................... 64 Figure 5.17 Longitudinal strain gage locations ............................................... 65 Figure 5.18 Longitudinal strains at the ultimate stage for SC_22_44_88_530 . 65 Figure 5.19 Longitudinal strains at the ultimate stage for SC_22_44_88_800 . 66 Figure 5.20 Longitudinal strains at the ultimate stage for SC_22_44_88_800 . 66 Figure 5.21 Longitudinal strains at the ultimate stage for SC_22_44_88_800 . 66 Figure 5.22 Longitudinal strains at the ultimate stage for SC_44_44_44_710 . 67 Figure 5.23 Longitudinal strains at the ultimate stage for SC_44_44_44_710 . 67 Figure 5.24 Longitudinal strains at the ultimate stage for SC_44_44_44_710 . 67 Figure 5.25 Longitudinal strains at the ultimate stage for SC_44_44_44_530_T4
................................................................................................. 68 Figure 5.26 Longitudinal strains at the ultimate stage for SC_44_44_44_530_T4
................................................................................................. 68 Figure 5.27 Longitudinal strains at the ultimate stage for SC_44_44_44_530_T4
................................................................................................. 68 Figure 5.28 Longitudinal strains at the ultimate stage for SC_44_22_22_530_T4
................................................................................................. 69 Figure 5.29 Longitudinal strains at the ultimate stage for SC_44_22_22_530_T4
................................................................................................. 69 Figure 5.30 Longitudinal strains at the ultimate stage for SC_44_22_22_530_T6
................................................................................................. 69 Figure 5.31 Longitudinal strains at the ultimate stage for SC_44_22_22_530_T6
................................................................................................. 70
xiv
Figure 5.32 Longitudinal strains at the ultimate stage for SC_44_22_22_530_T6
.................................................................................................. 71 Figure 5.33 Strain value at ultimate for transverse reinforcements of
SC_44_44_44_530_T4 ................................................................ 71 Figure 5.34 Strain value at ultimate for transverse reinforcements of
SC_44_22_22_530_T4 ................................................................ 71 Figure 5.35 Strain value at ultimate for transverse reinforcements of
SC_44_22_22_530_T6 ................................................................ 72 Figure A.1 Moment Curvature Diagram – SC_22_44_88_530 ........................ 80 Figure A.2 Moment Curvature Diagram – SC_22_44_88_800 ........................ 80 Figure A.3 Moment Curvature Diagram – SC_44_44_44_710 ........................ 81 Figure A.4 Moment Curvature Diagram – SC_44_44_44_530_T4 ................... 81 Figure A.5 Moment Curvature Diagram – SC_44_22_22_530_T4 ................... 82 Figure A.6 Moment Curvature Diagram – SC_44_22_22_530_T6 ................... 82


xiv
LIST OF SYMBOLS
a Distance of the point load to the support Ab area of bar being developed or spliced Atr Total cross-sectional area of all transverse reinforcement which is within the
spacing s and which crosses the potential plane of splitting through the
reinforcement being developed. bw Width of specimen
cb bottom concrete cover for reinforcing bar being developed or spliced
cmax maximum (cb, cs)
cmin maximum (cb, csi) cs minimum [cso , csi + 6.4 mm]
csi ½ of the bar clear spacing
cs side cover
db Diameter of reinforcing bars
f´c 28 days cylinder compressive strength of concrete
fc Cylinder compressive strength of concrete
fcts Split tensile strength of concrete
fs stress in reinforcing bars fy Longitudinal reinforcement yield strength
Ktr transverse reinforcement index ls Development or splice length n Number of bars or wires being spliced or developed along the plane of
splitting N the number of transverse stirrups, or ties, within the development or splice
length tA/C Tangential deviations between points A and C
tB/C Tangential deviations between points B and C
td The bar diameter factor
tr The relative rib area factor
A Deflection at point A
Deflection at point B
Reinforcement bar diameter

1
CHAPTER 1
INTRODUCTION
1.1. General
Concrete, along with steel, is one of the most popular construction materials of the
last century. Since fresh mix of concrete is flowable, concrete can be molded into
any shape as long as the formwork can be built for the desired shape. Concrete mix is very important because of the target strength and workability. To increase the
strength of concrete, water/cement ratio should be decreased which arises
workability problems. To avoid honeycombing in concrete, it should be properly
compacted by means of vibrators when it is placed into the forms. However,
compaction is carried out by unskilled workers on site and it is very tiring and demanding work. Therefore, a substantial proportion of concrete is not adequately
compacted in reality. High water content can increase the level of workability
whereas it causes segregation and decrease the target strength of concrete.
After the Second World War in Japan, the rapid reconstruction projects concealed
the construction quality. Those structures deteriorated very rapidly in one or two decades which initiated investigation of the unsatisfactory performance of concrete.
Many researches aimed improvement in the durability of concrete. The cause of
deterioration of concrete was found to be mainly insufficient compaction of concrete
and the solution was proposed as increasing the workability of the fresh mix so
much that compaction was no longer necessary (De Schutter, Bartos, Domone, &
Gibbs, 2008), (Ozawa, et al. 1989), (Tanaka, Sato, et al., 1993), (Miura, Takeda, Chikamatsu, & and Sogo, 1993), (Hayakawa, Matsouka and Shindoh 1993).
Self-compacting concrete (SCC) can be defined as specially produced concrete that
flows under its own weight, fills the required space or formwork completely and
produces a dense and adequately homogenous material without the need for compaction. SCC resists segregation and maintains its stable composition during
transportation and placing (De Schutter, Bartos, Domone, & Gibbs, 2008). Today,
SCC has been used widely all around the world. In general, SCC is produced with
conventional concrete materials and viscosity-modifying admixture (VMA) (ACI
237R-07, 2007). SCC is also named as self-consolidating concrete, self-leveling
concrete, and self-placing concrete in the literature.
SCC has many advantages such as reducing the labor and equipment for vibration
to get appropriate compaction/consolidation, and for screeding operations to get
flat surfaces. Mechanical properties of SCC are always very high. SCC also
accelerates construction time. For complex formworks, it ensures high construction quality. Even at congested reinforcement, SCC places perfectly into
the formwork.
2
1.2. Fresh and hardened properties of self-compacting concrete
Although SSC and traditionally vibrated concrete have similar hardened properties
such as strength and elastic modulus, there are unavoidable differences in practical mix design (Domone, 2007), (De Schutter, Bartos, Domone, & Gibbs,
2008). Materials that constitute self-compacting concrete are the same as used for
normal concrete. The most usual distinction lies in higher powder content and a
low water/powder ratio in self-compacting concrete than normal concrete. The
compressive strength increment of SCC depends on portion of additions. Limestone powder is an ordinary addition that contributes considerably to the rate of gain of
strength. In addition, usage of viscosity modifying admixtures upgrades the
stability of SCC. The types of superplasticiser define the effectualness of a viscosity
material admixture. There are three key properties of fresh SCC, namely:
Filling ability
Passing ability
Segregation resistance Filling ability is the ability of the fresh mix to flow under its own weight and
perfectly fill all the spaces in the formwork. Passing ability is the ability which
demonstrates how well the fresh mix flow through constrained formwork.
Segregation resistance, which is determined by the plastic viscosity and density of
the cement paste, is the ability of fresh mix to keep its basic apportionment of
constituent materials during transport, placing and compaction.
Some tests, which are different than normal vibrated concrete, are performed to explore the key properties of fresh SCC. These tests are Slump-flow test, T500 time,
V-funnel and L-Box.
The Slump-flow test and T500 time is a test to evaluate flowability and the flow rate
of self-compacting concrete in the absence of restrictions. Unlike the normal
vibrated concrete, an unconfined horizontal spread of the sample is measured as the slump-flow. T500 time is a time measured when horizontal spread of the sample
reaches a circle of 500 mm diameter.
The V-funnel test is used to evaluate the viscosity and filling ability of self-compacting concrete. The V-funnel flow time is the period a defined volume of SCC
needs to pass a narrow opening. The time measured as test result is fundamentally
depends on plastic viscosity provided that blocking and/or segregation do not take
place.
The L-Box test is used to evaluate the passing ability of self-compacting concrete to flow through tight openings including spaces between reinforcing bars and other
obstructions without segregation or blocking.
1.3. Bond Behavior
In reinforced concrete construction, bond between concrete and steel is one of the
essential factor affecting the member behavior. The resistance of plain concrete
against tension is lower in comparison with its compressive strength; due to this
fact concrete has been classified as brittle material. The role of steel bars in
concrete member is to enhance the tensile strength of concrete. For this reason, perfect bond between steel bars and concrete is necessary. The features of bond
depend mainly on:

3
Adhesion between steel and concrete
Friction between steel and concrete
Bearing of the deformation on the steel surface against surrounding concrete
For deformed bars, bearing of the deformation on the steel surface against surrounding concrete has consequential role in force transfer between steel bars
and concrete. Adhesion and friction have little contribution for deformed bars. For
this reason, the use of plain bars is prohibited in structural members.
As it is shown in Figure 1.1, due to existence of ribs and lugs along deformed bar, a
great majority of forces are transferred by bearing and friction forces act on it. The force transfer by adhesion and friction along the surface of the bar is lost after
initial slip.
Figure 1.1 Bond force transfer mechanism (ACI 408R-03, 2003)
Bond behavior mainly depends on the variables listed below:
The mechanical properties of the concrete (associated with tensile and bearing strength);
The volume of the concrete around the bars (related to concrete cover and bar spacing parameters);
The presence of confinement in the form of transverse reinforcement which can delay and control crack propagation;
The surface condition of the bar;
The geometry of the bar (deformation height, spacing, width, and face angle).
According to the ACI report “Bond and Development of Straight Reinforcing Bars in
Tension” (ACI 408R-03), factors affecting bond behavior are classified in three
categories as structural characteristics, bar properties and concrete properties.
Two types of splitting failure can occur due to insufficient bond characteristics. Side splitting occurs if total face cover is larger than sum of side cover and bar clear
spacing, Figure 1.2. If the concrete face cover is smaller than half of the free
spacing between the bars, the splitting crack occurs through the cover to the free
surface known as face splitting.

4
Figure 1.2 Bond crack
1.4. Research Needs
Bond strength of the steel reinforcing bars has been studied by many researchers for more than 100 years. Thaddeus Hyatt (1877) is one of the first investigators,
made tests to determine the bond between concrete and iron bars. In the following
years, Duff A. Abrams (1913) started a project took about three years for bond
between steel bars of any kind (plain and deformed) and concrete. During these
years significant modifications have been done by code provisions. There are
extensive numbers of researches on bond in the literature. Even, researches on bond behavior of SCC are outrageous. However, studies on bond behavior of SCC
are limited with small cubical or cylindrical specimens and with pull-out tests
(Canbay, 2009). In order to observe better the top-bar effect of SCC, pull-out tests
were also performed on some wall or column members (Yin-Wen, et al., 2003),
(Valcuende, et al., 2009). A study on small beam-end specimens was also
conducted for SCC (de Almeida Filho, et al., 2008), (Desnerk, et al., 2010). There are limited studies on the literature carried out on full-scale beams with lap splices
for SCC (Türk, et al., 2008), (de Almeida Filho, et al., 2008), (Pandurangan, et al.,
2010). It can be concluded that there is a need for bond tests on SCC with full-scale
beams to justify conclusions deduced from limited tests.
1.5. Objective and Scope
The objective of this study is to investigate the bond behavior between steel
reinforcing bars and self-compacting concrete, and evaluate the effect of different
parameters affecting the bond characteristics in SCC. In this study, three reports are followed; namely, ACI 408R-03 Bond and Development of Straight Reinforcing
Bars in Tension, ACI R237-07 Self-Consolidating Concrete, and The European
Guidelines for Self-Compacting Concrete. Totally six full-scale bottom cast beam
specimens were prepared. The parameters affecting bond behavior and considered
in this study were number of transverse reinforcing bars along lap-splice region, lap splice length of longitudinal reinforcing bars, cover dimensions, and free spacing
between longitudinal bars. All specimens were simply supported beams and loaded
symmetrically under two points along the length of the beams. All the longitudinal
reinforcement spliced at the mid-span where the shear force is zero and moment is
constant. Tip and mid deflections along with strains on longitudinal and transverse
reinforcement were acquired during the tests.
In this scope, previous publications and researches were reviewed to comprehend
the bond behavior for SCC. Six full scale beam specimens were designed based on
ACI 408R-03 descriptive equation for lap splice length. A suitable test setup was
prepared and all specimens were tested in the laboratory. All the necessary data was gathered with a data acquisition system during testing. Test results were
evaluated analytically to verify the validity of the design equations.
5
CHAPTER 2
LITERATURE REVIEW
The researches and studies associated with bond behavior of reinforced normal-
vibrated concrete members started by Abrams (1913). Based on comprehensive literature survey, significant observations and conclusions of the previous
researches and publications are summarized below. The survey is presented in
chronological order to keep the historical prospective.
Sonebi and Bartos (1999) operated experimental investigation to study the
properties of hardened SCC and the bond with reinforcing bars. According to the RILEM test specification, bond strength was ascertained for reinforcing bars with
two types of diameter embedded in concrete. The obtained results for SCC were
compared with those of a vibrated concrete as reference mix. They concluded briefly
that:
Self-compacting concrete had sufficient flowablity and excellent deformability without blockage.
The compressive strength of SCC is less dependent on curing condition than that of reference mix.
The SCC showed greater stability than that of the reference mix.
The drying shrinkage of SCC was lower than that of reference mix.
In comparison with the reference mix, the bond stress of SCC was obtained
higher.
Yien-Wen Chan, Yu-Sheng Chen, and Yi-Shi Liu (2003) performed direct pullout tests
on reinforcing bar embedded in self-compacting concrete members. Full-scale
reinforced concrete walls were used with a depth of 1200 mm as the pullout
specimens. The reinforcing bars were set up horizontally inside the test specimens at different elevations. Comparison of the test results between the specimens both
with self-compacting concrete (SCC) and ordinary Portland concrete (OPC) was
done by considering the affecting factors such as development of bond strength
with age, influence of compressive strength, top bar effect and effect of high-range
water-reducing admixture at early age. It was concluded that the variation in bond
strength at different elevations in SCC is less significant than that of OPC which is related to the more consistent nature of SCC and the non-consolidating concreting
process. SCC exhibited consequentially higher bond strength and less significant
top-bar effect. Because of the possible retarding effect, more attention required to
be paid to the development in compressive strength and bond strength of SCC. Daoud and Lorrian (2003) carried out the pull-out test to investigate the impact of
reinforcing bar positions on bond strength of SCC. Five different positions of
reinforcement were considered: horizontal (superior, inferior and median), and
vertical (loaded in casting or against casting direction). The results expressed that
when the bars cast in vertical position and loaded against the casting direction, the
highest bond strength was obtained. For bars cast horizontally, by increasing the
depth of concrete underneath the steel bar, the bond strength decreased. The ration between the bond strength of bars cast in vertical and horizontal position
was nearly 1.5. By using image analysis, a satisfying correlation was found between
the bond strength and the difference between the percentage of coarse aggregate
above and below the steel bar for different positions.
6
Zhu, Sonebi and Bartos (2004) fulfilled pullout test to estimate the sequel of
applying SCC on bond and interfacial properties around steel reinforcement in
practical concrete element. In this study, for the elastic modulus and micro-
strength of the interfacial transition zone (ITZ) around steel reinforcement determination, the depth-sensing nano-indentation technique was used. The
conclusions stated that the actual bond strength of SCC mixes for the same bar
diameter was higher than that of reference mix. Owing to the lower water content
and specifically the higher powder volume in SCC mixes, which resulted in
reducing the accumulation of bleed water under horizontally embedded reinforcing
bars, the normalized bond strength was nearly 10-40% higher than that of reference mix. The elastic modulus and micro-strength of the ITZ around steel
reinforcement in practical concrete were successfully studied by the depth-sensing
nano/micro-indentation technique. For the vibrated, reference concrete, the elastic
modulus and the micro-strength of the ITZ were greater on the top side of
horizontal steel reinforcement than on the bottom side. In SCC mixes, diversity of ITZ properties between top and bottom side were less distinct. By increasing bond
strength of reinforcement in the mixes, the improved micro-mechanical properties
of the ITZ and their uniformity for SCC mixes were unchanging.
Esfahani, Kianoush and Lachemi (2005) conducted an experimental study on bond
strength of reinforcing bars made of glass fiber reinforced polymers (GPRP) embedded in normal and self-compacting concrete. Pullout tests were done on 36
GFRP reinforcing bars installed inside concrete specimens. In this study, different
parameters such as type of concrete, bar location, and cover thickness were
encompassed. It was concluded that:
The bond strength of bottom GFRP reinforcing bars was nearly the same for the specimens made of normal and self-compacting concrete. For the top bars, the bond strength of normal concrete was greater than that of self-
compacting concrete.
The ratio of bottom bar bond strength to top bar bond strength for GFRP embedded in self-compacting concrete was obtained greater than that
embedded in normal concrete.
The V-notch failure is common in slab. Due to occurrence of this type of failure in the middle bars, the bond strength is larger than that for other
locations. Hence, the bond strength of bars in slabs should be greater than that in beams.
Ana Lúcia H. de C. El Debs e Fernando M. de Almeida Filho (2007) conducted the
numerical approach applying Finite Element Method to assess the bond stress
using beam models based in Rilem’s recommendation. The result obtained for
ordinary concrete and self-compacting with the same compressive strength were compared with each other, and additionally with numerical results. The results
obtained for beam model with SCC and ordinary concrete are almost identical, with
a small advantage for ordinary concrete. Although the slip could not be well
represented, the numerical models exhibited good approach with the test results,
especially for the failure load and for the displacements values. The theoretical predictions were more conservative than the test results. Finally, it could be said
that good approaches for the beam tests were obtained by utilization of the
numerical modes using both ordinary concrete and self-compacting concrete. Those
values could be extended to models with different compressive strength and bar
diameter.
7
de Almeida, F.M.A., El Debs , M.K., and El Debs, A.L.H.C. (2007) performed pull-out
and beam tests according to RILEM procedures on the test specimen made of SCC
with varying compressive strength, steel bar diameter and test methods to estimate
the bond behavior. The following conclusions can be inferred:
The bond behavior described by pull-out and beam tests using SCC and normal vibrated concrete are almost identical almost to each other.
However, in some cases for SCC it was better than vibrated concrete.
By comparing the Code provisions and equations reasoned out that adoption of the same procedures for vibrated concrete could be applied for
SCC, which denoting that bond behavior of SCC are similar of vibrated
concrete.
Hossain and Lachemi (2008) implemented especially developed pullout test on 72
specimens to determine the bond resistance and properties between deformed steel
bar and supplementary cementing materials (SCM) (such as fly ash and slag) and
viscosity modifying admixtures (VMA) based SCC as well as normal concrete (NC).
Furthermore, top-bar effect on the bond behavior was examined. By comparing the bond characteristics of deformed reinforcing bars embedded in conventionally
vibrated normal concrete and SCC, the following conclusions were interpreted:
Due to the more consistent nature of SCC and the nonconsolidated concreting process, variation in bond strengths at different elevations
yielded less significant effect than in NC.
For all SCC specimens except those cast in horizontal condition, the normalized bond strength were higher than those specimens made of NC. The top-bar effect in SCC was less significant than that in NC.
The bond measurement results as a quantitative estimation indicated that for a reinforced concrete, using SCC, would be more reliable than those
using NC. Bleeding and the inhomogeneous nature of normal concrete can
be minimized by using SCC.
Valcunde and Parra (2008) conducted experimental work studying the bond
strength between reinforcing steel bars and concrete and the top-bar effect on self-
compacting concrete. The pullout tests were conducted on eight different concrete,
four self-compacting concrete (SCC) and four normally-vibrated concrete (NVC). The
results indicated that the quality of concrete, the compressive strength and the
tensile strength had extensive influence on the bond strength. By comparing the results acquired for both SCC and normal vibrated concrete (NVC), it was
concluded that the SCC exhibited higher bond strength than NVC. By reason of
greater fill capacity and less bleeding of SCC, for moderated load levels, SCC
demonstrated a stiffer behavior than NVC. The ultimate bond strength in SCC was
obtained greater than that in NVC. Türk, Benli and Calayır (2009) examined experimentally the effect of self-compacting
concrete and the reinforcement diameter on the bond-slip properties of tension lap-
splices. Twelve full-scale beam specimens (2000×300×200 mm) were tested in
positive bending. Based on the results, the conclusions were obtained and listed
below:
In spite of the concrete type, by increasing the diameter of the reinforcing bar, the maximum load increased and the deflection recorded at the center
of the beam decreased, additionally the specimens with the higher
reinforcing bars presented higher stiffness.

8
For the embedded tension lap-spliced bars in SCC, load transfer was better than that of those embedded in normal concrete. Besides, in the beams
made of SCC failure developed evenly and was particularly ductile, in
comparison with the specimens made of normal concrete and with no
stirrups.
In spite of the reinforcing bar diameter, longer cracks were observed in specimens made of SCC than those of normal concrete.
The normalized bond strengths of the SCC mixes were nearly 4% higher than those of the NC mixes.
Canbay, E. (2009) followed up experimental study by conducting in total six full-
scale tests to evaluate the influence of main variables such as spacing between
reinforcing bars, splice length, and cover dimensions on the bond of lap-spliced bars in SCC. Increasing the splice length can change the type of failure from bond
to flexure. However, for specimens with large splice length with small cover
dimensions, flexural failure was followed by bond failure. By carrying out the
analytical study and using the equation in ACI 408-R03 for determination of
reinforcement stress and comparing them with the experimentally calculated
stress, it was concluded that the ACI 408 descriptive equation for normal concrete estimated tests results exceptionally good. Pandurangan, Kothandaraman, Sreedaran (2010) carried out full-scale experimental
investigation using pullout test to determine the effect of SCC on bond
characteristics and mode of bond splitting of tension lap splices anchored in
normal strength concrete (NSC). It was concluded that at low passive confinement by transverse reinforcement, the bond strength between the SCC and normal
vibrated concrete were almost identical. Furthermore, at well confinement, bond
strength in SCC is higher than normal vibrated concrete. For the beam specimens
with confinement index lower than or equal to 2.0, lower ductility was attained and
subjected to wide crack width. Specimens with ductility index higher than 3.0 demonstrated ductile performance and subjected to large number of smaller cracks.
Spacing of transverse reinforcements did not have any influence on the load at first
flexural crack.
Türk, Karataş and Ulucan (2010) carried out experimental study on a total of 27
full-scale beam specimens. All specimens were tested in positive bending under the four point loading arrangement used during the load controlled experiments to
evaluate the effect of fly ash (FA) and silica fume (SF) on the bond-slip properties of
tension lap-spliced bars. Following results were obtained by analyzing the results of
this study:
The experimental ultimate moment is lower than the analytical one. This designated that all specimens failed by splitting of concrete at the end of the overlapping splice. A sudden increase of the splitting cracks width occurred
at the ultimate moment over the whole splice.
All beam specimens with both NC and SCC had the same splice embedment length (300 mm), but the experimental and theoretical ultimate moment
generally were close to each other.
It was observed that, due to the hydration and pozzolanic reactions as well as the filer effects of high fineness, silica fume cause the improvement of
concrete pore structures and increased the strength of concrete. The beam specimens of SCC with SF had the greatest stiffness compared to other all
beam specimens.

9
The bond strength of the beam specimens produced from SCC was generally higher than that of beam specimens made of NC. This was due to high
volume fin grains content comparison with NC covered more effectively the
reinforcements. By increasing volume fraction of fine materials the
accumulation of bleed water under horizontally embedded bars reduced. Castel, Vidal and François (2010) preformed four different mechanical tests such as
splitting test, direct axial tension test, tension member test, and beam test in
flexure to examine the possible diversities between bond and cracking properties of
SCC, and vibrated concrete (VC). The conclusions are listed below:
In terms of transfer length, there was no significant difference observed in the bond properties of both types of concrete by conducting tension member
test.
In terms of cracking, the tensile strength measured for both types of concrete was obtained almost identical by performing beam test.
By using the splitting test, the direct axial tension test and the beam test, there was no significant difference emerged in both SCC and VC tensile
strength.
In terms of effect of the concrete skin on cracking, the comparison between the specimens mad of both SCC and VC concrete when either the concrete skin was removed or not, indicated that there was no diversity observed in
the cracking load of SCC and VC specimen when the concrete cover was
cast off. Therefore it was concluded that the quality of SCC skin influenced
the cracking loads. SCC requires greater attention on curing condition at
early age than VC in order to maintain identical cracking properties.
Desnerk, De Schutter, Taerwe (2010) conducted pullout tests to examine the bond
strength of reinforcing bars exposed to bending. According to RILEM
recommendations RC6, a total of 36 specimens were cast using 3 different concrete
types including conventional vibrated concrete (CVC) and SCC. In this study, effect
of bond length, concrete type and bars size on the bond behavior were investigated. The following conclusions were attained based on the results:
For SCC specimens with the bond length of 10 times the bar diameter failed by yielding or rupture of the reinforcing bars prior to bond splitting for the
concrete compressive strengths studied here (60 MPa and higher).
Therefore, according to the test results, the bond length was restricted to 5
times of the bar diameter.
When larger bar diameters were embedded in the tested specimens, the bond strengths of both SCC and CVC reached high values. But for smaller
reinforcing bars, the bond strength of SCC was somewhat higher.
Existence of the limestone filler content in SCC mixes caused higher compressive strength resulted to the greater bond strength of SCC than that
of CVC; though, both concrete mixes had equal water to cement ration.
By increasing bar diameters, the slip related to the maximum bond strength increased.
Mazaheripour, Baros, Sena-Cruz, Pepe and Martinelli (2013) performed experimental
study to investigate the effect of bar diameter, surface configuration, thickness of
concrete cover and bar embedment length on the bond behavior of Glass-Fiber
Reinforced Polymers (GFRPs) in self-compacting steel fiber reinforced concrete
(SFRSCC). The conclusions drawn based on experiments results indicated that
unbonding was the main cause of the failure. For two types of GFRP, bond length of

10
more than 20 times the bar diameter led to attaining the ultimate tensile strength.
Formation of single crack in the alignment of the reinforcing bars had deleterious
impact on the bod characteristics of tested beams, for the specimens with 15 mm
concrete cover. Since fiber reinforcement mechanism kept micro cracks away, no splitting failure took place. The bond failure generally depended on the shear
resistance of GFRP surface layers. As a matter of fact, the concrete cover thickness
had an important role on the bond performance of GFRP-SFRSCC, because the
maximum pullout force, attained by increasing the bar diameter and the bond
length, became limited by the SFRSCC splitting strength, which was in direct proportion to the concrete cover thickness. The post-peak pullout force and the
average residual bond stress increased by increasing the concrete cover.

11
CHAPTER 3
EXPERIMENTAL PROGRAM
3.1. General
In this study, six full-scale reinforced concrete beam specimens cast with self-
compacting concrete (SCC) were prepared for testing. The diameters of longitudinal
and transverse steel bars were 22 mm and 8 mm, respectively. In addition, two
longitudinal steel bars with 16 mm diameter were used as compression steel. All
preparations including reinforcement caging, strain gauges attachment, and construction of experimental formwork were done in Structural Mechanics
Laboratory; only SCC was supplied by a ready mix concrete firm.
3.2. Material
Concrete
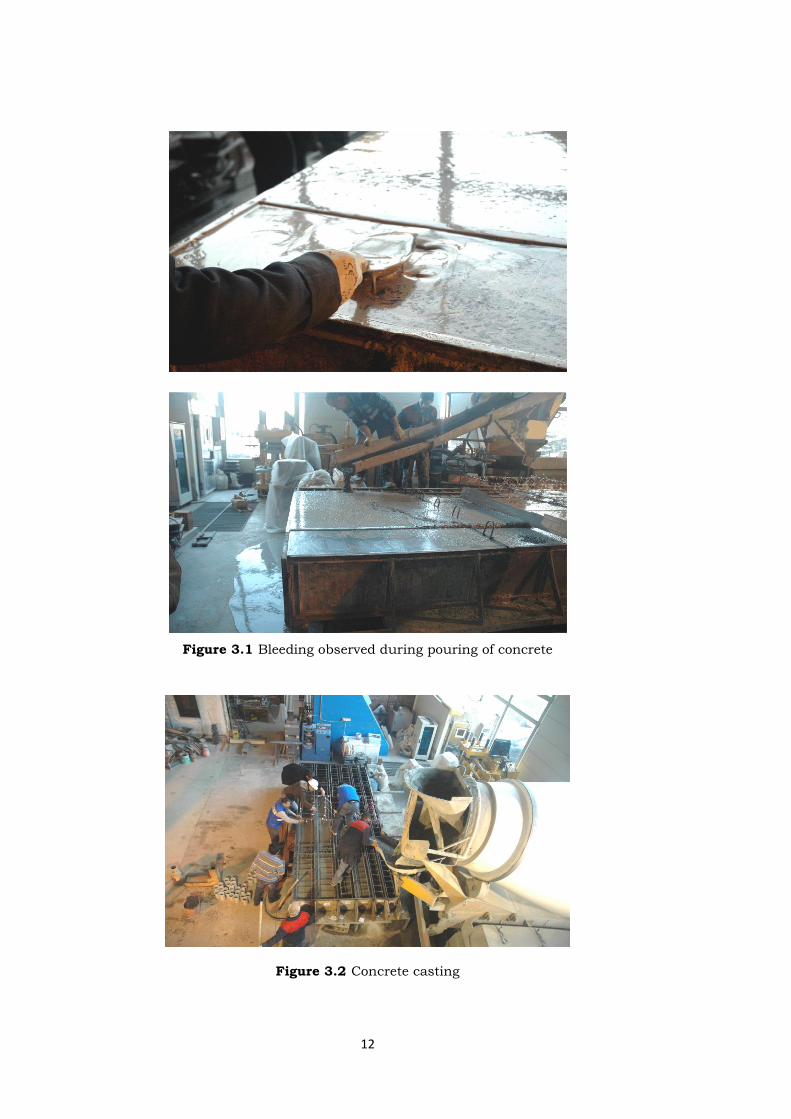
Self-compacting concrete was produced in the ready mix company and transferred
by transmixer to the laboratory, Figure 3.2. The target strength of concrete was 50
MPa. The mix design of the SCC is given in Table 3.1. Due to improper use of viscosity modifying agent, bleeding was observed on the top about 50 mm concrete
surfaces and on standard cylinder surfaces, Figure 3.1.
Table 3.1 Concrete mix design
Constituent Materials Weight
(kg/m3)
Cement 270
Fly Ash 180
Water 185
Fine Aggregate (0-4mm) 1114
Coarse Aggregate (4-11.2 mm) 551
Super Plasticizer 6.75
Viscosity Modifying Agent -
12
Figure 3.1 Bleeding observed during pouring of concrete
Figure 3.2 Concrete casting

13
Concrete of all specimens was molded at the same time from a transmixer and test
cylinders were taken arbitrarily during the placement of concrete. Concrete
strength was determined by testing these standard cylinders. In this study, 35
cylinders were taken, 4 of them were standard cylinders with 150 mm in diameter and 300 mm in height and the others were standard cylinders with 100 mm in
diameter and 200 mm in height.
During the experiment, the compressive and split strength of concrete was
determined by testing the cylinders. Table 3.2 presented the date of cylinder tests, corresponding compressive and split strength values, and related experiments. It is
not easy to produce normal strength concrete for SCC; therefore, at the beginning
of the study, the target compressive strength was chosen as 50 MPa. At the end of
28 days, however, the SCC did not reach this target value. Therefore, experiments
started after 141 days at an acceptable strength level.
Table 3.2. Concrete strength of specimens
Date
Age of
Concrete
(Days)
fc (MPa) fct (MPa) Experiments Done
0.1.12.2011 4 19.91 N.A. N.A.
04.12.2011 7 23.89 N.A. N.A.
11.12.2011 14 25.78 N.A. N.A.
18.12.2011 21 29.68 N.A. N.A.
25.12.2011 28 35.80 N.A. N.A.
02.01.2012 36 36.11 N.A. N.A.
14.02.2012 79 43.88 N.A. N.A.
22.03.2012 116 44 3.4 SC_22_44_88_530
SC_22_44_88_800
05.04.2012 130 44.5 3.9 SC_44_44_44_710
SC_44_44_44_530_T4
16.04.2012 141 45.6 3.9 SC_44_22_22_530_T4
SC_44_22_22_530_T6
Steel
Six deformed steel bars were used in each beam specimen with the diameter of 22
mm as tension reinforcements and two 16 mm bars were used as compression
reinforcement. All reinforcing bars were taken from the same batch. Turkish
classification for bars was S420.

14
From each full length reinforcements, three test coupons were taken. Lengths of
coupons were 600 mm, 400 mm, and 300 mm for bars with diameter of 22, 16 and
8 mm, respectively. These coupons were tested at the Material Laboratory of Civil
Engineering Department. In Turkish Standards, minimum requirement of elongation is 12%. As the results showed, all bars elongations were greater than the
minimum criteria. Table 3.3 and Table 3.4 show the properties of the reinforcing
bars used in the specimens.
Table 3.3 Geometrical properties of reinforcing bars
Test Coupon Weight
(gr)
Length
(cm)
Diameter
(mm)
Area
(mm2)
131.7 30 8.41 55.94
132.4 30 8.46 56.23
132.0 30 8.45 56.06
613.5 40 15.70 193.45
614.4 40 15.79 195.69
615.9 40 15.81 196.18
1793.4 60 22.03 380.80
1790.2 60 22.01 380.13
1790.0 60 22.00 380.08
Table 3.4 Properties of reinforcing bars
Bar Size (mm) Yield Strength
(MPa)
Ultimate Strength
(MPa)
Elongation
(%)
595 835 17.5
475 741 17.3
459 721 17.0
3.3. Formwork
Formworks were prepared at the Structural Mechanics Laboratory. In order to
construct six beams at the same time, six adjacent formworks were assembled by
using steel plates and steel profiles. To get smooth surface, 5 mm thick steel plates
were used as formwork. Steel plates were cut to get 4 m × 400 mm surface. The
depth of the four specimens was 400 mm. For the two of the specimens, 22 mm thick wooden plates were cut and put on the bottom of the formwork to get 378 mm
depth. Two steel box sections which had 20 × 20 × 2 mm dimensions and 4 m in
length were welded as stiffeners on the side steel plates vertically with 250 mm
spacing. Between these vertical stiffeners 430 mm diagonal cross stiffeners were
also welded. Another steel plate was welded on the stiffeners and a two side smooth
thick plate was produced. Figure 3.3 shows the details of the formwork.
15
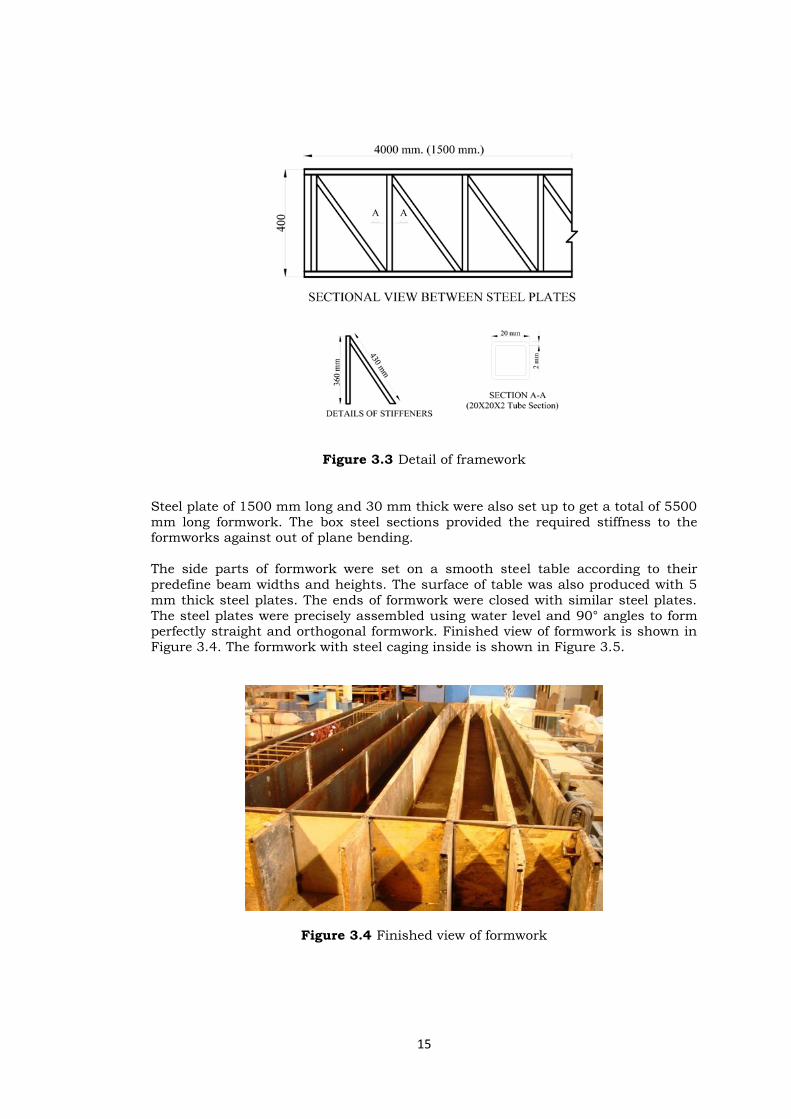
Figure 3.3 Detail of framework
Steel plate of 1500 mm long and 30 mm thick were also set up to get a total of 5500
mm long formwork. The box steel sections provided the required stiffness to the formworks against out of plane bending.
The side parts of formwork were set on a smooth steel table according to their
predefine beam widths and heights. The surface of table was also produced with 5
mm thick steel plates. The ends of formwork were closed with similar steel plates.
The steel plates were precisely assembled using water level and 90° angles to form perfectly straight and orthogonal formwork. Finished view of formwork is shown in
Figure 3.4. The formwork with steel caging inside is shown in Figure 3.5.
Figure 3.4 Finished view of formwork
16
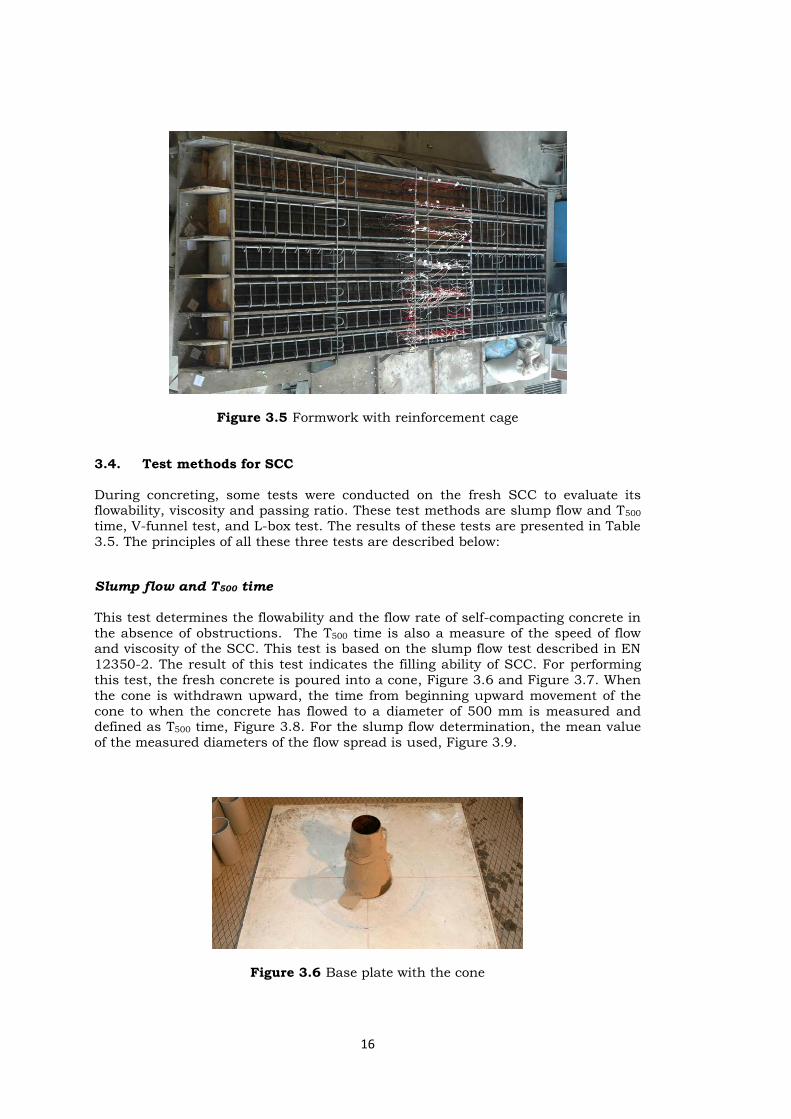
Figure 3.5 Formwork with reinforcement cage
3.4. Test methods for SCC
During concreting, some tests were conducted on the fresh SCC to evaluate its flowability, viscosity and passing ratio. These test methods are slump flow and T500
time, V-funnel test, and L-box test. The results of these tests are presented in Table
3.5. The principles of all these three tests are described below:
Slump flow and T500 time
This test determines the flowability and the flow rate of self-compacting concrete in
the absence of obstructions. The T500 time is also a measure of the speed of flow and viscosity of the SCC. This test is based on the slump flow test described in EN
12350-2. The result of this test indicates the filling ability of SCC. For performing
this test, the fresh concrete is poured into a cone, Figure 3.6 and Figure 3.7. When
the cone is withdrawn upward, the time from beginning upward movement of the
cone to when the concrete has flowed to a diameter of 500 mm is measured and defined as T500 time, Figure 3.8. For the slump flow determination, the mean value
of the measured diameters of the flow spread is used, Figure 3.9.
Figure 3.6 Base plate with the cone

17
Figure 3.7 Slump and T500 test method for fresh SCC
Figure 3.8 T500 test method
Figure 3.9 Slump flow test method

18
V-funnel test
This test is used to determine the viscosity and filling ability of SCC. The test is
carried out by filling the V shaped funnel with fresh concrete and the measured time taken for the concrete to flow out of the apparatus is recorded as the V-funnel
flow time, Figure 3.10.
Figure 3.10 V-funnel test method
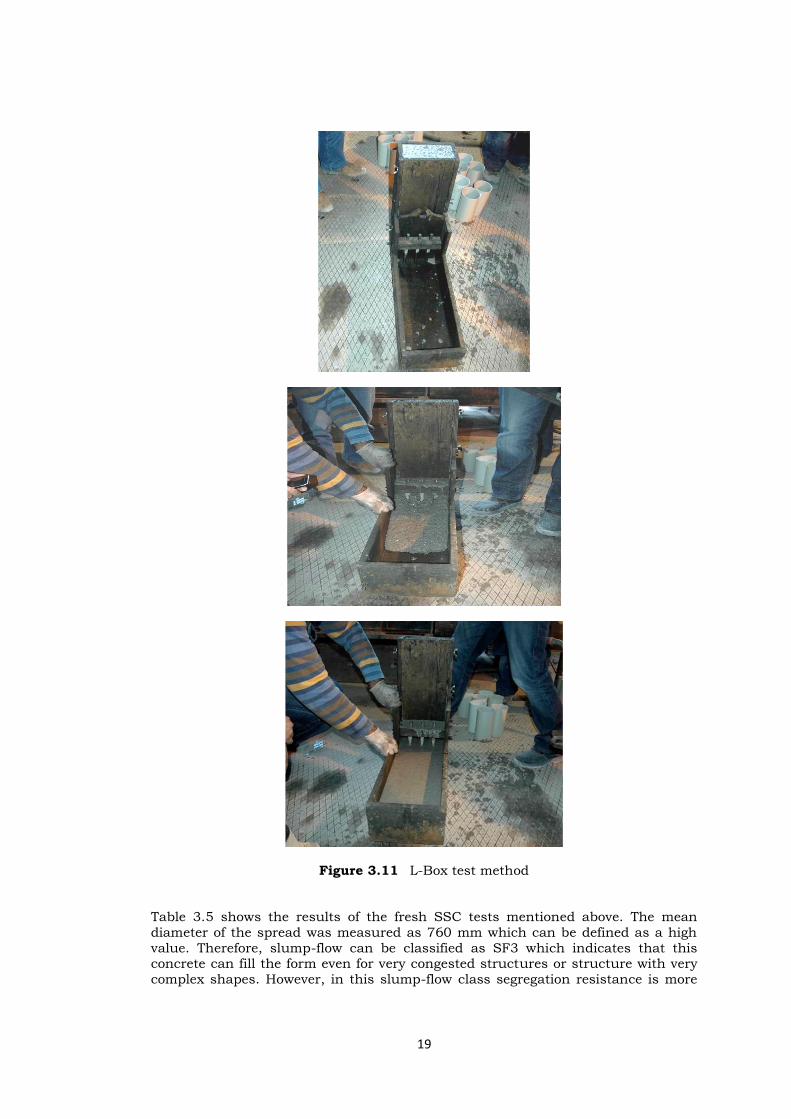
L-Box test
The passing ability of SCC to follow through tight openings including spaces
between reinforcing bars and other obstructions without segregation or blocking is
evaluated by the L-Box test. The basic result of the L-Box test is the passing ability, calculated by the ratio of the height of the concrete surface remaining at the far end
of the trough, after its passage through the reinforcing bars to the concrete height
remaining within the vertical column of the apparatus, Figure 3.11.
19
Figure 3.11 L-Box test method
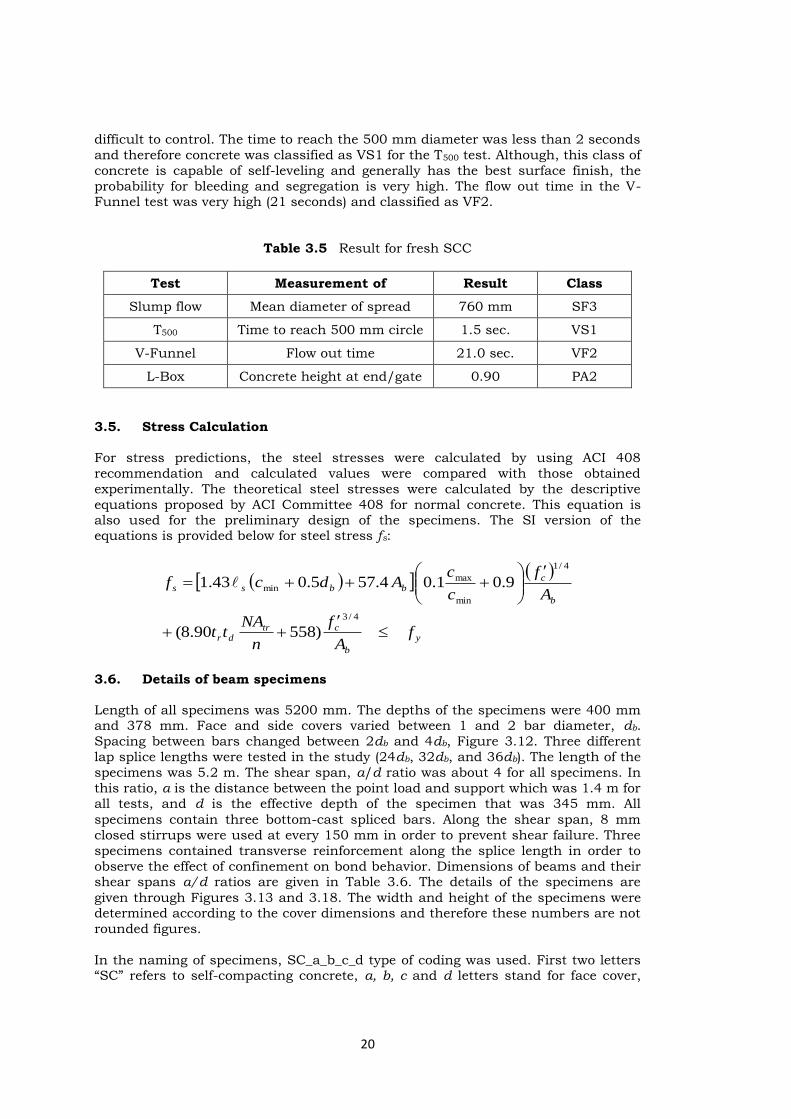
Table 3.5 shows the results of the fresh SSC tests mentioned above. The mean
diameter of the spread was measured as 760 mm which can be defined as a high
value. Therefore, slump-flow can be classified as SF3 which indicates that this concrete can fill the form even for very congested structures or structure with very
complex shapes. However, in this slump-flow class segregation resistance is more
20
difficult to control. The time to reach the 500 mm diameter was less than 2 seconds
and therefore concrete was classified as VS1 for the T500 test. Although, this class of
concrete is capable of self-leveling and generally has the best surface finish, the
probability for bleeding and segregation is very high. The flow out time in the V-Funnel test was very high (21 seconds) and classified as VF2.
Table 3.5 Result for fresh SCC
Test Measurement of Result Class
Slump flow Mean diameter of spread 760 mm SF3
T500 Time to reach 500 mm circle 1.5 sec. VS1
V-Funnel Flow out time 21.0 sec. VF2
L-Box Concrete height at end/gate 0.90 PA2
3.5. Stress Calculation
For stress predictions, the steel stresses were calculated by using ACI 408
recommendation and calculated values were compared with those obtained
experimentally. The theoretical steel stresses were calculated by the descriptive
equations proposed by ACI Committee 408 for normal concrete. This equation is also used for the preliminary design of the specimens. The SI version of the equations is provided below for steel stress fs:
y
b
ctrdr
b
cbbss
fA
f
n
NAtt
A
f
c
cAdcf
4/3
4/1
min
maxmin
)55890.8(
9.01.04.575.043.1
3.6. Details of beam specimens
Length of all specimens was 5200 mm. The depths of the specimens were 400 mm and 378 mm. Face and side covers varied between 1 and 2 bar diameter, db.
Spacing between bars changed between 2db and 4db, Figure 3.12. Three different
lap splice lengths were tested in the study (24db, 32db, and 36db). The length of the
specimens was 5.2 m. The shear span, a/d ratio was about 4 for all specimens. In
this ratio, a is the distance between the point load and support which was 1.4 m for all tests, and d is the effective depth of the specimen that was 345 mm. All
specimens contain three bottom-cast spliced bars. Along the shear span, 8 mm
closed stirrups were used at every 150 mm in order to prevent shear failure. Three
specimens contained transverse reinforcement along the splice length in order to
observe the effect of confinement on bond behavior. Dimensions of beams and their shear spans a/d ratios are given in Table 3.6. The details of the specimens are
given through Figures 3.13 and 3.18. The width and height of the specimens were determined according to the cover dimensions and therefore these numbers are not
rounded figures.
In the naming of specimens, SC_a_b_c_d type of coding was used. First two letters “SC” refers to self-compacting concrete, a, b, c and d letters stand for face cover,
21
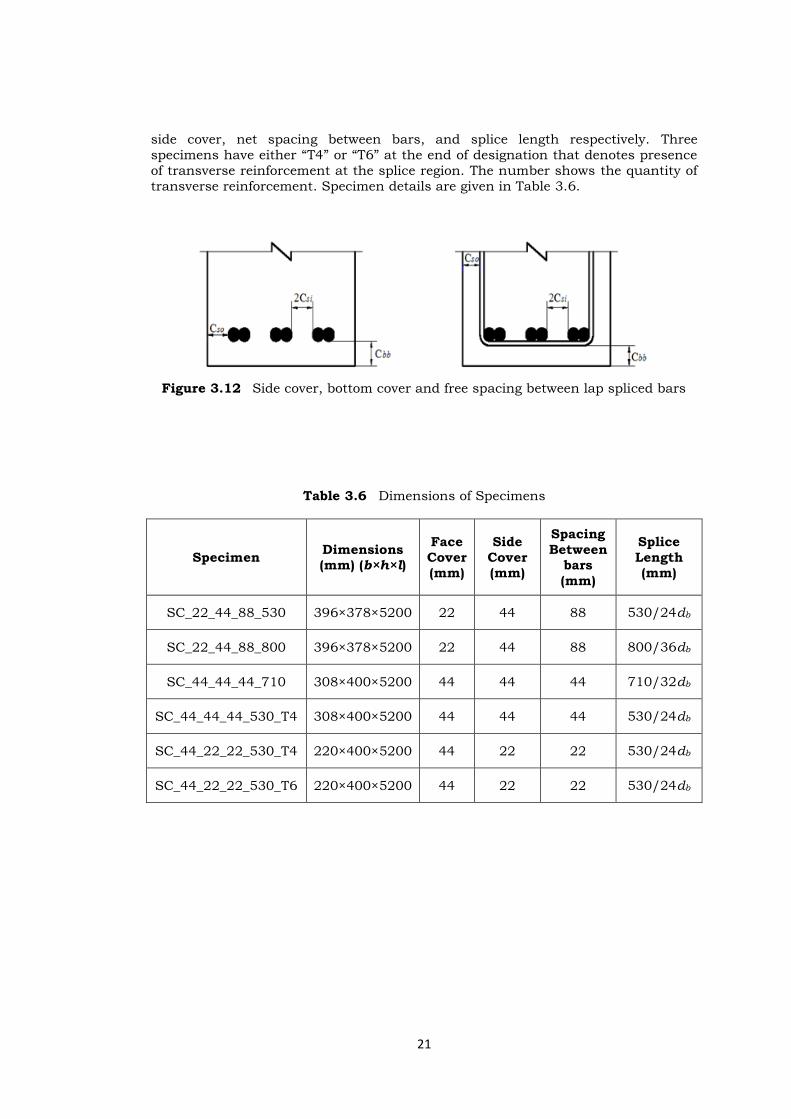
side cover, net spacing between bars, and splice length respectively. Three
specimens have either “T4” or “T6” at the end of designation that denotes presence
of transverse reinforcement at the splice region. The number shows the quantity of
transverse reinforcement. Specimen details are given in Table 3.6.
Figure 3.12 Side cover, bottom cover and free spacing between lap spliced bars
Table 3.6 Dimensions of Specimens
Specimen Dimensions (mm) (b×h×l)
Face
Cover (mm)
Side
Cover (mm)
Spacing
Between bars
(mm)
Splice
Length (mm)
SC_22_44_88_530 396×378×5200 22 44 88 530/24db
SC_22_44_88_800 396×378×5200 22 44 88 800/36db
SC_44_44_44_710 308×400×5200 44 44 44 710/32db
SC_44_44_44_530_T4 308×400×5200 44 44 44 530/24db
SC_44_22_22_530_T4 220×400×5200 44 22 22 530/24db
SC_44_22_22_530_T6 220×400×5200 44 22 22 530/24db
22
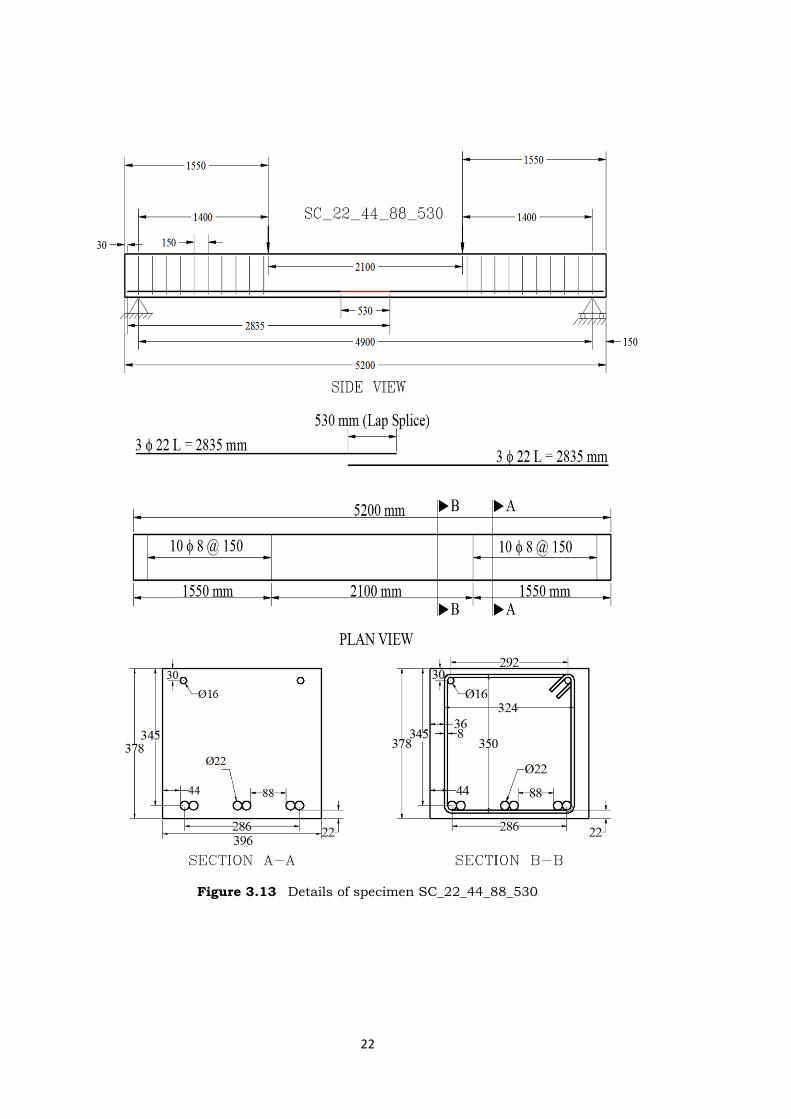
Figure 3.13 Details of specimen SC_22_44_88_530

23
Figure 3.14 Details of specimen SC_22_44_88_800

24
Figure 3.15 Details of specimen SC_44_44_44_710

25
Figure 3.16 Details of specimen SC_44_44_44_530_T4

26
Figure 3.17 Details of specimen SC_44_22_22_530_T4
27
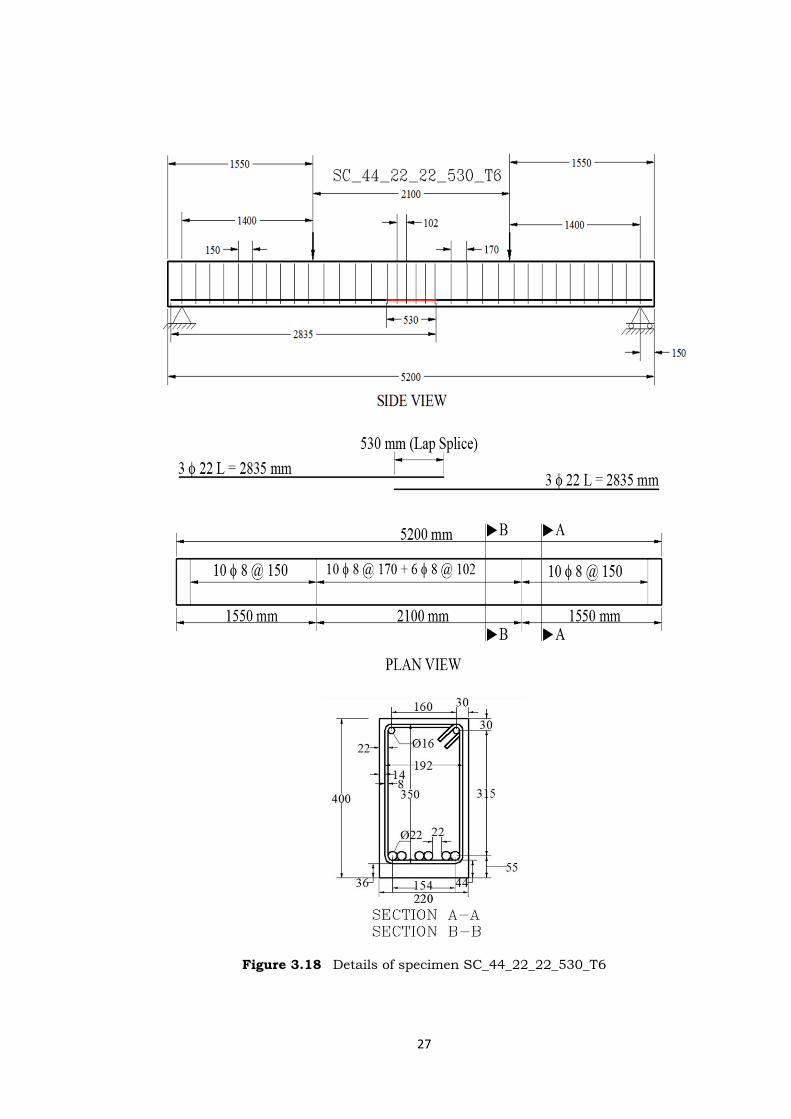
Figure 3.18 Details of specimen SC_44_22_22_530_T6

28
3.7. Test set up and loading
Two concrete blocks were used as the abutment for the beam specimens and
located inside the loading frame 1050 mm away from the midpoint, and totally for all specimens they were set 2100 mm apart from each other. These blocks were
fixed on the strong floor by plaster. Specimens were put inverted on a square and
on a circler steel bars to get simple and roller support action, Figure 3.19. The main
reason of upside down testing of specimens was to take lap-splice region on the top
and so, to better observe and mark cracks on the lap splice region.
A 20 ton-force capacity load cell was located to the bottom of the ram. A hinge at
the top and a roller at the bottom were provided to the ram-load cell couple in order
to ensure a rotationally free/moment free system
Figure 3.19 Test set up for all beam specimens
3.8. Instrumentation
Displacements and deformations measurement of critical regions along the beams
are necessary during the tests. Linear Variable Differential Transformers (LVDTs)
and dial gages were used for displacement measurements. The strain of
longitudinal and transverse reinforcements was measured using strain gages. Load
cells were utilized for load measurement.
Data was recorded by a data acquisition system The data was stored as engineering
units like strains, displacements and loads by means of a software. Load -
displacement curve of the specimens were monitored during testing.
Displacement Measurement
Vertical tip displacements were monitored at the both ends of beams, 300 mm away from the loading points. At these points two strain gage based LVDTs were located.
Heavy concrete blocks with steel rods were used to fix the LVDTs to the strong
floor.

29
The vertical mid-span deflection is one of the most important measurements of the
test. Therefore, the mid-span displacement was monitored for all specimens by two
LVDTs. The mean values of data collected by these two LVDTs recorded as the
vertical mid-span deflection.
Support displacement was also monitored in order to examine the vertical rigid
body support displacement. There was a little vertical displacement recorded at the supports, although it had to be zero. Two LDVTs were located at left and right the
supports.
Moment Curvature
Ductility of reinforced concrete is related to the sectional property of the member. It illustrates member resistance to brittle failure when reinforce concrete member is
exerted to flexural loading. Ductility is interpreted as the capability of a structural
member undergoing deformation without any significant reduction in the flexural
capacity of the member. Totally four LVDTs were used to collect related data to
calculate displacement ductility. Displacement ductility specifically determines the type of failure. This value was obtained by dividing the ultimate mid-deflection to
the corresponding yield displacement. For this purpose, on the top and bottom
surfaces of the specimens two LVDTs were installed horizontally. All horizontal
LVDT’s were located 200 mm away from the mid-point. Therefore, curvature values
are not sectional properties but average numbers over 400 mm in this study.
Locations of LVDTs are presented in Figure 3.20. As shown in the figure, totally ten
LVDTs were used during the test to record tip, mid, and support displacement.
Figure 3.20 Schematic view of instrumentation

30
Load measurements
Specimens were loaded at the ends of the specimens by means of hydraulic rams.
As it was mentioned before, two concrete blocks were used as supports to create a constant moment region and all the longitudinal bars were spliced in this region.
Load cells were located between the hydraulic rams and the surface of specimen.
Both load cells had compressive and tensile capacity of 200 kN. Figure 3.21 shows
the installed load cells:
Figure 3.21 Load cell used in test
Strain measurements
Kyowa strain gauges with 120resistance were used in both longitudinal and transverse bars to monitor strains. Figure 3.22 shows locations of strain gauges.
Bond stress is maximum at the continuous end of the lap splice and decreases
towards the free end of the lap splice. Theoretically, it gets zero at the free end

31
Figure 3.22 Locations of strain gauges on the longitudinal reinforcements
For the specimens with the transverse reinforcement, totally nine strain
gauges were used, and for each stirrup three strain gages were set up.
Location of these gauges on the stirrups were presented in figure 3.23.
Figure 3.23 Locations of strain gauges on the transverse reinforcements

32
33
CHAPTER 4
OBSERVED BEHAVIOR OF TEST SPECIMENS
4.1. General
In this chapter, observed behavior of the beam specimens will be presented. Using
LVDTs and strain gages, displacement and strain measurements were acquired
during testing. They are demonstrated in a graphical manner as Load vs.
Displacement and Load vs. Strain curves.
Table 4.1 summarizes the test results. In this table, cracking load Pcr, ultimate load Pult, and type of failure is included along with compressive fc, and splitting tensile
strength of concrete fcts.
Table 4.1 Test results
fc
(MPa)
fcts
(MPa) Pcr (kN) Pult (kN)
Failure
Type
SC_22_44_88_530 44.0 3.4 37.4 107.2 Bond
SC_22_44_88_800 44.0 3.4 34.8 131.3 Flexural
SC_44_44_44_710 44.5 3.7 30.8 125.2 Yield+Bond
SC_44_44_44_530_T4 44.5 3.7 30.4 109.8 Bond
SC_44_22_22_530_T4 45.6 3.9 21.3 98.3 Bond
SC_44_22_22_530_T6 45.6 3.9 22.6 95.3 Bond
4.2. Information of Graphs
For all specimens, 3 types of graphs including displacement, strain measurements
and moment curvatures, were drawn with respect to the acquired data during the
tests. All graphs are detailed below one by one with demonstrative figures.
4.2.1. Deflection and Support Settlement
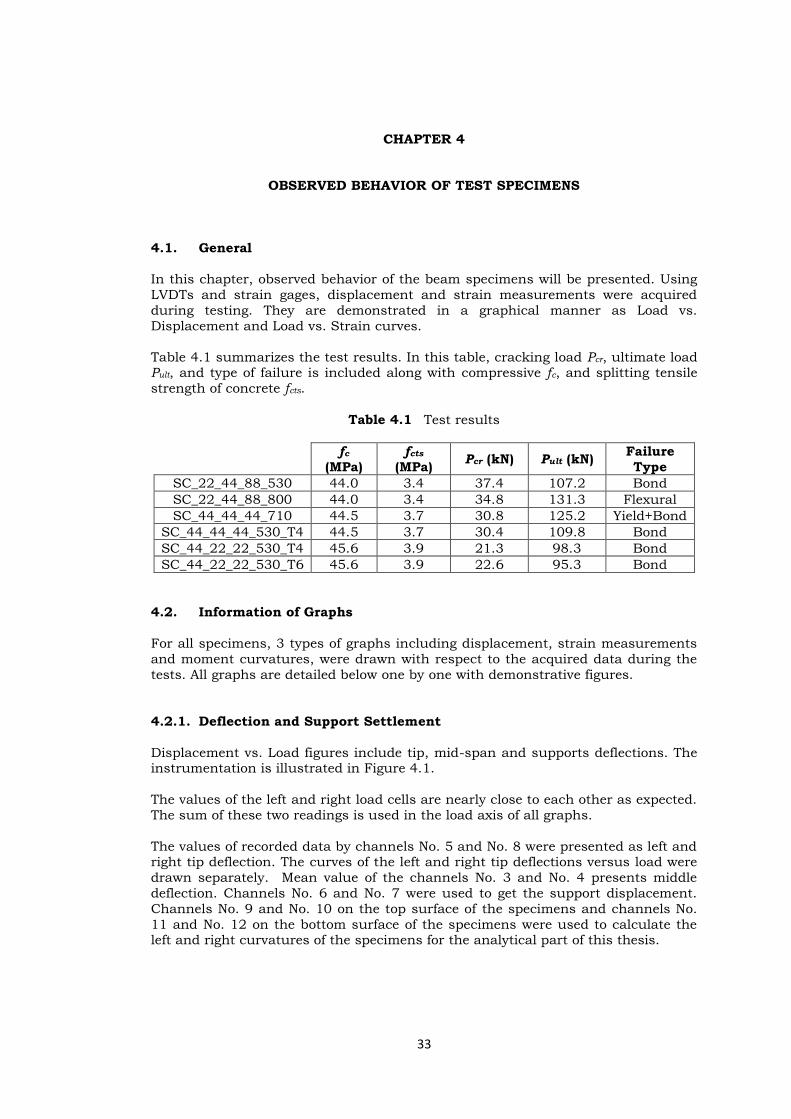
Displacement vs. Load figures include tip, mid-span and supports deflections. The instrumentation is illustrated in Figure 4.1.
The values of the left and right load cells are nearly close to each other as expected.
The sum of these two readings is used in the load axis of all graphs.
The values of recorded data by channels No. 5 and No. 8 were presented as left and right tip deflection. The curves of the left and right tip deflections versus load were
drawn separately. Mean value of the channels No. 3 and No. 4 presents middle
deflection. Channels No. 6 and No. 7 were used to get the support displacement.
Channels No. 9 and No. 10 on the top surface of the specimens and channels No.
11 and No. 12 on the bottom surface of the specimens were used to calculate the left and right curvatures of the specimens for the analytical part of this thesis.
34
Figure 4.1 Schematic view of measuring instruments set up
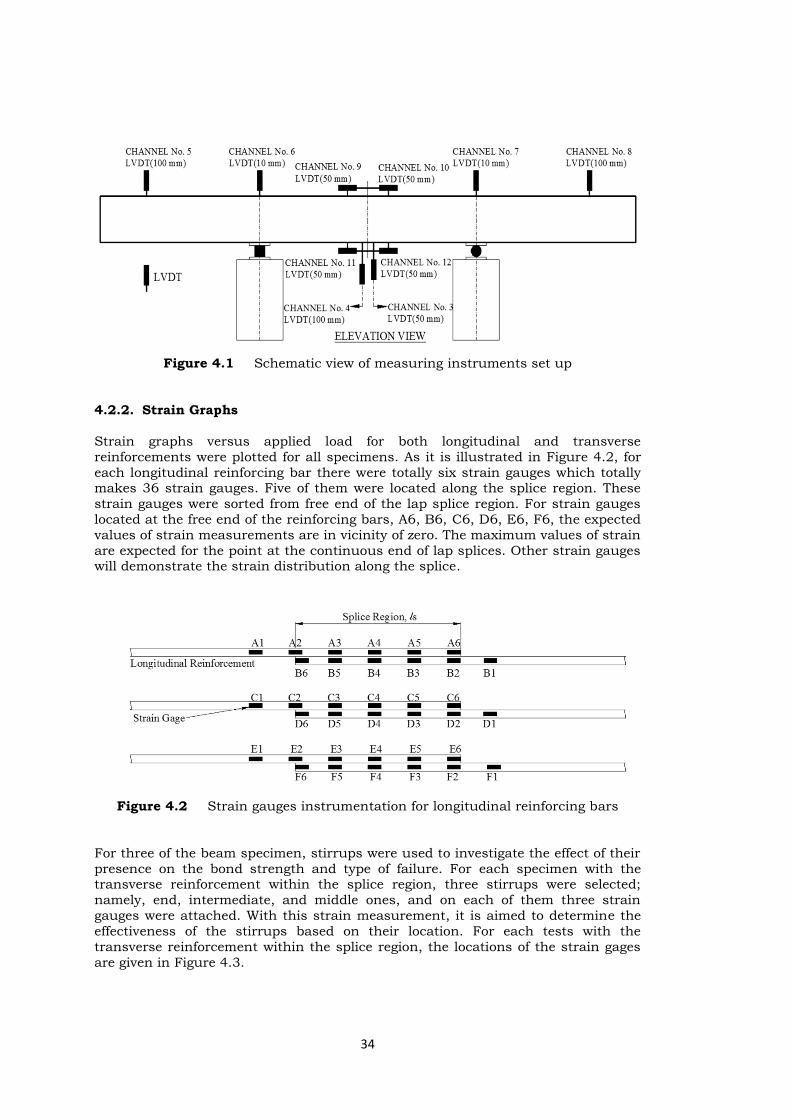
4.2.2. Strain Graphs
Strain graphs versus applied load for both longitudinal and transverse
reinforcements were plotted for all specimens. As it is illustrated in Figure 4.2, for
each longitudinal reinforcing bar there were totally six strain gauges which totally makes 36 strain gauges. Five of them were located along the splice region. These
strain gauges were sorted from free end of the lap splice region. For strain gauges
located at the free end of the reinforcing bars, A6, B6, C6, D6, E6, F6, the expected
values of strain measurements are in vicinity of zero. The maximum values of strain
are expected for the point at the continuous end of lap splices. Other strain gauges will demonstrate the strain distribution along the splice.
Figure 4.2 Strain gauges instrumentation for longitudinal reinforcing bars
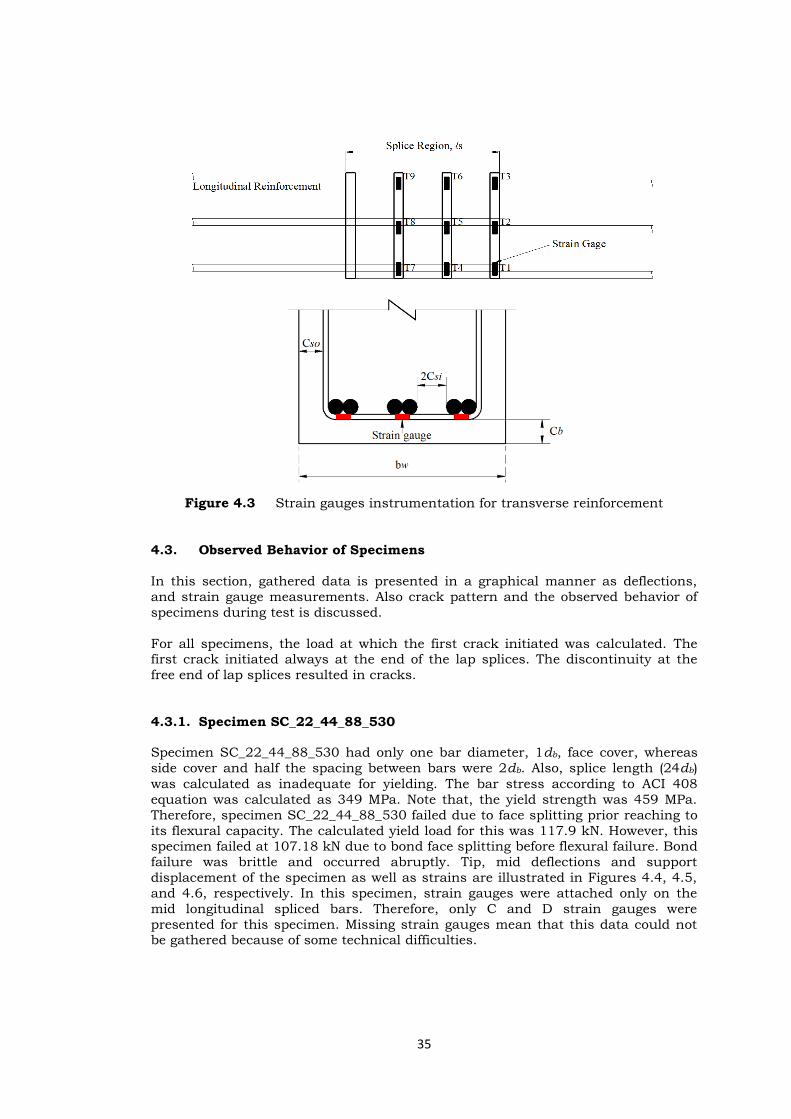
For three of the beam specimen, stirrups were used to investigate the effect of their
presence on the bond strength and type of failure. For each specimen with the transverse reinforcement within the splice region, three stirrups were selected;
namely, end, intermediate, and middle ones, and on each of them three strain
gauges were attached. With this strain measurement, it is aimed to determine the
effectiveness of the stirrups based on their location. For each tests with the
transverse reinforcement within the splice region, the locations of the strain gages
are given in Figure 4.3.
35
Figure 4.3 Strain gauges instrumentation for transverse reinforcement
4.3. Observed Behavior of Specimens
In this section, gathered data is presented in a graphical manner as deflections,
and strain gauge measurements. Also crack pattern and the observed behavior of
specimens during test is discussed.
For all specimens, the load at which the first crack initiated was calculated. The first crack initiated always at the end of the lap splices. The discontinuity at the
free end of lap splices resulted in cracks.
4.3.1. Specimen SC_22_44_88_530
Specimen SC_22_44_88_530 had only one bar diameter, 1db, face cover, whereas
side cover and half the spacing between bars were 2db. Also, splice length (24db)
was calculated as inadequate for yielding. The bar stress according to ACI 408
equation was calculated as 349 MPa. Note that, the yield strength was 459 MPa.
Therefore, specimen SC_22_44_88_530 failed due to face splitting prior reaching to
its flexural capacity. The calculated yield load for this was 117.9 kN. However, this specimen failed at 107.18 kN due to bond face splitting before flexural failure. Bond
failure was brittle and occurred abruptly. Tip, mid deflections and support
displacement of the specimen as well as strains are illustrated in Figures 4.4, 4.5,
and 4.6, respectively. In this specimen, strain gauges were attached only on the
mid longitudinal spliced bars. Therefore, only C and D strain gauges were
presented for this specimen. Missing strain gauges mean that this data could not be gathered because of some technical difficulties.

36
Figure 4.4 Load versus Deflection Charts
Figure 4.5 Load versus Support Displacement

37
Figure 4.6 Load versus Longitudinal Strain Charts
As can be seen from the figures, the first crack initiated at 37.4 kN. Support
displacements are very low as expected. The overlap of the left and right tip
deflections indicates that the load was applied symmetrically. Since the distance between the two supports is 2.1 m, the deflection in the span is low as estimated.
The total deflection can be calculated by adding both the tip and mid deflections.
According to Figure 4.6, first cracking occurred in “C” strain gauges at 500 and
in the counterpart “D” strain gauges at 400 . The average cracking strain can be
taken as 400 .
The cracks that formed at the ultimate stage on the face cover are shown in Figure 4.7. Eventually, face splitting failure was observed on the bottom cover with one
distinct flexural crack.
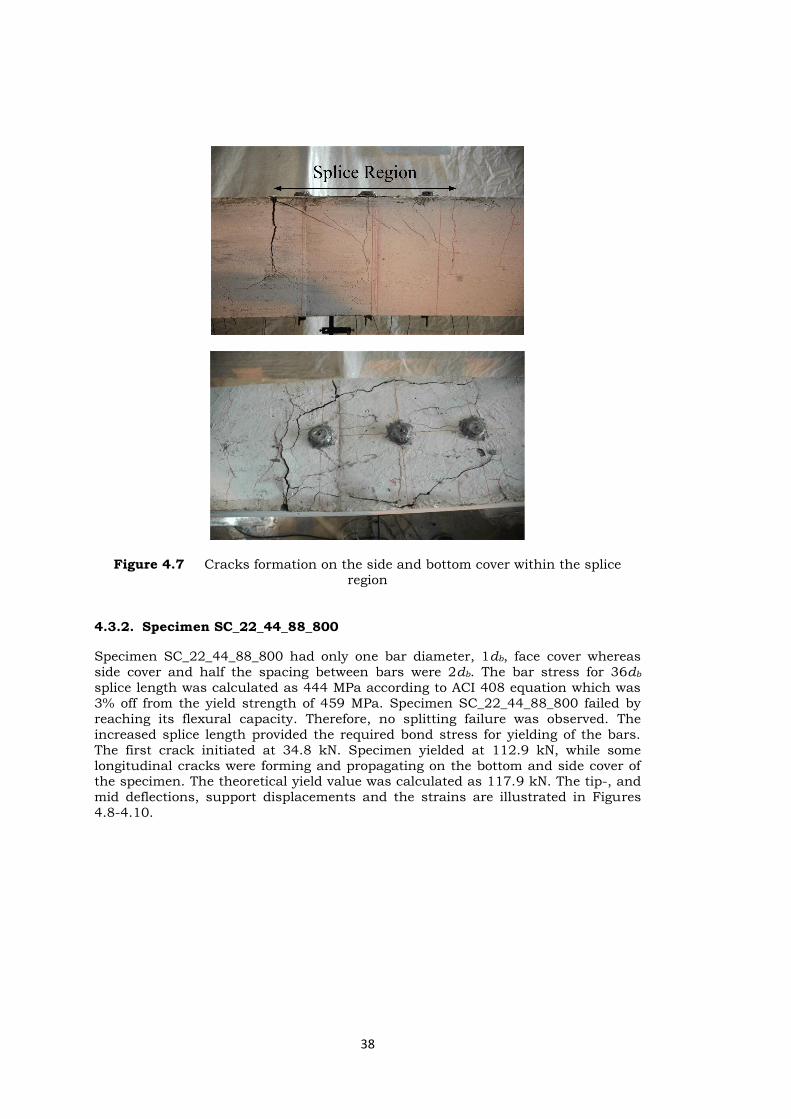
38
Figure 4.7 Cracks formation on the side and bottom cover within the splice region
4.3.2. Specimen SC_22_44_88_800
Specimen SC_22_44_88_800 had only one bar diameter, 1db, face cover whereas
side cover and half the spacing between bars were 2db. The bar stress for 36db
splice length was calculated as 444 MPa according to ACI 408 equation which was
3% off from the yield strength of 459 MPa. Specimen SC_22_44_88_800 failed by
reaching its flexural capacity. Therefore, no splitting failure was observed. The
increased splice length provided the required bond stress for yielding of the bars.
The first crack initiated at 34.8 kN. Specimen yielded at 112.9 kN, while some
longitudinal cracks were forming and propagating on the bottom and side cover of the specimen. The theoretical yield value was calculated as 117.9 kN. The tip-, and
mid deflections, support displacements and the strains are illustrated in Figures
4.8-4.10.

39
Figure 4.8 Load versus Deflection Charts
Figure 4.9 Load versus Support Displacement
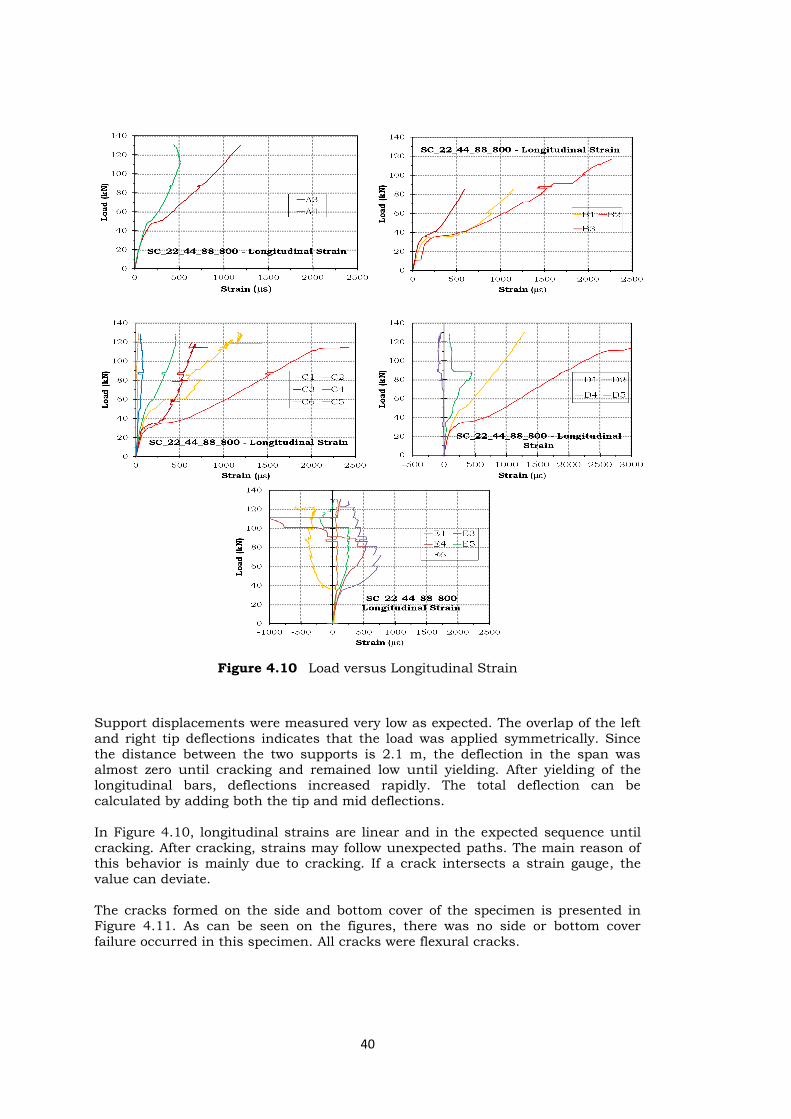
40
Figure 4.10 Load versus Longitudinal Strain
Support displacements were measured very low as expected. The overlap of the left
and right tip deflections indicates that the load was applied symmetrically. Since
the distance between the two supports is 2.1 m, the deflection in the span was almost zero until cracking and remained low until yielding. After yielding of the
longitudinal bars, deflections increased rapidly. The total deflection can be
calculated by adding both the tip and mid deflections.
In Figure 4.10, longitudinal strains are linear and in the expected sequence until
cracking. After cracking, strains may follow unexpected paths. The main reason of this behavior is mainly due to cracking. If a crack intersects a strain gauge, the
value can deviate.
The cracks formed on the side and bottom cover of the specimen is presented in
Figure 4.11. As can be seen on the figures, there was no side or bottom cover
failure occurred in this specimen. All cracks were flexural cracks.
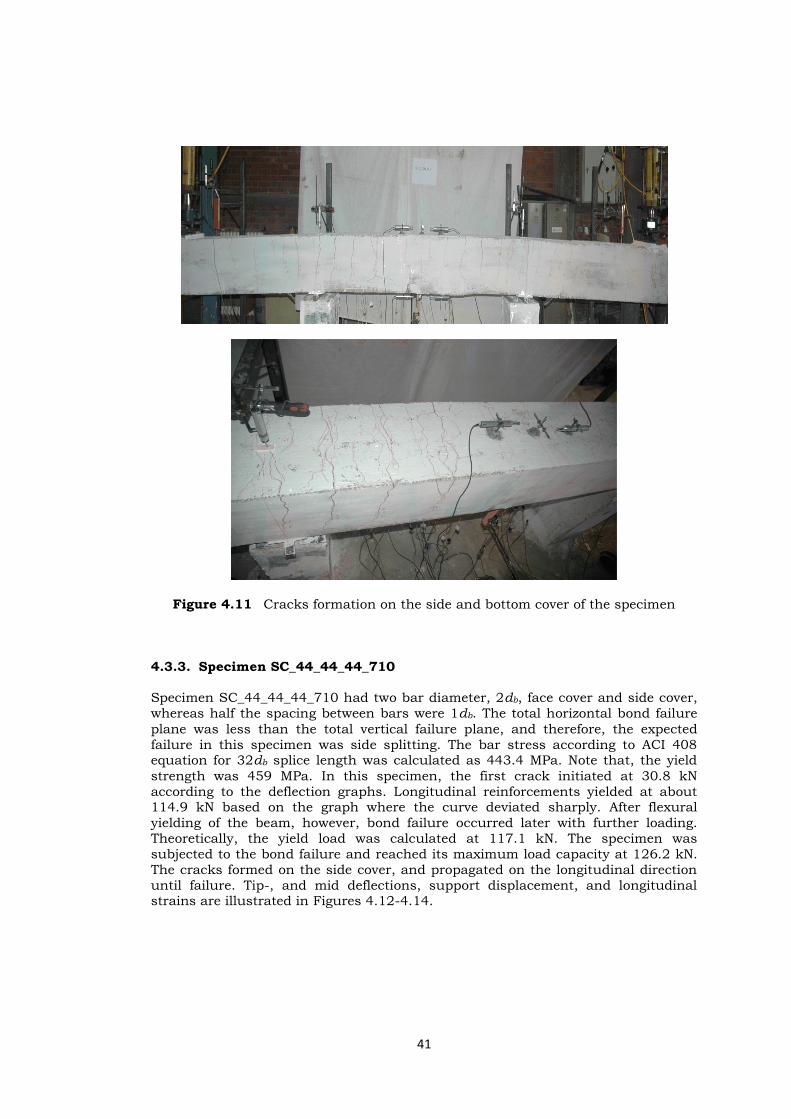
41
Figure 4.11 Cracks formation on the side and bottom cover of the specimen
4.3.3. Specimen SC_44_44_44_710
Specimen SC_44_44_44_710 had two bar diameter, 2db, face cover and side cover,
whereas half the spacing between bars were 1db. The total horizontal bond failure
plane was less than the total vertical failure plane, and therefore, the expected
failure in this specimen was side splitting. The bar stress according to ACI 408 equation for 32db splice length was calculated as 443.4 MPa. Note that, the yield
strength was 459 MPa. In this specimen, the first crack initiated at 30.8 kN
according to the deflection graphs. Longitudinal reinforcements yielded at about 114.9 kN based on the graph where the curve deviated sharply. After flexural
yielding of the beam, however, bond failure occurred later with further loading.
Theoretically, the yield load was calculated at 117.1 kN. The specimen was
subjected to the bond failure and reached its maximum load capacity at 126.2 kN.
The cracks formed on the side cover, and propagated on the longitudinal direction
until failure. Tip-, and mid deflections, support displacement, and longitudinal strains are illustrated in Figures 4.12-4.14.
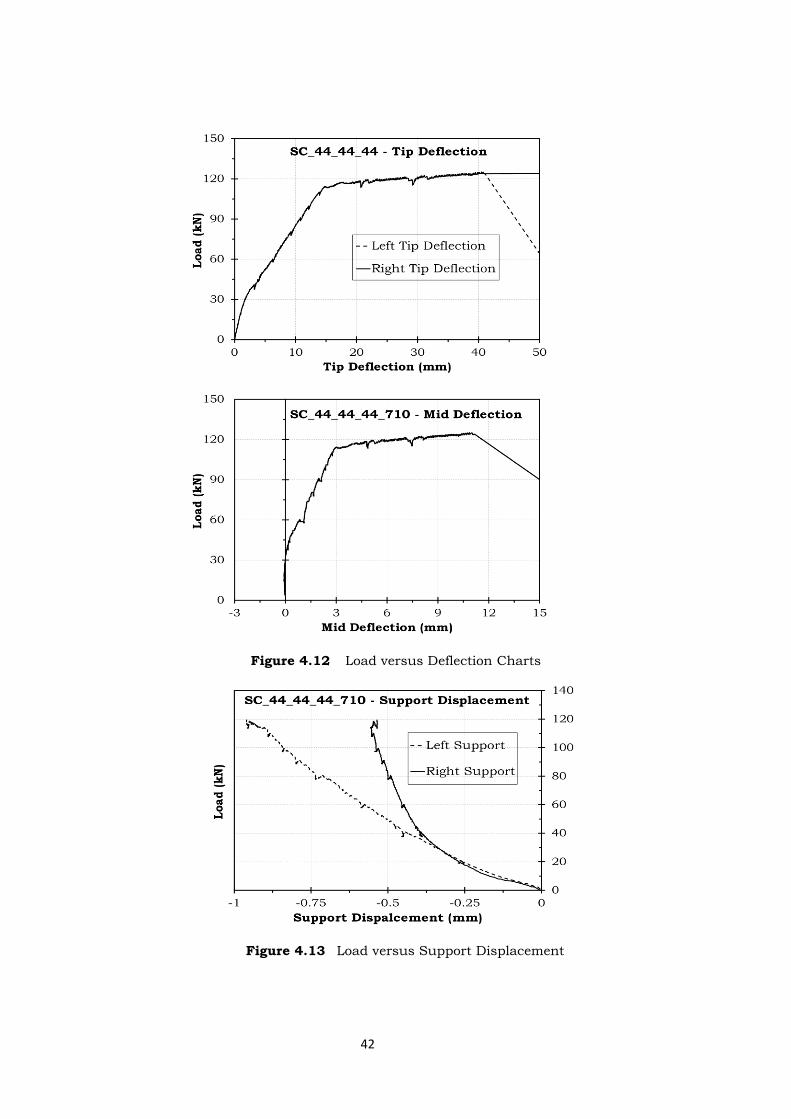
42
Figure 4.12 Load versus Deflection Charts
Figure 4.13 Load versus Support Displacement

43
Figure 4.14 Load versus Longitudinal Strain Charts
Support displacements were measured very low as expected. The overlap of the left
and right tip deflections indicates that the load was applied symmetrically. Since
the distance between the two supports is 2.1 m, the deflection in the span was almost zero until cracking and remained low until yielding. After yielding of the
longitudinal bars, deflections increased rapidly. The total deflection can be
calculated by adding both the tip and mid deflections.
In Figure 4.14, longitudinal strains are linear and in the expected sequence until cracking. After cracking, unpredicted strains were measured as shown in the
figure. The main reason of this behavior is mainly due to cracks intersecting strain
gauges.
The cracks formed on the side cover of the specimen are presented in Figure 4.15.
As can be seen on the figures, side splitting occurred. Simultaneously, with the formation of side splitting cracks, two flexural cracks at the tip of laps widened
excessively.
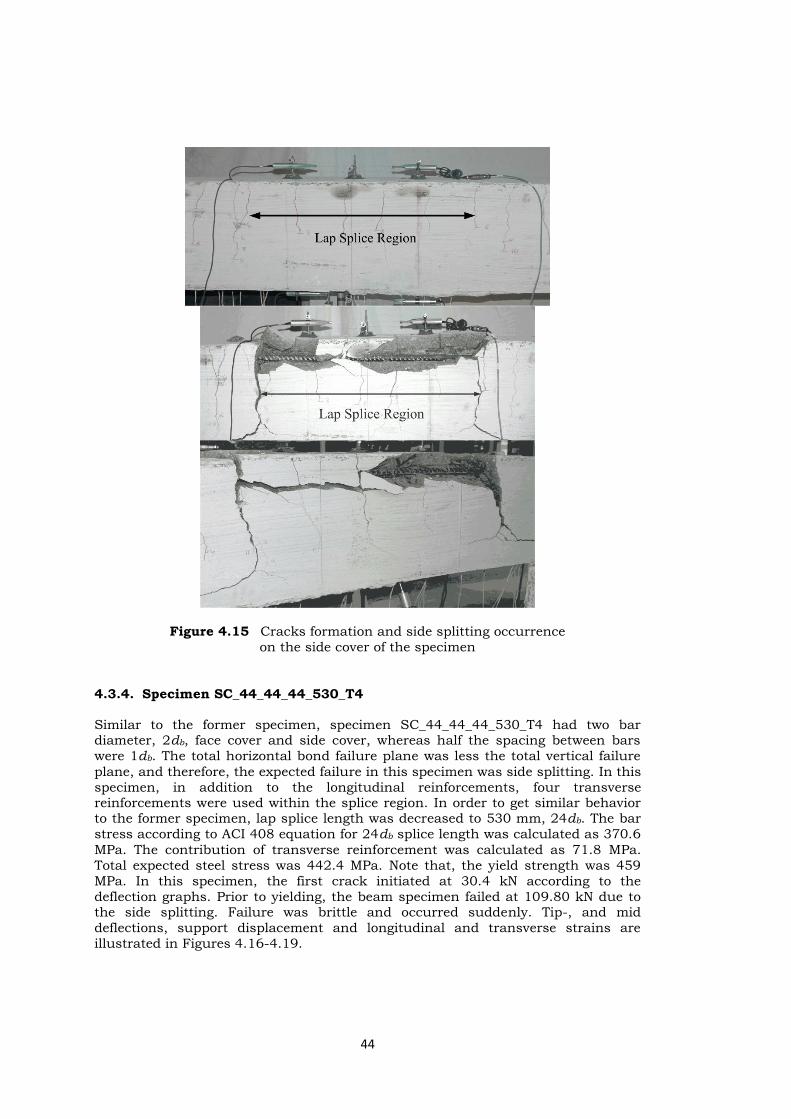
44
Figure 4.15 Cracks formation and side splitting occurrence
on the side cover of the specimen
4.3.4. Specimen SC_44_44_44_530_T4
Similar to the former specimen, specimen SC_44_44_44_530_T4 had two bar diameter, 2db, face cover and side cover, whereas half the spacing between bars
were 1db. The total horizontal bond failure plane was less the total vertical failure
plane, and therefore, the expected failure in this specimen was side splitting. In this
specimen, in addition to the longitudinal reinforcements, four transverse reinforcements were used within the splice region. In order to get similar behavior to the former specimen, lap splice length was decreased to 530 mm, 24db. The bar
stress according to ACI 408 equation for 24db splice length was calculated as 370.6
MPa. The contribution of transverse reinforcement was calculated as 71.8 MPa.
Total expected steel stress was 442.4 MPa. Note that, the yield strength was 459
MPa. In this specimen, the first crack initiated at 30.4 kN according to the
deflection graphs. Prior to yielding, the beam specimen failed at 109.80 kN due to the side splitting. Failure was brittle and occurred suddenly. Tip-, and mid
deflections, support displacement and longitudinal and transverse strains are
illustrated in Figures 4.16-4.19.
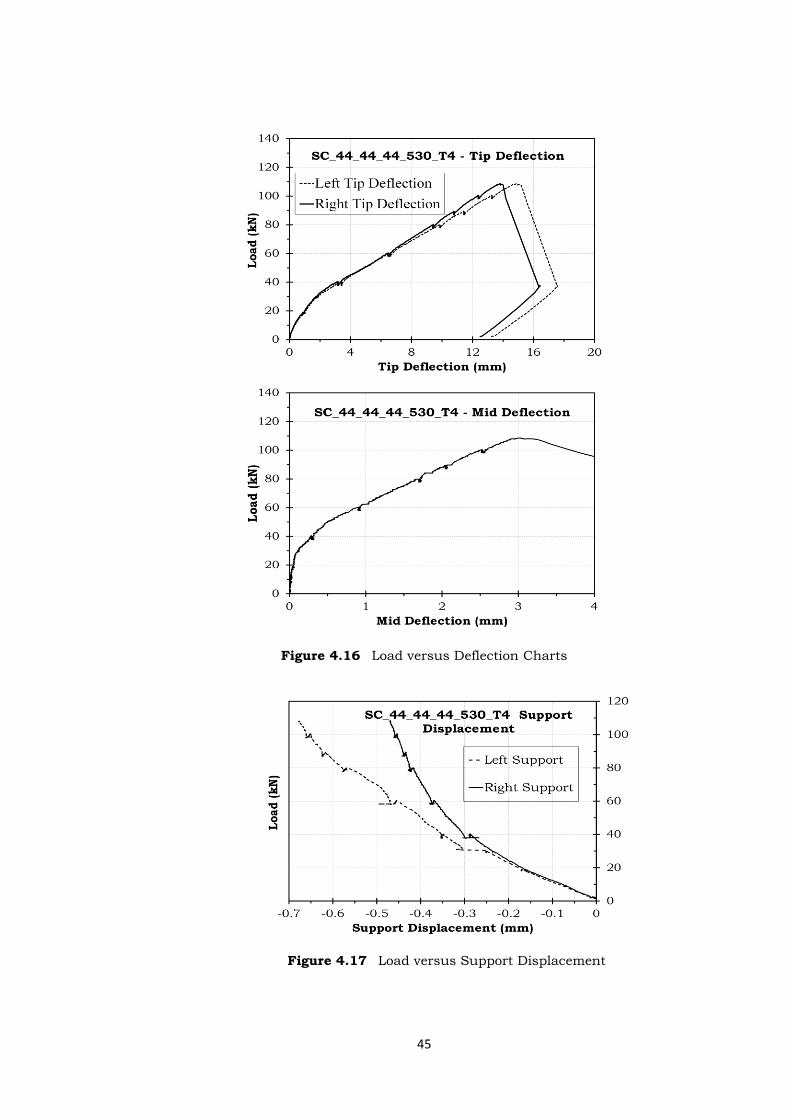
45
Figure 4.16 Load versus Deflection Charts
Figure 4.17 Load versus Support Displacement

46
Figure 4.18 Load versus Longitudinal Strain Charts
Figure 4.19 Load versus Transverse Strain Chart

47
Support displacements were measured very low as expected. The overlap of the left
and right tip deflections indicates that the load was applied symmetrically. The
mid-deflection was much lower than the tip deflections. The total deflection can be
calculated by adding both the tip and mid deflections.
Cracks initiated at approximately 250 level. After cracking, strain distribution is not uniform along the splice length. This unpredictable inconsistency is much
predominant on the transverse reinforcement as shown in Figure 4.19.
Vertical flexural cracks formed first on the bottom and side cover. Formation of the longitudinal cracks on the side cover caused side splitting failure at the ultimate
stage, Figure 4.20.
Figure 4.20 Cracks formation and side splitting on the side cover of the specimen
4.3.5. Specimen SC_44_22_22_530_T4
Specimen SC_44_22_22_530_T4 had two bar diameter, 2db, face cover, whereas
side cover was 1db, and half the spacing between bars was ½db. The total
horizontal bond failure plane was less the total vertical failure plane, and therefore,
the expected failure in this specimen was side splitting. In this specimen, in addition to the longitudinal reinforcements, four transverse reinforcements were used within the splice region. Lap splice length was 530 mm, 24db. The bar stress
according to ACI 408 equation for 24db splice length was calculated as 341.7 MPa.
The contribution of transverse reinforcement was calculated as 73.1 MPa. Total
expected steel stress was 414.8 MPa. Note that, the yield strength was 459 MPa. In
this specimen, the first crack initiated at 21.3 kN according to the deflection graphs. Prior to yielding, the beam specimen failed at 98.3 kN due to the side
splitting. Failure was brittle and occurred suddenly. Tip-, and mid deflections,
support displacement and longitudinal and transverse strains are illustrated in
Figures 4.21-4.24.

48
Figure 4.21 Load versus Deflection Charts
Figure 4.22 Load versus Support Displacement
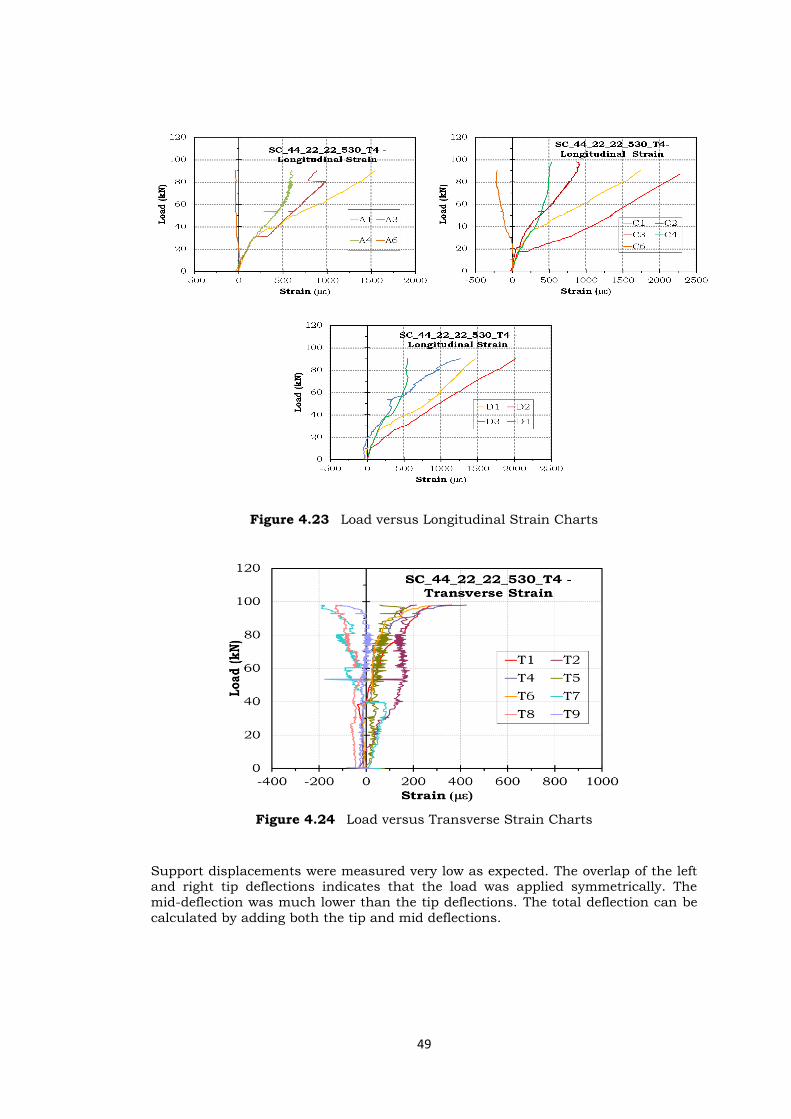
49
Figure 4.23 Load versus Longitudinal Strain Charts
Figure 4.24 Load versus Transverse Strain Charts
Support displacements were measured very low as expected. The overlap of the left and right tip deflections indicates that the load was applied symmetrically. The
mid-deflection was much lower than the tip deflections. The total deflection can be
calculated by adding both the tip and mid deflections.
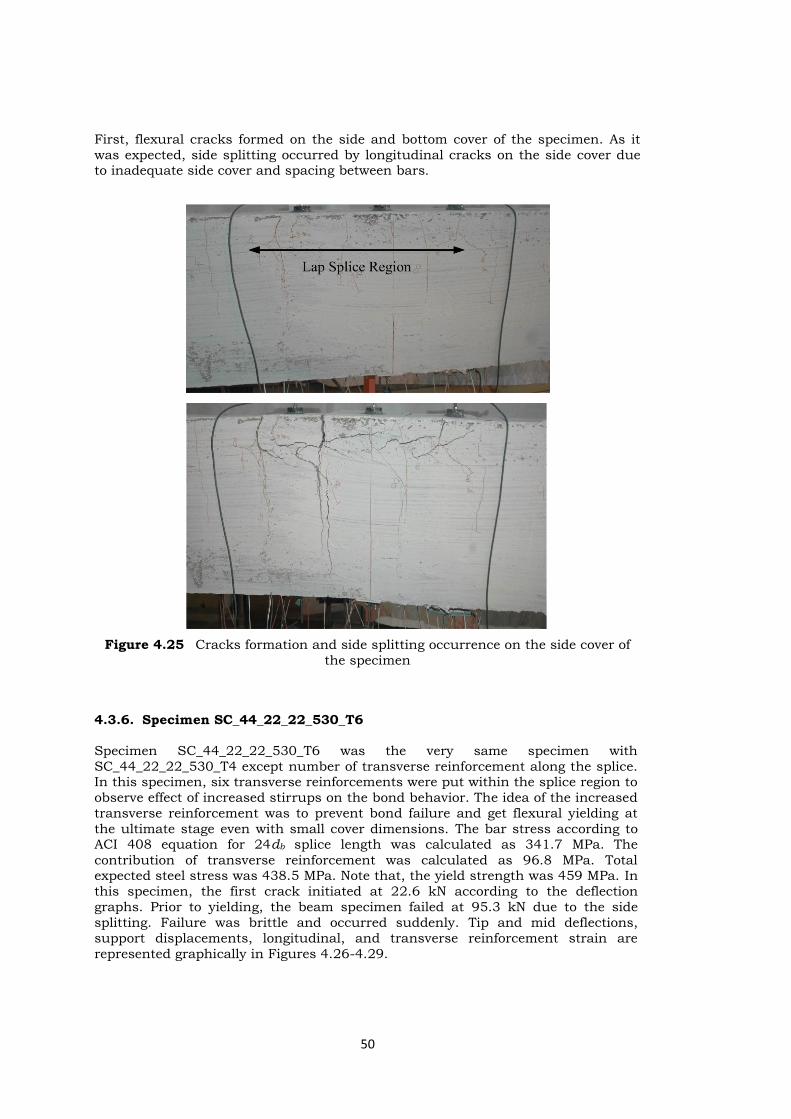
50
First, flexural cracks formed on the side and bottom cover of the specimen. As it
was expected, side splitting occurred by longitudinal cracks on the side cover due to inadequate side cover and spacing between bars.
Figure 4.25 Cracks formation and side splitting occurrence on the side cover of
the specimen
4.3.6. Specimen SC_44_22_22_530_T6
Specimen SC_44_22_22_530_T6 was the very same specimen with
SC_44_22_22_530_T4 except number of transverse reinforcement along the splice. In this specimen, six transverse reinforcements were put within the splice region to
observe effect of increased stirrups on the bond behavior. The idea of the increased
transverse reinforcement was to prevent bond failure and get flexural yielding at
the ultimate stage even with small cover dimensions. The bar stress according to ACI 408 equation for 24db splice length was calculated as 341.7 MPa. The
contribution of transverse reinforcement was calculated as 96.8 MPa. Total expected steel stress was 438.5 MPa. Note that, the yield strength was 459 MPa. In
this specimen, the first crack initiated at 22.6 kN according to the deflection
graphs. Prior to yielding, the beam specimen failed at 95.3 kN due to the side
splitting. Failure was brittle and occurred suddenly. Tip and mid deflections,
support displacements, longitudinal, and transverse reinforcement strain are
represented graphically in Figures 4.26-4.29.
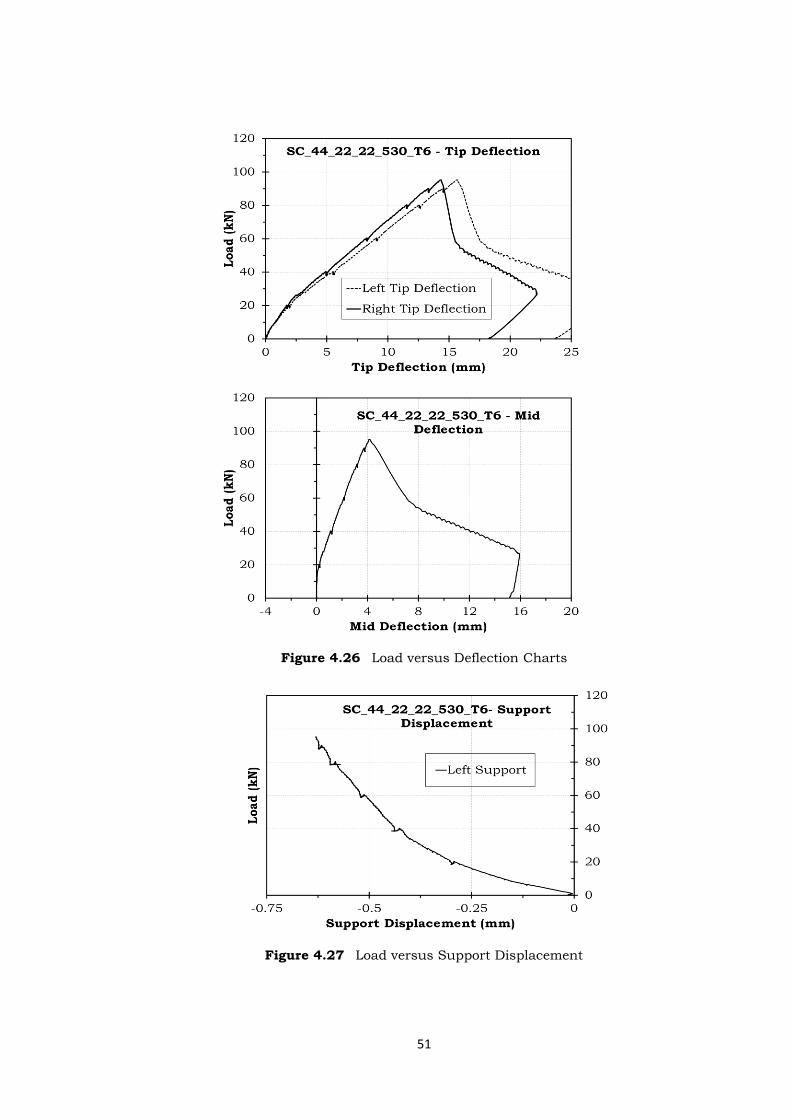
51
Figure 4.26 Load versus Deflection Charts
Figure 4.27 Load versus Support Displacement

52
Figure 4.28 Load versus Longitudinal Strain Charts
Figure 4.29 Load versus Transverse Strain

53
Similar to the other specimens, vertical flexural cracks formed first. Although, the
number of stirrups were increased from four to six, inadequate cover could not
carry the tensile stresses and with the formation of longitudinal side cracks, failure
occurred by side splitting, Figure 4.30.
Figure 4.30 Cracks formation and side splitting occurrence on the side cover of
the specimen

54
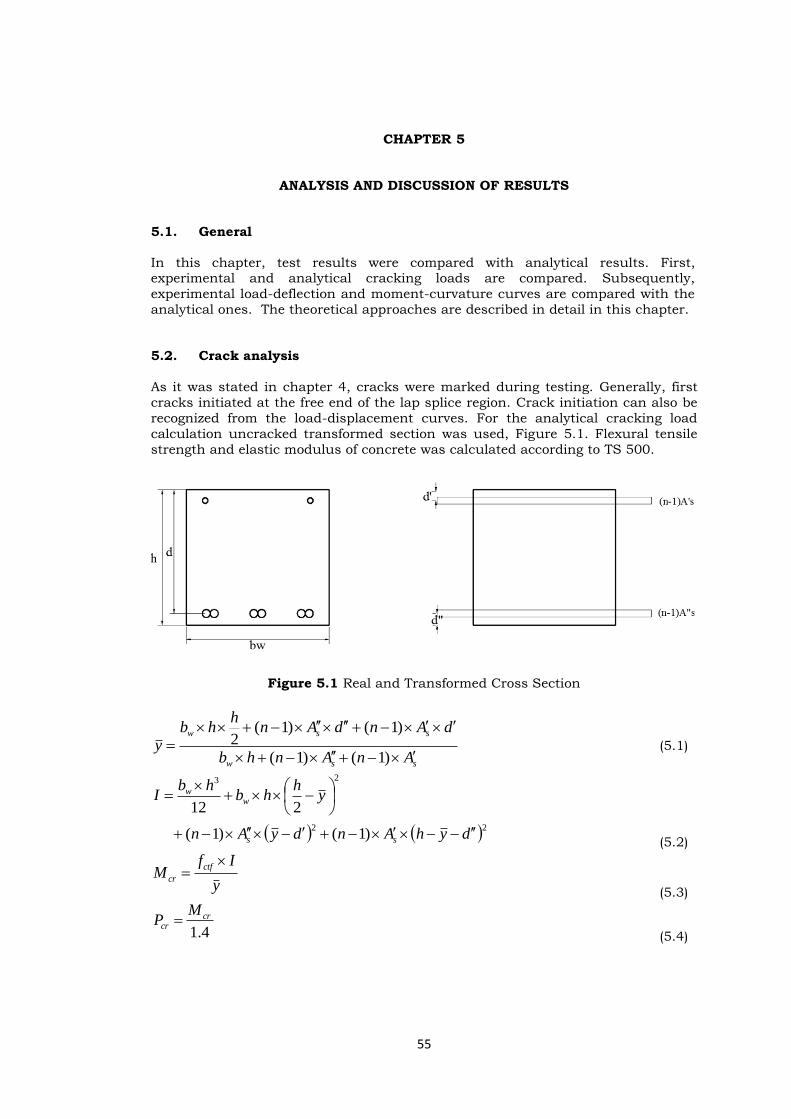
55
CHAPTER 5
ANALYSIS AND DISCUSSION OF RESULTS
5.1. General
In this chapter, test results were compared with analytical results. First, experimental and analytical cracking loads are compared. Subsequently,
experimental load-deflection and moment-curvature curves are compared with the
analytical ones. The theoretical approaches are described in detail in this chapter.
5.2. Crack analysis
As it was stated in chapter 4, cracks were marked during testing. Generally, first
cracks initiated at the free end of the lap splice region. Crack initiation can also be
recognized from the load-displacement curves. For the analytical cracking load
calculation uncracked transformed section was used, Figure 5.1. Flexural tensile
strength and elastic modulus of concrete was calculated according to TS 500.
Figure 5.1 Real and Transformed Cross Section
ssw
ssw
AnAnhb
dAndAnh
hby
)1()1(
)1()1(2 (5.1)
22
23
)1()1(
212
dyhAndyAn
yh
hbhb
I
ss
ww
(5.2)
y
IfM
ctf
cr
(5.3)
4.1
crcr
MP
(5.4)
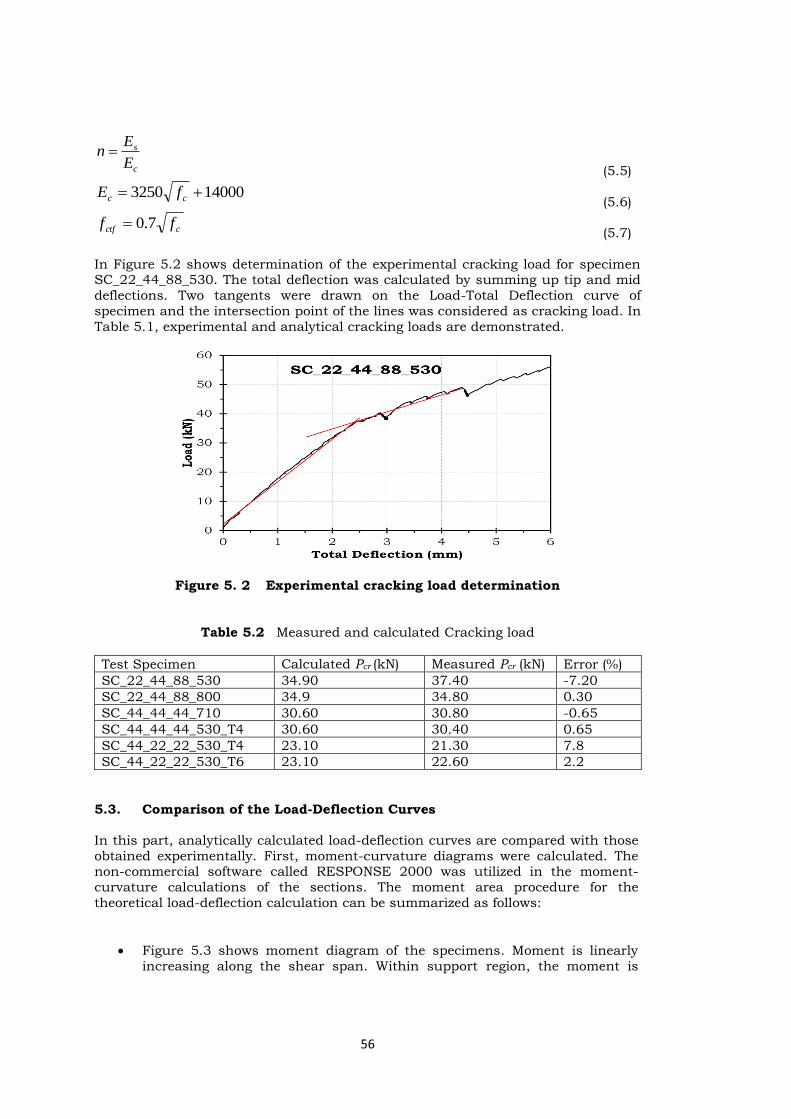
56
c
s
E
En
(5.5)
140003250 cc fE (5.6)
cctf ff 7.0 (5.7)
In Figure 5.2 shows determination of the experimental cracking load for specimen SC_22_44_88_530. The total deflection was calculated by summing up tip and mid
deflections. Two tangents were drawn on the Load-Total Deflection curve of
specimen and the intersection point of the lines was considered as cracking load. In
Table 5.1, experimental and analytical cracking loads are demonstrated.
Figure 5. 2 Experimental cracking load determination
Table 5.2 Measured and calculated Cracking load
Test Specimen Calculated Pcr (kN) Measured Pcr (kN) Error (%)
SC_22_44_88_530 34.90 37.40 -7.20
SC_22_44_88_800 34.9 34.80 0.30
SC_44_44_44_710 30.60 30.80 -0.65
SC_44_44_44_530_T4 30.60 30.40 0.65
SC_44_22_22_530_T4 23.10 21.30 7.8
SC_44_22_22_530_T6 23.10 22.60 2.2
5.3. Comparison of the Load-Deflection Curves
In this part, analytically calculated load-deflection curves are compared with those
obtained experimentally. First, moment-curvature diagrams were calculated. The non-commercial software called RESPONSE 2000 was utilized in the moment-
curvature calculations of the sections. The moment area procedure for the
theoretical load-deflection calculation can be summarized as follows:
Figure 5.3 shows moment diagram of the specimens. Moment is linearly
increasing along the shear span. Within support region, the moment is
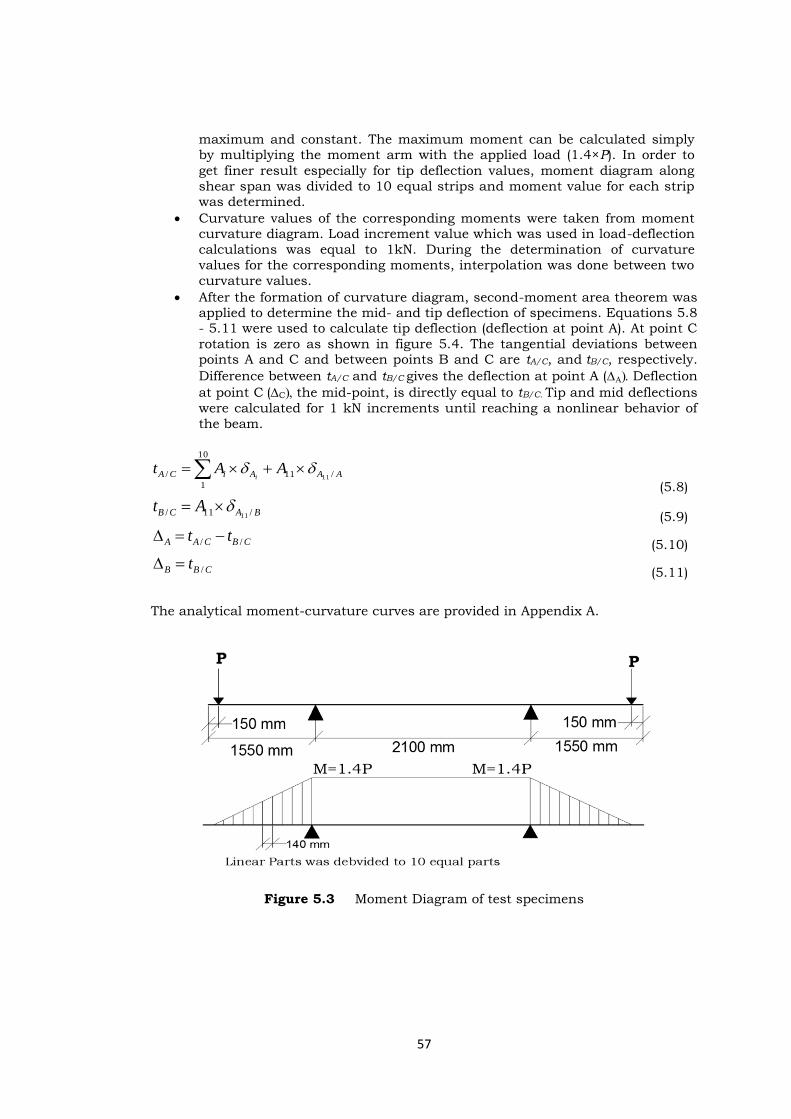
57
maximum and constant. The maximum moment can be calculated simply by multiplying the moment arm with the applied load (1.4×P). In order to
get finer result especially for tip deflection values, moment diagram along
shear span was divided to 10 equal strips and moment value for each strip was determined.
Curvature values of the corresponding moments were taken from moment curvature diagram. Load increment value which was used in load-deflection
calculations was equal to 1kN. During the determination of curvature
values for the corresponding moments, interpolation was done between two
curvature values.
After the formation of curvature diagram, second-moment area theorem was applied to determine the mid- and tip deflection of specimens. Equations 5.8 - 5.11 were used to calculate tip deflection (deflection at point A). At point C
rotation is zero as shown in figure 5.4. The tangential deviations between points A and C and between points B and C are tA/C, and tB/C, respectively.
Difference between tA/C and tB/C gives the deflection at point A (Deflection
at point C(Cthe mid-point, is directly equal to tB/C. Tip and mid deflections
were calculated for 1 kN increments until reaching a nonlinear behavior of
the beam.
AAAiCA AAti /
10
1
11/ 11
(5.8)
BACB At /11/ 11
(5.9)
CBCAA tt // (5.10)
CBB t / (5.11)
The analytical moment-curvature curves are provided in Appendix A.
Figure 5.3 Moment Diagram of test specimens
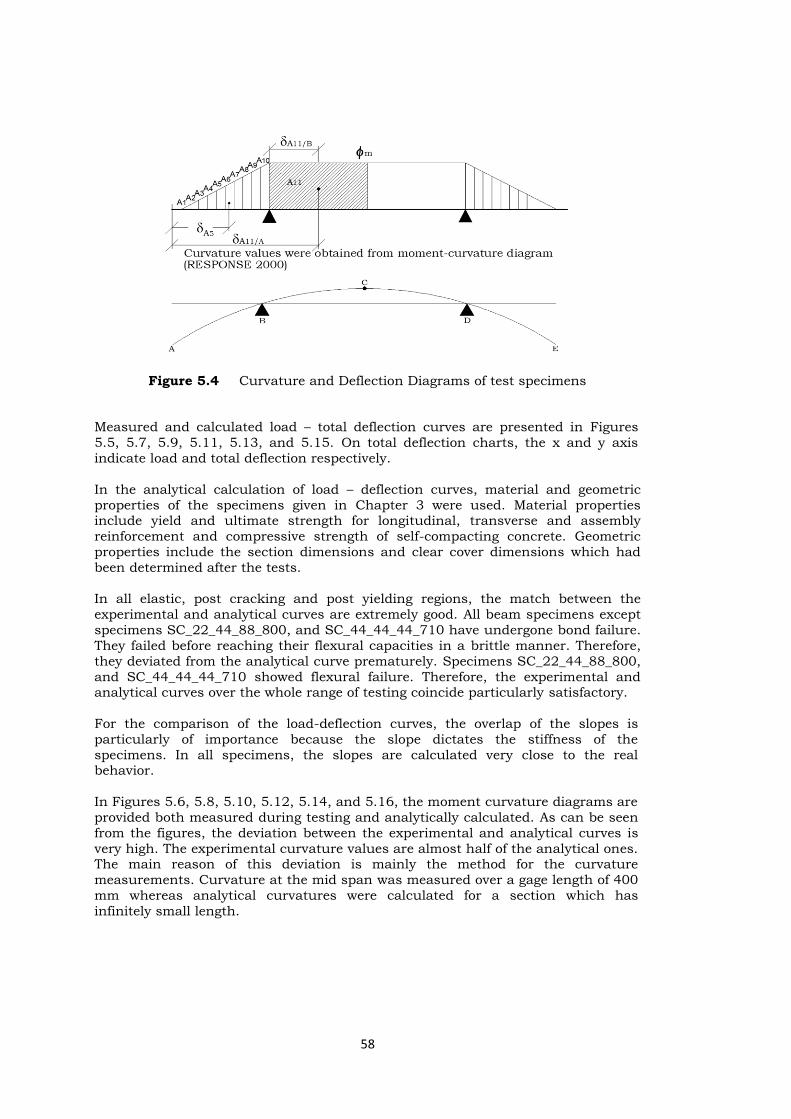
58
Figure 5.4 Curvature and Deflection Diagrams of test specimens
Measured and calculated load – total deflection curves are presented in Figures
5.5, 5.7, 5.9, 5.11, 5.13, and 5.15. On total deflection charts, the x and y axis
indicate load and total deflection respectively.
In the analytical calculation of load – deflection curves, material and geometric
properties of the specimens given in Chapter 3 were used. Material properties include yield and ultimate strength for longitudinal, transverse and assembly
reinforcement and compressive strength of self-compacting concrete. Geometric
properties include the section dimensions and clear cover dimensions which had
been determined after the tests.
In all elastic, post cracking and post yielding regions, the match between the
experimental and analytical curves are extremely good. All beam specimens except
specimens SC_22_44_88_800, and SC_44_44_44_710 have undergone bond failure.
They failed before reaching their flexural capacities in a brittle manner. Therefore,
they deviated from the analytical curve prematurely. Specimens SC_22_44_88_800,
and SC_44_44_44_710 showed flexural failure. Therefore, the experimental and analytical curves over the whole range of testing coincide particularly satisfactory.
For the comparison of the load-deflection curves, the overlap of the slopes is
particularly of importance because the slope dictates the stiffness of the
specimens. In all specimens, the slopes are calculated very close to the real behavior.
In Figures 5.6, 5.8, 5.10, 5.12, 5.14, and 5.16, the moment curvature diagrams are
provided both measured during testing and analytically calculated. As can be seen
from the figures, the deviation between the experimental and analytical curves is
very high. The experimental curvature values are almost half of the analytical ones. The main reason of this deviation is mainly the method for the curvature
measurements. Curvature at the mid span was measured over a gage length of 400
mm whereas analytical curvatures were calculated for a section which has
infinitely small length.

59
Figure 5.5 Load versus Total Deflection curves for SC_22_44_88_530
Figure 5.6 Moment-Curvature Diagram for SC_22_44_88_530

60
Figure 5.7 Load versus Total Deflection curves for SC_22_44_88-800
Figure 5.8 Moment-Curvature Diagram for SC_22_44_88_800

61
Figure 5.9 Load versus Total Deflection curves for SC_44_44_44_710
Figure 5.10 Moment-Curvature Diagram for SC_44_44_44_710
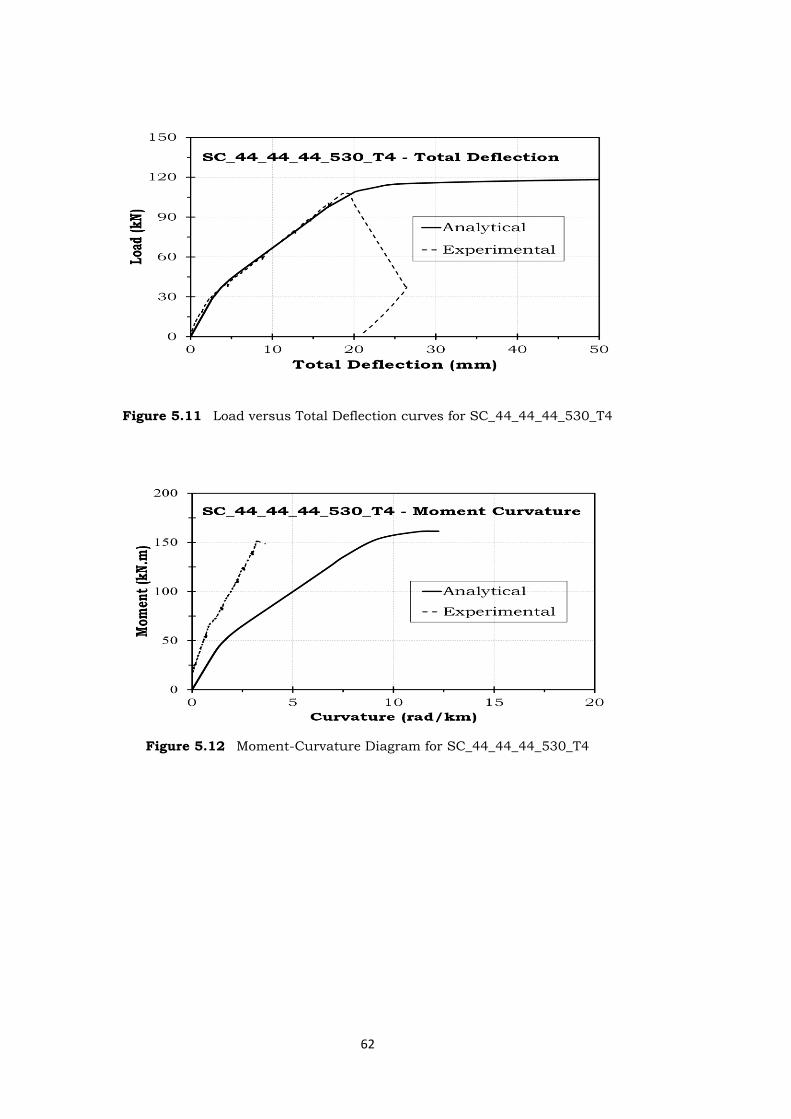
62
Figure 5.11 Load versus Total Deflection curves for SC_44_44_44_530_T4
Figure 5.12 Moment-Curvature Diagram for SC_44_44_44_530_T4

63
Figure 5.13 Load versus Total Deflection curves for SC_44_22_22_530_T4
Figure 5.14 Moment-Curvature Diagram for SC_44_22_22_530_T4

64
Figure 5.15 Load versus Total Deflection curves for SC_44_22_22_530_T6
Figure 5.16 Moment-Curvature Diagram for SC_22_db_24_T6
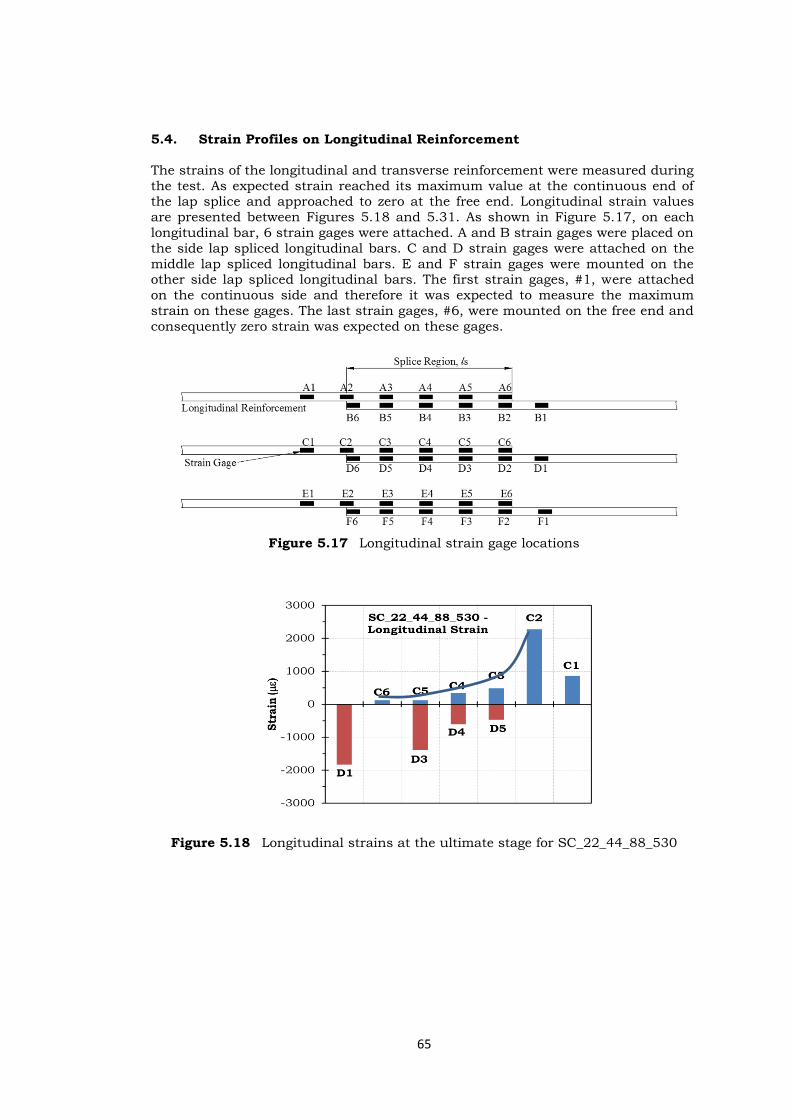
65
5.4. Strain Profiles on Longitudinal Reinforcement
The strains of the longitudinal and transverse reinforcement were measured during
the test. As expected strain reached its maximum value at the continuous end of the lap splice and approached to zero at the free end. Longitudinal strain values
are presented between Figures 5.18 and 5.31. As shown in Figure 5.17, on each
longitudinal bar, 6 strain gages were attached. A and B strain gages were placed on
the side lap spliced longitudinal bars. C and D strain gages were attached on the
middle lap spliced longitudinal bars. E and F strain gages were mounted on the other side lap spliced longitudinal bars. The first strain gages, #1, were attached
on the continuous side and therefore it was expected to measure the maximum
strain on these gages. The last strain gages, #6, were mounted on the free end and
consequently zero strain was expected on these gages.
Figure 5.17 Longitudinal strain gage locations
Figure 5.18 Longitudinal strains at the ultimate stage for SC_22_44_88_530
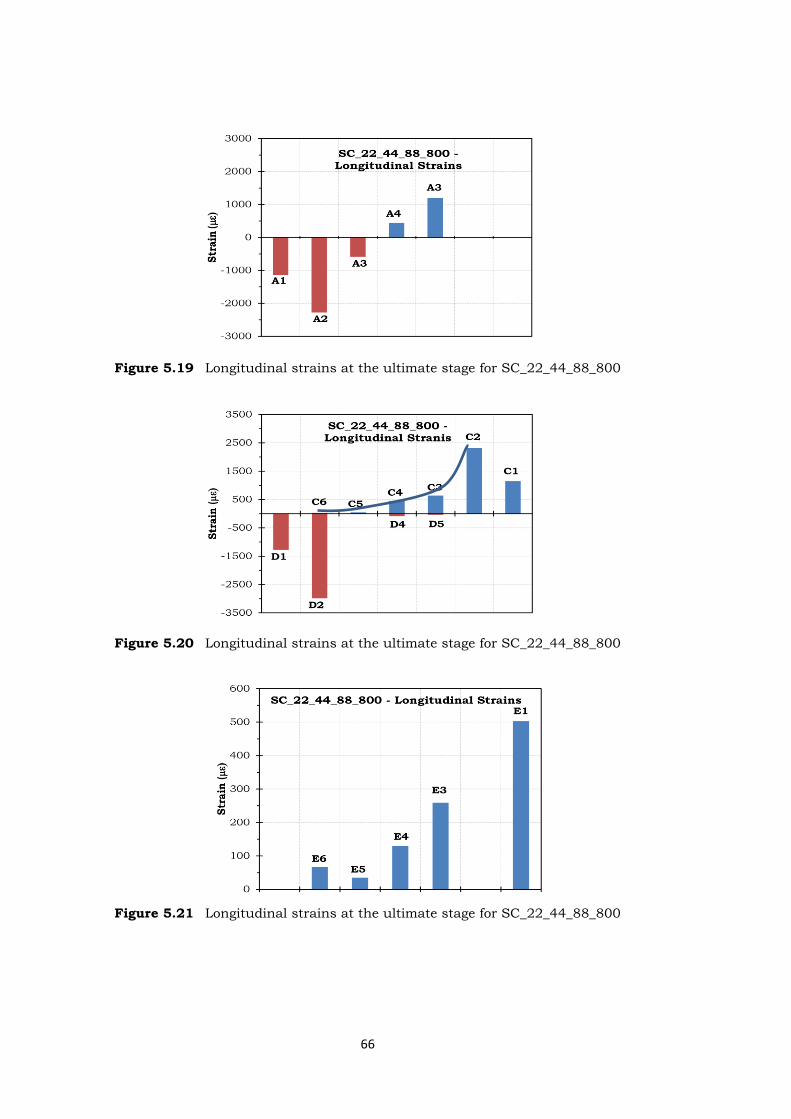
66
Figure 5.19 Longitudinal strains at the ultimate stage for SC_22_44_88_800
Figure 5.20 Longitudinal strains at the ultimate stage for SC_22_44_88_800
Figure 5.21 Longitudinal strains at the ultimate stage for SC_22_44_88_800

67
Figure 5.22 Longitudinal strains at the ultimate stage for SC_44_44_44_710
Figure 5.23 Longitudinal strains at the ultimate stage for SC_44_44_44_710
Figure 5.24 Longitudinal strains at the ultimate stage for SC_44_44_44_710

68
Figure 5.25 Longitudinal strains at the ultimate stage for SC_44_44_44_530_T4
Figure 5.26 Longitudinal strains at the ultimate stage for SC_44_44_44_530_T4
Figure 5.27 Longitudinal strains at the ultimate stage for SC_44_44_44_530_T4
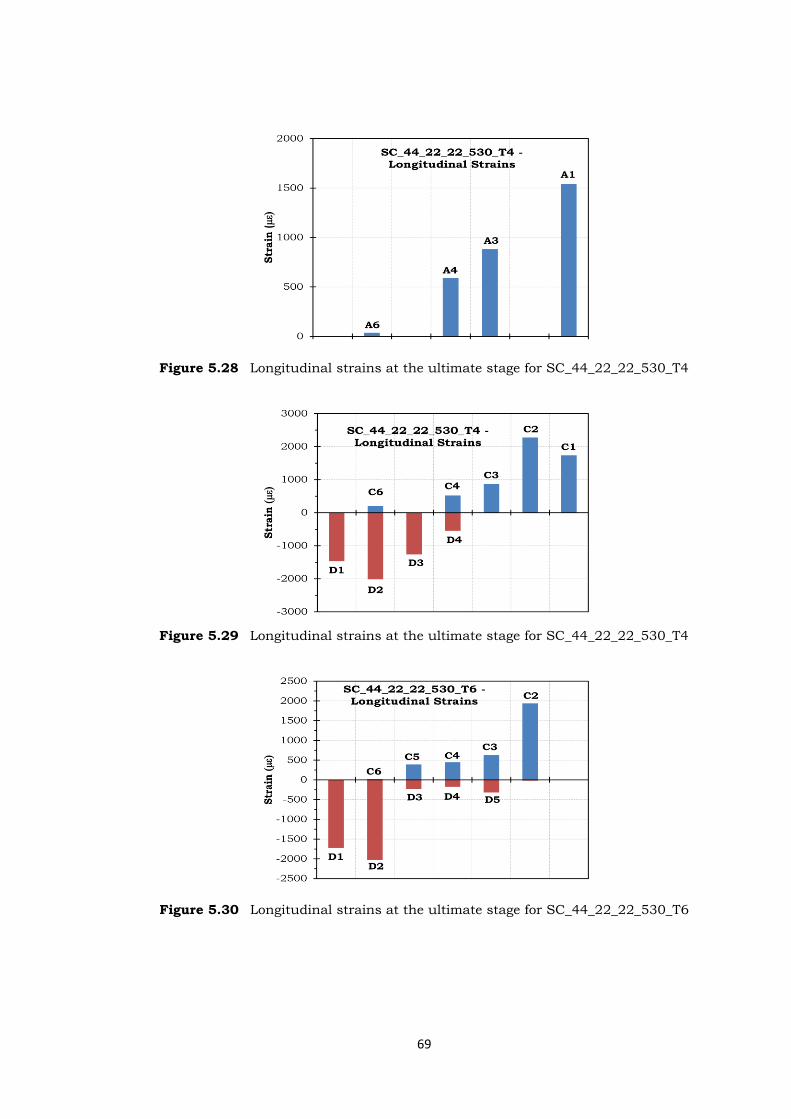
69
Figure 5.28 Longitudinal strains at the ultimate stage for SC_44_22_22_530_T4
Figure 5.29 Longitudinal strains at the ultimate stage for SC_44_22_22_530_T4
Figure 5.30 Longitudinal strains at the ultimate stage for SC_44_22_22_530_T6

70
Figure 5.31 Longitudinal strains at the ultimate stage for SC_44_22_22_530_T6
As expected, maximum strains occurred at the continuous side of the bars and
minimum strains at the free end. Generally, #1 gages showed lower strains as
compared to #2 gages. However, similar strains were expected on both gages. #2
strain gages were located on the end of lap splice whereas #1 gages were attached
away from the lap splice. Generally, the main flexural cracks were observed at the both end of the lap splices. Therefore, #2 gages met generally these main flexural
cracks. Strains accumulate at the cracked regions and therefore, cracked sections
cause increase in the strain as compared to uncracked sections.
Like specimens SC_22_44_88_800 and SC_44_44_44_710, the strains are not close
to each other on the three splices. The reason may be the uneven crack distribution.
As can be observed from the above figures, the longitudinal strain variation on the
splice is not linear. The strain increases in accelerated manner.
5.5. Strain Profiles on Transverse Reinforcement
The locations of the strain gages on the transverse reinforcement are given in
Figure 5.32. For 4 stirrup case, the last two strain gaged stirrups are symmetrical
and should give similar results. For 6 stirrup case, the first stirrup (T1, T2, T3) is at the end of lap splice whereas the last stirrup (T7, T8, T9) is located at the middle
of lap splice. Figures 5.33 - 5.35 shows strain variation of transverse reinforcement
at the ultimate stage.
As shown in the above figures and in the previous chapter, strain variations on the transverse reinforcement are not smooth and show high variations. While some
gages show compressive strains other can give tensile strains. Therefore it is hard
to conclude from the strain readings on the transverse reinforcement. However, it
can be generalized that, strain gages at the corner of the transverse reinforcement
(T4, and T6) gave higher strains as compared to the middle strain gages (T5).
Additionally, it can be concluded that strain values measured on transverse reinforcement adjacent to the free ends were higher than that of strain values
measured closer to mid of the lap splice. The average strain on the transverse
reinforcement for specimen SC_44_22_22_530_T4 can be taken as 200 .

71
Figure 5.32 Longitudinal strains at the ultimate stage for SC_44_22_22_530_T6
Figure 5.33 Strain value at ultimate for transverse reinforcements of
SC_44_44_44_530_T4
Figure 5. 34 Strain value at ultimate for transverse reinforcements of
SC_44_22_22_530_T4

72
Figure 5.35 Strain value at ultimate for transverse reinforcements of
SC_44_22_22_530_T6
5.6. Comparison of the Measured and Calculated Ultimate Stresses
The reinforcement stress values were calculated theoretically by using ACI 408 descriptive equation, Equation 5.12. The SI version of the equations is provided below for steel stress fs:
y
b
ctrdr
b
cbbss
fA
f
n
NAtt
A
f
c
cAdcf
4/3
4/1
min
maxmin
)55890.8(
9.01.04.575.043.1
(5.12)
fs: stress in reinforcing bar,
s: splice length, cmin: min(cb; cs)
cb: bottom concrete cover,
cs: min(cso; csi+6.35mm)
cso: side concrete cover,
csi: ½ of the bar clear spacing,
db: diameter of bar,
Ab: area of bar being spliced, cmax: max(cb; cs)
fc': concrete compressive strength,
tr: term representing the effect of relative rib area on Ts. Taken as 0.978 for regular
bars. Ts : the additional bond strength provided by the transverse steel,
td: term representing the effect of bar size on Ts.
N: the number of transverse reinforcement within the splice length,
Atr: area of each stirrup crossing the potential plane of splitting adjacent to the
reinforcement being spliced, n: number of bars being spliced,
s: spacing of transverse reinforcement, fy: yield strength of steel.

73
The measured bar stresses were determined from the ultimate load. The ultimate
stress reached during the test was calculated by using the ultimate load. The bar
stresses were computed by back solving iteratively the force and moment
equilibrium equations.
Table 5.2 shows the bar stresses determined from the tests and calculated
analytically. For unconfined specimens, the error between the measured and
calculated bars stress varies between 3.4% and 6.5 %. It can be concluded that the
ACI 408 bond stress descriptive equation for normal vibrated concrete predicts very successfully the bar stresses of unconfined beams made of SCC.
According to Table 5.2, the error between the measured and calculated bar stresses
varies between 10.6% and 34.5 %. In general, bar stress prediction for confined
beams is poor even for normal vibrated concrete. However, the error was enormous
in this series of tests. The main reason of this high difference is mainly inadequate cover dimensions. According to ACI 318-11, Clause 7.6.1, the minimum clear spacing between parallel bars in a layer shall be 1 bar diameter, 1db, but not less
than 1 in. (25.4 mm). For the last two specimens, this limitation is not satisfied and
set to 22 mm which is less than 25.4 mm. According to ACI 318-11 Clause 7.7.1,
specified cover for reinforcement shall not be less than 1.5 in. (38.1 mm) for beams
not exposed to weather or in contact with ground. The given distance for clear cover should be measured from the outside of the transverse reinforcement. The face
cover of all confined specimens was 44 mm which was measured from outside of
the longitudinal bars. The clear face cover was 36 mm which is slightly less than
the given limit. The side clear cover for specimen SC_44_44_44_530_T4 was 36
mm. However, for specimens SC_44_22_22_530_T4, and SC_44_22_22_530_T4, the side clear cover was 14 mm which was far below the given limit. These inadequate
covers and spacing caused unpredictable and low bars stresses. Briefly, the
descriptive equation cannot predict bar stresses adequately if covers are very small.
The last specimen SC_44_22_22_530_T6 should have behaved better than
specimen SC_44_22_22_530_T4 because it had more transverse reinforcement. The calculated bar stress of this specimens was 5.7% higher than specimen with less
stirrups. However, the measured bar stress of SC_44_22_22_530_T6 was 4.4% less
than that of SC_44_22_22_530_T4. The main reason is again inadequate cover
dimensions. The side cover dimensions for these two specimens were extremely low.
Increased number of transverse reinforcement inside this small cover caused weak plane instead of increase in bar stress. Briefly, small cover along with a large
number of transverse reinforcement weakened tensile capacity of cover concrete
and resulted in a decrease in the capacity.
Table 5.2 Test results
fc (MPa) fcts (MPa) Measured
fs (MPa)
ACI 408
fs (MPa)
Error (%)
SC_22_44_88_530 44.0 3.4 373.5 349.1 -6.5 SC_22_44_88_800 44.0 3.4 459 441.1 -3.9 SC_44_44_44_710 44.5 3.7 459 443.4 -3.4
SC_44_44_44_530_T4 44.5 3.7 400.0 442.4 10.6
SC_44_22_22_530_T4 45.6 3.9 341 414.8 21.6 SC_44_22_22_530_T6 45.6 3.9 326 438.5 34.5

74

75
CHAPTER 6
CONCLUSIONS
Due to insufficient experimental study on the bond behavior of full scale beams
with Self Compacting Concrete (SCC), this study was conducted to fill the gap of lacking experimental data. In this study 6 beams were prepared, with different
variables affecting bond behavior. These variables are side cover, bottom cover, free
spacing between lap-spliced bars and transverse reinforcement. These specimens
were tested under flexure. All beams had lap splice at mid span where constant
moment exists. The reinforcement stresses were calculated analytically by using
ACI 408-R03 descriptive equations and compared with those obtained experimentally. Based on the experimental and analytical studies and therefore
limited to number of tests conducted, the following conclusions are inferred:
In Turkey, ready-mix concrete companies may not design concrete mix for SCC properly and may cause bleeding in SCC. The main reason of the
bleeding can be attributed to exclusion of the viscosity modifying agent in
the mix design.
Specimen SC_22_44_88_530 with 24db lap splice length showed bond
failure with face splitting as expected.
The expected failure for Specimen SC_22_44_88_800 with 36db lap splice
was bond failure. This specimen, however, showed flexural failure.
Increased lap splice length and adequate covers succeeded flexural failure.
Test continued approximately until reaching 4 times the yield displacement.
The expected failure for Specimen SC_44_44_44_710 with 32db lap splice
was bond failure. This specimen showed yielding primarily. With the
increasing loading and increasing displacements, however, bond failure
occurred with side splitting. Bond failure occurred at about 3 times the yield
displacement.
Specimen SC_44_44_44_530_T4 with 24db lap splice length and 4 stirrups
within the lap splice showed bond failure with side splitting as expected.
Specimen SC_44_22_22_530_T4 with 24db lap splice length and 4 stirrups
within the lap splice showed bond failure with side splitting as expected.
Specimen SC_44_22_22_530_T6 with 24db lap splice length and 6 stirrups
within the lap splice showed bond failure with side splitting as expected.
ACI 408 descriptive equation for normal vibrated concrete predicted bar stresses of the unconfined specimens produced with SCC acceptably well.
The predicted values were lower than the measured values to be on the safe side. The error varied between 3.4% and 6.5%.
All predictions of the ACI408 descriptive equation gave higher bar stresses than measured values of the confined specimens produced with SCC. All
76
the calculated values were unsafe. The error varied between 10.6% and
34.5%.
Although specimen SC_44_44_44_530_T4 with 24db lap splice length
followed almost all the limitation for cover dimension the error of the bar stress prediction was 10.6%. In this specimen, side and face cover was only
5.5% less than the ACI 318 limits and spacing between bars was 13.4% less
than the ACI 318 limits.
Although, specimen SC_44_22_22_530_T4 with 24db lap splice length
should have shown high bar stresses according to ACI 408 prediction, this
calculated value was 21.6% higher than the measured value. The main reason of the deviation was inadequate cover dimensions. In this specimen,
face cover was only 5.5% less than the ACI 318 limits, whereas side cover
and spacing between bars were 63.3% and 56.7% less than the ACI 318
limits.
In specimen SC_44_22_22_530_T6 with 24db lap splice length to overcome
the small cover and spacing problem, number transverse reinforcement was
increased to 6 stirrups. However, this increase had a negative effect on the bar stress and measured values were lower than specimen
SC_44_22_22_530_T4. The main reason of the decreasing bar stress was the
weak plane created due to the increased number of stirrups inside a small
side and face cover.
Cover dimensions or spacing between bars lower than code minimums cause unpredictable bar stresses and cause premature bond failure. Lap
splice length provision alone cannot ensure flexural failure. Cover
dimensions and bar spacing limitations should be strictly followed in
design.
77
REFERENCES
The European Guidlines for Self-Compacting Concrete; Specification, Production and Use. (2005).
Abrams, D. (1913). Tests of Bomnd Between Concrete and Steel. University of
Illinois. ACI 237R-07. (2007). "Self-Consolidating Concrete Reported by ACI Committe 237".
Farmington Hills, MI: American concrete Institute. ACI 408R-03. (2003). "Bond and Develoement of Straight Reinforcing Bars in Tension
Reported by ACI Committe 408". Farmington Hills, MI: American Concrete
Institute. Bentz, E. (2000). Response-2000, Reinforced Concrete Sectional Analysis using the
Modified Compression Field Theroy, Version 1.0.5. Toronto, CA.
Canbay, E. (2009). Bond of Lap-Spliced Bars in Self-Compacting Concrete. Canada.
Daoud, A., & Lorrian, M. (2003, May). Influence of bar position on bond between
reinforcement and self-compacting concrete: interpretation using image analysis. Materials and Structures/, 38, 231-237.
de Almeida Filho, F., El Debs, M. K., & El Debs, A. H. (2008). Bond-slip behavior of
self-compacting concrete and vibrated concrete using pull-out and beam tests. Materials and Structures, 41, 1073–1089.
de C. El Debs, A. H., & de Almeida Filho, F. M. (2007). THEORETICAL AND
NUMERICAL APPROACH OF THE BOND BEHAVIOR IN BEAM TESTS
USING SELF-COMPACTING AND ORDINARY CONCRETE WITH THE SAME COMPRESSIVE STRENGTH. Ciência & Engenharia,, 16(1/2), 99-106.
De Schutter, G., Bartos, P. J., Domone, P., & Gibbs, J. (2008). Self-Compacting Concrete. New York: Whittles Publishing.
Desnerk, P., De Schutter, G., & Taerwe, L. (2010). Bond Behavior of reinforcing
bars in self-compacting concrete: experimental determination by using beam test. Material and Structures, 43, 53-62.
Domone, P. (2007). A review of the hardened mechanical properties of self-compacting concrete. Cement & Concrete Composites, 29, 1-12.
Esfahani, M. R., Kianoush, M. R., & Lachemi, M. (2005, June 4). Bond strength of glass fibre reinforced polymer reinforcing bars in normal and self-consolidating concrete. Retrieved from http://cjce.nrc.ca
Hayakawa, M., Matsouka, Y., & Shindoh, T. (1993). Developement and Applicatioon of Super Workable Cocncrete. Universiyi of Pasiley (p. 8). RILEM.
Hossain, K., & Lachemi, M. (2008, September 1). Bond Behavior of Self-Consolidating Concrete with Mineral and Chemical Admixtures. Journal of Materials in Civil Engineering, 9(9), 608-616.
Mazaheripour, H., Barros, J., Sena-Cruz, J., Pepe, M., & Martinelli, E. (2013).
Experimental study on bond performance of GFRP bars in self-compacting steel fiber reinforced concrete. Composite Structure, 202-212.
Miura, N., Takeda, N., Chikamatsu, R., & and Sogo, S. (1993). Developement and
Utilization of High Performance Concrete fo the Construction of the Akashi Kaikyo Bridge. 25-51.
Okamura, H., Maekawa, K., & Ozawa, K. (1993). Highe Performance Concrete.
Gihodo Publishing.
Ozawa, K., Maekawa, K., Kunishima, M., & Okamura, H. (1989). Developement of
high performance concrete based on the durability design of concrete structures. East-Asia and Pacific Conference on Structural Engineering and Construction (EASEC-2), 1, pp. 445-450.

78
Pandurangan, K., Kothandaraman, S., & Sreedaran, D. (2010). A study on the bond strength of tension lap splices in self compacting concrete. Materials and Structures, 43, 1113-1121.
Sonebi, M., & Bartos, P. ( September 1999). Hardened SCC and its Bond with Reinforcement. The Firts Internatioan RELIM Symposym on SCC. Stockhom,
Sweden.
Sonebi, M., & Bartos, P. (September 1999). Hardened SCC and its Bond with Reinforcement. The Firts Internatioan RILEM Symposym on SCC. Stockhom,
Sweden.
Tanaka, K., Sato, K., Watanabe, S., Arima, I., & and Suenaga, K. (1993).
Development and Utilization of High Performance Concrete for the Construction of the Akashi Kaikyo Bridge. In High-Performance Concrete in Severe Environments (Vol. 140, pp. 25-51).
Tanaka, K., Sato, K., Watanabe, S., Arima, I., & and Suenaga, K. (n.d.).
Development and Utilization of High Performance Concrete for the
Construction of the Akashi Kaikyo Bridge. (P. Zia, Ed.)
Türk, K., Benli, A., & Calayır, Y. (2008, January 12). Bond Strength of Tension Lap-Splice in Full Scale Self-Compacting Concrete Beams. Turkish J. Eng. Env. Sci, 32, 377-386.
Türk, K., Karataş, M., & Ulucan, Z. C. (2010). Effect of the use of different types
and dosages of mineral additions on the bond strength of lap-spliced bars in self-compacting concrete. Materials and Structures, 43, 557-570.
Valcuende, M., & Parra, C. (2009). Bond behaviour of reinforcement in self-compacting concretes. Construction and Building Materials, 23, 162-170.
Yin-Wen, C., Chen, Y.-S., & Liu, Y.-S. (2003, July - August). Developement of Bond Strength of Reinforcement Steel in Self-Consolidating Concrete. ACI STRUCTURAL JOURNAL, 100(4).
Zhu, W., Sonebi, M., & Bartos, P. (2004, August - September). Bond and Interficial properties of reinforcement in self-compacting concrete. Material and
Sructures, 37, 442-448.

79

80
APPENDIX A
THEORETICAL MOMENT CURVATURE DIAGRAMS OF SPECIMENS
In this appendix theoretical moment curvature diagrams, acquired from RESPONSE-200, are shown.
Figure A.1 Moment Curvature Diagram – SC_22_44_88_530
Figure A.2 Moment Curvature Diagram – SC_22_44_88_800

81
Figure A.3 Moment Curvature Diagram – SC_44_44_44_710
Figure A.4 Moment Curvature Diagram – SC_44_44_44_530_T4

82
Figure A.5 Moment Curvature Diagram – SC_44_22_22_530_T4
Figure A.6 Moment Curvature Diagram – SC_44_22_22_530_T6