Bombs, Brains, and Science - Trinity College, Dublin Waldinger Bombs Brains and Science.pdfBombs,...
63
Bombs, Brains, and Science The Role of Human and Physical Capital for the Creation of Scientic Knowledge Fabian Waldinger (University of Warwick) December 6, 2013 Abstract This paper examines the relative roles of human and physical capital for the creation of scientic knowledge. To address the endogeneity of inputs, I analyze a shock to human capital, the dismissal of scientists in Nazi Germany, and a shock to physical capital, WWII bombings of universities. In the short-run, a 10% decline in human capital reduced output by .2 sd whereas a 10% decline in physical capital reduced output by .05sd. The human capital shock persisted in the long-run, while the physical capital shock did not. To explore mechanisms for the persistence of the human capital shock I show that the dismissal of star scientistswas particularly detrimental as they are key for attracting other successful researchers and for the training of PhD students. Keywords: Human Capital, Physical Capital, Productivity of Universities, Star Scien- tists, Long-Run Persistence, Nazi Germany, Bombings. 1 Introduction Which inputs create successful research universities? Anecdotal observation suggests that hu- man and physical capital, i.e. scientists and their laboratories, are important inputs in the production of scientic knowledge (Machlup, 1961). Understanding the causal e/ect of these inputs and their relative role for the creation of scientic output in universities is important for policy makers, university administrators, and researchers alike. At the moment, many coun- tries such as Brazil, South Korea, and especially China, are making large investments in higher education (Kugler, 2011, Rhee, 2011, Wang et al. 2011). Should they hire outstanding scholars or construct new laboratories to achieve the highest returns on their investments? Christoph Knig, Veronika Rogers-Thomas, and Michael Talbot provided excellent research assistance. I thank Daron Acemoglu, David Figlio, Ben Jones, Victor Lavy, Guy Michaels, Andrew Oswald, Steve Pischke, Daniel Sturm, Maria Waldinger, Heidi Williams, and seminar participants at Amsterdam, Berkeley, Berlin (DIW and German Econmists Abraod), Carnegie Mellon, Case Western, CESifo, Dalhousie, Essex, Harvard, IIES, IoE London, MIT, NBER, Northwestern, Oxford, RHUL, SOLE (Chicago), SSE, Stockholm, Stirling, Sussex, UCLA, Warwick, and Wesleyan for very helpful comments. A large number of university archivists have been very helpful at providing datasources for the construction of department level destruction data. I am very grateful to all of them. I also thank the British Academy for nancial support. 1
Transcript of Bombs, Brains, and Science - Trinity College, Dublin Waldinger Bombs Brains and Science.pdfBombs,...
Bombs, Brains, and Science
The Role of Human and Physical Capital for the Creation of Scientific
Knowledge
Fabian Waldinger (University of Warwick)∗
December 6, 2013
Abstract
This paper examines the relative roles of human and physical capital for the creationof scientific knowledge. To address the endogeneity of inputs, I analyze a shock to humancapital, the dismissal of scientists in Nazi Germany, and a shock to physical capital, WWIIbombings of universities. In the short-run, a 10% decline in human capital reduced outputby .2 sd whereas a 10% decline in physical capital reduced output by .05sd. The humancapital shock persisted in the long-run, while the physical capital shock did not. To exploremechanisms for the persistence of the human capital shock I show that the dismissal of‘star scientists’was particularly detrimental as they are key for attracting other successfulresearchers and for the training of PhD students.Keywords: Human Capital, Physical Capital, Productivity of Universities, Star Scien-
tists, Long-Run Persistence, Nazi Germany, Bombings.
1 Introduction
Which inputs create successful research universities? Anecdotal observation suggests that hu-
man and physical capital, i.e. scientists and their laboratories, are important inputs in the
production of scientific knowledge (Machlup, 1961). Understanding the causal effect of these
inputs and their relative role for the creation of scientific output in universities is important for
policy makers, university administrators, and researchers alike. At the moment, many coun-
tries such as Brazil, South Korea, and especially China, are making large investments in higher
education (Kugler, 2011, Rhee, 2011, Wang et al. 2011). Should they hire outstanding scholars
or construct new laboratories to achieve the highest returns on their investments?
∗Christoph König, Veronika Rogers-Thomas, and Michael Talbot provided excellent research assistance. Ithank Daron Acemoglu, David Figlio, Ben Jones, Victor Lavy, Guy Michaels, Andrew Oswald, Steve Pischke,Daniel Sturm, Maria Waldinger, Heidi Williams, and seminar participants at Amsterdam, Berkeley, Berlin(DIW and German Econmists Abraod), Carnegie Mellon, Case Western, CESifo, Dalhousie, Essex, Harvard,IIES, IoE London, MIT, NBER, Northwestern, Oxford, RHUL, SOLE (Chicago), SSE, Stockholm, Stirling,Sussex, UCLA, Warwick, and Wesleyan for very helpful comments. A large number of university archivists havebeen very helpful at providing datasources for the construction of department level destruction data. I am verygrateful to all of them. I also thank the British Academy for financial support.
1
Despite the significance of these issues we know little about the effects of different inputs
for the production of scientific knowledge. As highlighted for firms by a large literature in
industrial economics, the estimation of production functions is diffi cult because inputs are
often chosen on the basis of unobservable productivity shocks (e.g. Ackerberg, et al. 2007).
Estimating ‘knowledge production functions’is similarly challenging. ‘Star scientists’may be
attracted by more productive departments and at the same time enhance the departments’
productivity. Similarly, high quality departments attract more funding for physical capital,
which further increases productivity. Finally, star scientists may attract funding for additional
physical capital.
To overcome these diffi culties I use two extensive, but temporary, shocks affecting German
and Austrian science departments. As human capital shock I use the dismissal of mostly Jewish
scientists in Nazi Germany and Austria between 1933 and 1940. As physical capital shock I use
the destruction of science facilities during the Allied bombing campaign in the Second World
War. The two shocks create ample variation because they affected departments to varying
extents. In some departments, up to 60 percent of the faculty were dismissed while other
departments did not lose anyone. Similarly, Allied bombings completely destroyed the facilities
of some departments while other departments were not destroyed.
To investigate how the two shocks impacted department output in the short-run and whether
they persisted in the long-run I construct a new data set of all scientists in German and
Austrian physics, chemistry, and mathematics departments at seven points in time between
1926 and 1980. The micro data contain more than 10,000 scientist-year observations with
detailed measures of their publication records in top journals. These data allow me to construct
output measures for all science departments between 1926 and 1980. I add information on the
two shocks from detailed historical records of dismissals in Nazi Germany and from archival
material on bombing destruction during WWII.
Results show that both human and physical capital shocks had a negative effect on scientific
output in the short-run. A 10 percent shock to human capital lowered department output by
0.2 standard deviations. A 10 percent shock to physical capital lowered output by 0.05 standard
deviations in the short-run. As it took time to rehire after the dismissals and to reconstruct
buildings after the bombings these short-run results inform us about the importance of human
and physical capital inputs in the ‘knowledge production function’. I also investigate the long-
run persistence of the two shocks to understand how quickly departments adjusted to the human
and physical capital shocks. The human capital shock persisted in the long-run and continued
to have a negative impact on scientific output until 1980, almost 50 years after the dismissals.
The physical capital shock, however, did not persist. Scientific output of departments that had
been bombed during WWII recovered by 1961. By 1970, bombed departments even had slightly
higher output than other departments. This suggests that bombed departments benefitted
from upgrading during post-war reconstruction; the latter results are only significant in some
specifications.
I show that the results are not driven by other changes that affected the German and
2
Austrian university system which may have been correlated with the two shocks. In particular,
the results are robust to controlling for post-war occupation zones (U.S., U.K., French, or Soviet
zones) and dropping East German and Austrian universities from the sample. The results are
also robust to controlling for the creation of federal states after WWII. Similarly, controlling for
changes at the university level, such as changes in university age and changes in competition
from newly founded universities, does not affect the results. I also show evidence that changes
at the city level are not driving my findings; the results are robust to controlling for bombing
destruction at the city level, changes in the fraction of Jews in a city, investment in armament
related industries by the Nazi government, and distance to the ‘iron curtain’after the division
of Germany. Furthermore, I show that the results are robust to controlling for mean reversion
and university wide changes after 1945.
Recent work has highlighted the importance of ‘star scientists’for the creation of scientific
knowledge (Azoulay, Zivin, and Wang, 2010). Many of the dismissed scholars were among
the leaders of their profession; my data include eleven dismissed Nobel Laureates such as the
physicists Albert Einstein and Max Born and the chemists Fritz Haber and Otto Meyerhof.
I can therefore investigate whether losing high quality scientists had particularly large effects
on department output. The results indicate that losing high quality scientists and especially
‘star’scientists caused particularly large reductions in output. The loss of a scientist in the top
5th percentile of the quality distribution, for example, lowered output by between 0.7 and 1.6
standard deviations, compared to an effect of 0.2 standard deviations for losing any scientist.
I then evaluate potential mechanisms that could explain the persistence of the human capi-
tal shock. A reduction in department size after the dismissals only explains some of the decline
in output. I show that a key mechanism for the persistence of the human capital shock was a
permanent fall in the quality of hires, in particular after losing high quality scientists. Recent
work on the short-run effects of the dismissal of scientists in Nazi Germany has documented
that the quality of PhD students declined in affected departments while the productivity of
established scientists who were directly exposed to the dismissal of their colleagues was un-
affected (Waldinger, 2010, 2012).1 While this earlier research indicates that the productivity
of faculty peers was not affected by the dismissal of high quality colleagues the results in the
current paper show that departments with dismissals declined in the long-run. These results
show that despite the absence of localized productivity spillovers the loss of human capital can
have persistent negative effects on output because of a permanent decline in the quality of hires.
To my knowledge, no previous paper has analyzed the role of human and physical capital
for the creation of scientific knowledge using exogenous variation in both inputs. Existing
empirical evidence has shown that scientific output of university departments is correlated with
department size and research expenditure (Johnes, Taylor, and Francis, 1993). At the country
level, patenting is significantly related to R&D manpower and spending (Furman, Porter, and
1Similarly, Borjas and Doran (2012) document that the migration of highly qualified Soviet mathematiciansto the United States did not lead to a productivity increase of incumbent U.S. mathematicians but rather to adecrease in publication output.
3
Stern, 2002).2 In a recent paper, Agrawal, McHale, and Oettl (2013) show that hiring stars
increases output of evolutionary biology departments through improved hiring but not through
positive spillovers on existing members of the department.
My findings also relate to several papers investigating the persistence of large economic
shocks. Physical capital shocks, such as extensive bombings, usually dissipate relatively quickly
(Davis and Weinstein, 2002, Brackman, Garretsen, Schramm, 2004, Miguel and Roland, 2011).
Most human capital shocks, however, seem to persist in the long-run. The extinction of the
Jewish population in the Soviet Union by the German Army during WWII still affects city
growth, per capita income, wages, and political outcomes today (Acemoglu, Hassan, Robinson,
2011) and reduces entrepreneurship and support for markets and democracy (Grosfeld, Rod-
nyansky, and Zhuravskaya, 2013). In Germany, the decline of the Jewish population during
the Nazi era had persistent negative effects on education levels (Akbulut-Yuksel and Yuksel,
2011).3 In the present paper I analyze the persistence of human and physical capital shocks
within the same framework for the first time. My results corroborate the findings of earlier
papers that have separately analyzed human and physical capital shocks.
This paper also improves our understanding of Germany’s decline as scientific superpower
after WWII. At the beginning of the 20th century, German scientists were at the pinnacle of
their profession. The leading German universities, especially Göttingen and Berlin, attracted
large numbers of foreign scholars. Physicists like Arthur Compton (Nobel Prize, 1927) and
Robert Oppenheimer from the United States, Leo Szilard and Eugene Wigner (Nobel Prize,
1961) from Hungary, Enrico Fermi (Nobel Prize, 1938) from Italy, and many Germans such
as Werner Heisenberg (Nobel Prize, 1932), Max Born (Nobel Prize, 1954), and James Frank
(Nobel Prize, 1925) had permanent or visiting positions in Göttingen during the 1920s (Dardo,
2004, p. 171). Many of these illustrious scientists were later dismissed by the Nazi regime. Born
and Franck were dismissed from their professorships in Göttingen; Szilard and Wigner, who
had moved in the meantime, were dismissed from their positions in Berlin. After WWII, the
importance of German science declined massively and the United States became the dominant
force in science. This development is reflected in data on Nobel Prizes as shown in appendix
Figure A1. Germany’s decline may have been caused by a number of factors. The dismissal
of some of the most prominent scientists (among them eleven Nobel laureates) and bombing
destruction during WWII are obvious factors that I consider in this paper.
2A number of papers investigate other drivers of university output. University governance significantlyaffects how changes in funding affect research performance (Aghion et al., 2010). An increase of universitylevel funding increases the number of published papers but not their quality (Payne and Siow, 2003, Whalleyand Hicks, 2012). At the level of individual scientists, National Institutes of Health funding only has a limitedimpact on the research of marginal grant recipients (Jacob and Lefgren, 2011). Howard Hughes Medical Institutegrants, however, which tolerate early failure and reward long-run success, increase the probability of publishinghigh-impact papers (Azoulay, Graff Zivin, and Manso, 2011).
3Economic historians have also argued that the forced emigration of approximately 200,000 Huguenots in 1685had long-lasting effects on some parts of the French economy (Scoville, 1953, 1960). Similarly, the expulsion of130,000 converted Muslims from the Kingdom of Valencia in 1609 had long-lasting negative effects on populationand total output but positive effects on output per capita (Chaney and Hornbeck, 2013). Some historians alsoargue that the expulsion of 40,000 to 50,000 Jews from Spanish lands in 1492 caused long-lasting effects onthe Spanish economy. More recent historical accounts, however, suggest that the expulsion may have had largeeffects in affected communities but that places with few Jews were not affected (Kamen, 1988).
4
My estimates indicate that the dismissals of scientists reduced total output in affected
German and Austrian science departments by 9,576 top journal publications between 1933
and 1980; a reduction of about 33.5 percent. Total output as measured by citation weighted
publications declined by 191,920 (34.6 percent) citations as a result of the dismissals. In the
same time period dismissed scientists produced 1,181 top journal publications receiving 32,369
citations. These results indicate that German science lost much more than the publications of
the dismissed scientists because the reduction in output in departments with dismissals persisted
at least until 1980. WWII bombings of German and Austrian science departments reduced total
output of affected departments by 1,028 top journal publications between 1944 and 1980; a fall
of about 5.7 percent. Citation weighted publications declined by 22,194 (6.4 percent).4 These
calculations suggest that the dismissal of scientists in Nazi Germany contributed about nine
times more to the decline of German science than physical destruction during WWII.5
2 Human and Physical Capital Shocks
The production of scientific knowledge uses human and physical capital as main inputs (Machlup,
1961). University governance determines how the inputs are combined to produce scientific
knowledge. Recent research has shown that more autonomous universities and those operating
in a more competitive environment are better at converting funding increases into research
output (Aghion et al., 2009).
Estimating ‘knowledge production functions’is challenging because departments adjust inputs
on the basis of unobservable productivity shocks (Ackerberg et. al., 2007). More productive
departments attract ‘star scientists’who then make these departments even more successful.
Similarly, more productive departments invest more in physical capital. Finally, good scientists
prefer universities with well equipped laboratories and attract funding for additional physical
capital. It is therefore diffi cult to establish causality in this context.Even without these endogeneity concerns it is challenging to directly estimate the productionfunction of universities because it is diffi cult to measure physical capital of science departmentsover reasonably long time periods. I therefore use an indirect way to identify the importance ofhuman and physical capital by investigating the effect of large and, I argue, exogenous shocksto the human and physical capital of German and Austrian science departments. I estimatehow the shocks affected department output in the short and long-run as follows:
Outputdt = β1 +∑t
t6=1931 β2t HCShock(1933-40)d * Yeart +∑t
t6=1940 β3t PCShock(1942-45)d * Yeart (1)
+ β4 DepartmentFEd + β5YearFEt + β5Xct + εdt
Outputdt is a measure of department d’s research output in year t, i.e. total publications
or citation weighted publications. HCShock(1933-40)d measures the shock to human capital
during the dismissal of mainly Jewish scientists between 1933 and 1940. PCShock(1942-45)
4The time periods for these calculations differ for dismissals and bombings because dismissals started in 1933and bombings intensified in 1943.
5For subject level results and details on these calculations see appendix section 9.3.
5
measures the shock to physical capital during Allied bombings that occurred between 1942
and 1945. I describe both shocks in more detail below. The interactions of the shocks with
year dummies (one for each of the seven years between 1926 and 1980 for which I observe
department output; one of those 7 interactions will be excluded as the omitted category for
each shock) allow me to investigate the short and long-run effects of the two shocks.6As it
took time to rehire after the dismissals and to rebuild destroyed departments after WWII the
short-run effects inform us about the importance of human and physical capital inputs in the
‘knowledge production function’. The long-run persistence of the two shocks indicates how
quickly departments recovered from losses to human and physical capital.
2.1 Human Capital Shock: The Dismissal of Scientists in Nazi Ger-
many
As human capital shock I use the dismissal of Jewish and ‘politically unreliable’scientists by
the Nazi government. Just over two months after the National Socialist Party seized power
at the end of January 1933, the new government passed the “Law for the Restoration of the
Professional Civil Service”on April 7, 1933. Jewish and ‘politically unreliable’persons were
dismissed from civil service positions in Germany. As anybody with at least one Jewish grand-
parent was to be dismissed, all civil servants had to document their ancestry until 1800 and
those with Jewish grandparents were dismissed from service.
Scientists of Jewish origin who had been civil servants since 1914 or who had fought or lost a
close family member in WWI were initially exempted. In 1935, however, the Reich Citizenship
Law (Reichsbürgergesetz) revoked the exemption and remaining scientists of Jewish origin were
ultimately dismissed. The 1933 law also served to dismiss civil servants with opposing political
views such as members of the Communist Party. The law was immediately implemented and
resulted in a wave of dismissals and early retirements from German universities. After the
annexation of Austria on March 12, 1938, the law was extended to Austrian universities.7
Overall, more than 1,000 academics were dismissed from German universities. This included
15.0 percent of physicists, 14.1 percent of chemists, and 18.7 percent of mathematicians (Table
1). Most dismissals occurred in 1933, immediately after the law had been passed. The small
6One may be concerned that scientists died during the bombings and that bombings therefore affect humancapital, as well. There is no evidence that the number of scientists who disappear from the sample between1940 and 1950 is correlated with bombing destruction at the department level. In a regression of the numberof scientists who disappear from the sample in each department (for non-retirement reasons) on bombingdestruction, the coeffi cient on destruction interacted with the 1950 dummy is -0.006 with a p-value of 0.43.These results indicate that bombings are not related to sample attrition in affected departments. This evidenceis consistent with historical accounts that show that the total number of bombing casualties in Germany wasrelatively low. Historians debate about the exact number of casualties but estimates range from 305,000 (UnitedStates Strategic Bombing Survey, 1945, p. 95) to between 750,000 and 1 million (Frankland, 2005, p. 833 ).Allied bombings therefore killed between 0.4 and 1.4 per cent of the 69.3 million people living in Germany atthe beginning of WWII.
7For more details on the dismissal of professors and the consequences for Ph.D. students and contemporaneouseffects on faculty peers see Waldinger (2010, 2012).
6
spike in dismissals in 1938 is driven by dismissals from Austrian universities.8
Many dismissed scientists were outstanding members of their profession. They published
more papers in top journals and received more citations than average scientists. While 15.0
percent of physicists were dismissed, they published 23.8 percent of papers in top journals before
1933 and received 64 percent of the citations to papers published before 1933. In chemistry,
14.1 percent were dismissed but they wrote 22.0 percent of top journal articles, and received
23.4 percent of the citations. In mathematics, 18.7 percent were dismissed, but contributed
31.0 percent of top journal publications, and received 61.3 percent of the citations (Table 1).
My data do not allow me to identify whether researchers were dismissed because of their
Jewish origin or because of their political orientation. Historical studies, however, have shown
that about 87 percent of the dismissed in chemistry (Deichmann, 2001), and 79 percent of the
dismissed in mathematics (Siegmund-Schultze, 1998) were either Jewish or of Jewish decent.
Most of the dismissed scientists emigrated and the majority of them obtained positions in
foreign universities (Moser, Voena, and Waldinger, 2012). The main emigration destinations
were the United States, the United Kingdom, Turkey, the British Mandate of Palestine (later
Israel), and Switzerland.
The dismissals affected departments to a varying degree. There was a lot of variation across
departments even within universities. Some departments lost more than 60 percent of their
faculty while others did not lose anyone (Table 2).
2.2 Physical Capital Shock: Allied Bombings of Universities inWorld
War II
I use destruction caused by allied bombings during WWII as a shock to physical capital. At the
beginning of the war in 1939, the Royal Air Force (RAF) concentrated bombings on military
targets, such as the German fleet. After the German invasion of the Low Countries and the
bombing of Rotterdam by the Luftwaffe in May, 1940, the RAF started bombing other targets
such as oil reservoirs, railway lines in the Ruhr area, aircraft factories, aerodromes, U-boat
shipyards, and ports. To avoid the German antiaircraft defence the majority of raids were
flown under the cover of darkness which made targeting extremely diffi cult.
At the end of 1940, the RAF flew the first “area attacks”on German cities to “affect the
morale of the German people”(Webster and Frankland, 1961 p. 156) and to “concentrate the
maximum amount of damage in the centre of town”(Peirse, 1940). The first "area attack" was
flown by 134 RAF bombers on December 16, 1940, and targeted the inner city of Mannheim in
the south of Germany as a response to the devastation of Coventry by the German Luftwaffe.
In 1941 the RAF increased the number of small scale area attacks on German cities. Most
of these attacks, however, did not cause large destruction as only about 20 percent of bombers
managed to navigate within five miles of their destination, even less managed to hit the target.
8Dismissals that occurred in German universities after 1933 affected researchers who had been exemptedunder the clause for war veterans or for who had taken up their position before 1914. Furthermore, somepolitical dismissals occurred after 1933.
7
As a result, the smallest potential targets were whole towns (Frankland, 2005, Webster and
Frankland, 1961, vol. 1, p.156, p.257). Even these were often missed. A bombing raid of
Karlsruhe and Stuttgart on October 1st, 1941, for example, hit not only the two target cities
but also 25 other cities, some of them several hundred kilometers away (Webster and Frankland,
1961, vol. 1, p. 185).
The appointment of Sir Arthur Harris as head of "Bomber Command" on February 23, 1942,
and the “Area Bombing Directive”that was issued a week earlier caused an intensification of
the bombing campaign as more planes were deployed in each raid. On May 30, 1942 the RAF
flew the first 1,000 bomber attack against Cologne, a city that had been bombed with at most
40 planes in each of the 107 preceding attacks. The raid damaged about a third of Cologne’s
surface area (Hohn, 1991 p.12, Webster and Frankland, 1961, vol. 1, p. 340, pp. 402-410).
To maximize destruction of inner cities the RAF used incendiary bombs that started fires in
bombed cities. The introduction of heavy bombers (in particular the Lancaster bomber that
was gradually introduced after March, 1942), the use of radar and radar-like devices (introduced
in March, 1942), and the deployment of Pathfinder target marking planes (first used in January,
1943) increased the precision and effi ciency of bombings.
In January, 1943 the United States Army Air Force (USAAF) entered the bombing campaign
against Germany. While the British continued to fly night time raids and in particular area at-
tacks against inner cities, the USAAF mostly attacked during the day and bombed strategically
important targets such as the German aircraft and ball bearing industries.
The bombing of targets in Germany intensified in 1944 with the introduction of the “double
blow”tactic. Two, or later three, bombing attacks over short time periods increased the effi cacy
of incendiary bombs. The increased air supremacy of the Allied forces further facilitated the
bombings. Towards the end of the war the bombardments were extended to smaller cities that
had been spared in previous attacks.
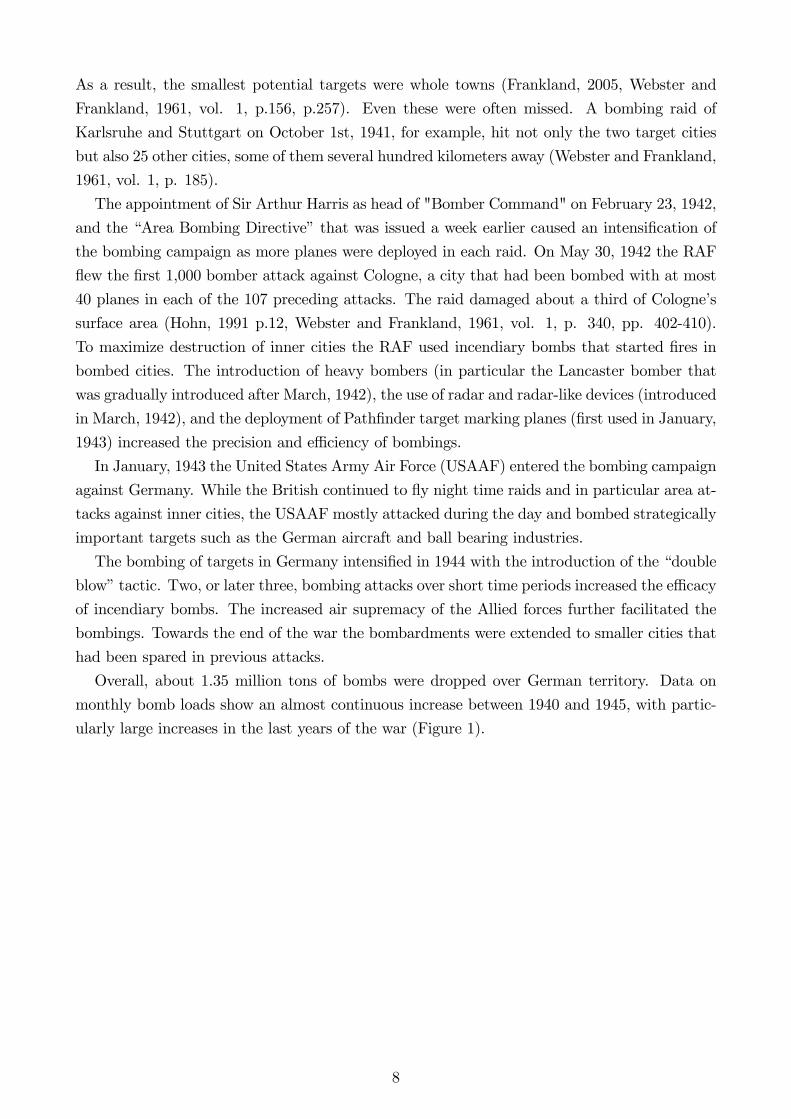
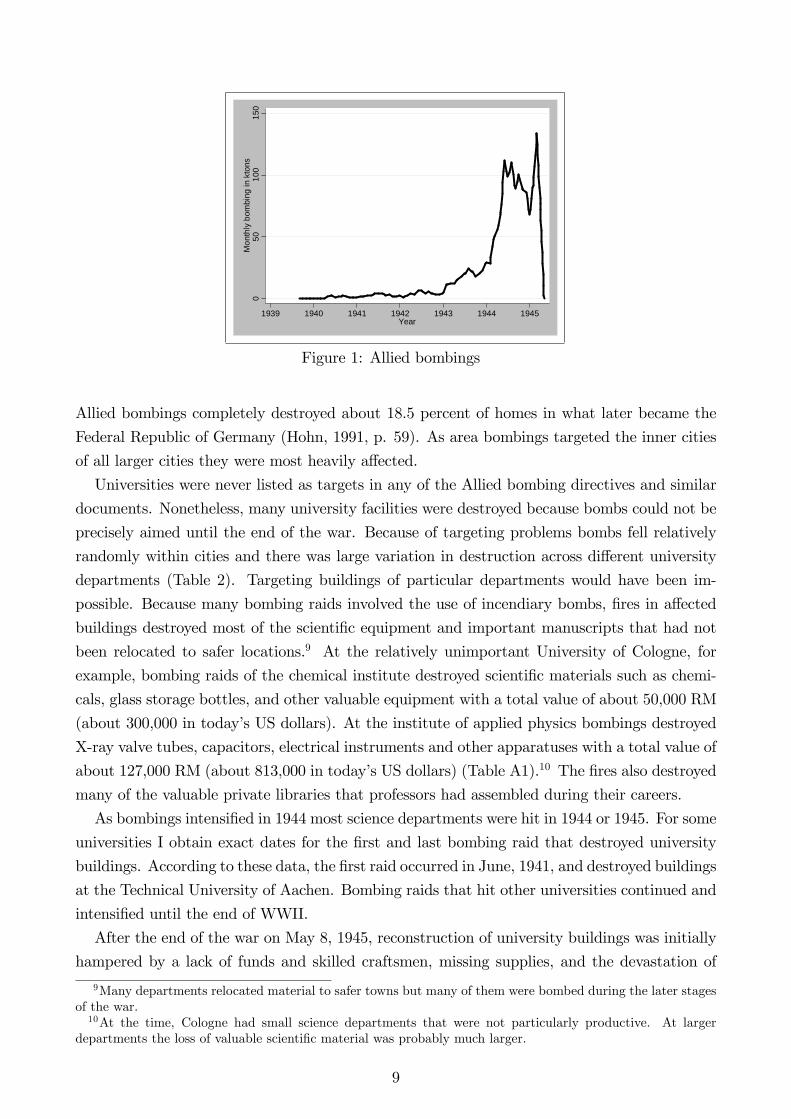
Overall, about 1.35 million tons of bombs were dropped over German territory. Data on
monthly bomb loads show an almost continuous increase between 1940 and 1945, with partic-
ularly large increases in the last years of the war (Figure 1).
8
050
100
150
Mon
thly
bom
bing
in k
tons
1939 1940 1941 1942 1943 1944 1945Year
Figure 1: Allied bombings
Allied bombings completely destroyed about 18.5 percent of homes in what later became the
Federal Republic of Germany (Hohn, 1991, p. 59). As area bombings targeted the inner cities
of all larger cities they were most heavily affected.
Universities were never listed as targets in any of the Allied bombing directives and similar
documents. Nonetheless, many university facilities were destroyed because bombs could not be
precisely aimed until the end of the war. Because of targeting problems bombs fell relatively
randomly within cities and there was large variation in destruction across different university
departments (Table 2). Targeting buildings of particular departments would have been im-
possible. Because many bombing raids involved the use of incendiary bombs, fires in affected
buildings destroyed most of the scientific equipment and important manuscripts that had not
been relocated to safer locations.9 At the relatively unimportant University of Cologne, for
example, bombing raids of the chemical institute destroyed scientific materials such as chemi-
cals, glass storage bottles, and other valuable equipment with a total value of about 50,000 RM
(about 300,000 in today’s US dollars). At the institute of applied physics bombings destroyed
X-ray valve tubes, capacitors, electrical instruments and other apparatuses with a total value of
about 127,000 RM (about 813,000 in today’s US dollars) (Table A1).10 The fires also destroyed
many of the valuable private libraries that professors had assembled during their careers.
As bombings intensified in 1944 most science departments were hit in 1944 or 1945. For some
universities I obtain exact dates for the first and last bombing raid that destroyed university
buildings. According to these data, the first raid occurred in June, 1941, and destroyed buildings
at the Technical University of Aachen. Bombing raids that hit other universities continued and
intensified until the end of WWII.
After the end of the war on May 8, 1945, reconstruction of university buildings was initially
hampered by a lack of funds and skilled craftsmen, missing supplies, and the devastation of
9Many departments relocated material to safer towns but many of them were bombed during the later stagesof the war.10At the time, Cologne had small science departments that were not particularly productive. At larger
departments the loss of valuable scientific material was probably much larger.
9
many German cities. Most universities enlisted students to clear away rubble and to help with
reconstruction. The universities of Bonn, Karlsruhe, and Hannover, for example, required up to
1,000 reconstruction service hours from its students until 1949 (van Rey, 1995 p. 42, Hoepke,
2007 p. 137, Wolters, 1950 pp. 123-129). Most universities had completed reconstruction
by the end of the 1950s but some was not completed until the 1960s (Hoepke, 2007 p. 139,
Technische Universität Dresden 1996, pp. 18-36).
3 Panel Data Set of Science Departments
3.1 Scientists in German and Austrian Universities from 1926 to
1980
To evaluate the effect of the two shocks I construct a new panel data set covering physicists,
chemists, and mathematicians at German and Austrian universities. The data come from
“Kürschners Deutscher Gelehrtenkalender” that has been published since the 1920s in 5 to
10 year intervals. Volumes published in 1926, 1931, 1940/41, 1950, 1961, 1970, and 1980
allow me to construct complete faculty rosters for science departments at these seven points in
time spanning 54 years. From each volume I extract all scientists who were chaired professors,
extraordinary professors, or ‘Privatdozenten’(the first position in the German university system
with the right to give lectures).11 I include scientists from all 35 German or Austrian universities
that existed in 1926 and remained on German (both FRG and GDR) or Austrian territory after
1945; see Table 2 for a listing of the universities in my sample.12 For each university I obtain
data on physics, chemistry, and mathematics departments; 105 science departments, overall.13
The data appendix provides additional details and references on the data construction.
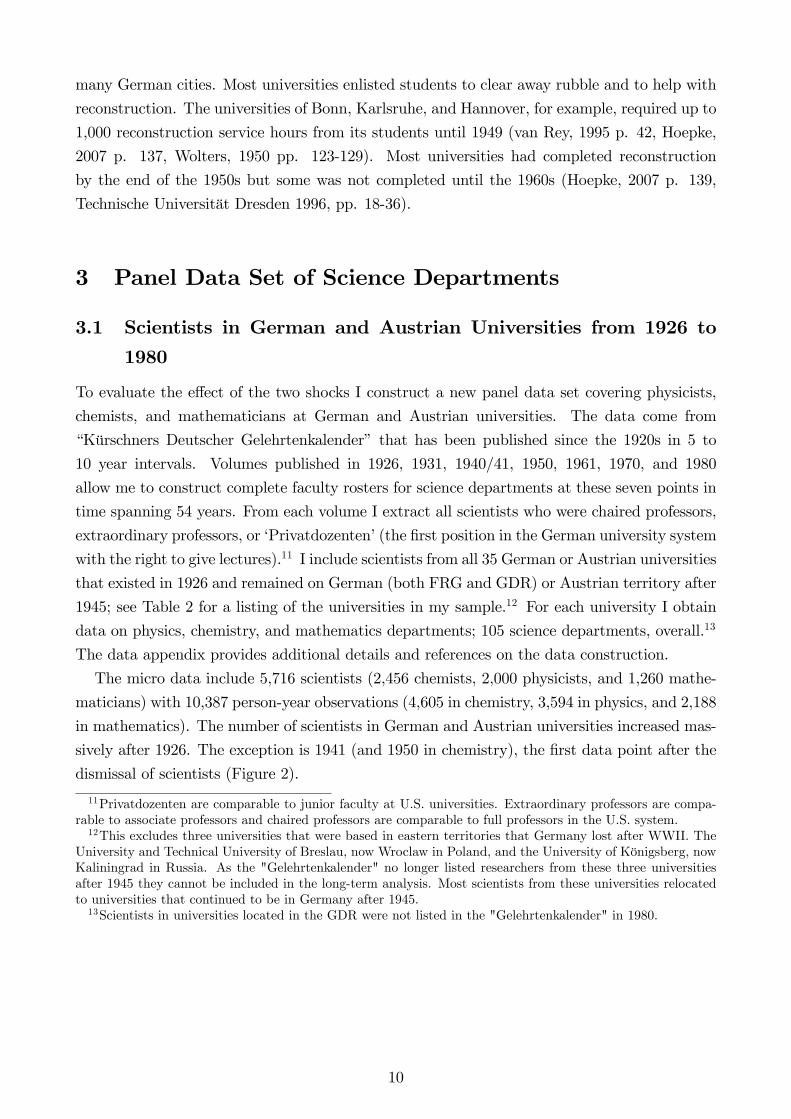
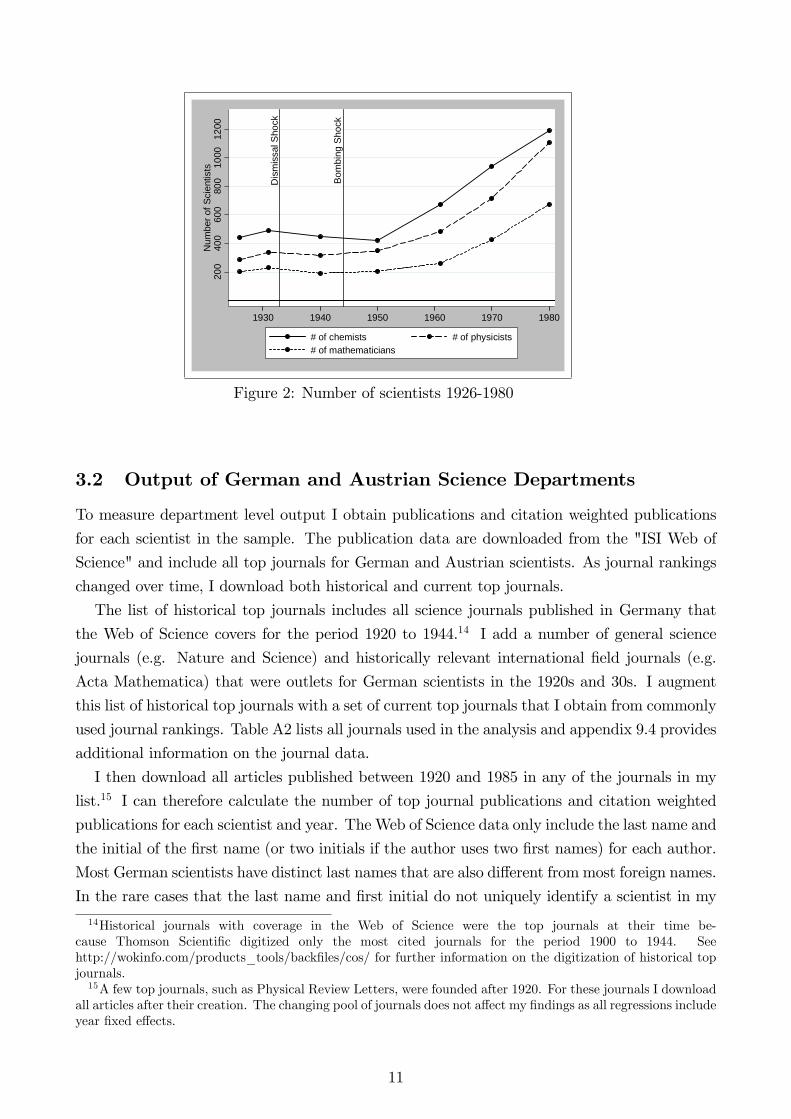
The micro data include 5,716 scientists (2,456 chemists, 2,000 physicists, and 1,260 mathe-
maticians) with 10,387 person-year observations (4,605 in chemistry, 3,594 in physics, and 2,188
in mathematics). The number of scientists in German and Austrian universities increased mas-
sively after 1926. The exception is 1941 (and 1950 in chemistry), the first data point after the
dismissal of scientists (Figure 2).
11Privatdozenten are comparable to junior faculty at U.S. universities. Extraordinary professors are compa-rable to associate professors and chaired professors are comparable to full professors in the U.S. system.12This excludes three universities that were based in eastern territories that Germany lost after WWII. The
University and Technical University of Breslau, now Wroclaw in Poland, and the University of Königsberg, nowKaliningrad in Russia. As the "Gelehrtenkalender" no longer listed researchers from these three universitiesafter 1945 they cannot be included in the long-term analysis. Most scientists from these universities relocatedto universities that continued to be in Germany after 1945.13Scientists in universities located in the GDR were not listed in the "Gelehrtenkalender" in 1980.
10
Dis
mis
sal S
hock
Bom
bing
Sho
ck
200
400
600
800
1000
1200
Num
ber o
f Sci
entis
ts
1930 1940 1950 1960 1970 1980
# of chemists # of physicists# of mathematicians
Figure 2: Number of scientists 1926-1980
3.2 Output of German and Austrian Science Departments
To measure department level output I obtain publications and citation weighted publications
for each scientist in the sample. The publication data are downloaded from the "ISI Web of
Science" and include all top journals for German and Austrian scientists. As journal rankings
changed over time, I download both historical and current top journals.
The list of historical top journals includes all science journals published in Germany that
the Web of Science covers for the period 1920 to 1944.14 I add a number of general science
journals (e.g. Nature and Science) and historically relevant international field journals (e.g.
Acta Mathematica) that were outlets for German scientists in the 1920s and 30s. I augment
this list of historical top journals with a set of current top journals that I obtain from commonly
used journal rankings. Table A2 lists all journals used in the analysis and appendix 9.4 provides
additional information on the journal data.
I then download all articles published between 1920 and 1985 in any of the journals in my
list.15 I can therefore calculate the number of top journal publications and citation weighted
publications for each scientist and year. The Web of Science data only include the last name and
the initial of the first name (or two initials if the author uses two first names) for each author.
Most German scientists have distinct last names that are also different from most foreign names.
In the rare cases that the last name and first initial do not uniquely identify a scientist in my
14Historical journals with coverage in the Web of Science were the top journals at their time be-cause Thomson Scientific digitized only the most cited journals for the period 1900 to 1944. Seehttp://wokinfo.com/products_tools/backfiles/cos/ for further information on the digitization of historical topjournals.15A few top journals, such as Physical Review Letters, were founded after 1920. For these journals I download
all articles after their creation. The changing pool of journals does not affect my findings as all regressions includeyear fixed effects.
11
data I split (citation weighted) publications according to the number of scientists with the same
last name and first initial. Table A3 shows the most cited scientists in my data. Most of them
are very well known in the scientific community. This indicates that the output measures carry
meaningful information. Interestingly, Johann von Neumann who later emigrated to the United
States is the most cited mathematician.
To measure department output for each of the seven points in time I add individual output
measures within departments. Individual output is measured using a five year window around
the relevant year. Albert Einstein’s individual output measure for 1926, for example, is the
sum of his publications between 1923 and 1927.16 I then sum the individual output measures
within departments. Say a department had three scientists with individual output equal to 1,
2, and 3; total department output would be 1+2+3=6. The Web of Science data also include
information on the number of times each article was subsequently cited in any journal covered
by the Web of Science. This allows me to construct an analogous output measure based on
citation weighted publications.17
Publication and citation patterns are different across the three subjects. To ensure compara-
bility across subjects I normalize total department output to have zero mean and unit variance
in each subject. This also allows for easy interpretation of the estimated regression coeffi cients.
3.3 Data on Dismissals
I obtain data on dismissed scientists from a number of sources. The main source is the “List of
Displaced German Scholars”. It was compiled by the relief organization “Emergency Alliance
of German Scholars Abroad” that had been founded by some dismissed scientists with the
purpose of supporting other dismissed scholars to find positions in foreign universities. The list
was published in 1937 and contained about 1,650 names of dismissed researchers. I extract all
dismissed physicists, chemists, and mathematicians from the "List".
As the “List”was published before 1938 it did not include dismissals from Austrian univer-
sities. I consult the “Biographisches Handbuch der deutschsprachigen Emigration nach 1933
- Vol. II : The arts, sciences, and literature (1983)” to obtain dismissals from Austria. This
source also contains a few additional dismissals from German universities, for example, because
dismissed scientists passed away before the “List of Displaced German Scholars”was compiled.
The two sources together cover about 90 percent of all dismissals. I augment this information
with data on a few additional dismissals from three secondary sources compiled by historians
who have studied the dismissal of scientists in Nazi Germany.18
16Publications are measured using an asymmetric window around the relevant year of the "Gelehrtenkalender";i.e. output for the faculty in 1926 is measured with publications between 1923 and 1927 (instead of publicationsbetween 1924 and 1928). This asymmetry accounts for the delay in the publication of the "Gelehrtenkalender"as questionnaires for a certain volume had to be sent out and returned before publication. Using a symmetricwindow to compute average output does not affect the results.17The citation weighted productivity measure is constructed as above by adding all citations to publications
published in a five year window around the relevant year. Citations are counted until today.18Dismissed chemists are contained in Deichmann (2001), dismissed physicists in Beyerchen (1977) and dis-
missed mathematicians in Siegmund-Schultze (1998).
12
3.4 Data on Bombings of Science Departments
No existing data set covers bombing destruction of German and Austrian science departments.
To measure department level bombing destruction, I therefore assemble new data based on
information from university archives. After bombing raids university institutes often provided
detailed destruction reports to obtain funds and materials for reconstruction. These reports
and other sources allow me to construct a measure of destruction at the department level.
To obtain this information I first contacted university archivists and asked them for infor-
mation on destruction levels for all buildings used by physicists, chemists, and mathematicians.
In most universities bombing destruction was reported as percentage of buildings that were
destroyed by the bombings. I therefore use percentage destruction to measure the physical
capital shock. Some universities provided very accurate descriptions or even maps of bombing
destruction (see Figure A2 for a map provided by the Technical University of Berlin). Other
departments did not report destruction in percentages but gave verbal descriptions of bombing
damages instead. I convert this information into percentage destruction using a rule outlined
in appendix 9.4. If university archivists could not provide adequate information, my research
assistant or I personally consulted the relevant archive to obtain a department level measure of
bombing destruction.19
While percentage destruction measures the destruction of buildings the measure also proxies
for destruction to scientific equipment and materials. As highlighted above for the case of
Cologne, the bombing raids often destroyed scientific equipment and other physical inputs.
Unfortunately, detailed data on the destruction of scientific equipment is not available for most
universities.
To analyze the importance of measurement error I also construct a measure of bombing
destruction at the university level. The data for this alternative measure come from information
on university websites and a number of additional sources (Tietze, 1995, Phillips, 1983, Samuel
and Thomas, 1949, Schneider, 1990, and Cheval, 1991). Appendix 9.4 provides additional
details on the destruction data.
3.5 Data on Control Variables
To investigate the robustness of my findings to the inclusion of additional controls I obtain data
on university age, the creation of nearby universities, the share of firms in armament related
industries in 1933, the fraction of Jews at the city level in 1933, and the distance to the ‘iron
curtain’. Further information on the control variables can be found in appendix 9.4.
The final data set contains panel data for German and Austrian science departments covering
seven points in time (1926, 1931, 1940, 1950, 1961, 1970, and 1980). The data include different
19As we could not obtain a measure for destruction at the department level for the University of DarmstadtI use university level destruction in this case.
13
measures of department output, information on dismissal and bombing shocks, and time-varying
control variables.
4 The Effect of Human and Physical Capital Shocks on
Department Output
4.1 Main Results
I investigate how the human and physical capital shocks affected output in the short-run (before
departments fully adjusted to the shocks) and in the long-run by estimating equation (1). I
start by analyzing the dismissal shock. As dismissals occurred between 1933 and 1940, with
most dismissals happening in 1933, the first post-dismissal observation is 1940. The short-run
results indicate that between 1931 (the last data point before the dismissals) and 1940 output in
departments with one more dismissal fell by .17 standard deviations compared to departments
without dismissals (Table 3, column 1). Coeffi cients on the interactions with subsequent years
indicate that this effect persisted in the long-run until 1980. Controlling for subject times
year fixed effects to allow for differential output trends in the three subjects does not affect
the results (column 2). Further controlling for occupation zone (U.S. zone, U.K. zone, French
zone, Soviet zone) times post-1945 dummies has a negligible effect on estimated coeffi cients but
lowers standard errors (column 3). Estimates imply that the dismissal of one scientist lowered
department output, even in the long-run, by between 0.17 and 0.28 standard deviations (column
3).
I next analyze the bombing shock. As bombings intensified towards the end of the war, the
first post-bombing observation is 1950. The short-run results indicate that output of depart-
ments with 10 percent bombing destruction declined by .05 standard deviations between 1941
and 1950 compared to departments without destruction. This effect is only significant at the 5
percent level if I control for subject times year fixed effects and occupation zone times post-1945
dummies (Table 3, columns 4 to 6). Output recovered quickly after WWII. Already in 1961,
there was no significant difference between departments that were bombed during WWII and
other departments. By 1970, departments that were bombed even performed slightly better
than other departments. While the 1970 results are only significant at the 10 percent level in
two of the three specifications they suggest that upgrading during reconstruction may have had
a small positive effect on output in the long-run.
Jointly estimating effects of the bombing and dismissal shocks leads to similar conclusions
(Table 3, columns 7 to 9). To investigate whether the bombing results are driven by the
destruction of department buildings or by more general destruction at the city level, I add
interactions of year dummies with city level destruction to the regression. The results do not
change substantially (Table 3, column 10). This indicates that output is primarily driven by
department facilities and not by more general city level destruction.
14
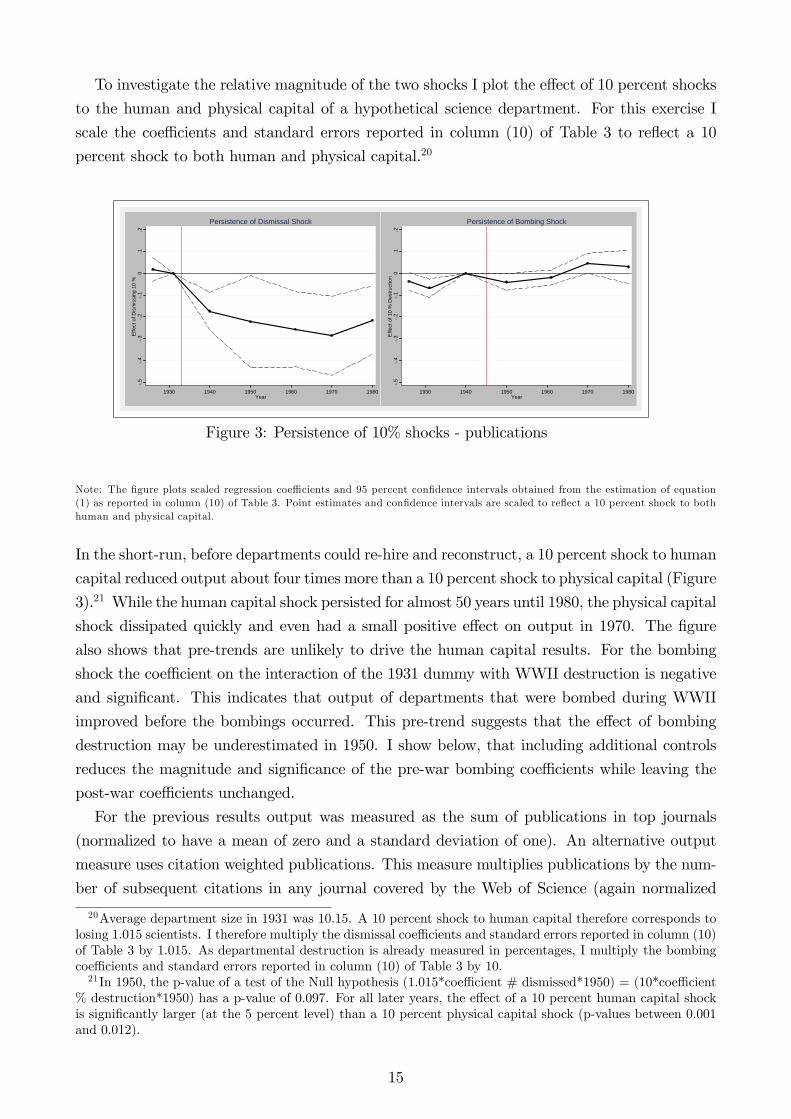
To investigate the relative magnitude of the two shocks I plot the effect of 10 percent shocks
to the human and physical capital of a hypothetical science department. For this exercise I
scale the coeffi cients and standard errors reported in column (10) of Table 3 to reflect a 10
percent shock to both human and physical capital.20.5
.4.3
.2.1
0.1
.2E
ffect
of D
ism
issi
ng 1
0 %
1930 1940 1950 1960 1970 1980Year
Persistence of Dismissal Shock
.5.4
.3.2
.10
.1.2
Effe
ct o
f 10
% D
estru
ctio
n1930 1940 1950 1960 1970 1980
Year
Persistence of Bombing Shock
Figure 3: Persistence of 10% shocks - publications
Note: The figure plots scaled regression coeffi cients and 95 percent confidence intervals obtained from the estimation of equation(1) as reported in column (10) of Table 3. Point estimates and confidence intervals are scaled to reflect a 10 percent shock to bothhuman and physical capital.
In the short-run, before departments could re-hire and reconstruct, a 10 percent shock to human
capital reduced output about four times more than a 10 percent shock to physical capital (Figure
3).21 While the human capital shock persisted for almost 50 years until 1980, the physical capital
shock dissipated quickly and even had a small positive effect on output in 1970. The figure
also shows that pre-trends are unlikely to drive the human capital results. For the bombing
shock the coeffi cient on the interaction of the 1931 dummy with WWII destruction is negative
and significant. This indicates that output of departments that were bombed during WWII
improved before the bombings occurred. This pre-trend suggests that the effect of bombing
destruction may be underestimated in 1950. I show below, that including additional controls
reduces the magnitude and significance of the pre-war bombing coeffi cients while leaving the
post-war coeffi cients unchanged.
For the previous results output was measured as the sum of publications in top journals
(normalized to have a mean of zero and a standard deviation of one). An alternative output
measure uses citation weighted publications. This measure multiplies publications by the num-
ber of subsequent citations in any journal covered by the Web of Science (again normalized
20Average department size in 1931 was 10.15. A 10 percent shock to human capital therefore corresponds tolosing 1.015 scientists. I therefore multiply the dismissal coeffi cients and standard errors reported in column (10)of Table 3 by 1.015. As departmental destruction is already measured in percentages, I multiply the bombingcoeffi cients and standard errors reported in column (10) of Table 3 by 10.21In 1950, the p-value of a test of the Null hypothesis (1.015*coeffi cient # dismissed*1950) = (10*coeffi cient
% destruction*1950) has a p-value of 0.097. For all later years, the effect of a 10 percent human capital shockis significantly larger (at the 5 percent level) than a 10 percent physical capital shock (p-values between 0.001and 0.012).
15
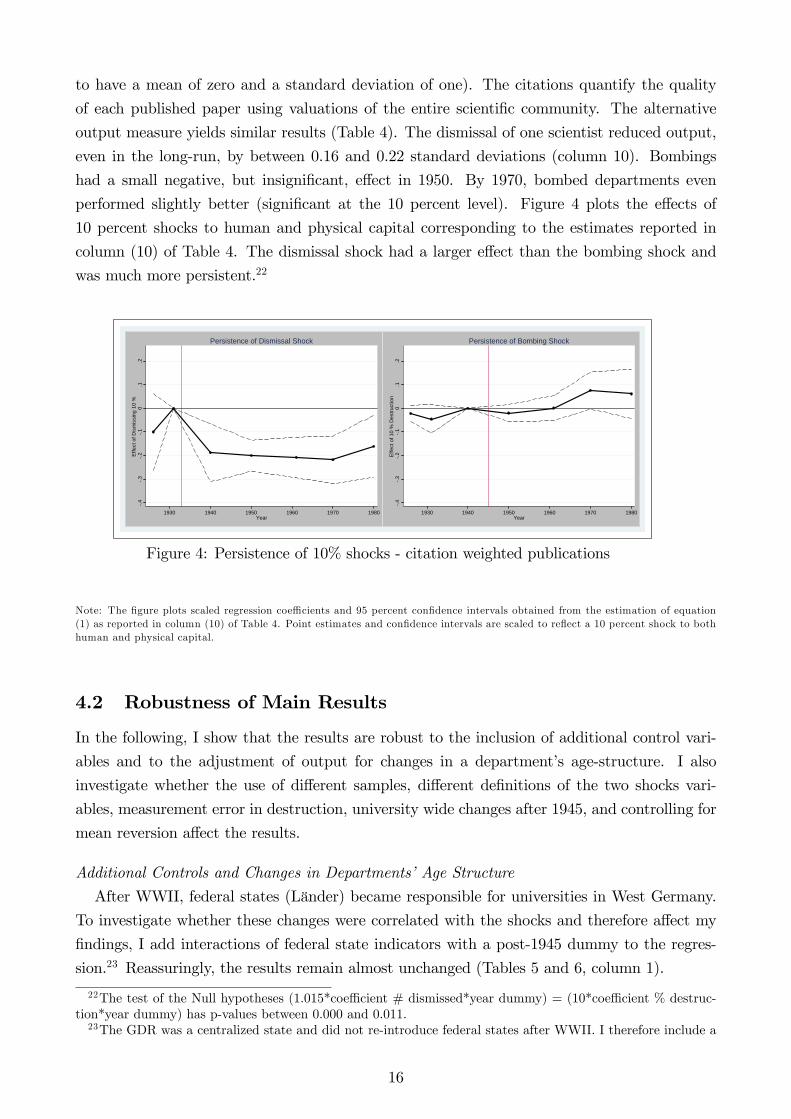
to have a mean of zero and a standard deviation of one). The citations quantify the quality
of each published paper using valuations of the entire scientific community. The alternative
output measure yields similar results (Table 4). The dismissal of one scientist reduced output,
even in the long-run, by between 0.16 and 0.22 standard deviations (column 10). Bombings
had a small negative, but insignificant, effect in 1950. By 1970, bombed departments even
performed slightly better (significant at the 10 percent level). Figure 4 plots the effects of
10 percent shocks to human and physical capital corresponding to the estimates reported in
column (10) of Table 4. The dismissal shock had a larger effect than the bombing shock and
was much more persistent.22
.4.3
.2.1
0.1
.2E
ffect
of D
ism
issi
ng 1
0 %
1930 1940 1950 1960 1970 1980Year
Persistence of Dismissal Shock
.4.3
.2.1
0.1
.2E
ffect
of 1
0 %
Des
truct
ion
1930 1940 1950 1960 1970 1980Year
Persistence of Bombing Shock
Figure 4: Persistence of 10% shocks - citation weighted publications
Note: The figure plots scaled regression coeffi cients and 95 percent confidence intervals obtained from the estimation of equation(1) as reported in column (10) of Table 4. Point estimates and confidence intervals are scaled to reflect a 10 percent shock to bothhuman and physical capital.
4.2 Robustness of Main Results
In the following, I show that the results are robust to the inclusion of additional control vari-
ables and to the adjustment of output for changes in a department’s age-structure. I also
investigate whether the use of different samples, different definitions of the two shocks vari-
ables, measurement error in destruction, university wide changes after 1945, and controlling for
mean reversion affect the results.
Additional Controls and Changes in Departments’Age Structure
After WWII, federal states (Länder) became responsible for universities in West Germany.
To investigate whether these changes were correlated with the shocks and therefore affect my
findings, I add interactions of federal state indicators with a post-1945 dummy to the regres-
sion.23 Reassuringly, the results remain almost unchanged (Tables 5 and 6, column 1).
22The test of the Null hypotheses (1.015*coeffi cient # dismissed*year dummy) = (10*coeffi cient % destruc-tion*year dummy) has p-values between 0.000 and 0.011.23The GDR was a centralized state and did not re-introduce federal states after WWII. I therefore include a
16
I also add university age and its square as additional controls. This specification allows me
to investigate whether the two shocks disproportionately affected older (or younger) universities
that may have been on different output trends. The results are almost unaffected (Tables 5
and 6, column 2).
During the post-war period, in particular during the 1960s and 1970s, a number of new uni-
versities were founded in Germany and Austria. Increased competition from these universities
may have influenced the output of established departments. To investigate whether the results
are affected by these changes I include a time-varying control that measures the number of
departments within 50 kilometers of each science department. The results remain unchanged
(Tables 5 and 6, column 3).
After the Nazi government seized power in 1933, it invested heavily in rearmament (Tooze,
2006). This investment was concentrated in a few industries and may therefore have im-
pacted department output in cities with firms that benefitted from rearmament spending, either
through spillovers from industry to universities or because the Allies may have targeted these
cities during the bombing campaign. To investigate whether investments in the armaments
industry affects the results I include the interaction of the share of firms in three armament
related industries with year dummies as additional controls.24 The results change only very
slightly (Tables 5 and 6, column 4).
Departments with more Jewish scientists may have been located in cities with a higher
fraction of Jewish residents. The disappearance of the Jewish population may have had long-
lasting effects on these cities (Acemoglu, Hassan, Robinson, 2011, and Grosfeld, Rodnyansky,
and Zhuravskaya, 2013, and Akbulut-Yuksel and Yuksel, 2011) that could have affected science
departments in the long-run. To investigate the effect of these changes on my results, I add
the interaction of a post-1945 dummy with the fraction of Jews at the city level in 1933 to the
regression.25 If anything, the dismissal coeffi cients become slightly more negative (Tables 5 and
6, column 5). This indicates that the extinction of Jews from German and Austrian cities is
not driving the results.
Finally, I investigate whether the two shocks were correlated with the geographic location
of universities. Universities in cities that were closer to the ‘iron curtain’may have suffered
after 1945 because these cities experienced a decline in population growth after the division of
Germany (Redding and Sturm, 2008). To investigate this issue I add the interaction of a post-
1945 dummy with distance to the iron curtain to the regression. The results remain unchanged
(Tables 5 and 6, column 6).
joint indicator for all universities in East Germany, including the Technical University of Berlin that was locatedin West Berlin. The federal states of Hamburg and Schleswig-Holstein had only one university and I thereforecombine them with the adjacent state of Niedersachsen. The five Austrian universities are also covered by ajoint indicator.24The three armament relevant industries are iron and steel production, mechanical engineering and vehicle
construction, and chemicals. The shares of firms in these industries are measured in 1933 (1930 for Austriancities). They are therefore determined before the Nazi government seized power and are not endogenouslyaffected by the two shocks.25For Austrian cities the fraction of Jews at the city level is measured in 1934 (Vienna) and 1938 (Graz and
Innsbruck) and thus before the annexation of Austria by Nazi Germany in 1938.
17
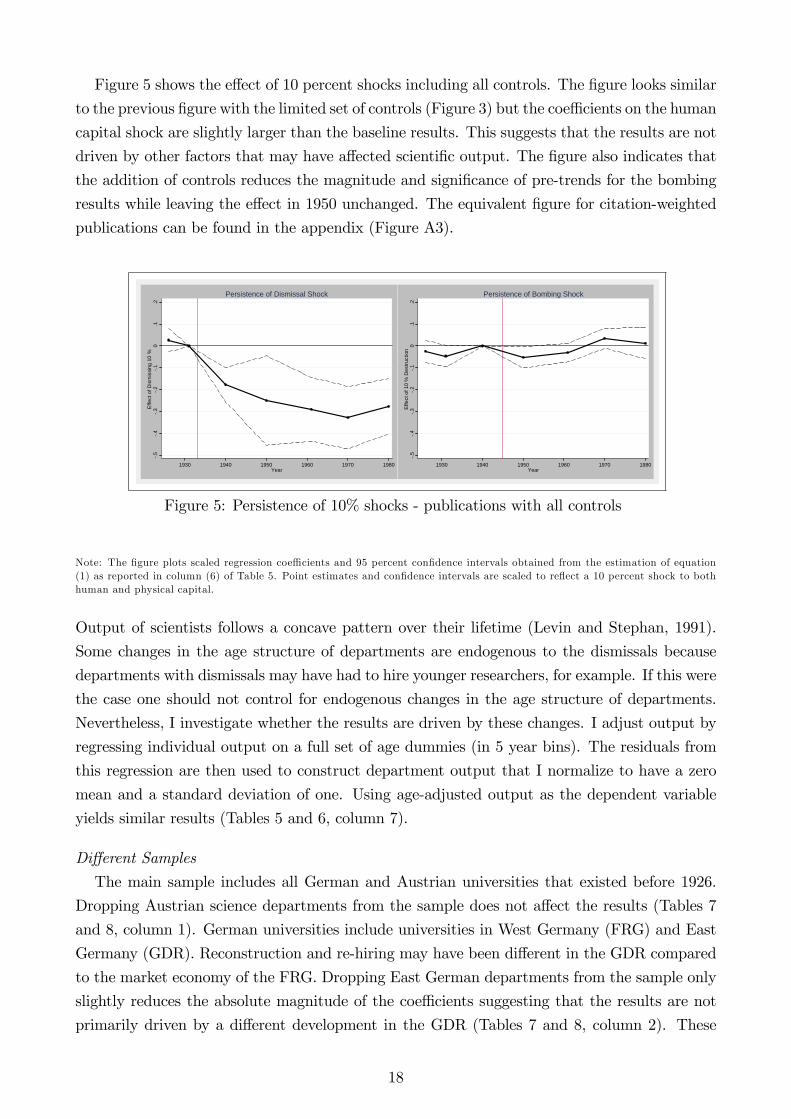
Figure 5 shows the effect of 10 percent shocks including all controls. The figure looks similar
to the previous figure with the limited set of controls (Figure 3) but the coeffi cients on the human
capital shock are slightly larger than the baseline results. This suggests that the results are not
driven by other factors that may have affected scientific output. The figure also indicates that
the addition of controls reduces the magnitude and significance of pre-trends for the bombing
results while leaving the effect in 1950 unchanged. The equivalent figure for citation-weighted
publications can be found in the appendix (Figure A3).
.5.4
.3.2
.10
.1.2
Effe
ct o
f Dis
mis
sing
10
%
1930 1940 1950 1960 1970 1980Year
Persistence of Dismissal Shock
.5.4
.3.2
.10
.1.2
Effe
ct o
f 10
% D
estru
ctio
n
1930 1940 1950 1960 1970 1980Year
Persistence of Bombing Shock
Figure 5: Persistence of 10% shocks - publications with all controls
Note: The figure plots scaled regression coeffi cients and 95 percent confidence intervals obtained from the estimation of equation(1) as reported in column (6) of Table 5. Point estimates and confidence intervals are scaled to reflect a 10 percent shock to bothhuman and physical capital.
Output of scientists follows a concave pattern over their lifetime (Levin and Stephan, 1991).
Some changes in the age structure of departments are endogenous to the dismissals because
departments with dismissals may have had to hire younger researchers, for example. If this were
the case one should not control for endogenous changes in the age structure of departments.
Nevertheless, I investigate whether the results are driven by these changes. I adjust output by
regressing individual output on a full set of age dummies (in 5 year bins). The residuals from
this regression are then used to construct department output that I normalize to have a zero
mean and a standard deviation of one. Using age-adjusted output as the dependent variable
yields similar results (Tables 5 and 6, column 7).
Different Samples
The main sample includes all German and Austrian universities that existed before 1926.
Dropping Austrian science departments from the sample does not affect the results (Tables 7
and 8, column 1). German universities include universities in West Germany (FRG) and East
Germany (GDR). Reconstruction and re-hiring may have been different in the GDR compared
to the market economy of the FRG. Dropping East German departments from the sample only
slightly reduces the absolute magnitude of the coeffi cients suggesting that the results are not
primarily driven by a different development in the GDR (Tables 7 and 8, column 2). These
18
results also demonstrate that the special situation of the University of Berlin that was located
in the Soviet sector does not drive the results.26 In specifications not reported in the table I
also show that the results are robust to dropping both Austria and the GDR.
In an additional test I use Swiss universities as an alternative control group. As Jewish
scientists were of above average quality they worked in above average quality departments.
As a result, German and Austrian departments without dismissals may not be an approriate
control group for the high quality departments that experienced dismissals. To investigate
this concern, I use four German speaking Swiss universities as an alternative control group.27
Some of the Swiss universities are among the top universities in the German speaking world.
I estimate results in a sample that only includes German and Austrian departments who lost
people during the dismissals and the Swiss departments as control departments. Results are
highly significant with point estimates that are mostly larger than the main results (Tables 7
and 8, column 3).
Different Shock Measures
In the main specification the human capital shock measure counts the number of dismissals
in each department. This will allow me to disentangle dismissals into different quality groups
in the following section of the paper. An alternative measure of the human capital shock uses
percentage dismissals in each department. Results that use this alternative measure are less
significant, in particular for publications. The magnitude of the coeffi cient of a 10 percent
decline in department size, however, is very similar to the baseline specification (Tables 7 and
8, column 4).
As outlined above, most dismissals took place during the first years of the Nazi regime.
When I measure the human capital shock using only early dismissals between 1933 and 1934
estimates remain similar to the baseline results (Tables 7 and 8, column 5).
The dismissal shock was confined to particular departments because most scientists special-
ize in only one subject. As a result, universities could not reallocate physicists to chemistry
departments if a university had few dismissals in physics but many in chemistry. Following
a bombing shock, however, universities could reallocate buildings across departments. This
could have mitigated any negative effect of bombing destruction at the department level. To
investigate whether universities reallocated buildings after the bombings, I use an alternative
destruction measure that captures average destruction across all science departments. Using
this alternative measure yields a more negative coeffi cient for the interaction of bombing de-
struction with the 1950 dummy. The destruction of an additional 10 percent of science buildings
lowered output by 0.11 instead of 0.05 standard deviations (Table 7, column 6). In regressions
that use citation weighted publications as the dependent variable, the coeffi cient changes from
26The University of Berlin was located in the Soviet sector of Berlin. It reopened in January 1946 (and wasrenamed Humboldt University in 1949). In 1948, the Free University of Berlin was founded in the U.S. sectorof Berlin.27Swiss universities are not part of the main sample because they hired a small number of dismissed scien-
tists. The University of Basel hired one dismissed chemist, but no physicists or mathematicians, the TechnicalUniversity in Zurich hired one mathematician, but no physicists or chemists, the University of Zurich hired onephysicist, one chemist, but no mathematician, and the University of Bern did not hire any dismissed scientists.
19
-0.04 to -0.08 (Table 8, column 6). These results suggest that universities could mitigate some
of the bombing effects by reallocating buildings across departments.28 Using this alternative
destruction measure I also find a slightly more persistent decline in output after the bombings.
When I use publications as the dependent variable the negative effect persists until 1961 (signif-
icant at the 10 percent level) (Table 7, column 6) but not if I use citation-weighted publications
(Table 8, column 6). By 1970, bombed departments had completely recovered independently of
the destruction and output measures. In fact, citation-weighted publications were significantly
higher in bombed departments in 1970. This further suggests that bombed departments may
have benefitted from upgrading during reconstruction.
Measurement Error in Bombing Destruction
The destruction measure of some departments may contain measurement error. To investi-
gate whether this attenuates the bombing results I instrument for department level destruction
with destruction at the university level.29 The measure of university destruction is based on
data from different sources than the measure of department destruction (see appendix 9.4).
As a result, the two measurement errors should be uncorrelated. The instrumental variable
strategy should therefore minimize attenuation bias. First-stage regressions are reported in
Table A4 and indicate that university destruction is a strong predictor of department destruc-
tion.30 The instrumental variable results indicate that publications in departments with 10
percent more destruction fell by 0.13 standard deviations in 1950. In 1961, departments with
10 percent more bombing destruction still had 0.11 standard deviations lower output. By 1970,
however, output had recovered in bombed departments (Table 7, column 7). Equivalent results
for citation-weighted publications indicate that output in departments with 10 percent more
destruction fell by 0.08 standard deviations in 1950, and 0.05 standard deviations (significant
at the 10 percent level) in 1961. By 1970, output had completely recovered (Table 8, column
7). These results suggest that measurement error attenuates the bombing results for 1950 and
1961. The finding that bombed departments had completely recovered by 1970, however, is not
distorted by measurement error.
University Wide Changes after 1945
It may be the case that dismissals or bombings were related to university wide changes that
occurred after 1945, such as a reorientation of the university’s focus away from sciences towards
28An alternative explanation for the larger coeffi cient (in absolute magnitude) could be lower measurementerror for science wide destruction compared to destruction in each individual science department.29As the university level destruction measure captures destruction of all university buildings it is different
from the average destruction in science departments that has been used above.30As I instrument for all interactions of year dummies with department level destruction, I estimate six first
stage regressions: one for the interaction of % subject destruction with the 1926 dummy, one for the interactionof % subject destruction with the 1931 dummy, and so on. As a result, the usual F-test on the excludedinstruments is not appropriate in this context. Stock and Yogo (2005) propose a test for weak instrumentsbased on the Cragg-Donald (1993) Eigenvalue Statistic. Stock and Yogo (2005) only provide critical values forup to two endogenous regressors. With two endogenous regressors and two instruments the critical value is 7.03.Here, I use six instruments for six endogenous regressors. Appropriate critical values should be lower than 7.03.The Cragg-Donald EV statistic reported in Table A3 is 19.6. Weak instruments should therefore not bias theresults.
20
other fields. To investigate whether such changes are driving the results I include the interaction
of a full set of 35 university fixed effects with a post-1945 dummy in the regression. Results
indicate that publication output fell by 0.16 to 0.23 standard deviations after the dismissal of
one scientist with the majority of results remaining significant at the 1 percent level (Table 7,
column 8). The coeffi cient on bombing destruction interacted with the 1950 dummy indicates
that output fell by 0.04 standard deviations in 1950 but this result is no longer significant.
Equivalent results for citation-weighted publications indicate that output fell by 0.12 to 0.18
standard deviations after the dismissal of one scientist but only the 1940 coeffi cient remains
significant at the 5 percent level (Table 8, column 8). The coeffi cient on bombing destruction
interacted with the 1950 dummy indicates that output fell by 0.03 standard deviations in 1950,
but as for publications the result is no longer significant.31
Controlling for Mean Reversion
Some of the dismissals affected the best universities such as Göttingen or Berlin. It is possible
that the relative quality of these departments would have declined even without dismissals
because of mean reversion. To investigate this hypothesis I include the interaction of department
quality in 1926 with the number of years that have passed since 1926 as additional control.32
Results that control for mean reversion yield smaller coeffi cients for the dismissals and indicate
that the dismissal of one scientist lowered output by between 0.10 and 0.15 standard deviations.
Most coeffi cients remain significant at the 1 percent level (Table 7, column 9). The bombing
results remain relatively similar. Equivalent results for citation-weighted publications indicate
that the dismissal of one scientists lowered output by between 0.11 and 0.17 standard deviations
with most coeffi cients significant at the 5 percent level (Table 8, column 9). Bombing results
indicate a small but significantly negative effect on output in 1950 that was not persistent.
Complementarities of Human and Physical Capital ShocksThe empirical model estimated above does not allow for complementarities of human and
physical capital. To investigate whether complementarities are important I add triple interac-tions of number dismissed, percentage destruction, and year dummies to the regression, i.e. Iestimate
Outputdt = β1 +∑t
t 6=1931 β2tHCShock(1933-40)d * Yeart +∑t
t6=1940 β3t PCShock(1942-45)d * Yeart
+∑t
t≥1950 β4t HCShock(1933-40)d * PCShock(1942-45)d * Yeart
+ β5 DepartmentFEd + β6YearFEt + εdt (2)
The first data point that could have been affected by both shocks is 1950. I therefore include
the triple interactions for the years 1950, 1961, 1970, and 1980. The publication results show
that departments with dismissals that were subsequently bombed did significantly worse than
other departments in 1950. The estimated coeffi cient indicates a reduction in publications by
31Alternatively, one could include the interaction of university fixed effects with a dummy for each year (i.e.adding 35*6=210 interactions). As the degrees of freedom become small (714 observations - 210 universityFE*year - 105 department fixed effects - 18 subject*year FE - 30 time varying controls - 1 constant) anddismissals and bombings within universities are positively correlated the results are no longer significant.32Department quality in 1926 is measured as the sum of (citation-weighted) publications for the specification
with (citation-weighted) publications as the dependent variable.
21
0.03 standard deviations in departments that lost one scientist and 10 percent of department
buildings. As departments recovered quickly from the physical capital shock triple interactions
with later years are no longer significant. (Table A5, column 2). For the citation weighted out-
put measure all triple interactions are insignificant (Table A5, column 4). The dismissal results
are remarkably robust to the inclusion of the triple interactions. The findings suggest that there
are some complementarities between human and physical capital but that these are relatively
minor. Furthermore, human capital effects are not driven by important complementarities with
physical capital.
4.3 Subject Specific Results
Data on the three subjects allow me to investigate whether the human and physical capital
shocks had different effects across disciplines. While physical capital may be more important
in chemistry and some fields of physics it is presumably less important in mathematics. The
estimation results, however, indicate that the decline in output after the physical capital shock
hardly differed across fields (Table 9).
Despite the fact that most results are less precisely estimated because of smaller sample sizes,
the dismissal results reveal interesting differences across subjects. If one considers citation
weighted publications as the output measure, the results are largest and most persistent in
mathematics, followed by physics (even though most coeffi cients in physics are not significant),
and then chemistry (Table 9, columns 2, 4, and 6). As dismissals in mathematics and physics
were of higher quality than in chemistry (Table 1) the results suggest that high quality scientists
may be particularly important for science departments.
4.4 The Effect of High Quality Scientists
To further investigate this hypothesis I assign scientists to quality percentiles based on their
pre-dismissal citation weighted publications. I then investigate how the dismissal of high qual-
ity scientists affected department output. The dismissal of any scientist lowered department
output by 0.18 to 0.32 standard deviations (Table 10, columns 1 and 2). The dismissal of a
scientist whose pre-dismissal citation-weighted publications put him above median quality low-
ered output by between 0.24 and 0.50 standard deviations (columns 3 and 4). The dismissal of
higher quality scientists caused even larger reductions in output that persisted in the long-run.
The dismissal of a scientist in the top 5th percentile lowered output by 0.7 to 1.6 standard
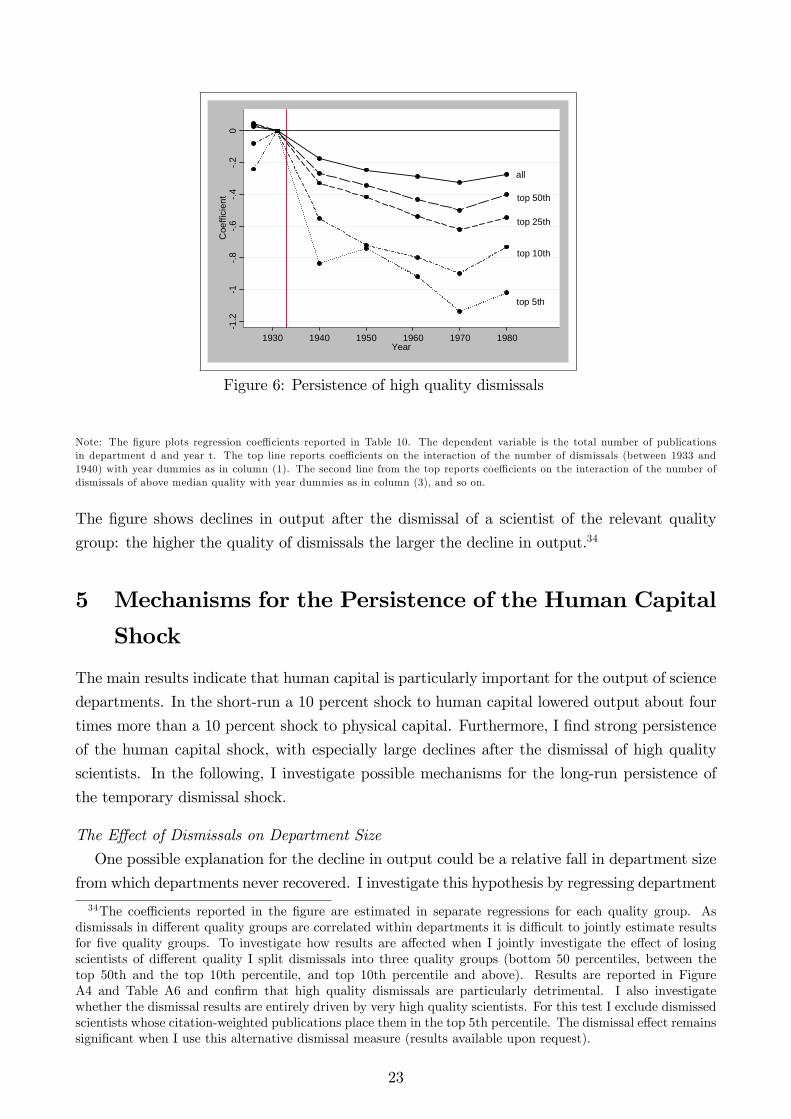
deviations (columns 9 and 10). Figure 6 summarizes these findings graphically.33
33To improve clarity I do not report confidence intervals. The majority of estimated coeffi cients are signifi-cantly different from 0 (Table 10).
22
all
top 50th
top 25th
top 10th
top 5th
1.2
1.8
.6.4
.20
Coe
ffici
ent
1930 1940 1950 1960 1970 1980Year
Figure 6: Persistence of high quality dismissals
Note: The figure plots regression coeffi cients reported in Table 10. The dependent variable is the total number of publicationsin department d and year t. The top line reports coeffi cients on the interaction of the number of dismissals (between 1933 and1940) with year dummies as in column (1). The second line from the top reports coeffi cients on the interaction of the number ofdismissals of above median quality with year dummies as in column (3), and so on.
The figure shows declines in output after the dismissal of a scientist of the relevant quality
group: the higher the quality of dismissals the larger the decline in output.34
5 Mechanisms for the Persistence of the Human Capital
Shock
The main results indicate that human capital is particularly important for the output of science
departments. In the short-run a 10 percent shock to human capital lowered output about four
times more than a 10 percent shock to physical capital. Furthermore, I find strong persistence
of the human capital shock, with especially large declines after the dismissal of high quality
scientists. In the following, I investigate possible mechanisms for the long-run persistence of
the temporary dismissal shock.
The Effect of Dismissals on Department Size
One possible explanation for the decline in output could be a relative fall in department size
from which departments never recovered. I investigate this hypothesis by regressing department
34The coeffi cients reported in the figure are estimated in separate regressions for each quality group. Asdismissals in different quality groups are correlated within departments it is diffi cult to jointly estimate resultsfor five quality groups. To investigate how results are affected when I jointly investigate the effect of losingscientists of different quality I split dismissals into three quality groups (bottom 50 percentiles, between thetop 50th and the top 10th percentile, and top 10th percentile and above). Results are reported in FigureA4 and Table A6 and confirm that high quality dismissals are particularly detrimental. I also investigatewhether the dismissal results are entirely driven by very high quality scientists. For this test I exclude dismissedscientists whose citation-weighted publications place them in the top 5th percentile. The dismissal effect remainssignificant when I use this alternative dismissal measure (results available upon request).
23
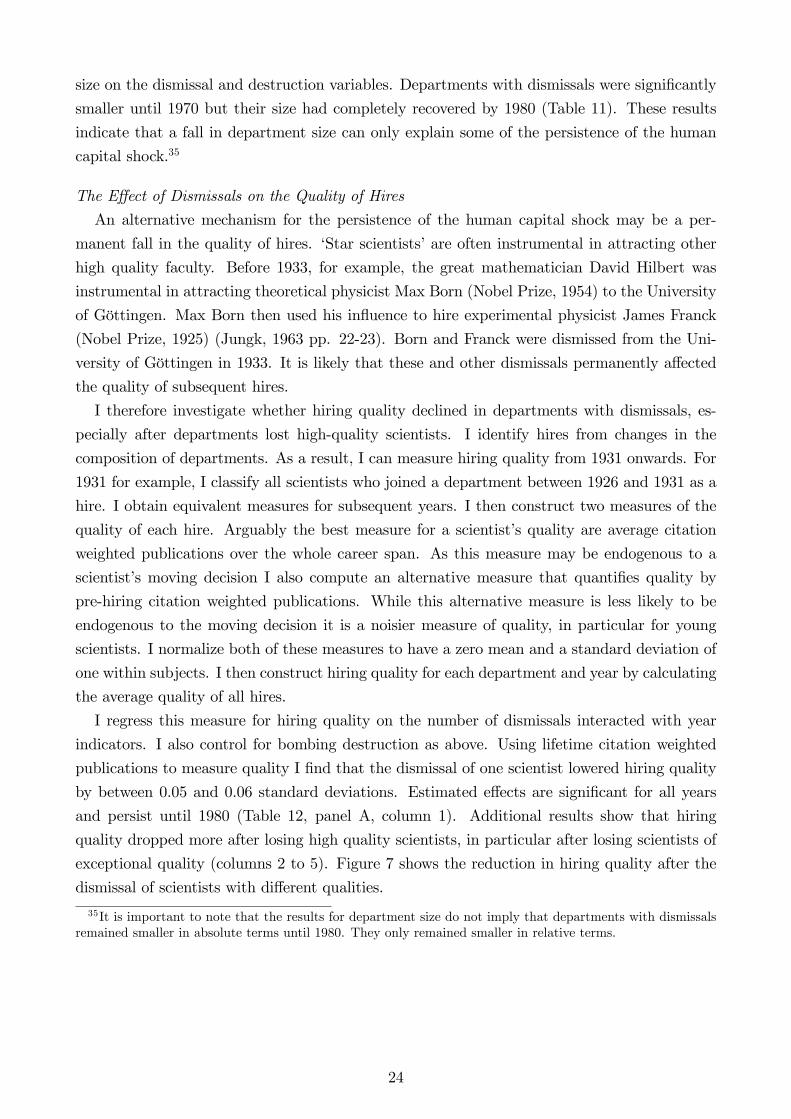
size on the dismissal and destruction variables. Departments with dismissals were significantly
smaller until 1970 but their size had completely recovered by 1980 (Table 11). These results
indicate that a fall in department size can only explain some of the persistence of the human
capital shock.35
The Effect of Dismissals on the Quality of Hires
An alternative mechanism for the persistence of the human capital shock may be a per-
manent fall in the quality of hires. ‘Star scientists’are often instrumental in attracting other
high quality faculty. Before 1933, for example, the great mathematician David Hilbert was
instrumental in attracting theoretical physicist Max Born (Nobel Prize, 1954) to the University
of Göttingen. Max Born then used his influence to hire experimental physicist James Franck
(Nobel Prize, 1925) (Jungk, 1963 pp. 22-23). Born and Franck were dismissed from the Uni-
versity of Göttingen in 1933. It is likely that these and other dismissals permanently affected
the quality of subsequent hires.
I therefore investigate whether hiring quality declined in departments with dismissals, es-
pecially after departments lost high-quality scientists. I identify hires from changes in the
composition of departments. As a result, I can measure hiring quality from 1931 onwards. For
1931 for example, I classify all scientists who joined a department between 1926 and 1931 as a
hire. I obtain equivalent measures for subsequent years. I then construct two measures of the
quality of each hire. Arguably the best measure for a scientist’s quality are average citation
weighted publications over the whole career span. As this measure may be endogenous to a
scientist’s moving decision I also compute an alternative measure that quantifies quality by
pre-hiring citation weighted publications. While this alternative measure is less likely to be
endogenous to the moving decision it is a noisier measure of quality, in particular for young
scientists. I normalize both of these measures to have a zero mean and a standard deviation of
one within subjects. I then construct hiring quality for each department and year by calculating
the average quality of all hires.
I regress this measure for hiring quality on the number of dismissals interacted with year
indicators. I also control for bombing destruction as above. Using lifetime citation weighted
publications to measure quality I find that the dismissal of one scientist lowered hiring quality
by between 0.05 and 0.06 standard deviations. Estimated effects are significant for all years
and persist until 1980 (Table 12, panel A, column 1). Additional results show that hiring
quality dropped more after losing high quality scientists, in particular after losing scientists of
exceptional quality (columns 2 to 5). Figure 7 shows the reduction in hiring quality after the
dismissal of scientists with different qualities.
35It is important to note that the results for department size do not imply that departments with dismissalsremained smaller in absolute terms until 1980. They only remained smaller in relative terms.
24
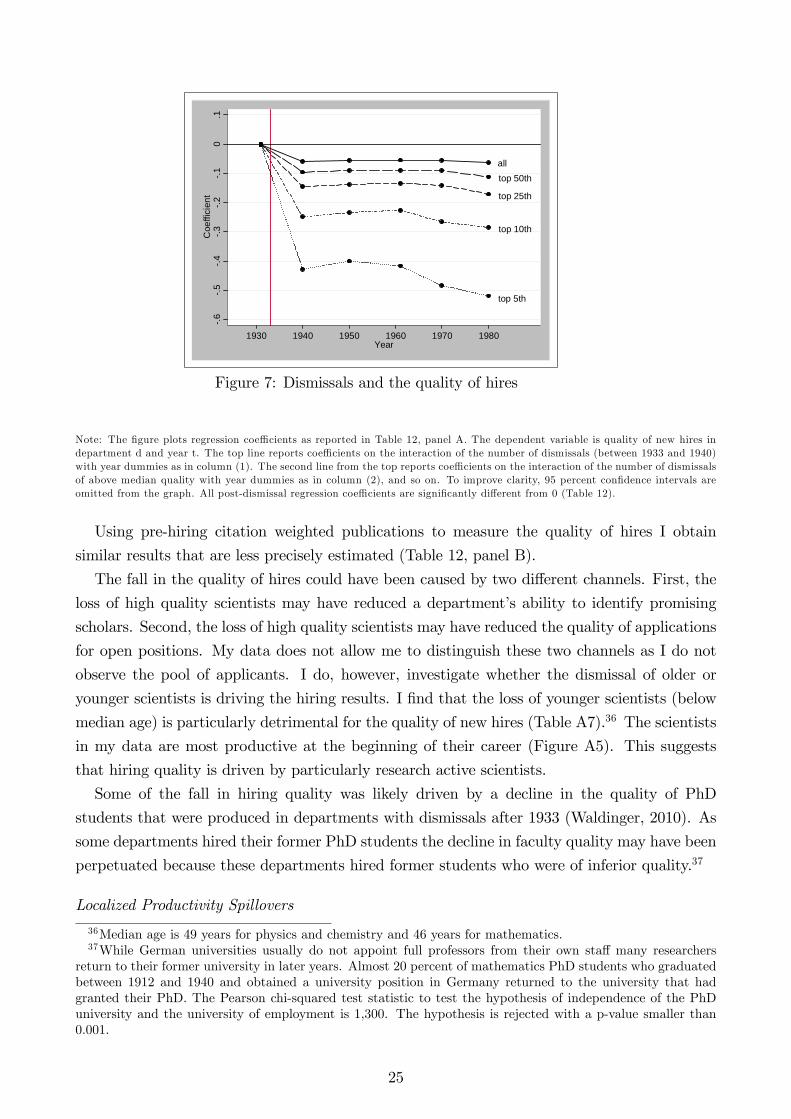
alltop 50th
top 25th
top 10th
top 5th
.6.5
.4.3
.2.1
0.1
Coe
ffici
ent
1930 1940 1950 1960 1970 1980Year
Figure 7: Dismissals and the quality of hires
Note: The figure plots regression coeffi cients as reported in Table 12, panel A. The dependent variable is quality of new hires indepartment d and year t. The top line reports coeffi cients on the interaction of the number of dismissals (between 1933 and 1940)with year dummies as in column (1). The second line from the top reports coeffi cients on the interaction of the number of dismissalsof above median quality with year dummies as in column (2), and so on. To improve clarity, 95 percent confidence intervals areomitted from the graph. All post-dismissal regression coeffi cients are significantly different from 0 (Table 12).
Using pre-hiring citation weighted publications to measure the quality of hires I obtain
similar results that are less precisely estimated (Table 12, panel B).
The fall in the quality of hires could have been caused by two different channels. First, the
loss of high quality scientists may have reduced a department’s ability to identify promising
scholars. Second, the loss of high quality scientists may have reduced the quality of applications
for open positions. My data does not allow me to distinguish these two channels as I do not
observe the pool of applicants. I do, however, investigate whether the dismissal of older or
younger scientists is driving the hiring results. I find that the loss of younger scientists (below
median age) is particularly detrimental for the quality of new hires (Table A7).36 The scientists
in my data are most productive at the beginning of their career (Figure A5). This suggests
that hiring quality is driven by particularly research active scientists.
Some of the fall in hiring quality was likely driven by a decline in the quality of PhD
students that were produced in departments with dismissals after 1933 (Waldinger, 2010). As
some departments hired their former PhD students the decline in faculty quality may have been
perpetuated because these departments hired former students who were of inferior quality.37
Localized Productivity Spillovers
36Median age is 49 years for physics and chemistry and 46 years for mathematics.37While German universities usually do not appoint full professors from their own staff many researchers
return to their former university in later years. Almost 20 percent of mathematics PhD students who graduatedbetween 1912 and 1940 and obtained a university position in Germany returned to the university that hadgranted their PhD. The Pearson chi-squared test statistic to test the hypothesis of independence of the PhDuniversity and the university of employment is 1,300. The hypothesis is rejected with a p-value smaller than0.001.
25
Another potential mechanism for the persistence of the human shock could be localized
productivity spillovers. The output of scientists who remained in departments with dismissals
after 1933 could have declined because of a reduction in the number and quality of local peers.
The declining output of scientists who were directly exposed to the dismissals could have affected
later generations of scientists in departments with dismissals. Previous research, however, has
found that individual output of contemporary scientists did not decline after the dismissal of
local peers in Nazi Germany (Waldinger, 2012). As a result, localized spillovers are unlikely to
drive persistence in this context.
6 Conclusion
I use the dismissal of scientists in Nazi Germany and Allied bombings during WWII as exoge-
nous and temporary shocks to the human and physical capital of science departments. In the
short-run, before departments could fully respond, the human capital shock lowered output by
about four times more than the physical capital shock. The human capital shock persisted
in the long-run, until 1980. The dismissal of high quality scientists caused particularly large
declines in output.
The negative effect of the physical capital shock, however, disappeared during the next few
decades. By 1970, departments with buildings that were destroyed during WWII even did
slightly better than departments without bombing destruction. These findings suggest that
human capital is more important than physical capital for the output of science departments.
My findings, of course, do not indicate that physical capital is irrelevant for output because
post-war reconstruction targeted destroyed departments. It seems, however, that negative
shocks to physical capital can be overcome much more easily than human capital shocks. In
recent years, some fields of science have become more dependent on large capital expenditures
such as particle accelerators. Today, negative physical shocks in these fields may lead to more
persistent effects than in the past.
The persistence of the human capital shock is particularly remarkable if one considers that
most scientists of the former German universities (Breslau now Wroclaw, TU Breslau, and
Königsberg now Kaliningrad) that became part of Poland and the Soviet Union had to relocate
to universities that remained on German territory after 1945. Departments that had lost people
during the dismissals could have hired the best people from these universities. I show, however,
that an important mechanism for the persistence of the human capital shock was a permanent
fall in the quality of new hires, in particular after the dismissal of high quality scientists. ‘Star
scientists’seem to be especially valuable as they attract other high quality researchers. This
suggests that appointing high quality scholars may be a good strategy if a university or country
wanted to raise its research profile.
An important question is whether evidence from historical events in Germany help our under-
standing of science departments today, and in other countries. Recent evidence on evolutionary
biology departments suggests that the human capital part of my findings is likely to be similar
26

today and in other countries. Agrawal, McHale, and Oettl (2013) show that the arrival of a star
scientist increases output of the hiring department through attracting other good researchers
but not by increasing the productivity of incumbent scientists. While Agrawal, McHale, and
Oettl cannot use exogenous variation in the arrival of a star scientist, their findings provide
a useful confirmation of the human capital result in this paper in a setting of current science
departments. While this is no definite proof of external validity it increases my trust in the
generalizability of the findings in this paper.
27
7 References
Acemoglu, Daron, Tarek A. Hassan, James A. Robinson (2011) "Social Structure and Devel-
opment: A Legacy of the Holocaust in Russia", The Quarterly Journal of Economics, vol. 126,
no. 2, pp. 895-946.
Ackerberg, D. C. Lanier Benkard, S. Berry, and A. Pakes (2007) “Econometric Tools for
Analyzing Market Outcomes”, in Handbook of Econometrics, eds. James J. Heckman and
Edward Leamer, vol. 6A.
Aghion, Philippe, Mathias Dewatripont, Caroline Hoxby, Andreu Mas-Colell, and Andre
Sapir (2010) "The governance and performance of universities: evidence from Europe and the
US", Economic Policy, vol. 25, issue 61, pp. 7-59.
Agrawal, Ajay, John McHale, and Alexander Oettl (2013) "Why Stars Matter", mimeo
University of Toronto.
Akbulut-Yuksel, Mevlude and Mutlu Yuksel (2011) "The Long-Term Direct and External
Effects of Jewish Expulsions in Nazi Germany", mimeo Dalhousie University.
Azoulay, Pierre, Joshua Graff Zivin, and Gustavo Manso (2011) "Incentives and Creativity:
Evidence from the Academic Life Sciences", RAND Journal of Economics, vol. 42, no.3, pp.
527-554.
Azoulay, Pierre, Joshua Graff Zivin, and Jialan Wang (2010) "Superstar Extinction", The
Quarterly Journal of Economics, vol. 125, no. 2.
Borjas, George and Kirk B. Doran (2012) "The Collapse of the Soviet Union and the Pro-
ductivity of American Mathematicians", The Quarterly Journal of Economics, vol 127, no. 3,
pp. 1143-1203.
Brakman, Steven, Harry Garretsen, and Marc Schramm (2004) “The Strategic Bombing
during World War II and its Impact on City Growth”, Journal of Economic Geography, vol. 4,
no. 2, pp. 201-218.
Chaney, Eric and Richard Hornbeck (2013) "Economic Growth in the Malthusian Era: Ev-
idence from the 1609 Spanish Expulsion of the Moriscos", mimeo Harvard University.
Cragg, John G. and Stephen G. Donald (1993) "Testing identifiablility and specification in
instrumental variables models", Econometric Theory, vol. 9.
Dardo, Mauro (2004)Nobel Laureates and Twentieth-Century Physics, Cambridge University
Press, Cambridge.
Davis, D. and D. Weinstein (2002) “Bones, Bombs, and Break Points: The Geography of
Economic Activity”, American Economic Review, vol. 92, no. 5, pp. 1269-1289.
Deichmann, Ute (2001) Flüchten, Mitmachen, Vergessen - Chemiker und Biochemiker in der
NS-Zeit", Wiley-VCH Verlag, Weinheim.
Frankland, Noble (2005) "Strategic air offensives" in The Oxford Companion to World War
II, eds. I.C.B. Dear and M.R.D. Foot, Oxford University Press, New York.
28
Furman, Jeff L., Michael E. Porter, and Scott Stern (2002) “The determinants of national
innovative capacity”, Research Policy, vol. 31, no. 6, pp. 899-933.
Gesellschaft für Exilforschung (1998) Handbuch der deutschsprachigen Emigration 1933-1945
- Einleitung, Eds.: Krohn, Claus-Dieter, Patrick von zur Mühlen, Gerhard Paul, Lutz Winkler
Primus Verlag; Darmstadt.
Grenville, J.A.S. (1994) The Collins History of the World in the Twentieth Century, Harper-
CollinsPublishers, London.
Grosfeld, Irena, Alexander Rodnyansky, Ekaterina Zhuravskaya (2013) "Persistent Anti-
Market Culture: A Legacy of the Pale of Settlement and the Holocaust", American Economic
Journal - Economic Policy, forthcoming.
Harris, Arthur (1947) Bomber Offensive , Greenhill Books, London.
Hentschel, Klaus (1996) Physics and National Socialism - An Anthology of Primary Sources,
Birkäuser Verlag, Berlin.
Hoepke, Klaus-Peter (2007) Geschichte der Fridericana - Stationen in der Geschichte der
Universität Karlsuhe (TH) von der Gründung 1825 bis zum Jahr 2000, eds. Günther Grünthal,
Klaus Nippert, and Peter Steinbach, Universitätsverlag Karlsruhe, Karlsruhe.
Hohn, Uta (1991) Die Zerstörung deutscher Städte im Zweiten Weltkrieg. Regionale Un-
terschiede in der Bilanz der Wohnungstotalschäden, Dortmunder Vertrieb für Bau- und Pla-
nungsarbeiten, Dortmund.
Jacob, Brian A. and Lars Lefgren (2011) "The impact of research grant funding on scientific
productivity" Journal of Public Economics, vol. 95, pp. 1168-1177.
Johnes, Jill, Jim Taylor, and Brian Francis (1993) "The Research Performance of UK Univer-
sities: A Statistical Analysis of the Results of the 1989 Research Selectivity Exercise" Journal
of the Royal Statistical Society. Series A (Statistics in Society), vol. 156, no.2, pp. 271-286.
Jungk, Robert (1963) Heller als tausend Sonnen - Das Schicksal der Atomforscher, Alfred
Scherz Verlag, Bern und Stuttgart.
Kugler, Henrique (2011) "Brazil releases science blueprint", Science and Development Net-
work, available at http://www.scidev.net/en/news/brazil-releases-science-blueprint.html, ac-
cessed 30/01/2012.
Levin, Sharon and Paula Stephan (1991) "Research Productivity Over the Life Cycle: Evi-
dence for Academic Scientists", The American Economic Review, vol. 81, no. 1.
Machlup, Fritz (1962) The Production and Distribution of Knowledge in the United States,
Princeton University Press, Princeton.
Miguel, Edward and Gerard Roland (2011) "The long-run impact of bombing Vietnam",
Journal of Development Economics, vol. 96, no. 1, pp. 1-15.
Moser, Petra, Alessandra Voena, and Fabian Waldinger (2012) "German-Jewish Émigrés
and U.S. Invention", mimeo Stanford and Warwick.
29
Notgemeinschaft Deutscher Wissenschaftler im Ausland (1936) List of Displaced German
Scholars, London.
Payne, A. Abigail and Aloysius Siow (2003) "Does Federal Research Funding Increase Uni-
versity Research Output?", Advances in Economic Policy Analysis & Policy, vol. 3, no. 1,
article 1.
Peirse (1940) "Memo to 1,2, 3, 4, and 5 Groups" (see p. 226 footnote 2 in Webster and
Frankland vol. 1.)
Redding, Stephen J. and Daniel M. Sturm "The Costs of Remoteness: Evidence fromGerman
Division and Reunification", American Economic Review, vol. 98, no. 5, pp. 1766-1797.
Rhee, Byung Shik (2011) "A World-Class Research University on the Periphery: The Po-
hang University of Science and Technology, the Republic of Korea", The Road to Academic
Excellence: The Making of World Class Research Universities, eds. Philip G. Altbach and
Jamil Salmi, The World Bank, Washington.
Scoville, Warren C. (1953) "The Hugenots in the French Economy, 1650-1750", The Quar-
terly Journal of Economics, vol. 67, no. 3, pp. 423-444.
Scoville, Warren C. (1960) The Persecution of Hugenots and French Economic Development
1680-1720, University of California Press, Berkeley and Los Angeles.
Siegmund-Schultze, Reinhard (1998) Mathematiker auf der Flucht vor Hitler, Deutsche
Mathematiker Vereinigung, F. Vieweg.
Stock, James H. and Motoshiro Yogo (2005) "Testing for Weak Instruments in Linear IV Re-
gression", in Identification and Inference for Econometric Models: Essays in Honor of Thomas
Rothenberg, eds: Donald W.K. Andrews and James H. Stock, Cambridge University Press, New
York.
Technische Universität Dresden (1996) Geschichte der Technischen Universität Dresden in
Dokumenten, Bildern, Erinnerungen, ed. Achim Mehlhorn, vol. 3.
Tooze, Adam (2006) The Wages of Destruction - The Making and Breaking of the Nazi
Economy, Penguin Books, London.
United States Strategic Bombing Survey (1945) Overall-Report (European War), accessed
online http://wwiiarchives.net/servlet/document/index/112/0.
van Rey, Manfred (1995) "Die Rheinische Friedrich-Wilhelms-Universität Bonn vom 18.
Oktober 1944 bis 17. November 1945", Bonner Universitätsblätter.
Waldinger, Fabian (2010) "Quality Matters: The Expulsion of Professors and the Conse-
quences for Ph.D. Student Outcomes in Nazi Germany", Journal of Political Economy, vol.
118, no 4.
Waldinger, Fabian (2012) "Peer Effects in Science - Evidence from the Dismissal of Scientists
in Nazi Germany", The Review of Economic Studies, vol. 79, no. 2, pp. 838-861.
Wang, Qing Hui, Qi Want, and Nian Cai Liu (2011) "Building World-Class Universities in
China: Shanghai Jiao Tong University", The Road to Academic Excellence: The Making of
30

World Class Research Universities, eds. Philip G. Altbach and Jamil Salmi, The World Bank,
Washington.
Webster, Charles K. and Noble Frankland (1961) The Strategic Air Offensive Against Ger-
many 1939-1945, vol. 1-4., Her Majesty’s Stationary Offi ce, London.
Whalley, Alexander and Justin Hicks (2012) "Spending Wisely? How Resources Affect
Knowledge Production in Universities", Economic Inquiry, forthcoming.
Wolters, Paul (1950) "Der Wiederaufbau der Technischen Hochschule", in Jahrbuch der
Technischen Hochschule Hannover 1949-1950, eds. Otto von Leunenschloßund Erich Böttcher,
Düsseldorf.
31
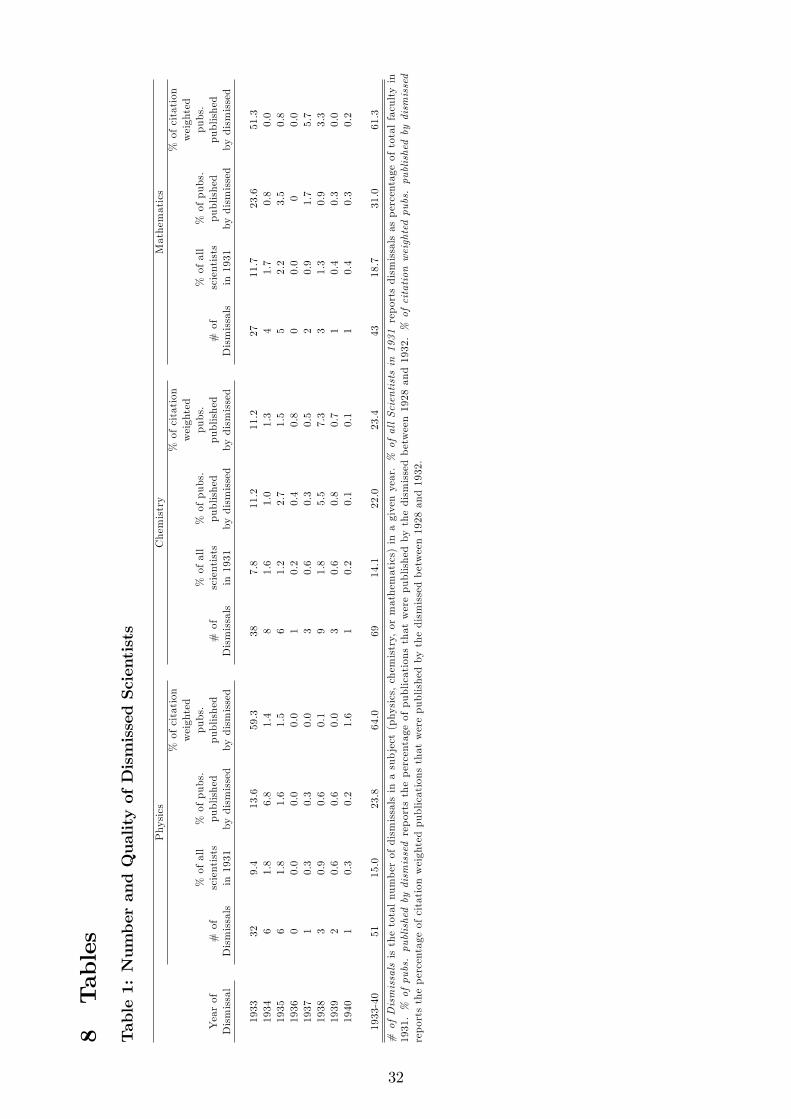
8Tables
Table1:NumberandQualityofDismissedScientists
Physics
Chemistry
Mathematics
%ofcitation
%ofcitation
%ofcitation
weighted
weighted
weighted
%ofall
%ofpubs.
pubs.
%ofall
%ofpubs.
pubs.
%ofall
%ofpubs.
pubs.
Yearof
#of
scientists
published
published
#of
scientists
published
published
#of
scientists
published
published
Dismissal
Dismissals
in1931
bydismissed
bydismissed
Dismissals
in1931
bydismissed
bydismissed
Dismissals
in1931
bydismissed
bydismissed
1933
329.4
13.6
59.3
387.8
11.2
11.2
2711.7
23.6
51.3
1934
61.8
6.8
1.4
81.6
1.0
1.3
41.7
0.8
0.0
1935
61.8
1.6
1.5
61.2
2.7
1.5
52.2
3.5
0.8
1936
00.0
0.0
0.0
10.2
0.4
0.8
00.0
00.0
1937
10.3
0.3
0.0
30.6
0.3
0.5
20.9
1.7
5.7
1938
30.9
0.6
0.1
91.8
5.5
7.3
31.3
0.9
3.3
1939
20.6
0.6
0.0
30.6
0.8
0.7
10.4
0.3
0.0
1940
10.3
0.2
1.6
10.2
0.1
0.1
10.4
0.3
0.2
1933-40
5115.0
23.8
64.0
6914.1
22.0
23.4
4318.7
31.0
61.3
#ofDismissalsisthetotalnumberofdismissalsinasubject(physics,chemistry,ormathematics)inagivenyear.%ofallScientistsin1931
reportsdismissalsaspercentageoftotalfacultyin
1931.%ofpubs.publishedbydismissedreportsthepercentageofpublicationsthatwerepublishedby
thedismissedbetween1928and1932.%ofcitation
weightedpubs.publishedbydismissed
reportsthepercentageofcitationweightedpublicationsthatwerepublishedbythedismissedbetween1928and1932.
32
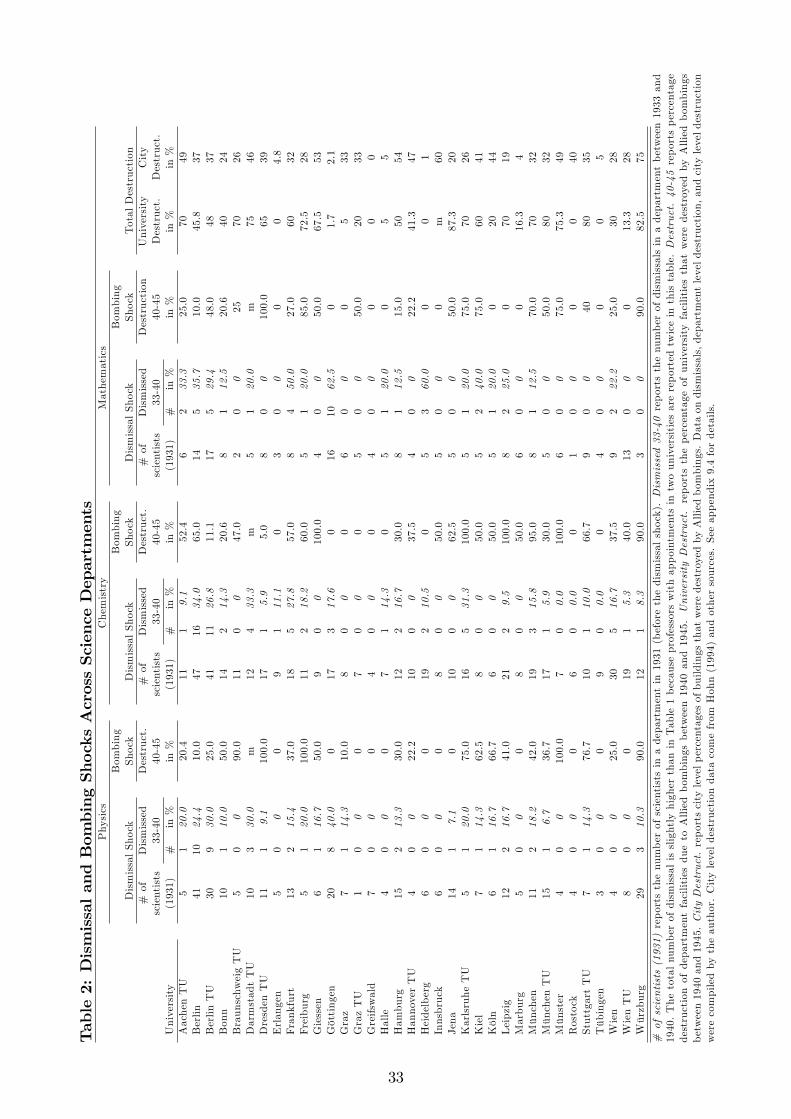
Table2:DismissalandBombingShocksAcrossScienceDepartments
Physics
Chemistry
Mathematics
Bombing
Bombing
Bombing
DismissalShock
Shock
DismissalShock
Shock
DismissalShock
Shock
TotalDestruction
#of
Dismissed
Destruct.
#of
Dismissed
Destruct.
#of
Dismissed
Destruction
University
City
scientists
33-40
40-45
scientists
33-40
40-45
scientists
33-40
40-45
Destruct.
Destruct.
University
(1931)
#in%
in%
(1931)
#in%
in%
(1931)
#in%
in%
in%
in%
AachenTU
51
20.0
20.4
111
9.1
52.4
62
33.3
25.0
7049
Berlin
4110
24.4
10.0
4716
34.0
65.0
145
35.7
10.0
45.8
37BerlinTU
309
30.0
25.0
4111
26.8
11.1
175
29.4
48.0
4837
Bonn
101
10.0
50.0
142
14.3
20.6
81
12.5
20.6
4024
BraunschweigTU
50
090.0
110
047.0
20
025
7026
DarmstadtTU
103
30.0
m12
433.3
m5
120.0
m75
46DresdenTU
111
9.1
100.0
171
5.9
5.0
80
0100.0
6539
Erlangen
50
00
91
11.1
03
00
00
4.8
Frankfurt
132
15.4
37.0
185
27.8
57.0
84
50.0
27.0
6032
Freiburg
51
20.0
100.0
112
18.2
60.0
51
20.0
85.0
72.5
28Giessen
61
16.7
50.0
90
0100.0
40
050.0
67.5
53Göttingen
208
40.0
017
317.6
016
1062.5
01.7
2.1
Graz
71
14.3
10.0
80
00
60
00
533
GrazTU
10
00
70
00
50
050.0
2033
Greifswald
70
00
40
00
40
00
00
Halle
40
00
71
14.3
05
120.0
05
5Hamburg
152
13.3
30.0
122
16.7
30.0
81
12.5
15.0
5054
HannoverTU
40
022.2
100
037.5
40
022.2
41.3
47Heidelberg
60
00
192
10.5
05
360.0
00
1Innsbruck
60
00
80
050.0
50
00
m60
Jena
141
7.1
010
00
62.5
50
050.0
87.3
20KarlsruheTU
51
20.0
75.0
165
31.3
100.0
51
20.0
75.0
7026
Kiel
71
14.3
62.5
80
050.0
52
40.0
75.0
6041
Köln
61
16.7
66.7
60
050.0
51
20.0
020
44Leipzig
122
16.7
41.0
212
9.5
100.0
82
25.0
070
19Marburg
50
00
80
050.0
60
00
16.3
4München
112
18.2
42.0
193
15.8
95.0
81
12.5
70.0
7032
MünchenTU
151
6.7
36.7
171
5.9
30.0
50
050.0
8032
Münster
40
0100.0
70
0.0
100.0
60
075.0
75.3
49Rostock
40
00
60
0.0
01
00
00
40StuttgartTU
71
14.3
76.7
101
10.0
66.7
90
040
8035
Tübingen
30
00
90
0.0
04
00
00
5Wien
40
025.0
305
16.7
37.5
92
22.2
25.0
3028
WienTU
80
00
191
5.3
40.0
130
00
13.3
28Würzburg
293
10.3
90.0
121
8.3
90.0
30
090.0
82.5
75
#ofscientists(1931)reportsthenumberofscientistsinadepartmentin1931(beforethedismissalshock).Dismissed33-40reportsthenumberofdismissalsinadepartmentbetween1933and
1940.ThetotalnumberofdismissalisslightlyhigherthaninTable1becauseprofessorswithappointmentsintwouniversitiesarereportedtwiceinthistable.Destruct.40-45reportspercentage
destructionofdepartmentfacilitiesduetoAlliedbombingsbetween1940
and1945.UniversityDestruct.reportsthepercentageofuniversityfacilitiesthatweredestroyed
byAlliedbombings
between1940and1945.CityDestruct.reportscitylevelpercentagesofbuildingsthatweredestroyedbyAlliedbombings.Dataondismissals,departmentleveldestruction,andcityleveldestruction
werecompiledbytheauthor.Cityleveldestructiondatacomefrom
Hohn(1994)andothersources.Seeappendix9.4fordetails.
33
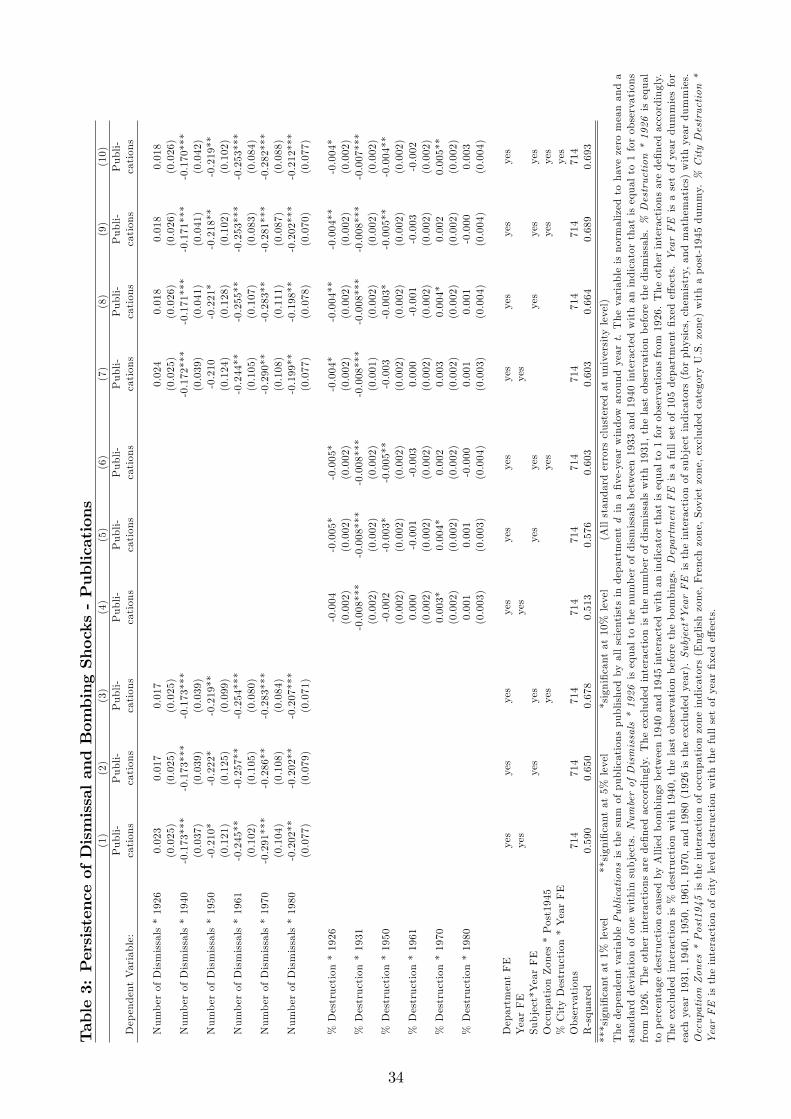
Table3:PersistenceofDismissalandBombingShocks-Publications
(1)
(2)
(3)
(4)
(5)
(6)
(7)
(8)
(9)
(10)
Publi-
Publi-
Publi-
Publi-
Publi-
Publi-
Publi-
Publi-
Publi-
Publi-
DependentVariable:
cations
cations
cations
cations
cations
cations
cations
cations
cations
cations
NumberofDismissals*1926
0.023
0.017
0.017
0.024
0.018
0.018
0.018
(0.025)
(0.025)
(0.025)
(0.025)
(0.026)
(0.026)
(0.026)
NumberofDismissals*1940
-0.173***
-0.173***
-0.173***
-0.172***
-0.171***
-0.171***
-0.170***
(0.037)
(0.039)
(0.039)
(0.039)
(0.041)
(0.041)
(0.042)
NumberofDismissals*1950
-0.210*
-0.222*
-0.219**
-0.210
-0.221*
-0.218**
-0.219**
(0.121)
(0.125)
(0.099)
(0.124)
(0.128)
(0.102)
(0.102)
NumberofDismissals*1961
-0.245**
-0.257**
-0.254***
-0.244**
-0.255**
-0.253***
-0.253***
(0.102)
(0.105)
(0.080)
(0.105)
(0.107)
(0.083)
(0.084)
NumberofDismissals*1970
-0.291***
-0.286**
-0.283***
-0.290**
-0.283**
-0.281***
-0.282***
(0.104)
(0.108)
(0.084)
(0.108)
(0.111)
(0.087)
(0.088)
NumberofDismissals*1980
-0.202**
-0.202**
-0.207***
-0.199**
-0.198**
-0.202***
-0.212***
(0.077)
(0.079)
(0.071)
(0.077)
(0.078)
(0.070)
(0.077)
%Destruction*1926
-0.004
-0.005*
-0.005*
-0.004*
-0.004**
-0.004**
-0.004*
(0.002)
(0.002)
(0.002)
(0.002)
(0.002)
(0.002)
(0.002)
%Destruction*1931
-0.008***
-0.008***
-0.008***
-0.008***
-0.008***
-0.008***
-0.007***
(0.002)
(0.002)
(0.002)
(0.001)
(0.002)
(0.002)
(0.002)
%Destruction*1950
-0.002
-0.003*
-0.005**
-0.003
-0.003*
-0.005**
-0.004**
(0.002)
(0.002)
(0.002)
(0.002)
(0.002)
(0.002)
(0.002)
%Destruction*1961
0.000
-0.001
-0.003
0.000
-0.001
-0.003
-0.002
(0.002)
(0.002)
(0.002)
(0.002)
(0.002)
(0.002)
(0.002)
%Destruction*1970
0.003*
0.004*
0.002
0.003
0.004*
0.002
0.005**
(0.002)
(0.002)
(0.002)
(0.002)
(0.002)
(0.002)
(0.002)
%Destruction*1980
0.001
0.001
-0.000
0.001
0.001
-0.000
0.003
(0.003)
(0.003)
(0.004)
(0.003)
(0.004)
(0.004)
(0.004)
DepartmentFE
yes
yes
yes
yes
yes
yes
yes
yes
yes
yes
YearFE
yes
yes
yes
Subject*YearFE
yes
yes
yes
yes
yes
yes
yes
OccupationZones*Post1945
yes
yes
yes
yes
%CityDestruction*YearFE
yes
Observations
714
714
714
714
714
714
714
714
714
714
R-squared
0.590
0.650
0.678
0.513
0.576
0.603
0.603
0.664
0.689
0.693
***significantat1%
level
**significantat5%
level
*significantat10%level
(Allstandarderrorsclusteredatuniversitylevel)
ThedependentvariablePublicationsisthesumofpublicationspublishedbyallscientistsindepartmentdinafive-yearwindow
aroundyeart.Thevariableisnormalizedtohavezeromeananda
standarddeviationofonewithinsubjects.NumberofDismissals*1926
isequaltothenumberofdismissalsbetween1933and1940interactedwithanindicatorthatisequalto1forobservations
from
1926.Theotherinteractionsaredefinedaccordingly.Theexcludedinteractionisthenumberofdismissalswith1931,thelastobservationbeforethedismissals.%Destruction*1926
isequal
topercentagedestructioncausedbyAlliedbombingsbetween1940and1945interactedwithanindicatorthatisequalto1forobservationsfrom
1926.Theotherinteractionsaredefinedaccordingly.
Theexcludedinteractionis%destructionwith1940,thelastobservationbeforethebombings.DepartmentFEisafullsetof105departmentfixedeffects.YearFEisasetofyeardummiesfor
eachyear1931,1940,1950,1961,1970,and1980(1926istheexcludedyear).Subject*YearFEistheinteractionofsubjectindicators(forphysics,chemistry,andmathematics)withyeardummies.
Occupation
Zones*Post1945istheinteractionofoccupationzoneindicators(Englishzone,Frenchzone,Sovietzone,excludedcategoryU.S.zone)withapost-1945dummy.%CityDestruction*
YearFEistheinteractionofcityleveldestructionwiththefullsetofyearfixedeffects.
34
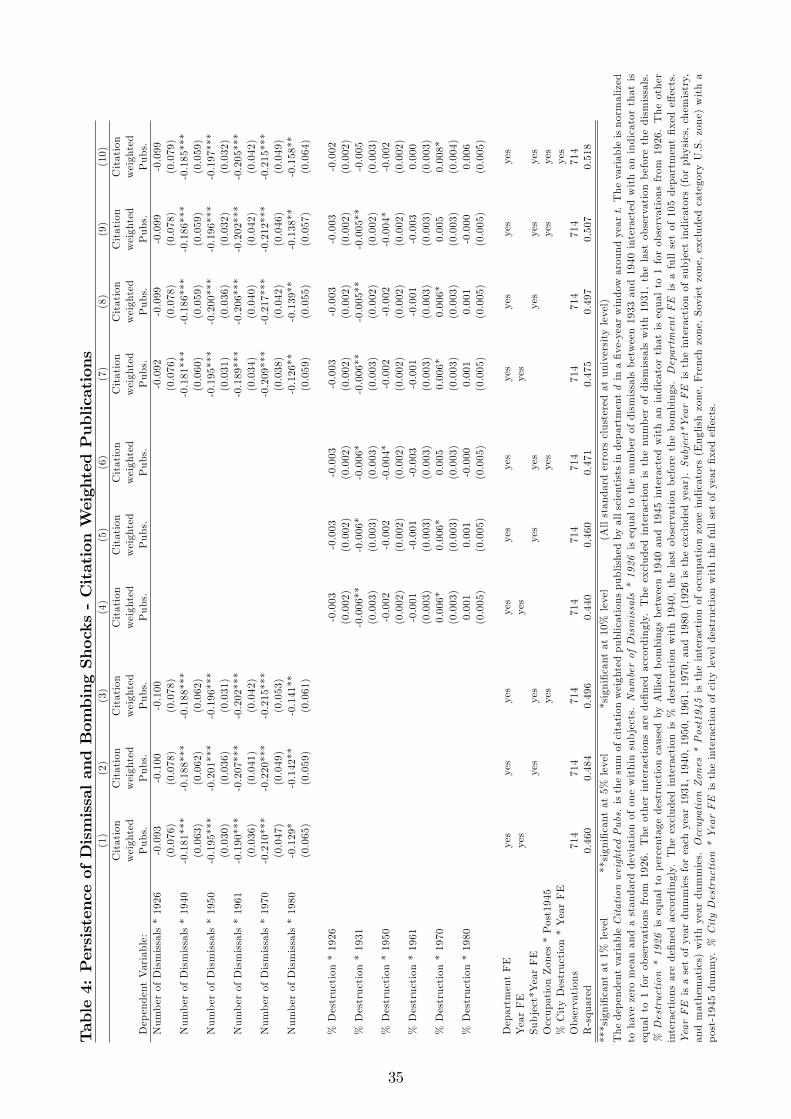
Table4:PersistenceofDismissalandBombingShocks-CitationWeightedPublications
(1)
(2)
(3)
(4)
(5)
(6)
(7)
(8)
(9)
(10)
Citation
Citation
Citation
Citation
Citation
Citation
Citation
Citation
Citation
Citation
weighted
weighted
weighted
weighted
weighted
weighted
weighted
weighted
weighted
weighted
DependentVariable:
Pubs.
Pubs.
Pubs.
Pubs.
Pubs.
Pubs.
Pubs.
Pubs.
Pubs.
Pubs.
NumberofDismissals*1926
-0.093
-0.100
-0.100
-0.092
-0.099
-0.099
-0.099
(0.076)
(0.078)
(0.078)
(0.076)
(0.078)
(0.078)
(0.079)
NumberofDismissals*1940
-0.181***
-0.188***
-0.188***
-0.181***
-0.186***
-0.186***
-0.185***
(0.063)
(0.062)
(0.062)
(0.060)
(0.059)
(0.059)
(0.059)
NumberofDismissals*1950
-0.195***
-0.201***
-0.196***
-0.195***
-0.200***
-0.196***
-0.197***
(0.030)
(0.036)
(0.031)
(0.031)
(0.036)
(0.032)
(0.032)
NumberofDismissals*1961
-0.190***
-0.207***
-0.202***
-0.189***
-0.206***
-0.202***
-0.205***
(0.036)
(0.041)
(0.042)
(0.034)
(0.040)
(0.042)
(0.042)
NumberofDismissals*1970
-0.210***
-0.220***
-0.215***
-0.209***
-0.217***
-0.212***
-0.215***
(0.047)
(0.049)
(0.053)
(0.038)
(0.042)
(0.046)
(0.049)
NumberofDismissals*1980
-0.129*
-0.142**
-0.141**
-0.126**
-0.139**
-0.138**
-0.158**
(0.065)
(0.059)
(0.061)
(0.059)
(0.055)
(0.057)
(0.064)
%Destruction*1926
-0.003
-0.003
-0.003
-0.003
-0.003
-0.003
-0.002
(0.002)
(0.002)
(0.002)
(0.002)
(0.002)
(0.002)
(0.002)
%Destruction*1931
-0.006**
-0.006*
-0.006*
-0.006**
-0.005**
-0.005**
-0.005
(0.003)
(0.003)
(0.003)
(0.003)
(0.002)
(0.002)
(0.003)
%Destruction*1950
-0.002
-0.002
-0.004*
-0.002
-0.002
-0.004*
-0.002
(0.002)
(0.002)
(0.002)
(0.002)
(0.002)
(0.002)
(0.002)
%Destruction*1961
-0.001
-0.001
-0.003
-0.001
-0.001
-0.003
0.000
(0.003)
(0.003)
(0.003)
(0.003)
(0.003)
(0.003)
(0.003)
%Destruction*1970
0.006*
0.006*
0.005
0.006*
0.006*
0.005
0.008*
(0.003)
(0.003)
(0.003)
(0.003)
(0.003)
(0.003)
(0.004)
%Destruction*1980
0.001
0.001
-0.000
0.001
0.001
-0.000
0.006
(0.005)
(0.005)
(0.005)
(0.005)
(0.005)
(0.005)
(0.005)
DepartmentFE
yes
yes
yes
yes
yes
yes
yes
yes
yes
yes
YearFE
yes
yes
yes
Subject*YearFE
yes
yes
yes
yes
yes
yes
yes
OccupationZones*Post1945
yes
yes
yes
yes
%CityDestruction*YearFE
yes
Observations
714
714
714
714
714
714
714
714
714
714
R-squared
0.460
0.484
0.496
0.440
0.460
0.471
0.475
0.497
0.507
0.518
***significantat1%
level
**significantat5%
level
*significantat10%level
(Allstandarderrorsclusteredatuniversitylevel)
ThedependentvariableCitationweightedPubs.isthesumofcitationweightedpublicationspublishedbyallscientistsindepartmentdinafive-yearwindow
aroundyeart.Thevariableisnormalized
tohavezeromeanandastandarddeviationofonewithinsubjects.NumberofDismissals*1926
isequaltothenumberofdismissalsbetween1933and1940interactedwithan
indicatorthatis
equalto1forobservationsfrom
1926.Theotherinteractionsaredefinedaccordingly.Theexcludedinteractionisthenumberofdismissalswith1931,thelastobservationbeforethedismissals.
%Destruction*1926
isequaltopercentagedestructioncausedby
Alliedbombingsbetween1940and1945interactedwithan
indicatorthatisequalto1forobservationsfrom
1926.Theother
interactionsaredefinedaccordingly.Theexcludedinteractionis%destructionwith1940,thelastobservationbeforethebombings.DepartmentFEisafullsetof105departmentfixedeffects.
YearFEisasetofyeardummiesforeachyear1931,1940,1950,1961,1970,and1980(1926istheexcludedyear).Subject*YearFEistheinteractionofsubjectindicators(forphysics,chemistry,
andmathematics)withyeardummies.Occupation
Zones*Post1945istheinteractionofoccupationzoneindicators(Englishzone,Frenchzone,Sovietzone,excludedcategoryU.S.zone)witha
post-1945dummy.%CityDestruction*YearFEistheinteractionofcityleveldestructionwiththefullsetofyearfixedeffects.
35
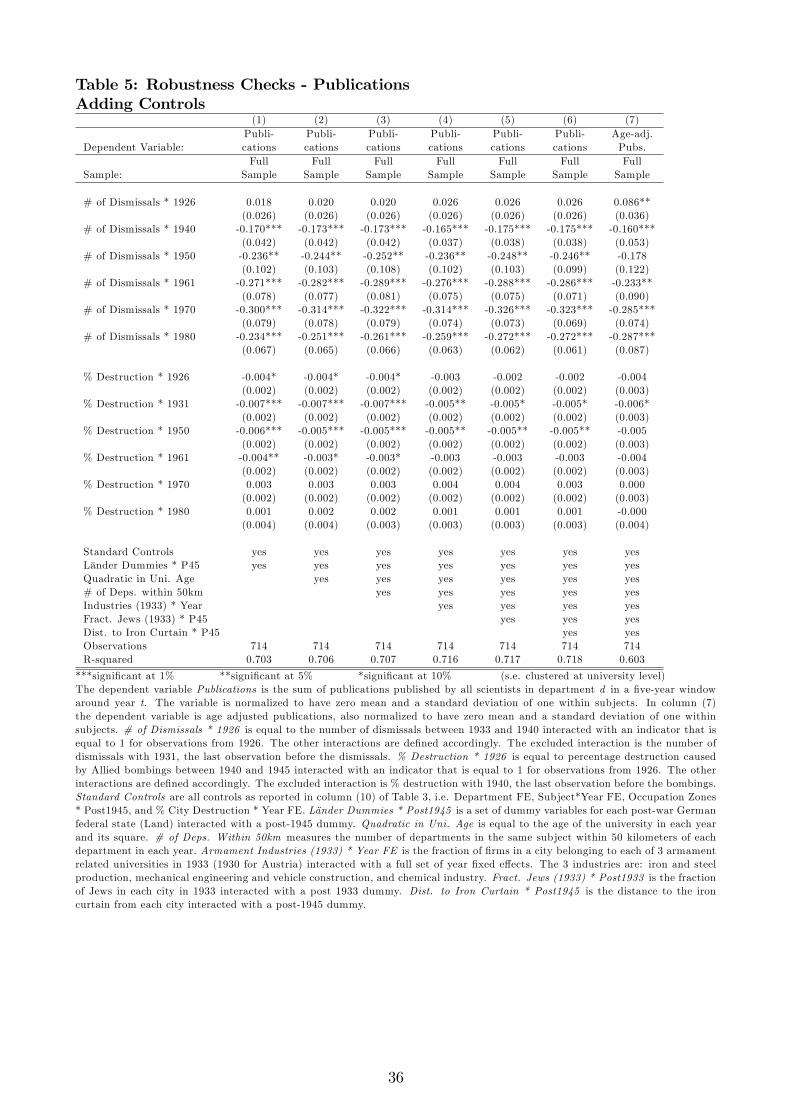
Table 5: Robustness Checks - PublicationsAdding Controls
(1) (2) (3) (4) (5) (6) (7)Publi- Publi- Publi- Publi- Publi- Publi- Age-adj.
Dependent Variable: cations cations cations cations cations cations Pubs.Full Full Full Full Full Full Full
Sample: Sample Sample Sample Sample Sample Sample Sample
# of Dismissals * 1926 0.018 0.020 0.020 0.026 0.026 0.026 0.086**(0.026) (0.026) (0.026) (0.026) (0.026) (0.026) (0.036)
# of Dismissals * 1940 -0.170*** -0.173*** -0.173*** -0.165*** -0.175*** -0.175*** -0.160***(0.042) (0.042) (0.042) (0.037) (0.038) (0.038) (0.053)
# of Dismissals * 1950 -0.236** -0.244** -0.252** -0.236** -0.248** -0.246** -0.178(0.102) (0.103) (0.108) (0.102) (0.103) (0.099) (0.122)
# of Dismissals * 1961 -0.271*** -0.282*** -0.289*** -0.276*** -0.288*** -0.286*** -0.233**(0.078) (0.077) (0.081) (0.075) (0.075) (0.071) (0.090)
# of Dismissals * 1970 -0.300*** -0.314*** -0.322*** -0.314*** -0.326*** -0.323*** -0.285***(0.079) (0.078) (0.079) (0.074) (0.073) (0.069) (0.074)
# of Dismissals * 1980 -0.234*** -0.251*** -0.261*** -0.259*** -0.272*** -0.272*** -0.287***(0.067) (0.065) (0.066) (0.063) (0.062) (0.061) (0.087)
% Destruction * 1926 -0.004* -0.004* -0.004* -0.003 -0.002 -0.002 -0.004(0.002) (0.002) (0.002) (0.002) (0.002) (0.002) (0.003)
% Destruction * 1931 -0.007*** -0.007*** -0.007*** -0.005** -0.005* -0.005* -0.006*(0.002) (0.002) (0.002) (0.002) (0.002) (0.002) (0.003)
% Destruction * 1950 -0.006*** -0.005*** -0.005*** -0.005** -0.005** -0.005** -0.005(0.002) (0.002) (0.002) (0.002) (0.002) (0.002) (0.003)
% Destruction * 1961 -0.004** -0.003* -0.003* -0.003 -0.003 -0.003 -0.004(0.002) (0.002) (0.002) (0.002) (0.002) (0.002) (0.003)
% Destruction * 1970 0.003 0.003 0.003 0.004 0.004 0.003 0.000(0.002) (0.002) (0.002) (0.002) (0.002) (0.002) (0.003)
% Destruction * 1980 0.001 0.002 0.002 0.001 0.001 0.001 -0.000(0.004) (0.004) (0.003) (0.003) (0.003) (0.003) (0.004)
Standard Controls yes yes yes yes yes yes yesLänder Dummies * P45 yes yes yes yes yes yes yesQuadratic in Uni. Age yes yes yes yes yes yes# of Deps. within 50km yes yes yes yes yesIndustries (1933) * Year yes yes yes yesFract. Jews (1933) * P45 yes yes yesDist. to Iron Curtain * P45 yes yesObservations 714 714 714 714 714 714 714R-squared 0.703 0.706 0.707 0.716 0.717 0.718 0.603
***significant at 1% **significant at 5% *significant at 10% (s.e. clustered at university level)The dependent variable Publications is the sum of publications published by all scientists in department d in a five-year windowaround year t. The variable is normalized to have zero mean and a standard deviation of one within subjects. In column (7)the dependent variable is age adjusted publications, also normalized to have zero mean and a standard deviation of one withinsubjects. # of Dismissals * 1926 is equal to the number of dismissals between 1933 and 1940 interacted with an indicator that isequal to 1 for observations from 1926. The other interactions are defined accordingly. The excluded interaction is the number ofdismissals with 1931, the last observation before the dismissals. % Destruction * 1926 is equal to percentage destruction causedby Allied bombings between 1940 and 1945 interacted with an indicator that is equal to 1 for observations from 1926. The otherinteractions are defined accordingly. The excluded interaction is % destruction with 1940, the last observation before the bombings.Standard Controls are all controls as reported in column (10) of Table 3, i.e. Department FE, Subject*Year FE, Occupation Zones* Post1945, and % City Destruction * Year FE. Länder Dummies * Post1945 is a set of dummy variables for each post-war Germanfederal state (Land) interacted with a post-1945 dummy. Quadratic in Uni. Age is equal to the age of the university in each yearand its square. # of Deps. Within 50km measures the number of departments in the same subject within 50 kilometers of eachdepartment in each year. Armament Industries (1933) * Year FE is the fraction of firms in a city belonging to each of 3 armamentrelated universities in 1933 (1930 for Austria) interacted with a full set of year fixed effects. The 3 industries are: iron and steelproduction, mechanical engineering and vehicle construction, and chemical industry. Fract. Jews (1933) * Post1933 is the fractionof Jews in each city in 1933 interacted with a post 1933 dummy. Dist. to Iron Curtain * Post1945 is the distance to the ironcurtain from each city interacted with a post-1945 dummy.
36
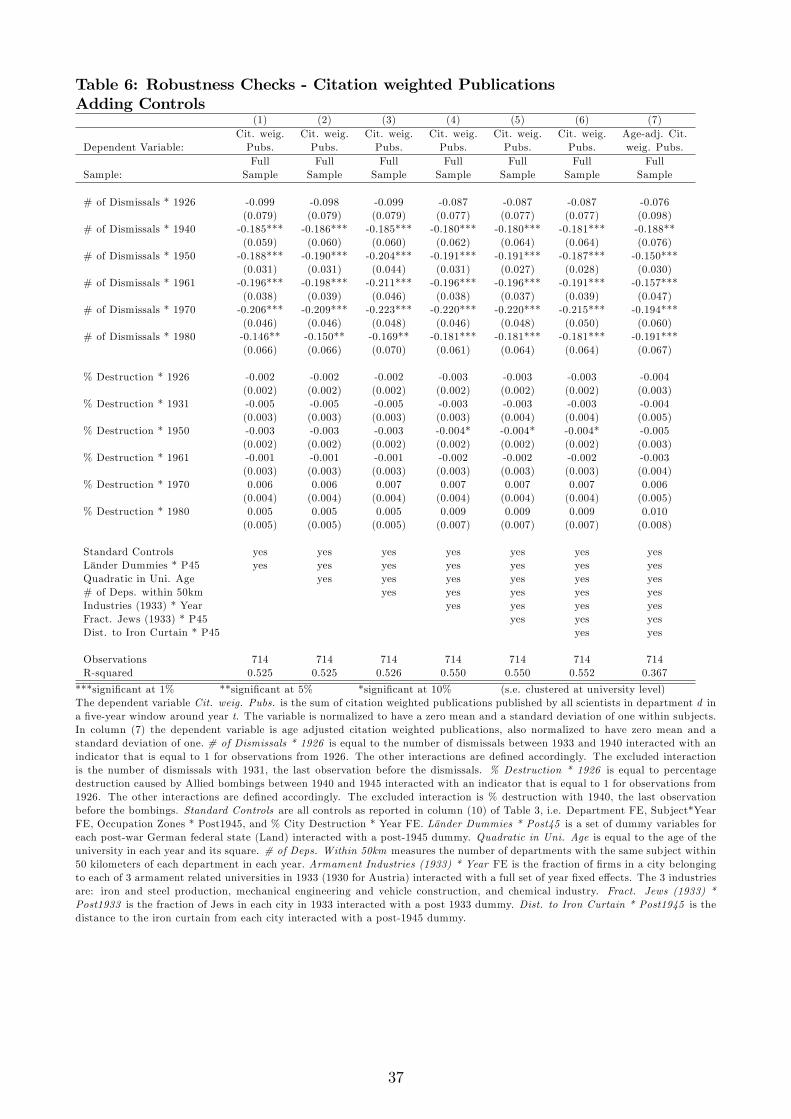
Table 6: Robustness Checks - Citation weighted PublicationsAdding Controls
(1) (2) (3) (4) (5) (6) (7)Cit. weig. Cit. weig. Cit. weig. Cit. weig. Cit. weig. Cit. weig. Age-adj. Cit.
Dependent Variable: Pubs. Pubs. Pubs. Pubs. Pubs. Pubs. weig. Pubs.Full Full Full Full Full Full Full
Sample: Sample Sample Sample Sample Sample Sample Sample
# of Dismissals * 1926 -0.099 -0.098 -0.099 -0.087 -0.087 -0.087 -0.076(0.079) (0.079) (0.079) (0.077) (0.077) (0.077) (0.098)
# of Dismissals * 1940 -0.185*** -0.186*** -0.185*** -0.180*** -0.180*** -0.181*** -0.188**(0.059) (0.060) (0.060) (0.062) (0.064) (0.064) (0.076)
# of Dismissals * 1950 -0.188*** -0.190*** -0.204*** -0.191*** -0.191*** -0.187*** -0.150***(0.031) (0.031) (0.044) (0.031) (0.027) (0.028) (0.030)
# of Dismissals * 1961 -0.196*** -0.198*** -0.211*** -0.196*** -0.196*** -0.191*** -0.157***(0.038) (0.039) (0.046) (0.038) (0.037) (0.039) (0.047)
# of Dismissals * 1970 -0.206*** -0.209*** -0.223*** -0.220*** -0.220*** -0.215*** -0.194***(0.046) (0.046) (0.048) (0.046) (0.048) (0.050) (0.060)
# of Dismissals * 1980 -0.146** -0.150** -0.169** -0.181*** -0.181*** -0.181*** -0.191***(0.066) (0.066) (0.070) (0.061) (0.064) (0.064) (0.067)
% Destruction * 1926 -0.002 -0.002 -0.002 -0.003 -0.003 -0.003 -0.004(0.002) (0.002) (0.002) (0.002) (0.002) (0.002) (0.003)
% Destruction * 1931 -0.005 -0.005 -0.005 -0.003 -0.003 -0.003 -0.004(0.003) (0.003) (0.003) (0.003) (0.004) (0.004) (0.005)
% Destruction * 1950 -0.003 -0.003 -0.003 -0.004* -0.004* -0.004* -0.005(0.002) (0.002) (0.002) (0.002) (0.002) (0.002) (0.003)
% Destruction * 1961 -0.001 -0.001 -0.001 -0.002 -0.002 -0.002 -0.003(0.003) (0.003) (0.003) (0.003) (0.003) (0.003) (0.004)
% Destruction * 1970 0.006 0.006 0.007 0.007 0.007 0.007 0.006(0.004) (0.004) (0.004) (0.004) (0.004) (0.004) (0.005)
% Destruction * 1980 0.005 0.005 0.005 0.009 0.009 0.009 0.010(0.005) (0.005) (0.005) (0.007) (0.007) (0.007) (0.008)
Standard Controls yes yes yes yes yes yes yesLänder Dummies * P45 yes yes yes yes yes yes yesQuadratic in Uni. Age yes yes yes yes yes yes# of Deps. within 50km yes yes yes yes yesIndustries (1933) * Year yes yes yes yesFract. Jews (1933) * P45 yes yes yesDist. to Iron Curtain * P45 yes yes
Observations 714 714 714 714 714 714 714R-squared 0.525 0.525 0.526 0.550 0.550 0.552 0.367
***significant at 1% **significant at 5% *significant at 10% (s.e. clustered at university level)The dependent variable Cit. weig. Pubs. is the sum of citation weighted publications published by all scientists in department d ina five-year window around year t. The variable is normalized to have a zero mean and a standard deviation of one within subjects.In column (7) the dependent variable is age adjusted citation weighted publications, also normalized to have zero mean and astandard deviation of one. # of Dismissals * 1926 is equal to the number of dismissals between 1933 and 1940 interacted with anindicator that is equal to 1 for observations from 1926. The other interactions are defined accordingly. The excluded interactionis the number of dismissals with 1931, the last observation before the dismissals. % Destruction * 1926 is equal to percentagedestruction caused by Allied bombings between 1940 and 1945 interacted with an indicator that is equal to 1 for observations from1926. The other interactions are defined accordingly. The excluded interaction is % destruction with 1940, the last observationbefore the bombings. Standard Controls are all controls as reported in column (10) of Table 3, i.e. Department FE, Subject*YearFE, Occupation Zones * Post1945, and % City Destruction * Year FE. Länder Dummies * Post45 is a set of dummy variables foreach post-war German federal state (Land) interacted with a post-1945 dummy. Quadratic in Uni. Age is equal to the age of theuniversity in each year and its square. # of Deps. Within 50km measures the number of departments with the same subject within50 kilometers of each department in each year. Armament Industries (1933) * Year FE is the fraction of firms in a city belongingto each of 3 armament related universities in 1933 (1930 for Austria) interacted with a full set of year fixed effects. The 3 industriesare: iron and steel production, mechanical engineering and vehicle construction, and chemical industry. Fract. Jews (1933) *Post1933 is the fraction of Jews in each city in 1933 interacted with a post 1933 dummy. Dist. to Iron Curtain * Post1945 is thedistance to the iron curtain from each city interacted with a post-1945 dummy.
37
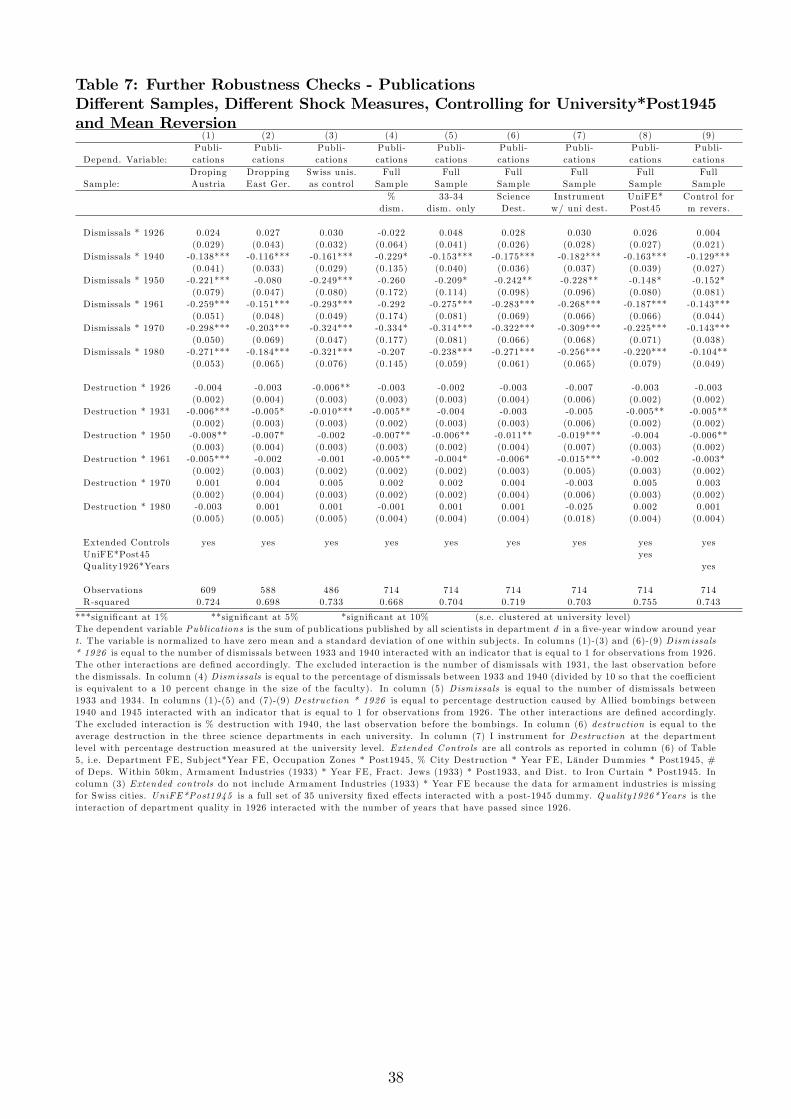
Table 7: Further Robustness Checks - PublicationsDifferent Samples, Different Shock Measures, Controlling for University*Post1945and Mean Reversion
(1) (2) (3) (4) (5) (6) (7) (8) (9)Publi- Publi- Publi- Publi- Publi- Publi- Publi- Publi- Publi-
Depend. Variable: cations cations cations cations cations cations cations cations cationsDroping Dropping Swiss unis. Full Full Full Full Full Full
Sample: Austria East Ger. as control Sample Sample Sample Sample Sample Sample% 33-34 Science Instrument UniFE* Control for
dism. dism. only Dest. w/ uni dest. Post45 m revers.
Dismissals * 1926 0.024 0.027 0.030 -0.022 0.048 0.028 0.030 0.026 0.004(0.029) (0.043) (0.032) (0.064) (0.041) (0.026) (0.028) (0.027) (0.021)
Dismissals * 1940 -0.138*** -0.116*** -0.161*** -0.229* -0.153*** -0.175*** -0.182*** -0.163*** -0.129***(0.041) (0.033) (0.029) (0.135) (0.040) (0.036) (0.037) (0.039) (0.027)
Dismissals * 1950 -0.221*** -0.080 -0.249*** -0.260 -0.209* -0.242** -0.228** -0.148* -0.152*(0.079) (0.047) (0.080) (0.172) (0.114) (0.098) (0.096) (0.080) (0.081)
Dismissals * 1961 -0.259*** -0.151*** -0.293*** -0.292 -0.275*** -0.283*** -0.268*** -0.187*** -0.143***(0.051) (0.048) (0.049) (0.174) (0.081) (0.069) (0.066) (0.066) (0.044)
Dismissals * 1970 -0.298*** -0.203*** -0.324*** -0.334* -0.314*** -0.322*** -0.309*** -0.225*** -0.143***(0.050) (0.069) (0.047) (0.177) (0.081) (0.066) (0.068) (0.071) (0.038)
Dismissals * 1980 -0.271*** -0.184*** -0.321*** -0.207 -0.238*** -0.271*** -0.256*** -0.220*** -0.104**(0.053) (0.065) (0.076) (0.145) (0.059) (0.061) (0.065) (0.079) (0.049)
Destruction * 1926 -0.004 -0.003 -0.006** -0.003 -0.002 -0.003 -0.007 -0.003 -0.003(0.002) (0.004) (0.003) (0.003) (0.003) (0.004) (0.006) (0.002) (0.002)
Destruction * 1931 -0.006*** -0.005* -0.010*** -0.005** -0.004 -0.003 -0.005 -0.005** -0.005**(0.002) (0.003) (0.003) (0.002) (0.003) (0.003) (0.006) (0.002) (0.002)
Destruction * 1950 -0.008** -0.007* -0.002 -0.007** -0.006** -0.011** -0.019*** -0.004 -0.006**(0.003) (0.004) (0.003) (0.003) (0.002) (0.004) (0.007) (0.003) (0.002)
Destruction * 1961 -0.005*** -0.002 -0.001 -0.005** -0.004* -0.006* -0.015*** -0.002 -0.003*(0.002) (0.003) (0.002) (0.002) (0.002) (0.003) (0.005) (0.003) (0.002)
Destruction * 1970 0.001 0.004 0.005 0.002 0.002 0.004 -0.003 0.005 0.003(0.002) (0.004) (0.003) (0.002) (0.002) (0.004) (0.006) (0.003) (0.002)
Destruction * 1980 -0.003 0.001 0.001 -0.001 0.001 0.001 -0.025 0.002 0.001(0.005) (0.005) (0.005) (0.004) (0.004) (0.004) (0.018) (0.004) (0.004)
Extended Controls yes yes yes yes yes yes yes yes yesUniFE*Post45 yesQuality1926*Years yes
Observations 609 588 486 714 714 714 714 714 714R-squared 0.724 0.698 0.733 0.668 0.704 0.719 0.703 0.755 0.743
***significant at 1% **significant at 5% *significant at 10% (s.e. clustered at university level)The dependent variable Publications is the sum of publications published by all scientists in department d in a five-year window around yeart. The variable is normalized to have zero mean and a standard deviation of one within sub jects. In columns (1)-(3) and (6)-(9) Dismissals* 1926 is equal to the number of dismissals between 1933 and 1940 interacted with an indicator that is equal to 1 for observations from 1926.The other interactions are defined accordingly. The excluded interaction is the number of dismissals with 1931, the last observation beforethe dismissals. In column (4) Dismissals is equal to the percentage of dismissals between 1933 and 1940 (divided by 10 so that the coeffi cientis equivalent to a 10 percent change in the size of the faculty). In column (5) Dismissals is equal to the number of dismissals between1933 and 1934. In columns (1)-(5) and (7)-(9) Destruction * 1926 is equal to percentage destruction caused by Allied bombings between1940 and 1945 interacted with an indicator that is equal to 1 for observations from 1926. The other interactions are defined accordingly.The excluded interaction is % destruction with 1940, the last observation before the bombings. In column (6) destruction is equal to theaverage destruction in the three science departments in each university. In column (7) I instrument for Destruction at the departmentlevel with percentage destruction measured at the university level. Extended Controls are all controls as reported in column (6) of Table5, i.e. Department FE, Sub ject*Year FE, Occupation Zones * Post1945, % City Destruction * Year FE, Länder Dummies * Post1945, #of Deps. Within 50km, Armament Industries (1933) * Year FE, Fract. Jews (1933) * Post1933, and Dist. to Iron Curtain * Post1945. Incolumn (3) Extended controls do not include Armament Industries (1933) * Year FE because the data for armament industries is missingfor Swiss cities. UniFE*Post1945 is a full set of 35 university fixed effects interacted with a post-1945 dummy. Quality1926*Years is theinteraction of department quality in 1926 interacted with the number of years that have passed since 1926.
38
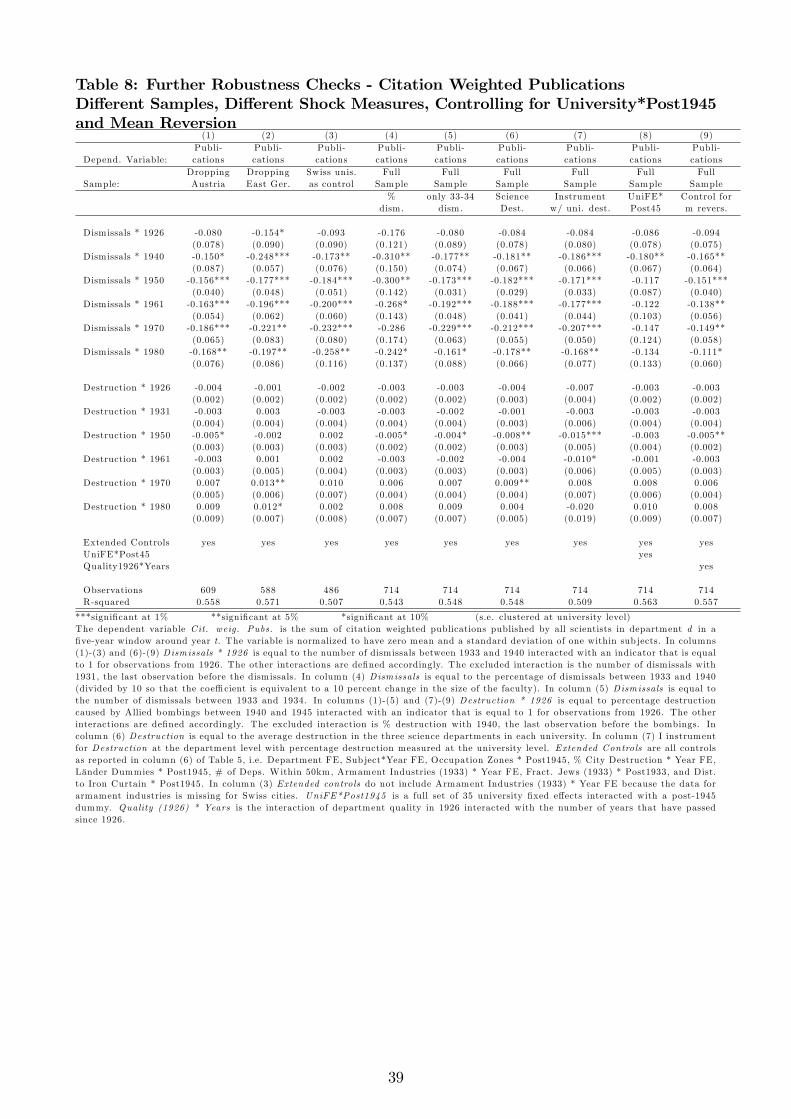
Table 8: Further Robustness Checks - Citation Weighted PublicationsDifferent Samples, Different Shock Measures, Controlling for University*Post1945and Mean Reversion
(1) (2) (3) (4) (5) (6) (7) (8) (9)Publi- Publi- Publi- Publi- Publi- Publi- Publi- Publi- Publi-
Depend. Variable: cations cations cations cations cations cations cations cations cationsDropping Dropping Swiss unis. Full Full Full Full Full Full
Sample: Austria East Ger. as control Sample Sample Sample Sample Sample Sample% only 33-34 Science Instrument UniFE* Control for
dism. dism. Dest. w/ uni. dest. Post45 m revers.
Dismissals * 1926 -0.080 -0.154* -0.093 -0.176 -0.080 -0.084 -0.084 -0.086 -0.094(0.078) (0.090) (0.090) (0.121) (0.089) (0.078) (0.080) (0.078) (0.075)
Dismissals * 1940 -0.150* -0.248*** -0.173** -0.310** -0.177** -0.181** -0.186*** -0.180** -0.165**(0.087) (0.057) (0.076) (0.150) (0.074) (0.067) (0.066) (0.067) (0.064)
Dismissals * 1950 -0.156*** -0.177*** -0.184*** -0.300** -0.173*** -0.182*** -0.171*** -0.117 -0.151***(0.040) (0.048) (0.051) (0.142) (0.031) (0.029) (0.033) (0.087) (0.040)
Dismissals * 1961 -0.163*** -0.196*** -0.200*** -0.268* -0.192*** -0.188*** -0.177*** -0.122 -0.138**(0.054) (0.062) (0.060) (0.143) (0.048) (0.041) (0.044) (0.103) (0.056)
Dismissals * 1970 -0.186*** -0.221** -0.232*** -0.286 -0.229*** -0.212*** -0.207*** -0.147 -0.149**(0.065) (0.083) (0.080) (0.174) (0.063) (0.055) (0.050) (0.124) (0.058)
Dismissals * 1980 -0.168** -0.197** -0.258** -0.242* -0.161* -0.178** -0.168** -0.134 -0.111*(0.076) (0.086) (0.116) (0.137) (0.088) (0.066) (0.077) (0.133) (0.060)
Destruction * 1926 -0.004 -0.001 -0.002 -0.003 -0.003 -0.004 -0.007 -0.003 -0.003(0.002) (0.002) (0.002) (0.002) (0.002) (0.003) (0.004) (0.002) (0.002)
Destruction * 1931 -0.003 0.003 -0.003 -0.003 -0.002 -0.001 -0.003 -0.003 -0.003(0.004) (0.004) (0.004) (0.004) (0.004) (0.003) (0.006) (0.004) (0.004)
Destruction * 1950 -0.005* -0.002 0.002 -0.005* -0.004* -0.008** -0.015*** -0.003 -0.005**(0.003) (0.003) (0.003) (0.002) (0.002) (0.003) (0.005) (0.004) (0.002)
Destruction * 1961 -0.003 0.001 0.002 -0.003 -0.002 -0.004 -0.010* -0.001 -0.003(0.003) (0.005) (0.004) (0.003) (0.003) (0.003) (0.006) (0.005) (0.003)
Destruction * 1970 0.007 0.013** 0.010 0.006 0.007 0.009** 0.008 0.008 0.006(0.005) (0.006) (0.007) (0.004) (0.004) (0.004) (0.007) (0.006) (0.004)
Destruction * 1980 0.009 0.012* 0.002 0.008 0.009 0.004 -0.020 0.010 0.008(0.009) (0.007) (0.008) (0.007) (0.007) (0.005) (0.019) (0.009) (0.007)
Extended Controls yes yes yes yes yes yes yes yes yesUniFE*Post45 yesQuality1926*Years yes
Observations 609 588 486 714 714 714 714 714 714R-squared 0.558 0.571 0.507 0.543 0.548 0.548 0.509 0.563 0.557
***significant at 1% **significant at 5% *significant at 10% (s.e. clustered at university level)The dependent variable Cit. weig. Pubs. is the sum of citation weighted publications published by all scientists in department d in afive-year window around year t. The variable is normalized to have zero mean and a standard deviation of one within sub jects. In columns(1)-(3) and (6)-(9) Dismissals * 1926 is equal to the number of dismissals between 1933 and 1940 interacted with an indicator that is equalto 1 for observations from 1926. The other interactions are defined accordingly. The excluded interaction is the number of dismissals with1931, the last observation before the dismissals. In column (4) Dismissals is equal to the percentage of dismissals between 1933 and 1940(divided by 10 so that the coeffi cient is equivalent to a 10 percent change in the size of the faculty). In column (5) Dismissals is equal tothe number of dismissals between 1933 and 1934. In columns (1)-(5) and (7)-(9) Destruction * 1926 is equal to percentage destructioncaused by Allied bombings between 1940 and 1945 interacted with an indicator that is equal to 1 for observations from 1926. The otherinteractions are defined accordingly. The excluded interaction is % destruction with 1940, the last observation before the bombings. Incolumn (6) Destruction is equal to the average destruction in the three science departments in each university. In column (7) I instrumentfor Destruction at the department level with percentage destruction measured at the university level. Extended Controls are all controlsas reported in column (6) of Table 5, i.e. Department FE, Sub ject*Year FE, Occupation Zones * Post1945, % City Destruction * Year FE,Länder Dummies * Post1945, # of Deps. Within 50km, Armament Industries (1933) * Year FE, Fract. Jews (1933) * Post1933, and Dist.to Iron Curtain * Post1945. In column (3) Extended controls do not include Armament Industries (1933) * Year FE because the data forarmament industries is missing for Swiss cities. UniFE*Post1945 is a full set of 35 university fixed effects interacted with a post-1945dummy. Quality (1926) * Years is the interaction of department quality in 1926 interacted with the number of years that have passedsince 1926.
39
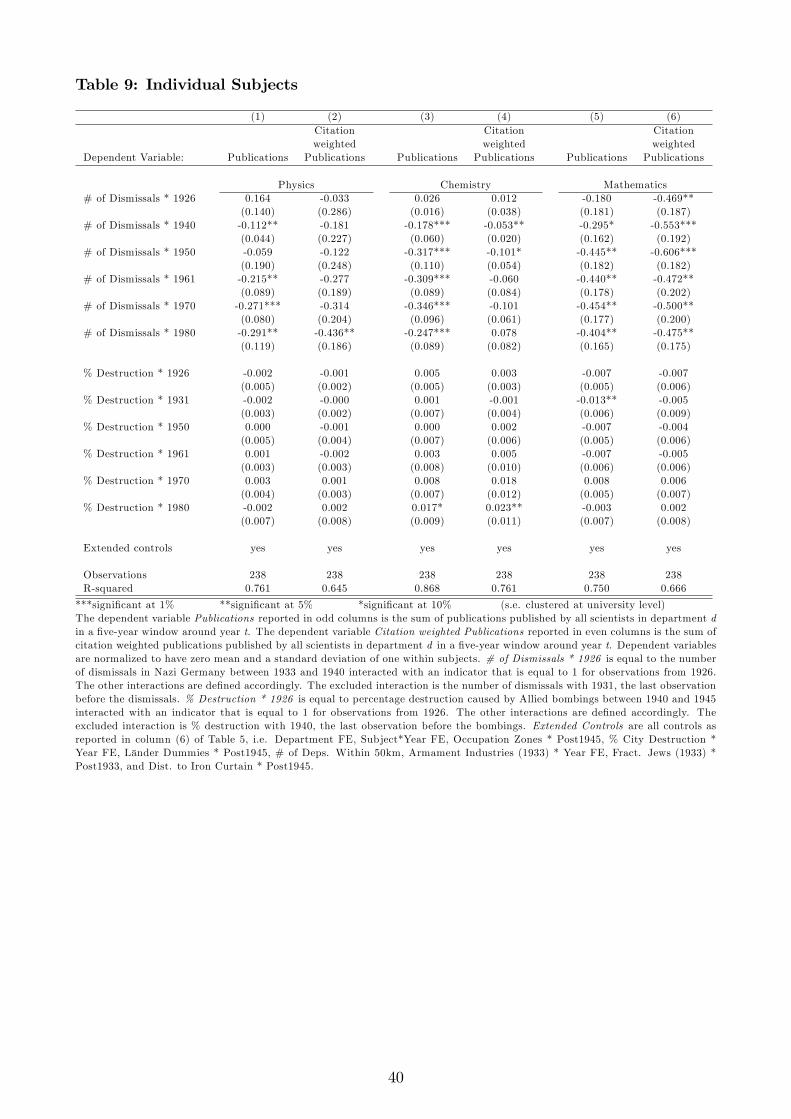
Table 9: Individual Subjects
(1) (2) (3) (4) (5) (6)Citation Citation Citationweighted weighted weighted
Dependent Variable: Publications Publications Publications Publications Publications Publications
Physics Chemistry Mathematics# of Dismissals * 1926 0.164 -0.033 0.026 0.012 -0.180 -0.469**
(0.140) (0.286) (0.016) (0.038) (0.181) (0.187)# of Dismissals * 1940 -0.112** -0.181 -0.178*** -0.053** -0.295* -0.553***
(0.044) (0.227) (0.060) (0.020) (0.162) (0.192)# of Dismissals * 1950 -0.059 -0.122 -0.317*** -0.101* -0.445** -0.606***
(0.190) (0.248) (0.110) (0.054) (0.182) (0.182)# of Dismissals * 1961 -0.215** -0.277 -0.309*** -0.060 -0.440** -0.472**
(0.089) (0.189) (0.089) (0.084) (0.178) (0.202)# of Dismissals * 1970 -0.271*** -0.314 -0.346*** -0.101 -0.454** -0.500**
(0.080) (0.204) (0.096) (0.061) (0.177) (0.200)# of Dismissals * 1980 -0.291** -0.436** -0.247*** 0.078 -0.404** -0.475**
(0.119) (0.186) (0.089) (0.082) (0.165) (0.175)
% Destruction * 1926 -0.002 -0.001 0.005 0.003 -0.007 -0.007(0.005) (0.002) (0.005) (0.003) (0.005) (0.006)
% Destruction * 1931 -0.002 -0.000 0.001 -0.001 -0.013** -0.005(0.003) (0.002) (0.007) (0.004) (0.006) (0.009)
% Destruction * 1950 0.000 -0.001 0.000 0.002 -0.007 -0.004(0.005) (0.004) (0.007) (0.006) (0.005) (0.006)
% Destruction * 1961 0.001 -0.002 0.003 0.005 -0.007 -0.005(0.003) (0.003) (0.008) (0.010) (0.006) (0.006)
% Destruction * 1970 0.003 0.001 0.008 0.018 0.008 0.006(0.004) (0.003) (0.007) (0.012) (0.005) (0.007)
% Destruction * 1980 -0.002 0.002 0.017* 0.023** -0.003 0.002(0.007) (0.008) (0.009) (0.011) (0.007) (0.008)
Extended controls yes yes yes yes yes yes
Observations 238 238 238 238 238 238R-squared 0.761 0.645 0.868 0.761 0.750 0.666
***significant at 1% **significant at 5% *significant at 10% (s.e. clustered at university level)The dependent variable Publications reported in odd columns is the sum of publications published by all scientists in department din a five-year window around year t. The dependent variable Citation weighted Publications reported in even columns is the sum ofcitation weighted publications published by all scientists in department d in a five-year window around year t. Dependent variablesare normalized to have zero mean and a standard deviation of one within subjects. # of Dismissals * 1926 is equal to the numberof dismissals in Nazi Germany between 1933 and 1940 interacted with an indicator that is equal to 1 for observations from 1926.The other interactions are defined accordingly. The excluded interaction is the number of dismissals with 1931, the last observationbefore the dismissals. % Destruction * 1926 is equal to percentage destruction caused by Allied bombings between 1940 and 1945interacted with an indicator that is equal to 1 for observations from 1926. The other interactions are defined accordingly. Theexcluded interaction is % destruction with 1940, the last observation before the bombings. Extended Controls are all controls asreported in column (6) of Table 5, i.e. Department FE, Subject*Year FE, Occupation Zones * Post1945, % City Destruction *Year FE, Länder Dummies * Post1945, # of Deps. Within 50km, Armament Industries (1933) * Year FE, Fract. Jews (1933) *Post1933, and Dist. to Iron Curtain * Post1945.
40
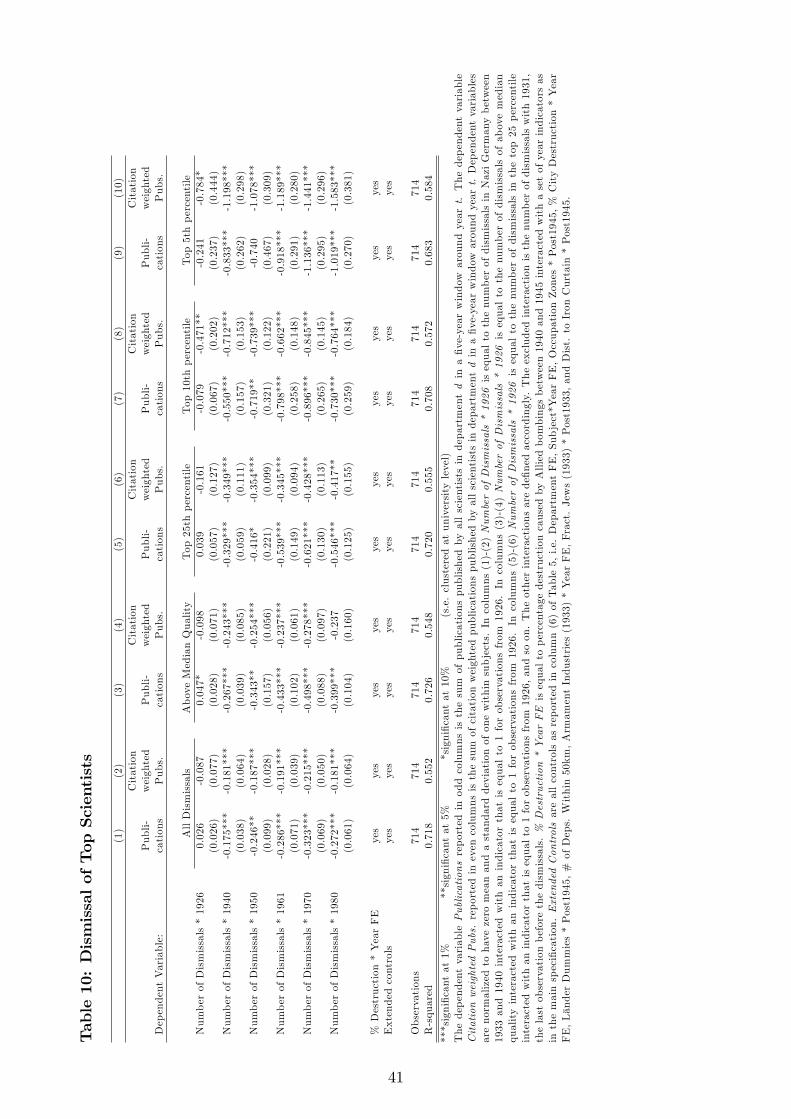
Table10:DismissalofTop
Scientists
(1)
(2)
(3)
(4)
(5)
(6)
(7)
(8)
(9)
(10)
Citation
Citation
Citation
Citation
Citation
Publi-
weighted
Publi-
weighted
Publi-
weighted
Publi-
weighted
Publi-
weighted
DependentVariable:
cations
Pubs.
cations
Pubs.
cations
Pubs.
cations
Pubs.
cations
Pubs.
AllDismissals
AboveMedianQuality
Top25thpercentile
Top10thpercentile
Top5thpercentile
NumberofDismissals*1926
0.026
-0.087
0.047*
-0.098
0.039
-0.161
-0.079
-0.471**
-0.241
-0.784*
(0.026)
(0.077)
(0.028)
(0.071)
(0.057)
(0.127)
(0.067)
(0.202)
(0.237)
(0.444)
NumberofDismissals*1940
-0.175***
-0.181***
-0.267***
-0.243***
-0.329***
-0.349***
-0.550***
-0.712***
-0.833***
-1.198***
(0.038)
(0.064)
(0.039)
(0.085)
(0.059)
(0.111)
(0.157)
(0.153)
(0.262)
(0.298)
NumberofDismissals*1950
-0.246**
-0.187***
-0.343**
-0.254***
-0.416*
-0.354***
-0.719**
-0.739***
-0.740
-1.078***
(0.099)
(0.028)
(0.157)
(0.056)
(0.221)
(0.099)
(0.321)
(0.122)
(0.467)
(0.309)
NumberofDismissals*1961
-0.286***
-0.191***
-0.433***
-0.237***
-0.539***
-0.345***
-0.798***
-0.662***
-0.918***
-1.189***
(0.071)
(0.039)
(0.102)
(0.061)
(0.149)
(0.094)
(0.258)
(0.148)
(0.291)
(0.280)
NumberofDismissals*1970
-0.323***
-0.215***
-0.498***
-0.278***
-0.621***
-0.428***
-0.896***
-0.845***
-1.136***
-1.441***
(0.069)
(0.050)
(0.088)
(0.097)
(0.130)
(0.113)
(0.265)
(0.145)
(0.295)
(0.296)
NumberofDismissals*1980
-0.272***
-0.181***
-0.399***
-0.237
-0.546***
-0.417**
-0.730***
-0.764***
-1.019***
-1.583***
(0.061)
(0.064)
(0.104)
(0.160)
(0.125)
(0.155)
(0.259)
(0.184)
(0.270)
(0.381)
%Destruction*YearFE
yes
yes
yes
yes
yes
yes
yes
yes
yes
yes
Extendedcontrols
yes
yes
yes
yes
yes
yes
yes
yes
yes
yes
Observations
714
714
714
714
714
714
714
714
714
714
R-squared
0.718
0.552
0.726
0.548
0.720
0.555
0.708
0.572
0.683
0.584
***significantat1%
**significantat5%
*significantat10%
(s.e.clusteredatuniversitylevel)
ThedependentvariablePublicationsreportedinoddcolumnsisthesumofpublicationspublishedby
allscientistsindepartmentdinafive-yearwindow
aroundyeart.Thedependentvariable
CitationweightedPubs.reportedinevencolumnsisthesumofcitationweightedpublicationspublishedbyallscientistsindepartmentdinafive-yearwindow
aroundyeart.Dependentvariables
arenormalizedtohavezeromeanandastandarddeviationofonewithinsubjects.Incolumns(1)-(2)NumberofDismissals*1926
isequaltothenumberofdismissalsinNaziGermanybetween
1933and1940interactedwithan
indicatorthatisequalto1forobservationsfrom
1926.Incolumns(3)-(4)NumberofDismissals*1926
isequaltothenumberofdismissalsofabovemedian
qualityinteractedwithan
indicatorthatisequalto1forobservationsfrom
1926.Incolumns(5)-(6)NumberofDismissals*1926
isequaltothenumberofdismissalsinthetop25percentile
interactedwithanindicatorthatisequalto1forobservationsfrom
1926,andsoon.Theotherinteractionsaredefinedaccordingly.Theexcludedinteractionisthenumberofdismissalswith1931,
thelastobservationbeforethedismissals.%Destruction*YearFEisequaltopercentagedestructioncausedbyAlliedbombingsbetween1940and1945interactedwithasetofyearindicatorsas
inthemainspecification.ExtendedControlsareallcontrolsasreportedincolumn(6)ofTable5,i.e.DepartmentFE,Subject*YearFE,OccupationZones*Post1945,%CityDestruction*Year
FE,LänderDummies*Post1945,#ofDeps.Within50km,ArmamentIndustries(1933)*YearFE,Fract.Jews(1933)*Post1933,andDist.toIronCurtain*Post1945.
41
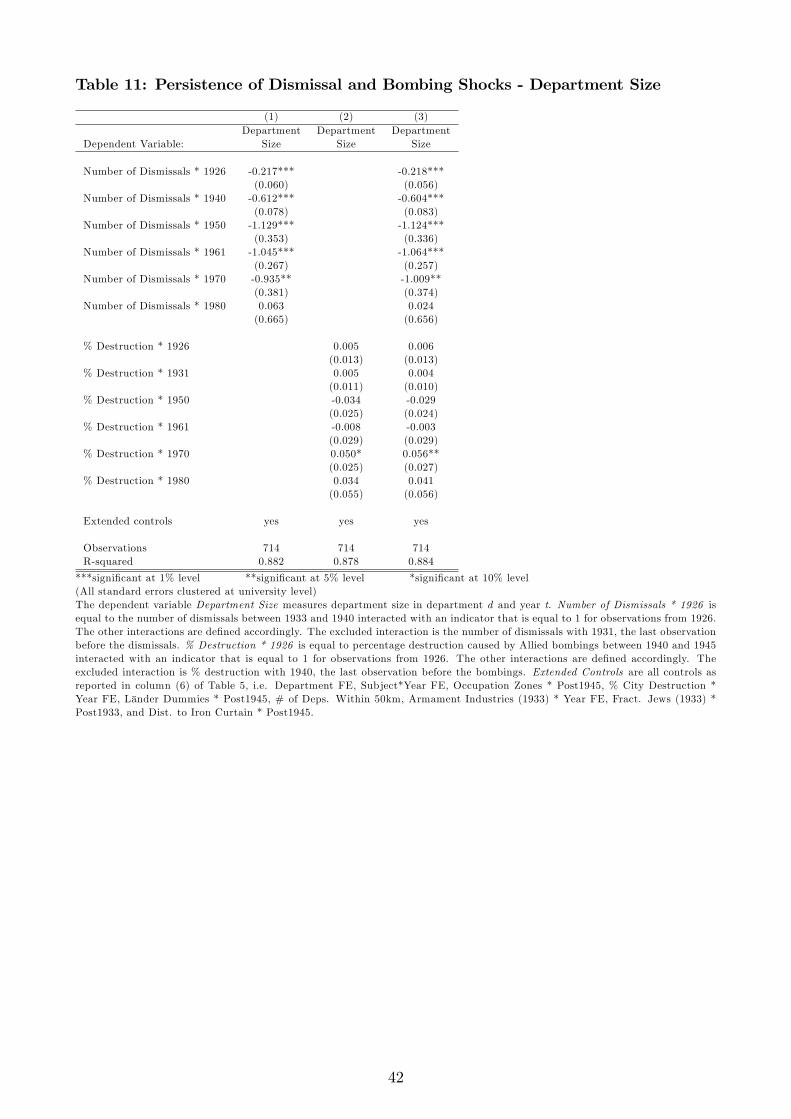
Table 11: Persistence of Dismissal and Bombing Shocks - Department Size
(1) (2) (3)Department Department Department
Dependent Variable: Size Size Size
Number of Dismissals * 1926 -0.217*** -0.218***(0.060) (0.056)
Number of Dismissals * 1940 -0.612*** -0.604***(0.078) (0.083)
Number of Dismissals * 1950 -1.129*** -1.124***(0.353) (0.336)
Number of Dismissals * 1961 -1.045*** -1.064***(0.267) (0.257)
Number of Dismissals * 1970 -0.935** -1.009**(0.381) (0.374)
Number of Dismissals * 1980 0.063 0.024(0.665) (0.656)
% Destruction * 1926 0.005 0.006(0.013) (0.013)
% Destruction * 1931 0.005 0.004(0.011) (0.010)
% Destruction * 1950 -0.034 -0.029(0.025) (0.024)
% Destruction * 1961 -0.008 -0.003(0.029) (0.029)
% Destruction * 1970 0.050* 0.056**(0.025) (0.027)
% Destruction * 1980 0.034 0.041(0.055) (0.056)
Extended controls yes yes yes
Observations 714 714 714R-squared 0.882 0.878 0.884
***significant at 1% level **significant at 5% level *significant at 10% level(All standard errors clustered at university level)The dependent variable Department Size measures department size in department d and year t. Number of Dismissals * 1926 isequal to the number of dismissals between 1933 and 1940 interacted with an indicator that is equal to 1 for observations from 1926.The other interactions are defined accordingly. The excluded interaction is the number of dismissals with 1931, the last observationbefore the dismissals. % Destruction * 1926 is equal to percentage destruction caused by Allied bombings between 1940 and 1945interacted with an indicator that is equal to 1 for observations from 1926. The other interactions are defined accordingly. Theexcluded interaction is % destruction with 1940, the last observation before the bombings. Extended Controls are all controls asreported in column (6) of Table 5, i.e. Department FE, Subject*Year FE, Occupation Zones * Post1945, % City Destruction *Year FE, Länder Dummies * Post1945, # of Deps. Within 50km, Armament Industries (1933) * Year FE, Fract. Jews (1933) *Post1933, and Dist. to Iron Curtain * Post1945.
42
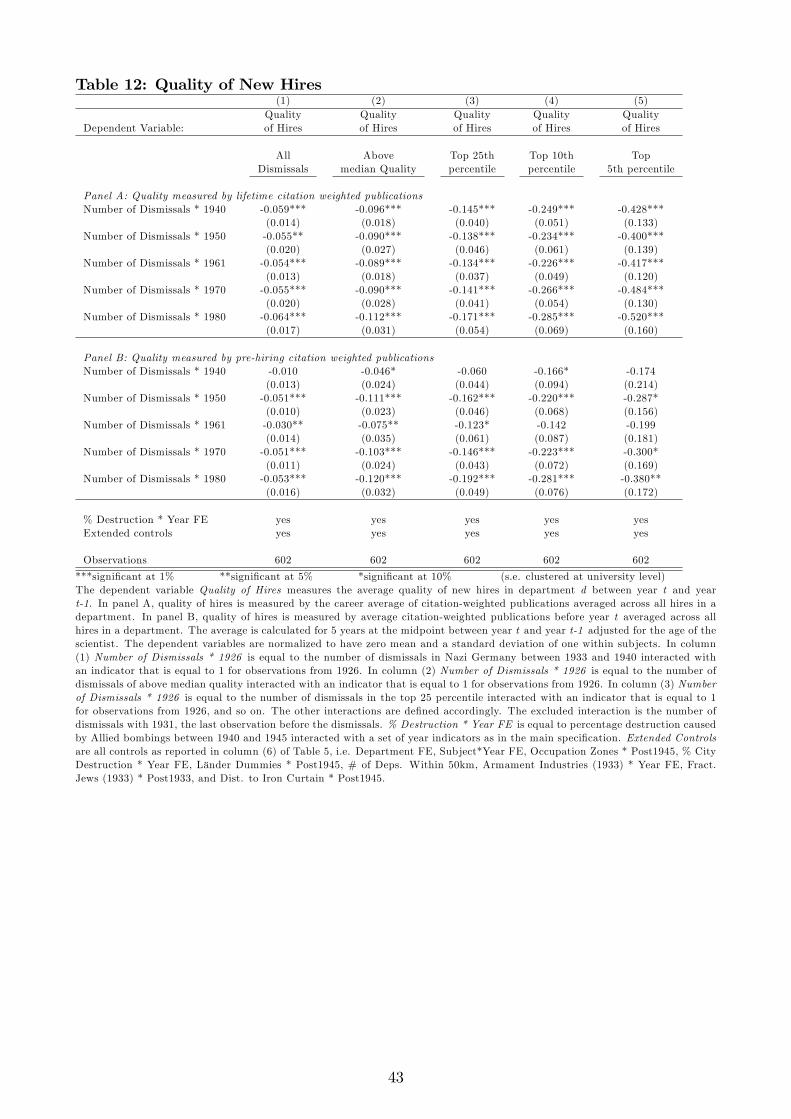
Table 12: Quality of New Hires(1) (2) (3) (4) (5)
Quality Quality Quality Quality QualityDependent Variable: of Hires of Hires of Hires of Hires of Hires
All Above Top 25th Top 10th TopDismissals median Quality percentile percentile 5th percentile
Panel A: Quality measured by lifetime citation weighted publicationsNumber of Dismissals * 1940 -0.059*** -0.096*** -0.145*** -0.249*** -0.428***
(0.014) (0.018) (0.040) (0.051) (0.133)Number of Dismissals * 1950 -0.055** -0.090*** -0.138*** -0.234*** -0.400***
(0.020) (0.027) (0.046) (0.061) (0.139)Number of Dismissals * 1961 -0.054*** -0.089*** -0.134*** -0.226*** -0.417***
(0.013) (0.018) (0.037) (0.049) (0.120)Number of Dismissals * 1970 -0.055*** -0.090*** -0.141*** -0.266*** -0.484***
(0.020) (0.028) (0.041) (0.054) (0.130)Number of Dismissals * 1980 -0.064*** -0.112*** -0.171*** -0.285*** -0.520***
(0.017) (0.031) (0.054) (0.069) (0.160)
Panel B: Quality measured by pre-hiring citation weighted publicationsNumber of Dismissals * 1940 -0.010 -0.046* -0.060 -0.166* -0.174
(0.013) (0.024) (0.044) (0.094) (0.214)Number of Dismissals * 1950 -0.051*** -0.111*** -0.162*** -0.220*** -0.287*
(0.010) (0.023) (0.046) (0.068) (0.156)Number of Dismissals * 1961 -0.030** -0.075** -0.123* -0.142 -0.199
(0.014) (0.035) (0.061) (0.087) (0.181)Number of Dismissals * 1970 -0.051*** -0.103*** -0.146*** -0.223*** -0.300*
(0.011) (0.024) (0.043) (0.072) (0.169)Number of Dismissals * 1980 -0.053*** -0.120*** -0.192*** -0.281*** -0.380**
(0.016) (0.032) (0.049) (0.076) (0.172)
% Destruction * Year FE yes yes yes yes yesExtended controls yes yes yes yes yes
Observations 602 602 602 602 602
***significant at 1% **significant at 5% *significant at 10% (s.e. clustered at university level)The dependent variable Quality of Hires measures the average quality of new hires in department d between year t and yeart-1. In panel A, quality of hires is measured by the career average of citation-weighted publications averaged across all hires in adepartment. In panel B, quality of hires is measured by average citation-weighted publications before year t averaged across allhires in a department. The average is calculated for 5 years at the midpoint between year t and year t-1 adjusted for the age of thescientist. The dependent variables are normalized to have zero mean and a standard deviation of one within subjects. In column(1) Number of Dismissals * 1926 is equal to the number of dismissals in Nazi Germany between 1933 and 1940 interacted withan indicator that is equal to 1 for observations from 1926. In column (2) Number of Dismissals * 1926 is equal to the number ofdismissals of above median quality interacted with an indicator that is equal to 1 for observations from 1926. In column (3) Numberof Dismissals * 1926 is equal to the number of dismissals in the top 25 percentile interacted with an indicator that is equal to 1for observations from 1926, and so on. The other interactions are defined accordingly. The excluded interaction is the number ofdismissals with 1931, the last observation before the dismissals. % Destruction * Year FE is equal to percentage destruction causedby Allied bombings between 1940 and 1945 interacted with a set of year indicators as in the main specification. Extended Controlsare all controls as reported in column (6) of Table 5, i.e. Department FE, Subject*Year FE, Occupation Zones * Post1945, % CityDestruction * Year FE, Länder Dummies * Post1945, # of Deps. Within 50km, Armament Industries (1933) * Year FE, Fract.Jews (1933) * Post1933, and Dist. to Iron Curtain * Post1945.
43
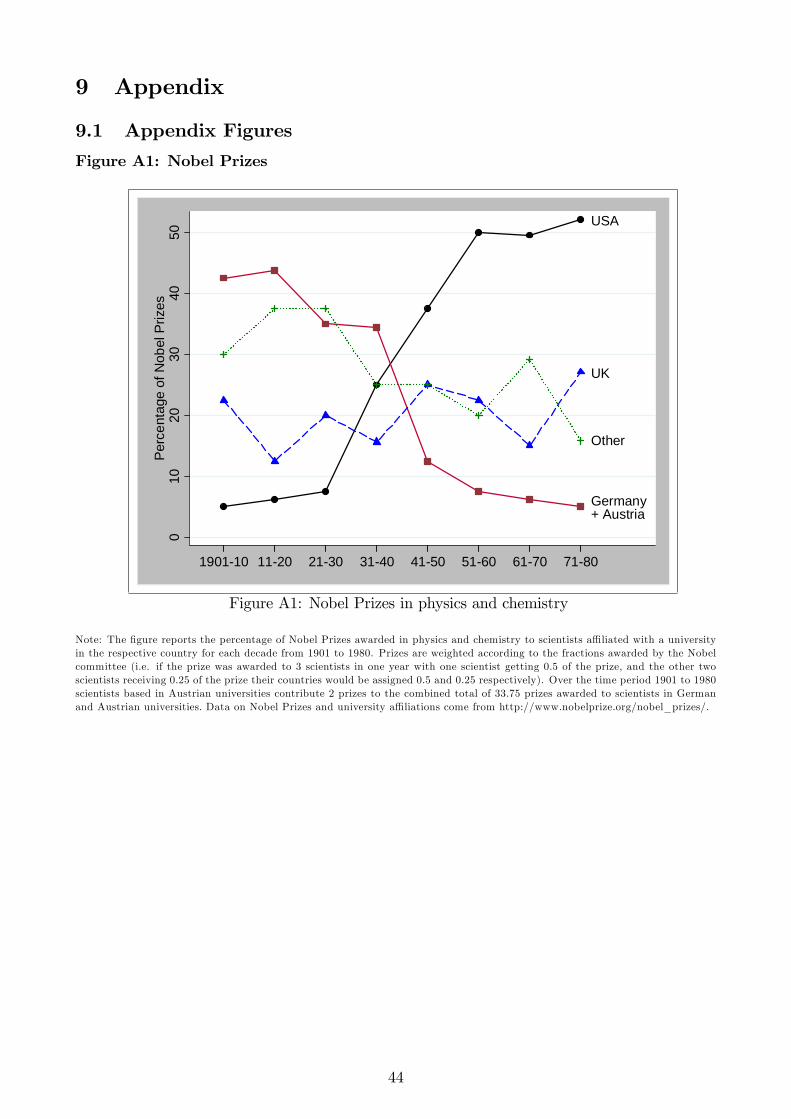
9 Appendix
9.1 Appendix Figures
Figure A1: Nobel Prizes
USA
Germany+ Austria
UK
Other
010
2030
4050
Perc
enta
ge o
f Nob
el P
rizes
190110 1120 2130 3140 4150 5160 6170 7180
Figure A1: Nobel Prizes in physics and chemistry
Note: The figure reports the percentage of Nobel Prizes awarded in physics and chemistry to scientists affi liated with a universityin the respective country for each decade from 1901 to 1980. Prizes are weighted according to the fractions awarded by the Nobelcommittee (i.e. if the prize was awarded to 3 scientists in one year with one scientist getting 0.5 of the prize, and the other twoscientists receiving 0.25 of the prize their countries would be assigned 0.5 and 0.25 respectively). Over the time period 1901 to 1980scientists based in Austrian universities contribute 2 prizes to the combined total of 33.75 prizes awarded to scientists in Germanand Austrian universities. Data on Nobel Prizes and university affi liations come from http://www.nobelprize.org/nobel_prizes/.
44
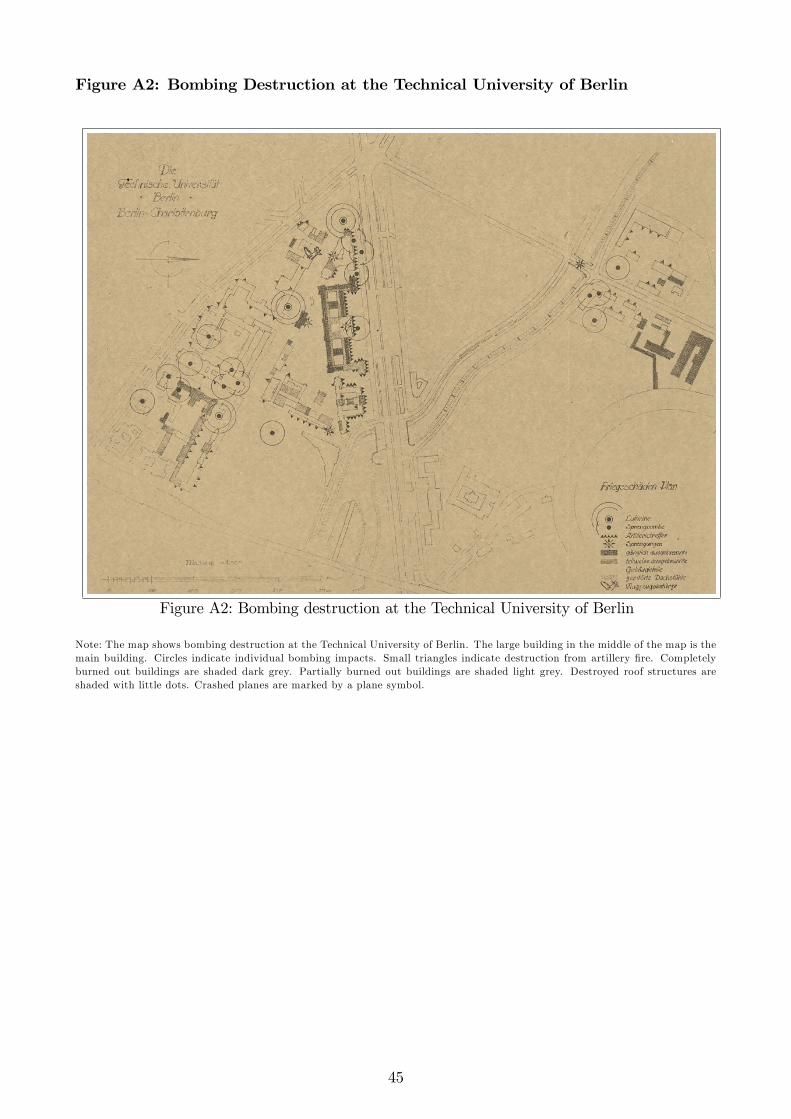
Figure A2: Bombing Destruction at the Technical University of Berlin
Figure A2: Bombing destruction at the Technical University of Berlin
Note: The map shows bombing destruction at the Technical University of Berlin. The large building in the middle of the map is themain building. Circles indicate individual bombing impacts. Small triangles indicate destruction from artillery fire. Completelyburned out buildings are shaded dark grey. Partially burned out buildings are shaded light grey. Destroyed roof structures areshaded with little dots. Crashed planes are marked by a plane symbol.
45
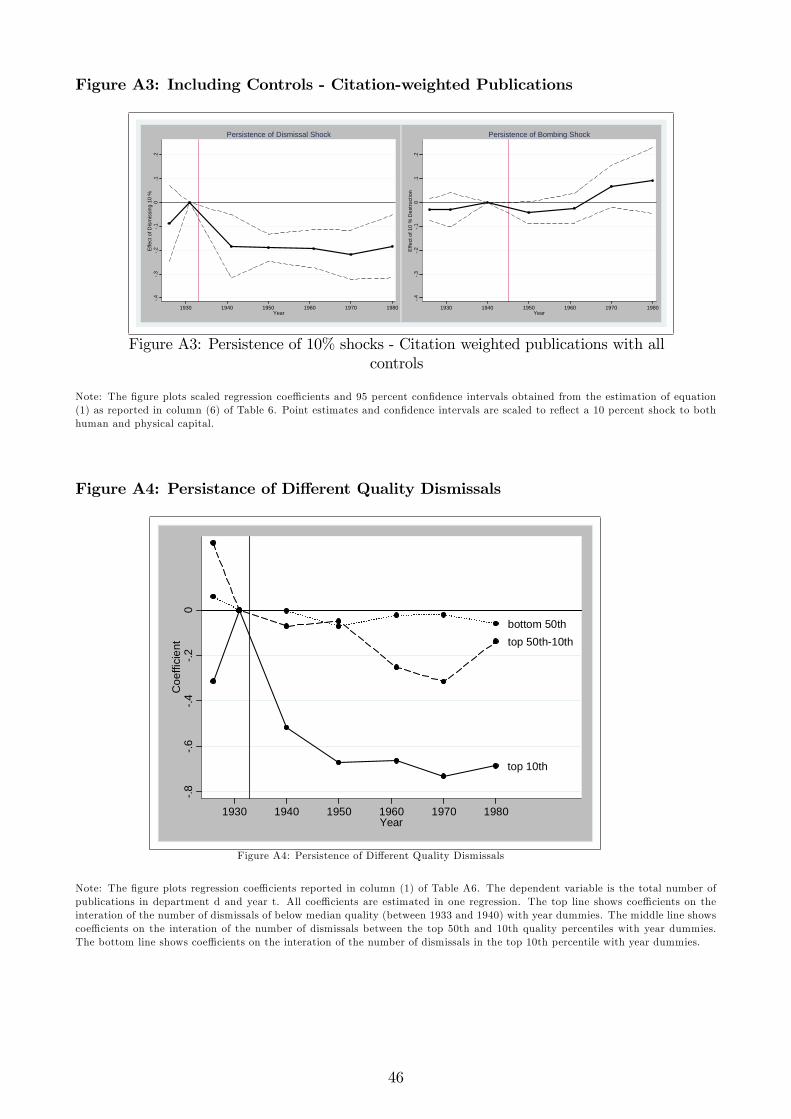
Figure A3: Including Controls - Citation-weighted Publications
.4.3
.2.1
0.1
.2E
ffect
of D
ism
issi
ng 1
0 %
1930 1940 1950 1960 1970 1980Year
Persistence of Dismissal Shock
.4.3
.2.1
0.1
.2E
ffect
of 1
0 %
Des
truct
ion
1930 1940 1950 1960 1970 1980Year
Persistence of Bombing Shock
Figure A3: Persistence of 10% shocks - Citation weighted publications with allcontrols
Note: The figure plots scaled regression coeffi cients and 95 percent confidence intervals obtained from the estimation of equation(1) as reported in column (6) of Table 6. Point estimates and confidence intervals are scaled to reflect a 10 percent shock to bothhuman and physical capital.
Figure A4: Persistance of Different Quality Dismissals
bottom 50thtop 50th10th
top 10th
.8.6
.4.2
0C
oeffi
cien
t
1930 1940 1950 1960 1970 1980Year
Figure A4: Persistence of Different Quality Dismissals
Note: The figure plots regression coeffi cients reported in column (1) of Table A6. The dependent variable is the total number ofpublications in department d and year t. All coeffi cients are estimated in one regression. The top line shows coeffi cients on theinteration of the number of dismissals of below median quality (between 1933 and 1940) with year dummies. The middle line showscoeffi cients on the interation of the number of dismissals between the top 50th and 10th quality percentiles with year dummies.The bottom line shows coeffi cients on the interation of the number of dismissals in the top 10th percentile with year dummies.
46
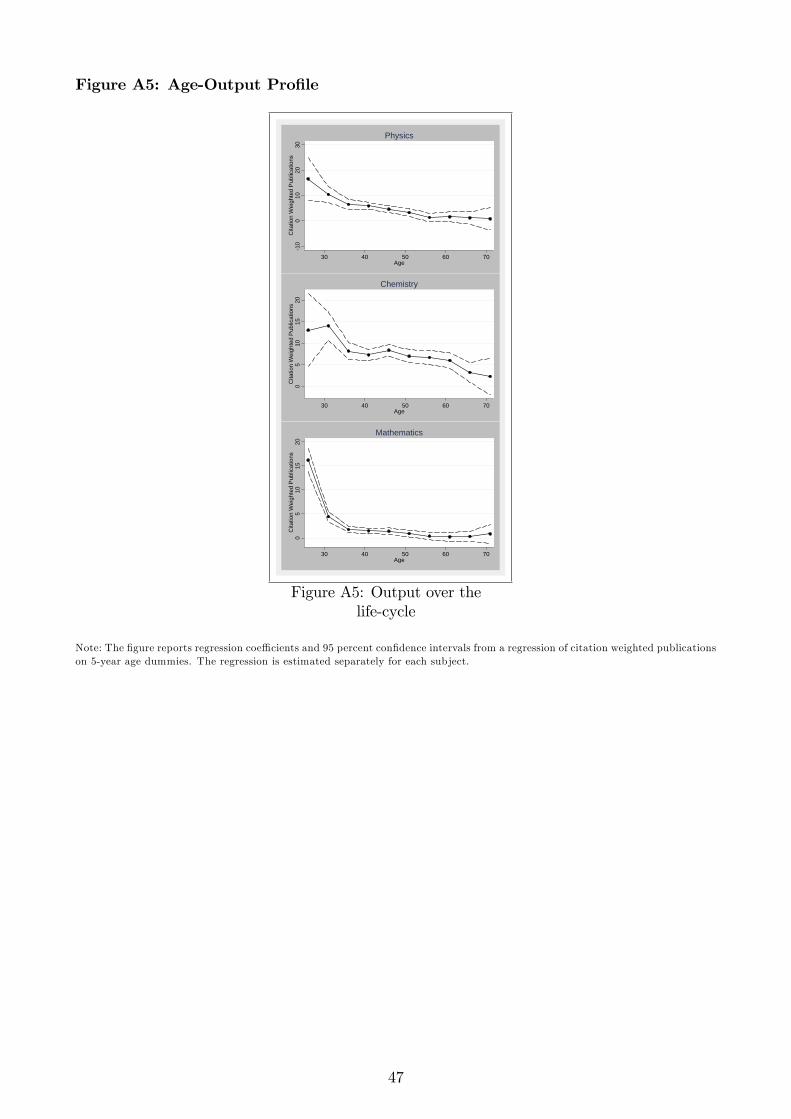
Figure A5: Age-Output Profile
10
010
2030
Cita
tion
Wei
ghte
d P
ublic
atio
ns
30 40 50 60 70Age
Physics
05
1015
20C
itatio
n W
eigh
ted
Pub
licat
ions
30 40 50 60 70Age
Chemistry0
510
1520
Cita
tion
Wei
ghte
d P
ublic
atio
ns
30 40 50 60 70Age
Mathematics
Figure A5: Output over thelife-cycle
Note: The figure reports regression coeffi cients and 95 percent confidence intervals from a regression of citation weighted publicationson 5-year age dummies. The regression is estimated separately for each subject.
47
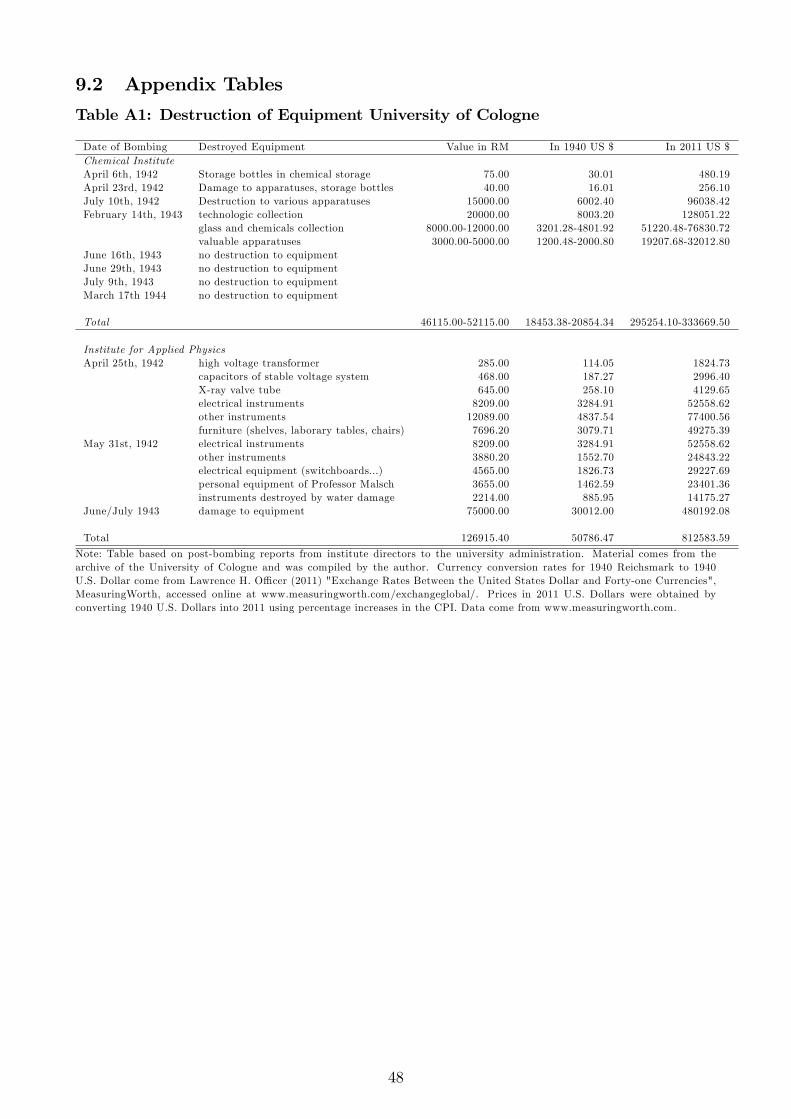
9.2 Appendix Tables
Table A1: Destruction of Equipment University of Cologne
Date of Bombing Destroyed Equipment Value in RM In 1940 US $ In 2011 US $Chemical InstituteApril 6th, 1942 Storage bottles in chemical storage 75.00 30.01 480.19April 23rd, 1942 Damage to apparatuses, storage bottles 40.00 16.01 256.10July 10th, 1942 Destruction to various apparatuses 15000.00 6002.40 96038.42February 14th, 1943 technologic collection 20000.00 8003.20 128051.22
glass and chemicals collection 8000.00-12000.00 3201.28-4801.92 51220.48-76830.72valuable apparatuses 3000.00-5000.00 1200.48-2000.80 19207.68-32012.80
June 16th, 1943 no destruction to equipmentJune 29th, 1943 no destruction to equipmentJuly 9th, 1943 no destruction to equipmentMarch 17th 1944 no destruction to equipment
Total 46115.00-52115.00 18453.38-20854.34 295254.10-333669.50
Institute for Applied PhysicsApril 25th, 1942 high voltage transformer 285.00 114.05 1824.73
capacitors of stable voltage system 468.00 187.27 2996.40X-ray valve tube 645.00 258.10 4129.65electrical instruments 8209.00 3284.91 52558.62other instruments 12089.00 4837.54 77400.56furniture (shelves, laborary tables, chairs) 7696.20 3079.71 49275.39
May 31st, 1942 electrical instruments 8209.00 3284.91 52558.62other instruments 3880.20 1552.70 24843.22electrical equipment (switchboards...) 4565.00 1826.73 29227.69personal equipment of Professor Malsch 3655.00 1462.59 23401.36instruments destroyed by water damage 2214.00 885.95 14175.27
June/July 1943 damage to equipment 75000.00 30012.00 480192.08
Total 126915.40 50786.47 812583.59
Note: Table based on post-bombing reports from institute directors to the university administration. Material comes from thearchive of the University of Cologne and was compiled by the author. Currency conversion rates for 1940 Reichsmark to 1940U.S. Dollar come from Lawrence H. Offi cer (2011) "Exchange Rates Between the United States Dollar and Forty-one Currencies",MeasuringWorth, accessed online at www.measuringworth.com/exchangeglobal/. Prices in 2011 U.S. Dollars were obtained byconverting 1940 U.S. Dollars into 2011 using percentage increases in the CPI. Data come from www.measuringworth.com.
48
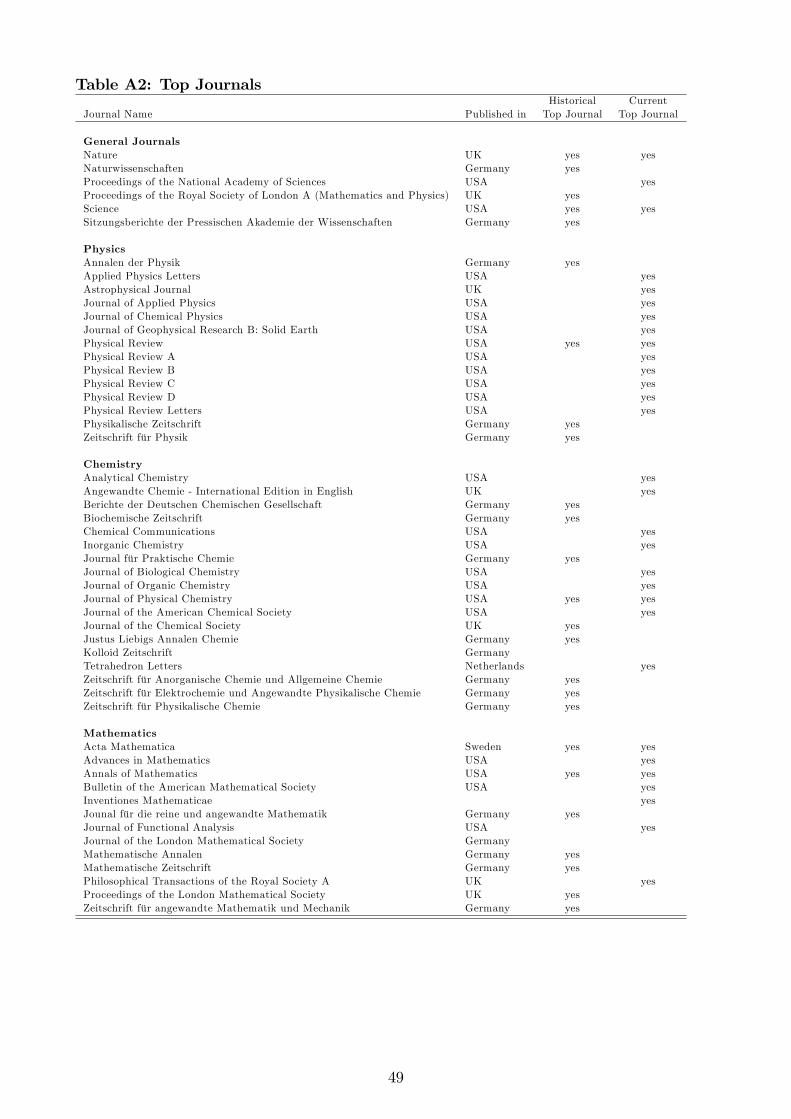
Table A2: Top JournalsHistorical Current
Journal Name Published in Top Journal Top Journal
General JournalsNature UK yes yesNaturwissenschaften Germany yesProceedings of the National Academy of Sciences USA yesProceedings of the Royal Society of London A (Mathematics and Physics) UK yesScience USA yes yesSitzungsberichte der Pressischen Akademie der Wissenschaften Germany yes
PhysicsAnnalen der Physik Germany yesApplied Physics Letters USA yesAstrophysical Journal UK yesJournal of Applied Physics USA yesJournal of Chemical Physics USA yesJournal of Geophysical Research B: Solid Earth USA yesPhysical Review USA yes yesPhysical Review A USA yesPhysical Review B USA yesPhysical Review C USA yesPhysical Review D USA yesPhysical Review Letters USA yesPhysikalische Zeitschrift Germany yesZeitschrift für Physik Germany yes
ChemistryAnalytical Chemistry USA yesAngewandte Chemie - International Edition in English UK yesBerichte der Deutschen Chemischen Gesellschaft Germany yesBiochemische Zeitschrift Germany yesChemical Communications USA yesInorganic Chemistry USA yesJournal für Praktische Chemie Germany yesJournal of Biological Chemistry USA yesJournal of Organic Chemistry USA yesJournal of Physical Chemistry USA yes yesJournal of the American Chemical Society USA yesJournal of the Chemical Society UK yesJustus Liebigs Annalen Chemie Germany yesKolloid Zeitschrift GermanyTetrahedron Letters Netherlands yesZeitschrift für Anorganische Chemie und Allgemeine Chemie Germany yesZeitschrift für Elektrochemie und Angewandte Physikalische Chemie Germany yesZeitschrift für Physikalische Chemie Germany yes
MathematicsActa Mathematica Sweden yes yesAdvances in Mathematics USA yesAnnals of Mathematics USA yes yesBulletin of the American Mathematical Society USA yesInventiones Mathematicae yesJounal für die reine und angewandte Mathematik Germany yesJournal of Functional Analysis USA yesJournal of the London Mathematical Society GermanyMathematische Annalen Germany yesMathematische Zeitschrift Germany yesPhilosophical Transactions of the Royal Society A UK yesProceedings of the London Mathematical Society UK yesZeitschrift für angewandte Mathematik und Mechanik Germany yes
49
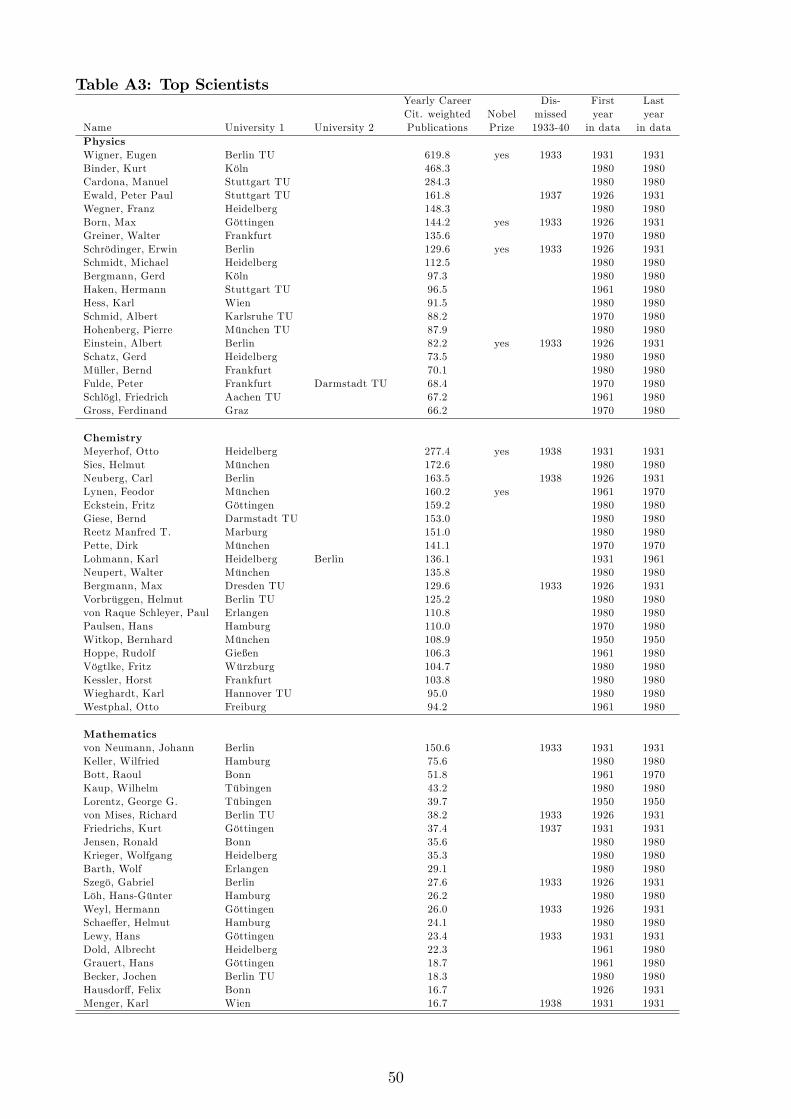
Table A3: Top ScientistsYearly Career Dis- First LastCit. weighted Nobel missed year year
Name University 1 University 2 Publications Prize 1933-40 in data in dataPhysicsWigner, Eugen Berlin TU 619.8 yes 1933 1931 1931Binder, Kurt Köln 468.3 1980 1980Cardona, Manuel Stuttgart TU 284.3 1980 1980Ewald, Peter Paul Stuttgart TU 161.8 1937 1926 1931Wegner, Franz Heidelberg 148.3 1980 1980Born, Max Göttingen 144.2 yes 1933 1926 1931Greiner, Walter Frankfurt 135.6 1970 1980Schrödinger, Erwin Berlin 129.6 yes 1933 1926 1931Schmidt, Michael Heidelberg 112.5 1980 1980Bergmann, Gerd Köln 97.3 1980 1980Haken, Hermann Stuttgart TU 96.5 1961 1980Hess, Karl Wien 91.5 1980 1980Schmid, Albert Karlsruhe TU 88.2 1970 1980Hohenberg, Pierre München TU 87.9 1980 1980Einstein, Albert Berlin 82.2 yes 1933 1926 1931Schatz, Gerd Heidelberg 73.5 1980 1980Müller, Bernd Frankfurt 70.1 1980 1980Fulde, Peter Frankfurt Darmstadt TU 68.4 1970 1980Schlögl, Friedrich Aachen TU 67.2 1961 1980Gross, Ferdinand Graz 66.2 1970 1980
ChemistryMeyerhof, Otto Heidelberg 277.4 yes 1938 1931 1931Sies, Helmut München 172.6 1980 1980Neuberg, Carl Berlin 163.5 1938 1926 1931Lynen, Feodor München 160.2 yes 1961 1970Eckstein, Fritz Göttingen 159.2 1980 1980Giese, Bernd Darmstadt TU 153.0 1980 1980Reetz Manfred T. Marburg 151.0 1980 1980Pette, Dirk München 141.1 1970 1970Lohmann, Karl Heidelberg Berlin 136.1 1931 1961Neupert, Walter München 135.8 1980 1980Bergmann, Max Dresden TU 129.6 1933 1926 1931Vorbrüggen, Helmut Berlin TU 125.2 1980 1980von Raque Schleyer, Paul Erlangen 110.8 1980 1980Paulsen, Hans Hamburg 110.0 1970 1980Witkop, Bernhard München 108.9 1950 1950Hoppe, Rudolf Gießen 106.3 1961 1980Vögtlke, Fritz Würzburg 104.7 1980 1980Kessler, Horst Frankfurt 103.8 1980 1980Wieghardt, Karl Hannover TU 95.0 1980 1980Westphal, Otto Freiburg 94.2 1961 1980
Mathematicsvon Neumann, Johann Berlin 150.6 1933 1931 1931Keller, Wilfried Hamburg 75.6 1980 1980Bott, Raoul Bonn 51.8 1961 1970Kaup, Wilhelm Tübingen 43.2 1980 1980Lorentz, George G. Tübingen 39.7 1950 1950von Mises, Richard Berlin TU 38.2 1933 1926 1931Friedrichs, Kurt Göttingen 37.4 1937 1931 1931Jensen, Ronald Bonn 35.6 1980 1980Krieger, Wolfgang Heidelberg 35.3 1980 1980Barth, Wolf Erlangen 29.1 1980 1980Szegö, Gabriel Berlin 27.6 1933 1926 1931Löh, Hans-Günter Hamburg 26.2 1980 1980Weyl, Hermann Göttingen 26.0 1933 1926 1931Schaeffer, Helmut Hamburg 24.1 1980 1980Lewy, Hans Göttingen 23.4 1933 1931 1931Dold, Albrecht Heidelberg 22.3 1961 1980Grauert, Hans Göttingen 18.7 1961 1980Becker, Jochen Berlin TU 18.3 1980 1980Hausdorff, Felix Bonn 16.7 1926 1931Menger, Karl Wien 16.7 1938 1931 1931
50
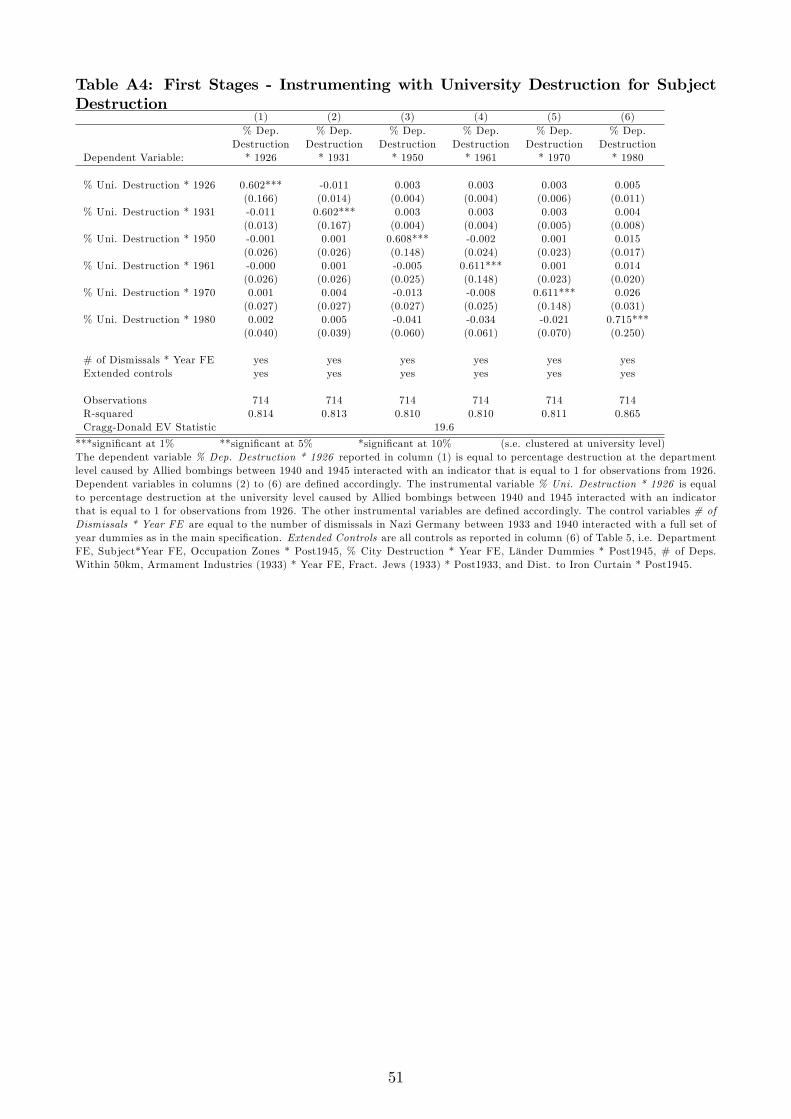
Table A4: First Stages - Instrumenting with University Destruction for SubjectDestruction
(1) (2) (3) (4) (5) (6)% Dep. % Dep. % Dep. % Dep. % Dep. % Dep.
Destruction Destruction Destruction Destruction Destruction DestructionDependent Variable: * 1926 * 1931 * 1950 * 1961 * 1970 * 1980
% Uni. Destruction * 1926 0.602*** -0.011 0.003 0.003 0.003 0.005(0.166) (0.014) (0.004) (0.004) (0.006) (0.011)
% Uni. Destruction * 1931 -0.011 0.602*** 0.003 0.003 0.003 0.004(0.013) (0.167) (0.004) (0.004) (0.005) (0.008)
% Uni. Destruction * 1950 -0.001 0.001 0.608*** -0.002 0.001 0.015(0.026) (0.026) (0.148) (0.024) (0.023) (0.017)
% Uni. Destruction * 1961 -0.000 0.001 -0.005 0.611*** 0.001 0.014(0.026) (0.026) (0.025) (0.148) (0.023) (0.020)
% Uni. Destruction * 1970 0.001 0.004 -0.013 -0.008 0.611*** 0.026(0.027) (0.027) (0.027) (0.025) (0.148) (0.031)
% Uni. Destruction * 1980 0.002 0.005 -0.041 -0.034 -0.021 0.715***(0.040) (0.039) (0.060) (0.061) (0.070) (0.250)
# of Dismissals * Year FE yes yes yes yes yes yesExtended controls yes yes yes yes yes yes
Observations 714 714 714 714 714 714R-squared 0.814 0.813 0.810 0.810 0.811 0.865Cragg-Donald EV Statistic 19.6
***significant at 1% **significant at 5% *significant at 10% (s.e. clustered at university level)The dependent variable % Dep. Destruction * 1926 reported in column (1) is equal to percentage destruction at the departmentlevel caused by Allied bombings between 1940 and 1945 interacted with an indicator that is equal to 1 for observations from 1926.Dependent variables in columns (2) to (6) are defined accordingly. The instrumental variable % Uni. Destruction * 1926 is equalto percentage destruction at the university level caused by Allied bombings between 1940 and 1945 interacted with an indicatorthat is equal to 1 for observations from 1926. The other instrumental variables are defined accordingly. The control variables # ofDismissals * Year FE are equal to the number of dismissals in Nazi Germany between 1933 and 1940 interacted with a full set ofyear dummies as in the main specification. Extended Controls are all controls as reported in column (6) of Table 5, i.e. DepartmentFE, Subject*Year FE, Occupation Zones * Post1945, % City Destruction * Year FE, Länder Dummies * Post1945, # of Deps.Within 50km, Armament Industries (1933) * Year FE, Fract. Jews (1933) * Post1933, and Dist. to Iron Curtain * Post1945.
51
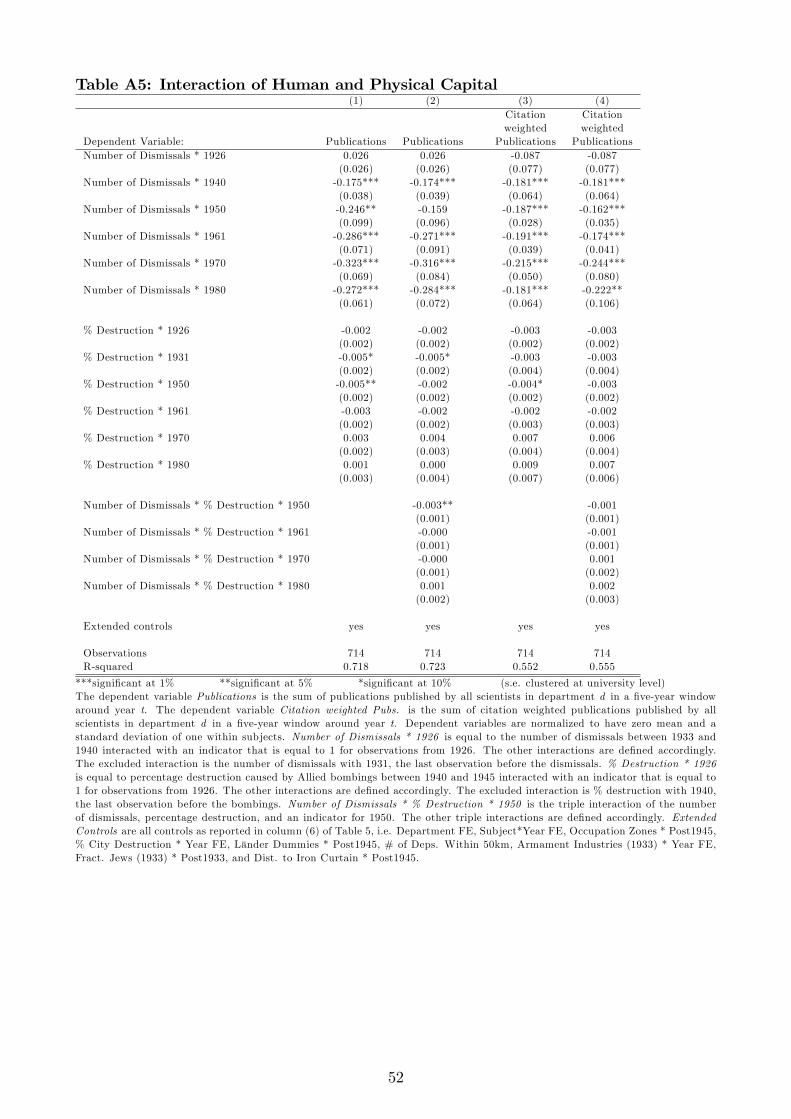
Table A5: Interaction of Human and Physical Capital(1) (2) (3) (4)
Citation Citationweighted weighted
Dependent Variable: Publications Publications Publications PublicationsNumber of Dismissals * 1926 0.026 0.026 -0.087 -0.087
(0.026) (0.026) (0.077) (0.077)Number of Dismissals * 1940 -0.175*** -0.174*** -0.181*** -0.181***
(0.038) (0.039) (0.064) (0.064)Number of Dismissals * 1950 -0.246** -0.159 -0.187*** -0.162***
(0.099) (0.096) (0.028) (0.035)Number of Dismissals * 1961 -0.286*** -0.271*** -0.191*** -0.174***
(0.071) (0.091) (0.039) (0.041)Number of Dismissals * 1970 -0.323*** -0.316*** -0.215*** -0.244***
(0.069) (0.084) (0.050) (0.080)Number of Dismissals * 1980 -0.272*** -0.284*** -0.181*** -0.222**
(0.061) (0.072) (0.064) (0.106)
% Destruction * 1926 -0.002 -0.002 -0.003 -0.003(0.002) (0.002) (0.002) (0.002)
% Destruction * 1931 -0.005* -0.005* -0.003 -0.003(0.002) (0.002) (0.004) (0.004)
% Destruction * 1950 -0.005** -0.002 -0.004* -0.003(0.002) (0.002) (0.002) (0.002)
% Destruction * 1961 -0.003 -0.002 -0.002 -0.002(0.002) (0.002) (0.003) (0.003)
% Destruction * 1970 0.003 0.004 0.007 0.006(0.002) (0.003) (0.004) (0.004)
% Destruction * 1980 0.001 0.000 0.009 0.007(0.003) (0.004) (0.007) (0.006)
Number of Dismissals * % Destruction * 1950 -0.003** -0.001(0.001) (0.001)
Number of Dismissals * % Destruction * 1961 -0.000 -0.001(0.001) (0.001)
Number of Dismissals * % Destruction * 1970 -0.000 0.001(0.001) (0.002)
Number of Dismissals * % Destruction * 1980 0.001 0.002(0.002) (0.003)
Extended controls yes yes yes yes
Observations 714 714 714 714R-squared 0.718 0.723 0.552 0.555
***significant at 1% **significant at 5% *significant at 10% (s.e. clustered at university level)The dependent variable Publications is the sum of publications published by all scientists in department d in a five-year windowaround year t. The dependent variable Citation weighted Pubs. is the sum of citation weighted publications published by allscientists in department d in a five-year window around year t. Dependent variables are normalized to have zero mean and astandard deviation of one within subjects. Number of Dismissals * 1926 is equal to the number of dismissals between 1933 and1940 interacted with an indicator that is equal to 1 for observations from 1926. The other interactions are defined accordingly.The excluded interaction is the number of dismissals with 1931, the last observation before the dismissals. % Destruction * 1926is equal to percentage destruction caused by Allied bombings between 1940 and 1945 interacted with an indicator that is equal to1 for observations from 1926. The other interactions are defined accordingly. The excluded interaction is % destruction with 1940,the last observation before the bombings. Number of Dismissals * % Destruction * 1950 is the triple interaction of the numberof dismissals, percentage destruction, and an indicator for 1950. The other triple interactions are defined accordingly. ExtendedControls are all controls as reported in column (6) of Table 5, i.e. Department FE, Subject*Year FE, Occupation Zones * Post1945,% City Destruction * Year FE, Länder Dummies * Post1945, # of Deps. Within 50km, Armament Industries (1933) * Year FE,Fract. Jews (1933) * Post1933, and Dist. to Iron Curtain * Post1945.
52
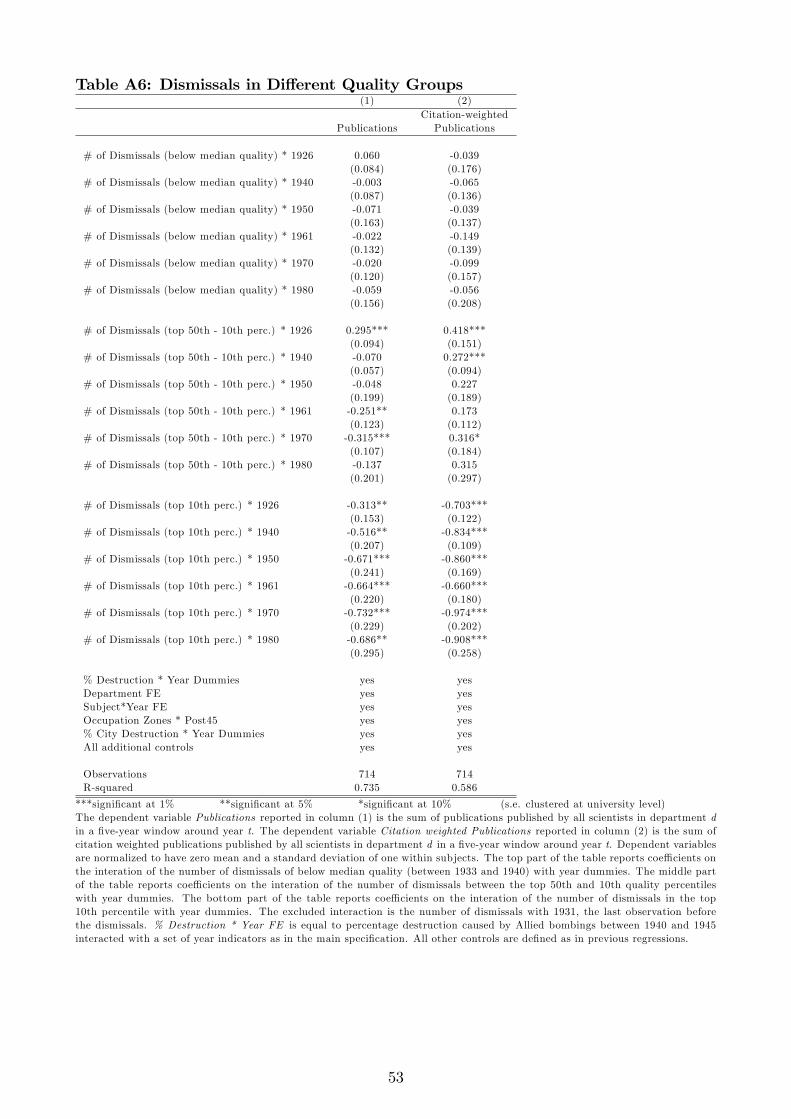
Table A6: Dismissals in Different Quality Groups(1) (2)
Citation-weightedPublications Publications
# of Dismissals (below median quality) * 1926 0.060 -0.039(0.084) (0.176)
# of Dismissals (below median quality) * 1940 -0.003 -0.065(0.087) (0.136)
# of Dismissals (below median quality) * 1950 -0.071 -0.039(0.163) (0.137)
# of Dismissals (below median quality) * 1961 -0.022 -0.149(0.132) (0.139)
# of Dismissals (below median quality) * 1970 -0.020 -0.099(0.120) (0.157)
# of Dismissals (below median quality) * 1980 -0.059 -0.056(0.156) (0.208)
# of Dismissals (top 50th - 10th perc.) * 1926 0.295*** 0.418***(0.094) (0.151)
# of Dismissals (top 50th - 10th perc.) * 1940 -0.070 0.272***(0.057) (0.094)
# of Dismissals (top 50th - 10th perc.) * 1950 -0.048 0.227(0.199) (0.189)
# of Dismissals (top 50th - 10th perc.) * 1961 -0.251** 0.173(0.123) (0.112)
# of Dismissals (top 50th - 10th perc.) * 1970 -0.315*** 0.316*(0.107) (0.184)
# of Dismissals (top 50th - 10th perc.) * 1980 -0.137 0.315(0.201) (0.297)
# of Dismissals (top 10th perc.) * 1926 -0.313** -0.703***(0.153) (0.122)
# of Dismissals (top 10th perc.) * 1940 -0.516** -0.834***(0.207) (0.109)
# of Dismissals (top 10th perc.) * 1950 -0.671*** -0.860***(0.241) (0.169)
# of Dismissals (top 10th perc.) * 1961 -0.664*** -0.660***(0.220) (0.180)
# of Dismissals (top 10th perc.) * 1970 -0.732*** -0.974***(0.229) (0.202)
# of Dismissals (top 10th perc.) * 1980 -0.686** -0.908***(0.295) (0.258)
% Destruction * Year Dummies yes yesDepartment FE yes yesSubject*Year FE yes yesOccupation Zones * Post45 yes yes% City Destruction * Year Dummies yes yesAll additional controls yes yes
Observations 714 714R-squared 0.735 0.586
***significant at 1% **significant at 5% *significant at 10% (s.e. clustered at university level)The dependent variable Publications reported in column (1) is the sum of publications published by all scientists in department din a five-year window around year t. The dependent variable Citation weighted Publications reported in column (2) is the sum ofcitation weighted publications published by all scientists in department d in a five-year window around year t. Dependent variablesare normalized to have zero mean and a standard deviation of one within subjects. The top part of the table reports coeffi cients onthe interation of the number of dismissals of below median quality (between 1933 and 1940) with year dummies. The middle partof the table reports coeffi cients on the interation of the number of dismissals between the top 50th and 10th quality percentileswith year dummies. The bottom part of the table reports coeffi cients on the interation of the number of dismissals in the top10th percentile with year dummies. The excluded interaction is the number of dismissals with 1931, the last observation beforethe dismissals. % Destruction * Year FE is equal to percentage destruction caused by Allied bombings between 1940 and 1945interacted with a set of year indicators as in the main specification. All other controls are defined as in previous regressions.
53
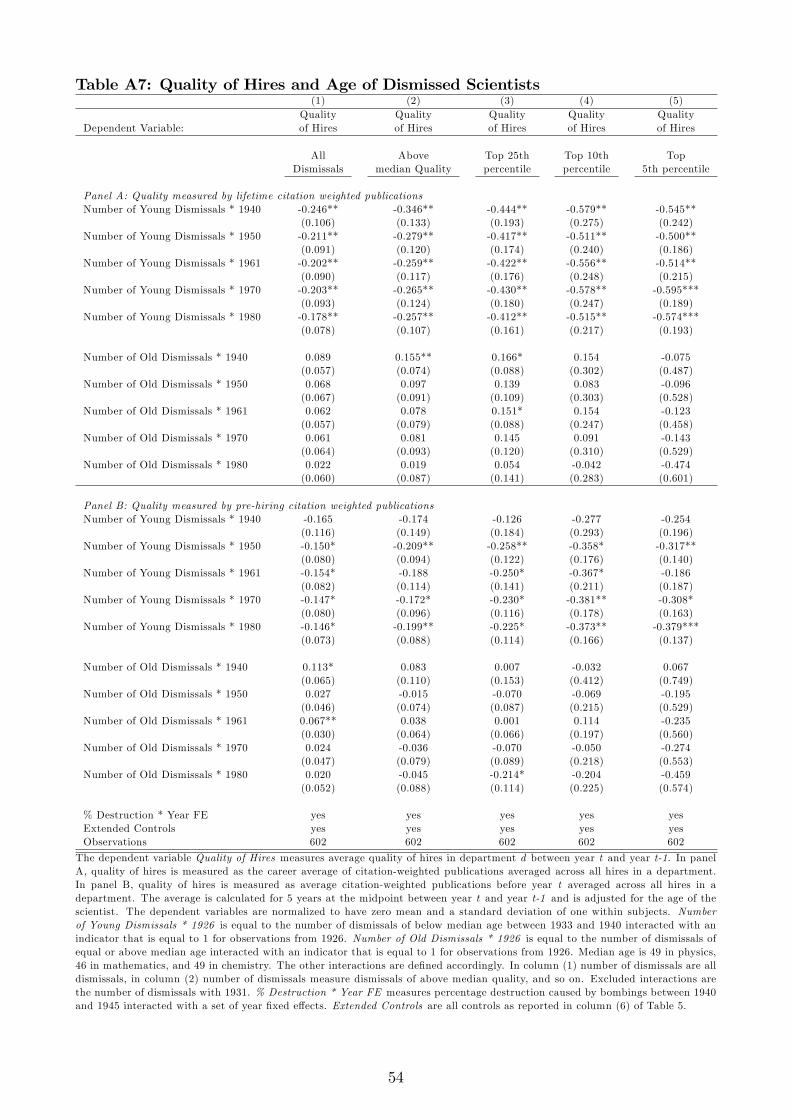
Table A7: Quality of Hires and Age of Dismissed Scientists(1) (2) (3) (4) (5)
Quality Quality Quality Quality QualityDependent Variable: of Hires of Hires of Hires of Hires of Hires
All Above Top 25th Top 10th TopDismissals median Quality percentile percentile 5th percentile
Panel A: Quality measured by lifetime citation weighted publicationsNumber of Young Dismissals * 1940 -0.246** -0.346** -0.444** -0.579** -0.545**
(0.106) (0.133) (0.193) (0.275) (0.242)Number of Young Dismissals * 1950 -0.211** -0.279** -0.417** -0.511** -0.500**
(0.091) (0.120) (0.174) (0.240) (0.186)Number of Young Dismissals * 1961 -0.202** -0.259** -0.422** -0.556** -0.514**
(0.090) (0.117) (0.176) (0.248) (0.215)Number of Young Dismissals * 1970 -0.203** -0.265** -0.430** -0.578** -0.595***
(0.093) (0.124) (0.180) (0.247) (0.189)Number of Young Dismissals * 1980 -0.178** -0.257** -0.412** -0.515** -0.574***
(0.078) (0.107) (0.161) (0.217) (0.193)
Number of Old Dismissals * 1940 0.089 0.155** 0.166* 0.154 -0.075(0.057) (0.074) (0.088) (0.302) (0.487)
Number of Old Dismissals * 1950 0.068 0.097 0.139 0.083 -0.096(0.067) (0.091) (0.109) (0.303) (0.528)
Number of Old Dismissals * 1961 0.062 0.078 0.151* 0.154 -0.123(0.057) (0.079) (0.088) (0.247) (0.458)
Number of Old Dismissals * 1970 0.061 0.081 0.145 0.091 -0.143(0.064) (0.093) (0.120) (0.310) (0.529)
Number of Old Dismissals * 1980 0.022 0.019 0.054 -0.042 -0.474(0.060) (0.087) (0.141) (0.283) (0.601)
Panel B: Quality measured by pre-hiring citation weighted publicationsNumber of Young Dismissals * 1940 -0.165 -0.174 -0.126 -0.277 -0.254
(0.116) (0.149) (0.184) (0.293) (0.196)Number of Young Dismissals * 1950 -0.150* -0.209** -0.258** -0.358* -0.317**
(0.080) (0.094) (0.122) (0.176) (0.140)Number of Young Dismissals * 1961 -0.154* -0.188 -0.250* -0.367* -0.186
(0.082) (0.114) (0.141) (0.211) (0.187)Number of Young Dismissals * 1970 -0.147* -0.172* -0.230* -0.381** -0.308*
(0.080) (0.096) (0.116) (0.178) (0.163)Number of Young Dismissals * 1980 -0.146* -0.199** -0.225* -0.373** -0.379***
(0.073) (0.088) (0.114) (0.166) (0.137)
Number of Old Dismissals * 1940 0.113* 0.083 0.007 -0.032 0.067(0.065) (0.110) (0.153) (0.412) (0.749)
Number of Old Dismissals * 1950 0.027 -0.015 -0.070 -0.069 -0.195(0.046) (0.074) (0.087) (0.215) (0.529)
Number of Old Dismissals * 1961 0.067** 0.038 0.001 0.114 -0.235(0.030) (0.064) (0.066) (0.197) (0.560)
Number of Old Dismissals * 1970 0.024 -0.036 -0.070 -0.050 -0.274(0.047) (0.079) (0.089) (0.218) (0.553)
Number of Old Dismissals * 1980 0.020 -0.045 -0.214* -0.204 -0.459(0.052) (0.088) (0.114) (0.225) (0.574)
% Destruction * Year FE yes yes yes yes yesExtended Controls yes yes yes yes yesObservations 602 602 602 602 602
The dependent variable Quality of Hires measures average quality of hires in department d between year t and year t-1. In panelA, quality of hires is measured as the career average of citation-weighted publications averaged across all hires in a department.In panel B, quality of hires is measured as average citation-weighted publications before year t averaged across all hires in adepartment. The average is calculated for 5 years at the midpoint between year t and year t-1 and is adjusted for the age of thescientist. The dependent variables are normalized to have zero mean and a standard deviation of one within subjects. Numberof Young Dismissals * 1926 is equal to the number of dismissals of below median age between 1933 and 1940 interacted with anindicator that is equal to 1 for observations from 1926. Number of Old Dismissals * 1926 is equal to the number of dismissals ofequal or above median age interacted with an indicator that is equal to 1 for observations from 1926. Median age is 49 in physics,46 in mathematics, and 49 in chemistry. The other interactions are defined accordingly. In column (1) number of dismissals are alldismissals, in column (2) number of dismissals measure dismissals of above median quality, and so on. Excluded interactions arethe number of dismissals with 1931. % Destruction * Year FE measures percentage destruction caused by bombings between 1940and 1945 interacted with a set of year fixed effects. Extended Controls are all controls as reported in column (6) of Table 5.
54
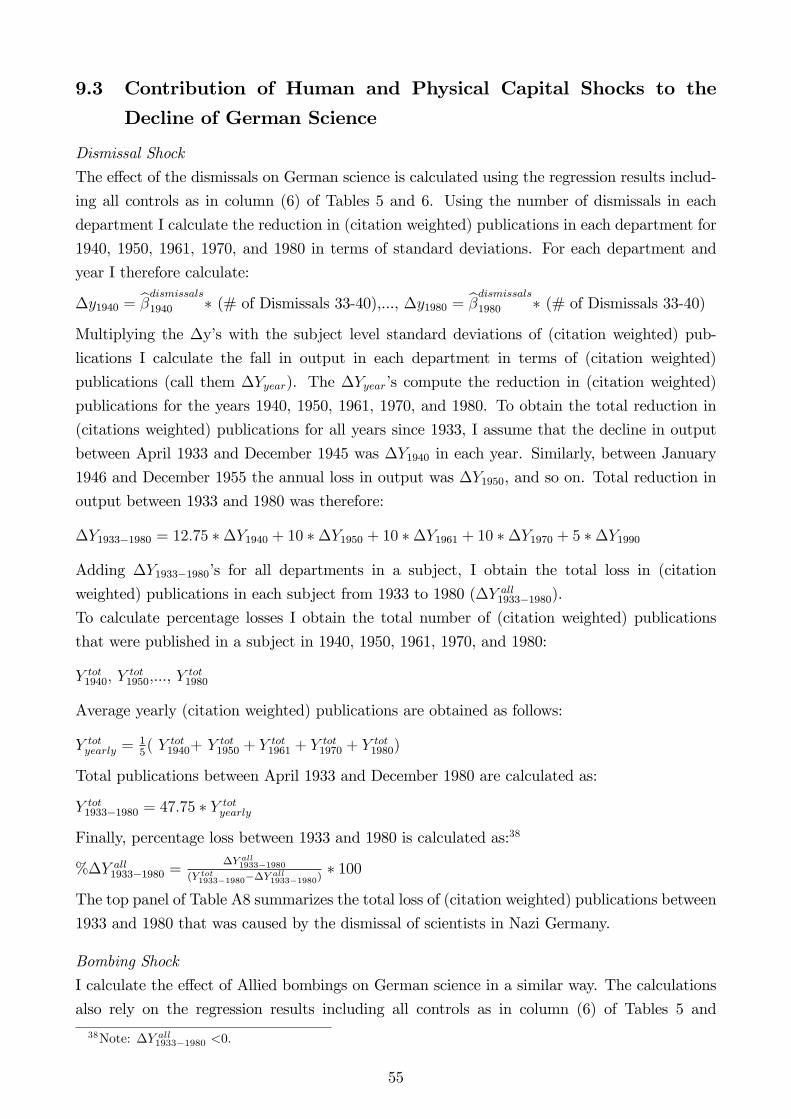
9.3 Contribution of Human and Physical Capital Shocks to the
Decline of German Science
Dismissal Shock
The effect of the dismissals on German science is calculated using the regression results includ-
ing all controls as in column (6) of Tables 5 and 6. Using the number of dismissals in each
department I calculate the reduction in (citation weighted) publications in each department for
1940, 1950, 1961, 1970, and 1980 in terms of standard deviations. For each department and
year I therefore calculate:
∆y1940 = β̂dismissals
1940 ∗ (# of Dismissals 33-40),..., ∆y1980 = β̂dismissals
1980 ∗ (# of Dismissals 33-40)
Multiplying the ∆y’s with the subject level standard deviations of (citation weighted) pub-
lications I calculate the fall in output in each department in terms of (citation weighted)
publications (call them ∆Yyear). The ∆Yyear’s compute the reduction in (citation weighted)
publications for the years 1940, 1950, 1961, 1970, and 1980. To obtain the total reduction in
(citations weighted) publications for all years since 1933, I assume that the decline in output
between April 1933 and December 1945 was ∆Y1940 in each year. Similarly, between January
1946 and December 1955 the annual loss in output was ∆Y1950, and so on. Total reduction in
output between 1933 and 1980 was therefore:
∆Y1933−1980 = 12.75 ∗∆Y1940 + 10 ∗∆Y1950 + 10 ∗∆Y1961 + 10 ∗∆Y1970 + 5 ∗∆Y1990
Adding ∆Y1933−1980’s for all departments in a subject, I obtain the total loss in (citation
weighted) publications in each subject from 1933 to 1980 (∆Y all1933−1980).
To calculate percentage losses I obtain the total number of (citation weighted) publications
that were published in a subject in 1940, 1950, 1961, 1970, and 1980:
Y tot1940, Y
tot1950,..., Y
tot1980
Average yearly (citation weighted) publications are obtained as follows:
Y totyearly = 1
5( Y tot
1940+ Y tot1950 + Y tot
1961 + Y tot1970 + Y tot
1980)
Total publications between April 1933 and December 1980 are calculated as:
Y tot1933−1980 = 47.75 ∗ Y tot
yearly
Finally, percentage loss between 1933 and 1980 is calculated as:38
%∆Y all1933−1980 =
∆Y all1933−1980(Y tot1933−1980−∆Y all1933−1980)
∗ 100
The top panel of Table A8 summarizes the total loss of (citation weighted) publications between
1933 and 1980 that was caused by the dismissal of scientists in Nazi Germany.
Bombing Shock
I calculate the effect of Allied bombings on German science in a similar way. The calculations
also rely on the regression results including all controls as in column (6) of Tables 5 and
38Note: ∆Y all1933−1980 <0.
55
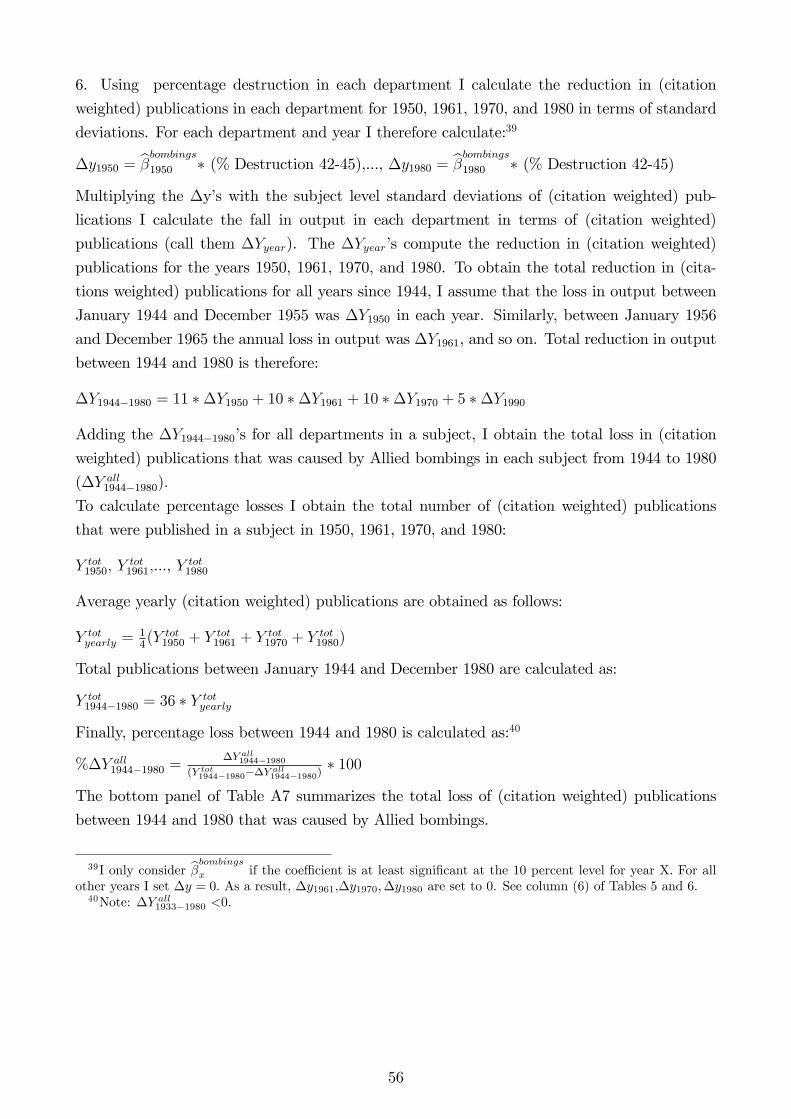
6. Using percentage destruction in each department I calculate the reduction in (citation
weighted) publications in each department for 1950, 1961, 1970, and 1980 in terms of standard
deviations. For each department and year I therefore calculate:39
∆y1950 = β̂bombings
1950 ∗ (% Destruction 42-45),..., ∆y1980 = β̂bombings
1980 ∗ (% Destruction 42-45)
Multiplying the ∆y’s with the subject level standard deviations of (citation weighted) pub-
lications I calculate the fall in output in each department in terms of (citation weighted)
publications (call them ∆Yyear). The ∆Yyear’s compute the reduction in (citation weighted)
publications for the years 1950, 1961, 1970, and 1980. To obtain the total reduction in (cita-
tions weighted) publications for all years since 1944, I assume that the loss in output between
January 1944 and December 1955 was ∆Y1950 in each year. Similarly, between January 1956
and December 1965 the annual loss in output was ∆Y1961, and so on. Total reduction in output
between 1944 and 1980 is therefore:
∆Y1944−1980 = 11 ∗∆Y1950 + 10 ∗∆Y1961 + 10 ∗∆Y1970 + 5 ∗∆Y1990
Adding the ∆Y1944−1980’s for all departments in a subject, I obtain the total loss in (citation
weighted) publications that was caused by Allied bombings in each subject from 1944 to 1980
(∆Y all1944−1980).
To calculate percentage losses I obtain the total number of (citation weighted) publications
that were published in a subject in 1950, 1961, 1970, and 1980:
Y tot1950, Y
tot1961,..., Y
tot1980
Average yearly (citation weighted) publications are obtained as follows:
Y totyearly = 1
4(Y tot
1950 + Y tot1961 + Y tot
1970 + Y tot1980)
Total publications between January 1944 and December 1980 are calculated as:
Y tot1944−1980 = 36 ∗ Y tot
yearly
Finally, percentage loss between 1944 and 1980 is calculated as:40
%∆Y all1944−1980 =
∆Y all1944−1980(Y tot1944−1980−∆Y all1944−1980)
∗ 100
The bottom panel of Table A7 summarizes the total loss of (citation weighted) publications
between 1944 and 1980 that was caused by Allied bombings.
39I only consider β̂bombings
x if the coeffi cient is at least significant at the 10 percent level for year X. For allother years I set ∆y = 0. As a result, ∆y1961,∆y1970,∆y1980 are set to 0. See column (6) of Tables 5 and 6.40Note: ∆Y all1933−1980 <0.
56
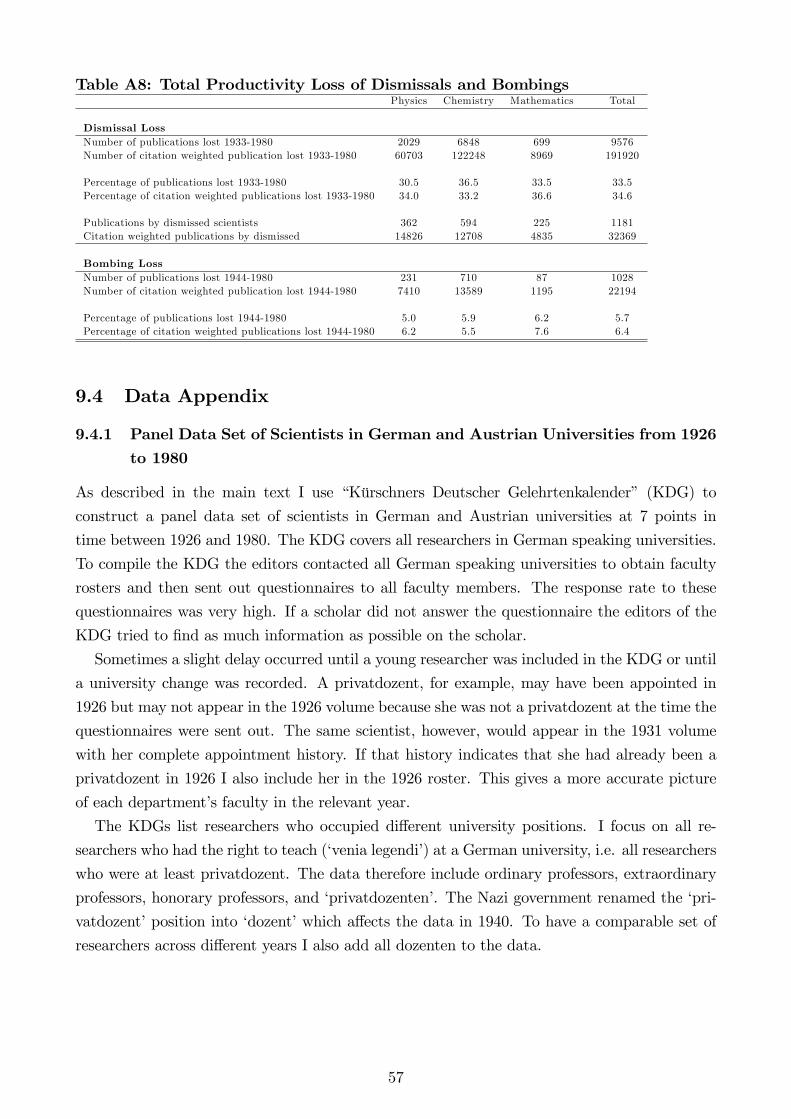
Table A8: Total Productivity Loss of Dismissals and BombingsPhysics Chemistry Mathematics Total
Dismissal LossNumber of publications lost 1933-1980 2029 6848 699 9576Number of citation weighted publication lost 1933-1980 60703 122248 8969 191920
Percentage of publications lost 1933-1980 30.5 36.5 33.5 33.5Percentage of citation weighted publications lost 1933-1980 34.0 33.2 36.6 34.6
Publications by dismissed scientists 362 594 225 1181Citation weighted publications by dismissed 14826 12708 4835 32369
Bombing LossNumber of publications lost 1944-1980 231 710 87 1028Number of citation weighted publication lost 1944-1980 7410 13589 1195 22194
Percentage of publications lost 1944-1980 5.0 5.9 6.2 5.7Percentage of citation weighted publications lost 1944-1980 6.2 5.5 7.6 6.4
9.4 Data Appendix
9.4.1 Panel Data Set of Scientists in German and Austrian Universities from 1926to 1980
As described in the main text I use “Kürschners Deutscher Gelehrtenkalender” (KDG) to
construct a panel data set of scientists in German and Austrian universities at 7 points in
time between 1926 and 1980. The KDG covers all researchers in German speaking universities.
To compile the KDG the editors contacted all German speaking universities to obtain faculty
rosters and then sent out questionnaires to all faculty members. The response rate to these
questionnaires was very high. If a scholar did not answer the questionnaire the editors of the
KDG tried to find as much information as possible on the scholar.
Sometimes a slight delay occurred until a young researcher was included in the KDG or until
a university change was recorded. A privatdozent, for example, may have been appointed in
1926 but may not appear in the 1926 volume because she was not a privatdozent at the time the
questionnaires were sent out. The same scientist, however, would appear in the 1931 volume
with her complete appointment history. If that history indicates that she had already been a
privatdozent in 1926 I also include her in the 1926 roster. This gives a more accurate picture
of each department’s faculty in the relevant year.
The KDGs list researchers who occupied different university positions. I focus on all re-
searchers who had the right to teach (‘venia legendi’) at a German university, i.e. all researchers
who were at least privatdozent. The data therefore include ordinary professors, extraordinary
professors, honorary professors, and ‘privatdozenten’. The Nazi government renamed the ‘pri-
vatdozent’position into ‘dozent’which affects the data in 1940. To have a comparable set of
researchers across different years I also add all dozenten to the data.
57
9.4.2 Output Measures for German and Austrian Science Departments
The publications and citations data cover historical and current top science journals and were
downloaded from the ISI Web of Science. The set of journals is based on historical accounts of
relevant top journals and on current journal rankings.
Historical top journals
The list of top journals in the 1920s and 1930s includes mostly German journals but also the
major international journals. As German science was leading at the time, many of the German
journals were among the best journals worldwide which is underlined by an article published in
Science in 1941: “Before the advent of the Nazis the German physics journals (Zeitschrift für
Physik, Annalen der Physik, Physikalische Zeitschrift) had always served as the central organs
of world science in this domain [...] In 1930 approximately 700 scientific papers were printed
in its [the Zeitschrift für Physik´s] seven volumes of which 280 were by foreign scientists”
(American Association for the Advancement of Science, 1941).
I obtain the list of historical journals using a three step process. First, I obtain all German
science journals published in the 1920s to 1940s that are included in the Web of Science. Sec-
ond, I include three general science journals that were relevant outlets for German scientists
publishing in the 1920s and 1930s: Nature, Science, and the Proceedings of the Royal Society.
Finally, the list of historical top journals is augmented by four international field journals that
have been recommended by historians of science as important outlets for German scientists.
Relevant chemistry journals were suggested by Ute Deichmann and John Andraos who work on
chemistry in the early 20th century. Historical mathematics journals were suggested by Rein-
hard Siegmund-Schultze and David Wilkins who are specialists in the history of mathematics.
Current top journals
The definition of top journals for German (and international) scientists changed substantially
since the 1920s and 30s. To reflect this change in my output measure I also compile a second
list of top journals based on current international journal rankings. I use rankings provided
by SCImago Journal & Country Rank to obtain the ten most cited journals in general science,
physics, and chemistry. SCImago does not rank mathematics journals.41 I therefore obtain
the current most cited mathematics journals from a commonly used ranking provided by the
University of Texas.42
Universe of Articles in Top Science Journals Published Between 1920 and 1985
The overall list of top science journals includes 51 journals. I download all articles published in
these journals between 1920 and 1985. I.e. even if a journal only became a top journal in later
years I download all articles published in the journal since 1920. A small number of journals
were only founded after 1920. For these journals I download all articles since the creation of
the journal. The publication of a few journals was interrupted towards the end of WWII. As
41See http://www.scimagojr.com, accessed 13th of May 2010.42See http://www.ma.utexas.edu/users/lsilvest/rankings/mranking.html, accessed 13th of May, 2010.
58
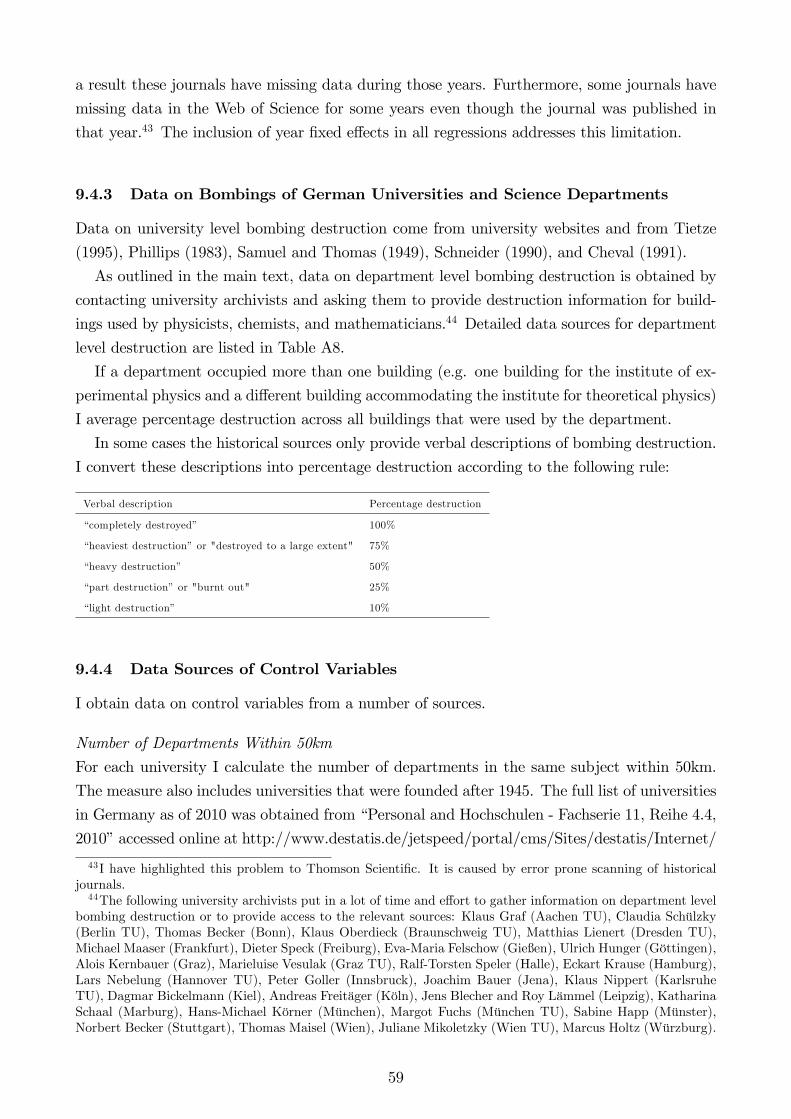
a result these journals have missing data during those years. Furthermore, some journals have
missing data in the Web of Science for some years even though the journal was published in
that year.43 The inclusion of year fixed effects in all regressions addresses this limitation.
9.4.3 Data on Bombings of German Universities and Science Departments
Data on university level bombing destruction come from university websites and from Tietze
(1995), Phillips (1983), Samuel and Thomas (1949), Schneider (1990), and Cheval (1991).
As outlined in the main text, data on department level bombing destruction is obtained by
contacting university archivists and asking them to provide destruction information for build-
ings used by physicists, chemists, and mathematicians.44 Detailed data sources for department
level destruction are listed in Table A8.
If a department occupied more than one building (e.g. one building for the institute of ex-
perimental physics and a different building accommodating the institute for theoretical physics)
I average percentage destruction across all buildings that were used by the department.
In some cases the historical sources only provide verbal descriptions of bombing destruction.
I convert these descriptions into percentage destruction according to the following rule:
Verbal description Percentage destruction
“completely destroyed” 100%
“heaviest destruction”or "destroyed to a large extent" 75%
“heavy destruction” 50%
“part destruction”or "burnt out" 25%
“light destruction” 10%
9.4.4 Data Sources of Control Variables
I obtain data on control variables from a number of sources.
Number of Departments Within 50km
For each university I calculate the number of departments in the same subject within 50km.
The measure also includes universities that were founded after 1945. The full list of universities
in Germany as of 2010 was obtained from “Personal and Hochschulen - Fachserie 11, Reihe 4.4,
2010”accessed online at http://www.destatis.de/jetspeed/portal/cms/Sites/destatis/Internet/
43I have highlighted this problem to Thomson Scientific. It is caused by error prone scanning of historicaljournals.44The following university archivists put in a lot of time and effort to gather information on department level
bombing destruction or to provide access to the relevant sources: Klaus Graf (Aachen TU), Claudia Schülzky(Berlin TU), Thomas Becker (Bonn), Klaus Oberdieck (Braunschweig TU), Matthias Lienert (Dresden TU),Michael Maaser (Frankfurt), Dieter Speck (Freiburg), Eva-Maria Felschow (Gießen), Ulrich Hunger (Göttingen),Alois Kernbauer (Graz), Marieluise Vesulak (Graz TU), Ralf-Torsten Speler (Halle), Eckart Krause (Hamburg),Lars Nebelung (Hannover TU), Peter Goller (Innsbruck), Joachim Bauer (Jena), Klaus Nippert (KarlsruheTU), Dagmar Bickelmann (Kiel), Andreas Freitäger (Köln), Jens Blecher and Roy Lämmel (Leipzig), KatharinaSchaal (Marburg), Hans-Michael Körner (München), Margot Fuchs (München TU), Sabine Happ (Münster),Norbert Becker (Stuttgart), Thomas Maisel (Wien), Juliane Mikoletzky (Wien TU), Marcus Holtz (Würzburg).
59
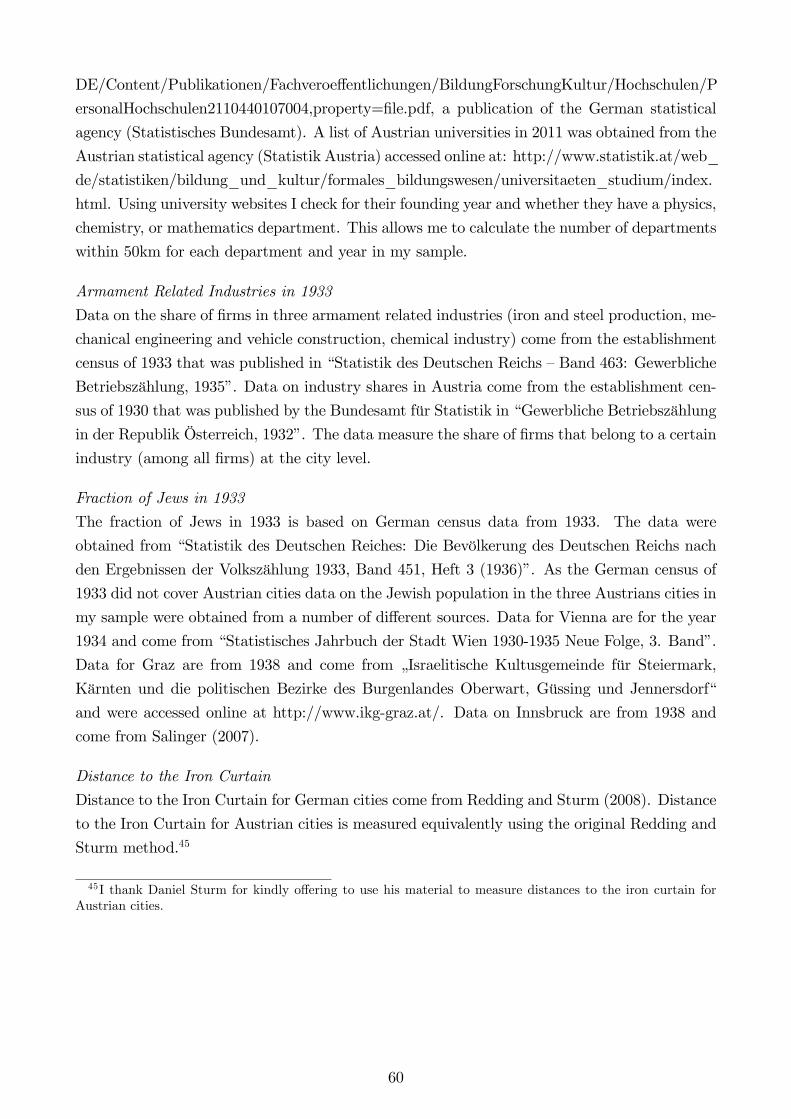
DE/Content/Publikationen/Fachveroeffentlichungen/BildungForschungKultur/Hochschulen/P
ersonalHochschulen2110440107004,property=file.pdf, a publication of the German statistical
agency (Statistisches Bundesamt). A list of Austrian universities in 2011 was obtained from the
Austrian statistical agency (Statistik Austria) accessed online at: http://www.statistik.at/web_
de/statistiken/bildung_und_kultur/formales_bildungswesen/universitaeten_studium/index.
html. Using university websites I check for their founding year and whether they have a physics,
chemistry, or mathematics department. This allows me to calculate the number of departments
within 50km for each department and year in my sample.
Armament Related Industries in 1933
Data on the share of firms in three armament related industries (iron and steel production, me-
chanical engineering and vehicle construction, chemical industry) come from the establishment
census of 1933 that was published in “Statistik des Deutschen Reichs —Band 463: Gewerbliche
Betriebszählung, 1935”. Data on industry shares in Austria come from the establishment cen-
sus of 1930 that was published by the Bundesamt für Statistik in “Gewerbliche Betriebszählung
in der Republik Österreich, 1932”. The data measure the share of firms that belong to a certain
industry (among all firms) at the city level.
Fraction of Jews in 1933
The fraction of Jews in 1933 is based on German census data from 1933. The data were
obtained from “Statistik des Deutschen Reiches: Die Bevölkerung des Deutschen Reichs nach
den Ergebnissen der Volkszählung 1933, Band 451, Heft 3 (1936)”. As the German census of
1933 did not cover Austrian cities data on the Jewish population in the three Austrians cities in
my sample were obtained from a number of different sources. Data for Vienna are for the year
1934 and come from “Statistisches Jahrbuch der Stadt Wien 1930-1935 Neue Folge, 3. Band”.
Data for Graz are from 1938 and come from „Israelitische Kultusgemeinde für Steiermark,
Kärnten und die politischen Bezirke des Burgenlandes Oberwart, Güssing und Jennersdorf“
and were accessed online at http://www.ikg-graz.at/. Data on Innsbruck are from 1938 and
come from Salinger (2007).
Distance to the Iron Curtain
Distance to the Iron Curtain for German cities come from Redding and Sturm (2008). Distance
to the Iron Curtain for Austrian cities is measured equivalently using the original Redding and
Sturm method.45
45I thank Daniel Sturm for kindly offering to use his material to measure distances to the iron curtain forAustrian cities.
60
Table A8: Detailed Data Sources for Department Level Destruction DataUniversity Source for Department Level DestructionAachen TU Kriegsschäden Akten 438, 1189, 1234aBerlin Humboldt Universität Berlin, Universitätsarchiv, Bestand des Universitätskurators, Aktennr. 655Berlin TU Universitätsarchiv der Technischen Universität Berlin in der Universitätsbibliothek, 602-44Bonn van Rey (1995)Braunschweig TU Kuhlenkamp (1976)Darmstadt TU missingDresden TU Technische Universität Dresden (1996)Erlangen no bombing destructionFrankfurt Universitätsarchiv Frankfurt (1947), Abteilung 50, Nr. 3046 BII, 241-244Freiburg Rösiger (1957)Gießen Universitätsarchiv Gießen, PrA. Nr. 2208Göttingen Brinkmann (1985)Graz e-mail communication with university archivist Prof. Dr. Alois KernbauerGraz TU Weingand (1995), p. 58, p. 103Greifswald no bombing destructionHalle Eberle (2002)Hamburg e-mail communication with university archivist Eckart Krause, Kröplin (1951), pp.422-428,
Senat Hamburg (1955), Giles (1985), p. 297Hannover TU Wolters (1950)Heidelberg no bombing destructionInnsbruck Klebelsberg (1953), pp. 193-196Jena Schmidt, Elm, Steiger, Böhlaus (1983), pp. 301-302Karlsruhe TU Hoepke (2007)Kiel Jaeger (1965), pp. 117-202Köln Universitätsarchiv documentsLeipzig Füssler (1961)Marburg Fritzsche, Hardt, and Schade (2003), p. 30München Mager (1958), p. 255München TU Technische Hochschule München (1968)Münster Niemer (2010)Rostock no bombing destructionStuttgart TU Technische Hochschule Stuttgart (1947)Tübingen no bombing destructionWien Adamovich (1947)Wien TU e-mail communication with university archivist Dr. Juliane MikoletzkyWürzburg e-mail communication with university archivist Dr. Marcus Holtz
The table shows detailed data sources for department level destruction. Detailed citations can be found below.
References
[1] Adamovich, Ludwig (1947) Bericht über den Studienbetrieb an der Wiener Universität vomSommer-Semester 1945 bis zum Sommer-Semester 1947, Selbstverlegung der UniversitätWien, Wien
[2] Brinkmann, Jens-Uwe (1985) "Noch mehr zusammenrücken... Die letzten Kriegsmonatein Göttingen" in Göttingen 1945, Kriegsende und Neubeginn. Texte und Materialien zurAusstellung im Städtischen Museum 31.3. - 28.7.1985, ed. Hans-Georg Schmeling, Göttin-gen.
[3] Cheval, R. (1991) "Probleme der deutschen Universitäten" in Hochschuloffi ziere undWiederaufbau des Hochschulwesens in Westdeutschland 1945-1952 - Teil 3: Die Franzö-sische Zone, ed. M. Heinemann and J. Fischer with collaboration of P. Hanske, K. Müller,and A. Peters, Edition Bildung und Wissenschaft, Hildesheim.
[4] Eberle, Henrik (2002) Die Martin-Luther-Universitat in Der Zeit Des Nationalsozialismus1933-1945, MDV Mitteldeutscher Verlag.
[5] Fritzsche Werner, Joachim Hardt, and Karlheinz Schade (2003) Universitätsbauten in Mar-burg 1945-1980. Baugeschichte und Liegenschaften der Philipps-Universität, Schriftenreiheder Universitäts Bibliothek Marburg, Marburg
61
[6] Füssler, Heinz (1961) "Leipziger Universitätsbauten die Neubauten der Karl-Marx-Universität seit 1945 und die Geschichte der Universitätsgebäude", in Leipziger stadt-geschichtliche Forchungen, vol. 6., Bibliographisches Institut, Leipzig.
[7] Giles, Geoffrey J. (1985) Students and National Socialism in Germany, Princeton Univer-sity Press, Princeton.
[8] Hoepke, Klaus-Peter (2007) Geschichte der Fridericana - Stationen in der Geschichte derUniversität Karlsuhe (TH) von der Gründung 1825 bis zum Jahr 2000, eds. Günther Grün-thal, Klaus Nippert, and Peter Steinbach, Universitätsverlag Karlsruhe, Karlsruhe.
[9] Jaeger, Rudolf (1965) "Die Baugeschichte der Universität" in Geschichte der Christian-Albrechts-Universität Kiel 1665-1965, vol. 1, no. 2, Wachholtz Verlag, Neumünster.
[10] Kamen, Henry (1988) "The Mediterranean and the Expulsion of Spanish Jews in 1492",Past & Present, no. 119, pp. 30-55.
[11] Klebelsberg, Raimund (1953) Innsbrucker Erinnerungen 1902-1952, UniversitätsverlagWagner, Innsbruck.
[12] Kuhlenkamp, Alfrad (1976) Die Technische Hochschule Braunschweig im Krieg 1939 -1945 und im ersten Nachkriegsabschnitt bis 1947, in Beiträge zur Geschichte der Carolo-Wilhelmina.
[13] Kröplin, Eduard (1951) "Bericht der Universität Hamburg" in Studium Generale, vol.4.,pp. 422-428.
[14] Mager, Friedrich (1958) Jahrbuch der Ludwig-Maximilians-Universität München1957/1958, Gesellschaft von Freunden und Förderern der Universität München, München.
[15] Niemer, Jörg (2010) Vom Domplatz zum Schloss: Die Baugeschichte der Universität Mün-ster von der Gründungsphase bis zum Abschluss des Wiederaufbaus, in Veröffentlichungendes Universitätsarchivs Münster, vol. 3., Aschendorf Verlag, Münster
[16] Phillips, D. (1983) "The Re-opening of Universities in the British Zone: The Problem ofNationalism and Student Admissions" inGerman Universities after the Surrender - BritishOccupation Policy and the Control of Higher Education, ed. D. Phillips, Oxford UniversityPress, Oxford.
[17] Rösiger, Hans Detlef (1957) Die Albert-Ludwigs-Universität Freiburg 1457-1957 - DerWiederaufbau seit 1945, Hans Ferdinand Schulz Verlag, Freiburg.
[18] Salinger, Gerhard (2007) "Die jüdische Gemeinde in Innsbruck" David - Jüdische Kul-turzeitschrift, vol. 72, accessed online at http://www.david.juden.at/kulturzeitschrift/70-75/72-salinger.htm
[19] Samuel, R. H. and R. H. Thomas (1949) Education and Society in Modern Germany,Routledge & Kegan Paul Ldt., London.
[20] Schmidt, Siegfried, Ludwig Elm, and Günter Steiger (1983) Alma mater Jenensis.Geschichte der Universität Jena, Böhlau Verlag, Weimar
[21] Schneider, U. (1990) "The Reconstruction of the Universities in American Occupied Ger-many" in Hochschuloffi ziere und Wiederaufbau des Hochschulwesens in Westdeutschland1945-1952 - Teil 2: Die US Zone, ed. M. Heinemann in collaboration with U. Schneider,Edition Bildung und Wissenschaft, Hildesheim.
62
[22] Senat Hamburg (1955) Bauplanung für die Universität Hamburg: Denkschrift des Senatsder Freien und Hansestadt, Wohlfeld und Ellermann Verlag, Hamburg
[23] Technische Universität Dresden (1996) Geschichte der Technischen Universität Dresden inDokumenten, Bildern, Erinnerungen, ed. Achim Mehlhorn, vol. 3.
[24] Technische Universität München (1968) Technische Hochschule München 1868 - 1968,Oldenbourg Verlag, München.
[25] Technische Universität Stuttgart (1947) Denkschrift Die Technische Hochschule Stuttgarteinst und jetzt, Stuttgart.
[26] Tietze, Hartmut (1995) Datenhandbuch zur Deutschen Bildungsgeschichte Band I:Hochschulen, 2.Teil Wachstum und Differenzierung der deutschen Universiäten 1830 -1945, ed. Hartmut Tietze, Vandenhoeck & Ruprecht, Göttingen.
[27] van Rey, Manfred (1995) "Die Rheinische Friedrich-Wilhelms-Universität Bonn vom 18.Oktober 1944 bis 17. November 1945", Bonner Universitätsblätter.
[28] Weingand, Hans Peter (1995) Die Technische Hochschule Graz im Dritten Reich.Vorgeschichte, Geschichte und Nachgeschichte des Nationalsozialismus an einer Institu-tion, Österreichische Hochschülerschaft, Graz.
[29] Wolters, Paul (1950) "Der Wiederaufbau der Technischen Hochschule", in Jahrbuch derTechnischen Hochschule Hannover 1949-1950, eds. Otto von Leunenschloßund ErichBöttcher, Düsseldorf.
63