Boliden Tara Mines Tailing Management Facility (TMF ... · Environmental Protection Agency...
213
Environmental Protection Agency (Ireland) Boliden Tara Mines Tailing Management Facility (TMF) Industrial Emission Licence Review Assessment of Proposed Stage 6 TMF Extension Expert Report Document No. L116-17-R2418 December 2017
Transcript of Boliden Tara Mines Tailing Management Facility (TMF ... · Environmental Protection Agency...
Environmental Protection Agency (Ireland) Boliden Tara Mines Tailing Management Facility (TMF) Industrial Emission Licence Review Assessment of Proposed Stage 6 TMF Extension Expert Report Document No. L116-17-R2418 December 2017

Boliden Tara Mines Tailing Management Facility (TMF) Assessment of Proposed Stage 6 TMF Extension
Expert Report
FINAL REPORT_TARA MINE TMF_EPA _REV 2_ISSUED.DOCX
Amec Foster Wheeler L116-17-R2418
Page i
Revision Date Description Prepared Reviewed Approved
Study Manager Sign-off Client
0 March 2017 Draft Report issued for comments DB CM PLC
1 April 2017 Draft Report issued for comments DB CM PLC
2 Dec 2017 Final Report ES PLC PLC
Boliden Tara Mines Tailing Management Facility (TMF) Assessment of Proposed Stage 6 TMF Extension
Expert Report
FINAL REPORT_TARA MINE TMF_EPA _REV 2_ISSUED.DOCX
Amec Foster Wheeler L116-17-R2418
Page ii
Disclaimer
This Assessment of proposed Stage 6 TMF extension (Report) has been prepared for the Environmental Protection Agency (Ireland) by Amec Foster Wheeler Earth & Environment (UK) Ltd (Amec Foster Wheeler), based on assumptions as identified throughout the text and upon information and data supplied by others. The Report is to be read in the context of the methodology, procedures and techniques used, Amec Foster Wheeler’s assumptions, and the circumstances and constraints under which the Report was written. The Report is to be read as a whole, and sections or parts thereof should therefore not be read or relied upon out of context. Amec Foster Wheeler has, in preparing the Report, followed methodology and procedures, and exercised due care consistent with the intended level of accuracy, using its professional judgment and reasonable care. However, no warranty should be implied as to the accuracy of estimates or other values and all estimates and other values are only valid as at the date of the Report and will vary thereafter. Parts of the Report have been prepared or arranged by the Environmental Protection Agency (Ireland) or third party contributors, as detailed in the document. While the contents of those parts have been generally reviewed by Amec Foster Wheeler for inclusion into the Report, they have not been fully audited or sought to be verified by Amec Foster Wheeler. Amec Foster Wheeler is not in a position to, and does not, verify the accuracy or completeness of, or adopt as its own, the information and data supplied by others and disclaims all liability, damages or loss with respect to such information and data. In respect of all parts of the Report, whether or not prepared by Amec Foster Wheeler no express or implied representation or warranty is made by Amec Foster Wheeler or by any person acting for and/or on behalf of Amec Foster Wheeler to any third party that the contents of the Report are verified, accurate, suitably qualified, reasonable or free from errors, omissions or other defects of any kind or nature. Third parties who rely upon the Report do so at their own risk and Amec Foster Wheeler disclaims all liability, damages or loss with respect to such reliance. Amec Foster Wheeler disclaims any liability, damage and loss to Environmental Protection Agency (Ireland) and to third parties in respect of the publication, reference, quoting or distribution of the Report or any of its contents to and reliance thereon by any third party. This disclaimer must accompany every copy of this Report, which is an integral document and must be read in its entirety.
Boliden Tara Mines Tailing Management Facility (TMF) Assessment of Proposed Stage 6 TMF Extension
Expert Report
FINAL REPORT_TARA MINE TMF_EPA _REV 2_ISSUED.DOCX
Amec Foster Wheeler L116-17-R2418
Page iii
Table of Contents
Disclaimer ............................................................................................................... i
1. INTRODUCTION .............................................................................................. 1
2. BACKGROUND ................................................................................................ 1
3. INFORMATION REVIEWED ............................................................................. 3
4. TMF STAGE 6 EXTENSION PERMITTING ....................................................... 4
5. TMF STAGE 6 DESIGN REVIEW ...................................................................... 4
5.1 GEOTECHNICAL SITE AND LABORATORY INVESTIGATIONS (GSI) ................................. 4
5.1.1 General ...................................................................................................................... 4
5.1.2 Geotechnical Design Parameters .............................................................................. 4
5.1.3 Amec Foster Wheeler Comments ............................................................................. 5
5.2 GEOCHEMICAL CHARACTERISATION .................................................................................. 6
5.2.1 General ...................................................................................................................... 6
5.2.2 Amec Foster Wheeler Comments ............................................................................. 6
5.3 TAILINGS DISPOSAL OPTIONS STUDY ................................................................................ 6
5.3.1 General ...................................................................................................................... 6
5.3.2 Amec Foster Wheeler Comments ............................................................................. 6
5.4 TMF DESIGN CRITERIA .......................................................................................................... 7
5.4.1 General ...................................................................................................................... 7
5.4.2 Amec Foster Wheeler Comments ............................................................................. 7
5.5 FLOOD RETENTION AND FREEBOARD ................................................................................ 7
5.5.1 General ...................................................................................................................... 7
5.5.2 Amec Foster Wheeler Comments ............................................................................. 8
5.6 TMF DAM CROSS SECTIONS ................................................................................................ 8
5.6.1 General ...................................................................................................................... 8
5.6.2 Amec Foster Wheeler Comments ............................................................................. 9
5.7 CONSTRUCTION MATERIALS ................................................................................................ 9
5.7.1 General ...................................................................................................................... 9
5.7.2 Amec Foster Wheeler Comments ...........................................................................10
5.8 SLOPE STABILITY & SEEPAGE ANALYSES .......................................................................10
5.8.1 Seepage Analyses ...................................................................................................10
5.8.2 Slope stability Analyses ...........................................................................................10
5.8.3 Amec Foster Wheeler Comments ...........................................................................11
5.9 COMPOSITE LINER ...............................................................................................................12
5.9.1 General ....................................................................................................................12
5.9.2 Amec Foster Wheeler Comments ...........................................................................13
5.10 RUNOFF CONTROL ...............................................................................................................14
5.10.1 General ....................................................................................................................14
5.10.2 Amec Foster Wheeler Comments ...........................................................................14

Boliden Tara Mines Tailing Management Facility (TMF) Assessment of Proposed Stage 6 TMF Extension
Expert Report
FINAL REPORT_TARA MINE TMF_EPA _REV 2_ISSUED.DOCX
Amec Foster Wheeler L116-17-R2418
Page iv
5.11 TAILINGS DEPOSITION SYSTEM .........................................................................................14
5.11.1 General ....................................................................................................................14
5.11.2 Amec Foster Wheeler Comments ...........................................................................15
5.12 WATER MANAGEMENT ........................................................................................................15
5.12.1 General ....................................................................................................................15
5.12.2 Amec Foster Wheeler Comments ...........................................................................17
5.13 WATER BALANCE .................................................................................................................17
5.13.1 General ....................................................................................................................17
5.13.2 Amec Foster Wheeler Comments ...........................................................................17
5.14 RETURN WATER SYSTEM ...................................................................................................17
5.14.1 General ....................................................................................................................17
5.14.2 Amec Foster Wheeler Comments ...........................................................................18
5.15 WATER TREATMENT SYSTEM ............................................................................................18
5.15.1 General ....................................................................................................................18
5.15.2 Amec Foster Wheeler Comments ...........................................................................18
5.16 TAILINGS RUN-OUT ANALYSIS ...........................................................................................19
5.16.1 General ....................................................................................................................19
5.16.2 Amec Foster Wheeler Comments ...........................................................................19
5.17 OPERATION, MAINTENANCE AND SURVEILLANCE .........................................................19
5.17.1 General ....................................................................................................................19
5.17.2 Amec Foster Wheeler Comments ...........................................................................20
5.18 ACCESS ROADS ....................................................................................................................20
5.18.1 General ....................................................................................................................20
5.18.2 Amec Foster Wheeler Comments ...........................................................................20
5.19 CLOSURE ...............................................................................................................................20
5.19.1 General ....................................................................................................................20
5.19.2 Amec Foster Wheeler Comments ...........................................................................21
5.20 CONCLUSIONS AND RECOMMENDATION .........................................................................22
6. PROPOSED AMENDMENTS TO THE CURRENT IEL CONDITIONS ................ 24
7. REFERENCES ................................................................................................ 24
List of Attachments
Attachment 1 Documents Review Register
Attachment 2 Response to Further Information Requests
List of Tables
Table 5.1 Geotechnical Parameters (Ref. 1) ........................................................................................... 4

Boliden Tara Mines Tailing Management Facility (TMF) Assessment of Proposed Stage 6 TMF Extension
Expert Report
FINAL REPORT_TARA MINE TMF_EPA _REV 2_ISSUED.DOCX
Amec Foster Wheeler L116-17-R2418
Page v
List of Figures
Figure 2.1 Proposed TMF Stage 6 Extension (Ref. 1) ............................................................................ 2
Figure 5.1 Slope Stability Analysis Model .............................................................................................11
Figure 5.2 TMF Composite liner ............................................................................................................13
Figure 5.3 TMF Water management model ..........................................................................................15
Figure 5.4 Tara Mines Water Systems Flowsheet (Ref. 6) ...................................................................16
Boliden Tara Mines Tailing Management Facility (TMF) Assessment of Proposed Stage 6 TMF Extension
Expert Report
FINAL REPORT_TARA MINE TMF_EPA _REV 2_ISSUED.DOCX
Amec Foster Wheeler L116-17-R2418
Page 1
1. INTRODUCTION
Amec Foster Wheeler Earth & Environmental UK Ltd, now Wood plc (Amec Foster Wheeler) was selected
as first ranked tenderer for the provision of technical assistance and advice to the Environmental
Protection Agency of Ireland (EPA) on mines, extractive waste and related works (OEE-12-WLTU003-
Framework).
Under this framework contract Amec Foster Wheeler was appointed to undertake an assessment of
Boliden Tara Mines Ltd. (Tara Mines) proposed Stage 6 Tailings Management Facility (TMF) extension
as part of a review of the existing Industrial Emissions Licence (IEL) for the facility
(Register No. P0516- 04).
The EPA has outlined the tasks expected from Amec Foster Wheeler as follow:
Assess relevant documents related to the design, construction and operational stages of the
proposed Stage 6 TMF extension
Assess the proposed updated Closure Restoration and Aftercare Management Plan (CRAMP)
Identify any issues of an engineering, operational, environmental or safety nature arising from
reviewed documents that should be of concern to the EPA in the context of deciding whether to grant
a revised licence that would authorise the lateral extension
Determine and advise whether the design of the TMF extension, and the manner in which it is
proposed to be operated, represent BAT for management of tailings
Determine and advise whether the TMF design, and the proposed nature of operations, address the
requirements of Regulations 6(2), 11(2) (a) to (e) and 13(1) (a) to (c) of the Waste Management
(Management of Waste from the Extractive Industries) Regulations (SI No. 566 of 2009)
Advise on what, if any, additional information should be sought from the applicant to address
identified concerns prior to determination of the licence review application
Advise on whether particular concerns can adequately be addressed by conditions in a revised
licence.
2. BACKGROUND
The TMF associated with the operating mine falls within the scope of European Directive 2006/21/EC as
a Category A facility. The Regulations 2009 (S.I. No. 566 of 2009 on Management of Waste from the
Extractive Industries implemented the European directive in Ireland. The legislation was subsequently
amended by the European Union Regulations 2013 -Industrial Emissions (S.I. No. 138 of 2013).
Tara Mines currently holds an Industrial Emissions Licence IEL (Reg. No. P0516-03) for its lead zinc mine
located in Navan, Meath County, Ireland. The licence sets out in detail the conditions under which Tara
Mines must operate and manage this installation.

Boliden Tara Mines Tailing Management Facility (TMF) Assessment of Proposed Stage 6 TMF Extension
Expert Report
FINAL REPORT_TARA MINE TMF_EPA _REV 2_ISSUED.DOCX
Amec Foster Wheeler L116-17-R2418
Page 2
Tara Mines is now proposing an extension of the TMF (Stage 6) north of the existing facility to increase
storage capacity. The proposed extension has triggered a review of the existing IEL. The licence review
has been assigned Register No. P0516-04.
Figure 2.1 Proposed TMF Stage 6 Extension (Ref. 1)
An Environmental Impact Statement (EIS) (Ref. 1) and Natura Impact Statement (NIS) (Ref. 2) were
submitted to the local authority (Meath Country Council) as part of the TMF development Planning
Application.
The following definitions were used in the EIS document to describe the proposed development:
“Perimeter embankment refers only to the walls, constructed of clay fill, within which the tailings are deposited.

Boliden Tara Mines Tailing Management Facility (TMF) Assessment of Proposed Stage 6 TMF Extension
Expert Report
FINAL REPORT_TARA MINE TMF_EPA _REV 2_ISSUED.DOCX
Amec Foster Wheeler L116-17-R2418
Page 3
Tailings Storage Facility [TSF] refers only to the total area of deposited tailings within the perimeter embankment.
Tailings Management Facility [TMF] refers to the whole operational site, which, in addition to the tailings dam, includes the supporting infrastructure such as the interceptor channel, perimeter road, pump house, etc.”
The design for Stage 6 TMF and the proposed Integrated Constructed Wetland (ICW) were developed
by Golder Associates and Vesi Environmental respectively (Ref. 1).
The proposed Stage 6 TMF will consist of a lateral extension of the exiting ring-dyke facility over an area
of 58 ha to a height of 22 m above ground level. The ICW system will be constructed for water treatment
purpose at closure.
In November 2016 a notification of decision on the planning application permit was issued by Meath
Country Council for the proposed TMF (Reg. NA 160408), the decision was subsequently appealed to
the An Bord Pleanála (Reg. No PL 17.247707). In July 2017, following An Bord Pleanála, permission
was granted subject to conditions for the tailings facility extension, but not for the proposed ICW.
3. INFORMATION REVIEWED
The following documents were reviewed:
i. Licence review application documentation (P0615-04)
ii. Project description and engineering design (EIS Attachment – B6 – 1, Section 3)
iii. Water Framework Directive Assessment (EIS Appendix – 8.1B)
iv. Various reports related to hydrogeology and soil contamination in the vicinity of the TMF (See
Attachment I.5 and Appendix I of the Application Form for background regarding this matter)
v. EIS for TMF extension Stage 6 (EIS Attachment – B6 – 1)
vi. Current industrial emissions licence (Register No. P0516-03) and the Inspectors Report for that
licence application
vii. Updated closure, restoration and aftercare management plan (Attachment K to the Application
Form)
viii. Other documentation related to the industrial emissions licence that is deemed necessary to the
assessment.
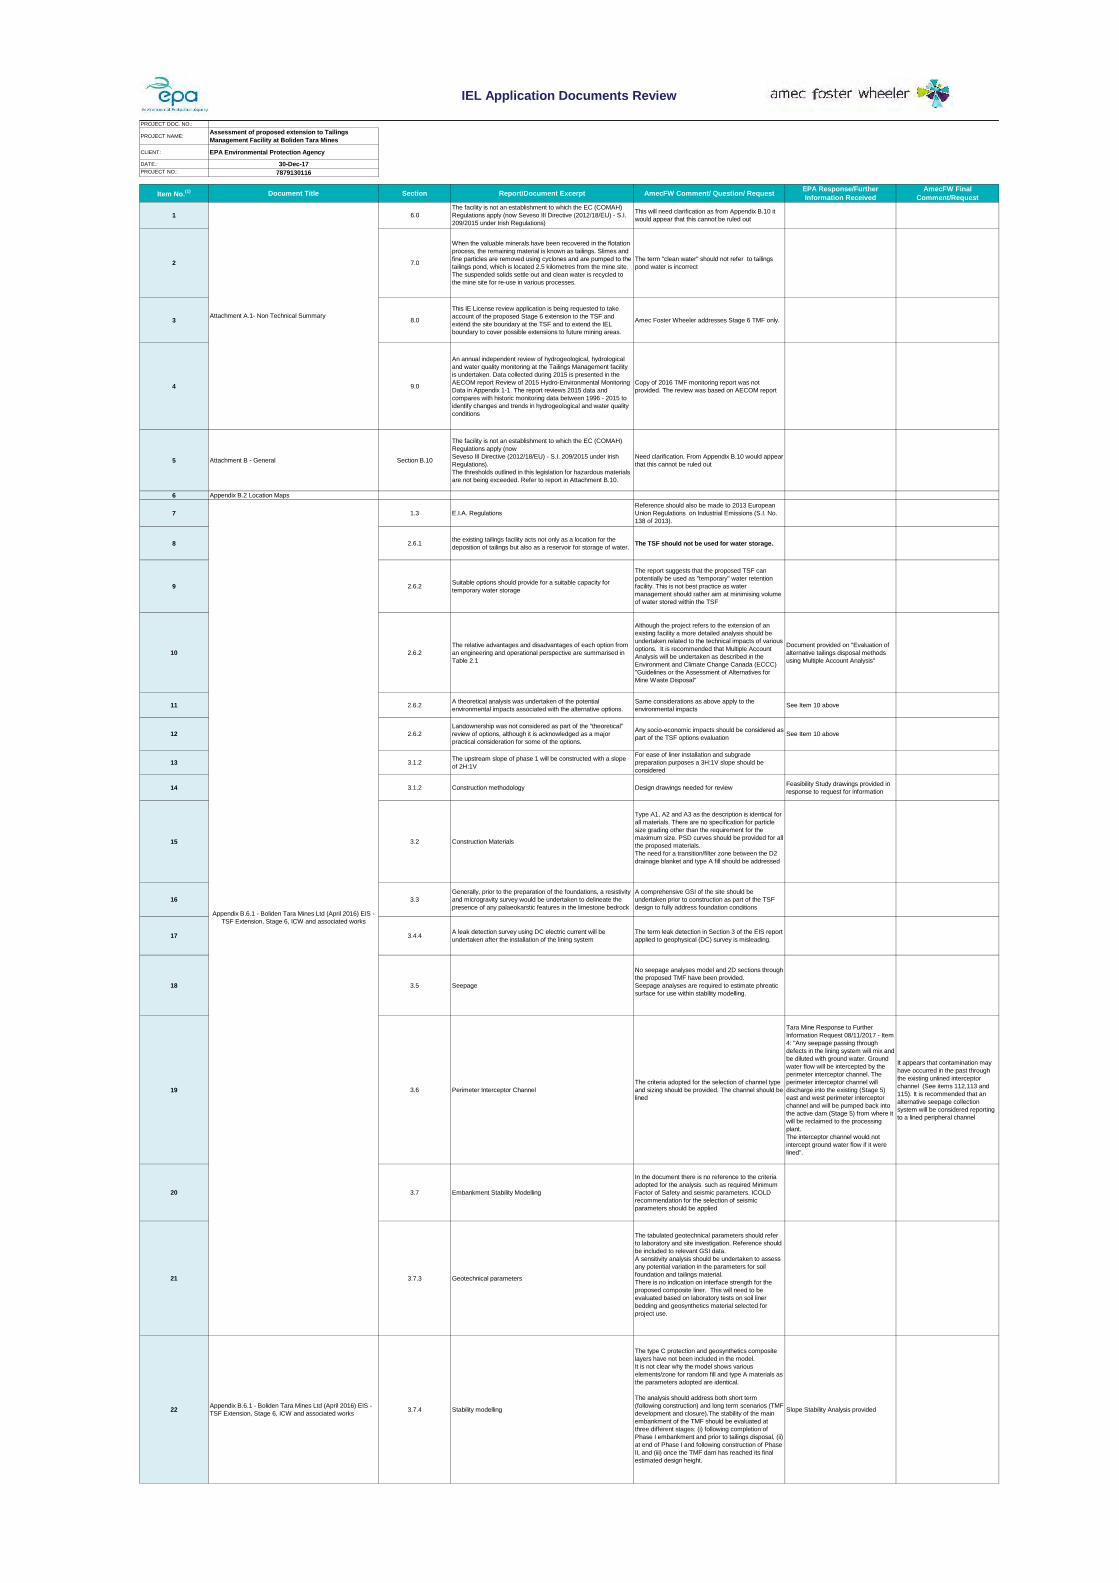
A list of the documents provided as part of the IEL Review application is presented in Attachment 1, which
includes comments and requests for clarification to validate concerns with the documents provided.
In April 2017 following the initial review Amec Foster Wheeler provided comments on the TMF design
together with reference to documents relevant to the Stage 6 TMF extension and request for further
information.
Additional documents provided by Tara Mines in response to the EPA’s request for further information
are presented in Appendix 2.

Boliden Tara Mines Tailing Management Facility (TMF) Assessment of Proposed Stage 6 TMF Extension
Expert Report
FINAL REPORT_TARA MINE TMF_EPA _REV 2_ISSUED.DOCX
Amec Foster Wheeler L116-17-R2418
Page 4
4. TMF STAGE 6 EXTENSION PERMITTING
The proposed extension for the TMF will require planning permission and the revision of Tara Mines
current IEL by the EPA.
In November 2016 a “Notification of Decision” (Reg. No NA/160408) was issued by the Planning
Department of Meath County Council with regard to the planning application for the extension of the TMF
at Tara Mines. The decision to grant permission was subject to 28 requests for further
“information/revised plans” included in the Schedule of Conditions.
In April 2016 the notification of Meath County Council was appealed to An Bord Pleanála (Reg. No
PL 17.247707). In July 2017, following An Bord Pleanála decision, a permission was granted subject to
conditions for the tailings facility extension, but not for the ICW.
5. TMF STAGE 6 DESIGN REVIEW
5.1 GEOTECHNICAL SITE AND LABORATORY INVESTIGATIONS (GSI)
5.1.1 General
The proposed extension will cover an area within the existing TMF borrow areas. “The footprint of the Stage 6 facility is confined to the existing northern and seven fields borrow areas. Virtually all the area is exposed indicating rock or glacial till over the site.” (Ref. 1)
It is understood that geotechnical borehole drilling and trial pitting was undertaken at the project site
together with a geophysical survey to assess soil foundation conditions, identify any palaeokarstic
features in the limestone bedrock and determine the ‘excavatability’ of the bedrock ”(Ref.1).
“The palaeokarst investigation did not identify any large voids beneath the footprint of the Stage 6 TMF Facility that might pose a risk to the integrity of the Stage 6 TMF Facility” (See Attachment 2 - Tara Mines
Response to Further Information Request 12/09/2017).
Wells were also installed to monitor groundwater levels around the existing TMF. However, the
monitoring wells in the northern section of the existing TMF would be decommissioned and replaced with
boreholes located around the perimeter of TMF Stage 6 extension.
5.1.2 Geotechnical Design Parameters
The geotechnical strength parameters adopted in the stability modelling are presented in the table below. As per EIS report (Ref. 1) “Effective strength parameters are typically used to assess long-term stability (after closure), whereby the excess pore pressures developed in any fine grained soils have dissipated.”
Table 5.1 Geotechnical Parameters (Ref. 1)
Material Type Unit Weight
(kN/m3) Effective Strength
c’ F’

Boliden Tara Mines Tailing Management Facility (TMF) Assessment of Proposed Stage 6 TMF Extension
Expert Report
FINAL REPORT_TARA MINE TMF_EPA _REV 2_ISSUED.DOCX
Amec Foster Wheeler L116-17-R2418
Page 5
(kPa) (deg) Type A 19 0 32
Typed D1 and D2 21 0 37
Tailings 18 0 32
In-situ Glacial Till 20 5 32
Limestone Bedrock 1 -
Note 1. Assumed impenetrable for slope analysis
5.1.3 Amec Foster Wheeler Comments
The tabulated geotechnical parameters included in the design report should make reference to a separate
comprehensive geotechnical interpretive report to include:
Site investigation plan (boreholes, trial pits and geophysics)
Geotechnical logs
Soil and rock laboratory testing (foundation soil and construction materials)
Tailings geotechnical characterisation
Geological plan and sections
It is understood that Tara Mines is proposing to import “demolition waste or materials made from construction and demolition waste” for TMF construction (Appendix 2 Response to Further
Information Request 08/11/2017. The geotechnical investigation should also address imported material
to confirm suitability for construction
A variability assessment should be undertaken to assess any potential variation in the parameters for soil
foundation, tailings and embankment construction material.

Boliden Tara Mines Tailing Management Facility (TMF) Assessment of Proposed Stage 6 TMF Extension
Expert Report
FINAL REPORT_TARA MINE TMF_EPA _REV 2_ISSUED.DOCX
Amec Foster Wheeler L116-17-R2418
Page 6
5.2 GEOCHEMICAL CHARACTERISATION
5.2.1 General
The EIS suggests that the “physical and chemical characteristics of the deposited tailings will remain unchanged from those deposited previously” (Ref. 1).
Based on laboratory testing on tailings samples collected in 2015 “the tailings are expected to be non-acid generating” (Ref. 2).
5.2.2 Amec Foster Wheeler Comments
The assessment of potential for acid generating drainage should also include construction materials. It
is recommended that laboratory testing is also carried out during TMF operation to confirm that there are
no significant changes in the tailings geochemistry.
5.3 TAILINGS DISPOSAL OPTIONS STUDY
5.3.1 General
The preliminary site options review for the TMF location considered three alternatives:
“A lateral extension of the existing facility to the north, south, east or west.
A vertical extension of the existing facility.
Construction of a completely new facility at an unspecified location.”
A qualitative appraisal of potential engineering and environmental impacts concluded that a lateral
extension to the north of the existing facility is the most favourable option.
Following Amec Foster Wheeler review and EPA’s request for further information, an evaluation of tailings
disposal options was undertaken addressing various methods (See Attachment 2- Tara Mines Response
to Further Information Request 08/11/2017). The assessment used Multiple Account Analysis methods
through the development of accounts and sub-accounts of the impact of various proposed alternative.
The quantitative evaluation of the TMF options technical, environmental and socio-economic impacts
concluded that conventional slurry tailings deposition is the most favourable option.
5.3.2 Amec Foster Wheeler Comments
Following pre-screening stage the filter cake disposal option was discarded due to “a number of reasons but primarily;
potential mechanical damage to the lining system from either trucks or conveyor system,
insufficient storage capacity to manage storm events
having the greatest negative environmental impacts.”

Boliden Tara Mines Tailing Management Facility (TMF) Assessment of Proposed Stage 6 TMF Extension
Expert Report
FINAL REPORT_TARA MINE TMF_EPA _REV 2_ISSUED.DOCX
Amec Foster Wheeler L116-17-R2418
Page 7
However there are advantages in using a filtered tailings (dry stacking) disposal system which were not
considered in the pre-screening assessment including:
Smaller footprint compared to other options
Very low potential for groundwater contamination through seepage
Reduced risk of catastrophic failure
Reduce volume of construction material required (no need for tailings dam)
The assessment also suggests that unlike dry stacking for the other options considered (slurry, thickened
and paste tailings) the “TSF can act as water reservoir”. Amec Foster Wheeler strongly advices that the
TSF should not be designed or used for water storage.
5.4 TMF DESIGN CRITERIA
5.4.1 General
No specific TMF design criteria document has been provided for review.
5.4.2 Amec Foster Wheeler Comments
A design criteria document should be developed summarising the TMF design basis. The design criteria
should include design input data from various sources (seismicity, geotechnical, geochemical,
environmental, process etc.). Each criterion should be source referenced and notes included where
assumptions have been made that may require further verification.
5.5 FLOOD RETENTION AND FREEBOARD
5.5.1 General
It is understood that the TMF will be constructed in two phases only consisting of a 14 m high starter
embankment extension of the existing TMF embankment to the north (Phase I) followed by a downstream
raise to 67.29 m AOD final elevation (Phase II) (Ref. 1).
As part of the EIS, a preliminary appraisal was undertaken addressing flood risk within the Stage 6 TMF
and environs. The review used information available from the preliminary flood maps developed by the
Office of Public Works (OPW) in 2011 and from the national Preliminary Flood Risk Assessment (PFRA)
Overview Report dated March 2012.
The scoping study concluded that “on the basis of the PFRA screening maps it is therefore probable that a full FRA will be called for within the planning application for the proposed extension at the Tara Mines facility due to the presence on a possible flood plain.” (Ref. 4).
Section 3.9 of the EIS report (Ref. 1) suggests that “During the operation of Phase 1 and Phase 2 the tailings level will be filled to a point leaving a ‘free board’ of 1 metre. The pond water level will be kept to 1.5m below the crest during operations.”
Boliden Tara Mines Tailing Management Facility (TMF) Assessment of Proposed Stage 6 TMF Extension
Expert Report
FINAL REPORT_TARA MINE TMF_EPA _REV 2_ISSUED.DOCX
Amec Foster Wheeler L116-17-R2418
Page 8
The report also suggests that the “type of perimeter dam used for tailings storage, which has no external catchment area, is normally operated without spillways. There is always adequate control on the tailings water level which can be achieved by adjusting the discharges into the TMF and removal of tailings water by pumping from the TSF to the plant site.
5.5.2 Amec Foster Wheeler Comments
Amec Foster Wheeler disagree with the presumption that “There is always adequate control on the
tailings water level”. Lack of control of the tailings water level has been a contributing factor to tailings
dam failures and provision of an emergency spillway is considered good practice.
Alternatively, capacity to store the Probable Maximum Precipitation (PMP) of appropriate duration would
be acceptable. The PMP is determined for very long return periods and although generally not defined
is considered to be in the order of 100,000 years or greater.
Although the construction of the starter embankment (Phase I) and subsequent downstream raise should
ensure that sufficient retention volume will be available, reference should be made to the criteria adopted
to determine the minimum design freeboard. In the absence of an emergency spillway the adopted
freeboard during operations need justification, including:
Depth-storage capacity curve showing tailings rate of raise and embankment crest elevation
Definition of the design storm events for various duration and return period and PMP.
Assessment of TSF design storm events storage capacity
Amec Foster Wheeler agree that a detailed flood risk assessment to include potential impact of climate
changes is required.
5.6 TMF DAM CROSS SECTIONS
5.6.1 General
A description for the proposed Stage 6 TMF dam is presented in Section 3 of the EIS report (Rev. 1).
The dam upstream slope “will be constructed with a slope of 2H:1V and will be keyed into the northern embankment wall of the existing facility…. The crest width of the dam walls for all phases is 6 m and the maximum wall height will be approximately 22 m. The upstream sector of the proposed dam will consist of a 6m wide unit of clayey glacial till (Type A1 and/or Type A2). The footprint of the dam wall will be constructed with a 1m minimum thickness of Type D2 rock which acts as a drainage blanket. To bring the dam wall up to an elevation of 44.29 m AOD will require approximately 2,500 m3 of Type D2 material. On the lower parts of the downstream sector of the dam wall, a 6 m width of Type A2 glacial till will be placed. Between the upstream Type A1/A2 zone and the downstream Type A2 zone is a random fill zone which would include Type A2 and A3 as well as Type D2 material.
Boliden Tara Mines Tailing Management Facility (TMF) Assessment of Proposed Stage 6 TMF Extension
Expert Report
FINAL REPORT_TARA MINE TMF_EPA _REV 2_ISSUED.DOCX
Amec Foster Wheeler L116-17-R2418
Page 9
The northern embankment wall of the existing TSF, perimeter interceptor channel and finger drain channels will be stripped of topsoil and vegetation prior to receiving the protection material and lining system forming Stage 6. A 100 mm layer of processed rock-fill Type C material would be placed over the Type A materials on the upstream side of the new Stage 6 dam walls and on the northern face of the existing embankment wall to provide protection for the lining system. The maximum particle size of the Type C would be 20 mm and the material would be well graded. A 1,000 g/m2 non-woven geotextile will be placed on top of the Type C material prior to placement of the lining system. The adjoining wall would be cleaned of vegetation, trimmed to receive the 100 mm layer of Type C followed by the 1,000 g/m2 nonwoven geotextile. The Type C material on the dam walls would continue over the backfilled finger channels and backfilled perimeter interceptor channel.
5.6.2 Amec Foster Wheeler Comments
The proposed dam will be constructed “from several materials which include cohesive glacial till, granular glacial material and processed rock fill”. It is proposed that TMF dam earthfill (type A1, A2 and A3) will
be placed in 300 mm lifts, compacted to 95 % Standard Proctor to form 1V:2H slopes. However, subject
to earthfill grading and moisture conditions it may prove difficult to achieve the required compaction. Also,
the constructability of placing a 100 mm thick only protection layer is of concern. Provision of a permeable
horizon would not be recommended as it can increase the potential for seepage.
For ease of construction and safety purposes during geosynthetics installation, Amec Foster Wheeler
recommend that consideration is given to providing a 1V:3H slope for the TMF dam upstream slope.
5.7 CONSTRUCTION MATERIALS
5.7.1 General
From the EIS report (Rev. 1) the TMF embankment will consist of the following material types:
Type A1 and A2 Cohesive Glacial Till
Type A3 Glacial Granular Material
Type B Road Material
Type C Protection Material
Type D1 Backfilling Existing Borrow Area Drains
Type D2 Dam Footprint Drainage Blanket Material
Type E 75 mm Coarse Drainage Backfill for Perimeter Interceptor Channel and Concrete Chutes.” For type C it is suggested that the material “will be nominally compacted with a smooth roller on the basin floor. The protection material placed on the dam wall side slopes will also be nominally compacted with a smooth roller winched down from the crest or by an alternative method agreed by the Engineer.”
Boliden Tara Mines Tailing Management Facility (TMF) Assessment of Proposed Stage 6 TMF Extension
Expert Report
FINAL REPORT_TARA MINE TMF_EPA _REV 2_ISSUED.DOCX
Amec Foster Wheeler L116-17-R2418
Page 10
5.7.2 Amec Foster Wheeler Comments
Type A1, A2 and A3 as the description is identical for all materials. There are no specification for particle
size grading other than the requirement for the maximum size. PSD curves should be provided for all the
proposed materials.
The need for a transition/filter zone between the D2 drainage blanket and type A fill should be addressed.
As noted in Section 5.6, it is recommended that a 1V:3H slope is adopted for the TMF dam upstream
slope to facilitate material compaction.
5.8 SLOPE STABILITY & SEEPAGE ANALYSES
5.8.1 Seepage Analyses
Section 3.5 “Seepage” of the EIS report discusses the “likelihood” of potential leakage through the liner
based on design equations available from published technical literature. Estimates were “based on a number of variables including infiltration rate based on the range of vertical permeability values of the tailings, the range of defects in the lining per hectare, the effective permeability of the composite lining and head acting on the lining.” (See Tara Mines Response to Further Information Request 12/09/2017).
Current design assumptions on materials permeability will need to be validated as part of the detailed
design.
5.8.2 Slope stability Analyses
The slope stability of the Stage 6 TMF has been evaluated by means of limit equilibrium analyses.
Minimum factors of safety have been computed with the commercial software. The models were
analysed for both static and pseudo-static (seismic) loading.
The results of the stability analyses were as below (Ref. 1):
“The factor of safety for the static and pseudo-static cases assuming the internal drainage system is operational are satisfactory.
Where the drainage system is non-operational, the factor of safety for the static condition is satisfactory.
In the statistically unlikely event of an earthquake, the factor of safety is 0.99 which under these conservative conditions, is acceptable.”
“The model geometry is based on a typical cross-section of perimeter dam wall at full height (67.29 m AOD) including the bench at 59.29 m AOD…..The geotechnical strength parameters adopted in the stability modelling are presented in the table 3.10 and the geometric configuration presented in Figure 3.14.”
Boliden Tara Mines Tailing Management Facility (TMF) Assessment of Proposed Stage 6 TMF Extension
Expert Report
FINAL REPORT_TARA MINE TMF_EPA _REV 2_ISSUED.DOCX
Amec Foster Wheeler L116-17-R2418
Page 11
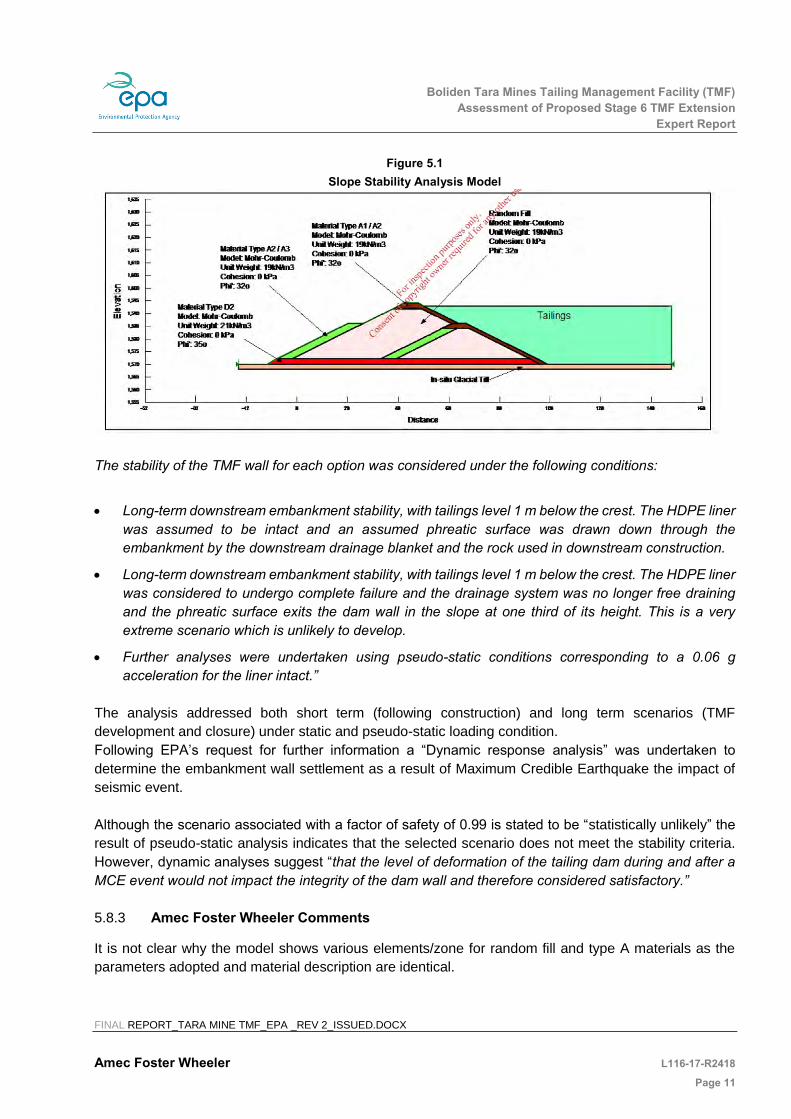
Figure 5.1 Slope Stability Analysis Model
The stability of the TMF wall for each option was considered under the following conditions:
Long-term downstream embankment stability, with tailings level 1 m below the crest. The HDPE liner was assumed to be intact and an assumed phreatic surface was drawn down through the embankment by the downstream drainage blanket and the rock used in downstream construction.
Long-term downstream embankment stability, with tailings level 1 m below the crest. The HDPE liner was considered to undergo complete failure and the drainage system was no longer free draining and the phreatic surface exits the dam wall in the slope at one third of its height. This is a very extreme scenario which is unlikely to develop.
Further analyses were undertaken using pseudo-static conditions corresponding to a 0.06 g acceleration for the liner intact.”
The analysis addressed both short term (following construction) and long term scenarios (TMF
development and closure) under static and pseudo-static loading condition.
Following EPA’s request for further information a “Dynamic response analysis” was undertaken to
determine the embankment wall settlement as a result of Maximum Credible Earthquake the impact of
seismic event.
Although the scenario associated with a factor of safety of 0.99 is stated to be “statistically unlikely” the
result of pseudo-static analysis indicates that the selected scenario does not meet the stability criteria.
However, dynamic analyses suggest “that the level of deformation of the tailing dam during and after a MCE event would not impact the integrity of the dam wall and therefore considered satisfactory.”
5.8.3 Amec Foster Wheeler Comments
It is not clear why the model shows various elements/zone for random fill and type A materials as the
parameters adopted and material description are identical.

Boliden Tara Mines Tailing Management Facility (TMF) Assessment of Proposed Stage 6 TMF Extension
Expert Report
FINAL REPORT_TARA MINE TMF_EPA _REV 2_ISSUED.DOCX
Amec Foster Wheeler L116-17-R2418
Page 12
There is no indication of the criteria adopted for the selection of the seismic design parameters (design
earthquakes and associated ground acceleration) used for the analysis. Appropriate ground motion
parameters and return period associated with the design seismic events should be adopted as per
International Commission on Large Dams ICOLD. In accordance with the ICOLD guidelines (Ref. 5) the
definitions of earthquakes for which the structure should be designed are:
Maximum Credible Earthquake (MCE)
Operating Basis Earthquake (OBE).
Although the project site may be located in a low seismic area, the potential for liquefaction should be
addressed based on the anticipated maximum seismic peak ground acceleration, embankment fill and
foundation soil conditions.
5.9 COMPOSITE LINER
5.9.1 General
As per the EIS report “The proposed stage 6 extension will incorporate a composite lining system which consists of high density polyethylene (HDPE) geomembrane over a geosynthetic clay liner (GCL). The composite lining will overlie a 1000 g/m2 geomembrane which in turn overlies 100 mm of Type C protection material”. The HDPE will be 2 mm thick, double textured and is placed directly over GCL on the 2H:1V upstream slopes of the dam wall. In the basin area the HDPE is 2 mm thick and smooth and is placed directly over the GCL. Three types of geotextile material are required, a 1000 g/m2 non-woven needled punched geotextile to protect the lining system from underneath, a carbon rich 500 g/m2 non-woven needled punched geotextile to protect the lining system from above on the slope and a Terram 1000 or equivalent as a separation medium. A permanent surcharge is required on the exposed geomembrane to prevent the HDPE from being lifted and damaged by wind action and minimise damage from pipe movements. It also acts as a ladder if someone accidently falls into the facility. The surcharge will consist of car tyres in filled with Type C material and placed on the carbon rich 500 g/m2 non-woven needle punched geotextile”

Boliden Tara Mines Tailing Management Facility (TMF) Assessment of Proposed Stage 6 TMF Extension
Expert Report
FINAL REPORT_TARA MINE TMF_EPA _REV 2_ISSUED.DOCX
Amec Foster Wheeler L116-17-R2418
Page 13
Figure 5.2 TMF Composite liner
It is understood that “A leak detection survey using DC electric current will be undertaken after the installation of the lining system.”
Section 3.6 suggests that “The regional groundwater flow is from the north east to the south west and the minimal seepage passing through defects in the lining system will mix and be diluted with the ground water.”
5.9.2 Amec Foster Wheeler Comments
It appears that no leak detection and collection system will be installed. The term leak detection in Section
3 of the EIS report applied to geophysical (DC) survey is misleading. However, the use of a geophysical
method following installation of the HDPE geomembrane and the adoption of a comprehensive QA/QC
plan during installation should minimise the risk of leakage through the geomembrane.
Boliden Tara Mines Tailing Management Facility (TMF) Assessment of Proposed Stage 6 TMF Extension
Expert Report
FINAL REPORT_TARA MINE TMF_EPA _REV 2_ISSUED.DOCX
Amec Foster Wheeler L116-17-R2418
Page 14
From the liner typical sections it would appear that the access road will run above the anchor trench. This
should be avoided to prevent any risk of damaging the liner during construction and operation. A road
safety berm should also be adopted.
5.10 RUNOFF CONTROL
5.10.1 General
It is proposed that the “interceptor channel close to the base of the dam captures vertical and horizontal seepage. Seepage water collected in the interceptor channel is then pumped back up to the TMF (tailings pond) from pumps with automated level controls, located at intervals around the interceptor channel. By returning seepage back to the TMF, a closed water cycle system operates which helps to protect the local water environment.” (Ref. 1)
As per TMF Closure Plan (Ref. 2) “The Stage 6 unlined perimeter interceptor channel will discharge into the existing TMF east and west perimeter interceptor channels during operation. An unlined perimeter interceptor channel surrounds the Stage I, II and III embankment walls collecting seepage water via a blanket of finger drains and intercepts flow from under the dam. The internal drainage system for Stage 4 and Stage 5 is directed to the perimeter interceptor channel by means of manholes, pipework and chutes. The perimeter interceptor channel feeds two collection sumps from which all water is pumped back to the tailings pond.”
Section 3.6 of the EIS report suggests that a “The regional groundwater flow is from the north east to the south west and the minimal seepage passing through defects in the lining system will mix and be diluted with the ground water…..perimeter interceptor channel will collect surface water runoff from the dam walls, perimeter road and borrow areas. This seepage will be insignificant when compared with the clean surface water runoff from the dam walls and surrounding land.”
From the EPA Inspectors report dated April 2012 it appears that “there is evidence of contamination of groundwater with sulphate to the south west of the TMF, i.e. downstream of the TMF. This indicates that, historically, some seepage has escaped the interceptor channel and moved away from the TMF.”
5.10.2 Amec Foster Wheeler Comments
It is recommended that an alternative seepage detection and collection system reporting to a lined
peripheral channel be considered to minimise potential for groundwater contamination.
5.11 TAILINGS DEPOSITION SYSTEM
5.11.1 General
“Stage 6 will be operated similar to the existing TSF by discharging the tailings from spigots from the dam crest. The spigots will be open sequentially and the tailings will be discharged uniformly over the TMF. The discharge spigots will be spaced at 50 metre centres and two tailings lines will be operated around the facility in opposite directions. Unlike the current Stage 5 operation, there will be a considerable depth between the crest and the basin floor initially.”

Boliden Tara Mines Tailing Management Facility (TMF) Assessment of Proposed Stage 6 TMF Extension
Expert Report
FINAL REPORT_TARA MINE TMF_EPA _REV 2_ISSUED.DOCX
Amec Foster Wheeler L116-17-R2418
Page 15
A typical layout of the tailings pipeline, deposition points and decant location were provided for review.
5.11.2 Amec Foster Wheeler Comments
The embankment cross-section shows a 6 m crest width. This may not be sufficient to accommodate the
tailings delivery pipelines and safety bunds.
The EIS report does not contain information on the tailings pipeline from plant to TMF. The Environmental
Emergency & Preparedness Response Procedure in Appendix to the IEL review application suggest that
“The tailings pipeline is constructed from 630mm high-density polyethylene (HDPE) and is buried for all of its length.” No information on the pipeline route, or proposed pipe cross-section and long section was presented in
the design report. Amec Foster Wheeler note that burying tailings pipelines is not always best practice
and consideration of containment in the event of leakage should be considered and discussed.
5.12 WATER MANAGEMENT
5.12.1 General
A conceptual water management model is discussed in Section 8.2.1 of the EIS report: “The proposed design for water management would be similar to that proposed for Stage 5 closure which involves the use of a spillway system connected to the interceptor channel. This would divert water to a wetland area for water treatment prior to discharge into the local river system as described in the Scott Wilson EIS (Scott Wilson, 2009). The spillway would be located and designed in detail closer to the end of the life of the Stage 6 facility.”
Figure 5.3 TMF Water management model

Boliden Tara Mines Tailing Management Facility (TMF) Assessment of Proposed Stage 6 TMF Extension
Expert Report
FINAL REPORT_TARA MINE TMF_EPA _REV 2_ISSUED.DOCX
Amec Foster Wheeler L116-17-R2418
Page 16
A schematic describing the Tara Mines Water System is included in the Attachment D to the IEL
application. The document identifies “three sources of water that are considered process water. These are as follows:
Water ingress to the mine that is pumped out to maintain a suitable dry working environment
Surface run-off
Water from processing plant.
Water from these three sources is collected, pumped and treated prior to discharge to the River Boyne at Emission Point Reference SW1. All water from the process plant is pumped to the TSF. This water is recycled back to the reclaim pond in the mine site after suspended solids have settled at the TSF. Minewater and surface run-off, representing a low risk effluent are treated in the onsite water treatment system….Water from the Reclaim Water Pond decants, via a controlled overflow, to a Clear Water Pond (Discharge pond). The discharge from the Clear Water Pond to the River Boyne is via a weir structure, which measures and controls the discharge.”
Figure 5.4
Tara Mines Water Systems Flowsheet (Ref. 6)
Boliden Tara Mines Tailing Management Facility (TMF) Assessment of Proposed Stage 6 TMF Extension
Expert Report
FINAL REPORT_TARA MINE TMF_EPA _REV 2_ISSUED.DOCX
Amec Foster Wheeler L116-17-R2418
Page 17
Section 5.4.1.2 of the EIS report (Ref. 1) suggests that the “continued monitoring of the TMF since operation of the Stage 5 extension has shown that the interceptor channel is effectively capturing almost all seepage from the tailings storage facility through the embankment walls. As this water is then recycled back to the Stage 5 TMF, a closed water cycle system is operating.”
Appendix B6.6 of the IEL application suggests that currently “All water from the process plant is pumped to the tailings facility for treatment prior to return of treated water to the reclaim pond. Minewater and surface run-off, representing a low risk effluent are treated in the on site water treatment system.”
5.12.2 Amec Foster Wheeler Comments
Collection systems for clean runoff and for seepage from the TMF should be separated. The seepage
peripheral channel should be fully lined if used to collect and discharge seepage water into the water
treatment system.
The statement that “All water from the process plant is pumped to the tailings facility” need clarification.
The TSF should not be designed or used for water storage.
5.13 WATER BALANCE
5.13.1 General
No water balance provided for review
5.13.2 Amec Foster Wheeler Comments
A water balance is required for the proposed Stage 6 for the TMF with input parameters such as tailings
throughput, tailings pulp density, rainfall, evaporation, runoff and other losses.
The water balance should be based on monthly time step over the life of mine and for a range of
meteorological scenarios. The aim is to determine the TMF water management system requirements
based on the amount of water returned to the process plant and the need for make-up water and water
treatment.
The determination of the volumes associated to the water balance are of particular importance given
consideration of the statement mentioned in 5.12.2 above
5.14 RETURN WATER SYSTEM
5.14.1 General
There are no specific details provided of the proposed return water system for Stage 6 TMF. EIS report
(Ref. 1) suggests that “Where the reclaim pumps are located, a continuous protection (liner protection) of in filled tyres will be required some 20 m wide. The optimum location of the reclaim pumps is firstly along the existing northern wall of Stage 5 in the south east sector where the future spillway can discharge into the eastern perimeter interceptor channel.
Boliden Tara Mines Tailing Management Facility (TMF) Assessment of Proposed Stage 6 TMF Extension
Expert Report
FINAL REPORT_TARA MINE TMF_EPA _REV 2_ISSUED.DOCX
Amec Foster Wheeler L116-17-R2418
Page 18
The second option is along the existing northern wall but in the south west sector where the future spillway can discharge into the western perimeter interceptor channel. The sand line also poses a potential challenge as this would be discharged from a 600 mm diameter pipe. Again the liner will be protected with a minimum 20 m wide continuous in filled tyre. This line will be located on the northern wall of Stage 5 where the composite lining and lining protection can be installed for both the phases from the beginning. To prevent damage of the lining at the point of discharge and to provide surcharge for the base, the basin should be filled with a minimum of 1 m of water equating to approximately 430,000 m3” 5.14.2 Amec Foster Wheeler Comments
A more detailed description of the proposed return water system should be provided. Figure 3.20 of the
EIS report shows a concrete platform 2 m from the toe of the slope (adjacent) to the 500 g/m2 geotextile.
The design criteria and requirement for a concrete platform need clarification. Details of liner/concrete
seal should be provided.
Alternative to the proposed 1 m water cover geomembrane protection should be considered (polyethylene
mat covers or similar). Compatibility of providing a water cover with the objective of minimising water
pressure on a liner to reduce potential seepage should be considered.
5.15 WATER TREATMENT SYSTEM
5.15.1 General
It is proposed that (Ref. 1) “The operation phase of the proposed Stage 6 tailings pond, including treatment of excess tailings pond supernatant water and surface water run-off within the existing treatment scenario via a recirculation system. Finally, the decommissioning of Stage 6 will include the decommissioned Stage 5 site and surface water run-off from both areas will be treated via a constructed wetland system and subsequently discharged to the River Blackwater.
The existing drainage system within the TSF will be modified to accommodate the extra storage capacity provided by Stage 6, but the previous system would still operate as designed for the Stage 5 raise. As such the existing water reticulation system will continue to operate, i.e. water will be pumped back to the mine and subsequently discharged to the River Boyne, under the existing IE licence.”
5.15.2 Amec Foster Wheeler Comments
It is proposed that the existing water treatment will be used for both Stage 5 and Stage 6 TMF until an
Integrated Constructed Wetland system will be operating, following Stage 6 decommission. Most of the
studies included in the IEL address the design and operation of the ICW. More information should be
provided on the suitability of the existing water treatment to accommodate the increased volumes
following Stage 6 start up and prior to Stage 5 decommissioning.
Boliden Tara Mines Tailing Management Facility (TMF) Assessment of Proposed Stage 6 TMF Extension
Expert Report
FINAL REPORT_TARA MINE TMF_EPA _REV 2_ISSUED.DOCX
Amec Foster Wheeler L116-17-R2418
Page 19
5.16 TAILINGS RUN-OUT ANALYSIS
5.16.1 General
Dam breach analysis was undertaken for the TMF (See Attachment 2- Tara Mines Response to Further
Information Request 12/09/2017). The study included “Five failure scenario locations have been considered during both operations and closure, totalling 10 failure scenarios and are as follows:
Stage 5A – East;
Stage 5B – West;
Stage 5B – South;
Stage 6 – North-west; and
Stage 6 – North-east.”
The analyses suggest that “In the event of a failure of the TMF, properties in proximity to Simonstown Stream, Yellow River and Stage 6 are particularly at risk of inundation. An early warning system will be implemented for those at risk, however residents will have very limited time in which to react. Given the high consequence (on local residents) of a dam break failure in the immediate vicinity of the TMF facility at Tara as demonstrated in this study, we would recommended that future consideration is given to undertaking a further assessment based on non-Newtonian tailings dam breach (i.e. tailings viscosity, rather than assuming water)”.
5.16.2 Amec Foster Wheeler Comments
The dam breach analysis confirmed that the proposed TMF facility should be classified as high risk.
Amec Foster Wheeler agree that further analysis should be carried out based on actual tailings
characteristics to fully assess TMF zone of influence in the event of dam breach.
Mitigation measures must be adopted to prevent any risk for local residents and nearby properties
associated with dam failure.
5.17 OPERATION, MAINTENANCE AND SURVEILLANCE
5.17.1 General
The existing TMF and Stage 6 extension fall within the scope of European Directive 2006/21/EC as a
Category A facility. Emergency preparedness and response procedures have been developed in
accordance with the current IEL schedule of conditions. The Internal Emergency Plan (IEP) and the
Major Accident Prevention Policy (MAPP) address the implementation of monitoring and response
protocols to minimise risk of accidental emissions of contaminants to the environment and prevent major
accidents.

Boliden Tara Mines Tailing Management Facility (TMF) Assessment of Proposed Stage 6 TMF Extension
Expert Report
FINAL REPORT_TARA MINE TMF_EPA _REV 2_ISSUED.DOCX
Amec Foster Wheeler L116-17-R2418
Page 20
5.17.2 Amec Foster Wheeler Comments
It assumed that the current IEL licence schedule of conditions detailing control and monitoring
requirements for the existing TMF will also be applied to the proposed Stage 6 extension.
Monitoring methods and frequency are also included in the current Extractive Waste Management Plan
(EWMP) (Ref. 7).
The EWMP refers to existing TMF Operation, Maintenance and Surveillance Manual. These documents
will need to be updated to include Stage 6 and the TMF zone of influence as identified by the dam break
study.
5.18 ACCESS ROADS
5.18.1 General
It is understood that approximately 1.1 Mm3 of soil and rock material will be required to complete the
proposed TMF dam extension. Local and regional roads will be used to access the TMF site.
The EIS (Ref. 1) suggests that “traffic generated by the TMF is expected to operate on national roads which are designed to accommodate such traffic without producing any additional adverse environmental effects.”
An assessment was undertaken of the impact of the traffic generated by the TMF construction. The study
considered two routes: i) from the TMF to Navan and ii) from the TMF to Slane. The study provided
recommendation for appropriate signage and for the development of a Construction Stage Traffic
Management Plan.
5.18.2 Amec Foster Wheeler Comments
The potential impact on local and regional roads raised concerns from local residents on road safety, dust
and construction vehicles emissions along the TMF proposed routes.
Reference to Tara Mines full responsibility for the costs due to potential damages to regional and national
road has been included in the Schedule of Condition of Meath County notification on the planning
application. However, it is recommended that the contractor provides road safety and mitigation
measures as a priority to prevent accidents on public roads due to TMF construction vehicles traffic.
5.19 CLOSURE
5.19.1 General
The rehabilitation and closure plan for the TMF undertaken in 1996 was based mainly on the vegetation
of the tailings and pond. Based on the current Closure Remediation and Aftercare Management Plan
(CRAMP, Ref. 8) an alternative arrangement has been selected consisting of “a 350mm thick layer of soil placed on top of the tailings and drained using a combination of rock fill access roads, perforated pipe and geosynthetic drains.”

Boliden Tara Mines Tailing Management Facility (TMF) Assessment of Proposed Stage 6 TMF Extension
Expert Report
FINAL REPORT_TARA MINE TMF_EPA _REV 2_ISSUED.DOCX
Amec Foster Wheeler L116-17-R2418
Page 21
The covering of the tailings with an inert cap will prevent erosion of the tailings from surface runoff. The profiling of the cap and tailings will allow surface water to be confined to the decant structures adjacent to the south west corner of Stage 5A and the south east corner of Stage 5B. Run-off will be controlled by a permanent decant spillway system which will be installed once deposition of tailings has ceased.”
A permanent decant spillway system will be installed once deposition of tailings into the Stage 6 TMF ceases. The decant will control surface runoff from precipitation after closure and drainage of the cap. There will be no permanent open water against the dam wall other than temporary ponding during major storm events. A simple open spillway will be the final decant structure in the south-east corner of Stage 6. The spillway will exit to a concrete cascade chute on the downstream slope of the dam wall and into a stilling basin. From the stilling basin, flow will discharge to the eastern perimeter channel and channel southwards to a Passive Treatment System (PTS) located to the south of the existing TMF. The spillway will be designed to accommodate normal discharge requirements and those resulting from the most extreme 1 in 10,000 year storm events.
The suggested PTS will comprise of an Integrated Constructed Wetland (ICW) which will “provide final attenuation and treatment prior to discharge.”
Following “closure of the TMF and the decommissioning of the existing water treatment plant, any runoff from the capped TMF and mine influenced water (MIW) collected in the perimeter channel will be channelled through the wetland treatment system“
A meso-scale ICW trial facility has been operated on sites since 2015 providing initial data on the
performance of this system (Ref. 9). The ICW design report suggests that the “Initial monitoring of the meso-scale ICW has shown that ICWs can manage and treat heavy metals and sulphate concentrations”.
EIS report (Ref. 1) suggest that “A spillway is required post-closure to control water levels and discharges. The spillway will be constructed prior to closure of the new cell.” The spillway will be located in the south east corner of the Stage 6 dam wall where the reclaim pumps are located. In the event of premature closure the wall would be cut down to accommodate a lower tailings level. The water will be discharged into the eastern perimeter interceptor channel. However, the final location will be dependent on the location of the return water pumps which will ensure the lowest tailings level and the location of the sand ramp where the shortest route from the mill is also the south east corner of Stage 6. If this was chosen for the sand line, then the return pumps and spillway would be located in the south west corner of the Stage 6 dam wall.
5.19.2 Amec Foster Wheeler Comments
The combination of soil cover and spillway for TMF is typical of ring-dyke type facilities and should be
suitable for the proposed TSF. However, considerations should be given in the design of the cover system
in preventing water infiltration into the tailings.
Cost implications for the proposed closure plan were not addressed by Amec Foster Wheeler.

Boliden Tara Mines Tailing Management Facility (TMF) Assessment of Proposed Stage 6 TMF Extension
Expert Report
FINAL REPORT_TARA MINE TMF_EPA _REV 2_ISSUED.DOCX
Amec Foster Wheeler L116-17-R2418
Page 22
Condition 2 of Meath County Council notification NA/160408 requires that “The Passive Treatment System to the south of the existing Tailings Storage facility shall not permitted. The Passive Treatment System shall be subject of a separate planning approval.” Amec Foster Wheeler suggest that it would
be preferable that the development of the tailings storage facility Stage 6 includes the development and
testing of a suitable water treatment system.
Although initial results from ICW trials suggest that the system can “manage and treat heavy metals and sulphate concentrations”, further study and field works are required to confirm suitability of this system.
A composite liner system (compacted low permeability soil and geomembrane) is recommended for the
ICW ponds.
The flood risk assessment undertaken as part of the EIS study suggests that “overall, the flood risk to and from the proposed ICW development is low’. However, this is subject to “upsize” of the existing culvert
structures. Further detail of culvert upsizing is required as part of the design.
It is recommended that the perimeter channel used to discharge water from the TSF will be lined.
Precipitation associated with PMP events should be considered for closure spillway design.
5.20 CONCLUSIONS AND RECOMMENDATION
Amec Foster Wheeler have reviewed documentation related to the proposed Stage 6 TMF extension.
Conclusions and Recommendations are made in each section above and should be referred to in the first
instance. The following list is a short summary of some of the issues noted:
The TMF report for the proposed Stage 6 TMF extension (Ref. 10) does not state the level of report
(pre-feasibility, feasibility etc.) and does not include a discussion on further work required before
implementation and further studies required to support environmental assessment and regulatory
requirements
The TSF interceptor channel should be lined to prevent any potential seepage into the ground
Limited information was provided on water management and adopted design criteria for freeboard
and storm events. The lack of an emergency spillway a concern
No Water Balance Model was provided
The TSF should not be designed or used for water storage
The assessment of potential for acid generating drainage should also include construction materials.
It is recommended that laboratory testing is also carried out during TMF operation to confirm that
there are no significant changes in the tailings geochemistry
It is understood that Tara Mines is proposing to import “demolition waste or materials made from
construction and demolition waste” for TMF construction (Appendix 2 Response to Further
Information Request 08/11/2017. The geotechnical investigation should also address imported
material to confirm suitability for construction

Boliden Tara Mines Tailing Management Facility (TMF) Assessment of Proposed Stage 6 TMF Extension
Expert Report
FINAL REPORT_TARA MINE TMF_EPA _REV 2_ISSUED.DOCX
Amec Foster Wheeler L116-17-R2418
Page 23
A sensitivity analysis should be undertaken to assess any potential variation in the parameters for
soil foundation, tailings and embankment construction material.
The assessment of potential for acid generating drainage should also include construction materials.
It is recommended that laboratory testing is also carried out during TMF operation to confirm that
there are no significant changes in the tailings geochemistry.
In the absence of an emergency spillway the adopted freeboard during operations need justification,
including i) definition of the design storm events for various duration and return period and PMP and
ii) assessment of TSF design storm events storage capacity
Although the project site may be located in a low seismic area, the potential for liquefaction should
be addressed based on the anticipated maximum seismic peak ground acceleration, embankment
fill and foundation soil conditions.
It is recommended that an alternative seepage detection and collection system reporting to a lined
peripheral channel will be considered to minimise potential for contamination.
Collection systems for clean runoff and for seepage from the TMF should be separated. The seepage
peripheral channel should be fully lined if used to collect and discharge seepage water into the water
treatment system.
The dam breach analysis confirmed that the proposed TMF facility should be classified as high risk.
Amec Foster Wheeler agree that further analysis should be carried out based on actual tailings
characteristics to fully assess TMF zone of influence in the event of dam breach.
Mitigation measures must be adopted to prevent any risk for local residents and nearby properties
associated with dam failure.
The current existing Internal Emergency Plan (IEP), the Major Accident Prevention Policy (MAPP)
and TMF Operation, Maintenance and Surveillance Manual will need to be updated to include Stage
6 extension and the TMF zone of influence as identified by the dam break study.
The combination of soil cover and spillway at closure for TMF is typical of ring-dyke type facilities
and should be suitable for the proposed TSF. However, considerations should be given in the design
of the cover system in preventing water infiltration into the tailings.
A composite liner system (compacted low permeability soil and geomembrane) is recommended for
the ICW ponds.
It is recommended that the perimeter channel used to discharge water from the TSF will be lined.
Precipitation associated with PMP events should be considered for closure spillway design.

Boliden Tara Mines Tailing Management Facility (TMF) Assessment of Proposed Stage 6 TMF Extension
Expert Report
FINAL REPORT_TARA MINE TMF_EPA _REV 2_ISSUED.DOCX
Amec Foster Wheeler L116-17-R2418
Page 24
6. PROPOSED AMENDMENTS TO THE CURRENT IEL CONDITIONS
The current IEL conditions focus on requirements for pollution prevention and control for the mine,
including the TMF. The proposed TMF extension does not substantially change those requirements,
which remain valid. However, there are some specific references, such as those to the Stage 5 EIS in
Section 6.18 and 6.19, that should be reviewed and updated.
The current license in Section 3.6.1 states:
“The licensee shall submit proposals for any Specified Engineering Works, as defined in Schedule D: Specified Engineering Works, of this licence, to the Agency for its agreement at least two months in advance of the intended date of commencement of any such works. No such works shall be carried out without the prior agreement by the Agency.”
Where Schedule D includes “An extension or raise of the Tailings Management Facility.”
Although the proposed design needs further work and definition, it is Amec Foster Wheeler’s opinion that,
Section 3.6.1 covers the submission and approval process for the Stage 6 extension of the TMF and that
the particular concerns should be addressed as part of that approval process.
7. REFERENCES
1. Boliden Tara Mines Ltd (April 2016) Environmental Impact Statement TMF Extension 6, ICW and
associated works
2. Tobin Consulting Engineers (April 2016) Boliden Tara Mines: Stage 6 Tailings Facility and
associated developments Natura Impact Statement
3. Environment Canada (2011) Guidelines for the assessment of alternatives for mine waste
disposal
4. AECOM (January 2016) Flood risk assessment report
5. ICOLD (2016) Selecting seismic parameters for large dams - Guidelines (revision of Bulletin 72)
6. Boliden Tara Mines Ltd (2016) IEL PO516-03 Review Application Attachment D Infrastructure
and Operation
7. Boliden Tara Mines Ltd (2013) Extractive Waste Management Plan
8. Boliden Tara Mines Ltd (December 2016) Closure Remediation and Aftercare Management Plan
(CRAMP)
9. Vesi Environmental (2016) Integrated Constructed Wetland for Tailings Management Runoff
10. Golder Associate (March 2016) Boliden Tara Mines Design for the Stage 6 Tailings Management
Facility

FINAL REPORT_TARA MINE TMF_EPA _REV 2_ISSUED.DOCX
Amec Foster Wheeler L116-17-R2418
Attachment 1
Documents Review Register
PROJECT DOC. NO.:
PROJECT NAME:Assessment of proposed extension to TailingsManagement Facility at Boliden Tara Mines
CLIENT: EPA Environmental Protection Agency
DATE.: 30-Dec-17PROJECT NO.: 7879130116
Item No.(1) Document Title Section Report/Document Excerpt AmecFW Comment/ Question/ Request EPA Response/FurtherInformation Received
AmecFW FinalComment/Request
1 6.0
The facility is not an establishment to which the EC (COMAH)
Regulations apply (now Seveso III Directive (2012/18/EU) - S.I.
209/2015 under Irish Regulations)
This will need clarification as from Appendix B.10 it
would appear that this cannot be ruled out
2 7.0
When the valuable minerals have been recovered in the flotation
process, the remaining material is known as tailings. Slimes and
fine particles are removed using cyclones and are pumped to the
tailings pond, which is located 2.5 kilometres from the mine site.
The suspended solids settle out and clean water is recycled to
the mine site for re-use in various processes.
The term "clean water" should not refer to tailings
pond water is incorrect
3 8.0
This IE License review application is being requested to take
account of the proposed Stage 6 extension to the TSF and
extend the site boundary at the TSF and to extend the IEL
boundary to cover possible extensions to future mining areas.
Amec Foster Wheeler addresses Stage 6 TMF only.
4 9.0
An annual independent review of hydrogeological, hydrological
and water quality monitoring at the Tailings Management facility
is undertaken. Data collected during 2015 is presented in the
AECOM report Review of 2015 Hydro-Environmental Monitoring
Data in Appendix 1-1. The report reviews 2015 data and
compares with historic monitoring data between 1996 - 2015 to
identify changes and trends in hydrogeological and water quality
conditions
Copy of 2016 TMF monitoring report was not
provided. The review was based on AECOM report
5 Attachment B - General Section B.10
The facility is not an establishment to which the EC (COMAH)
Regulations apply (now
Seveso III Directive (2012/18/EU) - S.I. 209/2015 under Irish
Regulations).
The thresholds outlined in this legislation for hazardous materials
are not being exceeded. Refer to report in Attachment B.10.
Need clarification. From Appendix B.10 would appear
that this cannot be ruled out
6 Appendix B.2 Location Maps
7 1.3 E.I.A. Regulations
Reference should also be made to 2013 European
Union Regulations on Industrial Emissions (S.I. No.
138 of 2013).
8 2.6.1the existing tailings facility acts not only as a location for the
deposition of tailings but also as a reservoir for storage of water.The TSF should not be used for water storage.
9 2.6.2Suitable options should provide for a suitable capacity for
temporary water storage
The report suggests that the proposed TSF can
potentially be used as "temporary" water retention
facility. This is not best practice as water
management should rather aim at minimising volume
of water stored within the TSF
10 2.6.2
The relative advantages and disadvantages of each option from
an engineering and operational perspective are summarised in
Table 2.1
Although the project refers to the extension of an
existing facility a more detailed analysis should be
undertaken related to the technical impacts of various
options. It is recommended that Multiple Account
Analysis will be undertaken as described in the
Environment and Climate Change Canada (ECCC)
"Guidelines or the Assessment of Alternatives for
Mine Waste Disposal"
Document provided on "Evaluation of
alternative tailings disposal methods
using Multiple Account Analysis"
11 2.6.2A theoretical analysis was undertaken of the potential
environmental impacts associated with the alternative options.
Same considerations as above apply to the
environmental impactsSee Item 10 above
12 2.6.2
Landownership was not considered as part of the “theoretical”
review of options, although it is acknowledged as a major
practical consideration for some of the options.
Any socio-economic impacts should be considered as
part of the TSF options evaluationSee Item 10 above
13 3.1.2The upstream slope of phase 1 will be constructed with a slope
of 2H:1V
For ease of liner installation and subgrade
preparation purposes a 3H:1V slope should be
considered
14 3.1.2 Construction methodology Design drawings needed for reviewFeasibility Study drawings provided in
response to request for information
15 3.2 Construction Materials
Type A1, A2 and A3 as the description is identical for
all materials. There are no specification for particle
size grading other than the requirement for the
maximum size. PSD curves should be provided for all
the proposed materials.
The need for a transition/filter zone between the D2
drainage blanket and type A fill should be addressed
16 3.3
Generally, prior to the preparation of the foundations, a resistivity
and microgravity survey would be undertaken to delineate the
presence of any palaeokarstic features in the limestone bedrock
A comprehensive GSI of the site should be
undertaken prior to construction as part of the TSF
design to fully address foundation conditions
17 3.4.4A leak detection survey using DC electric current will be
undertaken after the installation of the lining system
The term leak detection in Section 3 of the EIS report
applied to geophysical (DC) survey is misleading.
18 3.5 Seepage
No seepage analyses model and 2D sections through
the proposed TMF have been provided.
Seepage analyses are required to estimate phreatic
surface for use within stability modelling.
19 3.6 Perimeter Interceptor Channel
The criteria adopted for the selection of channel type
and sizing should be provided. The channel should be
lined
Tara Mine Response to Further
Information Request 08/11/2017 - Item
4: "Any seepage passing through
defects in the lining system will mix and
be diluted with ground water. Ground
water flow will be intercepted by the
perimeter interceptor channel. The
perimeter interceptor channel will
discharge into the existing (Stage 5)
east and west perimeter interceptor
channel and will be pumped back into
the active dam (Stage 5) from where it
will be reclaimed to the processing
plant.
The interceptor channel would not
intercept ground water flow if it were
lined".
It appears that contamination may
have occurred in the past through
the existing unlined interceptor
channel (See items 112,113 and
115). It is recommended that an
alternative seepage collection
system will be considered reporting
to a lined peripheral channel
20 3.7 Embankment Stability Modelling
In the document there is no reference to the criteria
adopted for the analysis such as required Minimum
Factor of Safety and seismic parameters. ICOLD
recommendation for the selection of seismic
parameters should be applied
21 3.7.3 Geotechnical parameters
The tabulated geotechnical parameters should refer
to laboratory and site investigation. Reference should
be included to relevant GSI data.
A sensitivity analysis should be undertaken to assess
any potential variation in the parameters for soil
foundation and tailings material.
There is no indication on interface strength for the
proposed composite liner. This will need to be
evaluated based on laboratory tests on soil liner
bedding and geosynthetics material selected for
project use.
22 Appendix B.6.1 - Boliden Tara Mines Ltd (April 2016) EIS -
TSF Extension, Stage 6, ICW and associated works3.7.4 Stability modelling
The type C protection and geosynthetics composite
layers have not been included in the model.
It is not clear why the model shows various
elements/zone for random fill and type A materials as
the parameters adopted are identical.
The analysis should address both short term
(following construction) and long term scenarios (TMF
development and closure).The stability of the main
embankment of the TMF should be evaluated at
three different stages: (i) following completion of
Phase I embankment and prior to tailings disposal, (ii)
at end of Phase I and following construction of Phase
II, and (iii) once the TMF dam has reached its final
estimated design height.
Slope Stability Analysis provided
IEL Application Documents Review
Attachment A.1- Non Technical Summary
Appendix B.6.1 - Boliden Tara Mines Ltd (April 2016) EIS -
TSF Extension, Stage 6, ICW and associated works

PROJECT DOC. NO.:
PROJECT NAME:Assessment of proposed extension to TailingsManagement Facility at Boliden Tara Mines
CLIENT: EPA Environmental Protection Agency
DATE.: 30-Dec-17PROJECT NO.: 7879130116
Item No.(1) Document Title Section Report/Document Excerpt AmecFW Comment/ Question/ Request EPA Response/FurtherInformation Received
AmecFW FinalComment/Request
IEL Application Documents Review
23 3.7.5
In the statistically unlikely event of an earthquake, the factor of
safety is 0.99 which under these conservative conditions, is
acceptable.
Although the scenario associated with a factor of
safety of 0.99 is stated to be “statistically unlikely” the
result of pseudo-static analysis indicates that the
seismic stability of the dam may not conform to the
minimum stability criteria.
Dynamic Response Analysis provided
(See Appendix to Tara Mines
Response to Further Information
Request 08/11/2017)
24 3.8
This type of perimeter dam used for tailings storage, which has
no external catchment area, is normally operated without
spillways.
Although the construction of the starter embankment
(Phase I) and subsequent downstream raise should
ensure that sufficient retention volume will be
available reference should be made to the criteria
adopted to determine the minimum design freeboard
in the absence of emergency spillway
Tara Mine Response to Further
Information Request 12/09/2017 - Item
4: "Spillways will be installed at the end
of the life of the facility as was the case
at Galmoy and Lisheen facilities to
protect the dam walls from being
overtopped in the long term at closure"
Perimeter dam may be designed
and operated with no emergency
spillway. However, the design will
need to incorporate sufficient
freeboard to contain design storm
rainfall. Duration and return period
should be selected based on Best
practice and international guidelines.
25 3.9During the operation of Phase 1 and Phase 2 the tailings level
will be filled to a point leaving a ‘free board’ of 1 metre
In absence of emergency spillway the adopted design
pond level of 1 m below the crest during operations is
considered insufficient.
Tara Mine Response to Further
Information Request 08/11/2017 - Item
2: "Water levels in the facility are
controlled by continually pumping
water back (reclaiming) to the
processing plant for reuse or further
treatment and discharge.
In the event of a pump failure no water
would be pumped to or from the
facility. The facility will operate with a
minimum free board of 1 metre,
meaning there will be reserve capacity
to store 1000mm of water. Based on
the OPWs Flood Studies Database
(Web Portal - http://opw.hydronet.com)
available data for the Navan area
would suggest that during a 1 in 500
year rainfall event (AEP: 0.2%) over a
continuous period of 600 hour (25
days) the maximum potential rainfall
depth would be 268.1mm c. 27% of
the available storage provided by the 1
metre free board.
Freeboard should be validated
based on the theoretical greatest
precipitation (Probable Maximum
Precipitation PMP) for a suitable
given duration. The PMP is
determined for very long return
period and although generally not
defined is considered to be in order
of 100,000 years or greater
26 3.9
To prevent damage of the lining at the point of discharge and to
provide surcharge for the base, the basin should be filled with a
minimum of 1 m of water equating to approximately 430,000 m3.
Alternative to the proposed 1 m water cover
geomembrane protection should be considered
27 3.9 Figure 3.20 Line protection - tyre arrangement
A more detailed description of the proposed return
water system should be provided. Figure 3.20 of the
EIS report shows a concrete platform 2 m from the
toe of the slope (adjacent) to the 500 g/m2 geotextile.
The design criteria and requirement for a concrete
platform need clarification. Details of liner/concrete
seal should be provided.
28 7.3.2
Existing Road Network. Thereafter, traffic generated by the TMF
is expected to operate on national roads which are designed to
accommodate such traffic without producing any additional
adverse environmental effects. As such, these are not
considered in this report.
Need clarification. From the document would appear
that an assessment on the existing road based on two
alternative route has indeed been undertaken
29 Schedule of Conditions.
Item 3
The document suggests that the Passive Treatment
System for TSF closure will not be part of the current
planning application. The development of the TSF
should be addressed together with the water
treatment facility to avoid the risk that the TSF will be
constructed and developed without suitable planning
for water treatment during operation and at closure
30 Schedule of Conditions.
Item 9
Unclear. A comprehensive seepage and slope
stability analyses should be part of the current
application and IEL Review. Point b) and point j)
seems identical. The Operation Maintenance and
Surveillance manual should address all aspect of TSF
development and operation
31 Schedule of Conditions.
Item 10
The independent consultant should have proven
experience on TMF design, construction operation
and closure
32Appendix B.6 -3
Planners Final Grant for each planning permission granted
since last Licence Review Application in 2010
33
The existing TSF is constructed as a ring-dike configuration,
enclosed by earth-fill embankment walls. The embankment walls
are constructed of low permeable glacial clay till and armoured
with a layer of coarse material on the upstream slope.
Need clarification. As from other documents would
appear that armour will be placed on the downstream
slope only
34
The Stage 5 extension was a further upstream extension. This 4
meter vertical raise too the overall height of the facility to C 22
metres. The proposed Stage 6 extension will be constructed in
two phases. Phase 1 will be a later extension to the north of the
existing facility and will extend to a height of 14 metres and will
tie in to the northern wall of the existing dam.
More details are needed of the proposed interface
between existing upstream wall and the proposed
Stage 6 extension
35
The upstream slope of phase 1 will be constructed with a slope
of 2H:1V and will be keyed into the northern embankment wall of
the existing facility. The crest elevation will be 59.29 m AOD (14
metres above ground level).
As per Item 13 above for ease of liner installation and
subgrade preparation purposes a 3H:1V slope should
be considered
36 The crest width of the dam walls for all phases is 6 m and the
maximum wall height will be approximately 22 m.
For safety reason a wider crest (min 8 m) may be
advisable
37
Sections through the dam wall are presented in Drawing 6.5 and
the section locations are shown in Drawing 6.6. Much of the dam
wall footprint is within the existing areas which have been
previously borrowed for Stage 5
No drawings providedFeasibility Study drawings provided in
response to request for information
38
The upstream sector of the proposed dam, Figure 3.4, will
consist of a 6m wide unit of clayey glacial till (Type A1 and/or
Type A2). The footprint of the dam wall will be constructed with a
1m minimum thickness of Type D2 rock which acts as a drainage
blanket
No Figure 3.4 includedFeasibility Study drawings provided in
response to request for information
39 2.3
Construction materials will be sourced for a number of potential
sources, including:
On site „borrow pits‟Onsite stockpiles
Third party licenced facilities
The main mine site at Knockumber (surplus mine rock)
A report addressing geotechnical and geochemical
characterisation for all materials should be provided
40 2.3.1
Passive treatment system (Integrated Constructed Wetland) has
been designed and will be constructed (approximately 10 years)
to take discharge from the capped stage 5 area and the
operational Stage 6 area. The ICW will be in place during
operation of the Stage 6 area and throughout the
decommissioning phase of the Stage 5 and Stage 6 areas.
Alternative options should be considered in the event
that ICW will be unsuitable to treat water from the
TSF
41 2.4.4
It was observed that the extreme volumes of rain in early
November resulted in a large body of water on Stage 5b of the
TSF, and activity shifted from Stage 5a to 5b (with little or no
roosting on 5b during October, when there was very little
standing water present).
The comment on "large body of water" raises
concern on TSF operation.
42 4.4.3
Once the Stage 5 and Stage 6 areas have been capped, there is
potential for groundwater seepage and surface water run-off to
carry heavy metals, suspended solids and other contaminants to
the River Blackwater.
Need clarification
43 4.6.3The construction of the ICW will come after the closure of Stage
6 and will include a retention pond
It is recommended that the ICW construction will
commence prior and in preparation of Stage 6
closure
44 Appendix B.6 - 5 NIS – Development of Wind Turbine at
Knockumber
Appendix B.6-4 Boliden Tara Mines Ltd 2016 STAGE 6
TMF Natura Impact Statement
Appendix B.6 - 2 Meath County Council Notification of
Decision to Grant Permission (Planning ref NA/160408)
Section 2.2.1
3.1.2
Appendix B.6.1 - Boliden Tara Mines Ltd (April 2016) EIS -
TSF Extension, Stage 6, ICW and associated works
Appendix B.6-4 Boliden Tara Mines Ltd 2016 STAGE 6
TMF Natura Impact Statement

PROJECT DOC. NO.:
PROJECT NAME:Assessment of proposed extension to TailingsManagement Facility at Boliden Tara Mines
CLIENT: EPA Environmental Protection Agency
DATE.: 30-Dec-17PROJECT NO.: 7879130116
Item No.(1) Document Title Section Report/Document Excerpt AmecFW Comment/ Question/ Request EPA Response/FurtherInformation Received
AmecFW FinalComment/Request
IEL Application Documents Review
45 Appendix B.6 - 6 NIS – Discharge to River Blackwater Section 7.5All water from the process plant is pumped to the tailings facility
for treatment prior to return of treated water to the reclaim pond.
This need clarification. No water treatment
undertaken at the TSF
46 Appendix B.6 - 7 NIS – Excavation of Material in
Simonstown Borrow Area
47 Appendix B.6 - 9 NIS – Development of Mine Return Air
Shaft, RAR 5N
48 Appendix B.6 - 10 NIS – Mining into Liscartan
49 Appendix B.9 Site Notice for application to the EPA for
review of industrial emission licence
50 Appendix B.10 SEVESO III Classification
51 Appendix B.13 Variations/Adjustments to conditions or
schedules of the existing licence
52 Attachment C Management of the Activity
53 Section D.1 Effluent
DischargeAll water from the process plant is pumped to the TSF
This need clarification. No water treatment
undertaken at the TSF
54 Section D.1 Effluent
Discharge
Water from the Reclaim Water Pond decants, via a controlled
overflow, to a Clear Water Pond (Discharge pond)
Need clarification. From the schematic and Section
"Water Treatment Plant (Lamella)" the TSF return
water is pumped to the Reclaim Water Pond 1 and
then discharged to Reclaim Pond 2, mixed with mill
processing pant and normal mine water and treated
before pumped to the clear water pond
55 App. D Licence review - Phase 1 and Phase 2 Hydrological
and site investigations
56 Attachment G Resource Use and Energy Efficiency
57 Attachment H Materials Handling
58
Appendix H - 1 Bund Integrity Test Report
Appendix H - 2 Weekly Bund Inspection Check Sheet
Appendix H – 3 Hazardous Waste Handling: UN Number
and class
Appendix H - 4 Hazardous Waste Management Procedure
Appendix H - 5 Non Hazardous Waste Management
Procedure
59 1.3
The Plan shall be reviewed at least once every five years
thereafter in a manner agreeable to the Agency and amended
where there are substantial changes to the operation of the
waste facility or to the waste accumulated or deposited
This will need to be updated addressing Stage 6 TMF
60 7.0 Management of Mine WasteThe current Operation, Maintenance and Surveillance
Manual will also need to be updated
61 8.6 Seepage and Supernatant Control As above
62 Appendix H - 7 PRTR_2015 Worksheet for Treatment and
Transfer of waste
63 Table I.8 Tailings Deposition Plan No tailings deposition plan included for review
Tailings discharge line layout and
typical spigot arrangement provided
(See Tara Mines Response to Further
Information Request 12/09/2017)
64 Table I.8
A layer of coarse material will be placed on the upstream side of
the raise to protect the slope against wave scour from the
ponded water (Rip rap used on upstream side slopes to prevent
water erosion).
This need clarification
65 Table I.8
Tailings supernatant water is pumped to the mill. An unlined
ditch, which surrounds the embankment perimeter, collects
seepage water via a blanket of finger drains and intercepts flow
from under the dam. The interceptor ditch feeds several
collection sumps from which excess water is pumped back to the
tailings pond, if necessary.
The interceptor channel should be lined See comment to Item 19
66 Table I.8
A probabilistic risk assessment has been undertaken previously
for the overall TMF. A number of failure scenarios were
examined and it was concluded that a failure of a dam wall with
an associated release of pond water and mobile tailings solids
was the only major accident scenario for the TMF.
Similar analysis should be undertaken for Stage 6
TMF
Dam break Analysis provided (See
Tara Mines Response to Further
Information Request 12/09/2017)
67 Appendix J – 1: Environmental Emergency & Preparedness
Response Procedure2.3
68 Appendix J – 2: Fire Water Risk Assessment
69 Appendix J – 3: MAPP Major Accident Prevention Policy
70 Appendix J – 4: Internal Emergency Plan for the TMF
71 Attachment K Remediation, Decommissioning, Restoration
and Aftercare
72 Appendix K – 1: ELRA Knockumber Mine Site
73 Appendix K – 2: ELRA TMF
74 1.2
The facility serves as containment for mine tailings to settle and
consolidate, as well as a storage dam for water which is re-
circulated to the processing plant for reuse.
The TSF should not be used as water storage
75 2.2.2
Managed deposition of tailings before closure will provide a
valley profile that is required for the cap and the tailings will
beach at slopes of between 0.1% and 0.5%. This will allow
surface water drainage and runoff to be confined to the decant
structure and into the interceptor channel.
Capping system should ensure that there will be no
ponding water and prevent infiltration
76
The tailings facility serves as a water storage dam, as well as a
mill tailings repository. The principal water streams that enter the
Randalstown facility comprise underground mine drainage,
surface drainage from the plant and mill process water and a
small amount of seepage water collected in the perimeter
interceptor channel
Inflows to the TMF also include water from slurry
tailings and precipitation. The facility should not beused as water storage
77
The Stage 6 unlined perimeter interceptor channel will discharge
into the existing TMF east and west perimeter interceptor
channels during operation. An unlined perimeter interceptor
channel surrounds the Stage I, II and III embankment walls
collecting seepage water via a blanket of finger drains and
intercepts flow from under the dam. The internal drainage system
for Stage 4 and Stage 5 is directed to the perimeter interceptor
channel by means of manholes, pipework and chutes. The
perimeter interceptor channel feeds two collection sumps from
which all water is pumped back to the tailings pond. The main
sump is at chainage 2125m in the southern sector of the
perimeter interceptor channel where the ground level is at its
lowest on the site. In the perimeter interceptor channel are a
number of weirs where the flow rates are monitored on regular
basis. The fall on the perimeter interceptor channel is
approximately 1 in 300 to the sumps.
The interceptor channel collecting seepage from the
TSF embankments should be linedSee comment to Item 19
78
The interface between the in situ tailings and the overlying
blanket material is more complicated because of the variability of
the tailings deposits. The drainage blanket filter material will in
some areas take flow from the fine tailings, and in others, from
the sand sized tailings. In order to maintain the practical aspects
of the design, a filter fabric, Terram 2000, have been used to
separate the drainage material and underlying tailings. The fabric
will also improve stability during the placement of the initial layers
of compacted fill on the underlying soft tailings deposits.
Assume the section refers to the capping system.
The main aim of this should be to minimise risk of
ponding water and prevent infiltration into discharged
tailings
79
The drainage system must be able to convey the seepage flows.
This is easily satisfied by the chimney drain. The embankment
consists of relatively uniform sandy to silty clay till placed as a
homogeneous mass without segregation of the coarse particles
and compacted to at least 95% of the standard Proctor
compaction dry unit weight, the upper bound permeability of the
fill is unlikely to exceed 10-9
m/s
Is the estimated permeability based on laboratory
tests?
80 2.3
It is proposed to install an inert soil cap cover over the existing
Randalstown TSF and the
proposed Stage 6 TSF. The cap will:
Provide a productive land asset that could be used for
agriculture; managed sheep farming and/or wildlife conservation
purposes;
Minimise the possibility of long term exposure of tailings and
therefore tailings dusting;
Minimise contaminant runoff from the surface;
Reduce the migration of contaminants upwards to the surface
and;
Reduce the time frame between the post closure active phase,
passive phase and finally the stable phase.
The TSF capping should aim to reduce infiltration and
water ponding rather than runoff
81 2.6 To accommodate the 45 minute 1 in 10,000 year storm eventReference should be provided to the criteria adopted
for the selection of the storm event
82 3.2.2
Further investigations which included geophysical and high quality
coring investigations, indicated that there are no significant
karstic fractures present in the rock encountered beneath the
tailings facility.
This seems in disagreement with other documents
reviewed
Appendix H – 6 Extractive Waste Management Plan
Attachment I Existing Environment & Impact of the Activity
Appendix K – 3: CRAMP
2.3
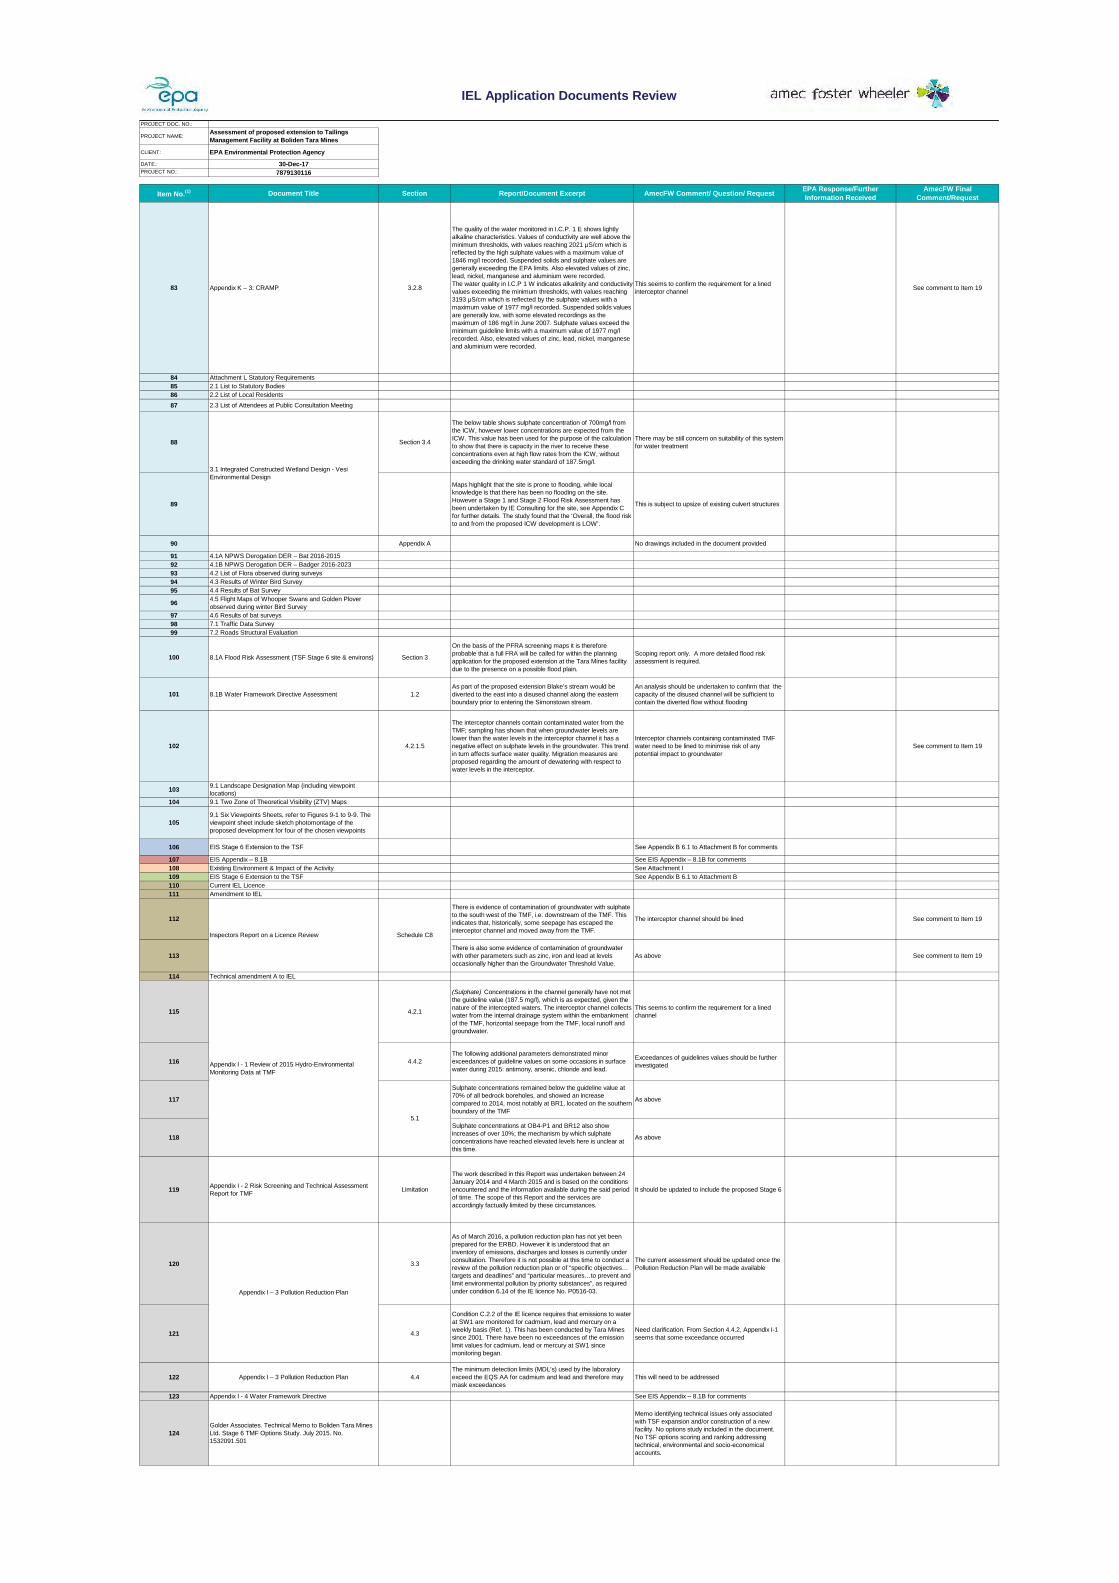
PROJECT DOC. NO.:
PROJECT NAME:Assessment of proposed extension to TailingsManagement Facility at Boliden Tara Mines
CLIENT: EPA Environmental Protection Agency
DATE.: 30-Dec-17PROJECT NO.: 7879130116
Item No.(1) Document Title Section Report/Document Excerpt AmecFW Comment/ Question/ Request EPA Response/FurtherInformation Received
AmecFW FinalComment/Request
IEL Application Documents Review
83 Appendix K – 3: CRAMP 3.2.8
The quality of the water monitored in I.C.P. 1 E shows lightly
alkaline characteristics. Values of conductivity are well above the
minimum thresholds, with values reaching 2021 μS/cm which is
reflected by the high sulphate values with a maximum value of
1846 mg/l recorded. Suspended solids and sulphate values are
generally exceeding the EPA limits. Also elevated values of zinc,
lead, nickel, manganese and aluminium were recorded.
The water quality in I.C.P 1 W indicates alkalinity and conductivity
values exceeding the minimum thresholds, with values reaching
3193 μS/cm which is reflected by the sulphate values with a
maximum value of 1977 mg/l recorded. Suspended solids values
are generally low, with some elevated recordings as the
maximum of 186 mg/l in June 2007. Sulphate values exceed the
minimum guideline limits with a maximum value of 1977 mg/l
recorded. Also, elevated values of zinc, lead, nickel, manganese
and aluminium were recorded.
This seems to confirm the requirement for a lined
interceptor channelSee comment to Item 19
84 Attachment L Statutory Requirements
85 2.1 List to Statutory Bodies
86 2.2 List of Local Residents
87 2.3 List of Attendees at Public Consultation Meeting
88 Section 3.4
The below table shows sulphate concentration of 700mg/l from
the ICW, however lower concentrations are expected from the
ICW. This value has been used for the purpose of the calculation
to show that there is capacity in the river to receive these
concentrations even at high flow rates from the ICW, without
exceeding the drinking water standard of 187.5mg/l.
There may be still concern on suitability of this system
for water treatment
89
Maps highlight that the site is prone to flooding, while local
knowledge is that there has been no flooding on the site.
However a Stage 1 and Stage 2 Flood Risk Assessment has
been undertaken by IE Consulting for the site, see Appendix C
for further details. The study found that the ‘Overall, the flood risk
to and from the proposed ICW development is LOW’.
This is subject to upsize of existing culvert structures
90 Appendix A No drawings included in the document provided
91 4.1A NPWS Derogation DER – Bat 2016-2015
92 4.1B NPWS Derogation DER – Badger 2016-2023
93 4.2 List of Flora observed during surveys
94 4.3 Results of Winter Bird Survey
95 4.4 Results of Bat Survey
96 4.5 Flight Maps of Whooper Swans and Golden Plover
observed during winter Bird Survey
97 4.6 Results of bat surveys
98 7.1 Traffic Data Survey
99 7.2 Roads Structural Evaluation
100 8.1A Flood Risk Assessment (TSF Stage 6 site & environs) Section 3
On the basis of the PFRA screening maps it is therefore
probable that a full FRA will be called for within the planning
application for the proposed extension at the Tara Mines facility
due to the presence on a possible flood plain.
Scoping report only. A more detailed flood risk
assessment is required.
101 8.1B Water Framework Directive Assessment 1.2
As part of the proposed extension Blake’s stream would be
diverted to the east into a disused channel along the eastern
boundary prior to entering the Simonstown stream.
An analysis should be undertaken to confirm that the
capacity of the disused channel will be sufficient to
contain the diverted flow without flooding
102 4.2.1.5
The interceptor channels contain contaminated water from the
TMF; sampling has shown that when groundwater levels are
lower than the water levels in the interceptor channel it has a
negative effect on sulphate levels in the groundwater. This trend
in turn affects surface water quality. Migration measures are
proposed regarding the amount of dewatering with respect to
water levels in the interceptor.
Interceptor channels containing contaminated TMF
water need to be lined to minimise risk of any
potential impact to groundwater
See comment to Item 19
103 9.1 Landscape Designation Map (including viewpoint
locations)
104 9.1 Two Zone of Theoretical Visibility (ZTV) Maps
1059.1 Six Viewpoints Sheets, refer to Figures 9-1 to 9-9. The
viewpoint sheet include sketch photomontage of the
proposed development for four of the chosen viewpoints
106 EIS Stage 6 Extension to the TSF See Appendix B 6.1 to Attachment B for comments
107 EIS Appendix – 8.1B See EIS Appendix – 8.1B for comments
108 Existing Environment & Impact of the Activity See Attachment I
109 EIS Stage 6 Extension to the TSF See Appendix B 6.1 to Attachment B
110 Current IEL Licence
111 Amendment to IEL
112
There is evidence of contamination of groundwater with sulphate
to the south west of the TMF, i.e. downstream of the TMF. This
indicates that, historically, some seepage has escaped the
interceptor channel and moved away from the TMF.
The interceptor channel should be lined See comment to Item 19
113There is also some evidence of contamination of groundwater
with other parameters such as zinc, iron and lead at levels
occasionally higher than the Groundwater Threshold Value.
As above See comment to Item 19
114 Technical amendment A to IEL
115 4.2.1
(Sulphate) Concentrations in the channel generally have not met
the guideline value (187.5 mg/l), which is as expected, given the
nature of the intercepted waters. The interceptor channel collects
water from the internal drainage system within the embankment
of the TMF, horizontal seepage from the TMF, local runoff and
groundwater.
This seems to confirm the requirement for a lined
channel
116 4.4.2
The following additional parameters demonstrated minor
exceedances of guideline values on some occasions in surface
water during 2015: antimony, arsenic, chloride and lead.
Exceedances of guidelines values should be further
investigated
117
Sulphate concentrations remained below the guideline value at
70% of all bedrock boreholes, and showed an increase
compared to 2014, most notably at BR1, located on the southern
boundary of the TMF
As above
118
Sulphate concentrations at OB4-P1 and BR12 also show
increases of over 10%; the mechanism by which sulphate
concentrations have reached elevated levels here is unclear at
this time.
As above
119 Appendix I - 2 Risk Screening and Technical Assessment
Report for TMFLimitation
The work described in this Report was undertaken between 24
January 2014 and 4 March 2015 and is based on the conditions
encountered and the information available during the said period
of time. The scope of this Report and the services are
accordingly factually limited by these circumstances.
It should be updated to include the proposed Stage 6
120 3.3
As of March 2016, a pollution reduction plan has not yet been
prepared for the ERBD. However it is understood that an
inventory of emissions, discharges and losses is currently under
consultation. Therefore it is not possible at this time to conduct a
review of the pollution reduction plan or of “specific objectives…
targets and deadlines” and “particular measures…to prevent and
limit environmental pollution by priority substances”, as required
under condition 6.14 of the IE licence No. P0516-03.
The current assessment should be updated once the
Pollution Reduction Plan will be made available
121 4.3
Condition C.2.2 of the IE licence requires that emissions to water
at SW1 are monitored for cadmium, lead and mercury on a
weekly basis (Ref. 1). This has been conducted by Tara Mines
since 2001. There have been no exceedances of the emission
limit values for cadmium, lead or mercury at SW1 since
monitoring began.
Need clarification. From Section 4.4.2, Appendix I-1
seems that some exceedance occurred
122 Appendix I – 3 Pollution Reduction Plan 4.4
The minimum detection limits (MDL’s) used by the laboratory
exceed the EQS AA for cadmium and lead and therefore may
mask exceedances
This will need to be addressed
123 Appendix I - 4 Water Framework Directive See EIS Appendix – 8.1B for comments
124Golder Associates. Technical Memo to Boliden Tara Mines
Ltd. Stage 6 TMF Options Study. July 2015. No.
1532091.501
Memo identifying technical issues only associated
with TSF expansion and/or construction of a new
facility. No options study included in the document.
No TSF options scoring and ranking addressing
technical, environmental and socio-economical
accounts.
Inspectors Report on a Licence Review Schedule C8
3.1 Integrated Constructed Wetland Design - Vesi
Environmental Design
5.1
Appendix I - 1 Review of 2015 Hydro-Environmental
Monitoring Data at TMF
Appendix I – 3 Pollution Reduction Plan
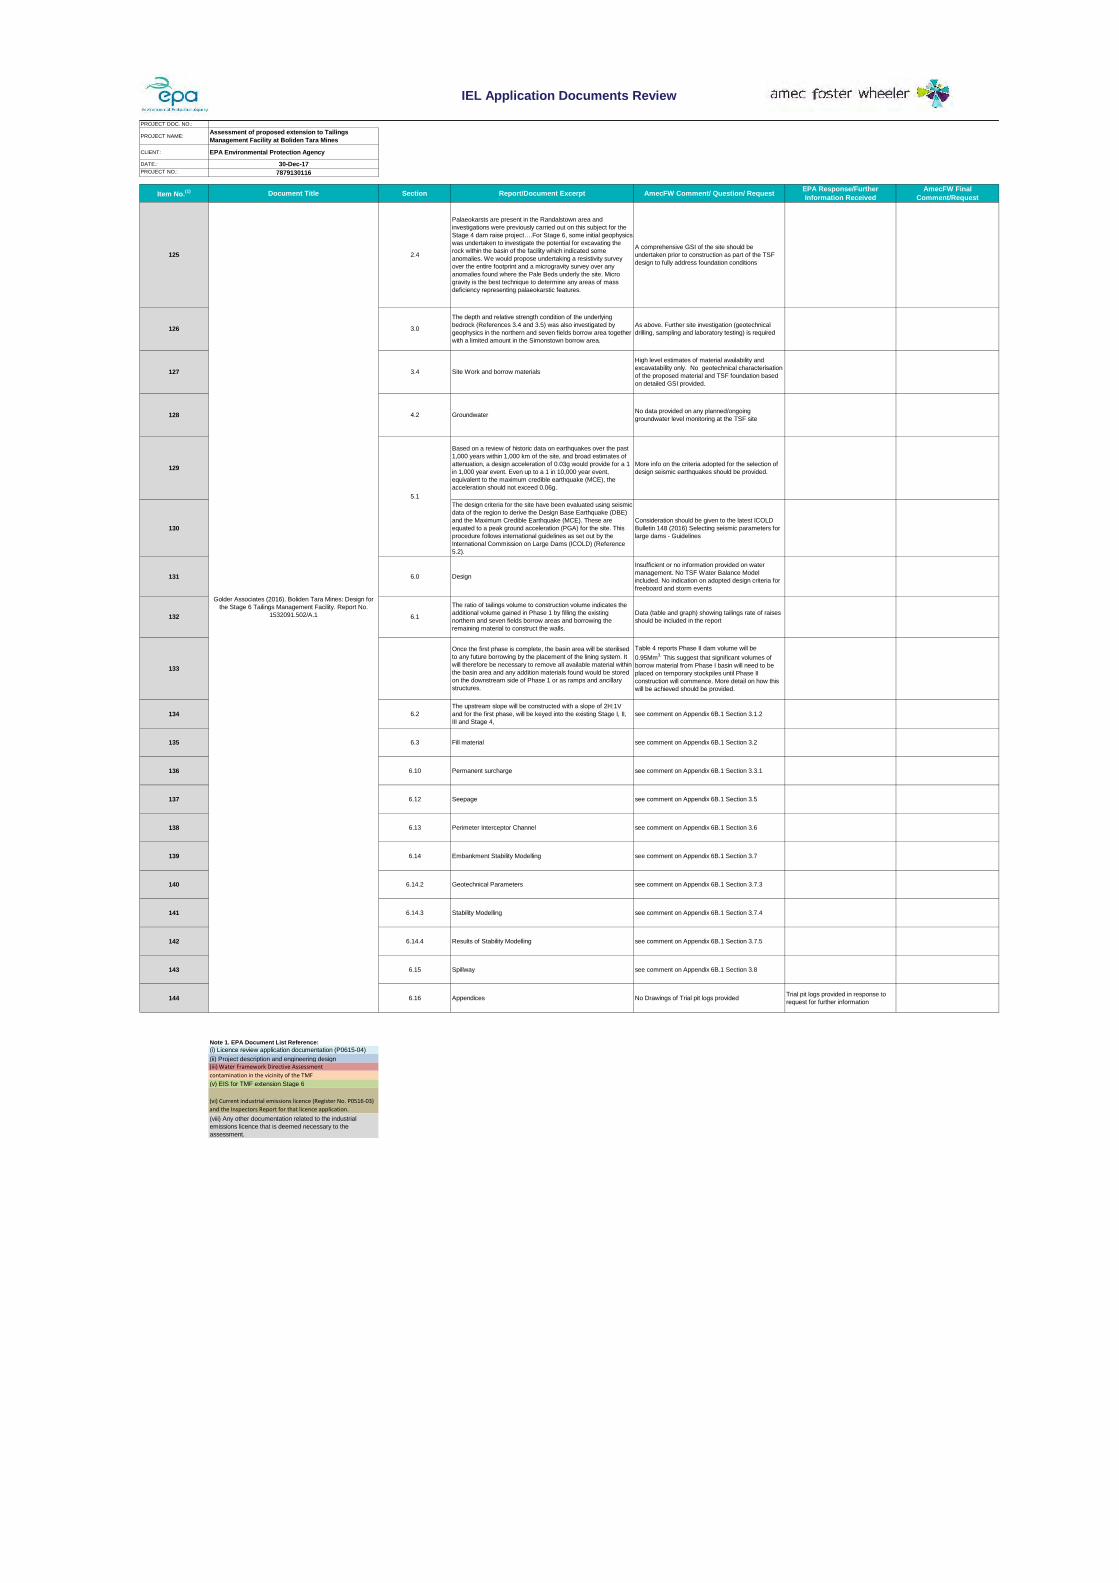
PROJECT DOC. NO.:
PROJECT NAME:Assessment of proposed extension to TailingsManagement Facility at Boliden Tara Mines
CLIENT: EPA Environmental Protection Agency
DATE.: 30-Dec-17PROJECT NO.: 7879130116
Item No.(1) Document Title Section Report/Document Excerpt AmecFW Comment/ Question/ Request EPA Response/FurtherInformation Received
AmecFW FinalComment/Request
IEL Application Documents Review
125 2.4
Palaeokarsts are present in the Randalstown area and
investigations were previously carried out on this subject for the
Stage 4 dam raise project….For Stage 6, some initial geophysics
was undertaken to investigate the potential for excavating the
rock within the basin of the facility which indicated some
anomalies. We would propose undertaking a resistivity survey
over the entire footprint and a microgravity survey over any
anomalies found where the Pale Beds underly the site. Micro
gravity is the best technique to determine any areas of mass
deficiency representing palaeokarstic features.
A comprehensive GSI of the site should be
undertaken prior to construction as part of the TSF
design to fully address foundation conditions
126 3.0
The depth and relative strength condition of the underlying
bedrock (References 3.4 and 3.5) was also investigated by
geophysics in the northern and seven fields borrow area together
with a limited amount in the Simonstown borrow area.
As above. Further site investigation (geotechnical
drilling, sampling and laboratory testing) is required
127 3.4 Site Work and borrow materials
High level estimates of material availability and
excavatability only. No geotechnical characterisation
of the proposed material and TSF foundation based
on detailed GSI provided.
128 4.2 GroundwaterNo data provided on any planned/ongoing
groundwater level monitoring at the TSF site
129
Based on a review of historic data on earthquakes over the past
1,000 years within 1,000 km of the site, and broad estimates of
attenuation, a design acceleration of 0.03g would provide for a 1
in 1,000 year event. Even up to a 1 in 10,000 year event,
equivalent to the maximum credible earthquake (MCE), the
acceleration should not exceed 0.06g.
More info on the criteria adopted for the selection of
design seismic earthquakes should be provided.
130
The design criteria for the site have been evaluated using seismic
data of the region to derive the Design Base Earthquake (DBE)
and the Maximum Credible Earthquake (MCE). These are
equated to a peak ground acceleration (PGA) for the site. This
procedure follows international guidelines as set out by the
International Commission on Large Dams (ICOLD) (Reference
5.2).
Consideration should be given to the latest ICOLD
Bulletin 148 (2016) Selecting seismic parameters for
large dams - Guidelines
131 6.0 Design
Insufficient or no information provided on water
management. No TSF Water Balance Model
included. No indication on adopted design criteria for
freeboard and storm events
132 6.1
The ratio of tailings volume to construction volume indicates the
additional volume gained in Phase 1 by filling the existing
northern and seven fields borrow areas and borrowing the
remaining material to construct the walls.
Data (table and graph) showing tailings rate of raises
should be included in the report
133
Once the first phase is complete, the basin area will be sterilised
to any future borrowing by the placement of the lining system. It
will therefore be necessary to remove all available material within
the basin area and any addition materials found would be stored
on the downstream side of Phase 1 or as ramps and ancillary
structures.
Table 4 reports Phase II dam volume will be
0.95Mm3.
This suggest that significant volumes of
borrow material from Phase I basin will need to be
placed on temporary stockpiles until Phase II
construction will commence. More detail on how this
will be achieved should be provided.
134 6.2
The upstream slope will be constructed with a slope of 2H:1V
and for the first phase, will be keyed into the existing Stage I, II,
III and Stage 4,
see comment on Appendix 6B.1 Section 3.1.2
135 6.3 Fill material see comment on Appendix 6B.1 Section 3.2
136 6.10 Permanent surcharge see comment on Appendix 6B.1 Section 3.3.1
137 6.12 Seepage see comment on Appendix 6B.1 Section 3.5
138 6.13 Perimeter Interceptor Channel see comment on Appendix 6B.1 Section 3.6
139 6.14 Embankment Stability Modelling see comment on Appendix 6B.1 Section 3.7
140 6.14.2 Geotechnical Parameters see comment on Appendix 6B.1 Section 3.7.3
141 6.14.3 Stability Modelling see comment on Appendix 6B.1 Section 3.7.4
142 6.14.4 Results of Stability Modelling see comment on Appendix 6B.1 Section 3.7.5
143 6.15 Spillway see comment on Appendix 6B.1 Section 3.8
144 6.16 Appendices No Drawings of Trial pit logs providedTrial pit logs provided in response to
request for further information
Note 1. EPA Document List Reference:(i) Licence review application documentation (P0615-04)
(ii) Project description and engineering design
(iii) Water Framework Directive Assessment(iv) Various reports related to hydrogeology and soilcontamination in the vicinity of the TMF(v) EIS for TMF extension Stage 6
(vi) Current industrial emissions licence (Register No. P0516-03)and the Inspectors Report for that licence application.(viii) Any other documentation related to the industrial
emissions licence that is deemed necessary to the
assessment.
5.1
Golder Associates (2016). Boliden Tara Mines: Design for
the Stage 6 Tailings Management Facility. Report No.
1532091.502/A.1

FINAL REPORT_TARA MINE TMF_EPA _REV 2_ISSUED.DOCX
Amec Foster Wheeler L116-17-R2418
Attachment 2
Response to Further Information Requests
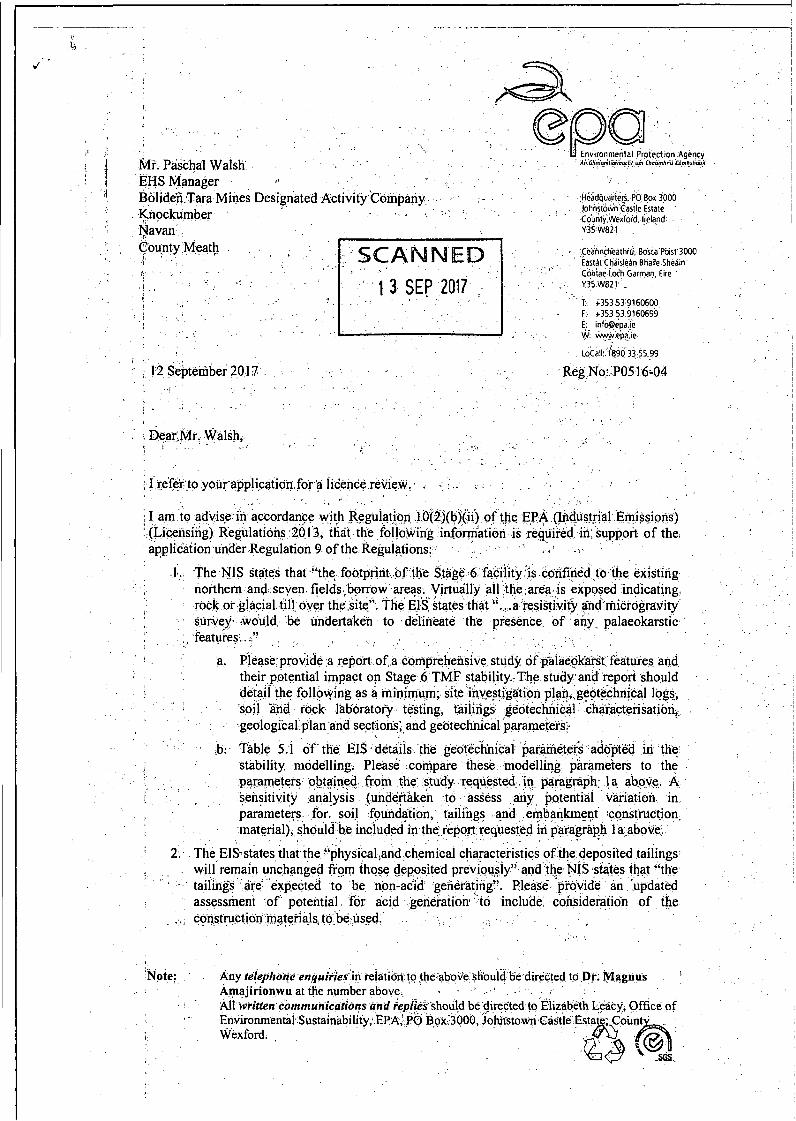
- . . . -__-I- . . . ..”._ -.
a i
I
I
kr. Paichal Walsh
Mines Designated Acti I ,
Bavan Coupty Meath i
. . Counly Wexford. Ireland Y35 W821
Ceanncheathru. b s c a Poist 3000 sledn Ehaile SheAin
t 3 5 3 53 9160600
LoCall ‘h90 33 55 99
Reg No:-P05 16-04
.( .
to your’application.for a licence
1,. The NIS states that “the foo northern and seven. fields, b
I
stability modelling. Plea
I
tailhgs ’are. expected assessment of potential for acid generation to inclu’de cobideration of the
. I construction materials to be used.
ote: Any telephone enquiries in re directed to Dr. Magnus ’ Amajirionwu at the number a
I All written communications izabeth Leacy, Office of ’ . Environmental Sustainability
I Wexford.

3. The EIS refers to two alternatives used to aSsess the stage 6 TMF options for mine waste disposal namely; slurry and paste. This is not satisfactory. P
slurry- to dry stack. The selection of th environmental and technical impacts and .de through scoring and ranking, using, for e
detailed report on the assessment of tailings disposal options
, . . . . _ 1
adjusting the discharges into th the TSF to the plant site". Clarify why n
stability modelling.
r include water ingress to
e enquiries in relation to the aboire should be directed to Dr. Magnus '
tions and replies should be directed to Elizabeth Leacy, Ofice of 1
' ' i r j
r i
Note: U at the number above.
ility, EPA, PO Box 3000, Johristown Castle Estate, County Wexford.
t
!

b. Provide a ’detailed explanation why collection systems for clean runoff and for seepage are not separate.
c. Provide a detailed explanation why the interceptor channel used to collect and discharge seepage water into the water treatment system is not fully lined.
10. It is proposed that the existing watertreatment system will be used for both Stage 5 and Stage 6 TMF until an integrated .constructed wetland system is put in place. Provide detailed information on the capability and suitability of the existing water treatment to acc-ommodate the increased volumes following Stage 6 start-up and prior to Stage 5 decommissioning.
11. It is noted that no tailings flow slide analysis is provided in the EIS in re TMF dam failure. Provide an assessment of’the potential impact on the env
t of a TMF dam failure.
In addition towthe above please al Vide an updated non-technical summary to reflect the
The requested,information should be submitted to the Agency within eight weeks of the date of this notice, in order to allow the Agency to process and deterniine your application.
In the circumstances, you should make arrangements. to have the required documents L1.
rovided in your reply:.
Sustainability.
It should be that the eight-week pefiod within which the Agency is to decide the .proposed det ion will commence on-the day on which ,this notice has been complied with. If you have any fUrther queries please contact Dr. Magnus Amajirionwu at the number ,above.
Yours sincerely,
Dr. Magnus Amajitjonwu Environmental Licensing Programme Office of Environmental Sustainability
Note: Any telephone enquiries in relation to the above should be directed to Dr. Magnus Amajirionwu at the number above. All wilten communications and replies should be directed to Elizabeth Leacy, Office of Environmental Sustainability, EPA, PO Box 3000, Johnstown Castle Estate, County Wexford.

f ,
'I
IEL PO516-04 Review Application Response to Further Information Request 08/11/2017
Appendix to FIR Item 3 ______________________________________________ Dynamic Response Analysis of Settlement of the Stage 6 Tailings
Storage Facility due to a Seismic Event

Golder Associates (UK) Ltd
Cavendish House, Bourne End Business Park, Cores End Road, Bourne End, Buckinghamshire, SL8 5AS, UK
Tel: [+44] (0) 1628 851851 Fax: [+44] (0) 1628 851852 www.golder.com
Golder Associates: Operations in Africa, Asia, Australasia, Europe, North America and South America
Company Registered in England No.1125149 At Attenborough House, Browns Lane Business Park, Stanton-on-the-Wolds, Nottinghamshire NG12 5BL
VAT No. 209 0084 92 Golder, Golder Associates and the GA globe design are trademarks of Golder Associates Corporation.
APPENDIX - DYNAMIC ANALYSIS
Golder Associates have undertaken numerous dynamic analysis in high seismic regions such as, Italy,
Greece, Bulgaria, Serbia, Armenia and Turkey where the peak ground acceleration (PGA) is in excess of 0.2
g, to determine the settlement of a dam wall under seismic conditions. During seismic events, well-
engineered and constructed dam walls do not fail due to slope stability issues but settle due to shaking.
To determine the settlement as a result of the maximum credible earthquake (MCE) impacting Stage 6
tailings facility, both finite element and empirical modelling was undertaken.
FINITE ELEMENT The dam dynamic response analysis was undertaken using the finite element software package Midas GTS
NX. Midas GTS NX is a comprehensive finite element analysis software package that can analyse a range
of geotechnical design applications including dynamic analysis.
The dynamic response analysis was primarily focused on the prediction of the likely range of maximum and
permanent deformation of the tailings dam under seismic loading. The analysis was undertaken based on
the following assumptions:
The analysis used isotropic elasto-perfect-plastic material model; and
The analysis used drained shear strength properties for the tailings and fill material.
Geotechnical Parameters Table 1 presents the shear strength parameters used for the drained tailings, the fill materials, the foundation
material and the underlying bedrock. The shear strength parameters were chosen in accordance with the
assessment undertaken in the previous 2D limit equilibrium analysis (Ref. 1).
Table 1: Shear Strength Parameters Material Unit Weight (kN/m3) Cohesion (kPa) Friction angle (°)
Drained Tailings 18 0 32
Random Fill 19 0 32
Material Type A1/A2 19 0 32
Material Type A2/A3 19 0 32
Material Type D2 21 0 35
Foundation Material 19 5 32
Limestone Bedrock 24 200 37
Table 2 presents the stiffness related parameters which are required for the finite element analysis. These
parameters were chosen primarily based on Golders in-house previous experience and also the values
reported in the technical literature.

Ailish McCabe 1532091.507
01 December 2017
2/15
Table 2: Stiffness Parameters Material Young’s Modulus E (MPa) Poisson’s Ratio ν
Tailings 30 0.3
Random Fill 50 0.3
Material Type A1/A2 50 0.3
Material Type A2/A3 50 0.3
Material Type D2 100 0.3
Foundation Material 150 0.3
Limestone Bedrock 1,000 0.25
Model Set-Up The geometry of the finite element model is consistent with that used in the previous slope stability analysis.
The finite element mesh is presented in Figure 1. Points A, B and C show the locations where the
displacement results will be examined.
Figure 1: Finite Element Mesh
Ground acceleration data from three previously recorded earthquake events were used to develop the
loading conditions for the current dynamic analysis study. These three earthquake events are:
Ground Acceleration Time History 1: 1940 El Centro earthquake;
Ground Acceleration Time History 2: 1979 Imperial Valley earthquake; and
Ground Acceleration Time History 3: 1994 Northridge earthquake.
The Peak Ground Acceleration (PGA) of these earthquake were scaled down to 0.06g which is the PGA that
the mine site is expected to potentially experience during 1 in 10,000 year event, i.e. equivalent to the
Maximum Credible Earthquake (MCE). The processed ground acceleration time history adopted in the
dynamic analysis are presented in Figures 2 to 4 all of which showing a PGA of 0.06 g.
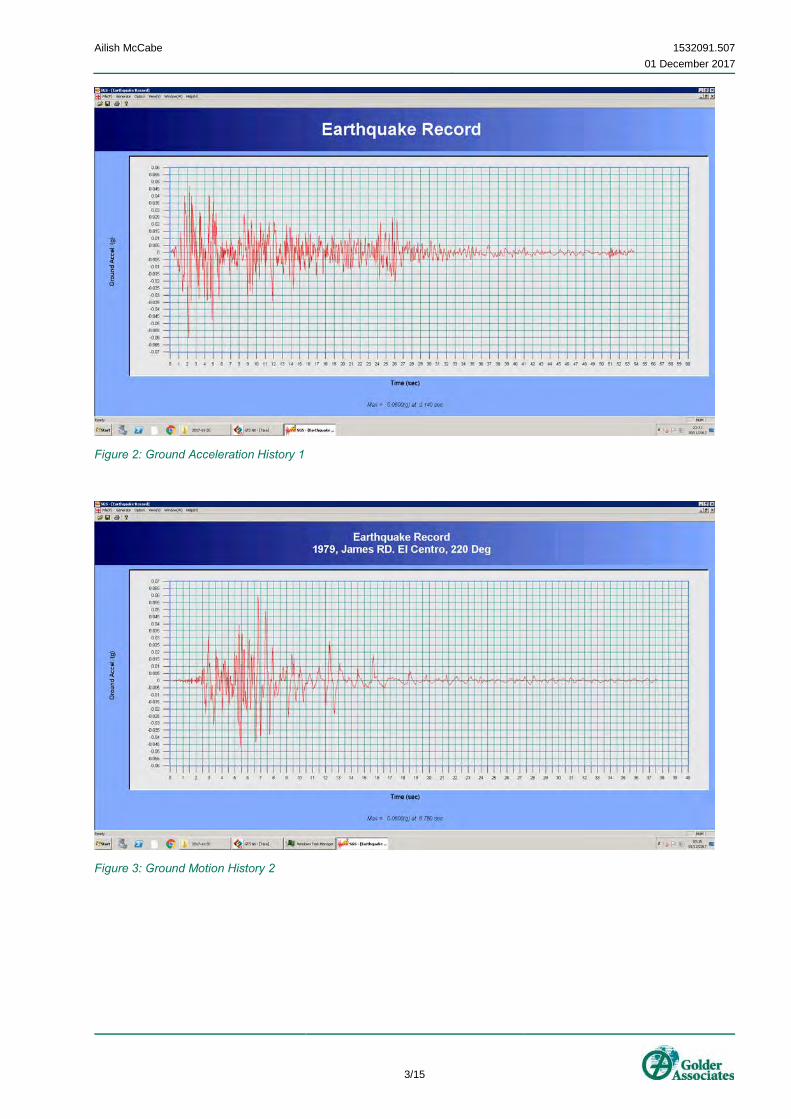
Ailish McCabe 1532091.507
01 December 2017
3/15
Figure 2: Ground Acceleration History 1
Figure 3: Ground Motion History 2
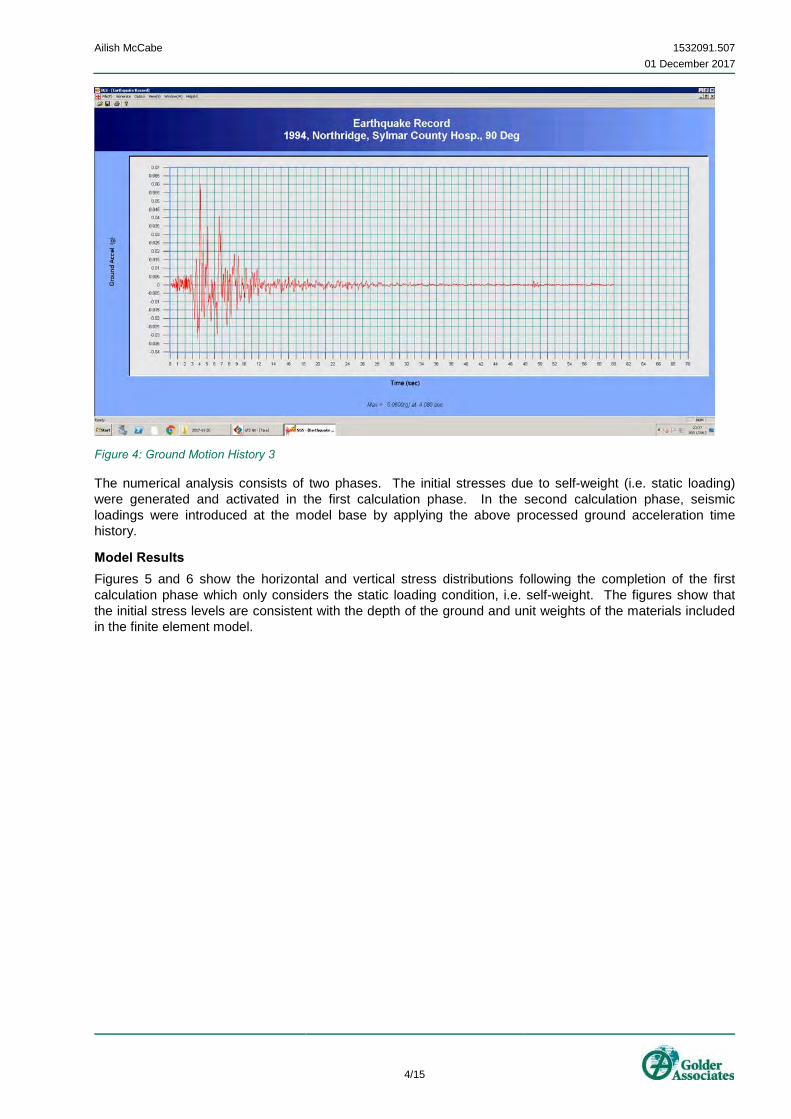
Ailish McCabe 1532091.507
01 December 2017
4/15
Figure 4: Ground Motion History 3
The numerical analysis consists of two phases. The initial stresses due to self-weight (i.e. static loading)
were generated and activated in the first calculation phase. In the second calculation phase, seismic
loadings were introduced at the model base by applying the above processed ground acceleration time
history.
Model Results Figures 5 and 6 show the horizontal and vertical stress distributions following the completion of the first
calculation phase which only considers the static loading condition, i.e. self-weight. The figures show that
the initial stress levels are consistent with the depth of the ground and unit weights of the materials included
in the finite element model.

Ailish McCabe 1532091.507
01 December 2017
5/15
Figure 5: Initial Horizontal Stress Distribution
Figure 6: Initial Vertical Stress Distribution
Figures 7 to 10 present the results for the dynamic analysis using Ground Acceleration Time History 1 as the
dynamic loading condition, i.e. Run 1.

Ailish McCabe 1532091.507
01 December 2017
6/15
Figure 7: Run 1: Post-Earthquake Horizontal Displacement
Figure 8: Run 1: Post-Earthquake Vertical Displacement

Ailish McCabe 1532091.507
01 December 2017
7/15
Figure 9: Run 1: Post-Earthquake Plastic Strain
Figure 10: Run 1: Dam Crest Horizontal Displacement History Plot
Figures 7 and 8 show the predicted post-earthquake displacement in both horizontal and vertical directions
at the final time step.
The level of displacements are generally at a very low level (up to 20 mm) with some slightly elevated values
(20 to 110 mm) near the surface of the downstream face of the dam which is apparent in the horizontal
displacement plot. The depth of this high displacement zone is generally very limited, i.e. less than 300 mm
following further interrogation near the surface. This is understandable considering the model assumes zero

Ailish McCabe 1532091.507
01 December 2017
8/15
cohesion for the fill material of the dam. Following the shake of an earthquake event (even with a not very
high PGA), some movements or perhaps local slumping near the surface of the dam is to be expected and
considered acceptable. The vast majority of the dam and the tailings would experience insignificant
movements which is considered satisfactory. Figure 9 shows very small plastic strain concentration near the
surface of the dam which further confirms the damage would be superficial. Figure 10 presents the dam
crest horizontal displacement history during the shake.
Figures 11 to 14 presents the results for the dynamic analysis using Ground Acceleration Time History 2 as
the dynamic loading condition, i.e. Run 2.
Figure 11: Run 2: Post-Earthquake Horizontal Displacement
Figure 12: Run 2: Post-Earthquake Vertical Displacement

Ailish McCabe 1532091.507
01 December 2017
9/15
Figure 13: Run 2: Post-Earthquake Plastic Strain
Figure 14: Run 2: Dam Crest Horizontal Displacement History Plot
Figures 15 to 18 presents the results for the dynamic analysis using Ground Acceleration Time History 3 as
the dynamic loading condition, i.e. Run 3. These results are similar to those of Run 1.
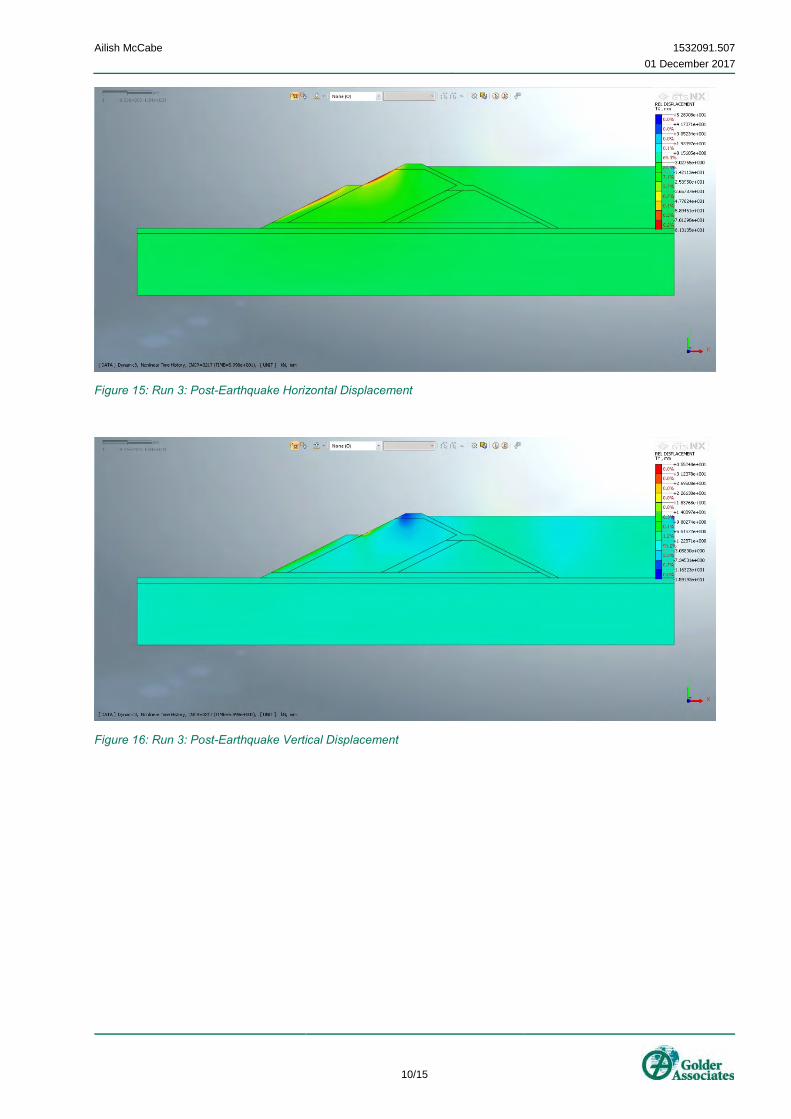
Ailish McCabe 1532091.507
01 December 2017
10/15
Figure 15: Run 3: Post-Earthquake Horizontal Displacement
Figure 16: Run 3: Post-Earthquake Vertical Displacement
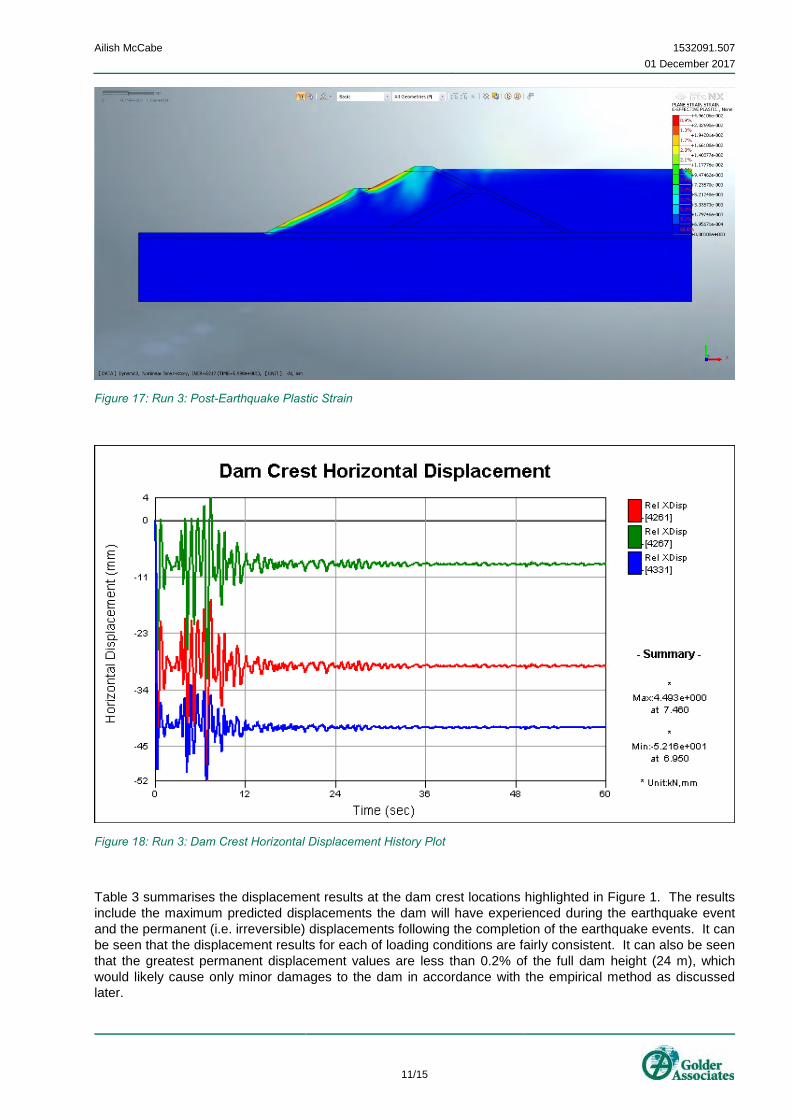
Ailish McCabe 1532091.507
01 December 2017
11/15
Figure 17: Run 3: Post-Earthquake Plastic Strain
Figure 18: Run 3: Dam Crest Horizontal Displacement History Plot
Table 3 summarises the displacement results at the dam crest locations highlighted in Figure 1. The results
include the maximum predicted displacements the dam will have experienced during the earthquake event
and the permanent (i.e. irreversible) displacements following the completion of the earthquake events. It can
be seen that the displacement results for each of loading conditions are fairly consistent. It can also be seen
that the greatest permanent displacement values are less than 0.2% of the full dam height (24 m), which
would likely cause only minor damages to the dam in accordance with the empirical method as discussed
later.

Ailish McCabe 1532091.507
01 December 2017
12/15
The displacement results are therefore considered satisfactory.
Table 3: Summary of Dam Crest Displacements
Reference Loading Location Horizontal Disp. (mm) Settlement (mm)
Maximum Permanent Maximum Permanent
Run 1 Time History 1
A 45.5 29.9 13.8 13.8
B 26.5 9.5 7.8 7.8
C 54.0 45.0 3.8 3.8
Run 2 Time History 2
A 45.1 29.2 13.4 12.9
B 26.0 8.7 7.6 6.5
C 54.6 46.9 4.0 3.5
Run 3 Time History 3
A 52.2 29.4 13.6 13.0
B 31.9 9.0 7.5 6.4
C 52.0 41.6 3.3 3.0
Summary and Conclusions Dynamic response analysis was carried out for the Tara Stage 6 tailings dam using the finite element
programme Midas GTS NX. Three difference sets of ground acceleration time history were used in the
analysis to cover a wide range of response spectrum in ground motion simulation. The analysis results
indicated that the level of deformation of the tailing dam during and after a MCE event would not impact the
integrity of the dam wall and therefore considered satisfactory.
EMPIRICAL METHODS Two methods were adopted for the empirical evaluation of settlement due to a seismic event.
The first empirical method was developed by Bray and Travasarou (Ref. 2). It is a simplified semi empirical
relationship for estimating permanent displacements due to earthquake – induced deviatoric deformations. It
utilises a nonlinear fully coupled stick slip sliding block model to capture the dynamic performance of an
earth dam, natural slope, compacted earth fill or municipal solid-waste landfill.
This methodology calculates the level of vertical deformation which may occur in an embankment following
or during a seismic event.
There are four steps in the process:
1) Use available data to determine the average Shear Wave Velocity (Vs) for materials within the
embankment;
2) Determine the Yield Acceleration (kY) and Depth of the Critical Slip Plane (H) from Limit Equilibrium;
3) Determine Spectral Acceleration (Sa) from earthquake records based on a calculated Natural Period
4) (Ts): and
5) Using the Bray - Travasarou equation, calculate values of seismic deformation.
The equation used is:

Ailish McCabe 1532091.507
01 December 2017
13/15
Where:
D = Vertical Displacement (cm);
Ky = Yield acceleration (taken as the horizontal seismic coefficient for a FOS of 1 from pseudo-static
limit equilibrium modelling using a fully-softened soil strength model;
Sa = Spectral acceleration from earthquake time record (g) at a period of 1.5 Ts;
M = Earthquake magnitude (which acts as a measure of the earthquake duration);
ε = Standard deviation of 0.66; and
Ts = Natural period of Embankment (s) = 4H/Vs or 2.6H/Vs (Figure 5).
Figure 19: Calculation for Natural Period
The steps and calculations are presented at the end of Appendix A and a summary of the results using this
method are given below.
Figure 20: Crest Settlement

Ailish McCabe 1532091.507
01 December 2017
14/15
For a magnitude of 3, the expected crest settlement is likely to be of the order of 11 mm to 14 mm with a
standard deviation of between a lower bound value of 5 mm and an upper bound value of 27 mm. If the
magnitude was increased to 4, the expected crest settlement would be in the order of 14 mm to 18 mm and
for a magnitude of 5, the expected crest settlement would be in the order of 18 mm to 25 mm
The second empirical method adopted was developed by Swaisigood (Ref 3) and presents a review of case
histories of embankment dam behaviour during earthquake events. The results of this empirical study have
shown that the most important factors that appear to affect dam crest settlement during earthquake include
the peak ground acceleration at the site and the earthquake magnitude. A chart was prepared to summarize
the relationship between the amount of measured settlement and the peak ground accelerations
experienced in the incidents that were studied.
An important outcome of the study was that it was found that there is ample evidence that well-built dams
can withstand moderate shaking with peak accelerations up to at least 0.2 g with no harmful effects
In addition, an empirical equation was formulated as an aid in estimating the amount of deformation to be
expected. The results of the study as presented as a chart is given below.

Ailish McCabe 1532091.507
01 December 2017
15/15
CRFD are concrete face rock fill dams, ECRD are earth core rock fill dams and HF are hydraulic fill (sand)
dam. Stage 6 dam would be classified as a clay faced rock fill dam and therefore could be expected to
behave somewhere between an earth fill dam and rockfill dam.
Both the equation and chart were used to estimate the potential range of settlement that could be
experienced at Stage 6 as a result of an MCE earthquake.
From the equation, the amount of settlement is 0.7 mm. From the chart, and represented by the green
dashed line, the settlement is between 0.3 mm and 28 mm. The calculations are presented at the end of
Appendix A.
Summary and Conclusions Both the empirical dynamic analyses indicated settlements of similar range and not exceeding 27 mm
compared to the dynamic response analysis using the finite element programme Midas GTS NX of 14 mm.
The analysis results indicated that the level of deformation of the tailing dam during and after a MCE event
would not impact the integrity of the dam wall and therefore considered satisfactory.
Ref. 1 Golder Associates (2016), Design for the Stage 6 Tailings Management Facility, Boliden Tara Mines,
1523091.503/B.0, March 2016
Ref. 2 Bray, J, D. and Travasarou, T., 2007, Simplified Procedure for Estimating Earthquake-Induced Deviatoric Slope Displacements, Journal of Geotechnical and Geoenviromental Engineering, ASCE.
Ref. 3 Swaisgood, J. R., 2003, Embankment Dam Deformation Caused By Earthquakes, Pacific
Conference On Earthquake Engineering.
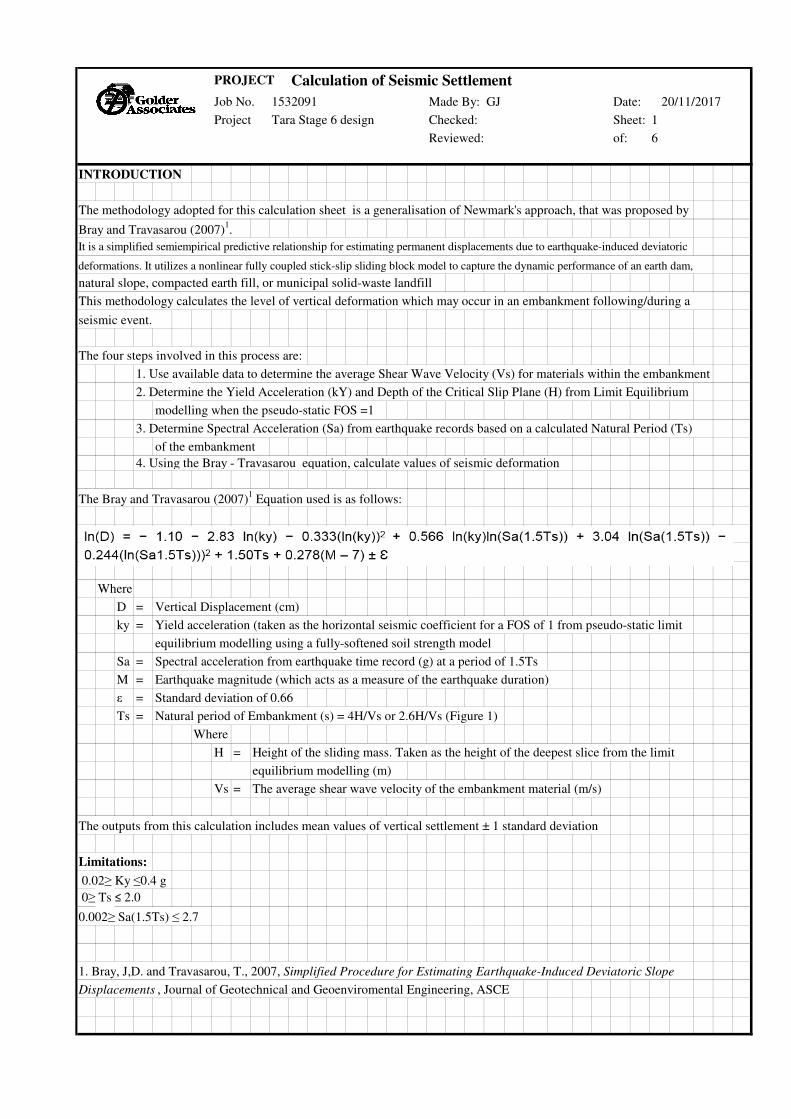
PROJECT Calculation of Seismic Settlement
Job No. Made By: GJ Date:
Project Tara Stage 6 design Checked: Sheet: 1
Reviewed: of: 6
INTRODUCTION
The methodology adopted for this calculation sheet is a generalisation of Newmark's approach, that was proposed by
Bray and Travasarou (2007)1.
It is a simplified semiempirical predictive relationship for estimating permanent displacements due to earthquake-induced deviatoric
deformations. It utilizes a nonlinear fully coupled stick-slip sliding block model to capture the dynamic performance of an earth dam,
natural slope, compacted earth fill, or municipal solid-waste landfill
This methodology calculates the level of vertical deformation which may occur in an embankment following/during a
seismic event.
The four steps involved in this process are:
1. Use available data to determine the average Shear Wave Velocity (Vs) for materials within the embankment
2. Determine the Yield Acceleration (kY) and Depth of the Critical Slip Plane (H) from Limit Equilibrium
modelling when the pseudo-static FOS =1
3. Determine Spectral Acceleration (Sa) from earthquake records based on a calculated Natural Period (Ts)
of the embankment
4. Using the Bray - Travasarou equation, calculate values of seismic deformation
The Bray and Travasarou (2007)1 Equation used is as follows:
Where
D = Vertical Displacement (cm)
ky = Yield acceleration (taken as the horizontal seismic coefficient for a FOS of 1 from pseudo-static limit
equilibrium modelling using a fully-softened soil strength model
Sa = Spectral acceleration from earthquake time record (g) at a period of 1.5Ts
M = Earthquake magnitude (which acts as a measure of the earthquake duration)
ε = Standard deviation of 0.66
Ts = Natural period of Embankment (s) = 4H/Vs or 2.6H/Vs (Figure 1)
Where
H = Height of the sliding mass. Taken as the height of the deepest slice from the limit
equilibrium modelling (m)
Vs = The average shear wave velocity of the embankment material (m/s)
The outputs from this calculation includes mean values of vertical settlement ± 1 standard deviation
Limitations:
0.02≥ Ky ≤0.4 g
0≥ Ts ≤ 2.0
0.002≥ Sa(1.5Ts) ≤ 2.7
1. Bray, J,D. and Travasarou, T., 2007, Simplified Procedure for Estimating Earthquake-Induced Deviatoric Slope
Displacements , Journal of Geotechnical and Geoenviromental Engineering, ASCE
1532091 20/11/2017
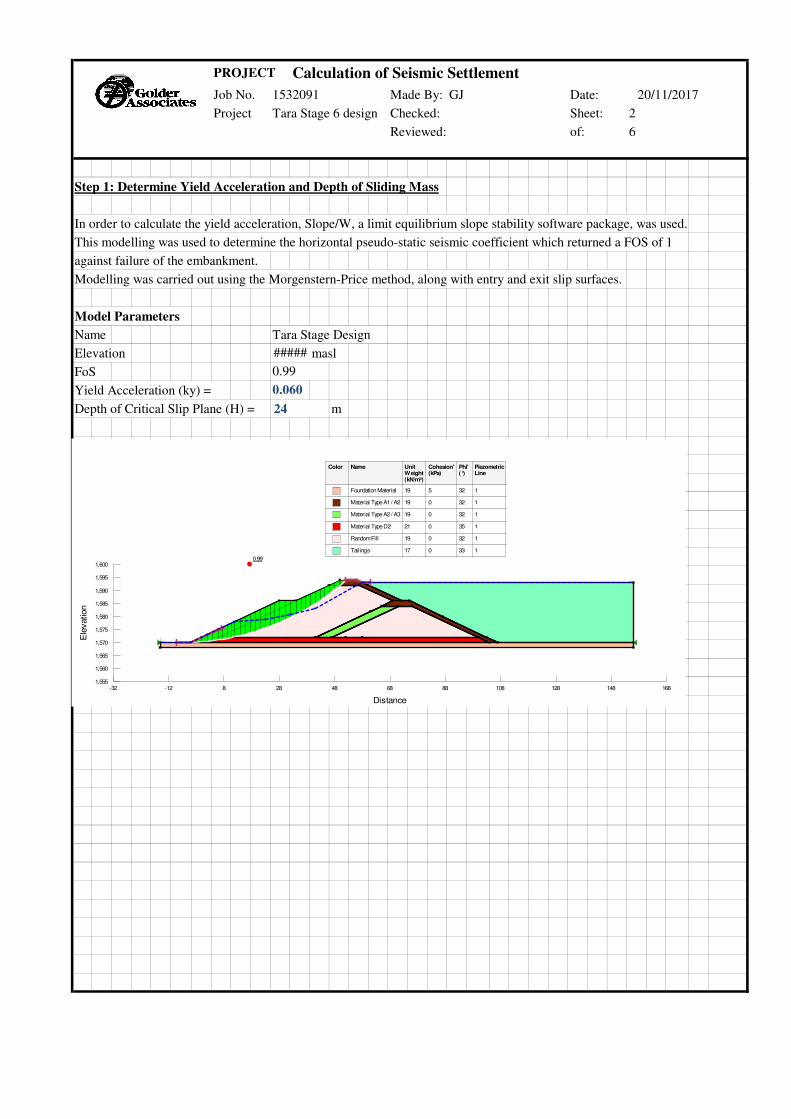
PROJECT Calculation of Seismic Settlement
Job No. Made By: GJ Date:
Project Tara Stage 6 design Checked: Sheet: 2
Reviewed: of: 6
Step 1: Determine Yield Acceleration and Depth of Sliding Mass
In order to calculate the yield acceleration, Slope/W, a limit equilibrium slope stability software package, was used.
This modelling was used to determine the horizontal pseudo-static seismic coefficient which returned a FOS of 1
against failure of the embankment.
Modelling was carried out using the Morgenstern-Price method, along with entry and exit slip surfaces.
Model Parameters
Name Tara Stage Design
Elevation masl
FoS
Yield Acceleration (ky) =
Depth of Critical Slip Plane (H) = 24 m
20/11/20171532091
0.99
#####
0.060
0.99
Distance
-32 -12 8 28 48 68 88 108 128 148 168
Ele
vation
1,555
1,560
1,565
1,570
1,575
1,580
1,585
1,590
1,595
1,600
Color Name Unit Weight(kN/m³)
Cohesion'(kPa)
Phi' (°)
PiezometricLine
Foundation Material 19 5 32 1
Material Type A1 / A2 19 0 32 1
Material Type A2 / A3 19 0 32 1
Material Type D2 21 0 35 1
Random Fill 19 0 32 1
Tailings 17 0 33 1

PROJECT Calculation of Seismic Settlement
Job No. Made By: GJ Date:
Project Tara Stage 6 design Checked: Sheet: 3
Reviewed: of: 6
Step 2: Determine Shear Wave Velocity and Natural Period
shear wave velocity, Vs (m/s)
Natural Period, Ts (s)
From: EuroCode 8 EN 1998-1
Figure 1: Calculation for Natural Period
0.21
350 400
0.160.18
1532091
300
20/11/2017
200150
0.310.42
250
0.25
A single wave velocity was chosen
to represent the average shear
velocity of the materials within the
embankment. The estimate was
based on typical shear wave
velonity as reported in Table 3.1,
and from Golder experience from
measurements in similar types of
embankments
The natural period of the
embankment was calculated based
on the shear wave velocity, the
depth of the failure surface within
the embankment, and the shape of
the embankment, and the failure
surface within the embankment.
Standard relationships, as reported
in Rathje and Bray 2001, were
used.
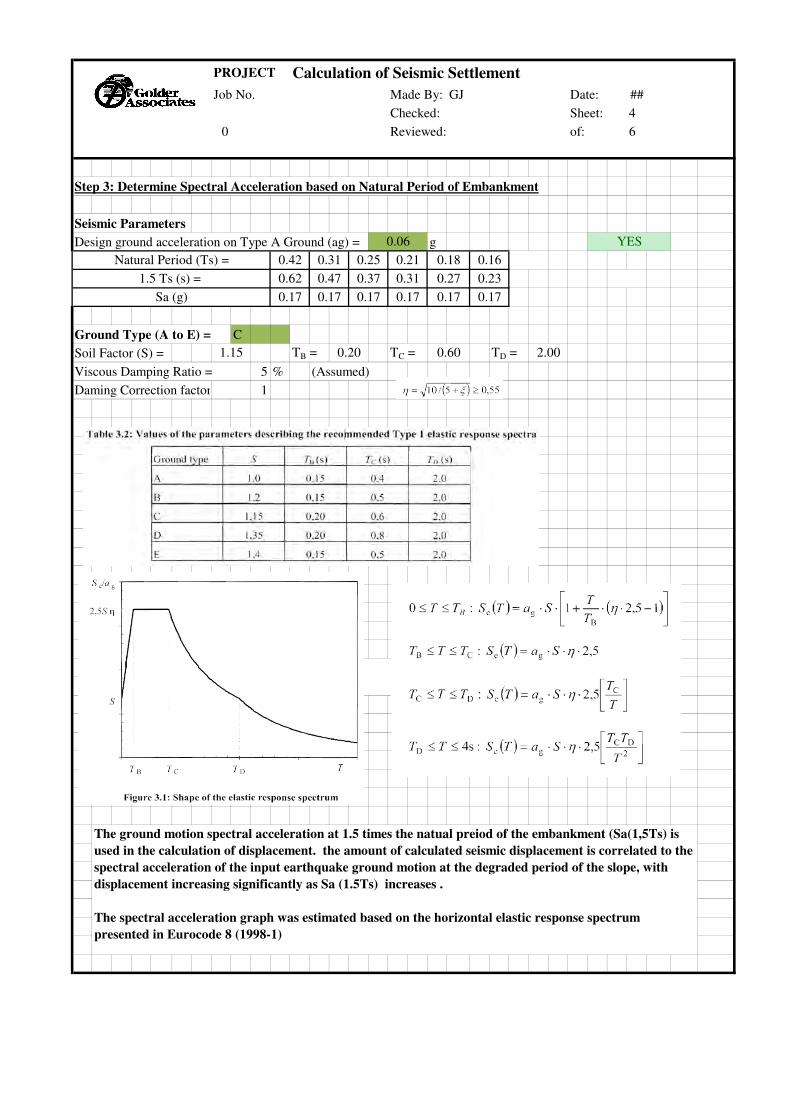
PROJECT Calculation of Seismic Settlement
Job No. Made By: GJ Date: ##
Checked: Sheet: 4
0 Reviewed: of: 6
Step 3: Determine Spectral Acceleration based on Natural Period of Embankment
Seismic Parameters
Design ground acceleration on Type A Ground (ag) = g
Ground Type (A to E) = C
Soil Factor (S) = TB = TC = TD =
Viscous Damping Ratio = 5 % (Assumed)
Daming Correction factor (n) = 1
2.000.600.20
YES
0.17 0.17
0.06
Natural Period (Ts) =
1.5 Ts (s) =
Sa (g)
1.15
0.17
0.37
0.17 0.17
0.62 0.47
0.21 0.18 0.16
0.31 0.27 0.23
0.17
0.250.42 0.31
The ground motion spectral acceleration at 1.5 times the natual preiod of the embankment (Sa(1,5Ts) is
used in the calculation of displacement. the amount of calculated seismic displacement is correlated to the
spectral acceleration of the input earthquake ground motion at the degraded period of the slope, with
displacement increasing significantly as Sa (1.5Ts) increases .
The spectral acceleration graph was estimated based on the horizontal elastic response spectrum
presented in Eurocode 8 (1998-1)
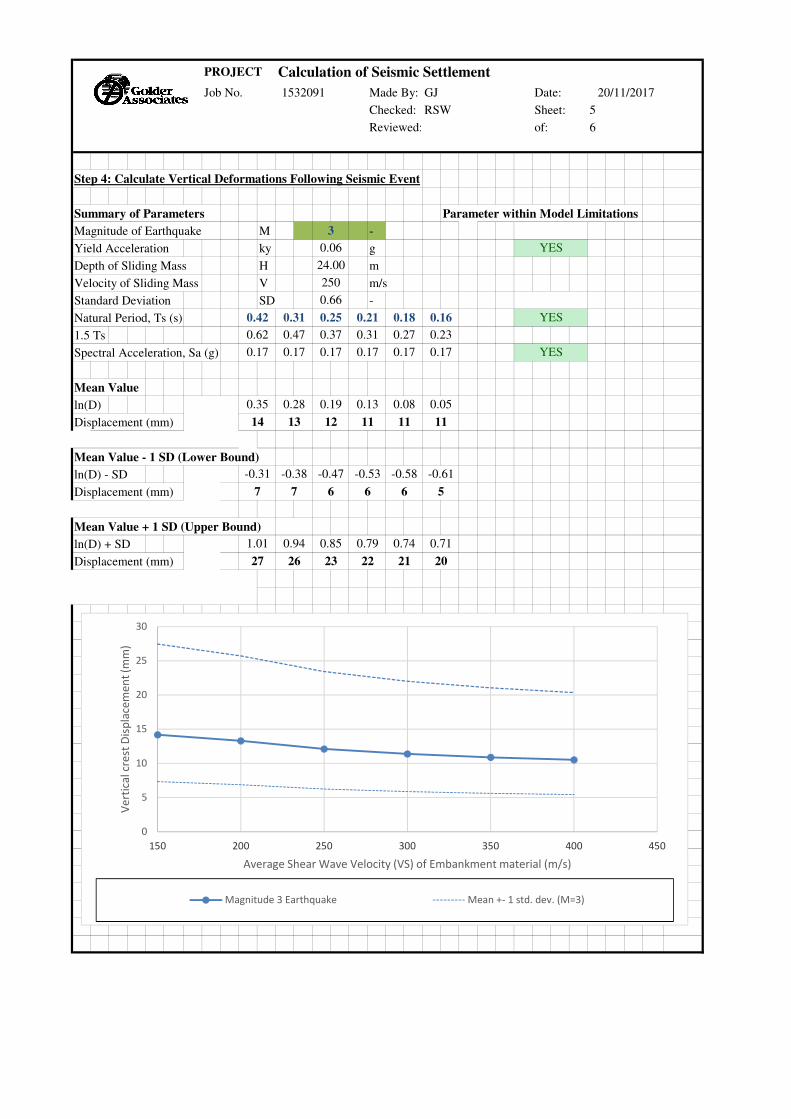
PROJECT Calculation of Seismic Settlement
Job No. Made By: GJ Date:
Checked: RSW Sheet: 5
Reviewed: of: 6
Step 4: Calculate Vertical Deformations Following Seismic Event
Summary of Parameters Parameter within Model Limitations
Magnitude of Earthquake M -
Yield Acceleration ky g
Depth of Sliding Mass H m
Velocity of Sliding Mass V m/s
Standard Deviation SD -
Natural Period, Ts (s)
1.5 Ts
Spectral Acceleration, Sa (g)
Mean Value
ln(D)
Displacement (mm)
Mean Value - 1 SD (Lower Bound)
ln(D) - SD
Displacement (mm)
Mean Value + 1 SD (Upper Bound)
ln(D) + SD
Displacement (mm)
1532091 20/11/2017
1.01 0.94
27 26
0.79 0.74 0.71
22 2123
-0.61
6 6 5
20
7 7 6
0.85
-0.53 -0.58
0.19
12
-0.47
0.13 0.08 0.05
11 11 11
0.35 0.28
14 13
-0.31 -0.38
0.31 0.27
0.17
0.23
0.170.17
3
0.37
0.17
0.66
0.42 0.31
0.47
0.17
0.62
0.17 YES
0.06
24.00
250
0.25
YES
YES0.21 0.18 0.16
0
5
10
15
20
25
30
150 200 250 300 350 400 450
Ve
rtic
al cr
est
Dis
pla
cem
en
t (m
m)
Average Shear Wave Velocity (VS) of Embankment material (m/s)
Magnitude 3 Earthquake Mean +- 1 std. dev. (M=3)

Seismic Embankment deformation based on Swaisgood (2003)
Embankment height = 24 m
foundation depth = 4 m
Design Earthquake = 0.06 g
Earthquake Magnitude = 3
From equation:
% settlement = 0.00267 %
Settlement = 0.7 mm
From Case History Graph
% settlement between 0.1 and 0.001 % (read off graph for design PGA)
Settlement between 28.0 and 0.3 mm

IEL PO516-04 Review Application
Response to Further Information Request 12/09/2017
Response to Further Information Request (FIR)
12/09/2017
For
insp
ectio
n pur
pose
s only
.
Conse
nt of
copy
right
owne
r req
uired
for a
ny ot
her u
se.
EPA Export 14-10-2017:03:27:43

Response to Further Information Request 12/09/2017
Table of Contents
Item 1 ............................................................................................................................................... 1
Item 2 ............................................................................................................................................... 2
Item 3 ............................................................................................................................................... 3
Item 4 ............................................................................................................................................... 6
Item 5 ............................................................................................................................................... 7
Item 6 ............................................................................................................................................. 10
Item 7 ............................................................................................................................................. 12
Item 8 ............................................................................................................................................. 14
Item 9 ............................................................................................................................................. 18
Item 10 .......................................................................................................................................... 19
Item 11 .......................................................................................................................................... 19
For
insp
ectio
n pur
pose
s only
.
Conse
nt of
copy
right
owne
r req
uired
for a
ny ot
her u
se.
EPA Export 14-10-2017:03:27:43
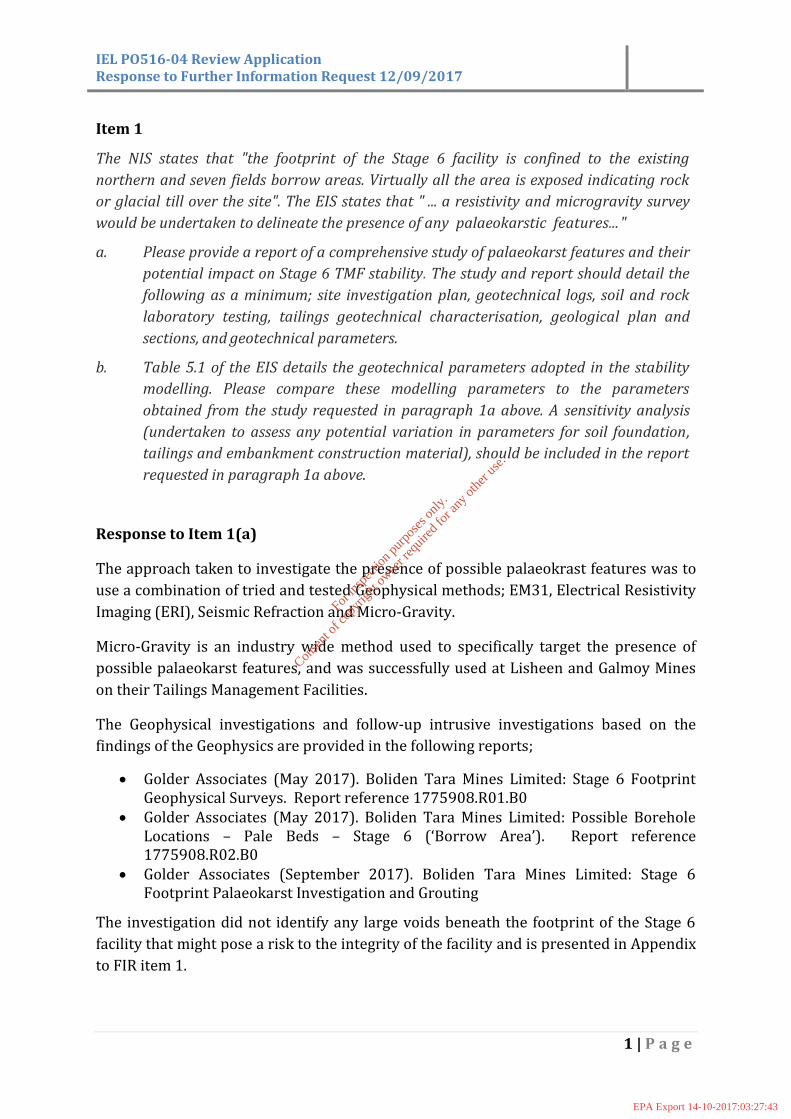
IEL PO516-04 Review Application Response to Further Information Request 12/09/2017
1 | P a g e
Item 1
The NIS states that "the footprint of the Stage 6 facility is confined to the existing
northern and seven fields borrow areas. Virtually all the area is exposed indicating rock
or glacial till over the site". The EIS states that " ... a resistivity and microgravity survey
would be undertaken to delineate the presence of any palaeokarstic features... "
a. Please provide a report of a comprehensive study of palaeokarst features and their
potential impact on Stage 6 TMF stability. The study and report should detail the
following as a minimum; site investigation plan, geotechnical logs, soil and rock
laboratory testing, tailings geotechnical characterisation, geological plan and
sections, and geotechnical parameters.
b. Table 5.1 of the EIS details the geotechnical parameters adopted in the stability
modelling. Please compare these modelling parameters to the parameters
obtained from the study requested in paragraph 1a above. A sensitivity analysis
(undertaken to assess any potential variation in parameters for soil foundation,
tailings and embankment construction material), should be included in the report
requested in paragraph 1a above.
Response to Item 1(a)
The approach taken to investigate the presence of possible palaeokrast features was to
use a combination of tried and tested Geophysical methods; EM31, Electrical Resistivity
Imaging (ERI), Seismic Refraction and Micro-Gravity.
Micro-Gravity is an industry wide method used to specifically target the presence of
possible palaeokarst features, and was successfully used at Lisheen and Galmoy Mines
on their Tailings Management Facilities.
The Geophysical investigations and follow-up intrusive investigations based on the
findings of the Geophysics are provided in the following reports;
Golder Associates (May 2017). Boliden Tara Mines Limited: Stage 6 Footprint Geophysical Surveys. Report reference 1775908.R01.B0
Golder Associates (May 2017). Boliden Tara Mines Limited: Possible Borehole Locations – Pale Beds – Stage 6 (‘Borrow Area’). Report reference 1775908.R02.B0
Golder Associates (September 2017). Boliden Tara Mines Limited: Stage 6 Footprint Palaeokarst Investigation and Grouting
The investigation did not identify any large voids beneath the footprint of the Stage 6
facility that might pose a risk to the integrity of the facility and is presented in Appendix
to FIR item 1.
For
insp
ectio
n pur
pose
s only
.
Conse
nt of
copy
right
owne
r req
uired
for a
ny ot
her u
se.
EPA Export 14-10-2017:03:27:43
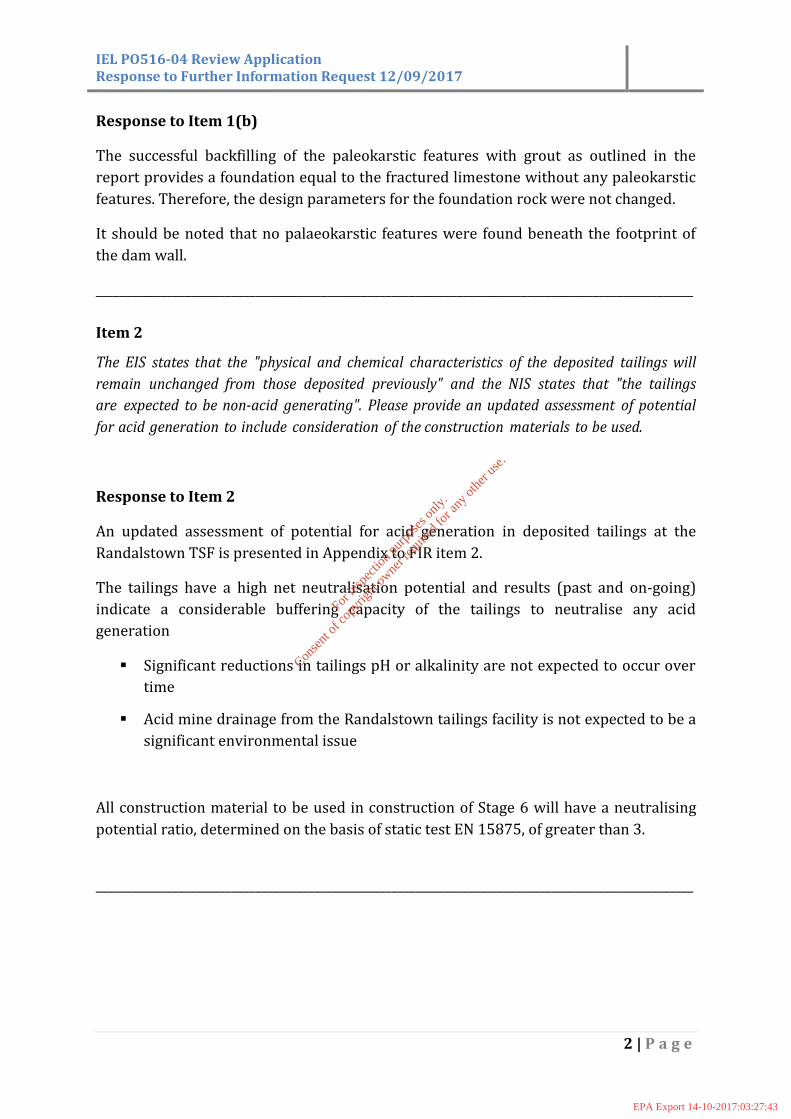
IEL PO516-04 Review Application Response to Further Information Request 12/09/2017
2 | P a g e
Response to Item 1(b)
The successful backfilling of the paleokarstic features with grout as outlined in the
report provides a foundation equal to the fractured limestone without any paleokarstic
features. Therefore, the design parameters for the foundation rock were not changed.
It should be noted that no palaeokarstic features were found beneath the footprint of
the dam wall.
_____________________________________________________________________________________________________
Item 2
The EIS states that the "physical and chemical characteristics of the deposited tailings will
remain unchanged from those deposited previously" and the NIS states that "the tailings
are expected to be non-acid generating". Please provide an updated assessment of potential
for acid generation to include consideration of the construction materials to be used.
Response to Item 2
An updated assessment of potential for acid generation in deposited tailings at the
Randalstown TSF is presented in Appendix to FIR item 2.
The tailings have a high net neutralisation potential and results (past and on-going)
indicate a considerable buffering capacity of the tailings to neutralise any acid
generation
Significant reductions in tailings pH or alkalinity are not expected to occur over
time
Acid mine drainage from the Randalstown tailings facility is not expected to be a
significant environmental issue
All construction material to be used in construction of Stage 6 will have a neutralising
potential ratio, determined on the basis of static test EN 15875, of greater than 3.
_____________________________________________________________________________________________________
For
insp
ectio
n pur
pose
s only
.
Conse
nt of
copy
right
owne
r req
uired
for a
ny ot
her u
se.
EPA Export 14-10-2017:03:27:43
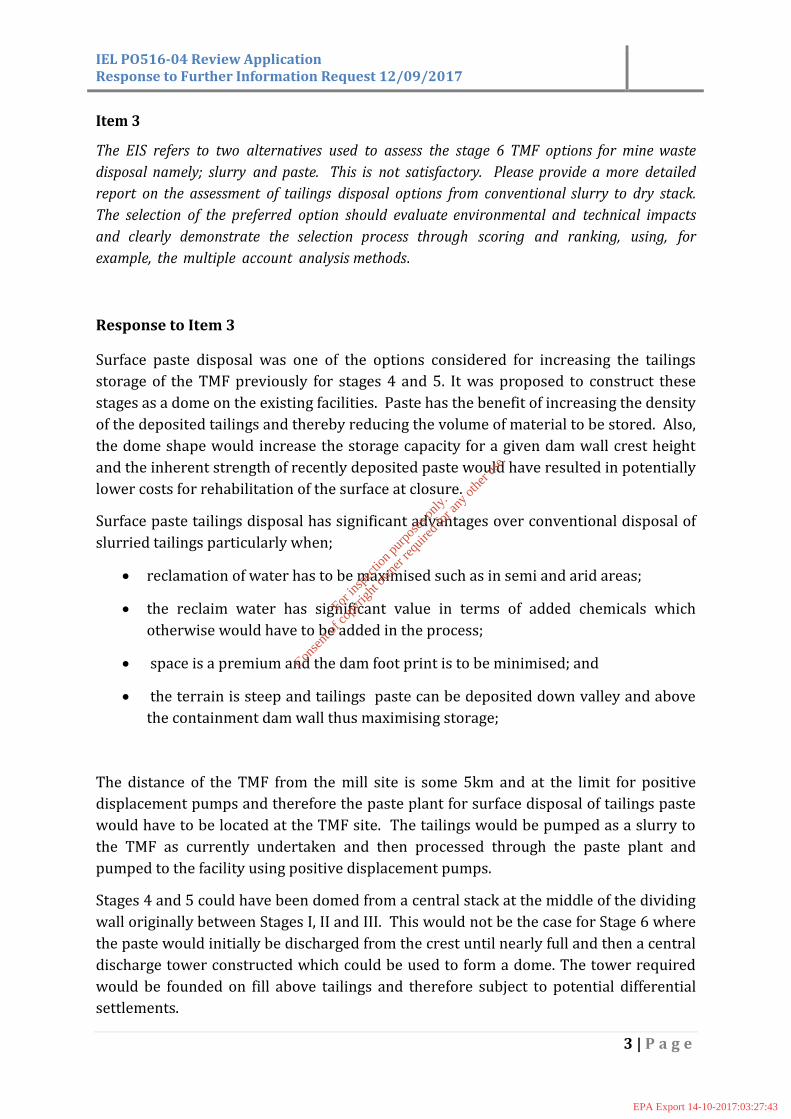
IEL PO516-04 Review Application Response to Further Information Request 12/09/2017
3 | P a g e
Item 3
The EIS refers to two alternatives used to assess the stage 6 TMF options for mine waste
disposal namely; slurry and paste. This is not satisfactory. Please provide a more detailed
report on the assessment of tailings disposal options from conventional slurry to dry stack.
The selection of the preferred option should evaluate environmental and technical impacts
and clearly demonstrate the selection process through scoring and ranking, using, for
example, the multiple account analysis methods.
Response to Item 3
Surface paste disposal was one of the options considered for increasing the tailings
storage of the TMF previously for stages 4 and 5. It was proposed to construct these
stages as a dome on the existing facilities. Paste has the benefit of increasing the density
of the deposited tailings and thereby reducing the volume of material to be stored. Also,
the dome shape would increase the storage capacity for a given dam wall crest height
and the inherent strength of recently deposited paste would have resulted in potentially
lower costs for rehabilitation of the surface at closure.
Surface paste tailings disposal has significant advantages over conventional disposal of
slurried tailings particularly when;
reclamation of water has to be maximised such as in semi and arid areas;
the reclaim water has significant value in terms of added chemicals which
otherwise would have to be added in the process;
space is a premium and the dam foot print is to be minimised; and
the terrain is steep and tailings paste can be deposited down valley and above
the containment dam wall thus maximising storage;
The distance of the TMF from the mill site is some 5km and at the limit for positive
displacement pumps and therefore the paste plant for surface disposal of tailings paste
would have to be located at the TMF site. The tailings would be pumped as a slurry to
the TMF as currently undertaken and then processed through the paste plant and
pumped to the facility using positive displacement pumps.
Stages 4 and 5 could have been domed from a central stack at the middle of the dividing
wall originally between Stages I, II and III. This would not be the case for Stage 6 where
the paste would initially be discharged from the crest until nearly full and then a central
discharge tower constructed which could be used to form a dome. The tower required
would be founded on fill above tailings and therefore subject to potential differential
settlements.
For
insp
ectio
n pur
pose
s only
.
Conse
nt of
copy
right
owne
r req
uired
for a
ny ot
her u
se.
EPA Export 14-10-2017:03:27:43

IEL PO516-04 Review Application Response to Further Information Request 12/09/2017
4 | P a g e
The paste plant would operate 24hrs/day and the plant, the discharge points and
eventually the tower would need to be adequately lit to allow for continuous
observation/access.
The pasted tailings would form a slope between 2.5% and 5% depending on the final
moisture content at discharge. Thus for a slope of 2.5%, the central tower height would
need to be about 10m high for the paste to reach the Stage 6 crest wall at a distance of
400 m. Normally, the slope gradient will decrease as the distance from the discharge
point increases and more discharge points may be required.
To prevent dusting of the paste an extensive system of sprinklers would be required
and operated frequently during dry and windy periods. The exposed beaches would be
subject to extensive dusting unless continually saturated. The sprinkler system would
have to be continuously raised as paste is deposited. The sprinkler water and rainfall
runoff from the slopes, which would be contaminated, would be collected around the
upstream perimeter of the Stage 6 dam wall crest via a constructed channel. The water
collected would be discharged into Stage 5. An emergency facility to hold slurried
tailings would also be required when the paste plant is maintained or for some reason
was non-operational. The facility would again be the existing Stage 5.
Tara Mines use the coarse fraction of the tailings (sands) for hydraulically back filling
stopes underground as part of the mining operation. This procedure also reduces the
amount of tailings discharging to the TMF. The fine tailings (slimes) are discharged into
the TMF. When backfilling underground is not required, the total tailings (sand and
slimes) are discharged directly to the TMF. Surface disposal of paste needs to be
reasonably consistent in order that the geotechnical/fluid properties can be reliably
used for design of the disposal facility. Therefore, the sand and slimes component of the
tailings combined would have different rheological and geotechnical properties than
each of the materials if separated. This would mean that the backfilling underground at
Tara would also have to be paste and therefore a backfill plant would be required at the
mill site as well as at the TMF.
There are a number of negative key issues relating to paste disposal in Stage 6 as
discussed above. These are given below;
potential for dusting of the paste surface;
requirement for two paste plants at the TMF site and also to replace Tara’s
existing backfilling operation underground using cyclone coarse sands with
paste; and
operating the paste plant at the TMF site 24 hours a day, seven day a week with
the associated noise and lighting.
For
insp
ectio
n pur
pose
s only
.
Conse
nt of
copy
right
owne
r req
uired
for a
ny ot
her u
se.
EPA Export 14-10-2017:03:27:43

IEL PO516-04 Review Application Response to Further Information Request 12/09/2017
5 | P a g e
Filter cake disposal has many of the advantages and disadvantages that apply to paste
disposal. It is by far the safest option for tailings disposal and is reasonably commonly
used in arid climates where water is a premium, the reclaimed water has a value and
the filter cake can be dried in the heat and compacted. In Ireland, trafficking on filter
cake, when wet, is very problematic. At Aughinish, where filter cake is produced, it is
wetted up to form paste and pumped to the facility. The filter cake plant would have to
be located at the TMF site and the material could either be placed by a conveyor system
or trucks. The filter cake plant site, road ways and the placement areas would need to be
lit up continuously.
Either paste or filter cake disposal operations would impact the neighbours due to light
and noise pollution for the life of the facility. These options have been discussed with
the stakeholders during previous consultation meetings and none would prefer a plant
operating at the tailings sites 24 hours a day seven days a week. Currently, with slurry
disposal, there is the minimum of activity on the TMF.
It was considered therefore that the negative aspects of surface paste or filter cake
disposal outweighed the benefits and these methods of disposal were rejected in favour
of conventional slurry discharge into Stage 6.
_____________________________________________________________________________________________________
For
insp
ectio
n pur
pose
s only
.
Conse
nt of
copy
right
owne
r req
uired
for a
ny ot
her u
se.
EPA Export 14-10-2017:03:27:43
IEL PO516-04 Review Application Response to Further Information Request 12/09/2017
6 | P a g e
Item 4
It is noted that, as part of the EIS, a preliminary appraisal was carried out to address flood
risk within the stage 6 TMF and environs. Section 3.9 of the EIS states that "there is
adequate control of the tailings water level which can be achieved by adjusting the
discharges into the TMF and removal of tailings water by pumping from the TSF to the
plant site". Clarify why neither an emergency spillway nor the capability to store probable
maximum precipitation of appropriate duration (months, not hours), is provided.
Response to Item 4
The stage 6 TMF is classified as a perimeter dam with no external catchment area. The
facility will be operated with a 1 m freeboard. It is normal to operate a perimeter dam
with no spillway and has been the case with Stages 1, 2, 3, 4 and 5 of the facility.
Similarly, tailings facilities at the Galmoy and Lisheen were operated without a spillway.
A spillway is not required because the majority of the water discharged into the facility
is controlled by pumping and managed by Tara Mines. Thus the facility is operated by a
1m freeboard and if exceeded Tara mines has the option to stop pumping into the
facility or increase pumping from the facility provided discharge criteria is meet.
The 1 m freeboard would accommodate the total average annual rainfall over the
last 50 years (856 mm) and the maximum annual rainfall over the last 50 years
(1136 mm).
Spillways will be installed at the end of the life of the facility as was the case at Galmoy
and Lisheen facilities to protect the dam walls from being overtopped in the long term
at closure (Refer to Section 6.15 of Design for the Stage 6 Tailings Management Facility
report submitted as part of this IE License Review).
_____________________________________________________________________________________________________
For
insp
ectio
n pur
pose
s only
.
Conse
nt of
copy
right
owne
r req
uired
for a
ny ot
her u
se.
EPA Export 14-10-2017:03:27:43

IEL PO516-04 Review Application Response to Further Information Request 12/09/2017
7 | P a g e
Item 5
The likelihood of seepage through the liner is discussed in section 3.5 of the EIS.
However, no seepage analyses model and 2D sections through the proposed TMF have
been provided, which are required to estimate phreatic surface for use in stability
modelling.
a) Please provide a seepage analyses model and 2D sections through the proposed TMF
as part of the stability analysis.
b) Provide explanation why there is no allowance for an over liner and underliner
drainage as part of seepage control during operation.
Response to Item 5 (a)
Seepage from the TMF will be controlled by the low permeability composite lining
system, and the low permeability of the tailings retained by the facility. On the upstream
dam wall face there is Type A1 and A2 low permeability glacial till. Experience of a
large number of quality assured and controlled geomembrane installations indicates the
likely presence of between 2 and 5 leaks per hectare and these defects are generally less
than 10 mm2 in size.
Seepage calculations have been based on the design equations given in References 1 and
2 below for the worst case, when the facility is filled with tailings.
Ref 1 Leakage through Liners Constructed with Geomembranes. Part II. Composite
Liners. J. P. Giroud, et al., Geotextiles and Geomembranes, 8(4) pp71-111 1989.
Ref 2 Rate of Leakage through a Composite Liner due to Geomembrane Defects. J. P.
Giroud, et al., Geotextiles and Geomembranes, 11(1) pp1-28 1992
These equations also over estimate seepage flow from a lined tailings facility as any
defect is choked by the tailings particles reducing the seepage significantly.
The volume of seepage flowing laterally through the dam wall via the GCL and some
nominal defects in the lining system for a constant head of 20m (Phase 2) would be an
average of about 1.5 m3/day with a 10% probability of the seepage being less than 0.25
m3/day and a 10% probability being greater than 5 m3/day. The range represented in
the figure below, is based on a number of variables including infiltration rate based on
the range of vertical permeability values of the tailings, the range of defects in the lining
per hectare, the effective permeability of the composite lining and head acting on the
lining.
For
insp
ectio
n pur
pose
s only
.
Conse
nt of
copy
right
owne
r req
uired
for a
ny ot
her u
se.
EPA Export 14-10-2017:03:27:43

IEL PO516-04 Review Application Response to Further Information Request 12/09/2017
8 | P a g e
Figure 1: Probability of Seepage from Composite Lining System
The dam wall incorporates a basal granular drainage blanket and the downstream
dam shell has been modified to be granular. Thus any seepage through the dam wall
will be directed to the drainage blanket. Seepage through the basin will pass into the
underlying limestone. It is not therefore not appropriate to undertake a seepage
model under these circumstances.
Response to Item 5 (b)
Neither the main composited lined cells at Lisheen or the Phase 1 Extension and Phase
2 cells at Aughinish had over or under drainage systems.
Overdrainage:
There are a number of reasons why an overliner was not proposed detailed below:
Unlike domestic land fill facilities, the tailings are a very low permeability
material. Placing a drainage blanket above the lining would allow the drainage
water to find and recharge any defects in the lining system.
For
insp
ectio
n pur
pose
s only
.
Conse
nt of
copy
right
owne
r req
uired
for a
ny ot
her u
se.
EPA Export 14-10-2017:03:27:43
IEL PO516-04 Review Application Response to Further Information Request 12/09/2017
9 | P a g e
Most damage to a lining system in landfills is a consequence of placing the
drainage blanket.
The water storage capacity of the drainage system is relatively small and the
recharge to the system via the low permeability tailings is slow. Thus pumps,
which would have to pump over the dam wall would rapidly pump the drainage
system followed by a long pause as the drainage blanket recharged.
The basin area of the TMF is significantly greater than those used at domestic
land fill sites. These are typically 1 Ha to 5 Ha. The basin area of the TMF is 43
Ha and would be difficult to shape with constant grades to a sump.
Seepages are comparatively very low compared to the adjoining tailings
facilities (Stages 1 to 5) which are lined with glacial till or clay blanket.
Underdrainage
Much of the footprint of the Stage 6 TMF is bed rock ranging from Lower Palaeozoic in
age through to Lower Carboniferous Limestone.
The Lower Palaeozoic rocks are divided into four main rock types, consisting of Lower
Palaeozoics, Red Beds (Old Red Sandstone), Mixed Beds and Pale Beds. The rocks are
predominantly siltstones, sandstones, shales and greywackes with quartz conglomerate
horizons. These Lower Palaeozoic rocks occur at rock head level to the east and north
of the tailings facility and in a 500 m wide zone beneath the site, to the west side of the
Randalstown fault. The fault cuts from northeast to southwest across the site.
The Pale Beds or the Meath Formation comprise a variety of pelletal, oolitic and
bioclastic calcarenites which locally contain quartz sand and darker argillaceous layers.
They are a dominantly massive group and are characterised by their low shale content.
The base of the Pale Beds is defined by a pale micritic limestone known as the Micrite
Unit, which varies greatly in thickness. The Pale Beds vary from 0 m to 140 m thick
across the Randalstown area.
All rocks are fractured and the mass permeability exceeds the seepage derived from the
low permeability of the tailings combined with any defects in the HDPE component of
the composite lining. Thus an underliner drainage system would not collect the seepage
and the seepage would pass vertically downwards and be diluted by the ground water.
A limited underdrainage system is incorporated to control groundwater during
construction and particularly during the winter months in which the water table will
rise. The main drainage system which exits in the north-west corner of the site will be
monitored for water quality.
_____________________________________________________________________________________________________
For
insp
ectio
n pur
pose
s only
.
Conse
nt of
copy
right
owne
r req
uired
for a
ny ot
her u
se.
EPA Export 14-10-2017:03:27:43
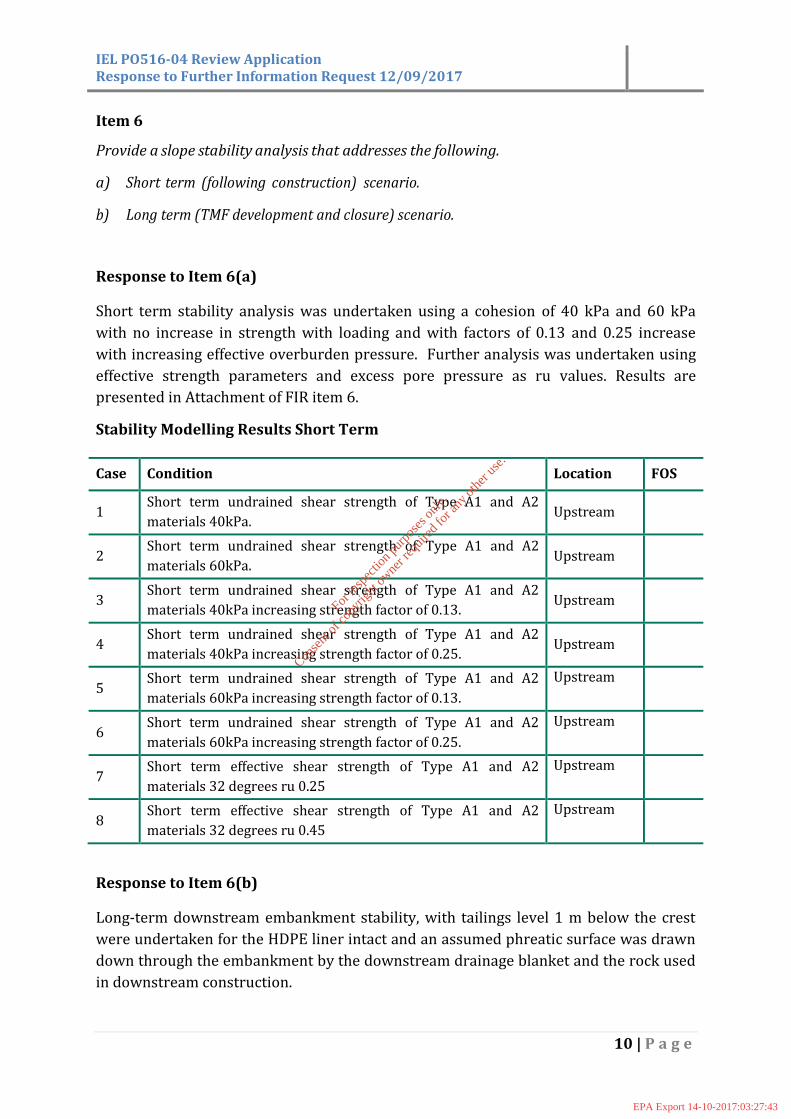
IEL PO516-04 Review Application Response to Further Information Request 12/09/2017
10 | P a g e
Item 6
Provide a slope stability analysis that addresses the following.
a) Short term (following construction) scenario.
b) Long term (TMF development and closure) scenario.
Response to Item 6(a)
Short term stability analysis was undertaken using a cohesion of 40 kPa and 60 kPa
with no increase in strength with loading and with factors of 0.13 and 0.25 increase
with increasing effective overburden pressure. Further analysis was undertaken using
effective strength parameters and excess pore pressure as ru values. Results are
presented in Attachment of FIR item 6.
Stability Modelling Results Short Term
Case Condition Location FOS
1 Short term undrained shear strength of Type A1 and A2
materials 40kPa. Upstream
2 Short term undrained shear strength of Type A1 and A2
materials 60kPa. Upstream
3 Short term undrained shear strength of Type A1 and A2
materials 40kPa increasing strength factor of 0.13. Upstream
4 Short term undrained shear strength of Type A1 and A2
materials 40kPa increasing strength factor of 0.25. Upstream
5 Short term undrained shear strength of Type A1 and A2
materials 60kPa increasing strength factor of 0.13.
Upstream
6 Short term undrained shear strength of Type A1 and A2
materials 60kPa increasing strength factor of 0.25.
Upstream
7 Short term effective shear strength of Type A1 and A2
materials 32 degrees ru 0.25
Upstream
8 Short term effective shear strength of Type A1 and A2
materials 32 degrees ru 0.45
Upstream
Response to Item 6(b)
Long-term downstream embankment stability, with tailings level 1 m below the crest
were undertaken for the HDPE liner intact and an assumed phreatic surface was drawn
down through the embankment by the downstream drainage blanket and the rock used
in downstream construction.
For
insp
ectio
n pur
pose
s only
.
Conse
nt of
copy
right
owne
r req
uired
for a
ny ot
her u
se.
EPA Export 14-10-2017:03:27:43
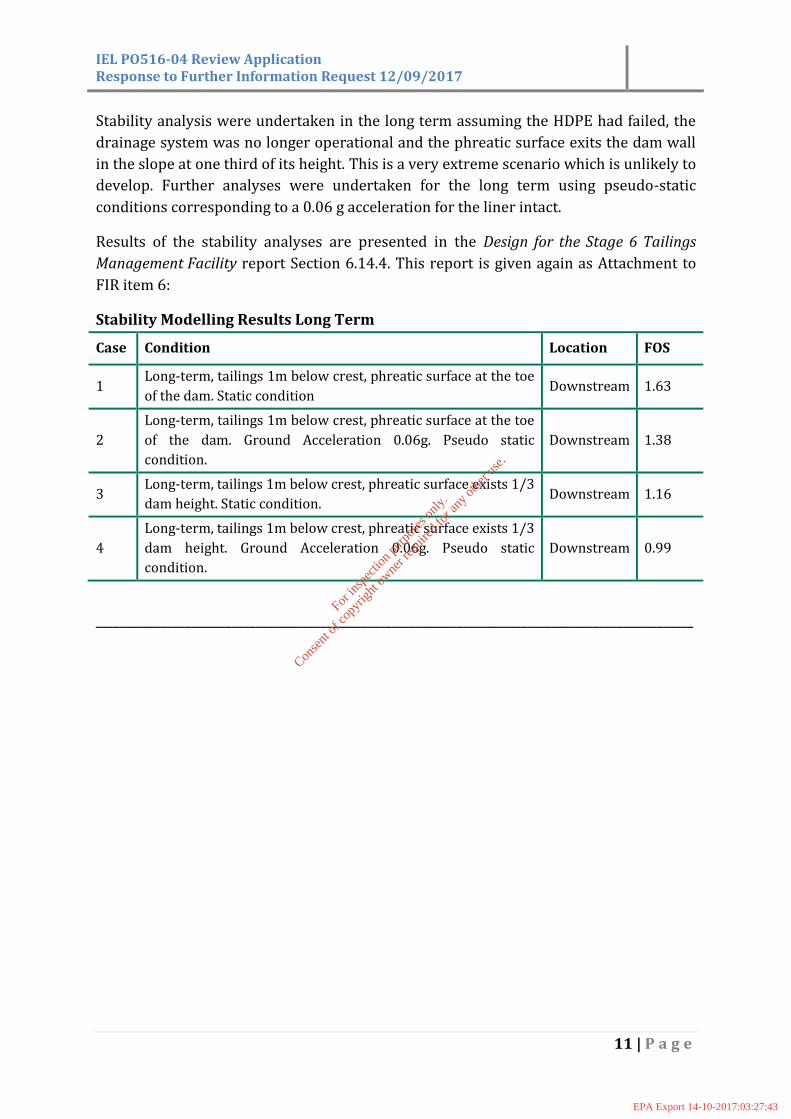
IEL PO516-04 Review Application Response to Further Information Request 12/09/2017
11 | P a g e
Stability analysis were undertaken in the long term assuming the HDPE had failed, the
drainage system was no longer operational and the phreatic surface exits the dam wall
in the slope at one third of its height. This is a very extreme scenario which is unlikely to
develop. Further analyses were undertaken for the long term using pseudo-static
conditions corresponding to a 0.06 g acceleration for the liner intact.
Results of the stability analyses are presented in the Design for the Stage 6 Tailings
Management Facility report Section 6.14.4. This report is given again as Attachment to
FIR item 6:
Stability Modelling Results Long Term
Case Condition Location FOS
1 Long-term, tailings 1m below crest, phreatic surface at the toe
of the dam. Static condition Downstream 1.63
2
Long-term, tailings 1m below crest, phreatic surface at the toe
of the dam. Ground Acceleration 0.06g. Pseudo static
condition.
Downstream 1.38
3 Long-term, tailings 1m below crest, phreatic surface exists 1/3
dam height. Static condition. Downstream 1.16
4
Long-term, tailings 1m below crest, phreatic surface exists 1/3
dam height. Ground Acceleration 0.06g. Pseudo static
condition.
Downstream 0.99
_____________________________________________________________________________________________________
For
insp
ectio
n pur
pose
s only
.
Conse
nt of
copy
right
owne
r req
uired
for a
ny ot
her u
se.
EPA Export 14-10-2017:03:27:43
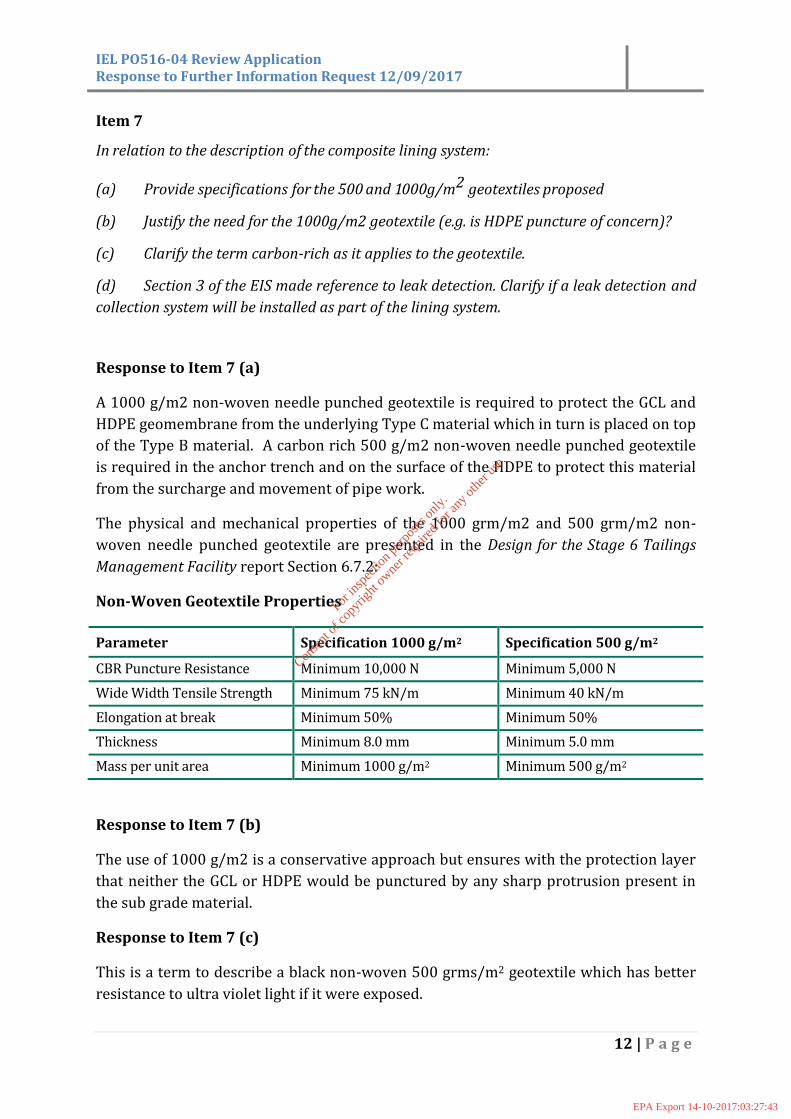
IEL PO516-04 Review Application Response to Further Information Request 12/09/2017
12 | P a g e
Item 7
In relation to the description of the composite lining system:
(a) Provide specifications for the 500 and 1000g/m2 geotextiles proposed
(b) Justify the need for the 1000g/m2 geotextile (e.g. is HDPE puncture of concern)?
(c) Clarify the term carbon-rich as it applies to the geotextile.
(d) Section 3 of the EIS made reference to leak detection. Clarify if a leak detection and
collection system will be installed as part of the lining system.
Response to Item 7 (a)
A 1000 g/m2 non-woven needle punched geotextile is required to protect the GCL and
HDPE geomembrane from the underlying Type C material which in turn is placed on top
of the Type B material. A carbon rich 500 g/m2 non-woven needle punched geotextile
is required in the anchor trench and on the surface of the HDPE to protect this material
from the surcharge and movement of pipe work.
The physical and mechanical properties of the 1000 grm/m2 and 500 grm/m2 non-
woven needle punched geotextile are presented in the Design for the Stage 6 Tailings
Management Facility report Section 6.7.2:
Non-Woven Geotextile Properties
Parameter Specification 1000 g/m2 Specification 500 g/m2
CBR Puncture Resistance Minimum 10,000 N Minimum 5,000 N
Wide Width Tensile Strength Minimum 75 kN/m Minimum 40 kN/m
Elongation at break Minimum 50% Minimum 50%
Thickness Minimum 8.0 mm Minimum 5.0 mm
Mass per unit area Minimum 1000 g/m2 Minimum 500 g/m2
Response to Item 7 (b)
The use of 1000 g/m2 is a conservative approach but ensures with the protection layer
that neither the GCL or HDPE would be punctured by any sharp protrusion present in
the sub grade material.
Response to Item 7 (c)
This is a term to describe a black non-woven 500 grms/m2 geotextile which has better
resistance to ultra violet light if it were exposed.
For
insp
ectio
n pur
pose
s only
.
Conse
nt of
copy
right
owne
r req
uired
for a
ny ot
her u
se.
EPA Export 14-10-2017:03:27:43
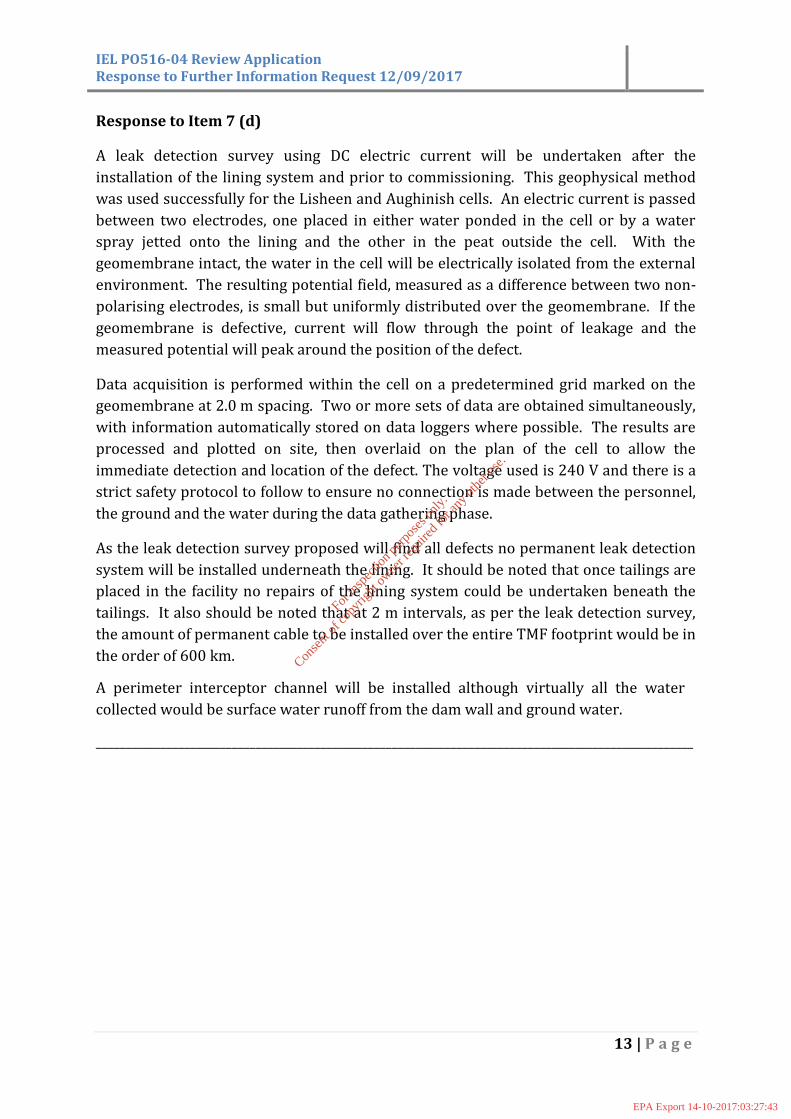
IEL PO516-04 Review Application Response to Further Information Request 12/09/2017
13 | P a g e
Response to Item 7 (d)
A leak detection survey using DC electric current will be undertaken after the
installation of the lining system and prior to commissioning. This geophysical method
was used successfully for the Lisheen and Aughinish cells. An electric current is passed
between two electrodes, one placed in either water ponded in the cell or by a water
spray jetted onto the lining and the other in the peat outside the cell. With the
geomembrane intact, the water in the cell will be electrically isolated from the external
environment. The resulting potential field, measured as a difference between two non-
polarising electrodes, is small but uniformly distributed over the geomembrane. If the
geomembrane is defective, current will flow through the point of leakage and the
measured potential will peak around the position of the defect.
Data acquisition is performed within the cell on a predetermined grid marked on the
geomembrane at 2.0 m spacing. Two or more sets of data are obtained simultaneously,
with information automatically stored on data loggers where possible. The results are
processed and plotted on site, then overlaid on the plan of the cell to allow the
immediate detection and location of the defect. The voltage used is 240 V and there is a
strict safety protocol to follow to ensure no connection is made between the personnel,
the ground and the water during the data gathering phase.
As the leak detection survey proposed will find all defects no permanent leak detection
system will be installed underneath the lining. It should be noted that once tailings are
placed in the facility no repairs of the lining system could be undertaken beneath the
tailings. It also should be noted that at 2 m intervals, as per the leak detection survey,
the amount of permanent cable to be installed over the entire TMF footprint would be in
the order of 600 km.
A perimeter interceptor channel will be installed although virtually all the water
collected would be surface water runoff from the dam wall and ground water.
_____________________________________________________________________________________________________
For
insp
ectio
n pur
pose
s only
.
Conse
nt of
copy
right
owne
r req
uired
for a
ny ot
her u
se.
EPA Export 14-10-2017:03:27:43

IEL PO516-04 Review Application Response to Further Information Request 12/09/2017
14 | P a g e
Item 8
It is stated that the Stage 6 TMF extension will be operated in a manner similar to the
existing TSF by discharging the tailings from spigots on the dam crest.
a) Provide a tailings deposition plan detailing the layout of the tailings pipeline,
deposition points, decant location and technical specifications of the pipeline (including
proposed pipe cross-section and long section).
b) Provide an explanation why burying the tailings pipeline is preferred to the over-
ground piping, in relation to containment in the event of leakage.
Response to Item 8(a)
The tailings deposition systems for the Stage 6 crest are detailed in Figure 2, including
spigot locations and long section (figure 3). The main header pipeline carrying the
tailings is 800 mm OD, 559 mm ID, PE100 and SDR17. The spigot spacings will be at
75m. The tailings discharge pipe line at the spigots is 200 mm OD, 176 mm ID, PE 100
and SDR17. A typical spigot point is presented in Figure 4 below
During normal operation, tailings are cycloned to produce a coarse fraction used as
backfill hydraulic fill for the mine. The fine fraction is pumped to the TSF. On occasion
when hydraulic fill is not required by the mine, the processing plant tailings are pumped
in total to the TSF.
Discharge of the total tailings fraction is from a single point, through a dedicated 800
mm OD pipeline of specification as described above. Discharge of this fine fraction
occurs from 3 to 4 spigots at any one time for a period of one week and the tailings are
deposited in layers. Discharge is rotated systematically along the dam wall crest.
The reclaim pump system is located in the south east corner and the water will be
pumped back into the existing reclaim water pumping system.
Response to Item 8(b)
The header pipeline is buried on the crest to prevent excessive movement due to
temperature related expansion/contraction of the pipe, protection from vehicle damage
and to act as a landscape berm.
The fact that the pipeline is buried has no application to containment in the event of a
leakage.
_____________________________________________________________________________________________________
For
insp
ectio
n pur
pose
s only
.
Conse
nt of
copy
right
owne
r req
uired
for a
ny ot
her u
se.
EPA Export 14-10-2017:03:27:43
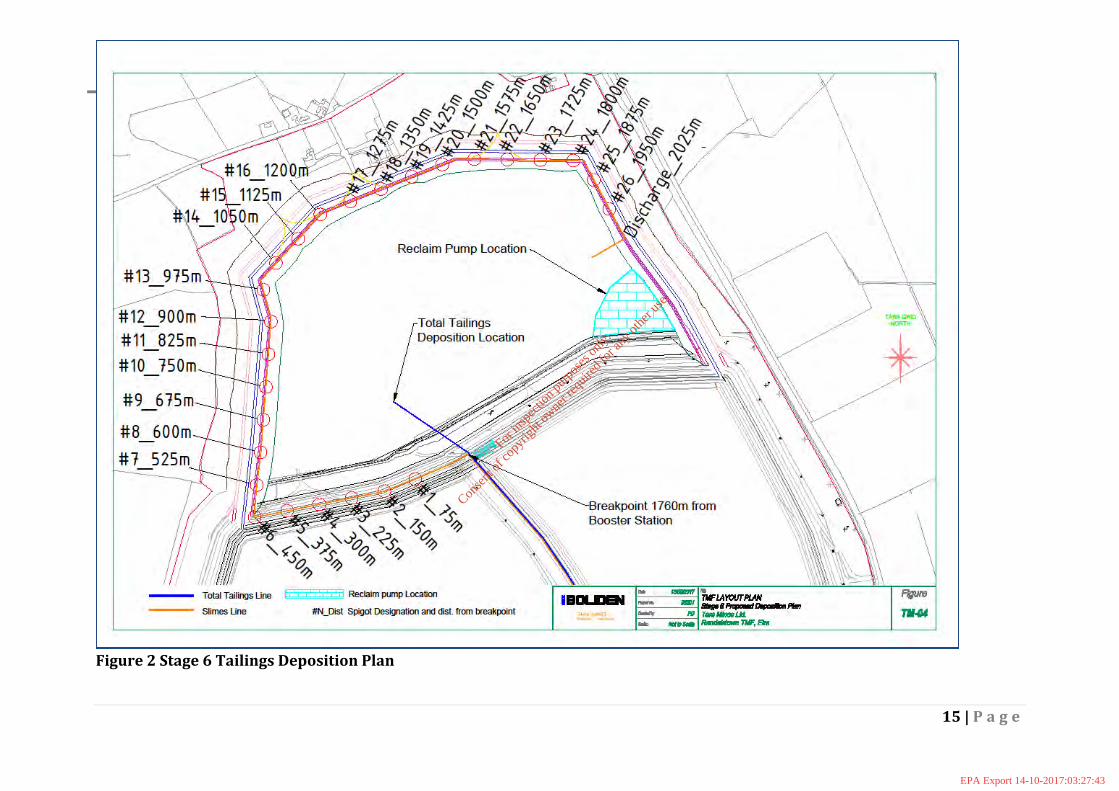
IEL PO516-04 Review Application Response to Further Information Request 12/09/2017
15 | P a g e
Figure 2 Stage 6 Tailings Deposition Plan
For
insp
ectio
n pur
pose
s only
.
Conse
nt of
copy
right
owne
r req
uired
for a
ny ot
her u
se.
EPA Export 14-10-2017:03:27:43
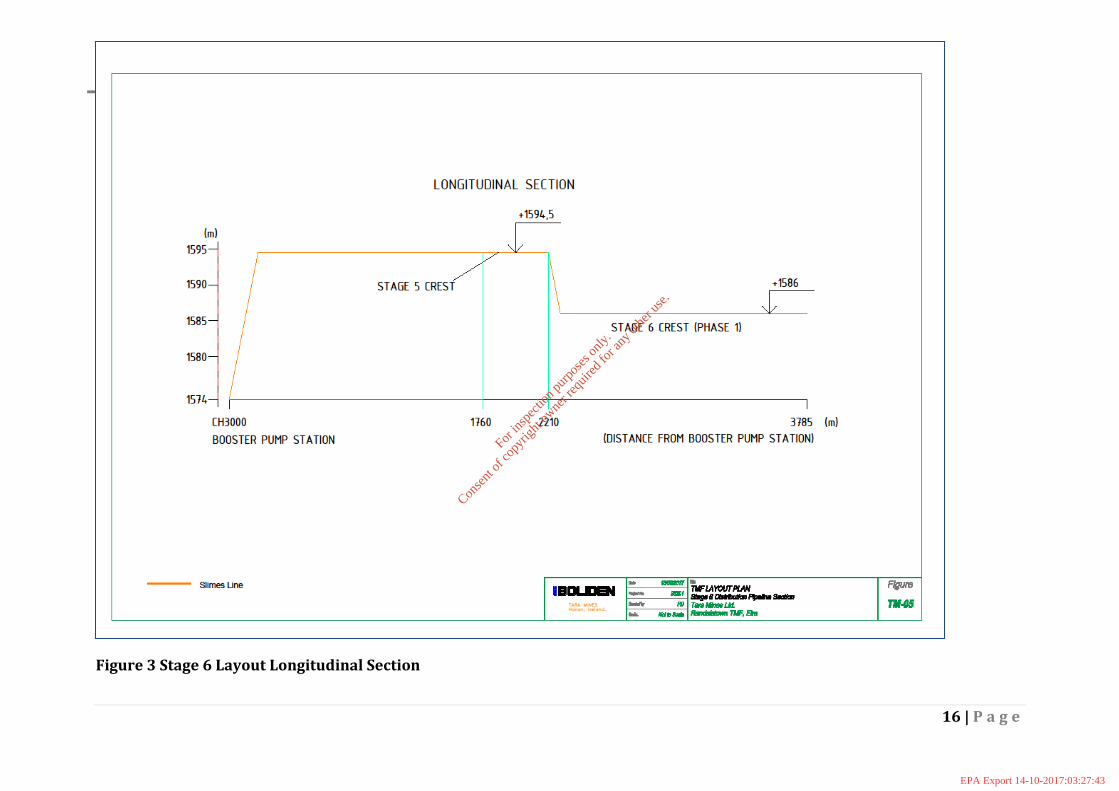
IEL PO516-04 Review Application Response to Further Information Request 12/09/2017
16 | P a g e
Figure 3 Stage 6 Layout Longitudinal Section
For
insp
ectio
n pur
pose
s only
.
Conse
nt of
copy
right
owne
r req
uired
for a
ny ot
her u
se.
EPA Export 14-10-2017:03:27:43

IEL PO516-04 Review Application Response to Further Information Request 12/09/2017
17 | P a g e
Figure 4 Typical Spigot Point
For
insp
ectio
n pur
pose
s only
.
Conse
nt of
copy
right
owne
r req
uired
for a
ny ot
her u
se.
EPA Export 14-10-2017:03:27:43
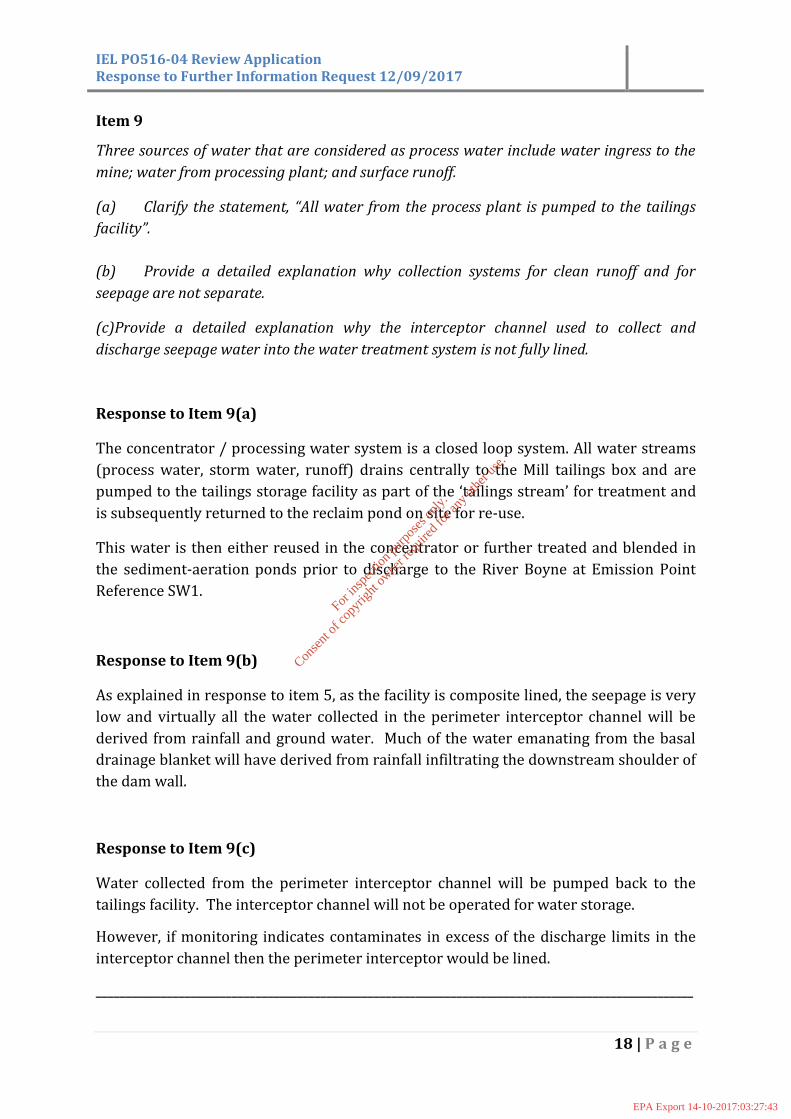
IEL PO516-04 Review Application Response to Further Information Request 12/09/2017
18 | P a g e
Item 9
Three sources of water that are considered as process water include water ingress to the
mine; water from processing plant; and surface runoff.
(a) Clarify the statement, “All water from the process plant is pumped to the tailings
facility”.
(b) Provide a detailed explanation why collection systems for clean runoff and for
seepage are not separate.
(c)Provide a detailed explanation why the interceptor channel used to collect and
discharge seepage water into the water treatment system is not fully lined.
Response to Item 9(a)
The concentrator / processing water system is a closed loop system. All water streams
(process water, storm water, runoff) drains centrally to the Mill tailings box and are
pumped to the tailings storage facility as part of the ‘tailings stream’ for treatment and
is subsequently returned to the reclaim pond on site for re-use.
This water is then either reused in the concentrator or further treated and blended in
the sediment-aeration ponds prior to discharge to the River Boyne at Emission Point
Reference SW1.
Response to Item 9(b)
As explained in response to item 5, as the facility is composite lined, the seepage is very
low and virtually all the water collected in the perimeter interceptor channel will be
derived from rainfall and ground water. Much of the water emanating from the basal
drainage blanket will have derived from rainfall infiltrating the downstream shoulder of
the dam wall.
Response to Item 9(c)
Water collected from the perimeter interceptor channel will be pumped back to the
tailings facility. The interceptor channel will not be operated for water storage.
However, if monitoring indicates contaminates in excess of the discharge limits in the
interceptor channel then the perimeter interceptor would be lined.
_____________________________________________________________________________________________________
For
insp
ectio
n pur
pose
s only
.
Conse
nt of
copy
right
owne
r req
uired
for a
ny ot
her u
se.
EPA Export 14-10-2017:03:27:43

IEL PO516-04 Review Application Response to Further Information Request 12/09/2017
19 | P a g e
Item 10
It is proposed that the existing water treatment system will be used for both Stage 5 and
Stage 6 TMF until an integrated constructed wetland system is put in place. Provide
detailed information on the capability and suitability of the existing water treatment to
accommodate the increased volumes following Stage 6 start-up and prior to Stage 5
decommissioning.
Response to Item 10
Process water flow from the TSF will not increase with the commissioning of Stage 6 as
the combined inputs to both systems will remain the same.
All process water eminating from the TSF will continue to enter the water management
system as at present. A wetlands water treamtment system will be utilised on
decommissioning of Stage 5.
_____________________________________________________________________________________________________
Item 11
It is noted that no tailings flow slide analysis is provided in the EIS in relation to TMF dam
failure. Provide an assessment of the potential impact on the environment in the event of a
TMF dam failure.
Response to Item 11
A dam break analysis for the existing and Stage 6 tailings facility has been undertaken
and is presented in Appendix to FIR item 11.
_____________________________________________________________________________________________________
For
insp
ectio
n pur
pose
s only
.
Conse
nt of
copy
right
owne
r req
uired
for a
ny ot
her u
se.
EPA Export 14-10-2017:03:27:43

IEL PO516-04 Review Application
Response to Further Information Request 12/09/2017
Appendix to FIR Item 1 • Stage 6 TMF Footprint Palaeokarst Site Investigation and Grouting
Works (Golder Associates)
For
insp
ectio
n pur
pose
s only
.
Conse
nt of
copy
right
owne
r req
uired
for a
ny ot
her u
se.
EPA Export 14-10-2017:03:27:43

September 2017
BOLIDEN TARA MINES LTD
Stage 6 TMF Footprint Palaeokarst Site Investigation and Grouting Works
RE
PO
RT
Report Number 1782163.R01.A0
Distribution: Boliden Tara Mines - one copy
Golder Associates Ireland Ltd - one copy
Submitted to: Boliden Tara Mines Ltd Knockumber Navan Co Meath
For
insp
ectio
n pur
pose
s only
.
Conse
nt of
copy
right
owne
r req
uired
for a
ny ot
her u
se.
EPA Export 14-10-2017:03:27:43
BOLIDEN TARA MINES - STAGE 6 PALAEOKARST REPORT
September 2017 Report No. 1782163.R01.A0
Study Limitations
IMPORTANT: This section should be read before reliance is placed on any of the opinions advice, recommendations or conclusions herein set out.
a) This report has been prepared for and at the request of Boliden Tara Mines Ltd (“the Client or Tara”) for the purpose of undertaking a drilling investigation to its appointment of Golder Associates Ireland Limited (Golder) to act as Consultant;
b) Save for the Client no duty is undertaken or warranty or representation made to any party in respect of the opinions, advice, recommendations or conclusions herein set out;
c) Regard should be had to the agreements between Golder and the Client from the proposal and the subsequent Terms of Appointment issued by Golder;
d) All work carried out in preparing this report has used, and is based upon Golder’s professional knowledge and understanding of the current relevant Irish, UK and European Community legislation.
Changes in the legislation may cause the opinion, advice, recommendations or conclusions set out in this report to become inappropriate or incorrect. However, in giving its opinions, advice, recommendations and conclusions, Golder has considered pending changes to environmental legislation and regulations of which it is currently aware. Following delivery of this report, Golder will have no obligation to advise the Client of any such changes, or of their repercussions;
e) Golder acknowledges that it is being retained, in part because of its knowledge and experience with respect to engineering and environmental matters. Golder will consider and analyse all information provided to it in the context of its knowledge and experience and all other relevant information known to Golder. To the extent that the information provided to Golder is not inconsistent or incompatible therewith, Golder shall be entitled to rely upon and assume, without independent verification, the accuracy and completeness of all such information and Golder shall have no obligation to verify the accuracy and completeness of such information;
f) The content of this report represents the professional opinion of experienced engineering and environmental consultants, Golder does not provide specialist legal advice and the advice of lawyers will be required;
g) If the scope of the work includes borings, trial pits, or engineering interpretation of such information attention is drawn to the fact that special risks occur whenever engineering and related disciplines are applied to identify subsurface conditions. Even a comprehensive sampling and testing programme implemented in accordance with a professional Standard of Care may fail to detect certain conditions. The environmental, geologic, geotechnical, geochemical and hydrogeological conditions that Golder interprets to exist between sampling points may differ from those that actually exist. Passage of time, natural occurrences, and activities near the Site may substantially alter discovered conditions;
h) In the conclusion section of this report, Golder has set out its findings and provided a summary and overview of its advice, opinions and recommendations, however, other parts of this report will often indicate the limitations of the information obtained by Golder and therefore any advice, opinions or recommendations set out in the conclusion section ought not to be relied upon until considered in the context of the whole report; and
i) The contents of this report includes confidential information and should not be disclosed to third parties without prior written approval from Golder.
For
insp
ectio
n pur
pose
s only
.
Conse
nt of
copy
right
owne
r req
uired
for a
ny ot
her u
se.
EPA Export 14-10-2017:03:27:43

BOLIDEN TARA MINES - STAGE 6 PALAEOKARST REPORT
September 2017 Report No. 1782163.R01.A0 i
Table of Contents
1.0 BACKGROUND AND INTRODUCTION .................................................................................................................... 1
2.0 BOREHOLE TARGETING ......................................................................................................................................... 2
3.0 DRILLING AND CAMERA SURVEY RESULTS ....................................................................................................... 5
4.0 GROUTING WORKS ................................................................................................................................................. 6
5.0 CONCLUSIONS ......................................................................................................................................................... 6
6.0 REFERENCES ........................................................................................................................................................... 7
TABLES Table 1: Coordinates for Proposed Borehole Locations in Irish National Grid ........................................................... 4
Table 2: Tara Mines Stage 6 Grouting Works ..................................................................................................................... 6
FIGURES Figure 1: Aerial Photograph of the Proposed Stage 6 TMF (Northern and Seven Fields Borrow Area) .............................. 1
Figure 2: Geological Map of area around Tara TMF, Stage 6 TMF footprint is located to the north of the existing TMF (highlighted by yellow dashed line) ............................................................................................................ 2
Figure 3: Residual Bouguer Gravity Map with Borehole Locations (red circles) .................................................................. 3
Figure 4: Location of Boreholes (plotted over recent aerial photograph of the Stage 6 TMF footprint) ............................... 4
APPENDICES APPENDIX A Geotechnical Borehole Logs
For
insp
ectio
n pur
pose
s only
.
Conse
nt of
copy
right
owne
r req
uired
for a
ny ot
her u
se.
EPA Export 14-10-2017:03:27:43

BOLIDEN TARA MINES - STAGE 6 PALAEOKARST REPORT
September 2017 Report No. 1782163.R01.A0 1
1.0 BACKGROUND AND INTRODUCTION Golder Associates (Golder) was retained by Boliden Tara Mines Ltd (Tara) to investigate potential palaeokarst
features, interpreted during recent geophysics survey works (Electrical Resistivity Imaging (ERI), Seismic
Refraction, EM31 Electromagnetic-Conductivity and Micro-Gravity), within the footprint of the proposed Stage
6 Tailings Management Facility (TMF) (the ‘Site’). The ‘Site’ is located to the north of the existing TMF at
Randalstown, Co. Meath (Figure 1).
Figure 1: Aerial Photograph of the Proposed Stage 6 TMF (Northern and Seven Fields Borrow Area)
The footprint of the Stage 6 TMF is confined to the existing ‘Northern and Seven Fields Borrow Areas’. During
the development phases of previous raises of the main TMF, the Site was used as a Borrow Area for
construction material and occupies some 40 hectares.
The bedrock underlying the proposed Stage 6 TMF footprint comprises of two main units:
Pale Beds (Carboniferous Limestones); and
Non-calcareous Lower Palaeozoic (LP) sediments (Rathkenny Formation).
The geological map of the area (supplied by Tara) in Figure 2 below shows that the majority of the footprint to
the east (including the area known as the Seven Fields Borrow Area) is underlain by black mudstone, siltstone
and greywacke of the Rathkenny Formation, which is Lower Palaeozoic in age.
Pale Beds (PB) are understood to underlie much of the south-western part of the Site and present a potential
risk for palaeokarst features; a number of anomalies were interpreted from the recent geophysical survey
For
insp
ectio
n pur
pose
s only
.
Conse
nt of
copy
right
owne
r req
uired
for a
ny ot
her u
se.
EPA Export 14-10-2017:03:27:43
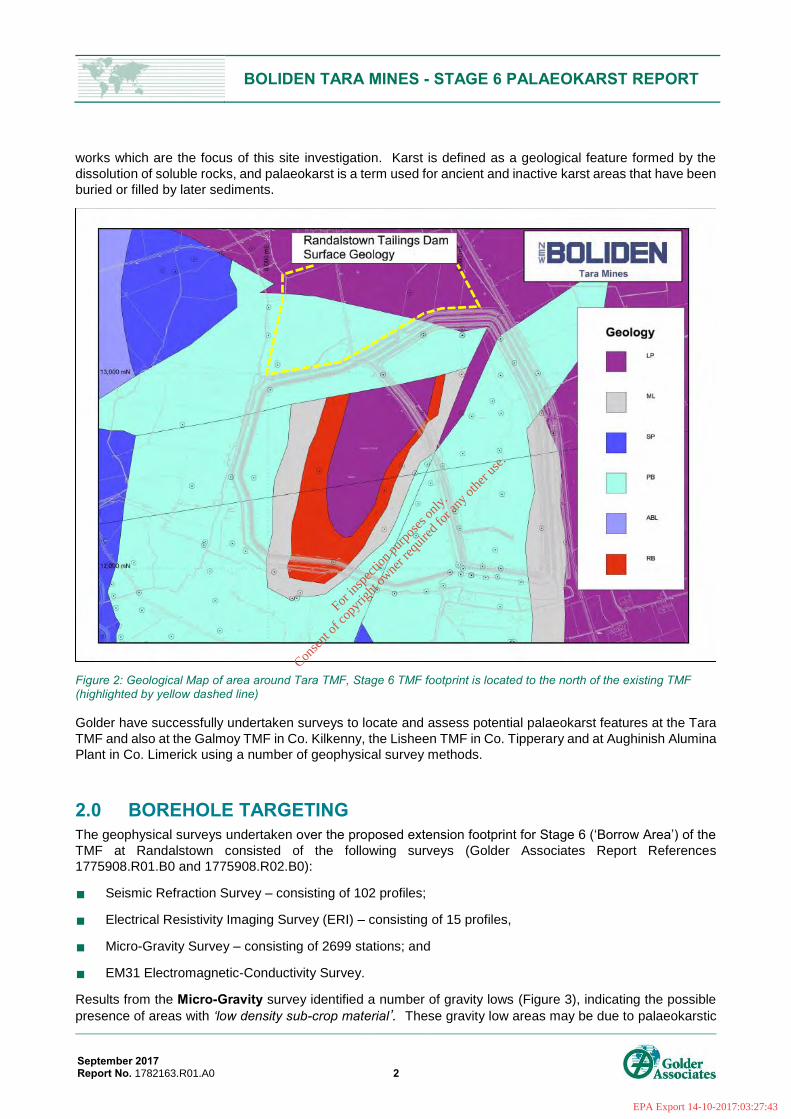
BOLIDEN TARA MINES - STAGE 6 PALAEOKARST REPORT
September 2017 Report No. 1782163.R01.A0 2
works which are the focus of this site investigation. Karst is defined as a geological feature formed by the
dissolution of soluble rocks, and palaeokarst is a term used for ancient and inactive karst areas that have been
buried or filled by later sediments.
Figure 2: Geological Map of area around Tara TMF, Stage 6 TMF footprint is located to the north of the existing TMF (highlighted by yellow dashed line)
Golder have successfully undertaken surveys to locate and assess potential palaeokarst features at the Tara
TMF and also at the Galmoy TMF in Co. Kilkenny, the Lisheen TMF in Co. Tipperary and at Aughinish Alumina
Plant in Co. Limerick using a number of geophysical survey methods.
2.0 BOREHOLE TARGETING The geophysical surveys undertaken over the proposed extension footprint for Stage 6 (‘Borrow Area’) of the
TMF at Randalstown consisted of the following surveys (Golder Associates Report References
1775908.R01.B0 and 1775908.R02.B0):
Seismic Refraction Survey – consisting of 102 profiles;
Electrical Resistivity Imaging Survey (ERI) – consisting of 15 profiles,
Micro-Gravity Survey – consisting of 2699 stations; and
EM31 Electromagnetic-Conductivity Survey.
Results from the Micro-Gravity survey identified a number of gravity lows (Figure 3), indicating the possible
presence of areas with ‘low density sub-crop material’. These gravity low areas may be due to palaeokarstic
For
insp
ectio
n pur
pose
s only
.
Conse
nt of
copy
right
owne
r req
uired
for a
ny ot
her u
se.
EPA Export 14-10-2017:03:27:43

BOLIDEN TARA MINES - STAGE 6 PALAEOKARST REPORT
September 2017 Report No. 1782163.R01.A0 3
features within the underlying Pale Beds limestones. Modelling of the Micro-Gravity and comparison with the
ERI pseudosections and Seismic Refraction profiles indicates that heavily weathered, fractured (and
palaeokarstic) bedrock conditions may exist in the underlying Pale Bed limestones from near surface to depths
of typically 40 to 50 m bgl. Five locations for boreholes, centred on the anomalies, were selected to test for
the presence of palaeokarst features.
Figure 3: Residual Bouguer Gravity Map with Borehole Locations (red circles)
None of the anomalies interpreted are located beneath the dam wall footprint, all five are located in the south-
west section of the base of the proposed Stage 6 TMF.
Previous site investigations (trial pitting) indicated that a thin layer of glacial till varying in thickness from 0.5 m
to 5.0 m overlies much of the Site. In some instances overburden thicknesses in excess of 5 m occur,
particularly overlying the Pale Beds in the western part of the Site. This material typically consists of grey
clayey silty sands and gravels with boulders, and gravelly sandy clayey silts with boulders, and weathered
brown clayey silty sands and gravels with occasional boulders. As the grey till approaches the underlying
bedrock surface, the boulder content typically increases to over 50% of the material.
For
insp
ectio
n pur
pose
s only
.
Conse
nt of
copy
right
owne
r req
uired
for a
ny ot
her u
se.
EPA Export 14-10-2017:03:27:43
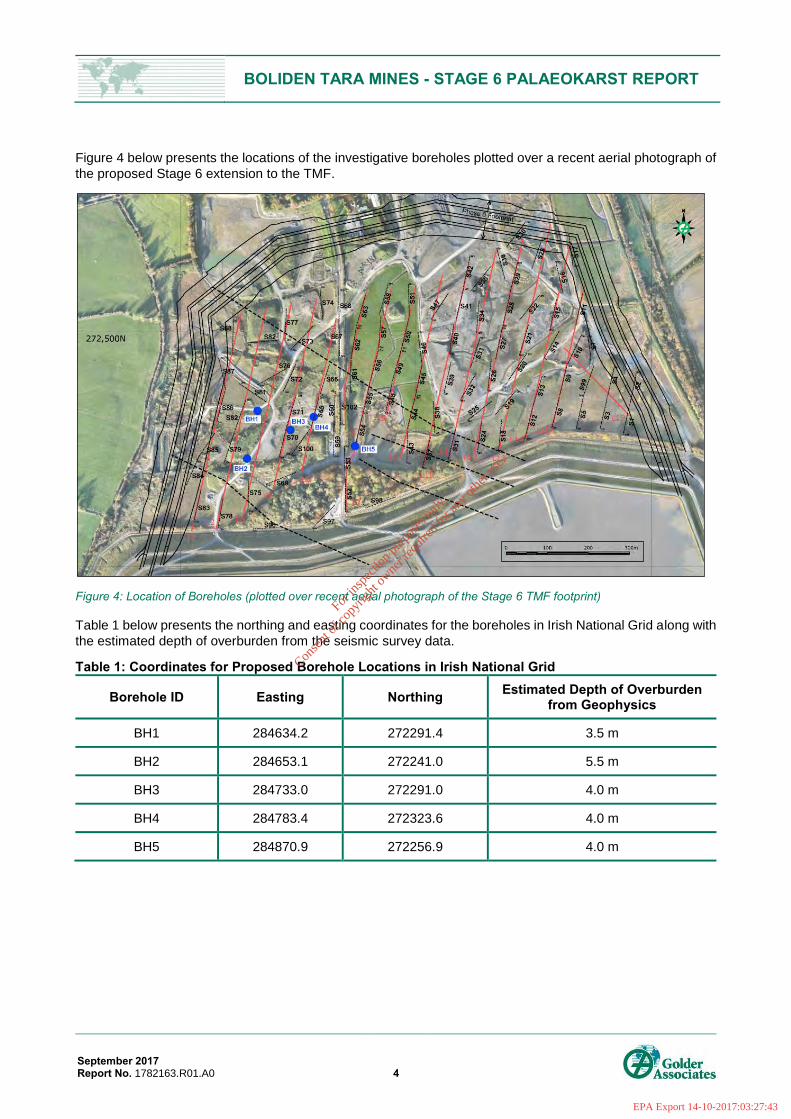
BOLIDEN TARA MINES - STAGE 6 PALAEOKARST REPORT
September 2017 Report No. 1782163.R01.A0 4
Figure 4 below presents the locations of the investigative boreholes plotted over a recent aerial photograph of
the proposed Stage 6 extension to the TMF.
Figure 4: Location of Boreholes (plotted over recent aerial photograph of the Stage 6 TMF footprint)
Table 1 below presents the northing and easting coordinates for the boreholes in Irish National Grid along with
the estimated depth of overburden from the seismic survey data.
Table 1: Coordinates for Proposed Borehole Locations in Irish National Grid
Borehole ID Easting Northing Estimated Depth of Overburden from Geophysics
BH1 284634.2 272291.4 3.5 m
BH2 284653.1 272241.0 5.5 m
BH3 284733.0 272291.0 4.0 m
BH4 284783.4 272323.6 4.0 m
BH5 284870.9 272256.9 4.0 m
For
insp
ectio
n pur
pose
s only
.
Conse
nt of
copy
right
owne
r req
uired
for a
ny ot
her u
se.
EPA Export 14-10-2017:03:27:43

BOLIDEN TARA MINES - STAGE 6 PALAEOKARST REPORT
September 2017 Report No. 1782163.R01.A0 5
3.0 DRILLING AND CAMERA SURVEY RESULTS The borehole drilling works were conducted by JS Drilling Ltd of Thomastown, Co Kilkenny with attendance
provided by a Golder. Borehole locations were determined by an interpretation of the geophysical survey data
and centred on the anomalies. A Golder geologist supervised the drilling works and completed geotechnical
logs (to BS 5930:1999 + A2 2010) for each of the boreholes, which are provided in Appendix A. Following
drilling each borehole, a camera survey was completed to assess for the presence of palaeokarst features.
A brief summary of each borehole is described below:
BH1 – Upper 6.0m comprised of made ground/overburden. Palaeokarst from 6m -17 m, in-filled with
sands, gravels, and pebbles/cobbles, including a 2.5m section of weathered limestone. Water strike at
14.5m. Limestone bedrock encountered at 17.0m, with the borehole being terminated at 23.5m (in
bedrock).
BH2 – Upper 1.7m comprised of made ground/overburden. Palaeokarst from 1.7m - 40.3m, in-filled with
sands, silts, clays, and gravels/cobbles. End of borehole at 40.3m due drill rods becoming stuck.
BH3 - Upper 1.0m comprised of glacial till. Palaeokarst from 1.0m - 33.5m, in-filled with clays and gravels,
becoming increasingly clay rich with depth. End of borehole at 33.5m due to loss of air (very stiff clays).
BH4 – Upper 2.0m comprised of made ground/overburden. Weathered limestone from 2.0m - 18.5m,
becoming less weathered at depth. Palaeokarst in-filled with clays, silt, sand, and rounded gravels from
18.5m - 23m. Limestone bedrock from 23.0m - 26.5m, becoming fractured at depth. Palaeokarst in-filled
with clay and sand from 26.5m - 31m. End of borehole at 31m due to drill rods becoming stuck.
BH5 – Upper 3.0m comprised of made ground, with glacial till between 3m -10m. Palaeokarst in-filled
with clays, silts, and sands from 10m - 17m. End of borehole hole at 19.5m due to drill rods becoming
stuck.
For
insp
ectio
n pur
pose
s only
.
Conse
nt of
copy
right
owne
r req
uired
for a
ny ot
her u
se.
EPA Export 14-10-2017:03:27:43

BOLIDEN TARA MINES - STAGE 6 PALAEOKARST REPORT
September 2017 Report No. 1782163.R01.A0 6
4.0 GROUTING WORKS Following from an assessment of the borehole logs and the camera surveys, the boreholes were
decommissioned using gravity grouting techniques, proceeding from the bottom of the borehole to the top of
the borehole. Four of the boreholes were infilled with a bentonite / cement grout mix to between 4m and 7 m
below ground level and capped with a concrete plug while BH4 was infilled with the bentonite / cement grout
mix to ground level.
The grout design mix selected had a ratio by weight of 8:3:1 for water: sodium bentonite powder: cement,
respectively.
The supply water for the grout was filled into a tanker vehicle from a water tank used for the on-site truck wash.
The grout was mixed in a high shear colloidal mixer to fully wet all the cement and bentonite particles prior to
being pumped through the rods into the borehole. The percentage grout consumption ranged from 126% to
300% of the estimated extracted volume of the borehole by drilling. Additional grout consumption beyond
100% is attributed to minor voids created in the subsurface during the drilling of the boreholes. Table 2 provides
a summary of the grouting works undertaken.
Table 2: Tara Mines Stage 6 Grouting Works
Borehole ID
Borehole Diameter
(mm)
Borehole Total Depth
(m) when drilled
Depth to top
of Grout
(m)
Volume of Grout Placed
(m3)
Est. Volume of Borehole for
Grouting (m3)
(V = dπr2)
% Grout Consump
tion
Concrete Volume used for
Plug (m3)
BH1 100 23.5 7 0.35 0.14 150 0.5
BH2 100 40.3 3.9 0.62 0.274 126 0.4
BH3 100 33.5 5.7 0.52 0.223 133 0.5
BH4 100 31 0 0.79 0.204 287 0
BH5 100 19.5 5 0.44 0.11 300 2.5
5.0 CONCLUSIONS Five boreholes (BH1 to BH5) were drilled to depths of between 19.5m and 40.3 m centred over the interpreted
geophysical anomalies to test for the presence of possible palaeokarst features in the underlying bedrock.
The findings of the palaeokarst investigative drilling were in agreement with the results of the geophysical
survey, indicating that the anomalies interpreted comprised of infilled palaeokarst features.
The boreholes intersected between ca. 1.0m - 6.0 m of glacial till/overburden underlain by weathered limestone
and palaeokarst features infilled with sediments including clay/silt, sand, and rounded gravels (limestone and
calcareous sandstones). Three boreholes were terminated before reaching bedrock due to drill rods becoming
stuck. BH3 was terminated due to loss of air in stiff clays, and BH1 was terminated in limestone bedrock.
Following drilling works, the boreholes were decommissioned with a bentonite-cement grout and capped with
concrete.
The palaeokarst investigation did not identify any large voids beneath the footprint of the Stage 6 TMF Facility
that might pose a risk to the integrity of the Stage 6 TMF Facility.
For
insp
ectio
n pur
pose
s only
.
Conse
nt of
copy
right
owne
r req
uired
for a
ny ot
her u
se.
EPA Export 14-10-2017:03:27:43

BOLIDEN TARA MINES - STAGE 6 PALAEOKARST REPORT
September 2017 Report No. 1782163.R01.A0 7
6.0 REFERENCES
1) Golder Associates (May 2017). Boliden Tara Mines Limited: Stage 6 Footprint Geophysical Surveys,
1775908.R01.B0
2) Golder Associates (May 2017). Boliden Tara Mines Limited: Possible Borehole Locations – Pale Beds
– Stage 6 (‘Borrow Area’), 1775908.R02.B0
For
insp
ectio
n pur
pose
s only
.
Conse
nt of
copy
right
owne
r req
uired
for a
ny ot
her u
se.
EPA Export 14-10-2017:03:27:43

BOLIDEN TARA MINES - STAGE 6 PALAEOKARST REPORT
September 2017 Report No. 1782163.R01.A0
Report Signature Page
GOLDER ASSOCIATES IRELAND LIMITED
Brian Keenan Barry Balding
Geotechnical Engineer Senior Geologist
BK/BB/ar
Registered in Ireland Registration No. 297875
Town Centre House, Dublin Road, Naas, Co. Kildare, Ireland
Directors: S. Copping, A. Harris (British), DRV Jones
VAT No.: 8297875W
For
insp
ectio
n pur
pose
s only
.
Conse
nt of
copy
right
owne
r req
uired
for a
ny ot
her u
se.
EPA Export 14-10-2017:03:27:43

BOLIDEN TARA MINES - STAGE 6 PALAEOKARST REPORT
September 2017 Report No. 1782163.R01.A0
APPENDIX A Geotechnical Borehole Logs
For
insp
ectio
n pur
pose
s only
.
Conse
nt of
copy
right
owne
r req
uired
for a
ny ot
her u
se.
EPA Export 14-10-2017:03:27:43

"#$$
%#&$
&#%$
'"#$$
'(#%$')#$$
*"#$$+
*,#&$+
*,#)$+
*-#%$+
*"#%$+
*(#%$+
� � � � � � � � � � �
� � � � � � � � � � � �
� � � � � � � � � � � � � � � � � !� "#$%&''(� ) *+,� #-./0&0� '*1&2+-/&� 3&44'&2� � � � � � � � � � � �
) &$+,&#&0� � � � � � � � �
� � � � � � � � � � � � � � � � � !� "#$%&''(� � � � � � � � � � � � � � 2-1&� 5-44'&2
� � � � � � � � � � � � � � � � � !� 2$/02� $/0� "#$%&'2
� -13&+$/+� "#&(� � � � � � � � � � � � � � � � �
'%)'#$,
'%(&#,,
'%(%#%,
'%('#$,
'%%)#%,'%%)#$,
>JQF
>HSF6M
0FSKL VDKF
C
0FSKL
>MWCMQ9DRJOB� &3+, � *$� � 11
VDKFC0SK
� � � -8� � �
>FRK3FRNGK
0DKF
� -#*/"� � #-"#&22� $/0� 6 $+&# � � 42&#%$+*-/2 � ,*2&''*/" 6 $+&# � � 00&0
>MWCMQYMNCR
� � � � 9� � � � � -
*>LJUZAOFRR+
� � � � � � � � � � � �
� � � � � �� � � � � � � � ; � � � � � �
0FSKL
8FBFOP 01=93@;>@463FPNUFP8FEFG
2FMGM
BH
@ORK
CNQ
FOK\
7DUZXJGG
� -!� #0*/$+&2� � $#$� � */&� � #*0�=-4� � -
;CM^FUK
9MOKCDUKMC
� +$"&� � � !� � $#2+� 8&$+.#&2� � *+&� /%&2+*"$/+*-/
� � � � � � � !� � $#2+� � � � � � �
� ''� 0*1&/2*-/2� */� 1&+#&2� 5$'&� � ?� � � � � &#&++$� �
� &) � � -'*0&/� !� � $#$.JOFR
21613/831./3<=
=� � � # *''*/"
=LFFK
� /0� -8� 9-'&� $+� � � � � 1 � !5-13&+$/+� � � � � � � �
0DKF
� -""&0� � (
� � � �
9GJFOK .FKLMP\� '$/+� � 2&0
� � � @� � � � � � � � � � � � @� � � �
� #-./0� � &%&'� 1 � "#$
� � � � � � � � � � � � ..� � � � � � � � � � � � �� � � � � � �
��
��
���
���
���
��
���
����
� !
���
�"
���
���
#$
��"
���
$%&%
&$'
For
insp
ectio
n pur
pose
s only
.
Conse
nt of
copy
right
owne
r req
uired
for a
ny ot
her u
se.
EPA Export 14-10-2017:03:27:43

'%%$#%,
>JQF
>HSF6M
0FSKL VDKF
C
0FSKL
>MWCMQ9DRJOB� &3+, � *$� � 11
VDKFC0SK
� � � -8� � �
>FRK3FRNGK
0DKF
� -#*/"� � #-"#&22� $/0� 6 $+&# � � 42&#%$+*-/2 � ,*2&''*/" 6 $+&# � � 00&0
>MWCMQYMNCR
� � � � 9� � � � � -
*>LJUZAOFRR+
� � � � � � � � � � � �
� � � � � �� � � � � � � � ; � � � � � �
0FSKL
8FBFOP 01=93@;>@463FPNUFP8FEFG
2FMGM
BH
@ORK
CNQ
FOK\
7DUZXJGG
� -!� #0*/$+&2� � $#$� � */&� � #*0�=-4� � -
;CM^FUK
9MOKCDUKMC
� +$"&� � � !� � $#2+� 8&$+.#&2� � *+&� /%&2+*"$/+*-/
� � � � � � � !� � $#2+� � � � � � �
� ''� 0*1&/2*-/2� */� 1&+#&2� 5$'&� � ?� � � � � &#&++$� �
� &) � � -'*0&/� !� � $#$.JOFR
21613/831./3<=
=� � � # *''*/"
=LFFK
� /0� -8� 9-'&� $+� � � � � 1 � !5-13&+$/+� � � � � � � �
0DKF
� -""&0� � (9GJFOK .FKLMP\� '$/+� � 2&0
� � � @� � � � � � � � � � � � @� � � �
� #-./0� � &%&'� 1 � "#$
� � � � � � � � � � � � ..� � � � � � � � � � � � �� � � � � � �
��
��
���
���
���
��
���
����
� !
���
�"
���
���
#$
��"
���
$%&%
&$'
For
insp
ectio
n pur
pose
s only
.
Conse
nt of
copy
right
owne
r req
uired
for a
ny ot
her u
se.
EPA Export 14-10-2017:03:27:43
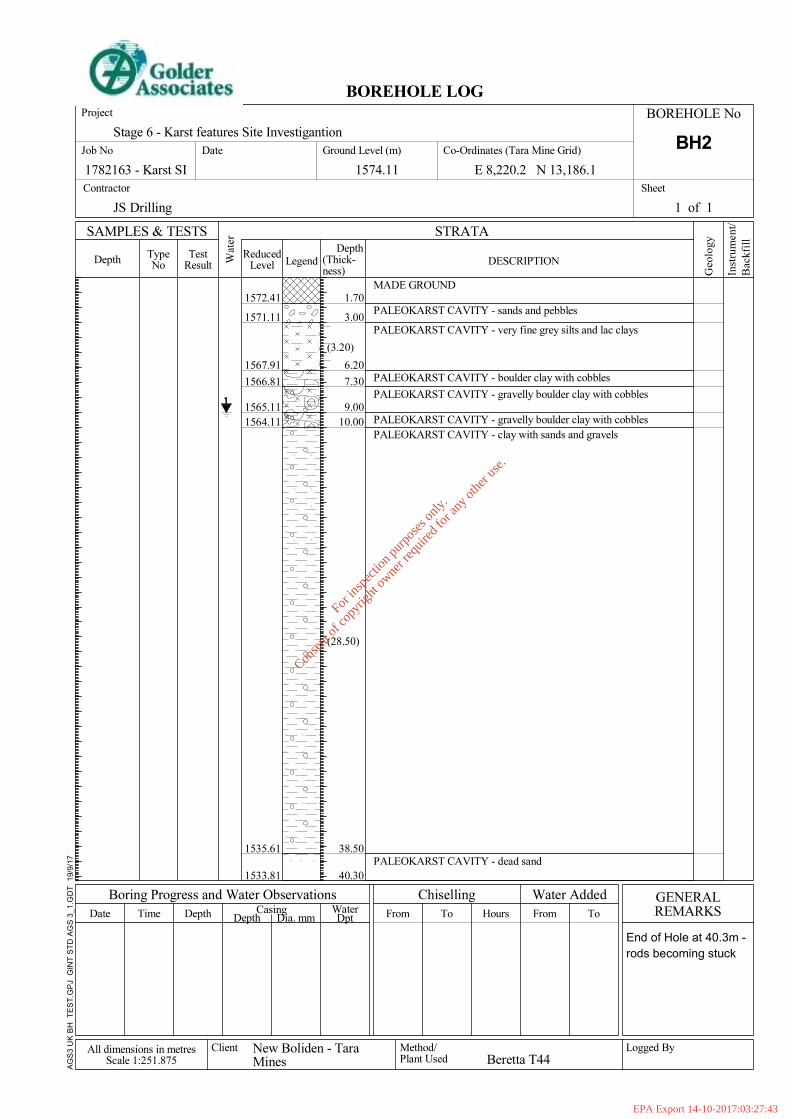
'#)$
"#$$
(#,$
)#"$
a#$$
'$#$$
"&#%$
-$#"$
*"#,$+
*,&#%$+
� � � � � � � � � � �
� � � � � � � � � � � � � � � � � !� 2$/02� $/0� 3&44'&2
� � � � � � � � � � � � � � � � � !� %&#(� 8*/&� "#&(� 2*'+2� $/0� '$5� 5'$(2
� � � � � � � � � � � � � � � � � !� 4-.'0&# � 5'$(� ) *+,� 5-44'&2
� � � � � � � � � � � � � � � � � !� "#$%&''(� 4-.'0&# � 5'$(� ) *+,� 5-44'&2
� � � � � � � � � � � � � � � � � !� "#$%&''(� 4-.'0&# � 5'$(� ) *+,� 5-44'&2
� � � � � � � � � � � � � � � � � !� 5'$(� ) *+,� 2$/02� $/0� "#$%&'2
� � � � � � � � � � � � � � � � � !� 0&$0� 2$/0
'%),#-'
'%)'#''
'%()#a'
'%((#&'
'%(%#''
'%(-#''
'%"%#('
'%""#&'
>JQF
>HSF6M
0FSKL VDKF
C
0FSKL
>MWCMQ9DRJOB� &3+, � *$� � 11
VDKFC0SK
� � � -8� � �
>FRK3FRNGK
0DKF
� -#*/"� � #-"#&22� $/0� 6 $+&# � � 42&#%$+*-/2 � ,*2&''*/" 6 $+&# � � 00&0
>MWCMQYMNCR
� � � � 9� � � � � -
*>LJUZAOFRR+
� � � � � � � � � � � �
� � � � � �� � � � � � � � ; � � � � � �
0FSKL
8FBFOP 01=93@;>@463FPNUFP8FEFG
2FMGM
BH
@ORK
CNQ
FOK\
7DUZXJGG
� -!� #0*/$+&2� � $#$� � */&� � #*0�=-4� � -
;CM^FUK
9MOKCDUKMC
� +$"&� � � !� � $#2+� 8&$+.#&2� � *+&� /%&2+*"$/+*-/
� � � � � � � !� � $#2+� � � � � � �
� ''� 0*1&/2*-/2� */� 1&+#&2� 5$'&� � ?� � � � � � � &#&++$� �
� &) � � -'*0&/� !� � $#$.JOFR
21613/831./3<=
=� � � # *''*/"
=LFFK
� /0� -8� 9-'&� $+� � � � 1 � !� #-023.''&0� 0.&� +-� 5-''$32*/"LMGF
0DKF
� -""&0� � (9GJFOK .FKLMP\� '$/+� � 2&0
� � � @� � � � � � � � � � � � @� � � � �
� #-./0� � &%&'� 1 � "#%
� � � � � � � � � � � � ..� � � � � � � � � � � � �� � � � � � �
��
��
���
���
���
��
���
����
� !
���
�"
���
���
#$
��"
���
$%&%
&$'
End of Hole at 40.3m -rods becoming stuck
For
insp
ectio
n pur
pose
s only
.
Conse
nt of
copy
right
owne
r req
uired
for a
ny ot
her u
se.
EPA Export 14-10-2017:03:27:43

'#$$
'"#$$
'-#,$
,'#$$
,"#'$
,(#,$
"'#)$",#,$
""#%$
*',#$$+
*(#&$+
*,#'$+
*"#'$+
*%#%$+
� -.'0&# � 4'$5:� � � � � � � � �
� � � � � � � � � � � � � � � � � !� 5'$(� ) *+,� 4-.'0
� � � � � � � � � � � � � � � � � !� "#$%&'@� ) *+,� '-+2� -8� ) $+&# � */8'-) � $bRGNCCHb+
� � � � � � � � � � � � � � � � � !� -#$/"(<4#-) /� 5'$(
� � � � � � � � � � � � � � � � � !� 2+*88� 5'$(
� � � � � � � � � � � � � � � � � !� 2+*88� 5'$(@� 1 */-# � 5'$2+2
� � � � � � � � � � � � � � � �
� � � � � � � � � � � � � � � � � !� %&#(� 2+*88� "#&(� 5'$(
� � � � � � � � � � � � � � � � � !� %&#(� 2+*88� "#&(� 5'$(
'%)$#")
'%%&#")
'%%)#')
'%%$#")
'%-&#,)
'%-%#')
'%"a#()'%"a#')
'%")#&)
>JQF
>HSF6M
0FSKL VDKF
C
0FSKL
>MWCMQ9DRJOB� &3+, � *$� � 11
VDKFC0SK
� � � -8� � �
>FRK3FRNGK
0DKF
� -#*/"� � #-"#&22� $/0� 6 $+&# � � 42&#%$+*-/2 � ,*2&''*/" 6 $+&# � � 00&0
>MWCMQYMNCR
� � � � 9� � � � � -
*>LJUZAOFRR+
� � � � � � � � � � � �
� � � � � �� � � � � � � � ; � � � � � �
0FSKL
8FBFOP 01=93@;>@463FPNUFP8FEFG
2FMGM
BH
@ORK
CNQ
FOK\
7DUZXJGG
� -!� #0*/$+&2� � $#$� � */&� � #*0�=-4� � -
;CM^FUK
9MOKCDUKMC
� +$"&� � � !� � $#2+� 8&$+.#&2� � *+&� /%&2+*"$/+*-/
� � � � � � � !� � $#2+� � � � � � �
� ''� 0*1&/2*-/2� */� 1&+#&2� 5$'&� � ?� � A � � � � &#&++$� �
� &) � � -'*0&/� !� � $#$.JOFR
21613/831./3<=
=� � � # *''*/"
=LFFK
� /0� -8� 9-'&� $+� � � � � 1 � !� #-023.''&0� 0.&� +-� '-22� -8� $*# �� &#(� 2+*88� 5'$(2
0DKF
� -""&0� � (9GJFOK .FKLMP\� '$/+� � 2&0
� � � @� A � � � � � � � � � @� � �
� #-./0� � &%&'� 1 � "#&
� � � � � � � � � � � � ..� � � � � � � � � � � � �� � � � � � �
��
��
���
���
���
��
���
����
� !
���
�"
���
���
#$
��"
���
$%&%
&$'
For
insp
ectio
n pur
pose
s only
.
Conse
nt of
copy
right
owne
r req
uired
for a
ny ot
her u
se.
EPA Export 14-10-2017:03:27:44

,#$$
%#"$
&#"$
''#)$
',#%$
'&#%$
,"#$$,"#%$
,%#%$
,(#%$
"'#$$
*,#$$+
*"#"$+
*"#$$+
*"#-$+
*(#$$+
*-#%$+
*,#$$+
*-#%$+
� � � � � � � � � � �
8#$5+.#&0� � � � � � � � � � ) *+,� 2*'+2
� � � � � � � � � !� %&#(� ,&$%*'(� ) &$+,&#&0� */� $#&$2
� 2� $4-%&@� 4.+� ,$#0&# � ) *+,� 0&3+,
� 2� $4-%&@� 4.+� ,$#0&# � ) *+,� 0&3+,
� 2� $4-%&@� 4.+� ,$#0&# � ) *+,� 0&3+,
� � � � � � � � � � � � � � � � � !� 5'$(2@� 2*'+2@� 2$/02� $/0� #-./0&0� "#$%&'2
%&#(� ,$#0� � � � � � � � �
%&#(� ,$#0� � � � � � � � �
2-8+� !� 4#-:&/� ,*",'(� 8#$5+.#&0� � � � � � � � �
� � � � � � � � � � � � � � � � � !� 5'$(� 8*''&0� ) *+,� 1 */-# � 2$/0
'%)$#%-
'%()#,-
'%(-#,-
'%($#&-
'%($#$-
'%%-#$-
'%-a#%-'%-a#$-
'%-)#$-
'%-(#$-
'%-'#%-
>JQF
>HSF6M
0FSKL VDKF
C
0FSKL
>MWCMQ9DRJOB� &3+, � *$� � 11
VDKFC0SK
� � � -8� � �
>FRK3FRNGK
0DKF
� -#*/"� � #-"#&22� $/0� 6 $+&# � � 42&#%$+*-/2 � ,*2&''*/" 6 $+&# � � 00&0
>MWCMQYMNCR
� � � � 9� � � � � -
*>LJUZAOFRR+
� � � � � � � � � � � �
� � � � � �� � � � � � � � ; � � � � � �
0FSKL
8FBFOP 01=93@;>@463FPNUFP8FEFG
2FMGM
BH
@ORK
CNQ
FOK\
7DUZXJGG
� -!� #0*/$+&2� � $#$� � */&� � #*0�=-4� � -
;CM^FUK
9MOKCDUKMC
� +$"&� � � !� � $#2+� 8&$+.#&2� � *+&� /%&2+*"$/+*-/
� � � � � � � !� � $#2+� � � � � � �
� ''� 0*1&/2*-/2� */� 1&+#&2� 5$'&� � ?� A � � � � &#&++$� �
� &) � � -'*0&/� !� � $#$.JOFR
21613/831./3<=
=� � � # *''*/"
=LFFK
� /0� -8� 9-'&� $+� � � 1 � !� #-023.''&0� 0.&� +-� 5-''$32*/"LMGF
0DKF
� -""&0� � (9GJFOK .FKLMP\� '$/+� � 2&0
� � � @� � � � � � � � � � � � @� � �
� #-./0� � &%&'� 1 � "#'
� � � � � � � � � � � � ..� � � � � � � � � � � � �� � � � � � �
��
��
���
���
���
��
���
����
� !
���
�"
���
���
#$
��"
���
$%&%
&$'
End of Hole at 31.0m -rods becoming stuck
For
insp
ectio
n pur
pose
s only
.
Conse
nt of
copy
right
owne
r req
uired
for a
ny ot
her u
se.
EPA Export 14-10-2017:03:27:44

"#$$
-#$$
)#$$
'$#$$
''#$$
'-#$$
')#$$
'a#%$
*"#$$+
*'#$$+
*"#$$+
*"#$$+
*'#$$+
*"#$$+
*"#$$+
*,#%$+
� � � � � � � � � � �
� � � � � � � � � � � �
� � � � � � � � � � � �
2*'+(� � � � � � � � � � � � �
� � � � � � � � � � � � � � � � � !� ) &+� 2*'+2
� � � � � � � � � � � � � � � � � !� 5'$(<2*'+2@� */5#&$2&� */� ) $+&#
� � � � � � � � � � � � � � � � � !� "#&(<4#-) /� 5-$#2&� 2$/0
� � � � � � � � � � � � � � � � � !� 2$/02� $/0� "#$%&'2
'%)$#((
'%(a#((
'%((#((
'%("#((
'%(,#((
'%%a#((
'%%(#((
'%%-#'(
>JQF
>HSF6M
0FSKL VDKF
C
0FSKL
>MWCMQ9DRJOB� &3+, � *$� � 11
VDKFC0SK
� � � -8� � �
>FRK3FRNGK
0DKF
� -#*/"� � #-"#&22� $/0� 6 $+&# � � 42&#%$+*-/2 � ,*2&''*/" 6 $+&# � � 00&0
>MWCMQYMNCR
� � � � 9� � � � � -
*>LJUZAOFRR+
� � � � � � � � � � � �
� � � � � �� � � � � � � � ; � � � � � �
0FSKL
8FBFOP 01=93@;>@463FPNUFP8FEFG
2FMGM
BH
@ORK
CNQ
FOK\
7DUZXJGG
� -!� #0*/$+&2� � $#$� � */&� � #*0�=-4� � -
;CM^FUK
9MOKCDUKMC
� +$"&� � � !� � $#2+� 8&$+.#&2� � *+&� /%&2+*"$/+*-/
� � � � � � � !� � $#2+� � � � � � � �
� ''� 0*1&/2*-/2� */� 1&+#&2� 5$'&� � ?� � � � � � � &#&++$� �
� &) � � -'*0&/� !� � $#$.JOFR
21613/831./3<=
=� � � # *''*/"
=LFFK
� /0� -8� 9-'&� $+� � A � � 1 � !� #-023.''&0� 0.&� +-� 5-''$32*/"LMGF
0DKF
� -""&0� � (9GJFOK .FKLMP\� '$/+� � 2&0
� � � @ � � � � � � � � � � � @� � � � �
� #-./0� � &%&'� 1 � "#(
� � � � � � � � � � � � ..� � � � � � � � � � � � �� � � � � � �
��
��
���
���
���
��
���
����
� !
���
�"
���
���
#$
��"
���
$%&%
&$'
End of Hole at 19.5m -rods becoming stuck
For
insp
ectio
n pur
pose
s only
.
Conse
nt of
copy
right
owne
r req
uired
for a
ny ot
her u
se.
EPA Export 14-10-2017:03:27:44
BOLIDEN TARA MINES - STAGE 6 PALAEOKARST REPORT
September 2017 Report No. 1782163.R01.A0
For
insp
ectio
n pur
pose
s only
.
Conse
nt of
copy
right
owne
r req
uired
for a
ny ot
her u
se.
EPA Export 14-10-2017:03:27:44

Golder Associates Ireland Limited Town Centre House Dublin Road Naas Co. Kildare Ireland T: +353 45 81 0200
Caption Text
For
insp
ectio
n pur
pose
s only
.
Conse
nt of
copy
right
owne
r req
uired
for a
ny ot
her u
se.
EPA Export 14-10-2017:03:27:44
IEL PO516-04 Review Application
Response to Further Information Request 12/09/2017
Appendix to FIR Item 2
Assessment of potential for acid generation in deposited tailings
For
insp
ectio
n pur
pose
s only
.
Conse
nt of
copy
right
owne
r req
uired
for a
ny ot
her u
se.
EPA Export 14-10-2017:03:27:44
IEL P0516-04 Review Application Appendix to FIR 12/09/2017 item 2 _________________________________________________________________________________________________________________________
An Assessment of Potential for acid generation in deposited Tailings at Randalstown
Physical Composition
The tailings comprise slurry containing approximately 10-15% solids. The solids are
composed of particles, with a significant percentage being less than 11 microns in size,
and 90% less than 44 microns.
Chemical Composition
The chemical composition of the tailings solids reflects a combination of the chemistry
of the host rock, the ore mineralogy and the metallurgical processes.
Chemical Reagents
A number of chemical reagents are added during mineral processing. Some of the
reagents are consumed or degraded in the process circuit. Small residual amounts may
enter the tailings stream and be deposited in the TMF, however they are present in low
concentrations and the organic component degrades rapidly.
Element Analysis
The primary economic minerals occurring within the orebody are galena and sphalerite.
Secondary minerals include pyrite, marcosite, baryte, and some sulphosalts. These
secondary minerals, together with residual amounts of galena and sphalerite, occur in
the tailings that remain after minerals processing. As mineralisation has occurred
within a Lower Carboniferous limestone host rock, the greater mass of tailings
comprises calcitic and dolomitic limestone.
Selective analyses of metals, metalloids, and non-metal components of the tailings are
routinely performed by an external accredited laboratory as part of Tara Mines IEL.
Results of the analyses for 2016 are presented in Table 1:
The analyses are undertaken monthly for zinc, lead, arsenic, iron copper, mercury,
cobalt, magnesium, sulphate and sulphide. Cyanide and pH are monitored weekly.
The tailings samples comprise significant concentrations of calcium and magnesium
representative of the calcitic and dolomitic limestones from which they are derived.
They also contain a few trace metals in concentrations which exceed 5 x crustal
abundance. These include zinc, lead, arsenic, mercury and copper. The near-neutral pH
indicates metal mobility will generally be low.
For
insp
ectio
n pur
pose
s only
.
Conse
nt of
copy
right
owne
r req
uired
for a
ny ot
her u
se.
EPA Export 14-10-2017:03:27:44

Table 1 Tailings Solid Chemistry 2016
Parameters pH Total Cyanide (mg/kg)
Weak Acid Dissociable Cn
Zinc (mg/kg)
Lead (mg/kg)
Arsenic (mg/kg)
Iron (mg/kg)
Tailings Solids
Average 7.9 <1.1 <3.4 2,410 1,690 531 21,173
Minimum 7.7 <1.1 <3.4 1,470 733 302 13,300
Maximum 8.3 <1.1 <3.4 3,130 2,590 832 30,300
Median 8.0 <1.1 <3.4 2,420 1.640 442 20,600
Parameters Copper (mg/kg)
Mercury (mg/kg)
Cobalt (mg/kg)
Calcium (mg/kg)
Magnesium (mg/kg)
Sulphate (mg/l)
Sulphide (mg/kg)
Tailings Solids
Average 75 <1.00 12.9 196,727 14,709 6,573 21,327
Minimum 37 <1.00 9.0 175,000 8,900 3,400 11,900
Maximum 126 <1.00 17.0 223,000 25,300 10,000 37,700
Median 71 <1.00 13.0 194,000 13,900 6,500 19,500
Host Rock Chemistry & Mineralogy
A samples mineralogical composition is a critical aspect in the prediction of its acid
generation, acid neutralisation, and metal leaching potential.
Tailings sample was submitted for XRD analyses in August 2015 to determine its
mineralogical composition. The sample was found to contain the following:
Major abundance: Calcite (49.4%)
Moderate abundance: Quartz (16.2%), Dolomite (11.5%)
Minor abundance: Mica (8.3%), Barite (5.2%), K-feldspar (3.8%), Pyrite (2.7%), Albite (2.4%)
Trace abundance: Galena (<0.5%), Sphalerite (<0.5%)
The sulphur concentration likely to result from metal sulphides and sulphates within
the tailings, particularly barite (BaSO4) and pyrite (FeS2), together with residual
amounts of sphalerite (ZnS) and galena (PbS).
Acid-Base Accounting (ABA) and Acid Generation Potential
The generation of acidic conditions within deposited tailings or waste rock is generally
encountered when pyrite is exposed to atmospheric oxygen and water. Pyrite oxidation
is a complex, stepwise process, one end product of which is sulphuric acid. The
associated reduction in pH of the waste mobilises metals as soluble salts which, with
sulphuric acid, may cause severe environmental impacts if allowed to drain or run off
from a tailings facility, in an uncontrolled manner. Acid rock drainage (ARD) can
For
insp
ectio
n pur
pose
s only
.
Conse
nt of
copy
right
owne
r req
uired
for a
ny ot
her u
se.
EPA Export 14-10-2017:03:27:44

significantly compromise ground and surface water quality, and surface reclamation
success, even if neutralisation reactions have occurred before discharge.
The results of ABA testing on tailings samples in 2016 are presented in Table 2.
Although tailings at Tara Mines contain both pyrite and trace amounts of its more
reactive polymorph, marcasite, the geochemical and physical characteristics of the
tailings mitigate against the formation of ARD.
At the Randalstown facility, oxidation of pyrite within the tailings is suppressed as a
consequence of the fine texture and saturated condition of the tailings, both of which
will restrict oxygen diffusion below the surface. Furthermore, the Carboniferous
Limestone matrix of the tailings offers significant and excess neutralisation capacity
should any pyrite oxidise to produce acid-sulphate tailings water.
Although no single standard exists for interpretation of ARD potential using ABA
results, the MEND (2009) guidance report presents screening criteria for ARD potential
that have gained widespread acceptance. These criteria indicate that where an NPR > 2,
the material is expected to be non-acid generating.
Using 2016 data the median NPR is ~9.0 and is well in excess of 2; therefore the tailings
are expected to be non-acid generating.
Furthermore, criteria based on the NNP is summarised in the GARD Guide (INAP, 2012). Material with an NNP >20kg CaCO3/t is expected to be non-acid generating.
Using 2016 data the median tailings NNP is 526 kg CaCO3/t and therefore classified as
non-acid generating in terms of this criteria.
At present, there is no visible evidence of acid seepage from the Randalstown facility, or
ponding of acidic water on the surface of the dam. Under conditions of net acid
generation potential, ARD is usually detected as a yellow to ochre-red drainage,
containing oxy-hydroxides of metals, particularly of iron, aluminium, and manganese.
The absence of such drainage, and a tailings water median pH of 8.3, suggests that ARD
is not being generated in the Randalstown tailings facility.
Based on the previous work and the ongoing monitoring it is concluded that Tara Mine’s
tailings at Randalstown have a high net neutralisation potential:
Significant reductions in tailings pH or alkalinity are not expected to occur over
time
Acid mine drainage from the Randalstown tailings facility is not expected to be a
significant environmental issue
The results indicated a considerable buffering capacity of the tailings to neutralise any
acid generation.
For
insp
ectio
n pur
pose
s only
.
Conse
nt of
copy
right
owne
r req
uired
for a
ny ot
her u
se.
EPA Export 14-10-2017:03:27:44

IEL P0516-04 Review Application Appendix to FIR 12/09/2017 item 2 _________________________________________________________________________________________________________________________
Table 2 2016 ABA testing on tailings samples
Acid Potential
(AP)
Neutralisation Potential (NP)
Neutralisation Potential
Ratio (NPR)
Net Neutralisation
Potential (NNP)
Total C Total
Sulphur Sulphate Sulphur
Sulphide Sulpher
(Calc)
C organic
C inorganic
kgCaCO3/t ore
kgCaCO3/t ore
unity kgCaCO3/t
ore % % % % % %
Jan-16 66 560 8.45 494 6.88 2.84 0.72 2.12 0.16 6.72
Feb-16 76 571 7.49 495 6.91 3.24 0.80 2.44 0.17 6.74
Mar-16 50 604 12.09 554 7.69 2.29 0.69 1.60 0.20 7.49
Apr-16 72 586 8.15 514 7.46 3.00 0.70 2.30 0.15 7.31
May-16 66 613 9.29 547 7.97 2.79 0.68 2.11 0.13 7.84
Jun-16 81 615 7.56 533 7.98 3.30 0.70 2.60 0.14 7.84
Jul-16 47 603 12.96 557 7.66 2.26 0.77 1.49 0.22 7.44
Aug-16 70 553 7.89 483 7.41 3.14 0.90 2.24 0.14 7.27
Sep-16 70 602 8.60 533 7.69 2.88 0.65 2.23 0.13 7.56
Oct-16 63 603 9.60 540 7.49 2.65 0.65 2.00 0.15 7.34
Nov-16 73 594 8.16 521 7.43 3.08 0.75 2.33 0.1 7.33
Dec-16 78 615 7.91 537 8.20 3.16 0.67 2.49 0.1 8.10
Average 67.59 593.25 9.01 525.67 7.56 2.89 0.72 2.16 0.15 7.42
For
insp
ectio
n pur
pose
s only
.
Conse
nt of
copy
right
owne
r req
uired
for a
ny ot
her u
se.
EPA Export 14-10-2017:03:27:44
IEL PO516-04 Review Application
Response to Further Information Request 12/09/2017
Appendix to FIR Item 6 • Results of short term stability analysis
• Design for the Stage 6 Tailings Management Facility (Golder Associates)
For
insp
ectio
n pur
pose
s only
.
Conse
nt of
copy
right
owne
r req
uired
for a
ny ot
her u
se.
EPA Export 14-10-2017:03:27:44

March 2016
BOLIDEN TARA MINES
Design for the Stage 6 Tailings Management Facility
RE
PO
RT
Report Number. 1532091.502/A.1
Distribution:
Boliden Tara Mines Ltd - 1 copy (pdf)
Golder Associates (UK) Ltd - 1 copy
Golder Associates Ireland Ltd - 1 copy
Submitted to:
Boliden Tara Mines Ltd
Knocknumber
Navan
Meath
Ireland
For
insp
ectio
n pur
pose
s only
.
Conse
nt of
copy
right
owne
r req
uired
for a
ny ot
her u
se.
EPA Export 14-10-2017:03:27:44

STAGE 6 TAILINGS MANAGEMENT FACILITY
March 2016
Report No. 1532091.503/B.0 i
Table of Contents
1.0 INTRODUCTION ...................................................................................................... 5
2.0 GEOLOGY ............................................................................................................... 6
2.1 Regional Geology ....................................................................................... 6
2.2 Quaternary Deposits ................................................................................... 7
2.3 Structure ..................................................................................................... 7
2.4 Karstification ............................................................................................... 7
3.0 SITE CONDITIONS .................................................................................................. 8
3.1 General ....................................................................................................... 8
3.2 Bedrock ...................................................................................................... 8
3.3 Glacial Till ................................................................................................... 9
3.4 Site Work and Borrow Materials ................................................................. 9
3.4.1 Geophysics ........................................................................................... 9
3.4.2 Trial Pitting Northern and Seven Fields Borrow Area .......................... 10
3.5 Summary of Borrow Material .................................................................... 11
4.0 HYDROLOGY AND GROUNDWATER ................................................................. 12
4.1 Hydrology ................................................................................................. 12
4.2 Groundwater ............................................................................................. 12
5.0 SEISMICITY ........................................................................................................... 13
5.1 Seismic Hazard ......................................................................................... 13
5.2 Seismic Vulnerability ................................................................................. 13
6.0 DESIGN ................................................................................................................. 14
6.1 General ..................................................................................................... 14
6.2 Dam Sections ........................................................................................... 14
6.3 Fill material ............................................................................................... 16
6.3.1 General ............................................................................................... 16
6.3.2 Type A Materials ................................................................................. 16
6.3.2.1 Type A1 ........................................................................................... 16
6.3.2.2 Type A2 Material.............................................................................. 16
6.3.2.3 Type A3 Material.............................................................................. 16
6.3.3 Granular Rock Material ....................................................................... 17
For
insp
ectio
n pur
pose
s only
.
Conse
nt of
copy
right
owne
r req
uired
for a
ny ot
her u
se.
EPA Export 14-10-2017:03:27:44

STAGE 6 TAILINGS MANAGEMENT FACILITY
March 2016
Report No. 1532091.503/B.0 ii
6.3.3.1 General ............................................................................................ 17
6.3.3.2 Type B Road Surface Material ......................................................... 17
6.3.3.3 Type C Protection Material .............................................................. 17
6.3.3.4 Type D1 Backfilling Existing Borrow Area Drains ............................ 18
6.3.3.5 Type D2 Dam Footprint Drainage Blanket Material ......................... 18
6.3.3.6 Type E Coarse Drainage Material.................................................... 18
6.4 Fill Material Quantities .............................................................................. 18
6.5 Site Preparation ........................................................................................ 19
6.6 Composite Lining ...................................................................................... 20
6.6.1 High Density Polyethylene (HDPE) ..................................................... 20
6.6.2 Geosynthetic Clay Liner (GCL) ........................................................... 21
6.7 Geotextile ................................................................................................. 22
6.7.1 General ............................................................................................... 22
6.7.2 500 g/m2 and 1000 g/m2 Non-Woven Geotextile ................................. 22
6.7.3 Terram 1000 ....................................................................................... 22
6.8 Geofabric Material Quantities ................................................................... 22
6.9 Anchor Trench .......................................................................................... 23
6.10 Permanent Surcharge ............................................................................... 23
6.11 Leak Detection .......................................................................................... 23
6.12 Seepage ................................................................................................... 23
6.13 Perimeter Interceptor Channel .................................................................. 24
6.14 Embankment Stability Modelling ............................................................... 25
6.14.1 Model Geometry.................................................................................. 25
6.14.2 Geotechnical Parameters .................................................................... 25
6.14.3 Stability Modelling ............................................................................... 26
6.14.4 Results of Stability Modelling .............................................................. 26
6.15 Spillway .................................................................................................... 28
7.0 OPERATIONS ....................................................................................................... 29
7.1 General ..................................................................................................... 29
7.2 Piezometer and Groundwater Monitoring ................................................. 30
7.3 Settlement Monitoring Points .................................................................... 30
8.0 CONSTRUCTION .................................................................................................. 30
8.1 General ..................................................................................................... 30
For
insp
ectio
n pur
pose
s only
.
Conse
nt of
copy
right
owne
r req
uired
for a
ny ot
her u
se.
EPA Export 14-10-2017:03:27:44

STAGE 6 TAILINGS MANAGEMENT FACILITY
March 2016
Report No. 1532091.503/B.0 iii
8.2 Phase 1 Construction ............................................................................... 31
8.3 Phase 2 Construction ............................................................................... 31
9.0 CLOSURE .............................................................................................................. 32
10.0 REFERENCES ....................................................................................................... 32
TABLES Table 1: Estimated Volumes from the Geophysical Surveys Above 1572 m AMSL. ......... 9
Table 2: Estimated Overburden Volumes from the Trial Pitting....................................... 10
Table 3: Estimated Available Borrow Materials ............................................................... 12
Table 4: Struck Storage and Construction Volumes at given Crest Elvs. ........................ 14
Table 5: Type B Grading Envelope ................................................................................. 17
Table 6: Type C Material ................................................................................................. 17
Table 7: Type D1 Grading Envelope ............................................................................... 18
Table 8: Material Quantities ............................................................................................ 18
Table 9: HDPE Properties ............................................................................................... 20
Table 10: GCL Properties ................................................................................................ 21
Table 11: Non-Woven Geotextile Properties ................................................................... 22
Table 12: Material Quantities .......................................................................................... 22
Table 13: Geotechnical Parameters for Stability Analysis ............................................... 25
Table 14: Stability Modelling Results .............................................................................. 26
Table 15: Average Production Values For Construction of Stage 6 ................................ 30
FIGURES Figure 1: Aerial Photograph of the Northern and Seven Fields Borrow Area .................... 6
Figure 2: Western and eastern cells within the Stage 6 basin area. ................................ 10
Figure 3: Location of Trial Pits in the Northern and Seven Fields borrow area ............... 11
Figure 4: Typical Dam Section ........................................................................................ 14
Figure 5: Possible Palaeokarstic Features (Ref.3.5) ....................................................... 20
Figure 6: Probability of Seepage from Composite Lining System ................................... 24
APPENDICES APPENDIX A Drawings
APPENDIX B Trial Pit Logs
APPENDIX C Aerial Photograph
For
insp
ectio
n pur
pose
s only
.
Conse
nt of
copy
right
owne
r req
uired
for a
ny ot
her u
se.
EPA Export 14-10-2017:03:27:44
STAGE 6 TAILINGS MANAGEMENT FACILITY
March 2016
Report No. 1532091.503/B.0 iv
For
insp
ectio
n pur
pose
s only
.
Conse
nt of
copy
right
owne
r req
uired
for a
ny ot
her u
se.
EPA Export 14-10-2017:03:27:44
STAGE 6 TAILINGS MANAGEMENT FACILITY
March 2016
Report No. 1532091.503/B.0
1.0 INTRODUCTION This report presents the design of the proposed Stage 6 tailings management facility (TMF) at Boliden Tara Mines Ltd (Tara). Stage 6 is required to supplement the diminishing storage capacity of the main TMF and will allow for progressive closure of the existing Stage 5A and 5B facilities.
Tara Mines is Europe's largest zinc and lead mine located near the town of Navan in Co. Meath. The main orebody is hosted in Lower Carboniferous limestone and the process produces large quantities of tailings and approximately 1.15 Mt of tailings, which represents 60% of the total, were discharged into Stage 5A in 2015 whilst the remaining tailings were placed underground as backfill. Historically, approximately 48% to 52% of the mine tailings are discharged into the tailings facilities. For future estimates, the tailings discharge rate has been taken as 1.1Mt/y.
The existing facilities have been built in five key stages during the period between 1974 and present. Drawings 1.1 and 1.2 show the site location and Drawing 1.3 shows the layout plan for the existing tailings facilities, Stages 5A and 5B and the proposed Stage 6 location. All drawings are presented in Appendix A. Stages I and II were constructed to an elevation of 57.29 m AOD (Above Mine Datum) filled and the tailings surface temporarily re-vegetated in 1988 (Drawing 1.4). Stage III was constructed between 1985 and 1987 to an elevation of 57.29 m AOD and was filled in March 2003. Construction of Stage 4A, a raised facility over the existing tailings in Stages I and II to an elevation of 63.29 m AOD, began in late summer of 1998 and was completed in July 2000. The Stage 4A tailings facility was filled by the end of 2006. The construction of Stage 4B to an elevation of 63.29 m AOD, which is founded on the Stage III tailings, commenced in the summer of 2003 and the dam walls were completed in 2006. Stage 4B has been filled. Construction of Stage 5A above Stage 4A to an elevation of 67.29 m AOD has been completed and tailings deposition into 5A commenced in July 2013. To date the total capacity of the tailings facilities, Stages I, II, III, 4A, 4B and 5A is approximately 40.3 Mt and based on an average dry density of 1.42 t/m3 equates to a volume of 28.4 Mm3.
Tara Mines had completed the construction of Stage 5B in October 2015 which was constructed on the tailings of Stage 4B to a crest elevation of 67.29 m AOD. Stage 5B will provide additional tailings storage of 4.6 Mt (3.2 Mm3).
An option study (Ref 1.1) and conceptual designs for Stage 6 were presented to Tara (Reference 1.2) in 2015. The decision by Tara was to adopt a new facility located along the northern sector of the existing facilities (Drawing 1.3) and confined within the northern and seven fields borrow areas (Drawing 1.4). These borrow areas have been extensively used for the construction of Stages 4B, 5A and 5B. Approximately 1.2 Mm3 of material has been removed from the borrow area including some 300,000 m3 of weathered rock.
The partially excavated borrow areas are shown in Figure 1 which is an aerial photograph of the borrow sites.
The northern boundary of the TMF footprint was restricted to a distance of at least 100 m from the public road.
The Stage 6 facility provides a potential struck storage volume of approximately 9.6 Mm3 or 13.6 Mt at a crest elevation of 67.29 m AOD.
For
insp
ectio
n pur
pose
s only
.
Conse
nt of
copy
right
owne
r req
uired
for a
ny ot
her u
se.
EPA Export 14-10-2017:03:27:44
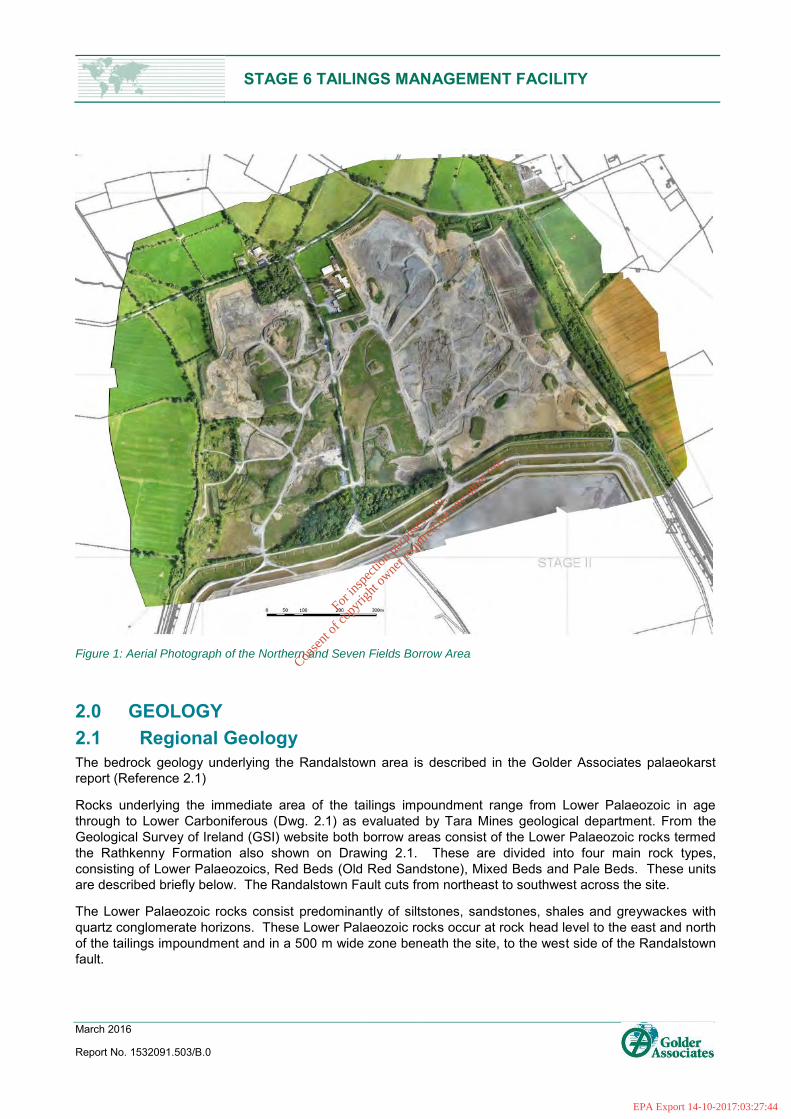
STAGE 6 TAILINGS MANAGEMENT FACILITY
March 2016
Report No. 1532091.503/B.0
Figure 1: Aerial Photograph of the Northern and Seven Fields Borrow Area
2.0 GEOLOGY 2.1 Regional Geology The bedrock geology underlying the Randalstown area is described in the Golder Associates palaeokarst report (Reference 2.1)
Rocks underlying the immediate area of the tailings impoundment range from Lower Palaeozoic in age through to Lower Carboniferous (Dwg. 2.1) as evaluated by Tara Mines geological department. From the Geological Survey of Ireland (GSI) website both borrow areas consist of the Lower Palaeozoic rocks termed the Rathkenny Formation also shown on Drawing 2.1. These are divided into four main rock types, consisting of Lower Palaeozoics, Red Beds (Old Red Sandstone), Mixed Beds and Pale Beds. These units are described briefly below. The Randalstown Fault cuts from northeast to southwest across the site.
The Lower Palaeozoic rocks consist predominantly of siltstones, sandstones, shales and greywackes with quartz conglomerate horizons. These Lower Palaeozoic rocks occur at rock head level to the east and north of the tailings impoundment and in a 500 m wide zone beneath the site, to the west side of the Randalstown fault.
For
insp
ectio
n pur
pose
s only
.
Conse
nt of
copy
right
owne
r req
uired
for a
ny ot
her u
se.
EPA Export 14-10-2017:03:27:44
STAGE 6 TAILINGS MANAGEMENT FACILITY
March 2016
Report No. 1532091.503/B.0
The Red Beds, which are Lower Carboniferous in age, consist of dark red interbedded conglomerates and sandstones and unconformably overly the Lower Palaeozoic. The Red Beds are assumed to be thin in this area. Exploration boreholes drilled in this area encountered between 0 m to 12 m of Red Beds.
The Mixed Beds is a collective term for two units, which are the Laminated Beds and the Muddy Limestone and also termed the Liscarton Formation. The Laminated Beds consist of dark laminated siltstones, mudstones and shales with local sandstones and calcarenites. The thickness of the laminated beds beneath the basin area of the tailings facility, range from 0 m to 40 m. The overlying Muddy Limestone consists of dark, well bedded, argillaceous and crinoidal limestones with local coarser, bioclastic strata which are microconglomeratic in nature. The thickness of this unit in the tailings area ranges from 0 m to 10 m.
The Pale Beds or the Meath Formation comprise a variety of pelletal, oolitic and bioclastic calcarenites which locally contain quartz sand and darker argillaceous layers. They are a dominantly massive group and are characterised by their low shale content. The base of the Pale Beds is defined by a pale micritic limestone known as the Micrite Unit, which varies greatly in thickness. The Pale Beds vary from 0 m to 140 m thick across the Randalstown area.
The Pale Beds have distinctive marker horizons within them, such as nodular shaley units and silty horizons. Extensive fracturing and leaching of this horizon is common (Reference 2.1) but cavity formation is almost wholly restricted to those sections of the Pale Beds which do not have a cover of the Upper Dark Limestone (UDL). The UDL is a more argillaceous unit compared to the Pale Beds, and as such is less prone to the chemical action of the groundwater. In the tailings area the Pale Beds are not covered by the UDL.
2.2 Quaternary Deposits The whole region was glaciated by ice sheets, in excess of 800 m thick, which covered Ireland during the Munsterian and Midlandian stages, approximately 15,000 years ago (Ref. 2.2 and 2.3). These left behind Quaternary overburden deposits in the area of the tailings impoundment consisting of three main soil types. The basal unit is a Quaternary glacial till consisting of consolidated lower grey silty clay to clayey silt with sand, gravel and some cobbles and boulders. This is directly overlain by the upper brown weathered glacial till also consisting of silty clay to clayey silt with sand, gravel with some cobbles and boulders. This is essentially a weathering of the underlying grey material and as such tends to have a higher clay content. Overlying some areas of the glacial till are lenses of possibly alluvial or out-wash granular materials comprising silt, sand and gravel.
The general thickness of overburden deposits recorded at Randalstown varies from about 1 m to 8 m and follows the somewhat random profile of the bedrock surface.
2.3 Structure The major Randalstown Fault, running diagonally across the main tailings site area, trends in a northeast to southwest direction and brings the Pale Beds directly into contact with the Lower Palaeozoic rocks (Drawing 2.1 and Ref. 2.1). This is a reverse fault which dips to the northwest at a steep 75° angle in the tailings area. It is possible that associated with this structure is a zone of strong and extensive shearing, fracturing and subsequent calcite vein infilling.
Several minor faults are reported to exist beneath the tailings dam, notably along the Carboniferous/Lower Palaeozoic contact at the northern end of Stage II (Ref. 2.1).
The limestones within the tailings pond are believed to be draped about the northwest flank of a complex southwest plunging anticline of Lower Palaeozoic rocks.
2.4 Karstification In carbonate rocks, the secondary permeability, where water moves through fissures, fractures, joints or along bedding planes, may be increased by solution during ground water movement. This process is termed karstification, and leaves interconnected cavities in the ground, and creates distinctive topographical features
For
insp
ectio
n pur
pose
s only
.
Conse
nt of
copy
right
owne
r req
uired
for a
ny ot
her u
se.
EPA Export 14-10-2017:03:27:44
STAGE 6 TAILINGS MANAGEMENT FACILITY
March 2016
Report No. 1532091.503/B.0
(Reference 2.4). During the formation of some karst features, the development of a solution cavity in the underlying limestone may induce the overlying overburden material to migrate or slump into the cavity. This could result in the formation of a sinkhole, also termed doline, at the ground surface. The concerns of this risk relate to the foundation failures that may be induced by karstification, associated with the development of sinkholes.
Karstic features may be considered as either ‘active’, i.e. forming at the present time, or may have formed in the past and are now inactive, termed ‘palaeokarst’. For karstification to be active at the site, there must be groundwater movement. A palaeokarst system is one in which the conditions which promote karstification are no longer present.
Palaeokarsts are present in the Randalstown area and investigations were previously carried out on this subject for the Stage 4 dam raise project (Reference 2.5). The outcome of these investigations indicated that the karsts at the tailings area comprises an immature palaeokarst system. It was termed an immature system because the individual cavities are small and are unlikely to be interconnected. It was considered as a palaeokarst due to the pre-glacial infill materials, such as sand, rock fragments and clay material, and also because the thickness of the overburden deposits indicate that there has been no active karstification in the Randalstown area within the past 15,000 years.
For Stage 6, some initial geophysics was undertaken to investigate the potential for excavating the rock within the basin of the facility which indicated some anomalies. We would propose undertaking a resistivity survey over the entire footprint and a microgravity survey over any anomalies found where the Pale Beds underly the site. Micro gravity is the best technique to determine any areas of mass deficiency representing palaeokarstic features. These types of survey were undertaken at Galmoy and Lisheen with considerable success.
3.0 SITE CONDITIONS 3.1 General The footprint of the Stage 6 facility is confined to the existing northern and seven fields borrow areas. Virtually all the area is exposed indicating rock or glacial till over the site. It is anticipated that rock which can be excavated by a tracked excavator, ripped or removed by pneumatic hammer (breakable) will be used in construction of the dam walls and drainage. The foundation of the dam walls will either be glacial till or bedrock.
Some locations within the northern borrow area have been restored using topsoil or ameliorated soil and these materials will be removed and stockpiled within the mine boundary and outside the footprint of the facility for capping of Stage 5A. Topsoil stockpiles are also present mainly around the perimeter of the borrow area and they will remain in place if outside the Stage 6 footprint. Any topsoil stockpiles within the basin area will be removed to outside the dam or used for capping of Stage 5A.
A number of site investigations have been undertaken to evaluate the extent and suitability of the glacial till for construction of Stage 5B (References 3.1 and 3.2) in the northern and seven fields borrow areas and for the Simonstown borrow area (Reference 3.3) used in the construction of Stage 4. The depth and relative strength condition of the underlying bedrock (References 3.4 and 3.5) was also investigated by geophysics in the northern and seven fields borrow area together with a limited amount in the Simonstown borrow area.
3.2 Bedrock The bedrock underlying the proposed Stage 6 footprint are the Pale Beds or Lower Palaeozoic rocks (Drawing. 2.1). Much of the area exposed in the north east sector of the Northern borrow area and the Seven Fields borrow area are Lower Palaeozoic rocks which are generally non calcareous with Pale Beds in the south west sector of the Northern borrow area which are calcareous.
Some removal of the weathered rock material has been undertaken during the construction of Stage 5B to a depth of at least 2 m below rock head level. The strength of the exposed rock is variable and dependent on
For
insp
ectio
n pur
pose
s only
.
Conse
nt of
copy
right
owne
r req
uired
for a
ny ot
her u
se.
EPA Export 14-10-2017:03:27:44

STAGE 6 TAILINGS MANAGEMENT FACILITY
March 2016
Report No. 1532091.503/B.0
the degree of weathering and structure. Where the rock has been removed by pneumatic hammer, the material is moderately strong to strong and would be suitable for the drainage protection materials.
3.3 Glacial Till Above the bedrock is a thin layer of glacial till generally varying in thickness from 0.5 m to 5.0 m and is typically grey clayey silty sands and gravels with boulders and gravelly sandy clayey silts with boulders which is termed Type A2 material and weathered brown clayey silty sands and gravels with occasional boulders which is termed Type A1 material. As the grey till approaches the underlying bedrock surface the boulder content increases considerably to over 50% of the material.
Occasionally, there are bands and lenses of silty fine sand/fine sandy silt (Lacustrine Deposits) or sands and gravels within and above the glacial till and these materials are referred to as Type A3 material.
3.4 Site Work and Borrow Materials 3.4.1 Geophysics A recent geophysical survey was undertaken in the basin area of Stage 6 consisting of electromagnetic conductivity, seismic refraction and electrical resistivity imaging. The surveys were undertaken to;
Evaluate the nature and extent of overburden across the basin area for use as material for construction;
Evaluate the nature and extent of ‘rippable-breakable’ rock for use as material for construction; and
Evaluate the potential quantities of overburden and viable rippable–breakable rock available within the proposed footprint of the ‘basin’ area to be used in construction of the new facility.
The electromagnetic conductivity (EM31) survey is used to assist in the delineation of variations in the thickness of overburden. The seismic refraction survey is used to investigate areas of overburden and potential rippable-breakable rock. The electrical resistivity imaging (ERI) survey is used to map and delineate changes in material type and to determine overburden and rock-fill properties. The results are discussed in Reference 3.5 and the estimated volumes are given below.
Table 1: Estimated Volumes from the Geophysical Surveys Above 1572 m AMSL.
Western Cell Estimated Volume (m3) % Adjustment Adjusted Volume
(m3) Estimated Excavatability
Overburden 170,000 30 119,000 Diggable
Weathered Bedrock 44,000 25 33,000 Rippable
Bedrock 3,500 25 2,600 Breaking
Total 217,500
154,600 -
Eastern Cell Estimated Volume (m3) % Adjustment Adjusted Volume
(m3) Estimated Excavatability
Overburden 365,000 30 255,500 Diggable
Weathered Bedrock 260,000 25 195,000 Rippable
Bedrock 59,000 25 44,200 Breaking
Total 684,000
494,700 -
For
insp
ectio
n pur
pose
s only
.
Conse
nt of
copy
right
owne
r req
uired
for a
ny ot
her u
se.
EPA Export 14-10-2017:03:27:44
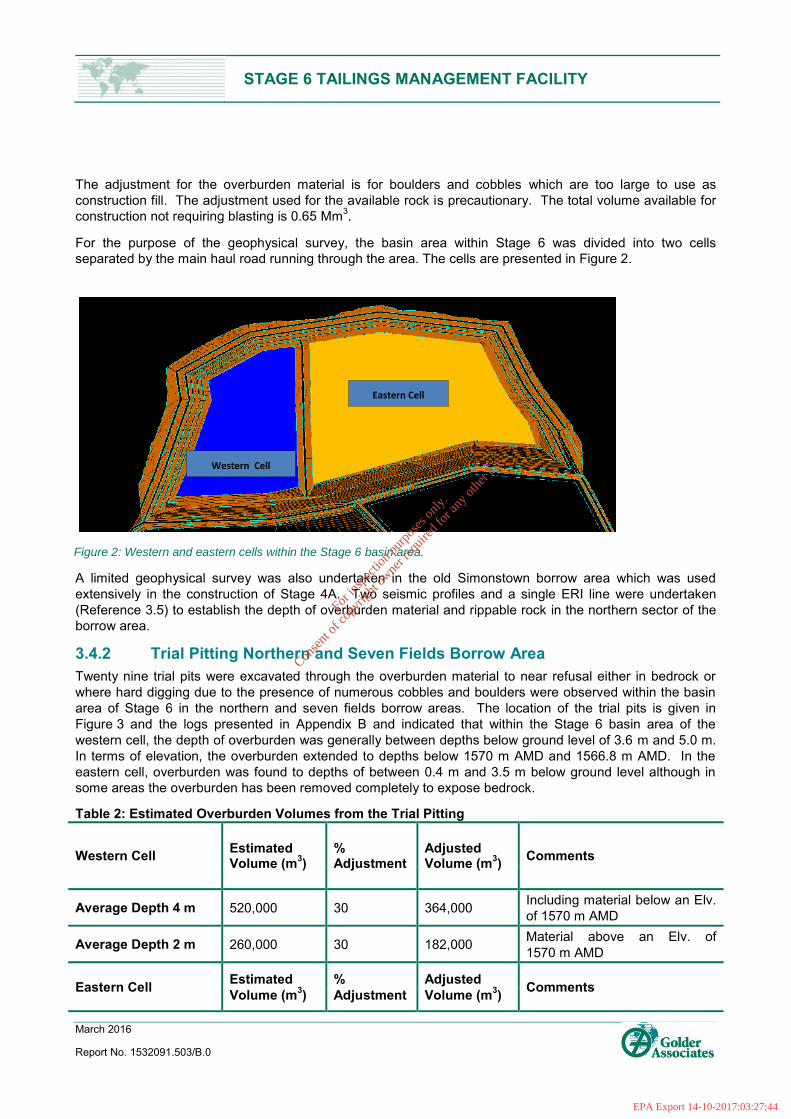
STAGE 6 TAILINGS MANAGEMENT FACILITY
March 2016
Report No. 1532091.503/B.0
The adjustment for the overburden material is for boulders and cobbles which are too large to use as construction fill. The adjustment used for the available rock is precautionary. The total volume available for construction not requiring blasting is 0.65 Mm3.
For the purpose of the geophysical survey, the basin area within Stage 6 was divided into two cells separated by the main haul road running through the area. The cells are presented in Figure 2.
A limited geophysical survey was also undertaken in the old Simonstown borrow area which was used extensively in the construction of Stage 4A. Two seismic profiles and a single ERI line were undertaken (Reference 3.5) to establish the depth of overburden material and rippable rock in the northern sector of the borrow area.
3.4.2 Trial Pitting Northern and Seven Fields Borrow Area Twenty nine trial pits were excavated through the overburden material to near refusal either in bedrock or where hard digging due to the presence of numerous cobbles and boulders were observed within the basin area of Stage 6 in the northern and seven fields borrow areas. The location of the trial pits is given in Figure 3 and the logs presented in Appendix B and indicated that within the Stage 6 basin area of the western cell, the depth of overburden was generally between depths below ground level of 3.6 m and 5.0 m. In terms of elevation, the overburden extended to depths below 1570 m AMD and 1566.8 m AMD. In the eastern cell, overburden was found to depths of between 0.4 m and 3.5 m below ground level although in some areas the overburden has been removed completely to expose bedrock.
Table 2: Estimated Overburden Volumes from the Trial Pitting
Western Cell Estimated Volume (m3)
% Adjustment
Adjusted Volume (m3) Comments
Average Depth 4 m 520,000 30 364,000 Including material below an Elv. of 1570 m AMD
Average Depth 2 m 260,000 30 182,000 Material above an Elv. of 1570 m AMD
Eastern Cell Estimated Volume (m3)
% Adjustment
Adjusted Volume (m3) Comments
Eastern Cell
Western Cell
Figure 2: Western and eastern cells within the Stage 6 basin area.
For
insp
ectio
n pur
pose
s only
.
Conse
nt of
copy
right
owne
r req
uired
for a
ny ot
her u
se.
EPA Export 14-10-2017:03:27:44

STAGE 6 TAILINGS MANAGEMENT FACILITY
March 2016
Report No. 1532091.503/B.0
Western Cell Estimated Volume (m3)
% Adjustment
Adjusted Volume (m3) Comments
Average Depth 1.2 m 300,000 30 210,000 Above an Elv. of 1570 m AMD
Figure 3: Location of Trial Pits in the Northern and Seven Fields borrow area
3.5 Summary of Borrow Material There are several sources of material that could be used for construction purposes for the dam wall and capping on land owned by Tara Mines and in the immediate vicinity of the existing TMF. The main sources of borrow material are:
Within the basin area of Stage 6 which will need to be removed prior to completion of the first phase of construction; and
The material outside of the TMF footprint and within the northern and seven fields borrow areas.
There are some discrepancies between the overburden evaluated by the geophysics and the trial pitting and it can be assumed that the latter is a more robust method of evaluation. In summary, the overburden material including diggable weathered bedrock within the basin area of Stage 6 is estimated to be between 392,000 m3 and 574,000 m3 depending on the depth achieved. This assumes that the depth of excavation in the western cell is approximately between 2 m and 4 m and generally above an elevation of between 1568 m AMD and 1572 m AMD. Assuming and average value (3m depth), the material available is 483,000 m3. Where overburden is taken to depth and particularly where ground water is encountered, these excavations will be backfilled with boulders and cobbles removed from the glacial till.
For
insp
ectio
n pur
pose
s only
.
Conse
nt of
copy
right
owne
r req
uired
for a
ny ot
her u
se.
EPA Export 14-10-2017:03:27:44

STAGE 6 TAILINGS MANAGEMENT FACILITY
March 2016
Report No. 1532091.503/B.0
From the geophysics, an estimate for the rippable rock volume is 228,000 m3 and the volume of breaking rock with a pneumatic hammer is approximately 46,800 m3.Therefore the total material available within the basin area of the TMF is approximately 757,000 m3.
Table 3: Estimated Available Borrow Materials
Location Estimated Volume (m3)
Overburden Diggable Rippable Rock Breakable Rock Total TMF Basin Area 483,000 228,000 46,000 757,000
Outside TMF Footprint 329,000 175,000 37,000 541,000
Total 812,000 403,000 83,000 1,298,000
The remaining borrow area outside of the dam footprint would be used after the completion of Phase 1 construction.
The bulk of any short fall in borrow materials for Phase 2 construction would be obtained from land adjacent to the tailings facility owned by Tara and subject to planning. Additional materials such as drainage or protection material would be imported from local quarries together with any recycling of imported material from construction sites.
4.0 HYDROLOGY AND GROUNDWATER 4.1 Hydrology The Randalstown tailings facility is located in a topographically flat area at approximately 50 m above sea level. There are four main drainage regimes in the vicinity (Dwg 4.1).
The Yellow River, to the west of the tailings facility, is close to the site and flows south. The Yellow River joins the Blackwater River about 0.75 km south west of the site.
The Blackwater River flows south east and into the River Boyne approximately 4 km downstream.
The Simonstown stream originally crossed the tailings site and was diverted during the construction of Stage I into a channel on the eastern side of Stages I and II. The stream flows into the Doug River which in turn flows into the Blackwater River.
4.2 Groundwater Two hydrogeological units exist at the site:
Quaternary sands, gravels and clays with an average thickness of 8 m beneath the tailings pond; and
Lower Palaeozoic greywacke and Lower Carboniferous limestone bedrock.
The units are expected to be in hydraulic connection naturally. Hydraulic conductivity for Quaternary sands and gravels is likely to be of the order of 1E-4 m/s and 1E-5 m/s. Areas of high clay content are expected to have significantly lower hydraulic conductivity as represented for the clayey glacial till materials and as low as 1E-9 m/s. The hydraulic conductivity range for the bedrock hydrogeological unit is likely to be 1E-4 m/s and 1E-5 m/s (Reference 4.1) although results obtained from the two deep borehole investigations (Reference 3.1), indicated lower permeabilities at around 1E-6 m/s. The permeability of the rock will be dependent on frequency of fissuring and fissure infilling.
Groundwater flow in the Quaternary hydrogeological unit is expected to be restricted by the laterally discontinuous nature of the high hydraulic conductivity lenses.
For
insp
ectio
n pur
pose
s only
.
Conse
nt of
copy
right
owne
r req
uired
for a
ny ot
her u
se.
EPA Export 14-10-2017:03:27:44
STAGE 6 TAILINGS MANAGEMENT FACILITY
March 2016
Report No. 1532091.503/B.0
Groundwater flow in the bedrock is expected to be locally very fast through faults, fissures and solution features in the limestone. High flows were recorded from the fissured bedrock (Reference 4.1).
Local groundwater flow is to the south west towards the Yellow River. Both hydrogeological units are expected to be in hydraulic connection with the Yellow River. A bedrock spring flows into the river near the north western edge of the Stage III tailings facility.
There are two private wells which draw water from bedrock in the Randalstown area and make contact with the Quaternary hydrogeological unit. Groundwater flow is expected to be to the south and southwest across the region, towards the Yellow and the Blackwater Rivers and River Boyne.
Groundwater is already encountered in the Northern and Seven Fields borrow areas and drainage measures have been installed to drain the site. During the summer season, the groundwater drops and rises in winter time. It is expected that over much of the basin area, rock will be exposed and therefore it would be prudent to place the lining system during late summer and early autumn.
5.0 SEISMICITY 5.1 Seismic Hazard Ireland is characterised by very low levels of seismic activity. There have been no known occurrences of severe shaking over the past 10 centuries. The largest earthquake of recent time to shake the area was the magnitude 5.4 (Richter Scale) Wales earthquake of 1984, about 400 km from the site. The last reported earthquake in Ireland was in Wicklow on 28th April 1992 with a magnitude of 1.4 which is a very small event. The seismicity of Ireland is very low, particularly in the western part of the country and virtually the whole of Ireland is practically free of earthquakes (Reference 5.1).
Based on a review of historic data on earthquakes over the past 1,000 years within 1,000 km of the site, and broad estimates of attenuation, a design acceleration of 0.03g would provide for a 1 in 1,000 year event. Even up to a 1 in 10,000 year event, equivalent to the maximum credible earthquake (MCE), the acceleration should not exceed 0.06g.
The design criteria for the site have been evaluated using seismic data of the region to derive the Design Base Earthquake (DBE) and the Maximum Credible Earthquake (MCE). These are equated to a peak ground acceleration (PGA) for the site. This procedure follows international guidelines as set out by the International Commission on Large Dams (ICOLD) (Reference 5.2). The DBE equates to an earthquake event that usually has a return period equal to 10 to 50 times the life of the facility (500 years) and when occurring will not affect the performance of the structure. The MCE has a return period of some 10,000 years and when occurring will not cause total failure of the embankment wall but will result in severe damage i.e. slumping of the crest. The MCE is particularly applicable to the long term situation such as the close-out phase of the facility.
5.2 Seismic Vulnerability Stage 6 will be constructed using the downstream method and therefore not vulnerable to the earthquakes anticipated for this site.
The DBE has been taken as 0.03g which is very low and would have little or no effect on any of the dam walls constructed. The MCE has been taken as 0.06g and has been used to determine the pseudo static stability of the dam walls. It is a very conservative method as it assumes a horizontal force in one direction whereas the action is both forwards and backwards and for a brief period of time at its peak. The normal consequence of seismicity is settlement of an engineered, constructed and compacted dam wall rather than dam failure. The MCE has been used in the long term stability analysis as a horizontal force acting on the stack wall of the TMF. This is termed the pseudo-static method of stability analysis and is a very conservative approach.
For
insp
ectio
n pur
pose
s only
.
Conse
nt of
copy
right
owne
r req
uired
for a
ny ot
her u
se.
EPA Export 14-10-2017:03:27:44

STAGE 6 TAILINGS MANAGEMENT FACILITY
March 2016
Report No. 1532091.503/B.0
6.0 DESIGN 6.1 General The adjoining cell is located along the northern sector of the of the existing TMF facility (Drawing 1.2 and 1.3) and confined within the northern and seven fields borrow areas. It is proposed to raise the dam in two phases (Dwg. 6.1), the first phase to 1586 m AMD and the second phase to 67.29 m AOD. External ramps will be provided (Dwg. 6.2) for access from the main haul roads. The total construction volumes and storage volumes for various elevations are presented in the following table.
Table 4: Struck Storage and Construction Volumes at given Crest Elvs.
Phases Crest Elevation m AMD
Tailings Struck Storage Acc. Vol. m3
Total Construction Acc. Volumes m3
Ratio Tails/Con Vol. Ratio
Life in years
1 1586 5,300,000 533,800 10 6.5
2 1594 9,580,000 1,786,400 5.6 11.75
The ratio of tailings volume to construction volume indicates the additional volume gained in Phase 1 by filling the existing northern and seven fields borrow areas and borrowing the remaining material to construct the walls. The life in years has been based on a tailings discharge into the TMF of 1.1Mt/y tailings to TMF, a 0.5% beach slope and an average dry density of 1.42 t/m3.
The main benefit of two phases is that the maximum amount of fill can be borrowed from the basin area to use in construction. Once the first phase is complete, the basin area will be sterilised to any future borrowing by the placement of the lining system. It will therefore be necessary to remove all available material within the basin area and any addition materials found would be stored on the downstream side of Phase 1 or as ramps and ancillary structures. The floor plan area of the TMF basin is approximately 38.5 Ha.
6.2 Dam Sections The construction of the walls would be different from all previous dam walls forming the existing facility because of the design for a composite lining on the upstream face of the dam walls and basin area although the dam wall will be zoned (Dwg. 6.3) and the figure below.
Figure 4: Typical Dam Section
The upstream slope will be constructed with a slope of 2H:1V and for the first phase, will be keyed into the existing Stage I, II, III and Stage 4, with a ramp down to 57.29 m AOD and a ramp up to 63.29 m AOD (Dwg 6.4A). The second phase will be keyed into Stage 5 at 67.29 m AOD. The overall downstream slope will be
For
insp
ectio
n pur
pose
s only
.
Conse
nt of
copy
right
owne
r req
uired
for a
ny ot
her u
se.
EPA Export 14-10-2017:03:27:44
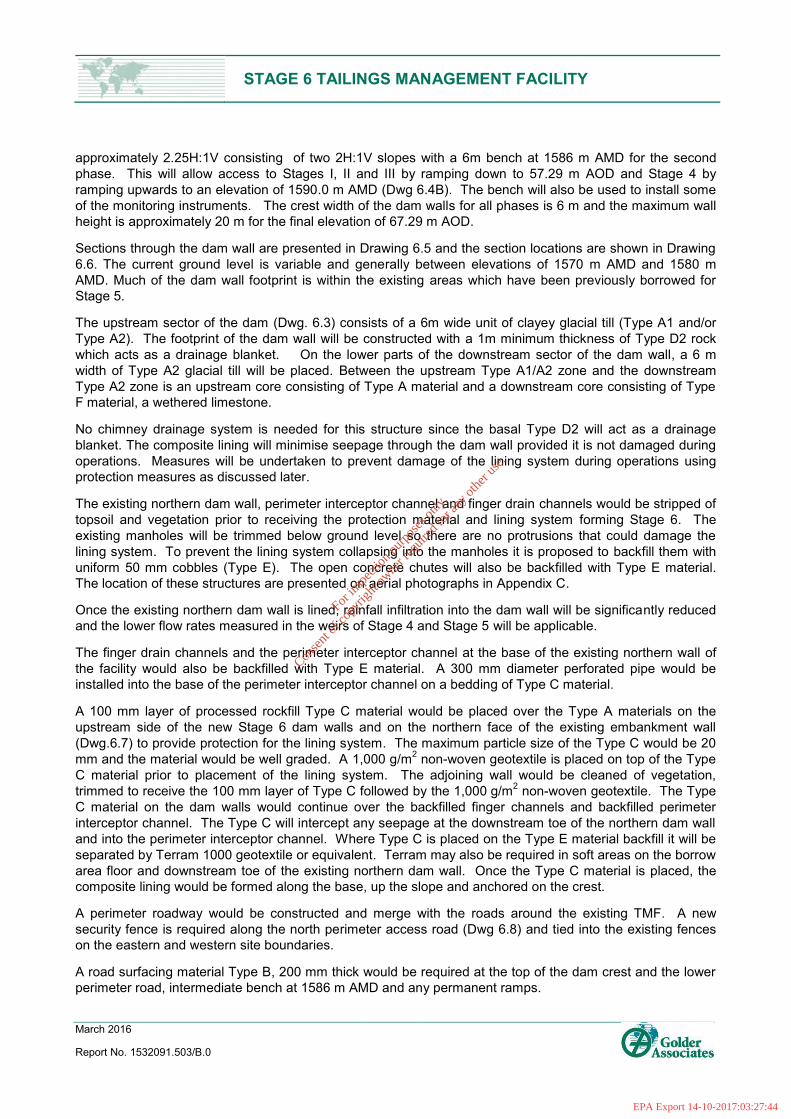
STAGE 6 TAILINGS MANAGEMENT FACILITY
March 2016
Report No. 1532091.503/B.0
approximately 2.25H:1V consisting of two 2H:1V slopes with a 6m bench at 1586 m AMD for the second phase. This will allow access to Stages I, II and III by ramping down to 57.29 m AOD and Stage 4 by ramping upwards to an elevation of 1590.0 m AMD (Dwg 6.4B). The bench will also be used to install some of the monitoring instruments. The crest width of the dam walls for all phases is 6 m and the maximum wall height is approximately 20 m for the final elevation of 67.29 m AOD.
Sections through the dam wall are presented in Drawing 6.5 and the section locations are shown in Drawing 6.6. The current ground level is variable and generally between elevations of 1570 m AMD and 1580 m AMD. Much of the dam wall footprint is within the existing areas which have been previously borrowed for Stage 5.
The upstream sector of the dam (Dwg. 6.3) consists of a 6m wide unit of clayey glacial till (Type A1 and/or Type A2). The footprint of the dam wall will be constructed with a 1m minimum thickness of Type D2 rock which acts as a drainage blanket. On the lower parts of the downstream sector of the dam wall, a 6 m width of Type A2 glacial till will be placed. Between the upstream Type A1/A2 zone and the downstream Type A2 zone is an upstream core consisting of Type A material and a downstream core consisting of Type F material, a wethered limestone.
No chimney drainage system is needed for this structure since the basal Type D2 will act as a drainage blanket. The composite lining will minimise seepage through the dam wall provided it is not damaged during operations. Measures will be undertaken to prevent damage of the lining system during operations using protection measures as discussed later.
The existing northern dam wall, perimeter interceptor channel and finger drain channels would be stripped of topsoil and vegetation prior to receiving the protection material and lining system forming Stage 6. The existing manholes will be trimmed below ground level so there are no protrusions that could damage the lining system. To prevent the lining system collapsing into the manholes it is proposed to backfill them with uniform 50 mm cobbles (Type E). The open concrete chutes will also be backfilled with Type E material. The location of these structures are presented on aerial photographs in Appendix C.
Once the existing northern dam wall is lined, rainfall infiltration into the dam wall will be significantly reduced and the lower flow rates measured in the weirs of Stage 4 and Stage 5 will be applicable.
The finger drain channels and the perimeter interceptor channel at the base of the existing northern wall of the facility would also be backfilled with Type E material. A 300 mm diameter perforated pipe would be installed into the base of the perimeter interceptor channel on a bedding of Type C material.
A 100 mm layer of processed rockfill Type C material would be placed over the Type A materials on the upstream side of the new Stage 6 dam walls and on the northern face of the existing embankment wall (Dwg.6.7) to provide protection for the lining system. The maximum particle size of the Type C would be 20 mm and the material would be well graded. A 1,000 g/m2 non-woven geotextile is placed on top of the Type C material prior to placement of the lining system. The adjoining wall would be cleaned of vegetation, trimmed to receive the 100 mm layer of Type C followed by the 1,000 g/m2 non-woven geotextile. The Type C material on the dam walls would continue over the backfilled finger channels and backfilled perimeter interceptor channel. The Type C will intercept any seepage at the downstream toe of the northern dam wall and into the perimeter interceptor channel. Where Type C is placed on the Type E material backfill it will be separated by Terram 1000 geotextile or equivalent. Terram may also be required in soft areas on the borrow area floor and downstream toe of the existing northern dam wall. Once the Type C material is placed, the composite lining would be formed along the base, up the slope and anchored on the crest.
A perimeter roadway would be constructed and merge with the roads around the existing TMF. A new security fence is required along the north perimeter access road (Dwg 6.8) and tied into the existing fences on the eastern and western site boundaries.
A road surfacing material Type B, 200 mm thick would be required at the top of the dam crest and the lower perimeter road, intermediate bench at 1586 m AMD and any permanent ramps.
For
insp
ectio
n pur
pose
s only
.
Conse
nt of
copy
right
owne
r req
uired
for a
ny ot
her u
se.
EPA Export 14-10-2017:03:27:44

STAGE 6 TAILINGS MANAGEMENT FACILITY
March 2016
Report No. 1532091.503/B.0
It is anticipated that at least 3 external ramps will be installed along the northern wall of Stage 6. The first ramp would be in a central location (Dwg.6.2) and be accessed via the main tarmac road from the site offices. Two other ramps would be located opposite the east and west sectors of the northern borrow area. These ramp would allow access to the remaining borrow materials and stockpiles to complete the second phase of Stage 6, the capping of Stage 5B and the eventual capping of Stage 6.
Temporary internal ramps will also be required but these would be removed systematically as the lining system is installed.
6.3 Fill material 6.3.1 General The dam wall raise is constructed from several materials which include cohesive glacial till, granular glacial material and processed rock fill. It consists of the following material types:
Type A1 and A2 Cohesive Glacial Till;
Type A3 Glacial Granular Material;
Type B Road Material;
Type C Protection Material;
Type D1 Backfilling Existing Borrow Area Drains;
Type D2 Dam Footprint Drainage Blanket Material; and
Type E 75 mm Coarse Drainage Backfill For Perimeter Interceptor Channel and Concrete Chutes.
6.3.2 Type A Materials 6.3.2.1 Type A1
Type A1 will be suitable material complying with the following:
Material Type A shall be glacial silty sands and gravels obtained from the borrow area with a Plasticity Index greater than 10%;
The moisture content shall be between -2% and +4% of optimum as measured in the Standard Proctor method and the material shall be free of all unsuitable material and compacted to 95% of Standard Proctor in 300 mm lifts; and
Maximum particle size is 200 mm in the minimum dimension.
6.3.2.2 Type A2 Material
Type A2 will be suitable material complying with the following:
Material Type A2 shall be glacial silty sands and gravels obtained from the borrow area with a Plasticity Index less than 10% but greater than 4%;
The moisture content shall be between -2% and +4% of optimum as measured in the Standard Proctor method and the material shall be free of all unsuitable material and compacted to 95% of Standard Proctor in 300 mm lifts; and
Maximum particle size is 200 mm in the minimum dimension.
6.3.2.3 Type A3 Material
Type A3 will be suitable material complying with the following:
For
insp
ectio
n pur
pose
s only
.
Conse
nt of
copy
right
owne
r req
uired
for a
ny ot
her u
se.
EPA Export 14-10-2017:03:27:44
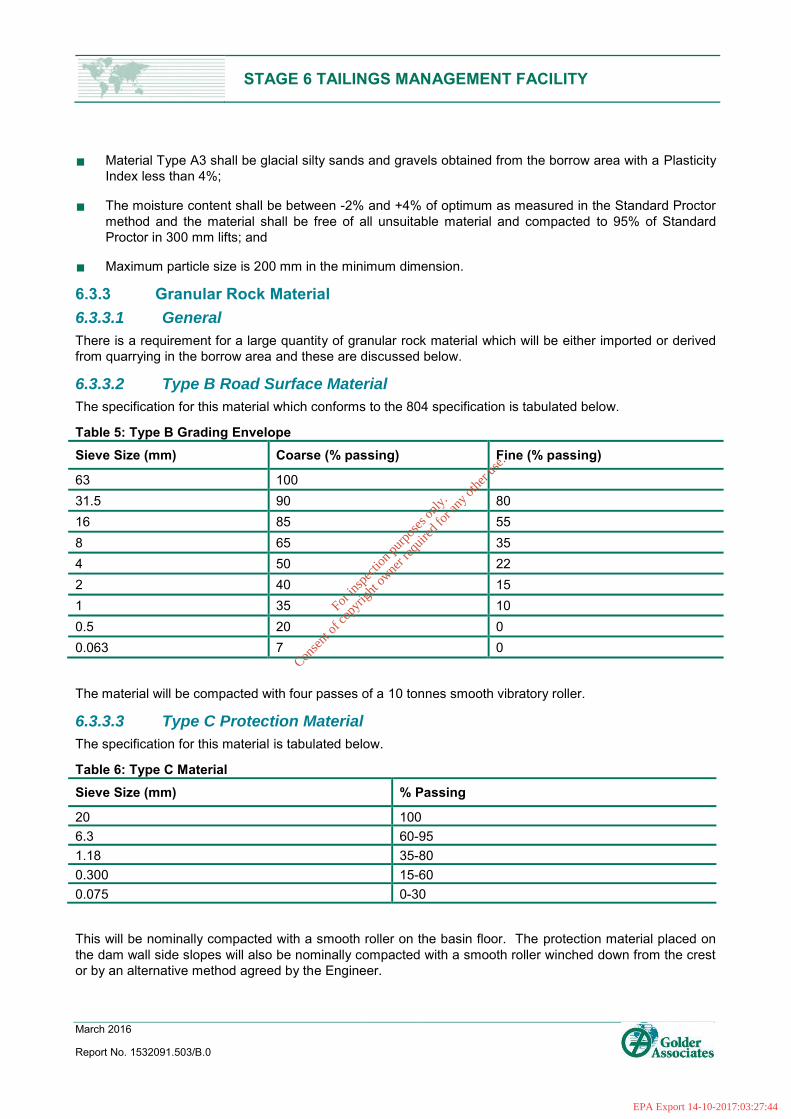
STAGE 6 TAILINGS MANAGEMENT FACILITY
March 2016
Report No. 1532091.503/B.0
Material Type A3 shall be glacial silty sands and gravels obtained from the borrow area with a Plasticity Index less than 4%;
The moisture content shall be between -2% and +4% of optimum as measured in the Standard Proctor method and the material shall be free of all unsuitable material and compacted to 95% of Standard Proctor in 300 mm lifts; and
Maximum particle size is 200 mm in the minimum dimension.
6.3.3 Granular Rock Material 6.3.3.1 General
There is a requirement for a large quantity of granular rock material which will be either imported or derived from quarrying in the borrow area and these are discussed below.
6.3.3.2 Type B Road Surface Material
The specification for this material which conforms to the 804 specification is tabulated below.
Table 5: Type B Grading Envelope Sieve Size (mm) Coarse (% passing) Fine (% passing)
63 100 31.5 90 80 16 85 55 8 65 35 4 50 22 2 40 15 1 35 10 0.5 20 0 0.063 7 0
The material will be compacted with four passes of a 10 tonnes smooth vibratory roller.
6.3.3.3 Type C Protection Material
The specification for this material is tabulated below.
Table 6: Type C Material Sieve Size (mm) % Passing
20 100 6.3 60-95 1.18 35-80 0.300 15-60 0.075 0-30
This will be nominally compacted with a smooth roller on the basin floor. The protection material placed on the dam wall side slopes will also be nominally compacted with a smooth roller winched down from the crest or by an alternative method agreed by the Engineer.
For
insp
ectio
n pur
pose
s only
.
Conse
nt of
copy
right
owne
r req
uired
for a
ny ot
her u
se.
EPA Export 14-10-2017:03:27:44

STAGE 6 TAILINGS MANAGEMENT FACILITY
March 2016
Report No. 1532091.503/B.0
6.3.3.4 Type D1 Backfilling Existing Borrow Area Drains
The specification for this material is tabulated below.
Table 7: Type D1 Grading Envelope Sieve Size (mm) Coarse (% passing) Fine (% passing)
250 100 100 100 30 75 60 10 50 40 0 20 15 0 10 10 0 1 6 0
This material will be placed and nominally compacted with the construction plant.
6.3.3.5 Type D2 Dam Footprint Drainage Blanket Material
The specification for Type D2 material is that it is granular and 100% passing 250 mm. The material will be placed in maximum lift size of 500mm and compacted with a 10 tonnes vibratory roller using 6 passes.
6.3.3.6 Type E Coarse Drainage Material
This material is uniformly graded at 50 mm diameter.
6.4 Fill Material Quantities The volumes of material for construction are tabulated as follows.
Table 8: Material Quantities Description Unit 1st Stage Qty 2nd Stage Qty Total Qty
Total Dam Fill Volumes m3 533,800 1,173,400 1,707,200 Type A1/A2 Upstream Wall Construction m3 105,500 110,600 216,100 Type A 2 Downstream Wall Construction m3 107,900 111,900 219,800 Type B Road Surfacing m3 4,900 5,100 7,400 Type C Protection Material m3 52,280 7,400 59,700 Type D1 Drainage m3 600
600
Type D2 Dam Footprint Drainage m3 85,400 98,900 184,300 Type A1/A2/A3 Upstream Core m3 117,500 426,000 543,500 Type F Downstream Core m3 117,500 426,000 543,500 Type E Coarse Drainage m3 11,500
11,500
Total Construction Volumes m3 600,500 1,185,900 1,786,400
The total dam fill volume excludes Type B, Type C, Type D1 and Type E material which is typically imported although could be produced on site from crushing and grading strong rock as previously undertaken for Stage 5B.
For
insp
ectio
n pur
pose
s only
.
Conse
nt of
copy
right
owne
r req
uired
for a
ny ot
her u
se.
EPA Export 14-10-2017:03:27:44
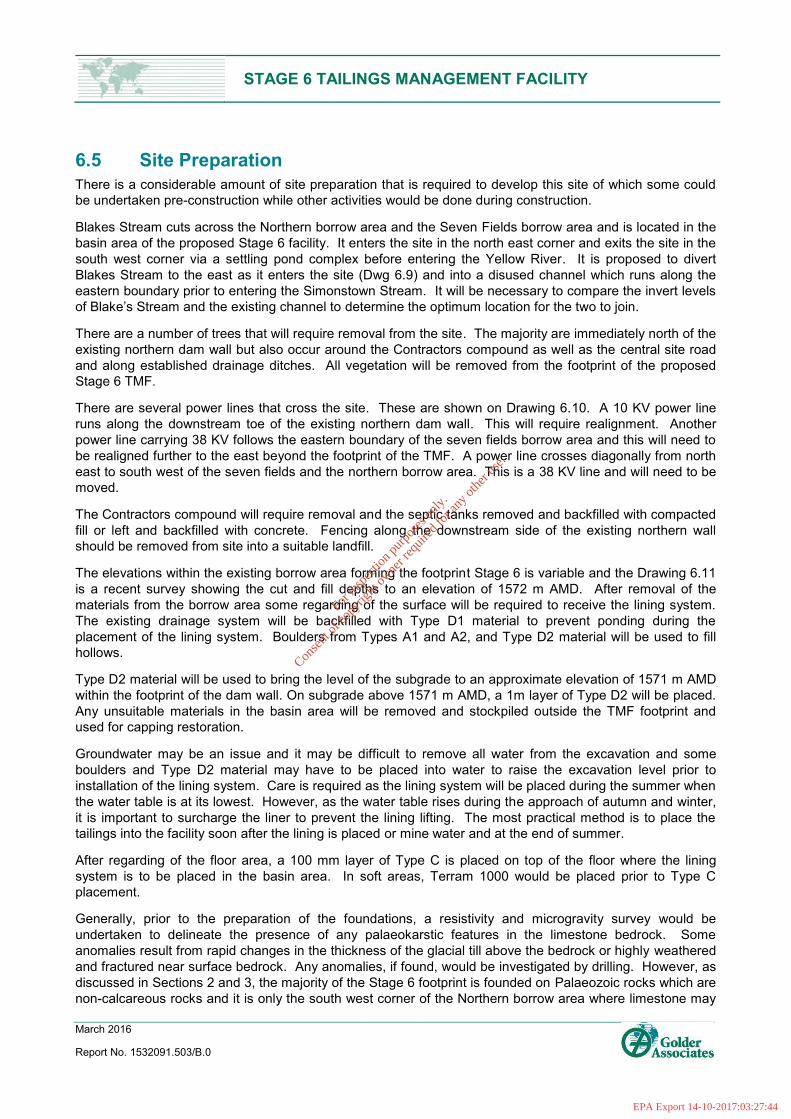
STAGE 6 TAILINGS MANAGEMENT FACILITY
March 2016
Report No. 1532091.503/B.0
6.5 Site Preparation There is a considerable amount of site preparation that is required to develop this site of which some could be undertaken pre-construction while other activities would be done during construction.
Blakes Stream cuts across the Northern borrow area and the Seven Fields borrow area and is located in the basin area of the proposed Stage 6 facility. It enters the site in the north east corner and exits the site in the south west corner via a settling pond complex before entering the Yellow River. It is proposed to divert Blakes Stream to the east as it enters the site (Dwg 6.9) and into a disused channel which runs along the eastern boundary prior to entering the Simonstown Stream. It will be necessary to compare the invert levels of Blake’s Stream and the existing channel to determine the optimum location for the two to join.
There are a number of trees that will require removal from the site. The majority are immediately north of the existing northern dam wall but also occur around the Contractors compound as well as the central site road and along established drainage ditches. All vegetation will be removed from the footprint of the proposed Stage 6 TMF.
There are several power lines that cross the site. These are shown on Drawing 6.10. A 10 KV power line runs along the downstream toe of the existing northern dam wall. This will require realignment. Another power line carrying 38 KV follows the eastern boundary of the seven fields borrow area and this will need to be realigned further to the east beyond the footprint of the TMF. A power line crosses diagonally from north east to south west of the seven fields and the northern borrow area. This is a 38 KV line and will need to be moved.
The Contractors compound will require removal and the septic tanks removed and backfilled with compacted fill or left and backfilled with concrete. Fencing along the downstream side of the existing northern wall should be removed from site into a suitable landfill.
The elevations within the existing borrow area forming the footprint Stage 6 is variable and the Drawing 6.11 is a recent survey showing the cut and fill depths to an elevation of 1572 m AMD. After removal of the materials from the borrow area some regarding of the surface will be required to receive the lining system. The existing drainage system will be backfilled with Type D1 material to prevent ponding during the placement of the lining system. Boulders from Types A1 and A2, and Type D2 material will be used to fill hollows.
Type D2 material will be used to bring the level of the subgrade to an approximate elevation of 1571 m AMD within the footprint of the dam wall. On subgrade above 1571 m AMD, a 1m layer of Type D2 will be placed. Any unsuitable materials in the basin area will be removed and stockpiled outside the TMF footprint and used for capping restoration.
Groundwater may be an issue and it may be difficult to remove all water from the excavation and some boulders and Type D2 material may have to be placed into water to raise the excavation level prior to installation of the lining system. Care is required as the lining system will be placed during the summer when the water table is at its lowest. However, as the water table rises during the approach of autumn and winter, it is important to surcharge the liner to prevent the lining lifting. The most practical method is to place the tailings into the facility soon after the lining is placed or mine water and at the end of summer.
After regarding of the floor area, a 100 mm layer of Type C is placed on top of the floor where the lining system is to be placed in the basin area. In soft areas, Terram 1000 would be placed prior to Type C placement.
Generally, prior to the preparation of the foundations, a resistivity and microgravity survey would be undertaken to delineate the presence of any palaeokarstic features in the limestone bedrock. Some anomalies result from rapid changes in the thickness of the glacial till above the bedrock or highly weathered and fractured near surface bedrock. Any anomalies, if found, would be investigated by drilling. However, as discussed in Sections 2 and 3, the majority of the Stage 6 footprint is founded on Palaeozoic rocks which are non-calcareous rocks and it is only the south west corner of the Northern borrow area where limestone may
For
insp
ectio
n pur
pose
s only
.
Conse
nt of
copy
right
owne
r req
uired
for a
ny ot
her u
se.
EPA Export 14-10-2017:03:27:44

STAGE 6 TAILINGS MANAGEMENT FACILITY
March 2016
Report No. 1532091.503/B.0
be present as part of the Pale Beds. The geophysical work undertaken in the borrow area to determine the excavatability of the bedrock indicated the possibility of palaeokarst in five locations as presented below.
Figure 5: Possible Palaeokarstic Features (Ref.3.5)
6.6 Composite Lining The TMF incorporates a composite lining system which consists of high density polyethylene (HDPE) geomembrane over a geosynthetic clay liner (GCL). The composite lining overlies a1000 g/m2 which in turn overlies 100 mm of Type C protection material as shown in section on Drawing 6.12.
6.6.1 High Density Polyethylene (HDPE) The HDPE will be 2 mm thick, double textured and is placed directly over GCL on the 2H:1V upstream slopes of the dam wall. In the basin area the HDPE is 2 mm thick and smooth and is placed directly over the GCL. The HDPE and GCL are anchored along the dam crest at 1586 m AMD and along the existing north wall of Stage 4 at an elevation of 63.29 m AOD for the first phase of Stage 6. Similarly, the lining system is anchored along the dam crest at 67.29 m AOD for the second phase of Stage 6.
The geomembrane materials shall consist of high density polyethylene, produced from new resins and containing no fillers, plasticisers or additives of any kind with the exception of carbon black.
The geomembrane shall comply with the requirements set out in the table below for 2.0 mm double textured and smooth geomembrane.
Table 9: HDPE Properties Parameters Properties
Material Double Textured 2 mm Smooth 2 mm Thickness (minimum average) nom. (mil)
Lowest individual of 10 values -10% -10%
Density mg/l (minimum.) 0.940 g/cc 0.940 g/cc Tensile Properties (minimum average)
Yield strength 29 kN/m 29 kN/m
For
insp
ectio
n pur
pose
s only
.
Conse
nt of
copy
right
owne
r req
uired
for a
ny ot
her u
se.
EPA Export 14-10-2017:03:27:44

STAGE 6 TAILINGS MANAGEMENT FACILITY
March 2016
Report No. 1532091.503/B.0
Parameters Properties
Break strength 21 kN/m 53 kN/m
Yield elongation >12% >12%
Break elongation >100% >700% Tear Resistance (minimum average) 250 N 249 N Puncture Resistance (minimum average) 500 N 640 N Stress Crack Resistance 300 hr. 300 hr. Carbon Black Content (range) 2.0 - 3.0% 2.0 - 3.0%
The geomembrane installation will be independently supervised and will be subjected to a strict CQA procedure.
6.6.2 Geosynthetic Clay Liner (GCL) The GCL is placed beneath the HDPE geomembrane and over the Type C sub-base material on the upstream dam slopes and basin area of the facility.
The GCL shall be Bentofix or an approved equivalent and the grade shall be 3600 g/m2 dry weight with a maximum permeability of 5E-11 m/s. The GCL shall consist of a layer of natural sodium bentonite clay encapsulated between two polypropylene textiles (geotextile), and have the following properties:
Table 10: GCL Properties Parameter Properties
Bentonite Layer Swell Index, Minimum 24 ml/2g Fluid Loss, Maximum 18 ml Sodium Bentonite, Minimum 3600 g/m2
Geotextile Mass (Minimum Average Roll Value)
Slit-Film Woven 105 g/m2 Nonwoven Needle Punched 200 g/m2
Index Flux (Maximum) 8x10⁻⁹ m3/m2/s Hydraulic Conductivity (Maximum) 5x10-11 m/s Peel Strength (Minimum) 240 N/m
Strip Tensile Strength (Minimum)
Machine Direction Tensile Strength 8 kN/m Elongation 8%
Across Machine Direction Tensile Strength 8 kN/m Elongation 8%
Hydrated Internal Shear Strength (Minimum) 24 kPa
For purposes of strength, performance, and integrity, the GCL shall be manufactured by mechanically bonding the geotextile using a needle-punching process. Needle-punched GCLs are those which, by the use of a needling board, have fibres of the non-woven geotextile pushed through the bentonite clay layer and integrated into a woven or non-woven geotextile.
The bentonite sealing compound or bentonite granules used to seal penetrations and make repairs shall be made of the same natural sodium bentonite as the GCL and shall be as recommended by the GCL Manufacturer. All GCL shall be free of damage or defect.
For
insp
ectio
n pur
pose
s only
.
Conse
nt of
copy
right
owne
r req
uired
for a
ny ot
her u
se.
EPA Export 14-10-2017:03:27:44
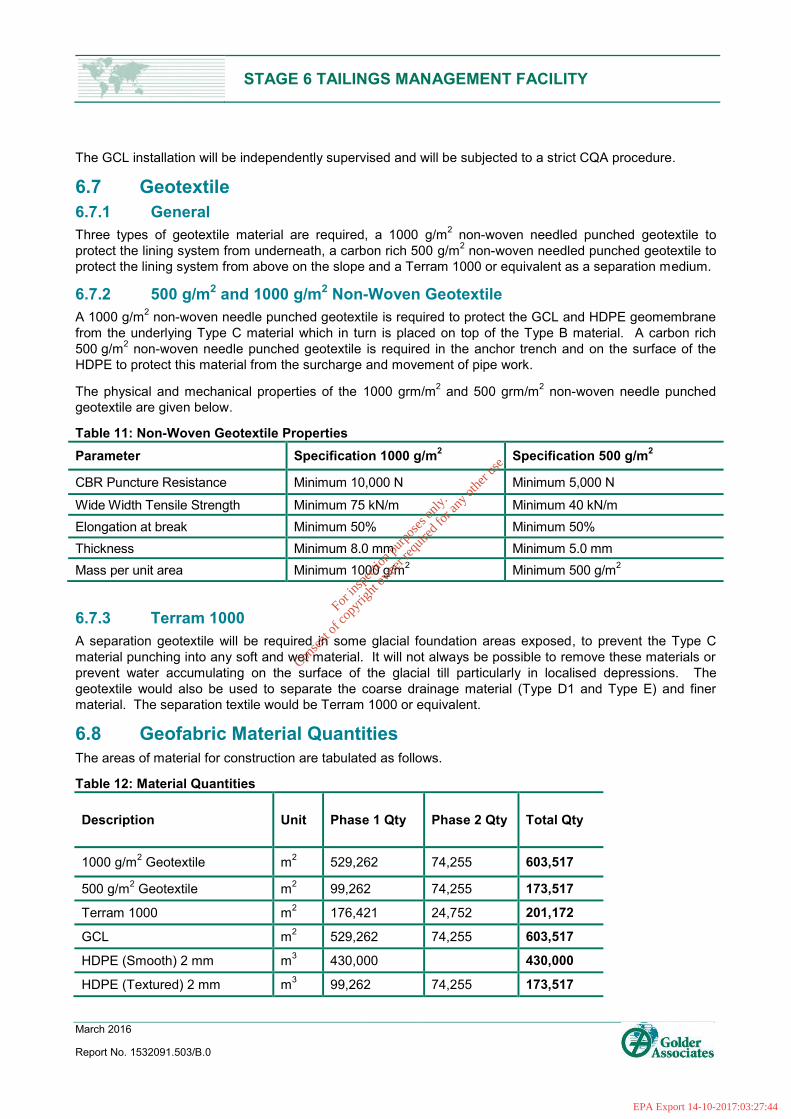
STAGE 6 TAILINGS MANAGEMENT FACILITY
March 2016
Report No. 1532091.503/B.0
The GCL installation will be independently supervised and will be subjected to a strict CQA procedure.
6.7 Geotextile 6.7.1 General Three types of geotextile material are required, a 1000 g/m2 non-woven needled punched geotextile to protect the lining system from underneath, a carbon rich 500 g/m2 non-woven needled punched geotextile to protect the lining system from above on the slope and a Terram 1000 or equivalent as a separation medium.
6.7.2 500 g/m2 and 1000 g/m2 Non-Woven Geotextile A 1000 g/m2 non-woven needle punched geotextile is required to protect the GCL and HDPE geomembrane from the underlying Type C material which in turn is placed on top of the Type B material. A carbon rich 500 g/m2 non-woven needle punched geotextile is required in the anchor trench and on the surface of the HDPE to protect this material from the surcharge and movement of pipe work.
The physical and mechanical properties of the 1000 grm/m2 and 500 grm/m2 non-woven needle punched geotextile are given below.
Table 11: Non-Woven Geotextile Properties Parameter Specification 1000 g/m2 Specification 500 g/m2
CBR Puncture Resistance Minimum 10,000 N Minimum 5,000 N Wide Width Tensile Strength Minimum 75 kN/m Minimum 40 kN/m Elongation at break Minimum 50% Minimum 50% Thickness Minimum 8.0 mm Minimum 5.0 mm Mass per unit area Minimum 1000 g/m2 Minimum 500 g/m2
6.7.3 Terram 1000 A separation geotextile will be required in some glacial foundation areas exposed, to prevent the Type C material punching into any soft and wet material. It will not always be possible to remove these materials or prevent water accumulating on the surface of the glacial till particularly in localised depressions. The geotextile would also be used to separate the coarse drainage material (Type D1 and Type E) and finer material. The separation textile would be Terram 1000 or equivalent.
6.8 Geofabric Material Quantities The areas of material for construction are tabulated as follows.
Table 12: Material Quantities
Description Unit Phase 1 Qty Phase 2 Qty Total Qty
1000 g/m2 Geotextile m2 529,262 74,255 603,517
500 g/m2 Geotextile m2 99,262 74,255 173,517
Terram 1000 m2 176,421 24,752 201,172
GCL m2 529,262 74,255 603,517
HDPE (Smooth) 2 mm m3 430,000
430,000
HDPE (Textured) 2 mm m3 99,262 74,255 173,517
For
insp
ectio
n pur
pose
s only
.
Conse
nt of
copy
right
owne
r req
uired
for a
ny ot
her u
se.
EPA Export 14-10-2017:03:27:44

STAGE 6 TAILINGS MANAGEMENT FACILITY
March 2016
Report No. 1532091.503/B.0
6.9 Anchor Trench The geosynthetics will be fixed in an anchor trench excavated along the crest of the dam wall stages as shown in section in Drawing 6.12. The trenches will be excavated with rounded shoulders where the geotextile and geomembrane lining will adjoin the trench in order to avoid sharp curvatures in the membrane material. The trench will be backfilled with screened Type C material and compacted in layers not exceeding 150 mm deep.
6.10 Permanent Surcharge A permanent surcharge is required on the exposed geomembrane to prevent the HDPE from being lifted and damaged by wind action and minimise damage from pipe movements. It also acts as a ladder if someone accidently falls into the facility. The surcharge will consist of car tyres in filled with Type C material and placed on the carbon rich 500 g/m2 non-woven needle punched geotextile. Each line of surcharge shall be a maximum of 2 m centres longitudinally and anchored on the crest and the weights consisting of car tyres shall be a maximum of 1.5 m apart down slope and where applicable on the lining placed on the floor of the tailings and a minimum distance of 1 tyre width beyond the downstream toe. The two tyres at the toe of the slope and 1 tyre width beyond will be tied together (Dwg 6.13). The tyres will be attached by suitable rope with a minimum life of 10 years.
6.11 Leak Detection A leak detection survey using DC electric current will be undertaken after the installation of the lining system. This geophysical method was previously used. An electric current is passed between two electrodes, one placed in either water ponded in the cell or by a water spray jetted onto the lining and the other in the peat outside the cell. With the geomembrane intact, the water in the cell will be electrically isolated from the external environment. The resulting potential field, measured as a potential difference between two non-polarising electrodes, is small but uniformly distributed over the geomembrane. If the geomembrane is defective, current will flow through the point of leakage and the measured potential will peak around the position of the defect.
Data acquisition is performed within the cell on a predetermined grid marked on the geomembrane at 2.0 m spacing. Two or more sets of data are obtained simultaneously, with information automatically stored on data loggers where possible. The results are processed and plotted on site, then overlaid on the plan of the cell to allow the immediate detection and location of the defect.
The voltage used is about 240 V and there is a strict safety protocol to follow to ensure no connection is made between the personnel, the ground and the water during the data gathering phase.
It is also anticipated that some difficulties will arise in physically walking on the flooded geomembrane. The surface of the geomembrane forming the basin area will be extremely slippery and to overcome this problem the operators use specialised waterproof clothing and footwear developed in the sailing industry.
6.12 Seepage Seepage from the TMF will be controlled by the low permeability composite lining system, and the low permeability of the tailings retained by the facility. Experience of a large number of quality assured and controlled geomembrane installations indicates (Reference 6.1) the presence of between 2 and 5 leaks per hectare and these are generally less than 10 mm2 in size.
Seepage calculations have been based on the design equations given in References 6.1 and 6.2 and for the worst case, when the facility is filled with tailings.
The volume of seepage flowing laterally through the dam wall via the GCL and some nominal defects in the lining system for a constant head of 20m (Phase 2) would be an average of about 1.5 m3/day with a 10% probability of the seepage being less than 0.25 m3/day and a 10% probability of greater than being 5 m3/day. The range represented in the figure below, is based on a number of variables including infiltration rate based
For
insp
ectio
n pur
pose
s only
.
Conse
nt of
copy
right
owne
r req
uired
for a
ny ot
her u
se.
EPA Export 14-10-2017:03:27:44
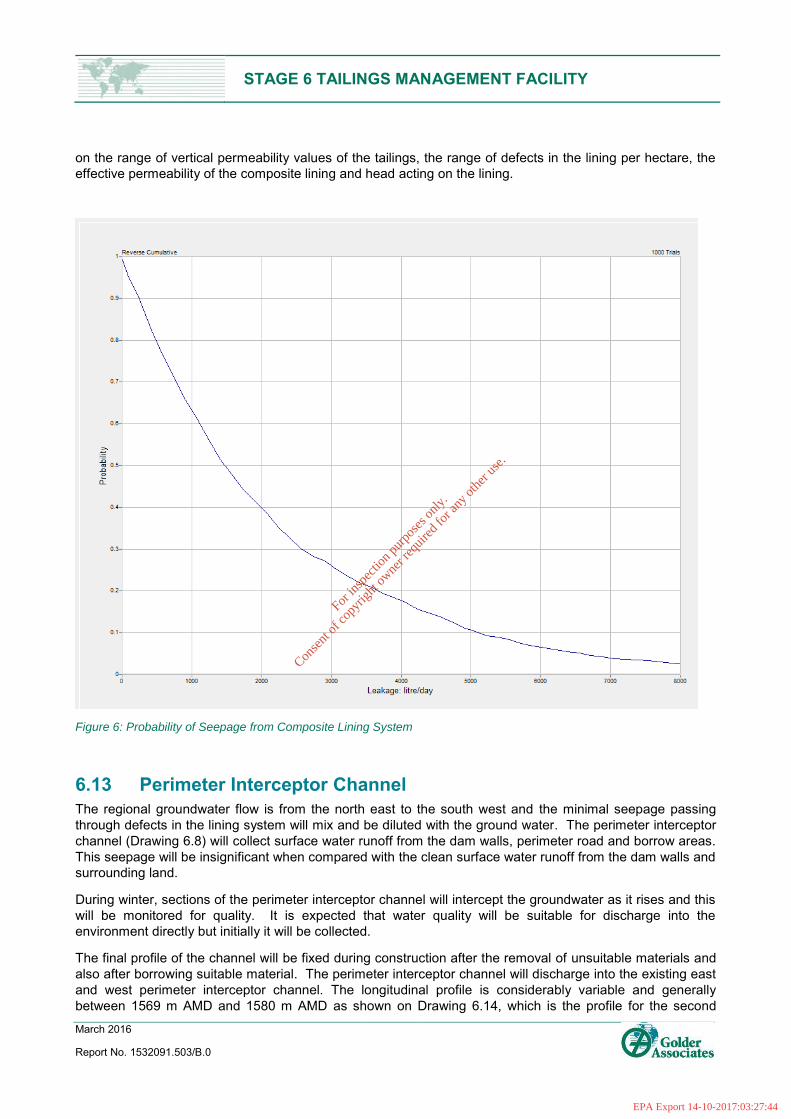
STAGE 6 TAILINGS MANAGEMENT FACILITY
March 2016
Report No. 1532091.503/B.0
on the range of vertical permeability values of the tailings, the range of defects in the lining per hectare, the effective permeability of the composite lining and head acting on the lining.
Figure 6: Probability of Seepage from Composite Lining System
6.13 Perimeter Interceptor Channel The regional groundwater flow is from the north east to the south west and the minimal seepage passing through defects in the lining system will mix and be diluted with the ground water. The perimeter interceptor channel (Drawing 6.8) will collect surface water runoff from the dam walls, perimeter road and borrow areas. This seepage will be insignificant when compared with the clean surface water runoff from the dam walls and surrounding land.
During winter, sections of the perimeter interceptor channel will intercept the groundwater as it rises and this will be monitored for quality. It is expected that water quality will be suitable for discharge into the environment directly but initially it will be collected.
The final profile of the channel will be fixed during construction after the removal of unsuitable materials and also after borrowing suitable material. The perimeter interceptor channel will discharge into the existing east and west perimeter interceptor channel. The longitudinal profile is considerably variable and generally between 1569 m AMD and 1580 m AMD as shown on Drawing 6.14, which is the profile for the second
For
insp
ectio
n pur
pose
s only
.
Conse
nt of
copy
right
owne
r req
uired
for a
ny ot
her u
se.
EPA Export 14-10-2017:03:27:44
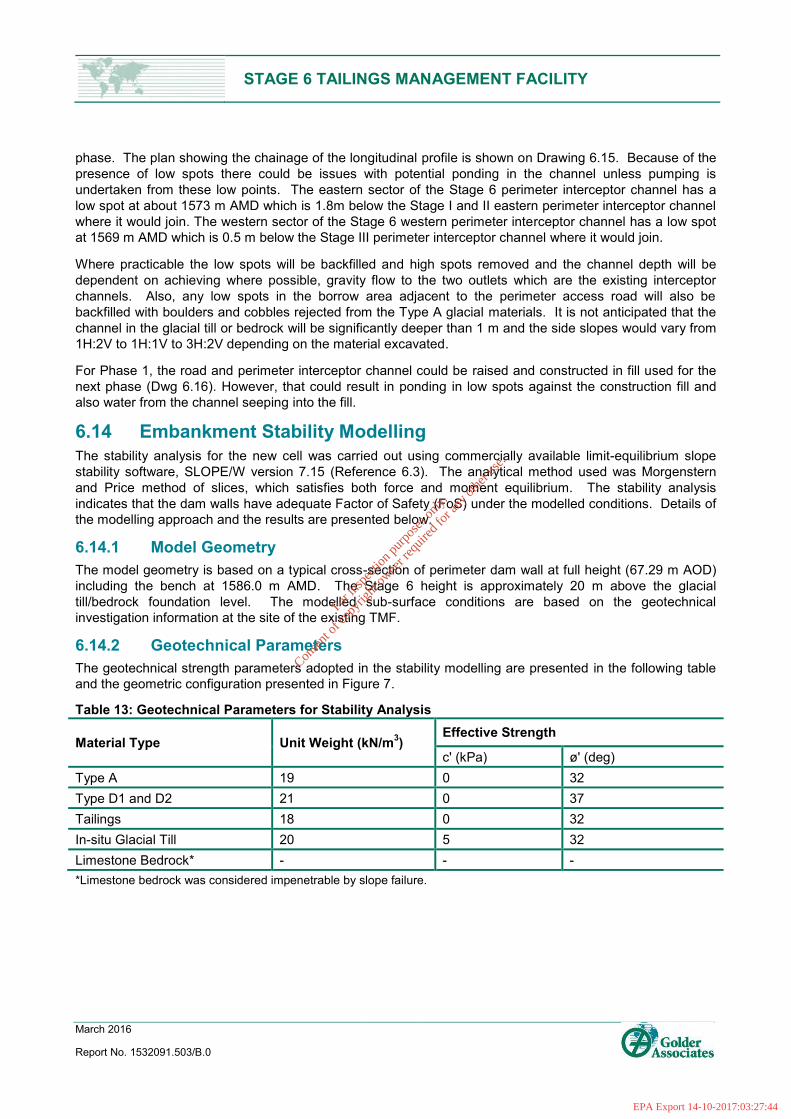
STAGE 6 TAILINGS MANAGEMENT FACILITY
March 2016
Report No. 1532091.503/B.0
phase. The plan showing the chainage of the longitudinal profile is shown on Drawing 6.15. Because of the presence of low spots there could be issues with potential ponding in the channel unless pumping is undertaken from these low points. The eastern sector of the Stage 6 perimeter interceptor channel has a low spot at about 1573 m AMD which is 1.8m below the Stage I and II eastern perimeter interceptor channel where it would join. The western sector of the Stage 6 western perimeter interceptor channel has a low spot at 1569 m AMD which is 0.5 m below the Stage III perimeter interceptor channel where it would join.
Where practicable the low spots will be backfilled and high spots removed and the channel depth will be dependent on achieving where possible, gravity flow to the two outlets which are the existing interceptor channels. Also, any low spots in the borrow area adjacent to the perimeter access road will also be backfilled with boulders and cobbles rejected from the Type A glacial materials. It is not anticipated that the channel in the glacial till or bedrock will be significantly deeper than 1 m and the side slopes would vary from 1H:2V to 1H:1V to 3H:2V depending on the material excavated.
For Phase 1, the road and perimeter interceptor channel could be raised and constructed in fill used for the next phase (Dwg 6.16). However, that could result in ponding in low spots against the construction fill and also water from the channel seeping into the fill.
6.14 Embankment Stability Modelling The stability analysis for the new cell was carried out using commercially available limit-equilibrium slope stability software, SLOPE/W version 7.15 (Reference 6.3). The analytical method used was Morgenstern and Price method of slices, which satisfies both force and moment equilibrium. The stability analysis indicates that the dam walls have adequate Factor of Safety (FoS) under the modelled conditions. Details of the modelling approach and the results are presented below.
6.14.1 Model Geometry The model geometry is based on a typical cross-section of perimeter dam wall at full height (67.29 m AOD) including the bench at 1586.0 m AMD. The Stage 6 height is approximately 20 m above the glacial till/bedrock foundation level. The modelled sub-surface conditions are based on the geotechnical investigation information at the site of the existing TMF.
6.14.2 Geotechnical Parameters The geotechnical strength parameters adopted in the stability modelling are presented in the following table and the geometric configuration presented in Figure 7.
Table 13: Geotechnical Parameters for Stability Analysis
Material Type Unit Weight (kN/m3) Effective Strength
c' (kPa) ø' (deg) Type A 19 0 32 Type D1 and D2 21 0 37 Tailings 18 0 32 In-situ Glacial Till 20 5 32 Limestone Bedrock* - - - *Limestone bedrock was considered impenetrable by slope failure.
For
insp
ectio
n pur
pose
s only
.
Conse
nt of
copy
right
owne
r req
uired
for a
ny ot
her u
se.
EPA Export 14-10-2017:03:27:44

STAGE 6 TAILINGS MANAGEMENT FACILITY
March 2016
Report No. 1532091.503/B.0
Figure 7: Model with material details
Effective strength parameters are typically used to assess long-term stability (after closure), whereby the excess pore pressures developed in any fine grained soils have dissipated.
6.14.3 Stability Modelling The stability of the TMF wall for each option was considered under the following conditions:
Long-term downstream embankment stability, with tailings level 1 m below the crest. The HDPE liner was assumed to be intact and an assumed phreatic surface was drawn down through the embankment by the downstream drainage blanket and the rock used in downstream construction.
Long-term downstream embankment stability, with tailings level 1 m below the crest. The HDPE liner was considered to undergo complete failure and the drainage system was no longer free draining and the phreatic surface exits the dam wall in the slope at one third of its height. This is a very extreme scenario which is unlikely to develop.
Further analyses were undertaken using pseudo-static conditions corresponding to a 0.06 g acceleration for the liner intact.
6.14.4 Results of Stability Modelling The results of the stability analyses are presented in Table 14 below in the form of the FoS for the most critical slip surface and in Figures 8 to 11. The required minimum FoS was exceeded under all conditions analysed.
Table 14: Stability Modelling Results Case Condition Location FOS
1 Long-term, tailings 1m below crest, phreatic surface at the toe of the dam. Static condition Downstream 1.63
2 Long-term, tailings 1m below crest, phreatic surface at the toe of the dam. Ground Acceleration 0.06g. Pseudo static condition. Downstream 1.38
3 Long-term, tailings 1m below crest, phreatic surface exists 1/3 dam height. Static condition. Downstream 1.16
For
insp
ectio
n pur
pose
s only
.
Conse
nt of
copy
right
owne
r req
uired
for a
ny ot
her u
se.
EPA Export 14-10-2017:03:27:44

STAGE 6 TAILINGS MANAGEMENT FACILITY
March 2016
Report No. 1532091.503/B.0
4 Long-term, tailings 1m below crest, phreatic surface exists 1/3 dam height. Ground Acceleration 0.06g. Pseudo static condition. Downstream 0.99
Figure 8: Static Analysis with Drainage Blanket operational (Phreatic Surface at the Dam toe)
Figure 9: Pseudo – Static analysis with Drainage Blanket operational (Phreatic Surface at the Dam toe)
For
insp
ectio
n pur
pose
s only
.
Conse
nt of
copy
right
owne
r req
uired
for a
ny ot
her u
se.
EPA Export 14-10-2017:03:27:44
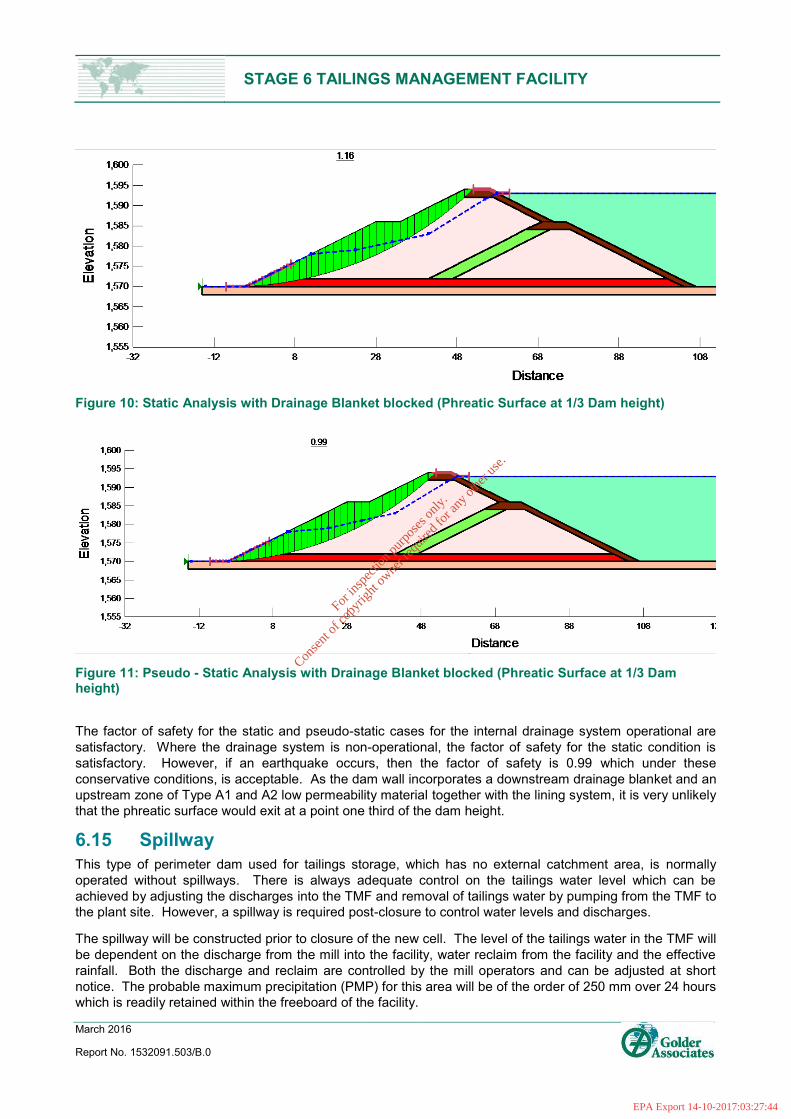
STAGE 6 TAILINGS MANAGEMENT FACILITY
March 2016
Report No. 1532091.503/B.0
Figure 10: Static Analysis with Drainage Blanket blocked (Phreatic Surface at 1/3 Dam height)
Figure 11: Pseudo - Static Analysis with Drainage Blanket blocked (Phreatic Surface at 1/3 Dam height)
The factor of safety for the static and pseudo-static cases for the internal drainage system operational are satisfactory. Where the drainage system is non-operational, the factor of safety for the static condition is satisfactory. However, if an earthquake occurs, then the factor of safety is 0.99 which under these conservative conditions, is acceptable. As the dam wall incorporates a downstream drainage blanket and an upstream zone of Type A1 and A2 low permeability material together with the lining system, it is very unlikely that the phreatic surface would exit at a point one third of the dam height.
6.15 Spillway This type of perimeter dam used for tailings storage, which has no external catchment area, is normally operated without spillways. There is always adequate control on the tailings water level which can be achieved by adjusting the discharges into the TMF and removal of tailings water by pumping from the TMF to the plant site. However, a spillway is required post-closure to control water levels and discharges.
The spillway will be constructed prior to closure of the new cell. The level of the tailings water in the TMF will be dependent on the discharge from the mill into the facility, water reclaim from the facility and the effective rainfall. Both the discharge and reclaim are controlled by the mill operators and can be adjusted at short notice. The probable maximum precipitation (PMP) for this area will be of the order of 250 mm over 24 hours which is readily retained within the freeboard of the facility.
For
insp
ectio
n pur
pose
s only
.
Conse
nt of
copy
right
owne
r req
uired
for a
ny ot
her u
se.
EPA Export 14-10-2017:03:27:44
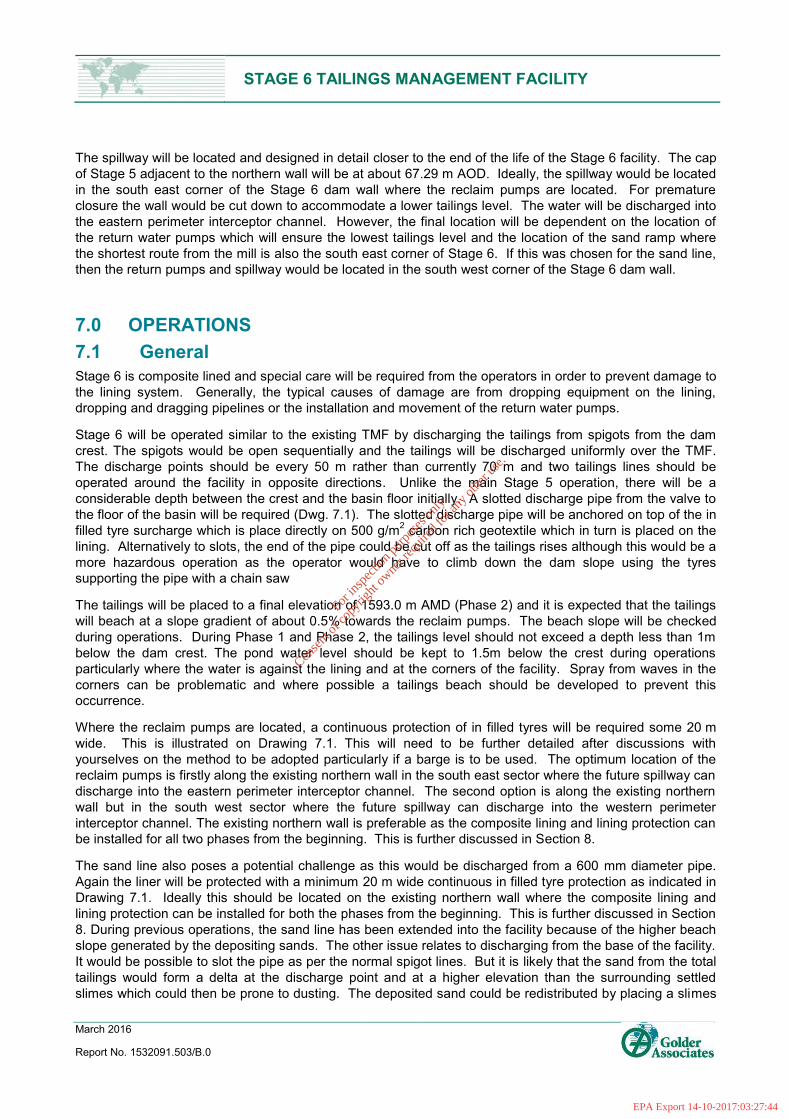
STAGE 6 TAILINGS MANAGEMENT FACILITY
March 2016
Report No. 1532091.503/B.0
The spillway will be located and designed in detail closer to the end of the life of the Stage 6 facility. The cap of Stage 5 adjacent to the northern wall will be at about 67.29 m AOD. Ideally, the spillway would be located in the south east corner of the Stage 6 dam wall where the reclaim pumps are located. For premature closure the wall would be cut down to accommodate a lower tailings level. The water will be discharged into the eastern perimeter interceptor channel. However, the final location will be dependent on the location of the return water pumps which will ensure the lowest tailings level and the location of the sand ramp where the shortest route from the mill is also the south east corner of Stage 6. If this was chosen for the sand line, then the return pumps and spillway would be located in the south west corner of the Stage 6 dam wall.
7.0 OPERATIONS 7.1 General Stage 6 is composite lined and special care will be required from the operators in order to prevent damage to the lining system. Generally, the typical causes of damage are from dropping equipment on the lining, dropping and dragging pipelines or the installation and movement of the return water pumps.
Stage 6 will be operated similar to the existing TMF by discharging the tailings from spigots from the dam crest. The spigots would be open sequentially and the tailings will be discharged uniformly over the TMF. The discharge points should be every 50 m rather than currently 70 m and two tailings lines should be operated around the facility in opposite directions. Unlike the main Stage 5 operation, there will be a considerable depth between the crest and the basin floor initially. A slotted discharge pipe from the valve to the floor of the basin will be required (Dwg. 7.1). The slotted discharge pipe will be anchored on top of the in filled tyre surcharge which is place directly on 500 g/m2 carbon rich geotextile which in turn is placed on the lining. Alternatively to slots, the end of the pipe could be cut off as the tailings rises although this would be a more hazardous operation as the operator would have to climb down the dam slope using the tyres supporting the pipe with a chain saw
The tailings will be placed to a final elevation of 1593.0 m AMD (Phase 2) and it is expected that the tailings will beach at a slope gradient of about 0.5% towards the reclaim pumps. The beach slope will be checked during operations. During Phase 1 and Phase 2, the tailings level should not exceed a depth less than 1m below the dam crest. The pond water level should be kept to 1.5m below the crest during operations particularly where the water is against the lining and at the corners of the facility. Spray from waves in the corners can be problematic and where possible a tailings beach should be developed to prevent this occurrence.
Where the reclaim pumps are located, a continuous protection of in filled tyres will be required some 20 m wide. This is illustrated on Drawing 7.1. This will need to be further detailed after discussions with yourselves on the method to be adopted particularly if a barge is to be used. The optimum location of the reclaim pumps is firstly along the existing northern wall in the south east sector where the future spillway can discharge into the eastern perimeter interceptor channel. The second option is along the existing northern wall but in the south west sector where the future spillway can discharge into the western perimeter interceptor channel. The existing northern wall is preferable as the composite lining and lining protection can be installed for all two phases from the beginning. This is further discussed in Section 8.
The sand line also poses a potential challenge as this would be discharged from a 600 mm diameter pipe. Again the liner will be protected with a minimum 20 m wide continuous in filled tyre protection as indicated in Drawing 7.1. Ideally this should be located on the existing northern wall where the composite lining and lining protection can be installed for both the phases from the beginning. This is further discussed in Section 8. During previous operations, the sand line has been extended into the facility because of the higher beach slope generated by the depositing sands. The other issue relates to discharging from the base of the facility. It would be possible to slot the pipe as per the normal spigot lines. But it is likely that the sand from the total tailings would form a delta at the discharge point and at a higher elevation than the surrounding settled slimes which could then be prone to dusting. The deposited sand could be redistributed by placing a slimes
For
insp
ectio
n pur
pose
s only
.
Conse
nt of
copy
right
owne
r req
uired
for a
ny ot
her u
se.
EPA Export 14-10-2017:03:27:44

STAGE 6 TAILINGS MANAGEMENT FACILITY
March 2016
Report No. 1532091.503/B.0
spigot adjacent to the sand line. It would also be possible to construct a berm into the facility, on the tailings at a later stage of the life of Phase 1 and also for Phase 2 if the sand line had to be extended into the facility.
To prevent damage of the lining at the point of discharge and to provide surcharge for the base, the basin should be filled with a minimum of 1 m of water equating to approximately 430,000 m3.
7.2 Piezometer and Groundwater Monitoring The groundwater monitoring system for the TMF is presented on Drawing 7.2 and indicates piezometers and monitoring wells at 5 locations. The monitoring wells will be located beyond the downstream toe and adjacent to the perimeter access road but subject to any anomalies indicated by the resistivity and microgravity survey which would indicate the presence of any water bearing fissures. The piezometers would be installed into the foundations and above the drainage blanket at the base of the dam fill from the crest at 1586 m AMD for the first phase of Stage 6. These would then be replaced during the construction of the second phase of Stage 6 with two piezometers installed on the crest and two piezometers on the intermediate bench. The construction of the piezometers and wells are shown on Drawings 7.3.
The water level and water quality sampling will be undertaken in accordance with the IPPC license.
7.3 Settlement Monitoring Points Settlement of the dam wall will be undertaken at seven locations as shown on Drawing 7.2 and the construction shown on Drawing 7.3
8.0 CONSTRUCTION 8.1 General Unlike Stages 4 and 5, there is no time restraint for placing the construction materials because there will be little to no excess pore pressure development in the foundation glacial tills compared to Stages 4 and 5 founded on tailings. Therefore, there is no restriction on the rate of rising of the dam wall or on the size or number of trucks. We would expect the size of dump trucks to be 40 tonnes rather than the 25 tonnes used to build the Stage 5B raise. We would also expect the dozers spreading on the dam wall to be the size of a D8. Using larger plant and increasing the number of dump trucks will significantly increase productivity.
The total bulk volume of fill to be removed from within the basin area of Stage 6 is 757,000 m3. The total bulk volume of construction material to build Phase 1 is 530,000 m3 plus 27,000 m3 towards ramp construction and a further 200,000 m3 to allow for capping of Stage 5A. For the second phase of Stage 6, to an elevation of 1594.0 m AMD the volume of construction fill material is 1,170,000 m3. A further 300,000 m3 is required for capping of Stage 5B. Assuming a construction season per year of 30 weeks, the average volume of material placed for the construction of Stage 6 only for a given number of seasons is tabulated below.
Table 15: Average Production Values For Construction of Stage 6 Construction Fill Vol. m3 Phase 1 1586 m AMD 557,000 557,000 557,000 557,000 557,000
Season 1 1.5 2 2.5 3
Weeks 30 45 60 75 90
Average Vol. m3/week 18,567 12,378 9,283 7,427 6,189
Construction Fill Vol. m3 1,170,000 1,170,000 1,170,000 1,170,000 1,170,000
For
insp
ectio
n pur
pose
s only
.
Conse
nt of
copy
right
owne
r req
uired
for a
ny ot
her u
se.
EPA Export 14-10-2017:03:27:44
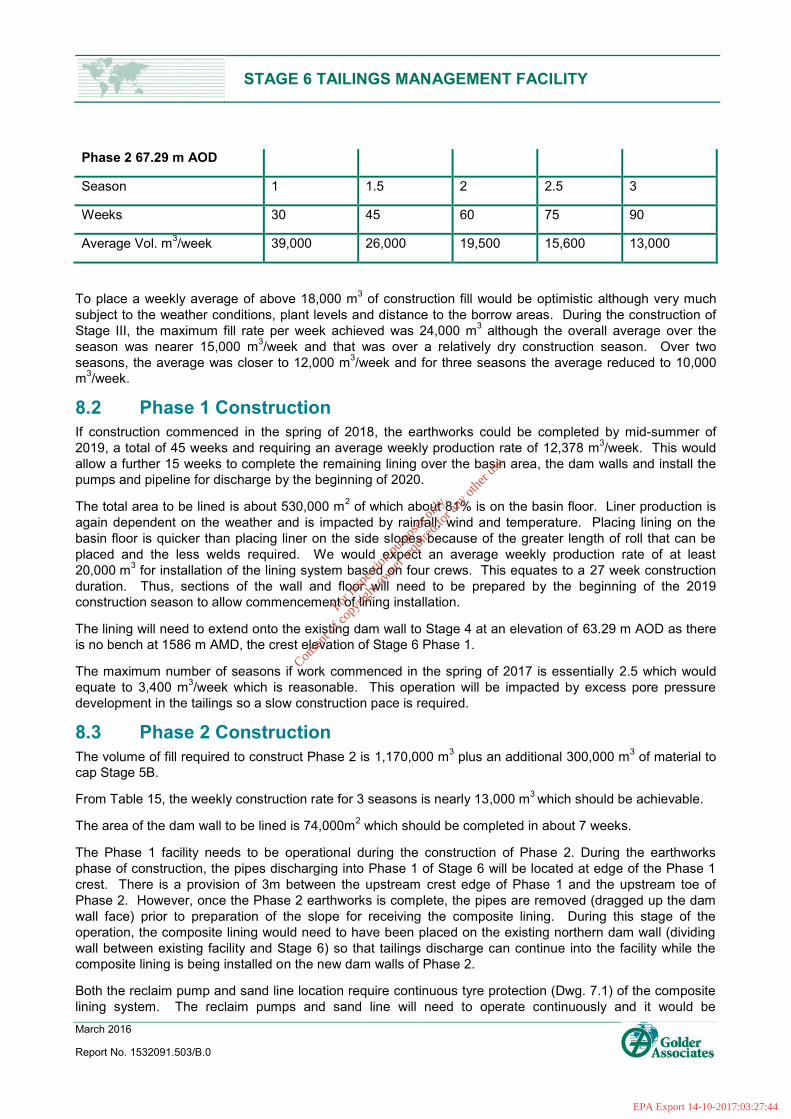
STAGE 6 TAILINGS MANAGEMENT FACILITY
March 2016
Report No. 1532091.503/B.0
Phase 2 67.29 m AOD
Season 1 1.5 2 2.5 3
Weeks 30 45 60 75 90
Average Vol. m3/week 39,000 26,000 19,500 15,600 13,000
To place a weekly average of above 18,000 m3 of construction fill would be optimistic although very much subject to the weather conditions, plant levels and distance to the borrow areas. During the construction of Stage III, the maximum fill rate per week achieved was 24,000 m3 although the overall average over the season was nearer 15,000 m3/week and that was over a relatively dry construction season. Over two seasons, the average was closer to 12,000 m3/week and for three seasons the average reduced to 10,000 m3/week.
8.2 Phase 1 Construction If construction commenced in the spring of 2018, the earthworks could be completed by mid-summer of 2019, a total of 45 weeks and requiring an average weekly production rate of 12,378 m3/week. This would allow a further 15 weeks to complete the remaining lining over the basin area, the dam walls and install the pumps and pipeline for discharge by the beginning of 2020.
The total area to be lined is about 530,000 m2 of which about 81% is on the basin floor. Liner production is again dependent on the weather and is impacted by rainfall, wind and temperature. Placing lining on the basin floor is quicker than placing liner on the side slopes because of the greater length of roll that can be placed and the less welds required. We would expect an average weekly production rate of at least 20,000 m3 for installation of the lining system based on four crews. This equates to a 27 week construction duration. Thus, sections of the wall and floor will need to be prepared by the beginning of the 2019 construction season to allow commencement of lining installation.
The lining will need to extend onto the existing dam wall to Stage 4 at an elevation of 63.29 m AOD as there is no bench at 1586 m AMD, the crest elevation of Stage 6 Phase 1.
The maximum number of seasons if work commenced in the spring of 2017 is essentially 2.5 which would equate to 3,400 m3/week which is reasonable. This operation will be impacted by excess pore pressure development in the tailings so a slow construction pace is required.
8.3 Phase 2 Construction The volume of fill required to construct Phase 2 is 1,170,000 m3 plus an additional 300,000 m3 of material to cap Stage 5B.
From Table 15, the weekly construction rate for 3 seasons is nearly 13,000 m3 which should be achievable.
The area of the dam wall to be lined is 74,000m2 which should be completed in about 7 weeks.
The Phase 1 facility needs to be operational during the construction of Phase 2. During the earthworks phase of construction, the pipes discharging into Phase 1 of Stage 6 will be located at edge of the Phase 1 crest. There is a provision of 3m between the upstream crest edge of Phase 1 and the upstream toe of Phase 2. However, once the Phase 2 earthworks is complete, the pipes are removed (dragged up the dam wall face) prior to preparation of the slope for receiving the composite lining. During this stage of the operation, the composite lining would need to have been placed on the existing northern dam wall (dividing wall between existing facility and Stage 6) so that tailings discharge can continue into the facility while the composite lining is being installed on the new dam walls of Phase 2.
Both the reclaim pump and sand line location require continuous tyre protection (Dwg. 7.1) of the composite lining system. The reclaim pumps and sand line will need to operate continuously and it would be
For
insp
ectio
n pur
pose
s only
.
Conse
nt of
copy
right
owne
r req
uired
for a
ny ot
her u
se.
EPA Export 14-10-2017:03:27:44
STAGE 6 TAILINGS MANAGEMENT FACILITY
March 2016
Report No. 1532091.503/B.0
appropriate to locate them on the existing northern wall and install the composite lining plus protection to the final dam crest height of 67.29 m AOD. The pipelines for these operations are currently operating on Stage 5 at an elevation of 67.29 m AOD and will need to be brought down the existing northern wall to the Stage 4 crest at 63.29 m AOD. The Phase 1 of Stage 6 is at a crest elevation of 1586 m AMD.
9.0 CLOSURE Stage 6 will be capped in accordance with the procedures developed for capping Stages 5A and 5B (Reference 10.1). This will include approximately 350 mm of capping material. The arrangement of drainage and shape of the cap will need to be detailed once the location of the sand line and reclaim pumps are determined by Tara Mines. The spillway arrangements will be engineered once the facility is approaching closure. A detailed design of the closure is currently being prepared separately.
10.0 REFERENCES 1.1 Golder Associates. Technical Memo to Boliden Tara Mines Ltd. Stage 6 TMF Options Study. July
2015. No. 1532091.501
1.2 Golder Associates. Report to Boliden Tara Mines Ltd. Conceptual Design for the Stage 6 Tailings Management Facility. October 2015. Report No. 532091.501
2.1 Golder Associates. Report to Outokumpu, Tara mines Ltd on assessment of palaeokarstic features in relation to the tailings impoundment, June 1996, Report No. 95512034 / 96512012
2.2 Golder Associates. Report to Kilborn Engineering Ltd, Geotechnical Investigation Tara Mines Ltd, Tailings Dam, Vol. 2, H.Q.Golder Associates Ltd, May 1974, Report No. L73074/2.
2.3 Boulton, G.S., A.S., Clayton, K.M. and Kenning, M.S., 1977, A British Ice Sheet Model and Patterns of Glacial Erosion and Deposition in Britain. In: British Quaternary Studies - Recent Advances, ed. F.W. Shottun, p. 231-245.
2.4 Schmidt, W. and Scott, T.M., 1984, Florida Karst - Its Relationship to Geologic Structure and Stratigraphy. In: Sinkholes: Their Geology, Engineering and Environmental Impact; Proceedings of the First Multi-Disciplinary Conference on Sinkholes, ed. Barry F. Beck, p. 11-16.
2.5 Golder Associates. Draft Report to Outokumpu Tara Mines on the Design of the Stage 4 Dam Raise, 1996 Report No. 93512044/6.
For
insp
ectio
n pur
pose
s only
.
Conse
nt of
copy
right
owne
r req
uired
for a
ny ot
her u
se.
EPA Export 14-10-2017:03:27:44

STAGE 6 TAILINGS MANAGEMENT FACILITY
March 2016
Report No. 1532091.503/B.0
3.1 Golder Associates. Draft Report to Outokumpu Tara Mines on the Assessment of the Northern Borrow Property and Construction of Stage 4B, 2001.
3.2 Golder Associates. Report to Outokumpu Zinc Tara Mines on Additional Site Investigation Adjacent to the Northern Borrow Area for Purpose of Tailings Dam Raise. March 1996 Report No. 95512098.
3.3 Golder Associates. Report to Outokumpu Zinc Tara Mines on site investigation in Simonstown and Clonmagaddan borrow areas for purpose of tailings dam raise, November 1994, Report No. 93512044/3.
3.4 Golder Associates Geophysical Report Seven Fields Borrow Area
3.5 Golder Associates Geophysical Report Northern, Seven Fields and Simonstown Borrow Areas.
3.6 Archaeological Study
4.1 Knight Piesold (1996). Outokumpu Tara Mines Limited. Randalstown Tailings Facility Stage IV. Environmental Impact Statement Draft No.1 April 1996.
5.1 Roger Musson, Seismicity and Earthquake Hazard in the UK, British Geological Survey, 2002.
5.2 International Committee of Large Dams (ICOLD), Dam Design Criteria, 1988.
6.1 Leakage through Liners Constructed with Geomembranes. Part II. Composite Liners. J. P. Giroud, et al., Geotextiles and Geomembranes, 8(4) pp71-111 1989.
6.2 Rate of Leakage through a Composite Liner due to Geomembrane Defects. J. P. Giroud, et al., Geotextiles and Geomembranes, 11(1) pp1-28 1992
6.3 SLOPE/W, Geoslope International, Slope Stability Program, Version 7.15
10.1 Golder Associates Ltd. (2008). Report to Boliden Tara Mines Ltd, Reclamation and Closure plan for the Randalstown Tailings Facility Following the Stage 5 Raise. 2009, Report no. 08514150063.
For
insp
ectio
n pur
pose
s only
.
Conse
nt of
copy
right
owne
r req
uired
for a
ny ot
her u
se.
EPA Export 14-10-2017:03:27:44
STAGE 6 TAILINGS MANAGEMENT FACILITY
March 2016
Report No. 1532091.503/B.0
Report Signature Page
GOLDER ASSOCIATES (UK) LTD
Roger White Martyn Willan Prinicpal/Project Manager Geotechnical Engineer
Date: March 2016
RSW/MW/gg
Company Registered in England No.1125149 At Attenborough House, Browns Lane Business Park, Stanton-on-the-Wolds, Nottinghamshire NG12 5BL VAT No. 209 0084 92 Golder, Golder Associates and the GA globe design are trademarks of Golder Associates Corporation.
For
insp
ectio
n pur
pose
s only
.
Conse
nt of
copy
right
owne
r req
uired
for a
ny ot
her u
se.
EPA Export 14-10-2017:03:27:44
STAGE 6 TAILINGS MANAGEMENT FACILITY
March 2016
Report No. 1532091.503/B.0
APPENDIX A Drawings
Drawing No. 1.1 – Site Location Plan
Drawing No. 1.2 – Mine Site and Randalstown Tailings Facility Location Plan
Drawing No. 1.3 – Plan of Stage 6 Raise
Drawing No. 1.4 – Plan of Dam Stages and the Northern and Sevenfields Borrow Areas
Drawing No. 2.1 – Randalstown Tailings Dam Surface Geology
Drawing No. 4.1 – Principal Drainage Flowpaths in the Randalstown Vicinity
Drawing No. 6.1A – Stage 6 TMF Layout Plan Phase 1
Drawing No. 6.1B – Stage 6 TMF Layout Plan Phase 1 and 2
Drawing No. 6.1C - Stage 6 TMF Layout Plan Phase 1, 2 and 3
Drawing No. 6.2 – Permanent Ramp Locations
Drawing No. 6.3 – Typical Dam Wall Section
Drawing No. 6.4A – Western and Eastern Connections Details Phase 1
Drawing No. 6.4B – Western and Eastern Connections Details Phase 2
Drawing No. 6.5 – Stage 6 Sections Through Dam Wall Phase 1 and 2
Drawing No. 6.6 – Stage 6 Plan Showing Chainage of Sections
Drawing No. 6.7 – Typical Section of Existing Northern Dam Wall
For
insp
ectio
n pur
pose
s only
.
Conse
nt of
copy
right
owne
r req
uired
for a
ny ot
her u
se.
EPA Export 14-10-2017:03:27:44

STAGE 6 TAILINGS MANAGEMENT FACILITY
March 2016
Report No. 1532091.503/B.0
Drawing No. 6.8 – Perimeter Roadway, Fence and Interceptor Channel.
Drawing No. 6.9 – Diversion of Blakes Stream
Drawing No. 6.10 – Existing Powerlines
Drawing No. 6.11– Survey of the Borrow Area Within the Footprint of Stage 6 Showing Cut and Fill Depth to 1573 mAMD
Drawing No. 6.12 –Typical Composite Lining System Detail
Drawing No. 6.13 – Tyre Ballast for Embankment Slopes
Drawing No. 6.14 – Longitudinal Profile Along Perimeter Interceptor Channel
Drawing No. 6.15 – Plan Showing Perimeter Interceptor Channel Chainage
Drawing No. 6.16 – Raised Perimeter Roadway and Interceptor Channel Constructed in the Next Phase
Drawing No. 7.1 – Pipeline and Reclaim Pump and Sand Line Protection
Drawing No. 7.2 – Piezometer and Monitoring Location Plan and Section
Drawing No. 7.3 – Instrumentation Details
For
insp
ectio
n pur
pose
s only
.
Conse
nt of
copy
right
owne
r req
uired
for a
ny ot
her u
se.
EPA Export 14-10-2017:03:27:44

STAGE 6 TAILINGS MANAGEMENT FACILITY
March 2016
Report No. 1532091.503/B.0
APPENDIX B
Trial Pit Logs
For
insp
ectio
n pur
pose
s only
.
Conse
nt of
copy
right
owne
r req
uired
for a
ny ot
her u
se.
EPA Export 14-10-2017:03:27:44

STAGE 6 TAILINGS MANAGEMENT FACILITY
March 2016
Report No. 1532091.503/B.0
APPENDIX C Aerial Photograph
For
insp
ectio
n pur
pose
s only
.
Conse
nt of
copy
right
owne
r req
uired
for a
ny ot
her u
se.
EPA Export 14-10-2017:03:27:44
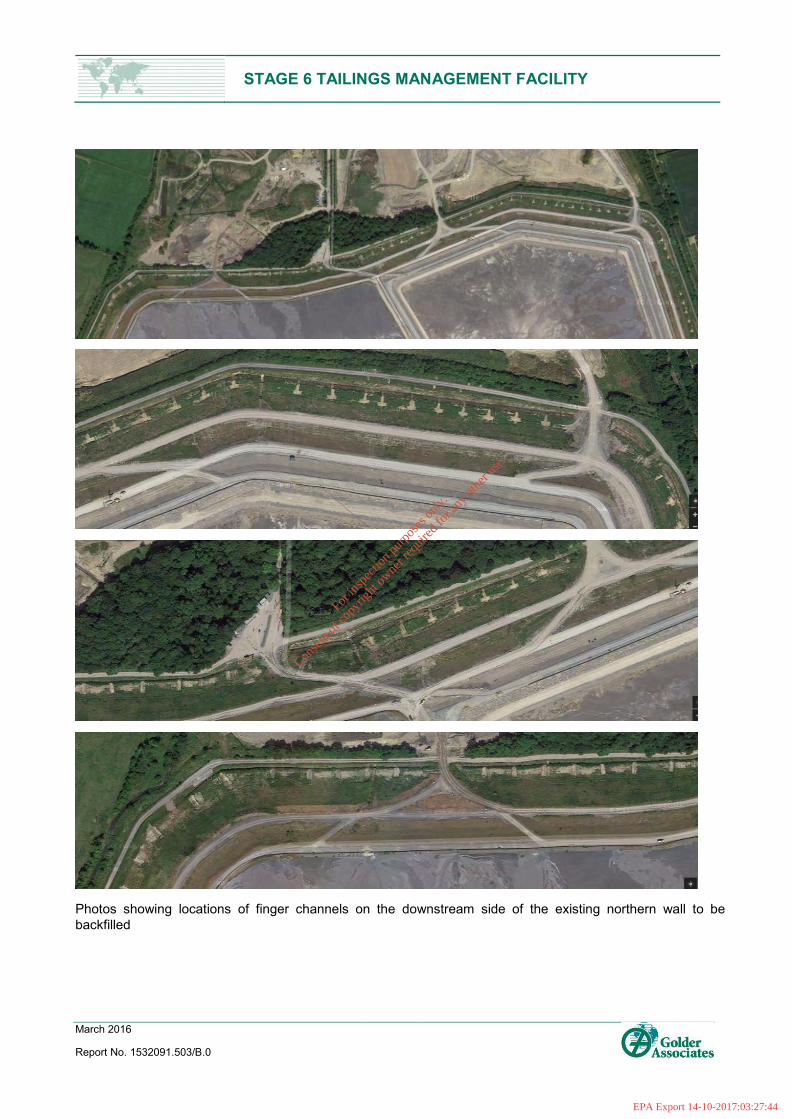
STAGE 6 TAILINGS MANAGEMENT FACILITY
March 2016
Report No. 1532091.503/B.0
Photos showing locations of finger channels on the downstream side of the existing northern wall to be backfilled
For
insp
ectio
n pur
pose
s only
.
Conse
nt of
copy
right
owne
r req
uired
for a
ny ot
her u
se.
EPA Export 14-10-2017:03:27:44

STAGE 6 TAILINGS MANAGEMENT FACILITY
March 2016
Report No. 1532091.503/B.0
Photos showing locations of chutes and manholes on the downstream side of the existing northern wall to be backfilled
For
insp
ectio
n pur
pose
s only
.
Conse
nt of
copy
right
owne
r req
uired
for a
ny ot
her u
se.
EPA Export 14-10-2017:03:27:44

Golder Associates (UK) Ltd Cavendish House Bourne End Business Park Cores End Road Bourne End Buckinghamshire SL8 5AS UK T: [+44] (0) 1628 851851
Caption Text
For
insp
ectio
n pur
pose
s only
.
Conse
nt of
copy
right
owne
r req
uired
for a
ny ot
her u
se.
EPA Export 14-10-2017:03:27:44
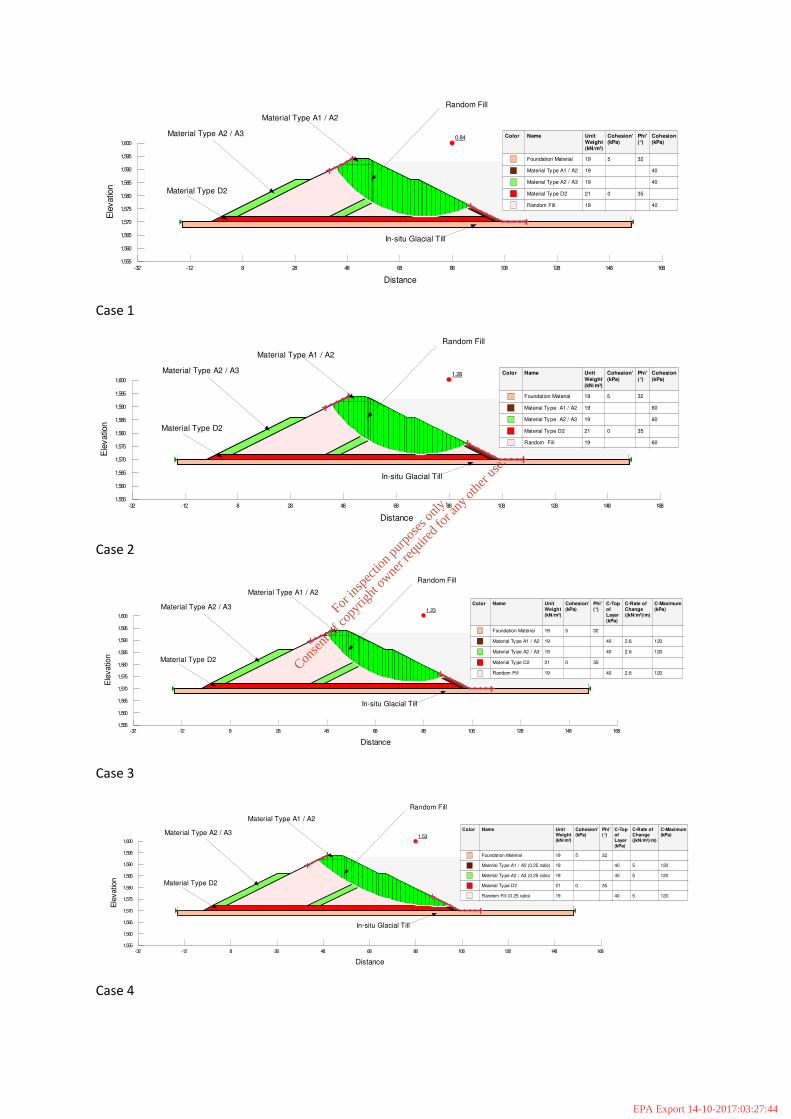
Case 1
Case 2
Case 3
Case 4
0.84
Distance
-32 -12 8 28 48 68 88 108 128 148 168
Ele
vatio
n
1,555
1,560
1,565
1,570
1,575
1,580
1,585
1,590
1,595
1,600
Material Type D2
Material Type A1 / A2
Material Type A2 / A3
Random Fill
In-situ Glacial Till
Color Name Unit Weight(kN/m³)
Cohesion'(kPa)
Phi'(°)
Cohesion(kPa)
Foundation Material 19 5 32
Material Type A1 / A2 19 40
Material Type A2 / A3 19 40
Material Type D2 21 0 35
Random Fill 19 40
1.26
Distance
-32 -12 8 28 48 68 88 108 128 148 168
Ele
vatio
n
1,555
1,560
1,565
1,570
1,575
1,580
1,585
1,590
1,595
1,600
Material Type D2
Material Type A1 / A2
Material Type A2 / A3
Random Fill
In-situ Glacial Till
Color Name Unit
Weight(kN/m³)
Cohesion'
(kPa)
Phi'
(°)
Cohesion
(kPa)
Foundation Material 19 5 32
Material Type A1 / A2 19 60
Material Type A2 / A3 19 60
Material Type D2 21 0 35
Random Fill 19 60
1.23
Distance
-32 -12 8 28 48 68 88 108 128 148 168
Ele
vatio
n
1,555
1,560
1,565
1,570
1,575
1,580
1,585
1,590
1,595
1,600
Material Type D2
Material Type A1 / A2
Material Type A2 / A3
Random Fill
In-situ Glacial Till
Color Name Unit Weight(kN/m³)
Cohesion'(kPa)
Phi'(°)
C-Topof Layer (kPa)
C-Rate of Change ((kN/m²)/m)
C-Maximum(kPa)
Foundation Material 19 5 32
Material Ty pe A1 / A2 19 40 2.6 120
Material Ty pe A2 / A3 19 40 2.6 120
Material Ty pe D2 21 0 35
Random Fill 19 40 2.6 120
1.53
Distance
-32 -12 8 28 48 68 88 108 128 148 168
Ele
vatio
n
1,555
1,560
1,565
1,570
1,575
1,580
1,585
1,590
1,595
1,600
Material Type D2
Material Type A1 / A2
Material Type A2 / A3
Random Fill
In-situ Glacial Till
Color Name Unit Weight(kN/m³)
Cohesion'(kPa)
Phi'(°)
C-Topof Layer
(kPa)
C-Rate of Change ((kN/m²)/m)
C-Maximum(kPa)
Foundation Material 19 5 32
Material Ty pe A1 / A2 (0.25 ratio) 19 40 5 120
Material Ty pe A2 / A3 (0.25 ratio) 19 40 5 120
Material Ty pe D2 21 0 35
Random Fill (0.25 ratio) 19 40 5 120
For
insp
ectio
n pur
pose
s only
.
Conse
nt of
copy
right
owne
r req
uired
for a
ny ot
her u
se.
EPA Export 14-10-2017:03:27:44

Case 5
Case 6
Case 7
Case 8
1.64
Distance
-32 -12 8 28 48 68 88 108 128 148 168
Ele
vatio
n
1,555
1,560
1,565
1,570
1,575
1,580
1,585
1,590
1,595
1,600
Material Type D2
Material Type A1 / A2
Material Type A2 / A3
Random Fill
In-situ Glacial Till
Color Name Unit Weight(kN/m³)
Cohesion'(kPa)
Phi'(°)
C-Topof Layer
(kPa)
C-Rate of Change ((kN/m²)/m)
C-Maximum(kPa)
Foundation Material 19 5 32
Material Type A1 / A2 (0.13 ratio) 19 60 2.6 120
Material Type A2 / A3 (0.13 ratio) 19 60 2.6 120
Material Type D2 21 0 35
Random Fill (0.13 ratio) 19 60 2.6 120
1.86
Distance
-32 -12 8 28 48 68 88 108 128 148 168
Ele
vatio
n
1,555
1,560
1,565
1,570
1,575
1,580
1,585
1,590
1,595
1,600
Material Type D2
Material Type A1 / A2
Material Type A2 / A3
Random Fill
In-situ Glacial Till
Color Name Unit Weight(kN/m³)
Cohesion'(kPa)
Phi'(°)
C-Topof Layer (kPa)
C-Rate of Change ((kN/m²)/m)
C-Maximum(kPa)
Foundation Material 19 5 32
Material Ty pe A1 / A2 (0.25 ratio) 19 60 5 120
Material Ty pe A2 / A3 (0.25 ratio) 19 60 5 120
Material Ty pe D2 21 0 35
Random Fill (0.25 ratio) 19 60 5 120
1.46
Distance
-32 -12 8 28 48 68 88 108 128 148 168
Ele
va
tio
n
1,555
1,560
1,565
1,570
1,575
1,580
1,585
1,590
1,595
1,600
Tailings
Material Type D2
Material Type A1 / A2
Material Type A2 / A3
Random Fill
In-situ Glacial Till
Color Name Model Unit
Weight
(kN/m³)
Cohesion'
(kPa)
Phi'
(°)
Foundation Material Mohr-Coulomb 19 5 32
Material T ype A1 / A2 Mohr-Coulomb 19 0 32
Material T ype A2 / A3 Mohr-Coulomb 19 0 32
Material T ype D2 Mohr-Coulomb 21 0 35
Random Fil l Mohr-Coulomb 19 0 32
1.20
Distance
-32 -12 8 28 48 68 88 108 128 148 168
Ele
vatio
n
1,555
1,560
1,565
1,570
1,575
1,580
1,585
1,590
1,595
1,600
Material Type D2
Material Type A1 / A2
Material Type A2 / A3
Random Fill
In-situ Glacial Till
Color Name Model Unit
Weight
(kN/m³)
Cohesion'
(kPa)
Phi'
(°)
Ru
Foundation Material Mohr-Coulomb 19 5 32 0
Material Type A1 / A2 Mohr-Coulomb 19 0 32 0.15
Material Type A2 / A3 Mohr-Coulomb 19 0 32 0
Material Type D2 Mohr-Coulomb 21 0 35 0
Random Fil l Mohr-Coulomb 19 0 32 0.15
For
insp
ectio
n pur
pose
s only
.
Conse
nt of
copy
right
owne
r req
uired
for a
ny ot
her u
se.
EPA Export 14-10-2017:03:27:44
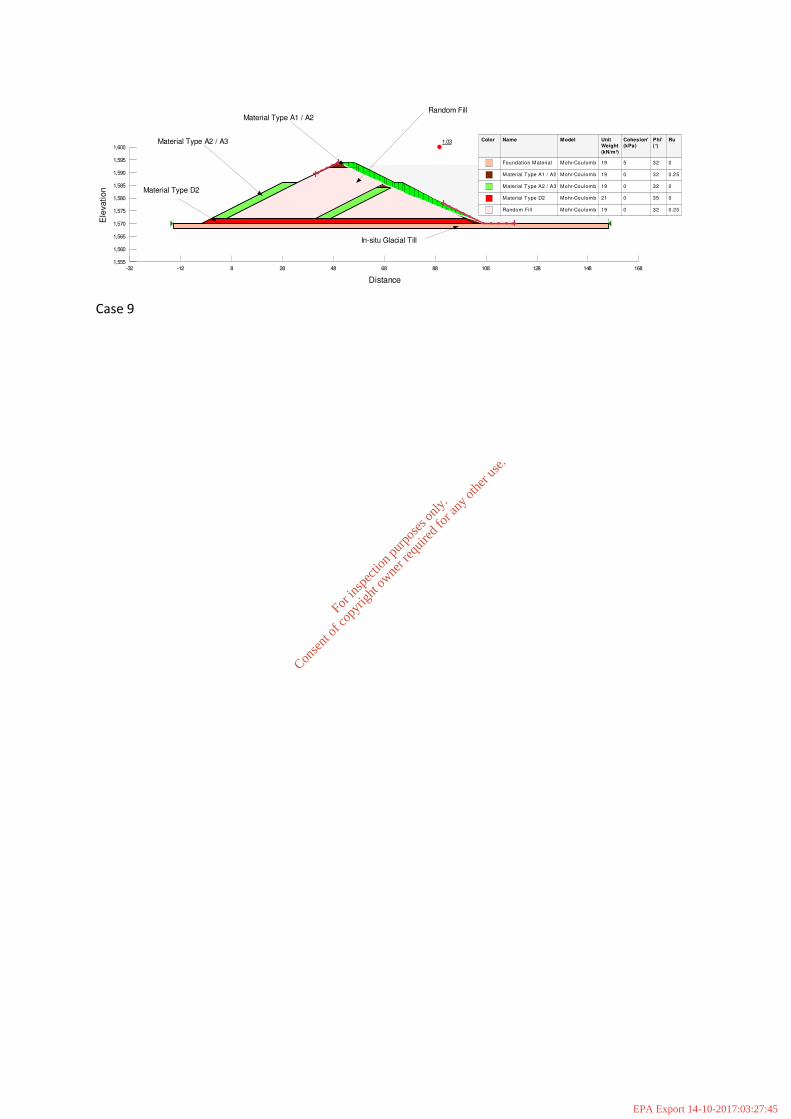
Case 9
1.03
Distance
-32 -12 8 28 48 68 88 108 128 148 168
Ele
vation
1,555
1,560
1,565
1,570
1,575
1,580
1,585
1,590
1,595
1,600
Material Type D2
Material Type A1 / A2
Material Type A2 / A3
Random Fill
In-situ Glacial Till
Color Name Model Unit
Weight
(kN/m³)
Cohesion'
(kPa)
Phi'
(°)
Ru
Foundation Material Mohr-Coulomb 19 5 32 0
Material Type A1 / A2 Mohr-Coulomb 19 0 32 0.25
Material Type A2 / A3 Mohr-Coulomb 19 0 32 0
Material Type D2 Mohr-Coulomb 21 0 35 0
Random Fi l l Mohr-Coulomb 19 0 32 0.25
For
insp
ectio
n pur
pose
s only
.
Conse
nt of
copy
right
owne
r req
uired
for a
ny ot
her u
se.
EPA Export 14-10-2017:03:27:45

IEL PO516-04 Review Application
Response to Further Information Request 12/09/2017
Appendix to FIR Item 11
Tailings Management Facility Dam Break Study (Golder Associates)
For
insp
ectio
n pur
pose
s only
.
Conse
nt of
copy
right
owne
r req
uired
for a
ny ot
her u
se.
EPA Export 14-10-2017:03:27:45
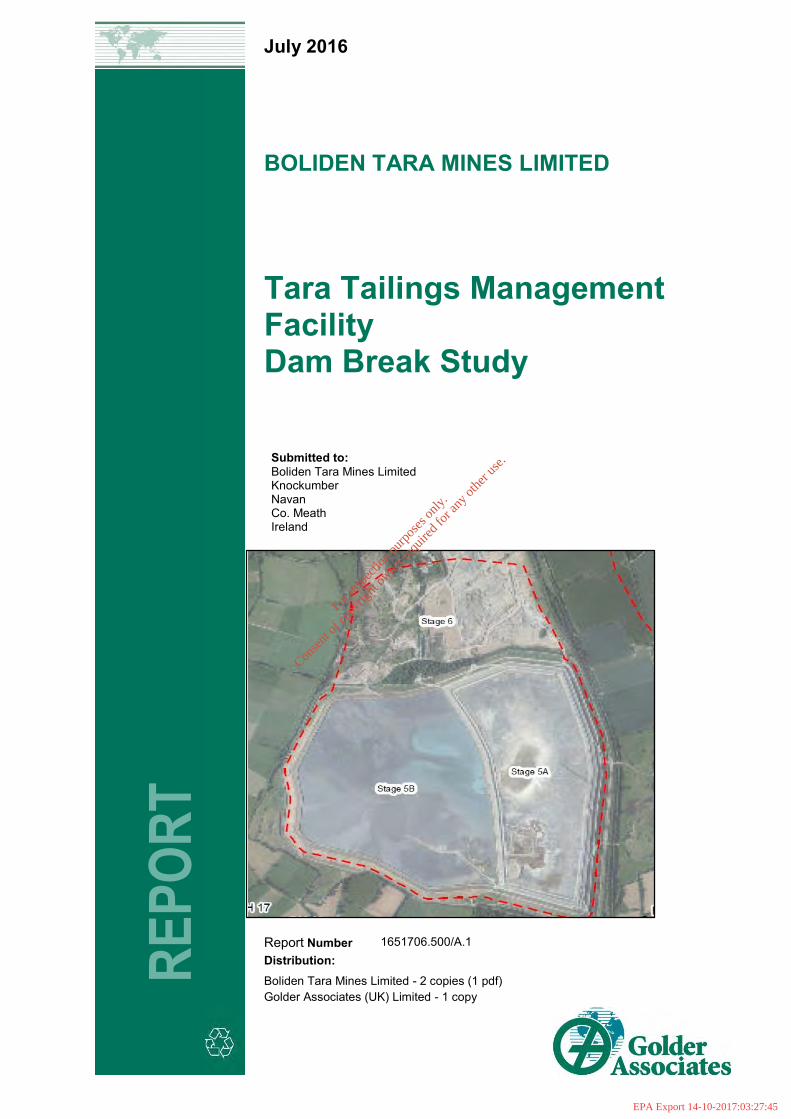
July 2016
BOLIDEN TARA MINES LIMITED
Tara Tailings Management Facility Dam Break Study
RE
PO
RT
Report Number 1651706.500/A.1
Distribution: Boliden Tara Mines Limited - 2 copies (1 pdf) Golder Associates (UK) Limited - 1 copy
Submitted to: Boliden Tara Mines Limited Knockumber Navan Co. Meath Ireland
For
insp
ectio
n pur
pose
s only
.
Conse
nt of
copy
right
owne
r req
uired
for a
ny ot
her u
se.
EPA Export 14-10-2017:03:27:45

TARA TMF DAM BREAK STUDY
July 2016 Report No. 1651706.500/A.1 i
Table of Contents
1.0 INTRODUCTION ........................................................................................................................................................ 1
2.0 BACKGROUND ......................................................................................................................................................... 1
3.0 DAM BREAK MODELLING ....................................................................................................................................... 2
3.1 Dam Break Modelling Process...................................................................................................................... 2
3.1.1 Dam Break Parameters ........................................................................................................................... 2
3.2 Model Results – Dam Break Hydrographs .................................................................................................... 4
3.3 Flood Routing ............................................................................................................................................... 5
3.3.1 Model Inputs ........................................................................................................................................... 5
3.4 Model Results – Flood Routing ..................................................................................................................... 5
3.5 Limitations .................................................................................................................................................... 7
4.0 CONCLUSIONS ......................................................................................................................................................... 8
5.0 REFERENCES ........................................................................................................................................................... 8
TABLES Table 1: Dam Break Parameters ......................................................................................................................................... 4
Table 2: TUFLOW Model Inputs .......................................................................................................................................... 5
Table 3: Model Outputs ....................................................................................................................................................... 6
FIGURES Figure 1: TMF Layout .......................................................................................................................................................... 1
Figure 2: Rainfall Data......................................................................................................................................................... 3
Figure 3: Dam Break Hydrographs ...................................................................................................................................... 4
APPENDICES APPENDIX A Drawings
APPENDIX B Dam Break Video Files (CD)
For
insp
ectio
n pur
pose
s only
.
Conse
nt of
copy
right
owne
r req
uired
for a
ny ot
her u
se.
EPA Export 14-10-2017:03:27:45
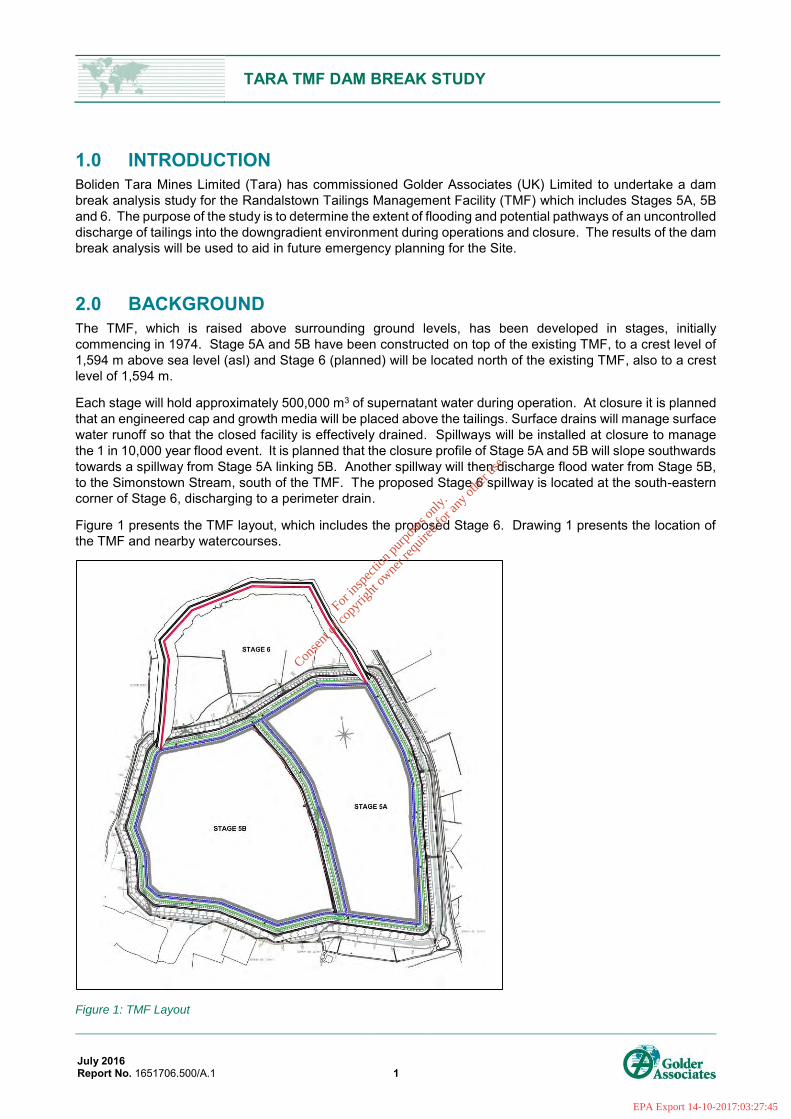
TARA TMF DAM BREAK STUDY
July 2016 Report No. 1651706.500/A.1 1
1.0 INTRODUCTION Boliden Tara Mines Limited (Tara) has commissioned Golder Associates (UK) Limited to undertake a dam break analysis study for the Randalstown Tailings Management Facility (TMF) which includes Stages 5A, 5B and 6. The purpose of the study is to determine the extent of flooding and potential pathways of an uncontrolled discharge of tailings into the downgradient environment during operations and closure. The results of the dam break analysis will be used to aid in future emergency planning for the Site.
2.0 BACKGROUND The TMF, which is raised above surrounding ground levels, has been developed in stages, initially commencing in 1974. Stage 5A and 5B have been constructed on top of the existing TMF, to a crest level of 1,594 m above sea level (asl) and Stage 6 (planned) will be located north of the existing TMF, also to a crest level of 1,594 m.
Each stage will hold approximately 500,000 m3 of supernatant water during operation. At closure it is planned that an engineered cap and growth media will be placed above the tailings. Surface drains will manage surface water runoff so that the closed facility is effectively drained. Spillways will be installed at closure to manage the 1 in 10,000 year flood event. It is planned that the closure profile of Stage 5A and 5B will slope southwards towards a spillway from Stage 5A linking 5B. Another spillway will then discharge flood water from Stage 5B, to the Simonstown Stream, south of the TMF. The proposed Stage 6 spillway is located at the south-eastern corner of Stage 6, discharging to a perimeter drain.
Figure 1 presents the TMF layout, which includes the proposed Stage 6. Drawing 1 presents the location of the TMF and nearby watercourses.
Figure 1: TMF Layout
For
insp
ectio
n pur
pose
s only
.
Conse
nt of
copy
right
owne
r req
uired
for a
ny ot
her u
se.
EPA Export 14-10-2017:03:27:45
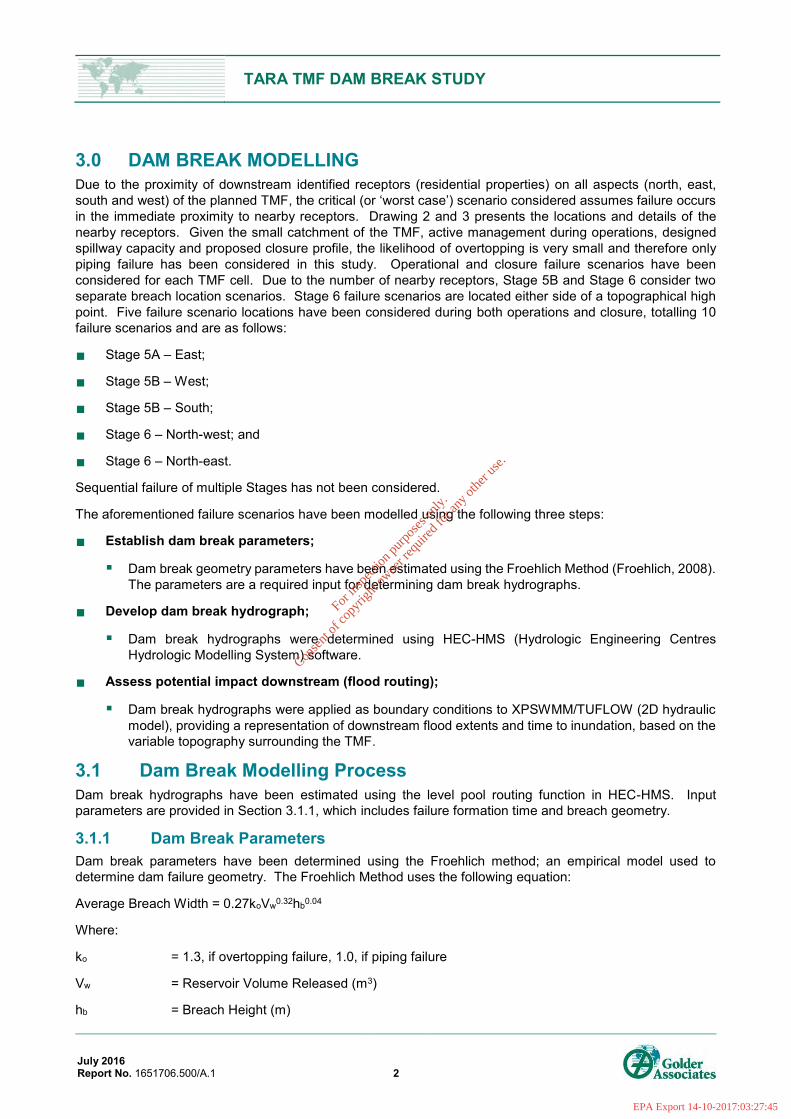
TARA TMF DAM BREAK STUDY
July 2016 Report No. 1651706.500/A.1 2
3.0 DAM BREAK MODELLING Due to the proximity of downstream identified receptors (residential properties) on all aspects (north, east, south and west) of the planned TMF, the critical (or ‘worst case’) scenario considered assumes failure occurs in the immediate proximity to nearby receptors. Drawing 2 and 3 presents the locations and details of the nearby receptors. Given the small catchment of the TMF, active management during operations, designed spillway capacity and proposed closure profile, the likelihood of overtopping is very small and therefore only piping failure has been considered in this study. Operational and closure failure scenarios have been considered for each TMF cell. Due to the number of nearby receptors, Stage 5B and Stage 6 consider two separate breach location scenarios. Stage 6 failure scenarios are located either side of a topographical high point. Five failure scenario locations have been considered during both operations and closure, totalling 10 failure scenarios and are as follows:
Stage 5A – East;
Stage 5B – West;
Stage 5B – South;
Stage 6 – North-west; and
Stage 6 – North-east.
Sequential failure of multiple Stages has not been considered.
The aforementioned failure scenarios have been modelled using the following three steps:
Establish dam break parameters;
Dam break geometry parameters have been estimated using the Froehlich Method (Froehlich, 2008). The parameters are a required input for determining dam break hydrographs.
Develop dam break hydrograph;
Dam break hydrographs were determined using HEC-HMS (Hydrologic Engineering Centres Hydrologic Modelling System) software.
Assess potential impact downstream (flood routing);
Dam break hydrographs were applied as boundary conditions to XPSWMM/TUFLOW (2D hydraulic model), providing a representation of downstream flood extents and time to inundation, based on the variable topography surrounding the TMF.
3.1 Dam Break Modelling Process Dam break hydrographs have been estimated using the level pool routing function in HEC-HMS. Input parameters are provided in Section 3.1.1, which includes failure formation time and breach geometry.
3.1.1 Dam Break Parameters Dam break parameters have been determined using the Froehlich method; an empirical model used to determine dam failure geometry. The Froehlich Method uses the following equation:
Average Breach Width = 0.27koVw0.32hb0.04
Where:
ko = 1.3, if overtopping failure, 1.0, if piping failure
Vw = Reservoir Volume Released (m3)
hb = Breach Height (m)
For
insp
ectio
n pur
pose
s only
.
Conse
nt of
copy
right
owne
r req
uired
for a
ny ot
her u
se.
EPA Export 14-10-2017:03:27:45

TARA TMF DAM BREAK STUDY
July 2016 Report No. 1651706.500/A.1 3
Side slope = 1.0, if overtopping failure, 0.7, if piping failure.
The dam break geometry for each scenario is presented in Table 1.
The volume of tailings released from the facility is based on the methodology presented in Tailings mobilization
estimates for dam breach studies (Knight Piesold, 2015) and the Froehlich Method (2008). The mass of mobilized tailings is estimated assuming full mixing of supernatant water, with the tailings solids and interstitial water at a selected solids content. In this instance, instantaneous mixing at 65% solids content by mass has been applied, which is considered a conservative upper limit to Newtonian-like fluid behaviour. The supernatant water also includes the 24 hour 10,000 year return period rainfall event which is based on Met Eireann rainfall data for Randalstown. The Met Eireann rainfall frequency analysis data yields a 24 hour 10,000 year rainfall event of 210 mm (Figure 2).
Figure 2: Rainfall Data
Failure formation time has been estimated using the equation developed by Froehlich (2008). The equation is presented below:
𝑇 = 0.0175√𝑉𝑤
𝑔𝐻𝑏2
Vw = Reservoir Volume Released (m3)
hb = Breach Height (m)
g = gravity (m/s2)
Breach depth is based on the current crest elevation of 1,594 masl, which also applies to the closure scenario. Breach formation times are presented in Table 1.
For
insp
ectio
n pur
pose
s only
.
Conse
nt of
copy
right
owne
r req
uired
for a
ny ot
her u
se.
EPA Export 14-10-2017:03:27:45

TARA TMF DAM BREAK STUDY
July 2016 Report No. 1651706.500/A.1 4
Table 1: Dam Break Parameters
Scenario
Total Volume Released (Mm3) 1
Supernatant Water (Mm3)
24hr 10,000 yr Rainfall (Mm3)
Breach height (m)
Failure Formation Time (hr)
Side Slope (1:H)
Breach Base Width (m)
Stage 5A, Operation 2.711 0.5 0.126 20 0.46 0.7 20.8
Stage 5A, Closure 0.547 - 0.126 20 0.21 0.7 6.9
Stage 5B, Operation 2.893 0.5 0.168 20 0.48 0.7 21.6
Stage 5B, Closure 0.729 - 0.168 20 0.22 0.7 8.9
Stage 6, Operation 2.694 0.5 0.122 20 0.46 0.7 20.8
Stage 6, Closure 0.530 - 0.122 20 0.2 0.7 6.7
1 Total volume releases includes supernatant water stored (500,000 m3), water stored in the tailings (estimated
at 65% solids content) and the 24 hour 10,000 year return period rainfall event for Randalstown (210 mm depth).
3.2 Model Results – Dam Break Hydrographs The level-pool routing function in HEC-HMS was used to generate dam break hydrographs based on the parameters presented in Table 1 (breach geometry and failure formation time). Figure 3 below presents the hydrographs derived from the HEC-HMS modelling that were subsequently applied to the XPSWMM/TUFLOW model as an upstream boundary condition.
Figure 3: Dam Break Hydrographs
For
insp
ectio
n pur
pose
s only
.
Conse
nt of
copy
right
owne
r req
uired
for a
ny ot
her u
se.
EPA Export 14-10-2017:03:27:45

TARA TMF DAM BREAK STUDY
July 2016 Report No. 1651706.500/A.1 5
Peak flow is greater during operation due to the large volume of water contained within the TMF, primarily supernatant water. Note that dam break models are very sensitive to each of the input parameters, particularly the formation time; reducing the formation time of the failure and keeping all other parameters equal can lead to significantly higher peak flows.
3.3 Flood Routing Flood routing downstream of a breach from the TMF has been modelled using XPSWMM/TUFLOW. TUFLOW is a 2D flood and tide simulation model. The 2D solution, which has been utilised to model flood routing of a dam break, simulates the hydrodynamics of floods based on the Stelling finite difference, alternating direction implicit (ADI) scheme that solves the full 2D free surface shallow water equations.
3.3.1 Model Inputs The model was constructed using a grid where each point represents the modelled topography. The hydrographs applied to the model are presented in Figure 3. Flow is then calculated between each cell. Model inputs are provided in Table 2.
Table 2: TUFLOW Model Inputs
Parameter Model Input Comments Sources
2D Grid 12 m Cell Size Digital Elevation Model (DEM) Tara Time Step 3 seconds - -
Downstream Boundary Condition
Located approximately 3 - 4 km downstream, along River Blackwater.
Downstream boundary condition set to automatically calculate based on Manning’s equation (Manning’s is an empirical formula used for estimating open channel flow and is a function of channel velocity, flow area, surface roughness and channel slope.) and a downstream slope, derived from the DEM, of 0.005 m/m.
-
Upstream Boundary Condition
Hydrographs developed using HEC-HMS.
See Section 3.1.2. -
Roughness 0.05
A relatively high Manning’s coefficient (resistance of ground surface to the flow of water) was selected for the surrounding land use (arable and pasture) due to the presence of mobilised tailings.
HEC-RAS Hydraulic Reference Manual (HEC-RAS, 2010).
The Yellow River and Simonstown Stream have been modelled in 2D by cutting the stream into the DEM. The interceptor ditch circumnavigating the existing Stage 5A and 5B has been extended around the proposed Stage 6 of the TMF. A bund along the northern extent of the Site has also been incorporated into the model by raising ground levels by 2 m.
The River Blackwater is represented in the model by the data from the DEM. It is assumed the DEM provides the elevation of the water surface at the time of survey. It has therefore not been possible to fully assess the flow in the River Blackwater i.e. tailings and river flow. The likely impact on flows in the Blackwater have been quantified later in this report.
3.4 Model Results – Flood Routing The maximum extent and depth of flooding is presented in Drawings 3 to 13.
Table 3 provides a summary of modelling results and flood propagation for various locations downstream of the TMF. These locations are presented in Drawings 3 to 13.
For
insp
ectio
n pur
pose
s only
.
Conse
nt of
copy
right
owne
r req
uired
for a
ny ot
her u
se.
EPA Export 14-10-2017:03:27:45

TARA TMF DAM BREAK STUDY
July 2016 Report No. 1651706.500/A.1 6
Table 3: Model Outputs
Section Line West South East RB1 RB2
Stage 5A, Dam Break East, Operation Phase, Drawing 4
Peak Flow (m3/s) 4 160 500 25 180 Available Flood Warning (minutes)* 53 15 5 53 60
Number of Properties Impacted 9 receptor locations (RH1 to RH6) and (RH83 to RH86)
Stage 5A, Dam Break East, Closure, Drawing 5
Peak Flow (m3/s) - 70 250 4 20 Available Flood Warning (minutes)* - 13 4 60 75
Number of Properties Impacted 3 receptors locations (RH84, RH85 and RH86)
Stage 5B Dam Break West, Operation Phase, Drawing 6
Peak Flow (m3/s) 1,170 21 - 580 360 Available Flood Warning (minutes)* 10 36 - 27 39
Number of Properties Impacted 1 receptor locations (RH18)
Stage 5B Dam Break West, Closure Phase, Drawing 7
Peak Flow (m3/s) 560 16 - 135 84 Available Flood Warning (minutes)* 8 38 - 25 43
Number of Properties Impacted 1 receptor locations (RH18)
Stage 5B Dam Break South, Operation Phase, Drawing 8
Peak Flow (m3/s) 27 1,400 - 50 240 Available Flood Warning (minutes)* 27 8 35 39
Number of Properties Impacted 7 receptor locations (RH1 to RH7)
Stage 5B Dam Break South, Closure Phase, Drawing 9
Peak Flow (m3/s) 13 710 - 7 41 Available Flood Warning (minutes)* 29 6 - 35 45
Number of Properties Impacted 4 (RH3 to RH6)
Stage 6 Dam Break North-west, Operation Phase, Drawing 10
Peak Flow (m3/s) 1,000 50 35 450 300 Available Flood Warning (minutes)* 24 55 37 42 55
Number of Properties Impacted 6 (RH18, RH19, RH23, RH24, RH48 and RH49)
Stage 6 Dam Break North-west, Closure Phase, Drawing 11
Peak Flow (m3/s) 120 20 10 40 40 Available Flood Warning (minutes)* 23 60 39 54 92
For
insp
ectio
n pur
pose
s only
.
Conse
nt of
copy
right
owne
r req
uired
for a
ny ot
her u
se.
EPA Export 14-10-2017:03:27:45
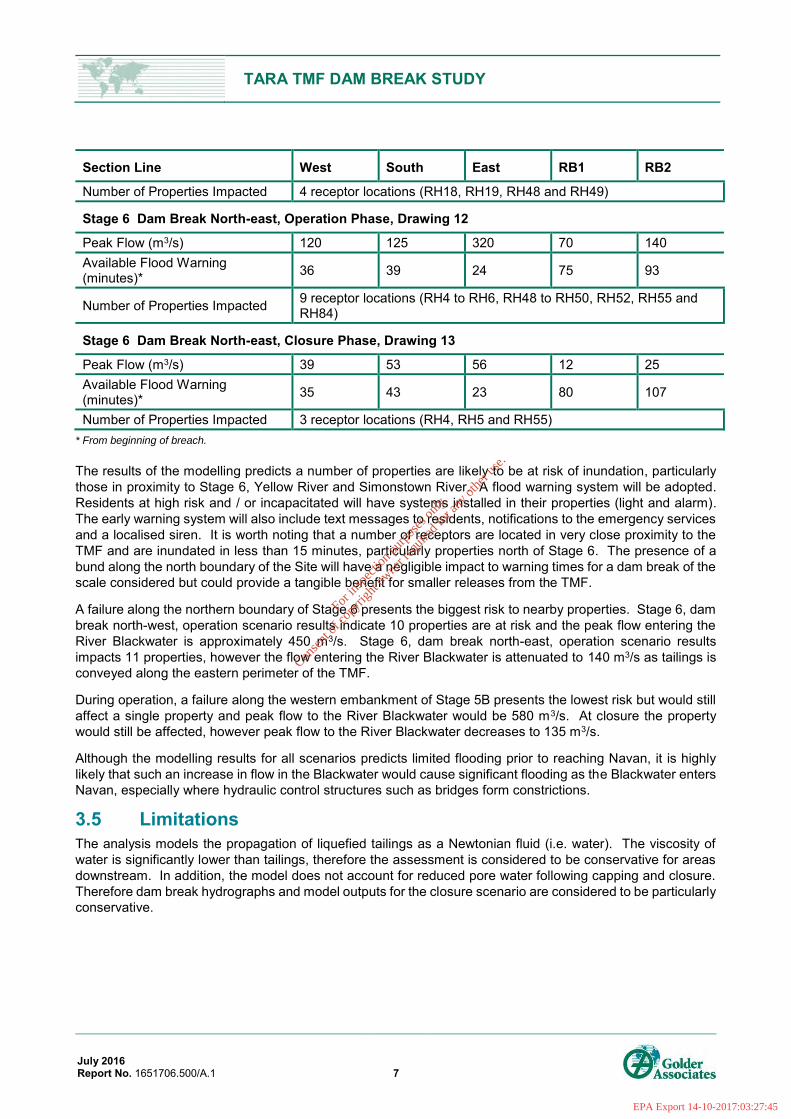
TARA TMF DAM BREAK STUDY
July 2016 Report No. 1651706.500/A.1 7
Section Line West South East RB1 RB2
Number of Properties Impacted 4 receptor locations (RH18, RH19, RH48 and RH49)
Stage 6 Dam Break North-east, Operation Phase, Drawing 12
Peak Flow (m3/s) 120 125 320 70 140 Available Flood Warning (minutes)* 36 39 24 75 93
Number of Properties Impacted 9 receptor locations (RH4 to RH6, RH48 to RH50, RH52, RH55 and RH84)
Stage 6 Dam Break North-east, Closure Phase, Drawing 13
Peak Flow (m3/s) 39 53 56 12 25 Available Flood Warning (minutes)* 35 43 23 80 107
Number of Properties Impacted 3 receptor locations (RH4, RH5 and RH55) * From beginning of breach.
The results of the modelling predicts a number of properties are likely to be at risk of inundation, particularly those in proximity to Stage 6, Yellow River and Simonstown River. A flood warning system will be adopted. Residents at high risk and / or incapacitated will have systems installed in their properties (light and alarm). The early warning system will also include text messages to residents, notifications to the emergency services and a localised siren. It is worth noting that a number of receptors are located in very close proximity to the TMF and are inundated in less than 15 minutes, particularly properties north of Stage 6. The presence of a bund along the north boundary of the Site will have a negligible impact to warning times for a dam break of the scale considered but could provide a tangible benefit for smaller releases from the TMF.
A failure along the northern boundary of Stage 6 presents the biggest risk to nearby properties. Stage 6, dam break north-west, operation scenario results indicate 10 properties are at risk and the peak flow entering the River Blackwater is approximately 450 m3/s. Stage 6, dam break north-east, operation scenario results impacts 11 properties, however the flow entering the River Blackwater is attenuated to 140 m3/s as tailings is conveyed along the eastern perimeter of the TMF.
During operation, a failure along the western embankment of Stage 5B presents the lowest risk but would still affect a single property and peak flow to the River Blackwater would be 580 m3/s. At closure the property would still be affected, however peak flow to the River Blackwater decreases to 135 m3/s.
Although the modelling results for all scenarios predicts limited flooding prior to reaching Navan, it is highly likely that such an increase in flow in the Blackwater would cause significant flooding as the Blackwater enters Navan, especially where hydraulic control structures such as bridges form constrictions.
3.5 Limitations The analysis models the propagation of liquefied tailings as a Newtonian fluid (i.e. water). The viscosity of water is significantly lower than tailings, therefore the assessment is considered to be conservative for areas downstream. In addition, the model does not account for reduced pore water following capping and closure. Therefore dam break hydrographs and model outputs for the closure scenario are considered to be particularly conservative.
For
insp
ectio
n pur
pose
s only
.
Conse
nt of
copy
right
owne
r req
uired
for a
ny ot
her u
se.
EPA Export 14-10-2017:03:27:45
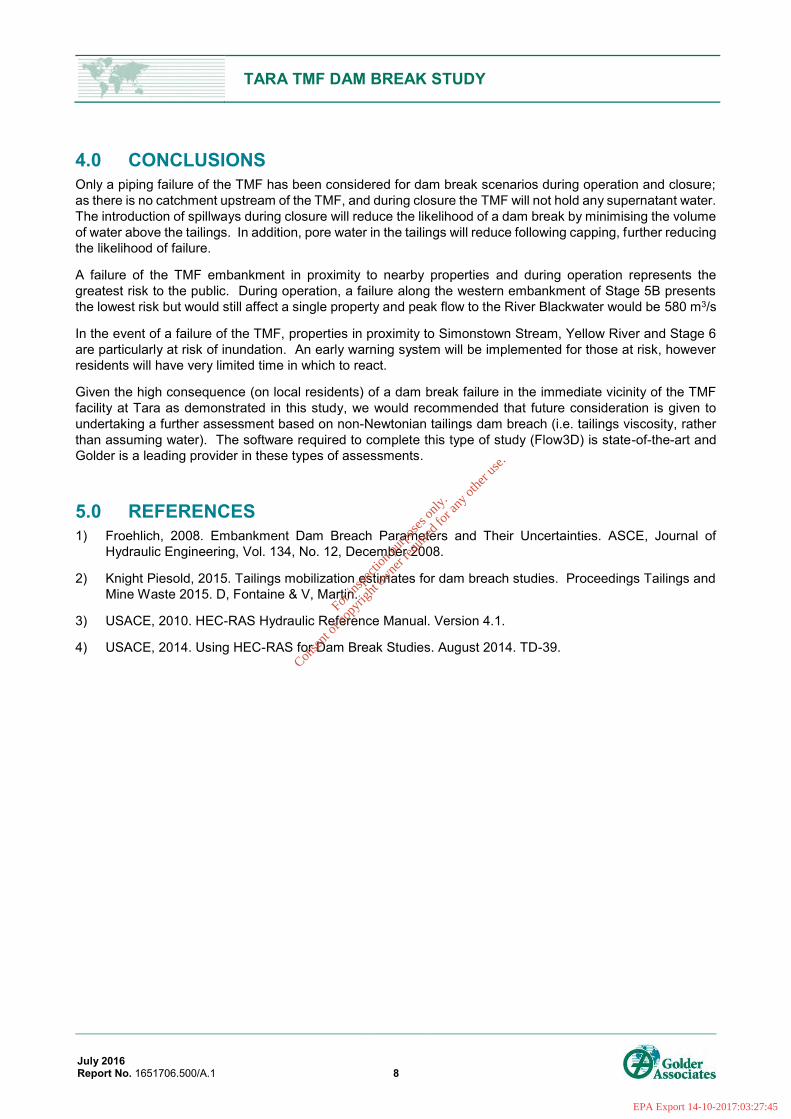
TARA TMF DAM BREAK STUDY
July 2016 Report No. 1651706.500/A.1 8
4.0 CONCLUSIONS Only a piping failure of the TMF has been considered for dam break scenarios during operation and closure; as there is no catchment upstream of the TMF, and during closure the TMF will not hold any supernatant water. The introduction of spillways during closure will reduce the likelihood of a dam break by minimising the volume of water above the tailings. In addition, pore water in the tailings will reduce following capping, further reducing the likelihood of failure.
A failure of the TMF embankment in proximity to nearby properties and during operation represents the greatest risk to the public. During operation, a failure along the western embankment of Stage 5B presents the lowest risk but would still affect a single property and peak flow to the River Blackwater would be 580 m3/s
In the event of a failure of the TMF, properties in proximity to Simonstown Stream, Yellow River and Stage 6 are particularly at risk of inundation. An early warning system will be implemented for those at risk, however residents will have very limited time in which to react.
Given the high consequence (on local residents) of a dam break failure in the immediate vicinity of the TMF facility at Tara as demonstrated in this study, we would recommended that future consideration is given to undertaking a further assessment based on non-Newtonian tailings dam breach (i.e. tailings viscosity, rather than assuming water). The software required to complete this type of study (Flow3D) is state-of-the-art and Golder is a leading provider in these types of assessments.
5.0 REFERENCES 1) Froehlich, 2008. Embankment Dam Breach Parameters and Their Uncertainties. ASCE, Journal of
Hydraulic Engineering, Vol. 134, No. 12, December 2008.
2) Knight Piesold, 2015. Tailings mobilization estimates for dam breach studies. Proceedings Tailings and Mine Waste 2015. D, Fontaine & V, Martin.
3) USACE, 2010. HEC-RAS Hydraulic Reference Manual. Version 4.1.
4) USACE, 2014. Using HEC-RAS for Dam Break Studies. August 2014. TD-39.
For
insp
ectio
n pur
pose
s only
.
Conse
nt of
copy
right
owne
r req
uired
for a
ny ot
her u
se.
EPA Export 14-10-2017:03:27:45

TARA TMF DAM BREAK STUDY
July 2016 Report No. 1651706.500/A.1
Report Signature Page
GOLDER ASSOCIATES (UK) LTD
Brian Keenan Matt Goode Engineer Senior Hydrologist
08 July 2016
BK/MG/ar
Company Registered in England No.1125149. At Attenborough House, Browns Lane Business Park, Stanton-on-the-Wolds, Nottinghamshire NG12 5BL VAT No. 209 0084 92 Golder, Golder Associates and the GA globe design are trademarks of Golder Associates Corporation.
For in
spec
tion p
urpo
ses o
nly.
Conse
nt of
copy
right
owne
r req
uired
for a
ny ot
her u
se.
EPA Export 14-10-2017:03:27:45
TARA TMF DAM BREAK STUDY
July 2016 Report No. 1651706.500/A.1
APPENDIX A Drawings
For
insp
ectio
n pur
pose
s only
.
Conse
nt of
copy
right
owne
r req
uired
for a
ny ot
her u
se.
EPA Export 14-10-2017:03:27:45
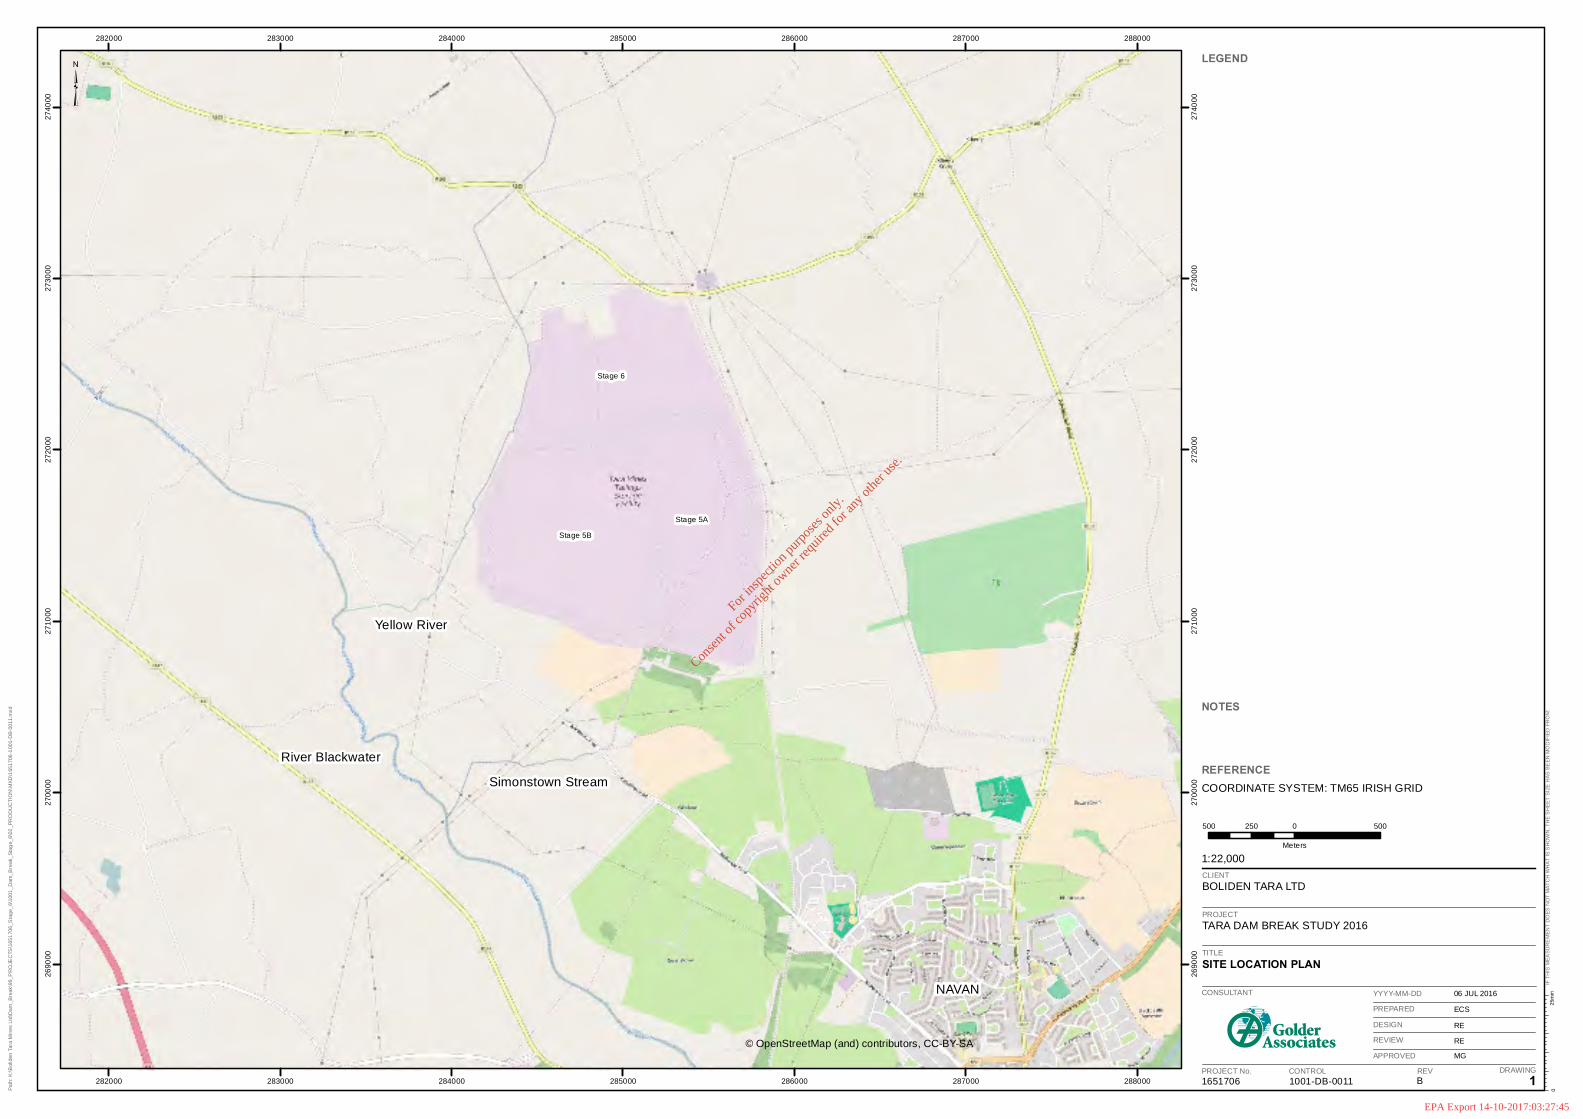
282000
282000
283000
283000
284000
284000
285000
285000
286000
286000
287000
287000
288000
288000
26
90
00
26
90
00
27
00
00
27
00
00
27
10
00
27
10
00
27
20
00
27
20
00
27
30
00
27
30
00
27
40
00
27
40
00
CLIENT
BOLIDEN TARA LTD
LEGEND
NOTES
REFERENCECOORDINATE SYSTEM: TM65 IRISH GRID
PROJECT
TARA DAM BREAK STUDY 2016
TITLE
SITE LOCATION PLAN
1651706 1001-DB-0011 B 1
06 JUL 2016
ECS
RE
RE
MG
Path
: K
:\B
olid
en T
ara
Min
es
Ltd
\Dam
_B
reak\9
9_P
RO
JEC
TS
\1651
706_S
tage_
6\1
001
_D
am
_B
reak_S
tag
e_6\0
2_P
RO
DU
CT
ION
\MX
D\1
651706
-1001-D
B-0
011.m
xd
IF T
HIS
ME
AS
UR
EM
EN
T D
OE
S N
OT
MA
TC
H W
HA
T I
S S
HO
WN
, T
HE
SH
EE
T S
IZE
HA
S B
EE
N M
OD
IFIE
D F
RO
M:
CONSULTANT
PROJECT No. CONTROL REV DRAWING
YYYY-MM-DD
PREPARED
DESIGN
REVIEW
APPROVED
25m
m0
1:22,000
500 0 500250
Meters
³
Stage 5A
River Blackwater
© OpenStreetMap (and) contributors, CC-BY-SA
Stage 6
Stage 5B
NAVAN
Simonstown Stream
Yellow River
For
insp
ectio
n pur
pose
s only
.
Conse
nt of
copy
right
owne
r req
uired
for a
ny ot
her u
se.
EPA Export 14-10-2017:03:27:45

RH 5RH 4 RH65
RH 9
RH 8
RH 7RH 6
RH 3RH 2RH 1
RH 85RH 84
RH 79
RH 78
RH 58
RH 49
RH 35
RH 31RH 30
RH 29
RH 99RH 98
RH 97
RH 96RH 95
RH 94
RH 93
RH 92
RH 91RH 90
RH 89
RH 87
RH 86
RH 83
RH 82RH 81
RH 76
RH 75
RH 74
RH 73RH 72 RH 71
RH 70RH 69
RH 68RH 63
RH 62
RH 61
RH 60
RH 59
RH 57
RH 56
RH 55
RH 54RH 53
RH 52RH 51
RH 50
RH 48
RH 47RH 46RH 45
RH 44
RH 43RH 42
RH 40
RH 39
RH 38RH 37
RH 36
RH 34
RG 33
RH 28RH 27
RH 26RH 25 RH 24
RH 22
RH 21
RH 20
RH 19
RH 18
RH 17
RH 16RH 15
RH 14
RH 13
RH 123
RH 122RH 121
RH 120
RH 119RH 118
RH 117
RH 107RH 104
RH 102
RH 100
282000
282000
283000
283000
284000
284000
285000
285000
286000
286000
287000
287000
288000
288000
26
90
00
26
90
00
27
00
00
27
00
00
27
10
00
27
10
00
27
20
00
27
20
00
27
30
00
27
30
00
27
40
00
27
40
00
CLIENT
BOLIDEN TARA LTD
LEGEND
Receptor
Model Boundary
NOTES
REFERENCECOORDINATE SYSTEM: TM65 IRISH GRID
PROJECT
TARA DAM BREAK STUDY 2016
TITLE
RECEPTOR LOCATIONS
1651706 1001-DB-0001 A 2
06 JUL 2016
ECS
RE
RE
MG
Path
: K
:\B
olid
en T
ara
Min
es
Ltd
\Dam
_B
reak\9
9_P
RO
JEC
TS
\1651
706_S
tage_
6\1
001
_D
am
_B
reak_S
tag
e_6\0
2_P
RO
DU
CT
ION
\MX
D\1
651706
-1001-D
B-0
00
12.m
xd
IF T
HIS
ME
AS
UR
EM
EN
T D
OE
S N
OT
MA
TC
H W
HA
T I
S S
HO
WN
, T
HE
SH
EE
T S
IZE
HA
S B
EE
N M
OD
IFIE
D F
RO
M:
CONSULTANT
PROJECT No. CONTROL REV DRAWING
YYYY-MM-DD
PREPARED
DESIGN
REVIEW
APPROVED
25m
m0
1:22,000
500 0 500250
Meters
³
Stage 5A
DS Model Boundary
Source: Esri, DigitalGlobe, GeoEye, Earthstar Geographics, CNES/Airbus DS, USDA,
USGS, AEX, Getmapping, Aerogrid, IGN, IGP, swisstopo, and the GIS User Community
Stage 6
Stage 5B
NAVAN
River Blackwater
Simonstown
Stream
Yellow
River
For
insp
ectio
n pur
pose
s only
.
Conse
nt of
copy
right
owne
r req
uired
for a
ny ot
her u
se.
EPA Export 14-10-2017:03:27:45

ReceptorReference Number
Dwelling No Name Address Address Line 1 Address Line 2 East NorthReceptorReference Number
Dwelling No Name Address Address Line 1 Address Line 2 East North
RH 1 1476 Paddy & Mary Gore Randalstown NAVAN 284866.719 270290.16
RH 2 1477 Joe & Geraldine Fitzpatrick Randalstown NAVAN 284815.000 270263.75
RH 3 1441 Siobhan & Lorcan O'Dowd Randal Lodge, Randalstown RANDALSTOWN NAVAN 284780.156 270353.47
RH 6 1479 Richie & Grainne Cahill Randalstown DONAGHPATRICK CO. MEATH 284543.156 270453.75
RH 7 706 Mrs. Smith Randalstown DONAGHPATRICK CO. MEATH 284510.438 270475.91
RH 8 1443 Sarah & Nathan Doyle Randalstown RANDALSTOWN NAVAN 284381.844 270574.97
RH 9 1444 Pat Kennedy Randalstown DONAGHPATRICK CO. MEATH 284360.094 270656.81
RH 10 1442 Aidan & Sarah Kennedy Randalstown DONAGHPATRICK CO. MEATH 284273.875 270592.38
RH 11 1480 Phillip & Geraldine O'Dea Randalstown DONAGHPATRICK CO. MEATH 284248.625 270608.94
RH 12 280 Mr. Ennis Randalstown RANDALSTOWN NAVAN 284281.031 270673.22
RH 13 267 Brendan & Susan O' Neill Mulleard NAVAN 283947.000 270347.34
RH 14 1445 Vacant - Duignan's Tatestown DONAGHPATRICK CO. MEATH 284204.219 270664.66
RH 15 707 Eimear & Karl Brennan Tatestown DONAGHPATRICK CO. MEATH 284176.594 270680.81
RH 16 910 Dympna & M ichael Dolan Tatestown NAVAN 284146.750 270695.13
RH 17 713 Phillip & Mary Brady Tatestown NAVAN 283876.781 270775.09
RH 18 1446 Kevin & Geraldine Thompson Riverview House, Tatestown TATESTOWN CO. MEATH 283659.188 270955.53
RH 19 1447 Jack Smith Tatestown NAVAN 283419.625 271488.28
RH 20 555 Dick & Eithne Brady Tatestown Lodge, Tatestown NAVAN 283252.719 271653.94
RH 21 1530 John & Majella Brady Tatestown TATESTOWN CO. MEATH 283194.031 271707.31
RH 22 786 John & Mary Boyle Tatestown NAVAN 283047.188 271867.84
RH 23 1481 Joan & Pat O'Toole Tatestown NAVAN 282973.125 271919.78
RH 24 1411 Michael & Patsy Monaghan Tatestown NAVAN 282945.313 271929.03
RH 25 1412 Mrs Kelly Tatestown NAVAN 282866.063 272004.06
RH 26 1413 Paul & Joanne Fisher Tatestown NAVAN 282821.375 271972.88
RH 27 1482 John & Orla Molloy Tatestown NAVAN 282741.313 272010.81
RH 28 1414 Raymond Quail Tatestown NAVAN 282538.781 272061.31
RH 32 1483 Paul Byrne Tatestown NAVAN 282245.063 272414.31
RG 33 714 Aidan & Mary Jordan Tatestown NAVAN 282161.438 272471.63
RH 34 1494 Tom & Carol Noonan Tatestown DONAGHPATRICK CO. MEATH 282097.719 272452.91
RH 36 553 Mr. & Mrs. Kevin Martin Tatestown DONAGHPATRICK CO. MEATH 282076.031 272565.69
RH 37 1493 Mr. Eddie Joyce Donaghpatrick DONAGHPATRICK CO. MEATH 282064.219 272758.09
RH 38 1431 Mr. Johnny Joyce Donaghpatrick DONAGHPATRICK CO. MEATH 282568.000 272869.28
RH 39 1455 Thomas & Mandy Maree Donaghpatrick DONAGHPATRICK CO. MEATH 282641.094 272873.59
RH 40 1531 John & Christina Maree Donaghpatrick DONAGHPATRICK CO. MEATH 282719.531 272878.22
RH 41 1429 Mrs. Catherine Lally Donaghpatrick DONAGHPATRICK CO. MEATH 282750.281 272903.41
RH 42 1430 Mr. Tommy Henehan Donaghpatrick DONAGHPATRICK CO. MEATH 282762.781 272827.44
RH 43 1454 Dick Brady Donaghpatrick DONAGHPATRICK CO. MEATH 282998.719 272790.47
RH 44 1428 Sean & Ann Lally Donaghpatrick DONAGHPATRICK CO. MEATH 283082.531 272816.41
RH 45 1427 Thomas & Nora Lally Donaghpatrick DONAGHPATRICK CO. MEATH 283113.125 272804.56
RH 46 1453 Peter Brady Donaghpatrick DONAGHPATRICK CO. MEATH 283379.500 272831.78
RH 47 720 Dick Brady Donaghpatrick DONAGHPATRICK CO. MEATH 283391.063 272781.88
RH 48 1426 John & Olive Kiely Randalstown DONAGHPATRICK CO. MEATH 284719.063 272879.84
RH 50 1423 Renter Woodview Lodge RANDALSTOWN NAVAN 285041.478 273029.91
RH 51 1422 Benny Sheridan Woodview House RANDALSTOWN NAVAN 285131.969 273208.31
RH 52 178 Gabriel Caldwell Randalstown DONAGHPATRICK CO. MEATH 284918.469 273148.72
RH 53 1451 Gerry Cauldwell Randalstown DONAGHPATRICK CO. MEATH 284685.781 273245.19
RH 54 1421 Kevin Ward Randalstown DONAGHPATRICK CO. MEATH 284677.781 273309.16
RH 55 1384 Willie Noonan Randalstown NAVAN 285296.469 272881.38
RH 56 1383 Padraic Heaney Randalstown NAVAN 285683.406 272996.75
RH 57 1450 Fiacra & Mary O'Cinneide Randalstown SILLOGUE CO. MEATH 285823.750 272902.59
RH 59 1382 Cynthia & Eamonn Dempsey Randalstown SILLOGUE CO. MEATH 285939.531 273068.13
RH 60 1380 Mrs. Rose Heaney Randalstown NAVAN 286147.531 273140.06
RH 61 1381 Mrs. Finnegan Randalstown NAVAN 286250.656 272895.56
RH 62 1449 Mr. & Mrs. Thomas Finnegan Randalstown SILLOGUE NAVAN 286326.594 273074.94
RH 63 195 David Mullin Proudstown NAVAN 287365.719 270281.34
RH 64 190 Paul Mc Donagh Proudstown NAVAN 287348.125 270346.13
RH65 191 Brendan O'Reilly Proudstown PROUDSTOWN CO. MEATH 287321.750 270350.91
RH 67 192 Gerry Mc Donagh Proudstown NAVAN 287289.781 270354.13
RH 68 193 Mike O'Shea Proudstown NAVAN 287257.781 270356.50
RH 69 194 Eric Brady Proudstown NAVAN 287223.406 270362.91
RH 70 1002 Paddy Markey Proudstown NAVAN 287008.344 270311.75
RH 71 796 Keith & Tracey Brady Proudstown NAVAN 286868.344 270412.59
RH 72 967 Michael Mc Ateer Simonstown NAVAN 286648.500 270399.94
RH 73 968 Tommy Mc Ateer Simonstown NAVAN 286621.688 270409.13
RH 74 282 Pat Conroy Simonstown NAVAN 286531.000 270551.84
RH 75 281 Mrs. Callaghan Simonstown NAVAN 286546.906 270675.53
RH 76 1003 Michael Clark Simonstown NAVAN 286495.031 270733.28
RH 77 1516 Tony & Rosaemary Curran Simonstown NAVAN 286265.125 270596.97
RH 80 969 Noel Clark Simonstown NAVAN 286216.625 270639.75
RH 81 970 Raymond & Caitriona Brady Simonstown NAVAN 286051.000 270646.09
RH 82 196 Derek & Ann Lister Simonstown NAVAN 286023.469 270640.28
RH 83 197 Brendan & Claire Brady Simonstown NAVAN 285988.188 270758.94
RH 86 1005 Gerry Fitzpatrixk Simonstown NAVAN 285935.000 270508.34
RH 86 1005 Gerry Fitzpatrixk Simonstown NAVAN 285935.000 270508.34
RH 87 1000 Tony Heanay Proudstown NAVAN 287558.188 272070.16
RH 89 1399 Jimmy Connolly Proudstown NAVAN 287421.000 272538.13
RH 90 787 John & Helen Burns Windtown NAVAN 285796.781 269854.78
RH 91 506 Eithne Cantwell WIndtown NAVAN 285861.188 269787.13
RH 92 507 John Sherlock Linton House, Windtown NAVAN 285585.094 269674.38
RH 93 508 Eamon & Ann Kearney Windtown NAVAN 285444.125 269727.44
RH 94 509 Joseph Downey Windtown NAVAN 285403.656 269773.69
RH 95 510 Andy & Geraldine O'Connor Windtown NAVAN 285391.438 269802.63
RH 96 511 Martina & Gabriel Hamilton Windtown NAVAN 285350.313 269848.88
RH 97 512 Mary & Ciaran Mangan Rathaldron NAVAN 285301.469 269934.34
RH 98 1440 Helen Duignan Rathaldron NAVAN 285051.875 270067.09
RH 99 1478 Bernie Ladd & Brian Collins Rathaldron NAVAN 285041.281 270089.69
RH 100 996 Jim Mc Hugh Rathaldron NAVAN 285018.688 270112.84
RH 101 997 Meath Disabilities Services Shalimar House, Rathaldron RATHALDRON CO. MEATH 285000.188 270129.47
RH 102 708 Padraig & Louise Fitzsimons Rathaldron NAVAN 284887.031 270154.50
RH 103 489 O'Briens 1 Windtown KINGDOM HALL NAVAN 285701.813 269569.59
RH 104 490 Kingdom Hall 2 Windtown NAVAN 285685.906 269578.47
RH 105 491 Mr. & Mrs. Muffit 3 Windtown NAVAN 285724.188 269586.75
RH 106 492 Fr. Ray Husband 4 Windtown NAVAN 285728.469 269596.53
RH 107 493 Mrs. Shiela Joyce 5 Windtown NAVAN 285734.594 269626.53
RH 108 494 Mrs. Johnston 6 Windtown NAVAN 285730.875 269651.31
RH 109 495 Mr. Wogan 7 Windtown NAVAN 285737.000 269660.81
RH 110 496 Mrs. Mc Ateer 8 Windtown NAVAN 285754.156 269674.88
RH 111 497 Mr. & Mrs. Markey 9 Windtown (Rosewood) NAVAN 285779.281 269671.22
RH 112 498 Mr. Jack Meighan 10 Windtown NAVAN 285803.000 269672.00
RH 113 499 Ms. Bridget & Kathleen Walsh 11 Windtown NAVAN 285813.406 269676.28
RH 114 500 Mr. Cassidy (2 brothers) 12 Windtown NAVAN 285834.250 269683.03
RH 115 501 Mrs. Baker 13 Windtown NAVAN 285845.250 269687.31
RH 116 502 Mrs. Alexander 14 Windtown NAVAN 285866.094 269694.03
RH 117 503 Mr. & Agnus Mc Govern 15 Windtown NAVAN 285878.344 269698.94
RH 118 504 Mrs. Kathleen Markey 16 Windtown NAVAN 285904.063 269696.50
RH 119 505 Mrs. Brennan 17 Windtown NAVAN 285907.719 269683.03
RH 120 484 Derelict Windtown NAVAN 285860.000 269373.91
RH 121 485 Mr. & Mrs. John Lynch Windtown NAVAN 285830.688 269395.41
RH 122 486 Tom Hoskins Windtown WINDTOWN CO. MEATH 285869.781 269458.91
RH 123 187 Mr. Colm Lynch Windtown NAVAN 287488.531 272386.59
RH 4 1700 Will Kearney Randalstown 284728.220 270349.68
RH 5 1701 Richard & Caroline Brennan Randalstown 284705.730 270366.00
RH 29 1703 Michael & Mary Corrigan Tatestown 282353.470 272180.00
RH 30 1704 David & Annmarie Cassidy Tatestown 282322.900 272227.39
RH 31 1705 Stephen Corrigan Tatestown 282318.000 272259.69
RH 35 1706 George & Julie Mc Dermott Tatestown 282023.380 272531.77
RH 49 1707 Robbie O'Brien Randalstown 284797.600 272895.31
RH 58 1708 Brian & Marie Heaney Randalstown 285895.600 273050.19
RH 78 1004 David Smith Simonstown 286210.340 270585.25
RH 79 618 John & Ann O'Hare Simonstown 286236.160 270590.47
RH 84 971 A Patsy & Rita Brady Simonstown 286003.160 270501.56
RH 85 971 B Joe & Collette Mooney Simonstown 285993.000 270510.85
TARA DAM BREAK STUDY 2016
BOLIDEN TARA LTD
025 m
m
1651706
CONTROL
1001-DB-0013
DRAWING
2
A
06 JUL 2016
ECS
BK
BK
MG
SPREADSHEET OF RECEPTOR LOCATIONS
TITLE
PROJECT NO. REV.
PROJECT
CLIENT
CONSULTANT
DESIGNED
PREPARED
REVIEWED
APPROVED
YYYY-MM-DD
Path: \\bnd1-s-m
ain01\C
AD
D_G
IS
_G
RA
PH
IC
S\B
oliden T
ara M
ines Ltd\D
am
_B
reak\99_P
RO
JE
CT
S\1651706_S
tage_6\1001_D
am
_B
reak_S
tage_6\02_P
RO
DU
CT
IO
N\D
WG
\ | F
ile N
am
e: 1651706-1001-D
B-0013.dw
g
IF
T
HIS
M
EA
SU
RE
ME
NT
D
OE
S N
OT
M
AT
CH
W
HA
T IS
S
HO
WN
, T
HE
S
HE
ET
S
IZ
E H
AS
B
EE
N M
OD
IF
IE
D F
RO
M: IS
O A
3
For
insp
ectio
n pur
pose
s only
.
Conse
nt of
copy
right
owne
r req
uired
for a
ny ot
her u
se.
EPA Export 14-10-2017:03:27:45
bkeenan
TextBox
3

WEST
RB1
SOUTH
RB2
EAST
282000
282000
283000
283000
284000
284000
285000
285000
286000
286000
287000
287000
288000
288000
26
90
00
26
90
00
27
00
00
27
00
00
27
10
00
27
10
00
27
20
00
27
20
00
27
30
00
27
30
00
27
40
00
27
40
00
CLIENT
BOLIDEN TARA LTD
LEGEND
Receptor
Section line (flow)
Model Boundary
North embankment
Flood Depth (m)0.0 - 0.5
0.5 - 1.0
1.0 - 1.5
1.5 - 2.0
2.0+
NOTES
REFERENCECOORDINATE SYSTEM: TM65 IRISH GRID
PROJECT
TARA DAM BREAK STUDY 2016
TITLE
STAGE 5A, DAM BREAK EAST, OPERATION PHASE
1651706 1001-DB-0001 B 4
06 JUL 2016
ECS
RE
RE
MG
Path
: K
:\B
olid
en T
ara
Min
es
Ltd
\Dam
_B
reak\9
9_P
RO
JEC
TS
\1651
706_S
tage_
6\1
001
_D
am
_B
reak_S
tag
e_6\0
2_P
RO
DU
CT
ION
\MX
D\1
651706
-1001-D
B-0
00
1.m
xd
IF T
HIS
ME
AS
UR
EM
EN
T D
OE
S N
OT
MA
TC
H W
HA
T I
S S
HO
WN
, T
HE
SH
EE
T S
IZE
HA
S B
EE
N M
OD
IFIE
D F
RO
M:
CONSULTANT
PROJECT No. CONTROL REV DRAWING
YYYY-MM-DD
PREPARED
DESIGN
REVIEW
APPROVED
25m
m0
1:22,000
500 0 500250
Meters
³
Stage 5A
DS Model Boundary
Source: Esri, DigitalGlobe, GeoEye, Earthstar Geographics, CNES/Airbus DS, USDA,
USGS, AEX, Getmapping, Aerogrid, IGN, IGP, swisstopo, and the GIS User Community
Stage 6
Stage 5B
NAVAN
River Blackwater
Simonstown
Stream
Yellow
River
For
insp
ectio
n pur
pose
s only
.
Conse
nt of
copy
right
owne
r req
uired
for a
ny ot
her u
se.
EPA Export 14-10-2017:03:27:45
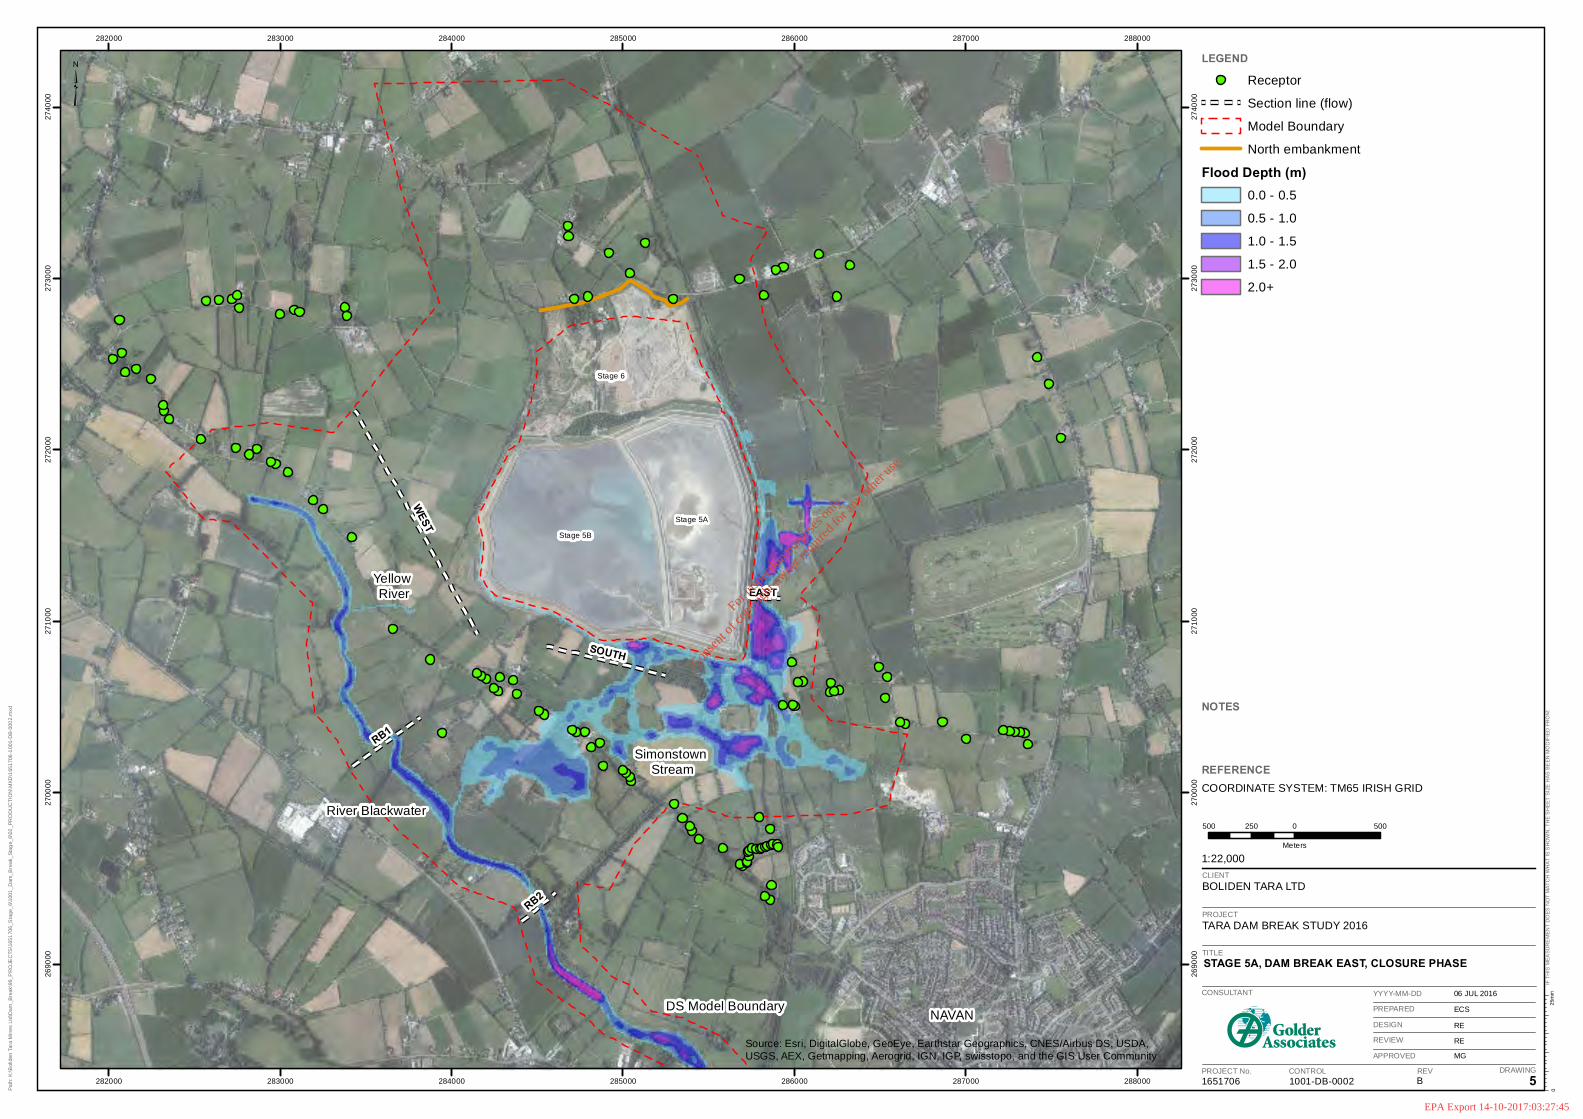
WEST
RB1
SOUTH
RB2
EAST
282000
282000
283000
283000
284000
284000
285000
285000
286000
286000
287000
287000
288000
288000
26
90
00
26
90
00
27
00
00
27
00
00
27
10
00
27
10
00
27
20
00
27
20
00
27
30
00
27
30
00
27
40
00
27
40
00
CLIENT
BOLIDEN TARA LTD
LEGEND
Receptor
Section line (flow)
Model Boundary
North embankment
Flood Depth (m)0.0 - 0.5
0.5 - 1.0
1.0 - 1.5
1.5 - 2.0
2.0+
NOTES
REFERENCECOORDINATE SYSTEM: TM65 IRISH GRID
PROJECT
TARA DAM BREAK STUDY 2016
TITLE
STAGE 5A, DAM BREAK EAST, CLOSURE PHASE
1651706 1001-DB-0002 B 5
06 JUL 2016
ECS
RE
RE
MG
Path
: K
:\B
olid
en T
ara
Min
es
Ltd
\Dam
_B
reak\9
9_P
RO
JEC
TS
\1651
706_S
tage_
6\1
001
_D
am
_B
reak_S
tag
e_6\0
2_P
RO
DU
CT
ION
\MX
D\1
651706
-1001-D
B-0
00
2.m
xd
IF T
HIS
ME
AS
UR
EM
EN
T D
OE
S N
OT
MA
TC
H W
HA
T I
S S
HO
WN
, T
HE
SH
EE
T S
IZE
HA
S B
EE
N M
OD
IFIE
D F
RO
M:
CONSULTANT
PROJECT No. CONTROL REV DRAWING
YYYY-MM-DD
PREPARED
DESIGN
REVIEW
APPROVED
25m
m0
1:22,000
500 0 500250
Meters
³
Stage 5A
DS Model Boundary
Source: Esri, DigitalGlobe, GeoEye, Earthstar Geographics, CNES/Airbus DS, USDA,
USGS, AEX, Getmapping, Aerogrid, IGN, IGP, swisstopo, and the GIS User Community
Stage 6
Stage 5B
NAVAN
River Blackwater
Yellow
River
Simonstown
Stream
For
insp
ectio
n pur
pose
s only
.
Conse
nt of
copy
right
owne
r req
uired
for a
ny ot
her u
se.
EPA Export 14-10-2017:03:27:45
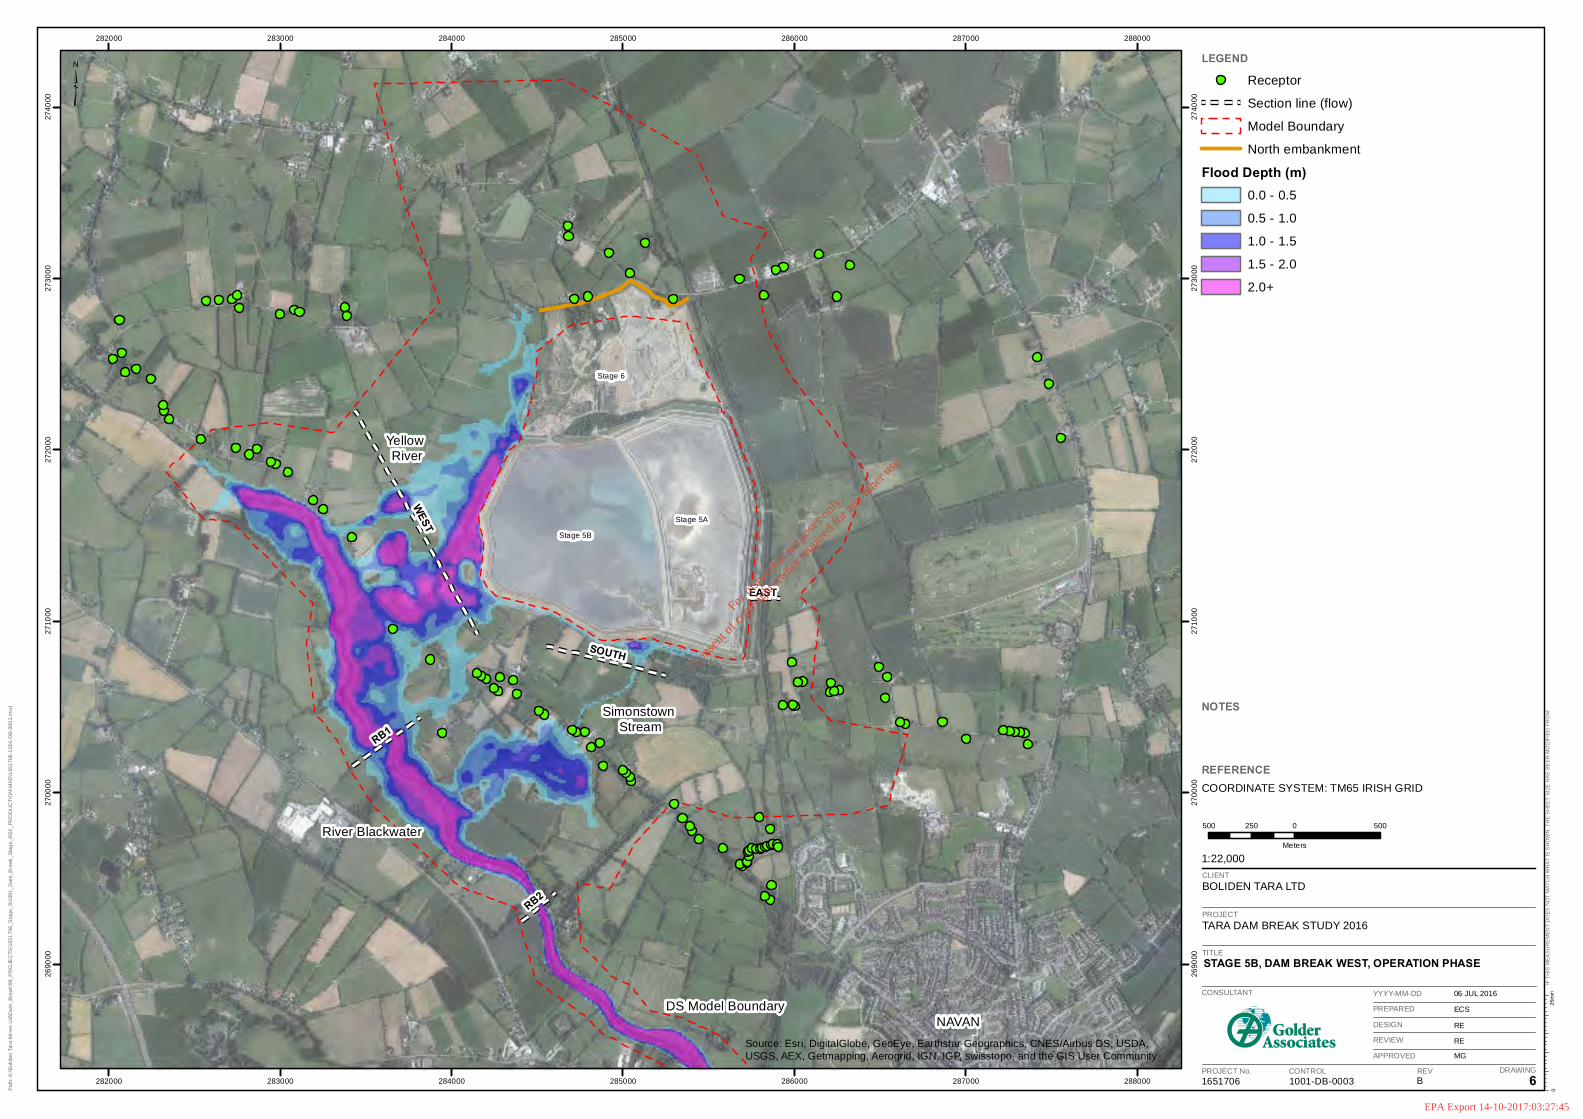
WEST
RB1
SOUTH
RB2
EAST
282000
282000
283000
283000
284000
284000
285000
285000
286000
286000
287000
287000
288000
288000
26
90
00
26
90
00
27
00
00
27
00
00
27
10
00
27
10
00
27
20
00
27
20
00
27
30
00
27
30
00
27
40
00
27
40
00
CLIENT
BOLIDEN TARA LTD
LEGEND
Receptor
Section line (flow)
Model Boundary
North embankment
Flood Depth (m)0.0 - 0.5
0.5 - 1.0
1.0 - 1.5
1.5 - 2.0
2.0+
NOTES
REFERENCECOORDINATE SYSTEM: TM65 IRISH GRID
PROJECT
TARA DAM BREAK STUDY 2016
TITLE
STAGE 5B, DAM BREAK WEST, OPERATION PHASE
1651706 1001-DB-0003 B 6
06 JUL 2016
ECS
RE
RE
MG
Path
: K
:\B
olid
en T
ara
Min
es
Ltd
\Dam
_B
reak\9
9_P
RO
JEC
TS
\1651
706_S
tage_
6\1
001
_D
am
_B
reak_S
tag
e_6\0
2_P
RO
DU
CT
ION
\MX
D\1
651706
-1001-D
B-0
00
3.m
xd
IF T
HIS
ME
AS
UR
EM
EN
T D
OE
S N
OT
MA
TC
H W
HA
T I
S S
HO
WN
, T
HE
SH
EE
T S
IZE
HA
S B
EE
N M
OD
IFIE
D F
RO
M:
CONSULTANT
PROJECT No. CONTROL REV DRAWING
YYYY-MM-DD
PREPARED
DESIGN
REVIEW
APPROVED
25m
m0
1:22,000
500 0 500250
Meters
³
Stage 5A
DS Model Boundary
Source: Esri, DigitalGlobe, GeoEye, Earthstar Geographics, CNES/Airbus DS, USDA,
USGS, AEX, Getmapping, Aerogrid, IGN, IGP, swisstopo, and the GIS User Community
Stage 6
Stage 5B
NAVAN
River Blackwater
Simonstown
Stream
Yellow
River
For
insp
ectio
n pur
pose
s only
.
Conse
nt of
copy
right
owne
r req
uired
for a
ny ot
her u
se.
EPA Export 14-10-2017:03:27:45
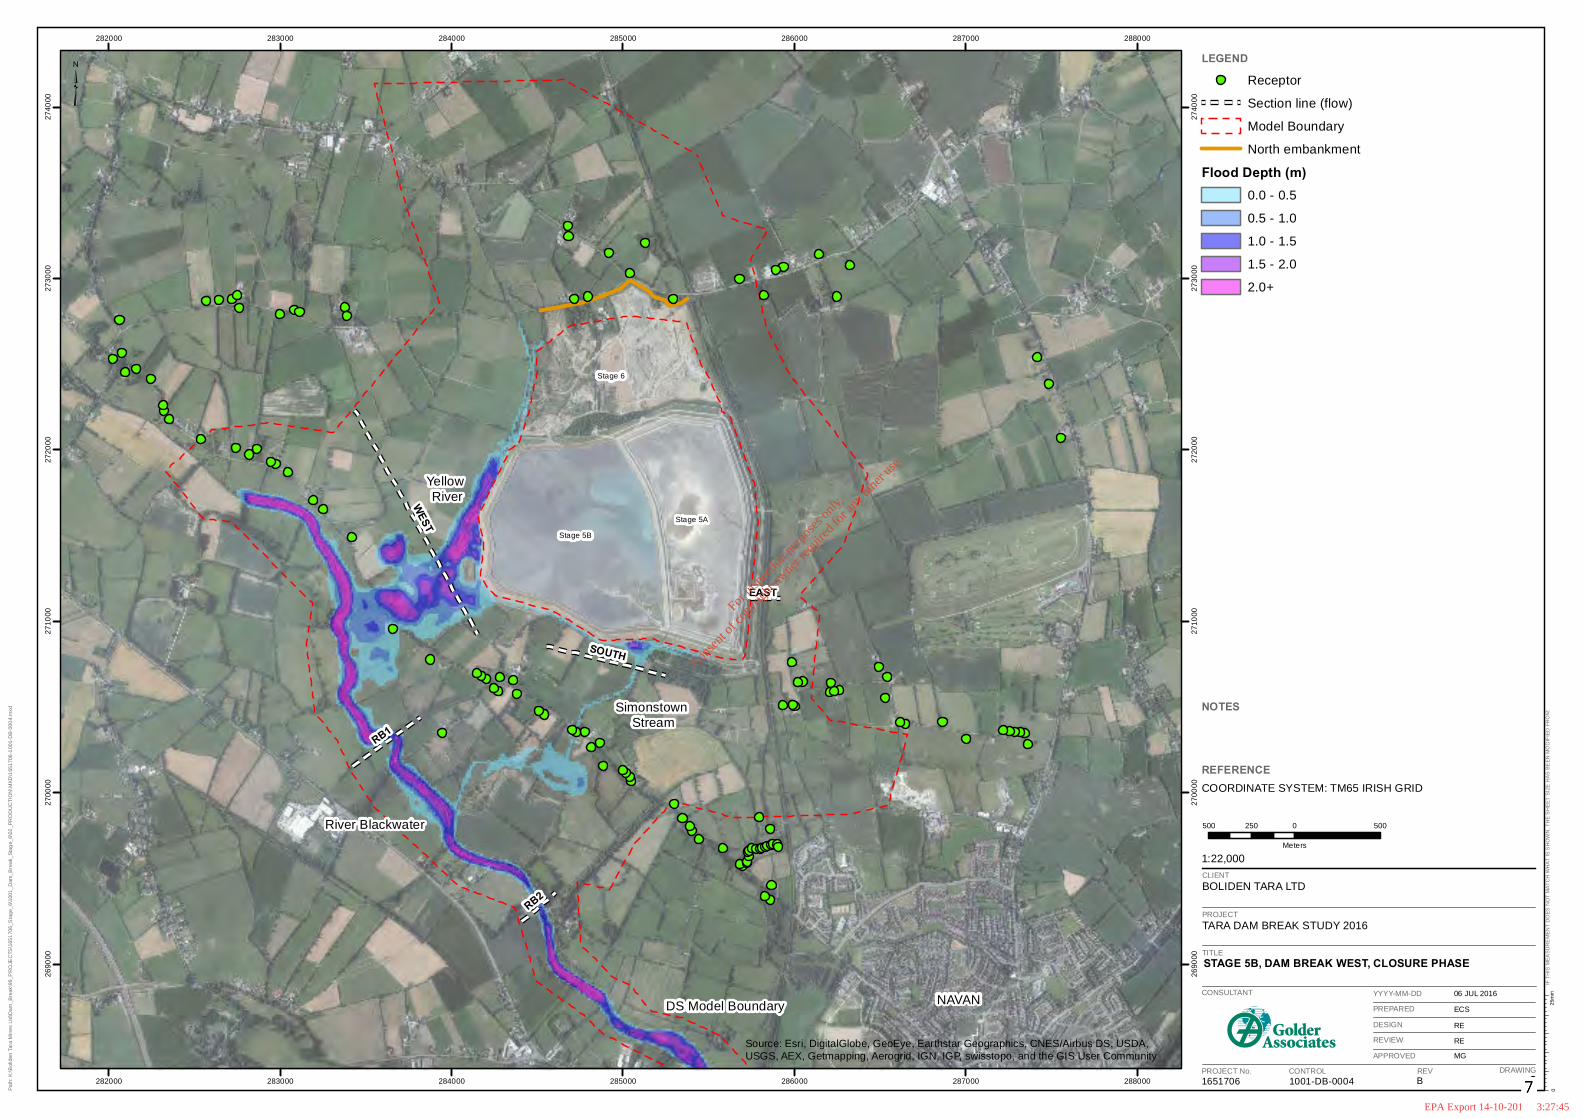
WEST
RB1
SOUTH
RB2
EAST
282000
282000
283000
283000
284000
284000
285000
285000
286000
286000
287000
287000
288000
288000
26
90
00
26
90
00
27
00
00
27
00
00
27
10
00
27
10
00
27
20
00
27
20
00
27
30
00
27
30
00
27
40
00
27
40
00
CLIENT
BOLIDEN TARA LTD
LEGEND
Receptor
Section line (flow)
Model Boundary
North embankment
Flood Depth (m)0.0 - 0.5
0.5 - 1.0
1.0 - 1.5
1.5 - 2.0
2.0+
NOTES
REFERENCECOORDINATE SYSTEM: TM65 IRISH GRID
PROJECT
TARA DAM BREAK STUDY 2016
TITLE
STAGE 5B, DAM BREAK WEST, CLOSURE PHASE
1651706 1001-DB-0004 B 6
06 JUL 2016
ECS
RE
RE
MG
Path
: K
:\B
olid
en T
ara
Min
es
Ltd
\Dam
_B
reak\9
9_P
RO
JEC
TS
\1651
706_S
tage_
6\1
001
_D
am
_B
reak_S
tag
e_6\0
2_P
RO
DU
CT
ION
\MX
D\1
651706
-1001-D
B-0
00
4.m
xd
IF T
HIS
ME
AS
UR
EM
EN
T D
OE
S N
OT
MA
TC
H W
HA
T I
S S
HO
WN
, T
HE
SH
EE
T S
IZE
HA
S B
EE
N M
OD
IFIE
D F
RO
M:
CONSULTANT
PROJECT No. CONTROL REV DRAWING
YYYY-MM-DD
PREPARED
DESIGN
REVIEW
APPROVED
25m
m0
1:22,000
500 0 500250
Meters
³
Stage 5A
DS Model Boundary
Source: Esri, DigitalGlobe, GeoEye, Earthstar Geographics, CNES/Airbus DS, USDA,
USGS, AEX, Getmapping, Aerogrid, IGN, IGP, swisstopo, and the GIS User Community
Stage 6
Stage 5B
NAVAN
River Blackwater
Yellow
River
Simonstown
Stream
For
insp
ectio
n pur
pose
s only
.
Conse
nt of
copy
right
owne
r req
uired
for a
ny ot
her u
se.
EPA Export 14-10-2017:03:27:45
bkeenan
TextBox
7
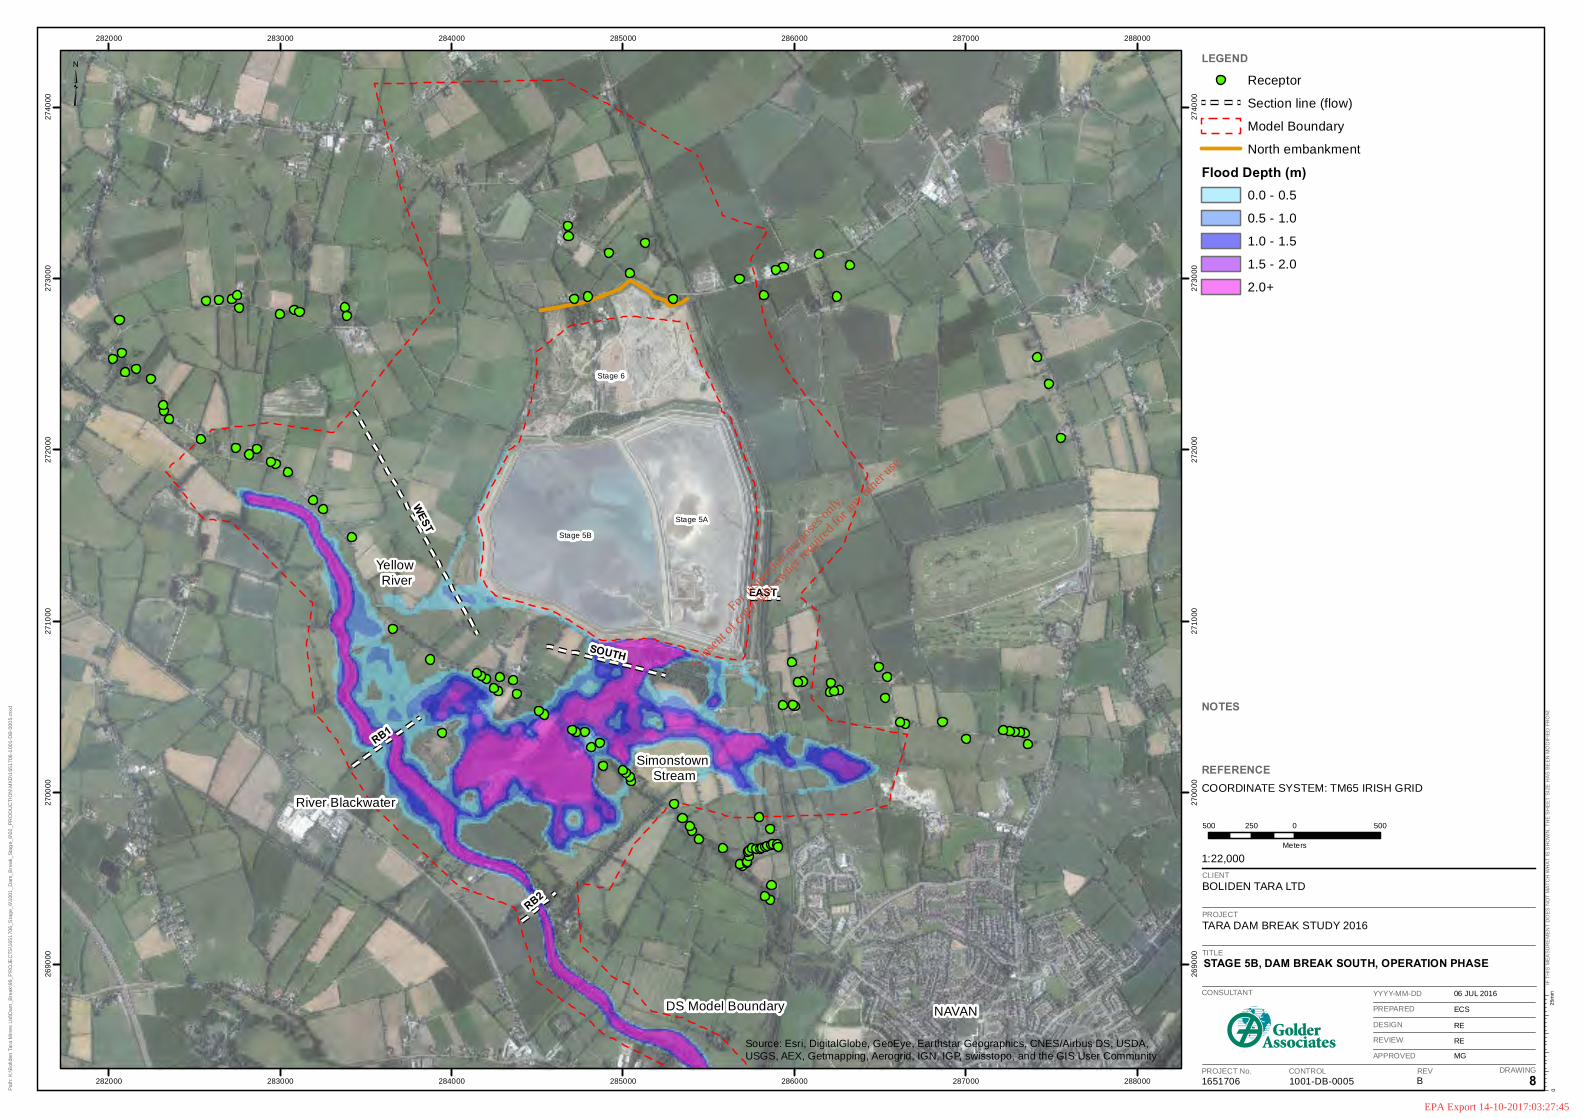
WEST
RB1
SOUTH
RB2
EAST
282000
282000
283000
283000
284000
284000
285000
285000
286000
286000
287000
287000
288000
288000
26
90
00
26
90
00
27
00
00
27
00
00
27
10
00
27
10
00
27
20
00
27
20
00
27
30
00
27
30
00
27
40
00
27
40
00
CLIENT
BOLIDEN TARA LTD
LEGEND
Receptor
Section line (flow)
Model Boundary
North embankment
Flood Depth (m)0.0 - 0.5
0.5 - 1.0
1.0 - 1.5
1.5 - 2.0
2.0+
NOTES
REFERENCECOORDINATE SYSTEM: TM65 IRISH GRID
PROJECT
TARA DAM BREAK STUDY 2016
TITLE
STAGE 5B, DAM BREAK SOUTH, OPERATION PHASE
1651706 1001-DB-0005 B 8
06 JUL 2016
ECS
RE
RE
MG
Path
: K
:\B
olid
en T
ara
Min
es
Ltd
\Dam
_B
reak\9
9_P
RO
JEC
TS
\1651
706_S
tage_
6\1
001
_D
am
_B
reak_S
tag
e_6\0
2_P
RO
DU
CT
ION
\MX
D\1
651706
-1001-D
B-0
00
5.m
xd
IF T
HIS
ME
AS
UR
EM
EN
T D
OE
S N
OT
MA
TC
H W
HA
T I
S S
HO
WN
, T
HE
SH
EE
T S
IZE
HA
S B
EE
N M
OD
IFIE
D F
RO
M:
CONSULTANT
PROJECT No. CONTROL REV DRAWING
YYYY-MM-DD
PREPARED
DESIGN
REVIEW
APPROVED
25m
m0
1:22,000
500 0 500250
Meters
³
Stage 5A
DS Model Boundary
Source: Esri, DigitalGlobe, GeoEye, Earthstar Geographics, CNES/Airbus DS, USDA,
USGS, AEX, Getmapping, Aerogrid, IGN, IGP, swisstopo, and the GIS User Community
Stage 6
Stage 5B
NAVAN
River Blackwater
Simonstown
Stream
Yellow
River
For
insp
ectio
n pur
pose
s only
.
Conse
nt of
copy
right
owne
r req
uired
for a
ny ot
her u
se.
EPA Export 14-10-2017:03:27:45

WEST
RB1
SOUTH
RB2
EAST
282000
282000
283000
283000
284000
284000
285000
285000
286000
286000
287000
287000
288000
288000
26
90
00
26
90
00
27
00
00
27
00
00
27
10
00
27
10
00
27
20
00
27
20
00
27
30
00
27
30
00
27
40
00
27
40
00
CLIENT
BOLIDEN TARA LTD
LEGEND
Receptor
Section line (flow)
Model Boundary
North embankment
Flood Depth (m)0.0 - 0.5
0.5 - 1.0
1.0 - 1.5
1.5 - 2.0
2.0+
NOTES
REFERENCECOORDINATE SYSTEM: TM65 IRISH GRID
PROJECT
TARA DAM BREAK STUDY 2016
TITLE
STAGE 5B, DAM BREAK SOUTH, CLOSURE PHASE
1651706 1001-DB-0006 B 8
06 JUL 2016
ECS
RE
RE
MG
Path
: K
:\B
olid
en T
ara
Min
es
Ltd
\Dam
_B
reak\9
9_P
RO
JEC
TS
\1651
706_S
tage_
6\1
001
_D
am
_B
reak_S
tag
e_6\0
2_P
RO
DU
CT
ION
\MX
D\1
651706
-1001-D
B-0
00
6.m
xd
IF T
HIS
ME
AS
UR
EM
EN
T D
OE
S N
OT
MA
TC
H W
HA
T I
S S
HO
WN
, T
HE
SH
EE
T S
IZE
HA
S B
EE
N M
OD
IFIE
D F
RO
M:
CONSULTANT
PROJECT No. CONTROL REV DRAWING
YYYY-MM-DD
PREPARED
DESIGN
REVIEW
APPROVED
25m
m0
1:22,000
500 0 500250
Meters
³
Stage 5A
DS Model Boundary
Source: Esri, DigitalGlobe, GeoEye, Earthstar Geographics, CNES/Airbus DS, USDA,
USGS, AEX, Getmapping, Aerogrid, IGN, IGP, swisstopo, and the GIS User Community
Stage 6
Stage 5B
NAVAN
River Blackwater
Simonstown
Stream
Yellow
River
For
insp
ectio
n pur
pose
s only
.
Conse
nt of
copy
right
owne
r req
uired
for a
ny ot
her u
se.
EPA Export 14-10-2017:03:27:45
bkeenan
TextBox
9

WEST
RB1
SOUTH
RB2
EAST
282000
282000
283000
283000
284000
284000
285000
285000
286000
286000
287000
287000
288000
288000
26
90
00
26
90
00
27
00
00
27
00
00
27
10
00
27
10
00
27
20
00
27
20
00
27
30
00
27
30
00
27
40
00
27
40
00
CLIENT
BOLIDEN TARA LTD
LEGEND
Receptor
Section line (flow)
Model Boundary
North embankment
Flood Depth (m)0.0 - 0.5
0.5 - 1.0
1.0 - 1.5
1.5 - 2.0
2.0+
NOTES
REFERENCECOORDINATE SYSTEM: TM65 IRISH GRID
PROJECT
TARA DAM BREAK STUDY 2016
TITLE
STAGE 6, DAM BREAK NORTH-WEST, OPERATION PHASE
1651706 1001-DB-0007 B 10
06 JUL 2016
ECS
RE
RE
MG
Path
: K
:\B
olid
en T
ara
Min
es
Ltd
\Dam
_B
reak\9
9_P
RO
JEC
TS
\1651
706_S
tage_
6\1
001
_D
am
_B
reak_S
tag
e_6\0
2_P
RO
DU
CT
ION
\MX
D\1
651706
-1001-D
B-0
00
7.m
xd
IF T
HIS
ME
AS
UR
EM
EN
T D
OE
S N
OT
MA
TC
H W
HA
T I
S S
HO
WN
, T
HE
SH
EE
T S
IZE
HA
S B
EE
N M
OD
IFIE
D F
RO
M:
CONSULTANT
PROJECT No. CONTROL REV DRAWING
YYYY-MM-DD
PREPARED
DESIGN
REVIEW
APPROVED
25m
m0
1:22,000
500 0 500250
Meters
³
Stage 5A
DS Model Boundary
Source: Esri, DigitalGlobe, GeoEye, Earthstar Geographics, CNES/Airbus DS, USDA,
USGS, AEX, Getmapping, Aerogrid, IGN, IGP, swisstopo, and the GIS User Community
Stage 6
Stage 5B
Simonstown
Stream
Yellow
River
River Blackwater
NAVAN
For
insp
ectio
n pur
pose
s only
.
Conse
nt of
copy
right
owne
r req
uired
for a
ny ot
her u
se.
EPA Export 14-10-2017:03:27:45
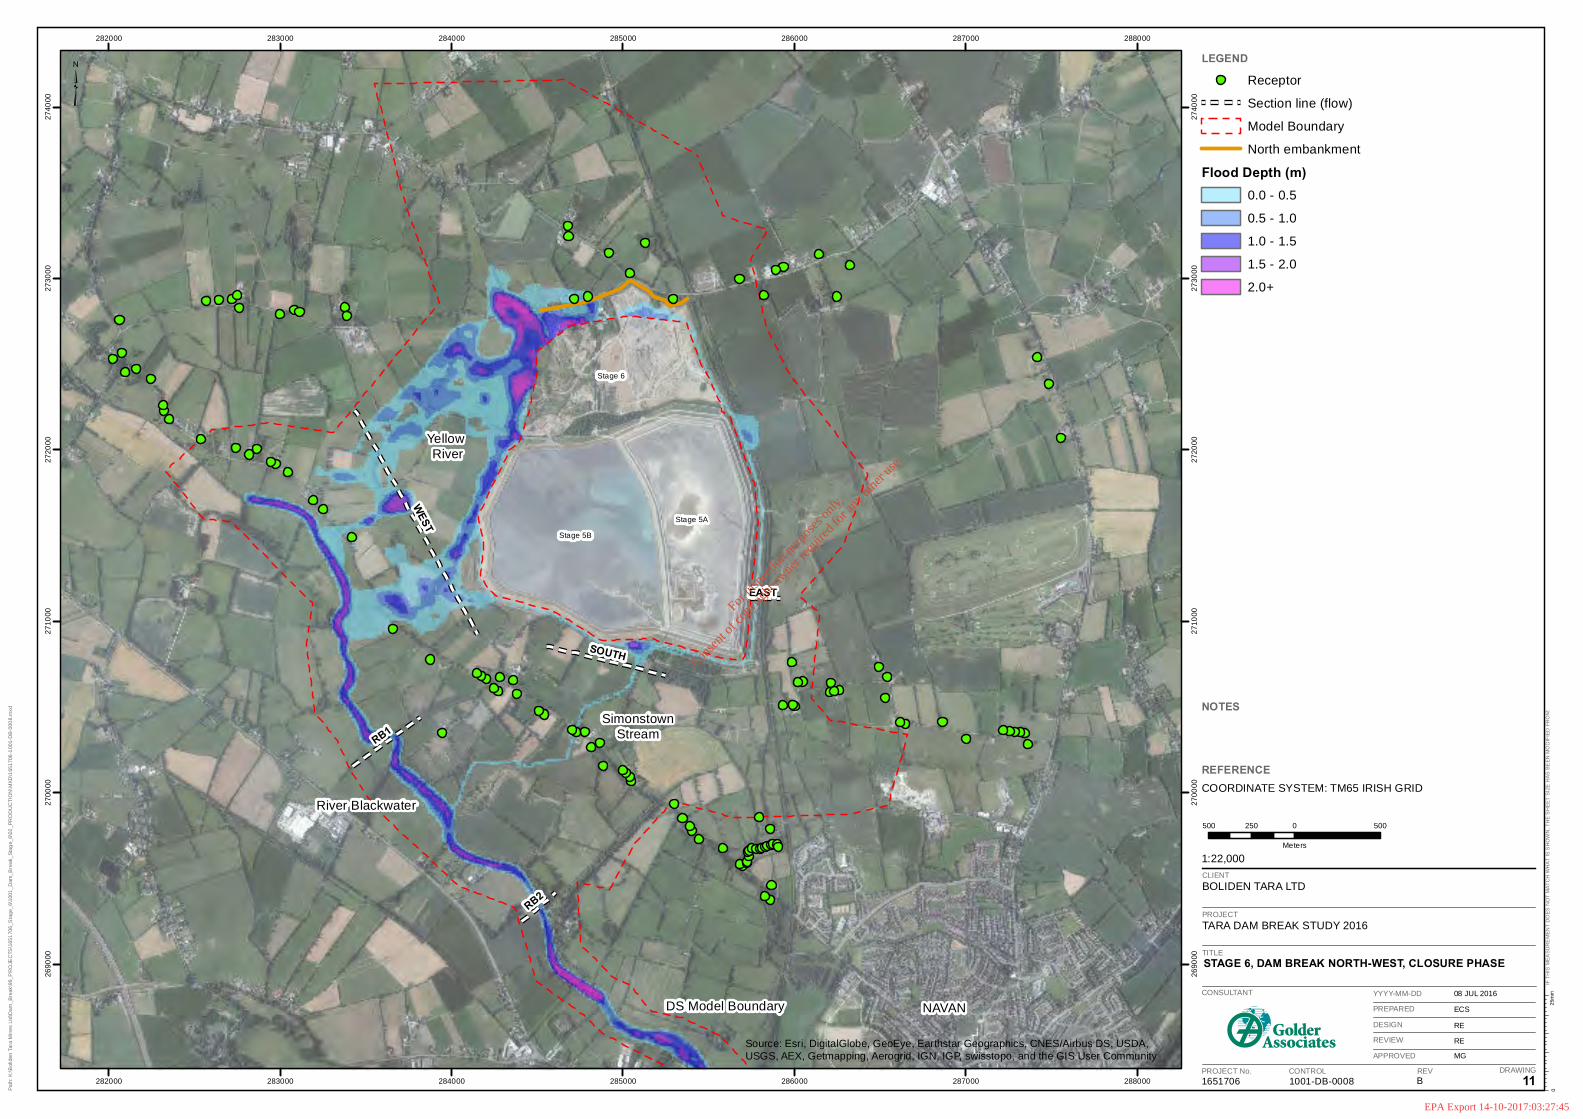
WEST
RB1
SOUTH
RB2
EAST
282000
282000
283000
283000
284000
284000
285000
285000
286000
286000
287000
287000
288000
288000
26
90
00
26
90
00
27
00
00
27
00
00
27
10
00
27
10
00
27
20
00
27
20
00
27
30
00
27
30
00
27
40
00
27
40
00
CLIENT
BOLIDEN TARA LTD
LEGEND
Receptor
Section line (flow)
Model Boundary
North embankment
Flood Depth (m)0.0 - 0.5
0.5 - 1.0
1.0 - 1.5
1.5 - 2.0
2.0+
NOTES
REFERENCECOORDINATE SYSTEM: TM65 IRISH GRID
PROJECT
TARA DAM BREAK STUDY 2016
TITLE
STAGE 6, DAM BREAK NORTH-WEST, CLOSURE PHASE
1651706 1001-DB-0008 B 11
08 JUL 2016
ECS
RE
RE
MG
Path
: K
:\B
olid
en T
ara
Min
es
Ltd
\Dam
_B
reak\9
9_P
RO
JEC
TS
\1651
706_S
tage_
6\1
001
_D
am
_B
reak_S
tag
e_6\0
2_P
RO
DU
CT
ION
\MX
D\1
651706
-1001-D
B-0
00
8.m
xd
IF T
HIS
ME
AS
UR
EM
EN
T D
OE
S N
OT
MA
TC
H W
HA
T I
S S
HO
WN
, T
HE
SH
EE
T S
IZE
HA
S B
EE
N M
OD
IFIE
D F
RO
M:
CONSULTANT
PROJECT No. CONTROL REV DRAWING
YYYY-MM-DD
PREPARED
DESIGN
REVIEW
APPROVED
25m
m0
1:22,000
500 0 500250
Meters
³
Stage 5A
DS Model Boundary
Source: Esri, DigitalGlobe, GeoEye, Earthstar Geographics, CNES/Airbus DS, USDA,
USGS, AEX, Getmapping, Aerogrid, IGN, IGP, swisstopo, and the GIS User Community
Stage 6
Stage 5B
Simonstown
Stream
Yellow
River
River Blackwater
NAVAN
For
insp
ectio
n pur
pose
s only
.
Conse
nt of
copy
right
owne
r req
uired
for a
ny ot
her u
se.
EPA Export 14-10-2017:03:27:45
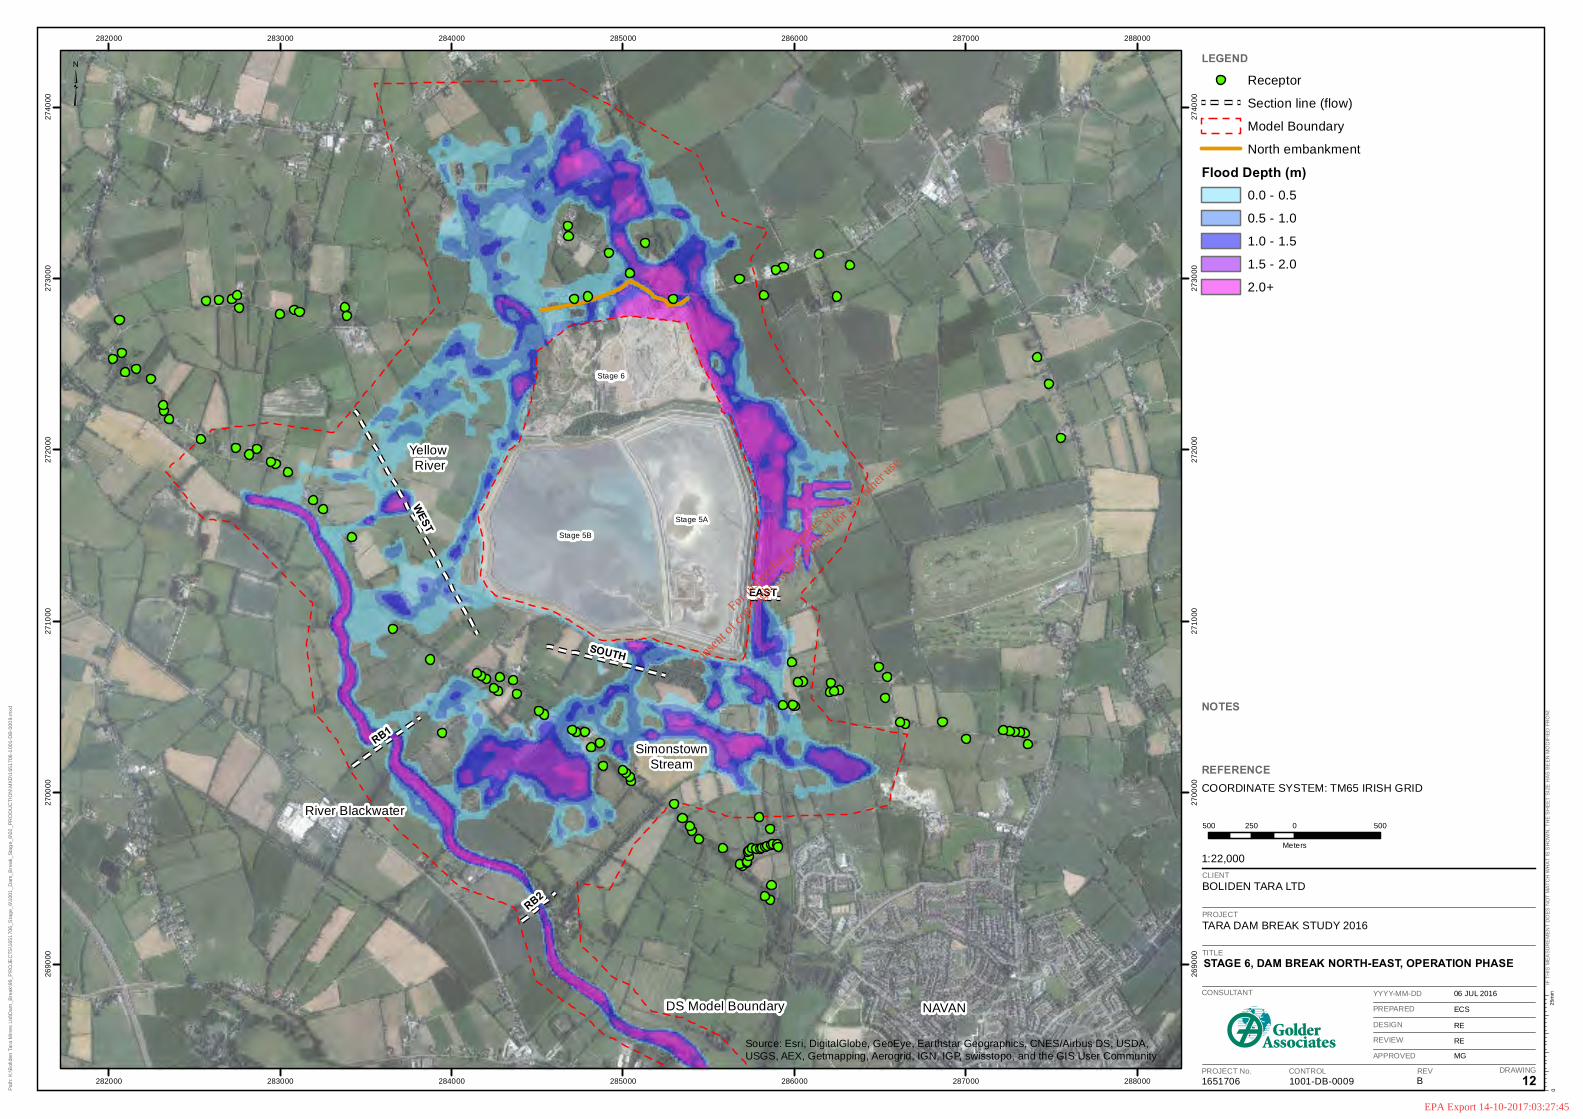
WEST
RB1
SOUTH
RB2
EAST
282000
282000
283000
283000
284000
284000
285000
285000
286000
286000
287000
287000
288000
288000
26
90
00
26
90
00
27
00
00
27
00
00
27
10
00
27
10
00
27
20
00
27
20
00
27
30
00
27
30
00
27
40
00
27
40
00
CLIENT
BOLIDEN TARA LTD
LEGEND
Receptor
Section line (flow)
Model Boundary
North embankment
Flood Depth (m)0.0 - 0.5
0.5 - 1.0
1.0 - 1.5
1.5 - 2.0
2.0+
NOTES
REFERENCECOORDINATE SYSTEM: TM65 IRISH GRID
PROJECT
TARA DAM BREAK STUDY 2016
TITLE
STAGE 6, DAM BREAK NORTH-EAST, OPERATION PHASE
1651706 1001-DB-0009 B 12
06 JUL 2016
ECS
RE
RE
MG
Path
: K
:\B
olid
en T
ara
Min
es
Ltd
\Dam
_B
reak\9
9_P
RO
JEC
TS
\1651
706_S
tage_
6\1
001
_D
am
_B
reak_S
tag
e_6\0
2_P
RO
DU
CT
ION
\MX
D\1
651706
-1001-D
B-0
00
9.m
xd
IF T
HIS
ME
AS
UR
EM
EN
T D
OE
S N
OT
MA
TC
H W
HA
T I
S S
HO
WN
, T
HE
SH
EE
T S
IZE
HA
S B
EE
N M
OD
IFIE
D F
RO
M:
CONSULTANT
PROJECT No. CONTROL REV DRAWING
YYYY-MM-DD
PREPARED
DESIGN
REVIEW
APPROVED
25m
m0
1:22,000
500 0 500250
Meters
³
Stage 5A
DS Model Boundary
Source: Esri, DigitalGlobe, GeoEye, Earthstar Geographics, CNES/Airbus DS, USDA,
USGS, AEX, Getmapping, Aerogrid, IGN, IGP, swisstopo, and the GIS User Community
Stage 6
Stage 5B
Simonstown
Stream
Yellow
River
River Blackwater
NAVAN
For
insp
ectio
n pur
pose
s only
.
Conse
nt of
copy
right
owne
r req
uired
for a
ny ot
her u
se.
EPA Export 14-10-2017:03:27:45

WEST
RB1
SOUTH
RB2
EAST
282000
282000
283000
283000
284000
284000
285000
285000
286000
286000
287000
287000
288000
288000
26
90
00
26
90
00
27
00
00
27
00
00
27
10
00
27
10
00
27
20
00
27
20
00
27
30
00
27
30
00
27
40
00
27
40
00
CLIENT
BOLIDEN TARA LTD
LEGEND
Receptor
Section line (flow)
Model Boundary
North embankment
Flood Depth (m)0.0 - 0.5
0.5 - 1.0
1.0 - 1.5
1.5 - 2.0
2.0+
NOTES
REFERENCECOORDINATE SYSTEM: TM65 IRISH GRID
PROJECT
TARA DAM BREAK STUDY 2016
TITLE
STAGE 6, DAM BREAK NORTH-EAST, CLOSURE PHASE
1651706 1001-DB-0010 B 13
06 JUL 2016
ECS
RE
RE
MG
Path
: K
:\B
olid
en T
ara
Min
es
Ltd
\Dam
_B
reak\9
9_P
RO
JEC
TS
\1651
706_S
tage_
6\1
001
_D
am
_B
reak_S
tag
e_6\0
2_P
RO
DU
CT
ION
\MX
D\1
651706
-1001-D
B-0
01
0.m
xd
IF T
HIS
ME
AS
UR
EM
EN
T D
OE
S N
OT
MA
TC
H W
HA
T I
S S
HO
WN
, T
HE
SH
EE
T S
IZE
HA
S B
EE
N M
OD
IFIE
D F
RO
M:
CONSULTANT
PROJECT No. CONTROL REV DRAWING
YYYY-MM-DD
PREPARED
DESIGN
REVIEW
APPROVED
25m
m0
1:22,000
500 0 500250
Meters
³
Stage 5A
DS Model Boundary
Source: Esri, DigitalGlobe, GeoEye, Earthstar Geographics, CNES/Airbus DS, USDA,
USGS, AEX, Getmapping, Aerogrid, IGN, IGP, swisstopo, and the GIS User Community
Stage 6
Stage 5B
Simonstown
Stream
Yellow
River
River Blackwater
NAVAN
For
insp
ectio
n pur
pose
s only
.
Conse
nt of
copy
right
owne
r req
uired
for a
ny ot
her u
se.
EPA Export 14-10-2017:03:27:45
TARA TMF DAM BREAK STUDY
July 2016 Report No. 1651706.500/A.1
APPENDIX B Dam Break Video Files (CD)
For
insp
ectio
n pur
pose
s only
.
Conse
nt of
copy
right
owne
r req
uired
for a
ny ot
her u
se.
EPA Export 14-10-2017:03:27:45

Golder Associates (UK) Ltd Sirius Building, The Clocktower South Gyle Crescent Edinburgh EH12 9LB UK T: [+44] (0) 131 314 5900
Caption Text
For
insp
ectio
n pur
pose
s only
.
Conse
nt of
copy
right
owne
r req
uired
for a
ny ot
her u
se.
EPA Export 14-10-2017:03:27:45
“BOLIDEN W
Dr. Magnus Amajirionwu Office of Climate, Licensing and Resource Use. EPA Headquarters. Po Box 3000, Johnstown Castle Estate. County Wexford.
1 1 t h December 2017
Ref: PO 516-04
Dr. Amajirionwu,
Please find response to your request for further information dated November 8th 20lTconsisting of 2 hard copies and 2 copies on CD-ROM in electronic searchable PDF format.
The content of the electronic file on the accompanying CD-ROM is a true copy of the original.
Yours sincerely,
Paschal Walsh EHS Manager Boliden Tara Mines DAC
Boliden Tara Mines Limited Knockumber, Navan, Co. Meath C15 NH63, Ireland. Tel: +353 (0)46 908 2000
Directors: M. Staffas (Chairman ) (Swedish), J. Morin (Managing) (Canadian), T. Farrell, M. Flynn, Y. Scannell Registered in Ireland 33148

Response to Further Information Request
08/11/2017
Table of Contents
Item 1 ............................................................................................................................................... 1
Item 2 ............................................................................................................................................... 1
Item 3 ............................................................................................................................................... 5
Item 4 ............................................................................................................................................... 6
Item 5 ............................................................................................................................................... 8
IEL PO516-04 Review Application Response to Further Information Request 08/11/2017
1 | P a g e
Item 1
You have included a list of advantages and disadvantages for various alternative tailings disposal method. Please provide a detailed methodology for selecting the most favourable option based on technical, environmental and socio-economic ranking.
Response to Item 1
An evaluation of alternative tailings disposal methods for the Stage 6 development of the Randalstown Tailings Storage Facility (TSF) was undertaken. The objective was to identify and select the most suitable method considering all aspects of the development lifecycle.
Multiple Account Anaylsis (MAA) was chosen as the framework for alternatives evaluation. The MMA process followed and overall outcome is presented in Appendix to FIR item 1.
_____________________________________________________________________________________________________
Item 2
Your correspondence did not clarify the capability to store probable maximum precipitation of appropriate duration (months, not hours). Please demonstrate how the current design incorporates sufficient freeboard to contain design storm rainfall. All duration and return periods used in the design should be selected based on best practice and international guidelines, and this requirement should be demonstrated in your response.
Response to Item 2
As stated in previous correspondence the TMF is classified as a perimeter dam with no external catchment area. What this means is that no external water flows/drains into the facility.
Water can only enter in two ways;
1. As tailings carrying water (pumped from the processing Plant) 2. As precipitation
Water levels in the facility are controlled by continually pumping water back (reclaiming) to the processing plant for reuse or further treatment and discharge.
In the event of a pump failure no water would be pumped to or from the facility.
The facility will operate with a minimum free board of 1 metre, meaning there will be reserve capacity to store 1000mm of water.

IEL PO516-04 Review Application Response to Further Information Request 08/11/2017
2 | P a g e
And since, in the event of a pump failure there will be no water pumped to the facility then the only way water can enter is as precipitation.
Based on the OPWs Flood Studies Database (Web Portal - http://opw.hydronet.com) available data ( Ref Table 1 and Figure 1 below) for the Navan area would suggest that during a 1 in 500 year rainfall event (AEP: 0.2%) over a continuous period of 600 hour (25 days) the maximum potential rainfall depth would be 268.1mm c. 27% of the available storage provided by the 1 metre free board.
The 1000mm of free board would actually provide adequate storage for the
• Total Annual Average rainfall over the last 50 years (856 mm) and • 87% of the Total Maximum Annual rainfall over the last 50 years (1136 mm)
(not taking account of loss to evaporation which would be c. 40% ).
In other words there is a minimum of 11 months storage capacity at any time.
There is no scenario where the above would not be adequate. The pumps would have to be turned off 11 consecutive months during which time there was the worst recorded rainfall and no loss to evaporation.
Closure Phase
Once the facility is filled the remaining stored water will be pumped off and the closure plan would be enacted.
The closure plan includes provision for a spillway as the reclaim pump will no longer be in operation (Ref; EIS Section 3 Project Description Section 3.8).
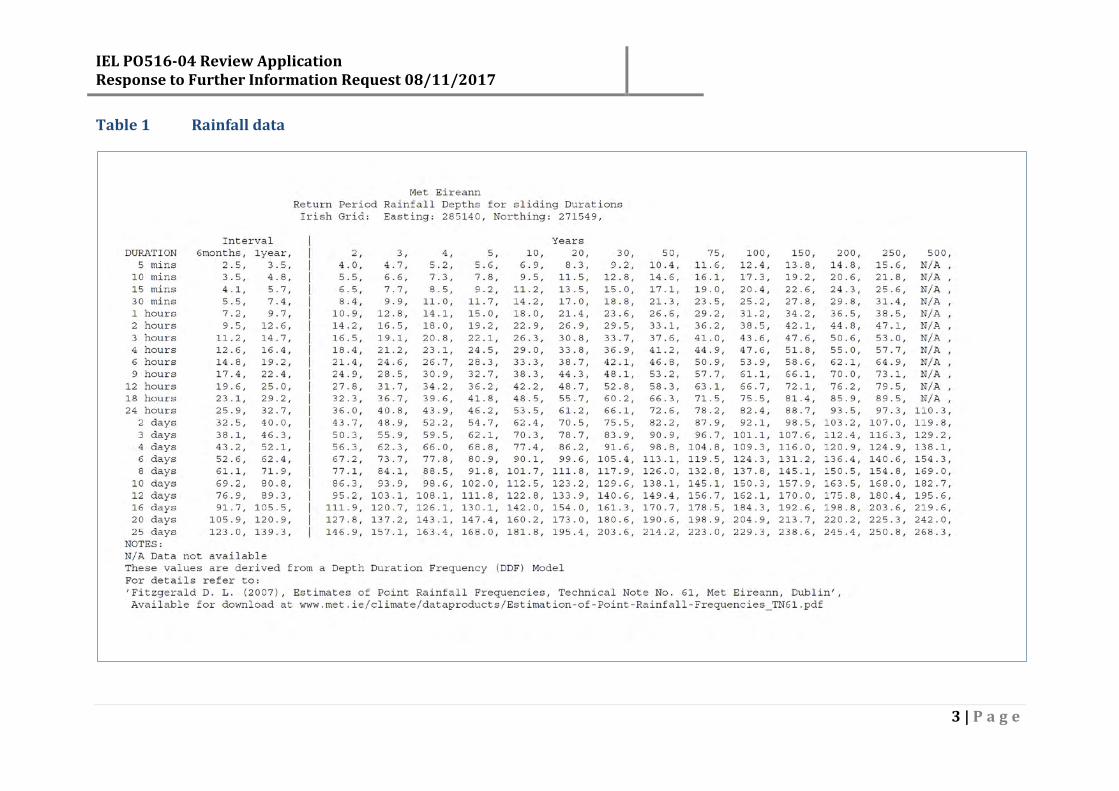
IEL PO516-04 Review Application Response to Further Information Request 08/11/2017
3 | P a g e
Table 1 Rainfall data
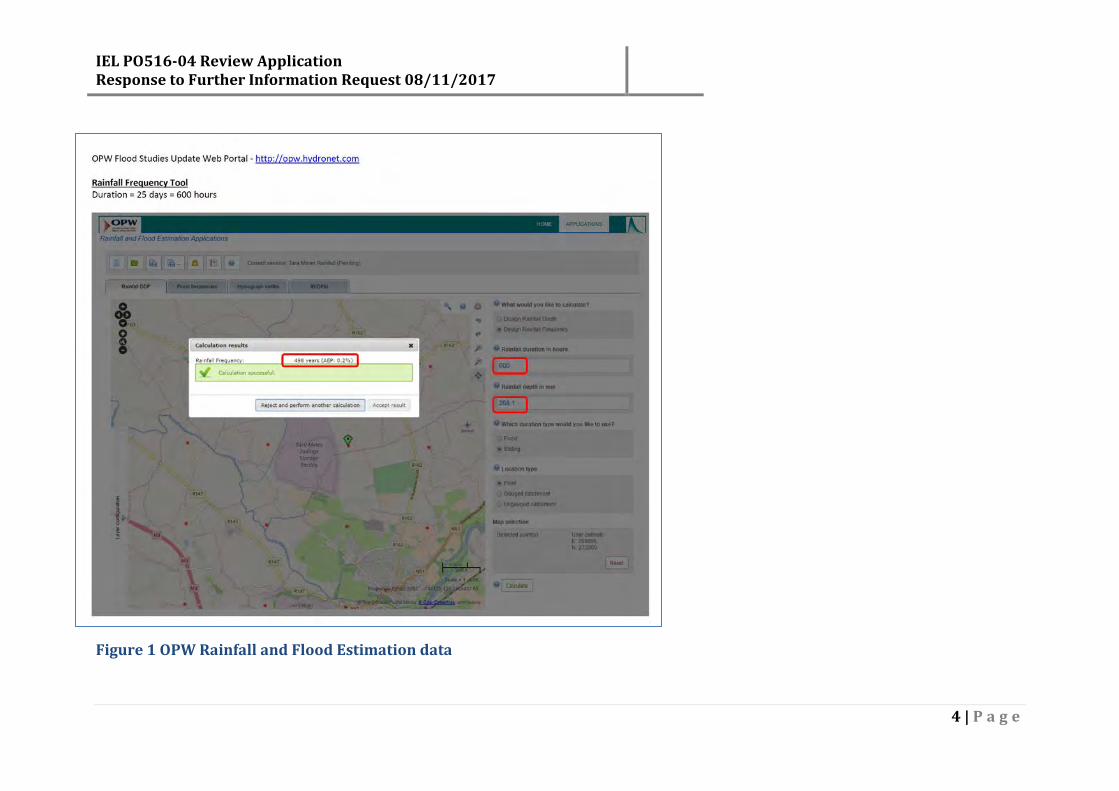
IEL PO516-04 Review Application Response to Further Information Request 08/11/2017
4 | P a g e
Figure 1 OPW Rainfall and Flood Estimation data
IEL PO516-04 Review Application Response to Further Information Request 08/11/2017
5 | P a g e
Item 3
Your correspondence referred to "a very extreme scenario which is unlikely to develop." The analyses suggest that although "unlikely" it is possible that the embankment will be unstable. Please provide a comprehensive (dynamic) analysis undertaken to confirm that the proposed embankment will be stable under "all" conditions.
Response to Item 3
Comprehensive (empirical dynamic) analysis to determine the settlement of the stage 6 dam walls under seismic conditions has been undertaken By Golder Associates and is presented in Appendix to FIR Item 2.
Dynamic response analysis was carried out using the finite element programme Midas GTS NX. Three different sets of ground acceleration time history were used in the analysis to cover a wide range of response spectrum in ground motion simulation.
The analysis results indicate the level of deformation of the tailings dam during and after a maximum credible earthquake (MCE) event would not impact the integrity of the dam wall and therefore is considered satisfactory.
In addition Pseudo Static Stability analysis carried out based on a MCE with a peak ground acceleration (PGA) of 0.06g is 1E-4 or a 1 in 10,000 year event (occurrence) or as given ‘very unlikely’ to occur. This analysis is presented in the BTM Design for the Stage 6 TMF document.
_____________________________________________________________________________________________________
IEL PO516-04 Review Application Response to Further Information Request 08/11/2017
6 | P a g e
Item 4
On why the interceptor channel used to collect and discharge seepage water into the water treatment system is not fully lined, it was stated that "if monitoring indicates contaminates in excess of the discharge limits in the interceptor channel then the perimeter interceptor would be lined. " Please confirm that the TMF design includes lining of the interceptor channel to prevent any potential contamination.
Response to Item 4
The Stage 6 facility will be composite lined with a 2mm HDPE geomembrane and a geosynthetic clay liner (GCL) designed to contain both the tailings solids and water (the lining system will undergo a leak detection survey prior to commissioning).
Any seepage passing through defects in the lining system will mix and be diluted with ground water. Ground water flow will be intercepted by the perimeter interceptor channel. Refer to Figure 2
The perimeter interceptor channel will collect surface water runoff from the dam walls, perimeter road and borrow areas. Seepage volumes will be insignificant when compared with the clean surface water runoff from the downstream slopes of the embankment walls and surroundings (Ref EIS Section 3 Project Description, Section 3.6).
During winter, sections of the perimeter interceptor channel will intercept the groundwater as it rises and this will be monitored for quality.
The perimeter interceptor channel will discharge into the existing (Stage 5) east and west perimeter interceptor channel and will be pumped back into the active dam (Stage 5) from where it will be reclaimed to the processing plant.
The interceptor channel would not intercept ground water flow if it were lined.
____________________________________________________________________________________________________

IEL PO516-04 Review Application Response to Further Information Request 08/11/2017
7 | P a g e
Figure 2 Section embankment walls and perimeter interceptor channel.
Seepage

IEL PO516-04 Review Application Response to Further Information Request 08/11/2017
8 | P a g e
Item 5
The need for large quantities of construction material is noted. Table 2.3 of the CRAMP provided with the application indicates a total soil requirement of 672,616m3 and a need to import 170,616m3 for the capping of stages 5 and 6. Table 3.5 of the EIS for the stage 6 extension indicates a total granular rock requirement of 1,738,578m3 some of which will need to be imported as indicated by your text in section 3.2.2.4.
Imported soils and stones will either be quarried by others for the purpose of sale and supply to you, or will be generated as a result of excavations linked to construction projects. Material sourced from the latter will be classified as waste or by-product, depending on the circumstances of the supply contract.
Item 5(a):
In relation to imported material other than that produced by quarries, please state the total quantity of soil and stone, whether classified as waste or by- product, that will be imported for the purpose of capping and construction.
Response
The total quantity of soil and stone, whether classified as waste or by- product, that will be imported for the purpose of capping and construction is 987,528 m3
Part 1 Materials Required
Table 1 Materials Required for Closure (m3)
Description (m3) Total Qty. (m3)
Closure Stage 5 Soil 472,950 Closure Stage 5 Rock 59,000 Closure Stage 6 Soil 199,666 Closure Stage 6 Rock 43,560
(A) Total Closure Soil 672,616
(B) Total Closure Rock 102,560
Closure Total (A+B) = ( C ) ( C ) 775,176
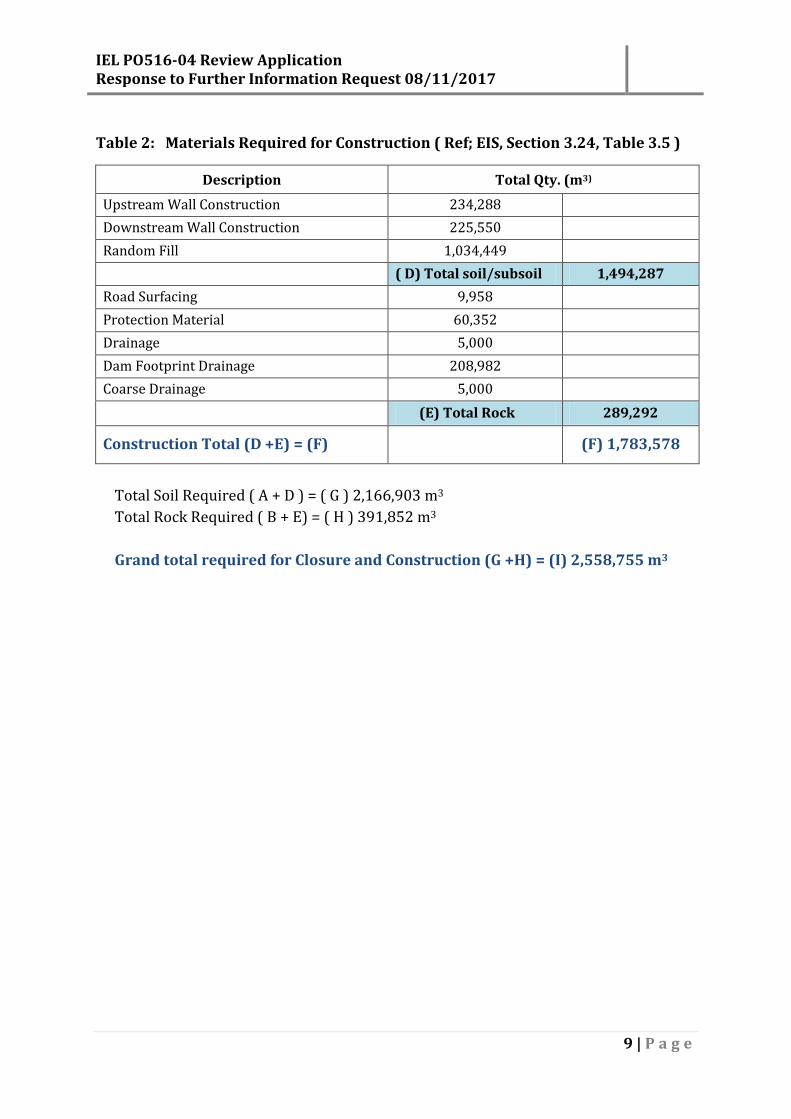
IEL PO516-04 Review Application Response to Further Information Request 08/11/2017
9 | P a g e
Table 2: Materials Required for Construction ( Ref; EIS, Section 3.24, Table 3.5 )
Description Total Qty. (m3)
Upstream Wall Construction 234,288 Downstream Wall Construction 225,550 Random Fill 1,034,449 ( D) Total soil/subsoil 1,494,287 Road Surfacing 9,958 Protection Material 60,352 Drainage 5,000 Dam Footprint Drainage 208,982 Coarse Drainage 5,000 (E) Total Rock 289,292
Construction Total (D +E) = (F)
(F) 1,783,578
Total Soil Required ( A + D ) = ( G ) 2,166,903 m3 Total Rock Required ( B + E) = ( H ) 391,852 m3 Grand total required for Closure and Construction (G +H) = (I) 2,558,755 m3

IEL PO516-04 Review Application Response to Further Information Request 08/11/2017
10 | P a g e
Part 2 Materials Available
Table 3 Material available in borrow areas (Ref; BTM Design TMF Table 3) Material Type Quantity (m3)
Rock 486,000 Soil 812,000 Total Available in borrow pits ( J ) 1,298,000 Material Imported1 and stockpiled between Apr ’16 - Nov ‘17 = (K) 273,227 m3. Grand Total available (J + K) = (L) 1, 571,227m3
Part 3 Shortfall of materials
The total quantity of soil and stone, whether classified as waste or by- product, that will be imported for the purpose of capping and construction is
Total Required (I) - Total Available (L) = Shortfall (M)
(I) 2,558,755 - (L) 1,571,227 = (M) 987,528 m3
1 Condition 8.12.22 of the Company’s existing IE Licence

IEL PO516-04 Review Application Response to Further Information Request 08/11/2017
11 | P a g e
Item 5(a):
Please state whether authorisation is sought in a revised licence to import construction and demolition waste or materials made from construction and demolition waste. Please specify the quantity of material proposed to be accepted and its proposed uses.
Response Yes, the Company is seeking authorisation in its revised licence to import construction and demolition waste or materials made from construction and demolition waste. BTM will continue to source suitable recovered material 2 to meet requirement for construction and closure. BTM believe that the conditions in its current licence are sufficient to cover the importation of suitable construction and rehabilitation materials:
• Condition 8.12.22 of the Company’s existing IE Licence states that “Subject to prior agreement by the Agency the licensee can use recovered material(s) at the TMF”.
• Condition 8.13.3 of the Company’s existing Industrial emissions Licence states
that “Subject to prior agreement by the Agency the licensee can use recovered material(s) for closure and aftercare at the landfill.
2 Material that has been recovered and/or prepared from waste and is fit for purpose for the operation, maintenance and/or long-term rehabilitation of the TMF.

IEL PO516-04 Review Application Response to Further Information Request 08/11/2017
Appendix to FIR Item 1 ______________________________________________ Evaluation of Alternative Tailings Disposal Methods using
Multiple Accounts Analysis (MAA)

IEL P0516-04 Review Application Appendix to FIR 08/11/2017 Item1 ______________________________________________________________________________________________________________
1
An Evaluation of Alternative Tailings Disposal methods using Multiple Accounts analysis (MAA)
The objective of this process was to evaluate different tailings disposal alternatives and identify and select the most suitable method taking into consideration all aspects of the development life cycle (from construction through operation, closure & rehabilitation).
Multiple Accounts Analysis (MAA) was used as a means of effectively evaluating different alternatives. This process allowed the comparison of the alternatives to allow for selection of the most suitable, or advantageous, method of tailings deposition.
The evaluation was undertaken by a project team which included representatives from;
Golder Associates (Consulting Engineers Design Stage) Boliden Group Technical Department Boliden Tara Mines (BTM) Environmental Department BTM Processing Department
The MAA process involved the following steps:
Step 1: Identifying Alternatives; Step 2: Screening of Alternatives; Step 3: Characterisation Criteria; Step 4: Multiple Accounts Ledger; and Step 5: Value-Based Decision process.
An important consideration/factor in the assessment was the distance between the concentrator/processing plant at Knockumber and all viable locations. Tailings would have to be pumped a minimum of 3km.
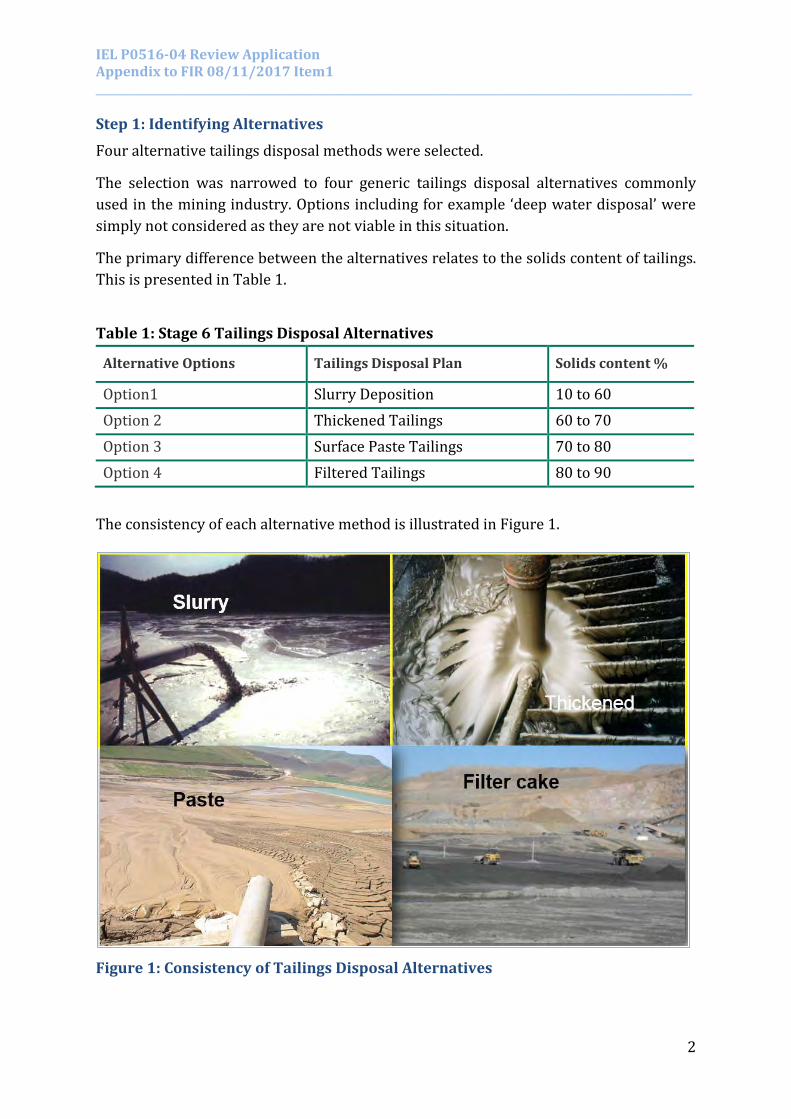
IEL P0516-04 Review Application Appendix to FIR 08/11/2017 Item1 ______________________________________________________________________________________________________________
2
Step 1: Identifying Alternatives
Four alternative tailings disposal methods were selected.
The selection was narrowed to four generic tailings disposal alternatives commonly used in the mining industry. Options including for example ‘deep water disposal’ were simply not considered as they are not viable in this situation.
The primary difference between the alternatives relates to the solids content of tailings. This is presented in Table 1.
Table 1: Stage 6 Tailings Disposal Alternatives
Alternative Options Tailings Disposal Plan Solids content %
Option1 Slurry Deposition 10 to 60 Option 2 Thickened Tailings 60 to 70 Option 3 Surface Paste Tailings 70 to 80 Option 4 Filtered Tailings 80 to 90
The consistency of each alternative method is illustrated in Figure 1.
Figure 1: Consistency of Tailings Disposal Alternatives
IEL P0516-04 Review Application Appendix to FIR 08/11/2017 Item1 ______________________________________________________________________________________________________________
3
Step 2: Screening of Alternatives A screening assessment of alternatives was undertaken. Screening is the first step in eliminating alternatives that are either flawed or not site suitable. A basic ‘set of criteria’ was adopted based on considerable experience of experts in the project team; Will there be adequate water storage1? Will the disposal method suitable for Tara tailings (particle size distribution)2? Will it provide adequate water treatment? Is it suitable in a lined facility? Potential environmental impact (air / noise / light / energy use)? Is there additional construction requirements? Will it result in positive project economics?
The screening assessment is presented in Table 2.
Following the screening stage, Option 4 (the filter cake option) was eliminated from further evaluation, due to a number of reasons but primarily;
potential mechanical damage to the lining system from either trucks or conveyor system,
insufficient storage capacity to manage storm events having the greatest negative environmental impacts.
The three remaining alternatives were carried through assessment via MAA technique.
Option 1: Conventional slurry disposal Option 2: Thickened disposal (Thickener plant located at Knockumber processing plant) Option 3: Paste disposal (Paste plant located at Randalstown).
1 TSF acts as a repository for solids and as a reservoir for water used in the process 2 Coarse fraction tailings are used to hydraulically backfill underground stopes. The fines tailings (slimes) are deposited in TSF. When backfilling is not required, total tailings (sand and slimes) are discharged to TSF

IEL P0516-04 Review Application Appendix to FIR 08/11/2017 Item1 ______________________________________________________________________________________________________________
4
Step 3: Characterisation of Alternatives MAA requires selection of the most important criteria to allow for a relative comparison between alternatives.
In this instance four broad categories of issues were defined, referred to as main accounts3 ;
1. Technical Account (focusing on engineering elements) 2. Environmental Account (focusing on environmental issues raised during the
consultation process) 3. Socio-Economic Account (focusing on aesthetics and employment) 4. Project Economics Account (focusing of the life of project economics)
In turn, all stakeholder issues, referred to as ‘sub-accounts’4 , were grouped under one of the main accounts.
Subaccounts are defined as any material impact (benefit or cost) associated with any of the alternatives being evaluated.
Within each sub-account, an ‘indicator value’ of the issue is defined to give a clear understandable description of the impact.
It should be noted that while some were straightforward and quantitative (such as project economics) others were more difficult to accurately describe / quantify and are qualitative (such as water quality).
Characterisation criteria for each sub-account are presented in Table 3.
3 Technical, Environmental, Socio-economics and project economics 4 Any material impact (benefit or cost) associated with any of the alternatives being evaluated
IEL P0516-04 Review Application Appendix to FIR 08/11/2017 Item1 ______________________________________________________________________________________________________________
5
Step 4: Multiple Accounts Ledger MAA requires a ‘multiple accounts ledger’ to be developed.
All accounts and subaccounts are listed on the MAA ledger.
When the ledger was completed, numerical evaluations were undertaken.
Step 5: Value-Based Decision Process A ‘value-based’ decision process was used involving scoring and weighting analysis.
Since separation of the alternatives may be either very slight or very significant a Scaled Value (S) was assigned to each alternative with respect to indicator of each subaccount. A five point scale ( 1 to 5) was used where the higher value indicated the better option.
Then a Weighting factor (W) was applied to all indicators in the ledger to distinguish the relative ‘importance’ of each account and sub-account.
A weight of ‘5’ indicated a ‘high value’ of importance; while a ‘1’ value indicated ‘low value’ or low relative importance.
The weighting factors approved by the project team are presented in Table 4.
MMA Outcome
The cumulative ‘score’ of one alternative compared to another in any subaccount was obtained by;
Adding together the products of Scalar Value and Weight of indicator in each subaccount and normalising by dividing by the sum of weights for the indicator of that subaccount.
Sub-Account Score = ∑ [Scalar Values X Weights of indicator]
___________________________________________________
∑ Weights of indicator
The higher the score, the more favorable the alternative in any one category.
The process of adding together the sub-account scores to obtain the account scores for the four accounts and the overall MAA score follows the same procedure of weighting and normalisation. The numerical evaluation is presented in Tables 5 and 6.
IEL P0516-04 Review Application Appendix to FIR 08/11/2017 Item1 ______________________________________________________________________________________________________________
6
A summary of the Overall MAA Score is:
Option 1 : Slurry tailings disposal 3.85 Option 2 : Thickened tailings disposal 3.22 Option 3 : Paste tailings disposal 2.30
Summary and Conclusion Four tailings disposal alternatives were identified for the Stage 6 TSF development. MAA was used as a means to effectively evaluate different alternatives.
Three alternatives were carried through assessment process:
Option 1 : Slurry tailings disposal
Option 2 : Thickened tailings disposal
Option 3 : Paste tailings disposal
Numerical evaluations were undertaken and the alternative with the highest overall score indicating the most favorable method.
It was concluded that Option 1, slurry deposition, was the most suitable, or advantageous, method for tailings deposition.

IEL P0516-04 Review Application Appendix to FIR 08/11/2017 Item1 ______________________________________________________________________________________________________________
7
Table 2: Screening Assessment Pre-Screening Criteria Option 1 (Slurry) Option 2 (Thickened) Option 3 (Paste) Option 4 (Filtered)
Will it provide for water Storage5
Yes Yes Yes but paste will be discharged under water
No – separate water storage required
Is disposal method suitable for Tara Tailings
Yes – Slimes and total tailings readily sent to TSF
No – Slimes and total tailings will behave differently in the thickener
No – Slimes and total tailings will behave differently in the paste plant
No – Slimes and total tailings will behave differently in the filter plant
Will it provide for water treatment
Yes – greater volume of water increases settlement time therefore less metal concentration
Yes but with less water volume = higher concentration
Yes but with less water volume = higher concentration
Yes but much lower water volume = higher metal concentration
Suitable for discharge in lined facility
Yes, liner readily protected Yes, liner readily protected Yes, liner readily protected No - liner difficult to protect from conveyor system / trucks
Environmental impacts
No additional noise or additional lighting required. Tailings in saturated conditions – not prone to dusting
Additional electrical energy required for thickener. Noise and light generated from plant running 24 hours. Tailings prone to dusting
Additional electrical energy required for paste plant. Noise and plant generated for plant running 24 hours. Tailings prone to dusting
Additional electrical energy required for filter plant. Noise generated form plant running 24 hours. Tailings prone to dusting
Additional Construction Requirements
No Yes (dewatering of tailings by thickener)
Yes (dewatering of tailings by deep cone thickener)
Yes (dewatering of tailings by mechanical or vacuum press)
Positive Project Economics
Yes Yes No No
Should alternative be excluded from further Assessment
No No No Yes
5 The TSF also acts as a water reservoir

IEL P0516-04 Review Application Appendix to FIR 08/11/2017 Item1 ______________________________________________________________________________________________________________
8
Table 3: Characterisations criteria for each account of the alternatives Characterisation Criteria
Indicator Value Option1 ( Slurry ) Option 2 (Thickened) Option 3 (Paste)
Technical Physical characteristics of tailings
Tailings pumped to TSF are both slimes and total tailings separately
Deposited as slurry Deposited as thickened tailings Deposited as paste tailings
Supporting infrastructure design
Dewatering of tailings by thickeners No requirements
Thickener Plant at the Processing site. Pumping to TSF at increased pressure - new pipeline and pumps required. Thickener plant will need to be designed for both slime and total tailings
Paste plant at the TSF. Increased pumping pressure - additional pipelines and positive displacement pumps required. Paste plant will need to be designed for both slime and total tailings
Tailings delivery and deposition system design
Delivery and deposition design Current disposal method New delivery pipe line on the
crest required New delivery pipe line on the crest required
Beach slope angle Impact on storage capacity and closure design
Flatter beaches obtained from slurry which maximises storage capacity
Beach slope angle is generally higher compared to slurry deposition resulting in a potential loss of storage due to steeper slope.
Beach slope angle is generally higher for Paste tailings compared to thickened deposition resulting in a potential loss of storage due to steeper slope.
Water management system design
TSF acts as water reservoir – storage required No additional requirements No additional requirements
No additional requirements but paste could end up being placed under water
Closure design Plan to cap with soil and vegetate.
Requires longer time for surface tailings to desiccate
Requires shorter time for surface tailings to desiccate
Requires shortest time for surface tailings to desiccate
Precedent Proven method Method adopted for past 40 Unknown in Tara context - Unknown in Tara context -

IEL P0516-04 Review Application Appendix to FIR 08/11/2017 Item1 ______________________________________________________________________________________________________________
9
Characterisation Criteria
Indicator Value Option1 ( Slurry ) Option 2 (Thickened) Option 3 (Paste)
years will depend on ability of thickener to manage two tailings streams
will depend on ability of paste plant to manage two tailings streams
Technical risks Failure of operation Simplest to operate and least technical risk
Relatively simple to operate and additional risk managed at plant site
Maintaining paste consistency is main risk and contingencies required for any variation in solids content.
Environmental Geochemical characterisation of tailings
Acid generating potential of tailings
No impact - tailings not acid generating No impact No impact
Atmospheric issues Dust Blow Tailings maintained in saturated condition
Prone to dusting in dry weather - extensive sprinkler system required
Prone to dusting in dry weather - extensive sprinkler system required
Overall affected land footprint of impoundment
Difference in footprint size Has maximum footprint area Potentially less footprint area
Potentially least footprint area
Water Treatment TSF is integral part of existing water management system
Greatest volume of water to be treated (high volume, low concentration)
Less volume of water to be treated (medium volume, medium concentration)
Least volume of water to be treated (low volume, high concentration)
Environmental risks Impact of failure
Potentially greater volume of water on Stage 6 and therefore the consequences of failure are higher
Potentially less volume of water on Stage 6 and therefore the consequences of failure are lower
Potentially less volume of water on Stage 6 and therefore the consequences of failure are lower
Energy Usage Energy requirements High energy usage associated with pumping slurry.
Higher energy requirement to manufacture and construct thickener, replace
Higher energy requirement to manufacture and construct paste plant,
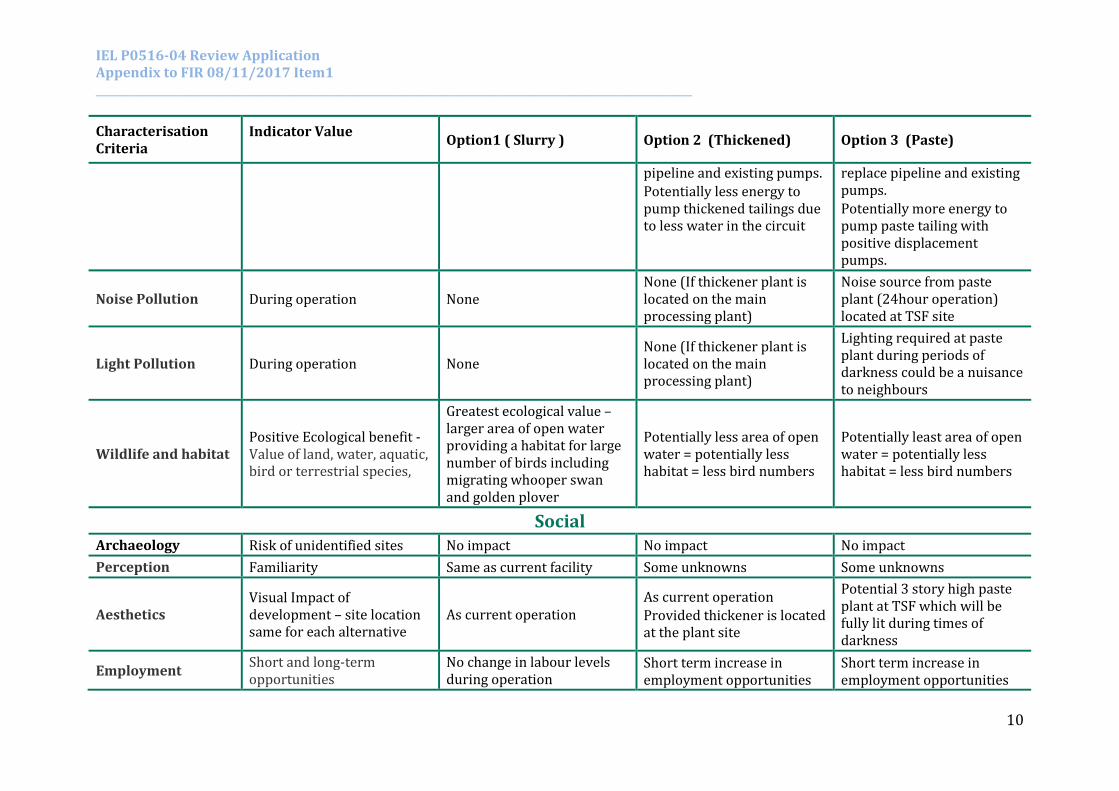
IEL P0516-04 Review Application Appendix to FIR 08/11/2017 Item1 ______________________________________________________________________________________________________________
10
Characterisation Criteria
Indicator Value Option1 ( Slurry ) Option 2 (Thickened) Option 3 (Paste)
pipeline and existing pumps. Potentially less energy to pump thickened tailings due to less water in the circuit
replace pipeline and existing pumps. Potentially more energy to pump paste tailing with positive displacement pumps.
Noise Pollution During operation None None (If thickener plant is located on the main processing plant)
Noise source from paste plant (24hour operation) located at TSF site
Light Pollution During operation None None (If thickener plant is located on the main processing plant)
Lighting required at paste plant during periods of darkness could be a nuisance to neighbours
Wildlife and habitat Positive Ecological benefit - Value of land, water, aquatic, bird or terrestrial species,
Greatest ecological value – larger area of open water providing a habitat for large number of birds including migrating whooper swan and golden plover
Potentially less area of open water = potentially less habitat = less bird numbers
Potentially least area of open water = potentially less habitat = less bird numbers
Social Archaeology Risk of unidentified sites No impact No impact No impact Perception Familiarity Same as current facility Some unknowns Some unknowns
Aesthetics Visual Impact of development – site location same for each alternative
As current operation As current operation Provided thickener is located at the plant site
Potential 3 story high paste plant at TSF which will be fully lit during times of darkness
Employment Short and long-term opportunities
No change in labour levels during operation
Short term increase in employment opportunities
Short term increase in employment opportunities

IEL P0516-04 Review Application Appendix to FIR 08/11/2017 Item1 ______________________________________________________________________________________________________________
11
Characterisation Criteria
Indicator Value Option1 ( Slurry ) Option 2 (Thickened) Option 3 (Paste)
in manufacturing and installing thickener, pipes and pumps. No change in labour level during operation
in manufacturing and installing paste plant, pipes and pumps. Minimum of 2 increase in labour level during operation
Project Economics Capital Expenditure Material and construction
costs Least expensive Less expensive Most expensive
Operational Expenditure
Consumables, energy and labour costs Least expensive Less expensive Most expensive
Closure Cost Material and construction costs Most expensive Less expensive Least expensive

IEL P0516-04 Review Application Appendix to FIR 08/11/2017 Item1 ______________________________________________________________________________________________________________
12
Table 4: Weightings of indicators in Accounts and Sub-Accounts
Account Weight Sub Account Score
Technical Issues 4
Physical characteristics of the tailings 5 Supporting infrastructure design 3 Tailings delivery and deposition system design 3 Beach slope angle 3 Water management system design 5 Closure design 3 Precedent 5 Technical risk 5
Environmental Issues 5
Atmospheric issues 5 Overall affected land footprint size of impoundment 3 Water Treatment 5 Environmental risk 5 Energy Usage 3 Noise 5 Light 3 Wildlife and habitat 3
Socio-Economics Issues 3
Perception 4 Aesthetics 5 Employment 3
Project Economic 3
Capital Cost 5 Operating Cost 3 Closure Cost 5
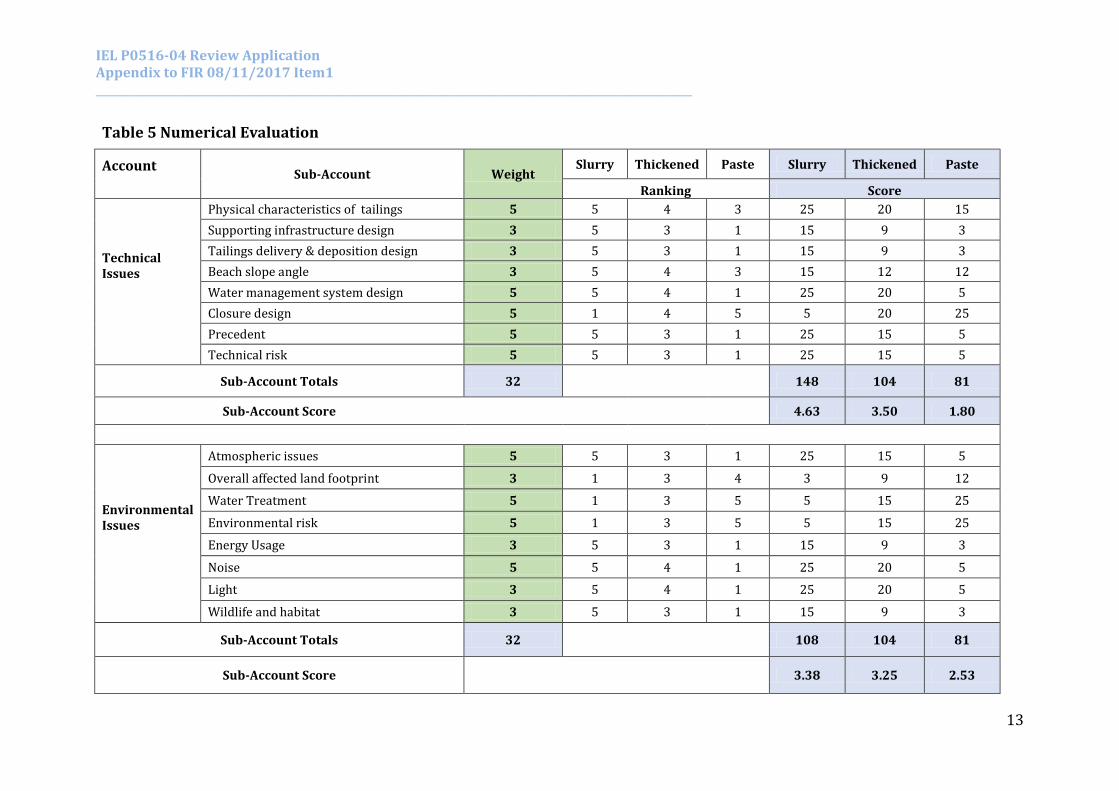
IEL P0516-04 Review Application Appendix to FIR 08/11/2017 Item1 ______________________________________________________________________________________________________________
13
Table 5 Numerical Evaluation
Account Sub-Account Weight
Slurry Thickened Paste Slurry Thickened Paste
Ranking Score
Technical Issues
Physical characteristics of tailings 5 5 4 3 25 20 15 Supporting infrastructure design 3 5 3 1 15 9 3 Tailings delivery & deposition design 3 5 3 1 15 9 3 Beach slope angle 3 5 4 3 15 12 12 Water management system design 5 5 4 1 25 20 5 Closure design 5 1 4 5 5 20 25 Precedent 5 5 3 1 25 15 5 Technical risk 5 5 3 1 25 15 5
Sub-Account Totals 32 148 104 81
Sub-Account Score 4.63 3.50 1.80
Environmental Issues
Atmospheric issues 5 5 3 1 25 15 5
Overall affected land footprint 3 1 3 4 3 9 12
Water Treatment 5 1 3 5 5 15 25
Environmental risk 5 1 3 5 5 15 25
Energy Usage 3 5 3 1 15 9 3
Noise 5 5 4 1 25 20 5
Light 3 5 4 1 25 20 5
Wildlife and habitat 3 5 3 1 15 9 3
Sub-Account Totals 32 108 104 81
Sub-Account Score 3.38 3.25 2.53

IEL P0516-04 Review Application Appendix to FIR 08/11/2017 Item1 ______________________________________________________________________________________________________________
14
Account Sub-Account Weight
Slurry Thickened Paste Slurry Thickened Paste
Ranking Score
Socio-Economic Issues
Perception 4 5 3 1 20 12 4
Aesthetics 5 5 3 1 25 15 5
Employment 3 1 3 5 3 9 15
Sub-Account Totals 12 48 36 24
Sub-Account Score 4.00 3.00 2.00
Project Economics Issues
Capital Cost 5 5 3 1 25 15 5
Operating Cost 3 5 3 1 15 9 3
Closure Cost 5 1 3 5 5 15 25
Sub-Account Totals 13 45 39 36
Sub-Account Score 3.46 3.00 2.77

IEL P0516-04 Review Application Appendix to FIR 08/11/2017 Item1 ______________________________________________________________________________________________________________
15
Table 6 Numerical Evaluation
Account Weight Slurry Thickened Paste Slurry Thickened Paste
Sub Account Score Score
Technical Account 4 4.63 3.50 1.80 19 14 8
Environmental Account 5 3.38 3.25 2.53 17 16 13
Socio-Economic Account 3 4.00 3.00 2.00 12 9 6
Project Economics Account 3 3.46 3.00 2.77 10 9 8
Account Total 15 58 48 34
Overall MAA Score 3.85 3.22 2.30