Boiler T ube Scale Deposit Measurement Program Tube Scale Deposit... · Boiler T ube Scale Deposit...
20
Boiler Tube Scale Deposit Measurement Program Valmet Inc., Energy and Environmental (ENE) 3430 Toringdon Way Charlotte, NC Contact: Mike Ward | 704-414-3468 | [email protected]
Transcript of Boiler T ube Scale Deposit Measurement Program Tube Scale Deposit... · Boiler T ube Scale Deposit...
Boiler Tube Scale DepositMeasurement Program
Valmet Inc., Energy and Environmental (ENE)3430 Toringdon Way
Charlotte, NC
Contact: Mike Ward | 704-414-3468 | [email protected]

Industry Strategies for Cleaning Boilers� Chemical clean boilers on a regular
interval– Example; every 5 -10 years– Excessive or unnecessary cleaning can
cause tube damage
� Remove sample tubes for DWDanalysis and chemically clean basedon analysis– Annual– Other interval
� Maintain strict water chemistrycontrols– A delay of one or two years on a dirty boiler
can result in major tube damage.
� Type of Boiler (RB vs PB) and use� Clean following major upgrade or
rebuild as required (10% or morereplacement)

Factors Affecting A Successful Strategy
� Water chemistry incidents betweencleaning intervals– Major or several small incidents– Do your incident corrective actions include a tube
sample at next opportunity?
� Water chemistry controls– Condensate return fouling– Makeup water contamination
� Change in treatment strategy– Coordinated PO4 to All-volatile
� Change in fuels or burner design– Coal to gas conversion, changes high heat zone
� If chemical cleaning is improperlyperformed, it can result in– Excessive cleaning time– Tube wall thinning
� Insufficient cleaning can lead to– Possible corrosion damage– Loss of heat transfer.
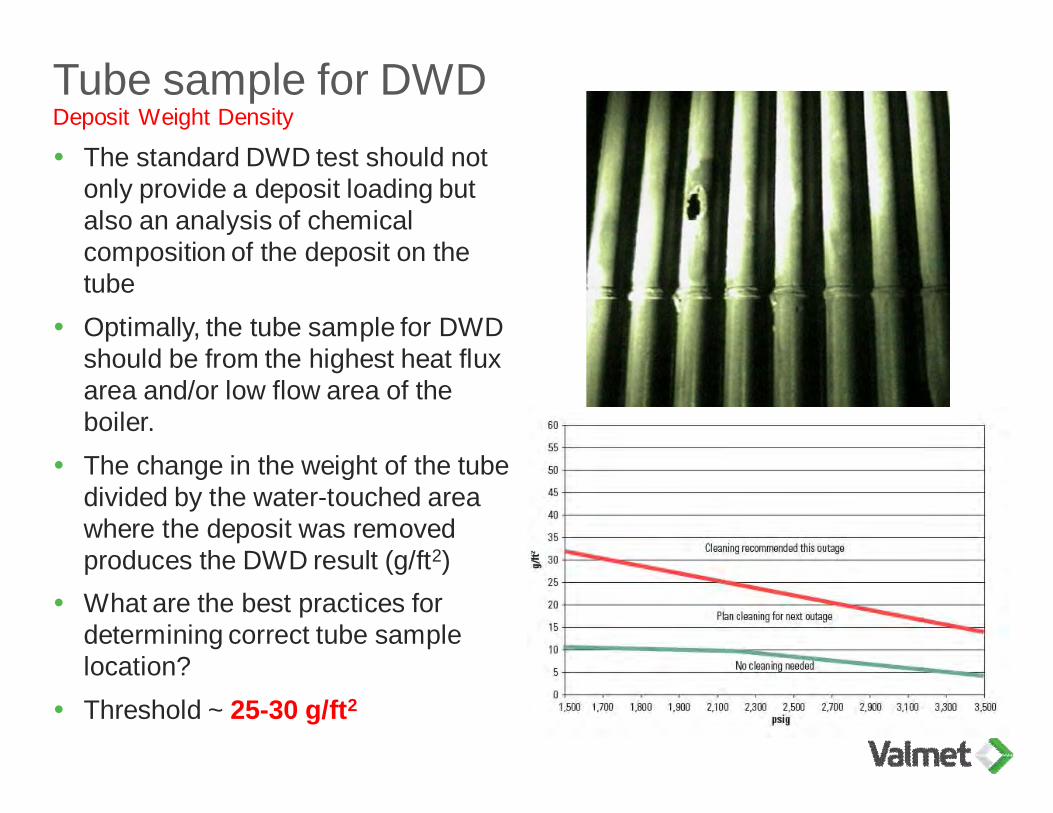
Tube sample for DWDDeposit Weight Density
� The standard DWD test should notonly provide a deposit loading butalso an analysis of chemicalcomposition of the deposit on thetube
� Optimally, the tube sample for DWDshould be from the highest heat fluxarea and/or low flow area of theboiler.
� The change in the weight of the tubedivided by the water-touched areawhere the deposit was removedproduces the DWD result (g/ft2)
� What are the best practices fordetermining correct tube samplelocation?
� Threshold ~ 25-30 g/ft2
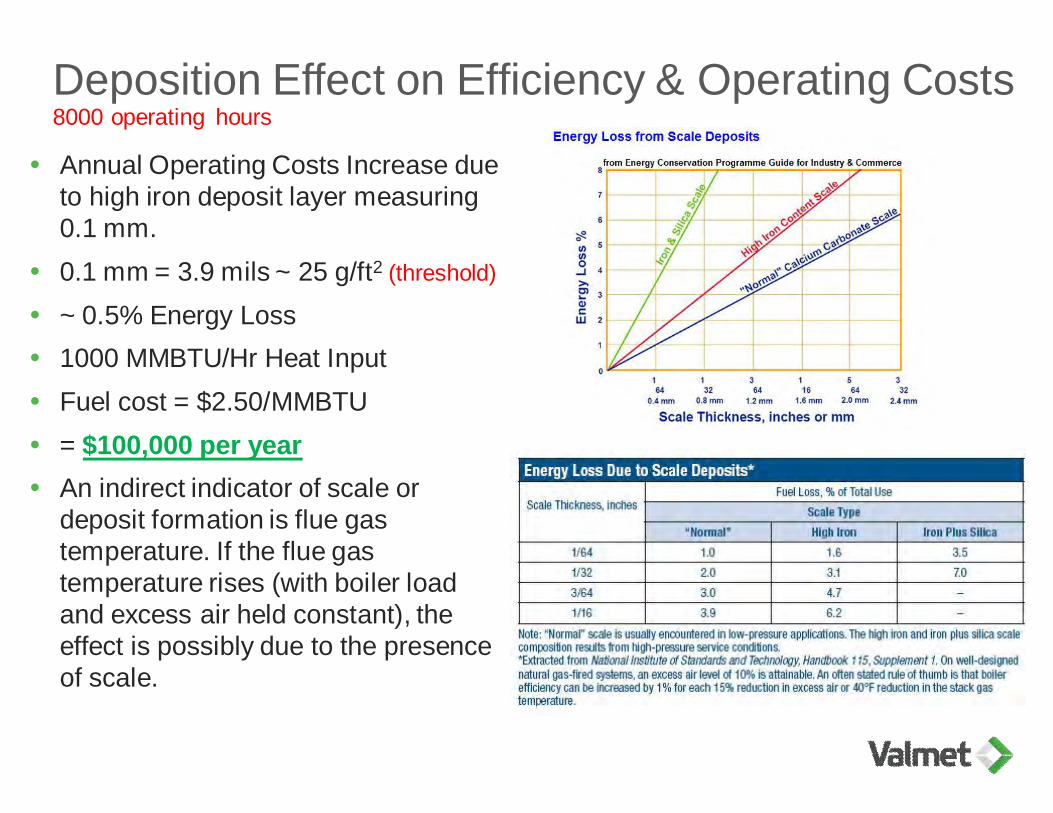
Deposition Effect on Efficiency & Operating Costs8000 operating hours
� Annual Operating Costs Increase dueto high iron deposit layer measuring0.1 mm.
� 0.1 mm = 3.9 mils ~ 25 g/ft2 (threshold)
� ~ 0.5% Energy Loss� 1000 MMBTU/Hr Heat Input� Fuel cost = $2.50/MMBTU� = $100,000 per year� An indirect indicator of scale or
deposit formation is flue gastemperature. If the flue gastemperature rises (with boiler loadand excess air held constant), theeffect is possibly due to the presenceof scale.
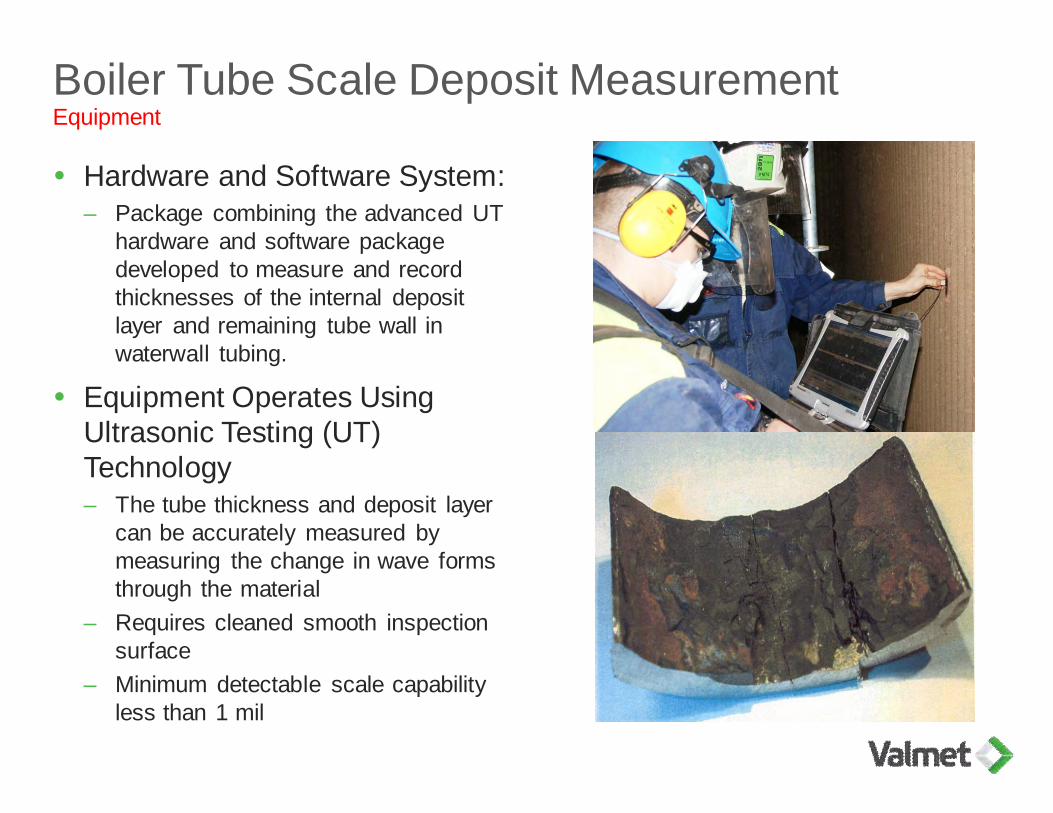
Boiler Tube Scale Deposit MeasurementEquipment
� Hardware and Software System:– Package combining the advanced UT
hardware and software packagedeveloped to measure and recordthicknesses of the internal depositlayer and remaining tube wall inwaterwall tubing.
� Equipment Operates UsingUltrasonic Testing (UT)Technology– The tube thickness and deposit layer
can be accurately measured bymeasuring the change in wave formsthrough the material
– Requires cleaned smooth inspectionsurface
– Minimum detectable scale capabilityless than 1 mil
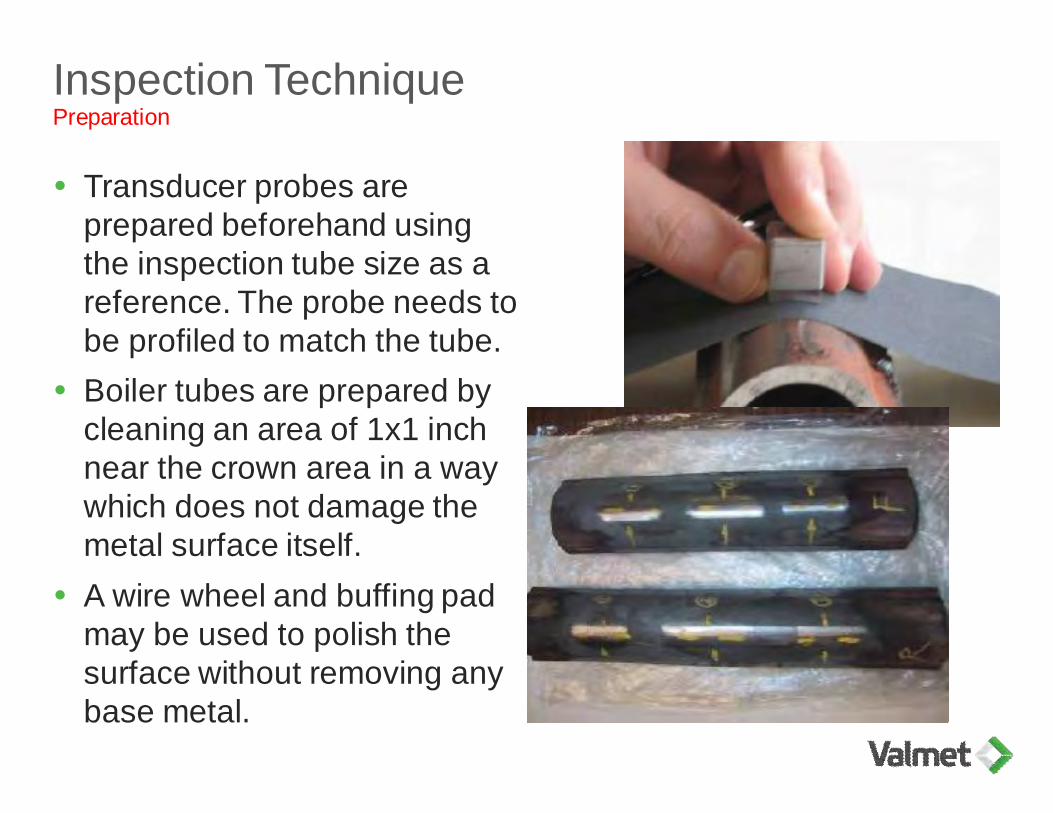
Inspection TechniquePreparation
� Transducer probes areprepared beforehand usingthe inspection tube size as areference. The probe needs tobe profiled to match the tube.
� Boiler tubes are prepared bycleaning an area of 1x1 inchnear the crown area in a waywhich does not damage themetal surface itself.
� A wire wheel and buffing padmay be used to polish thesurface without removing anybase metal.
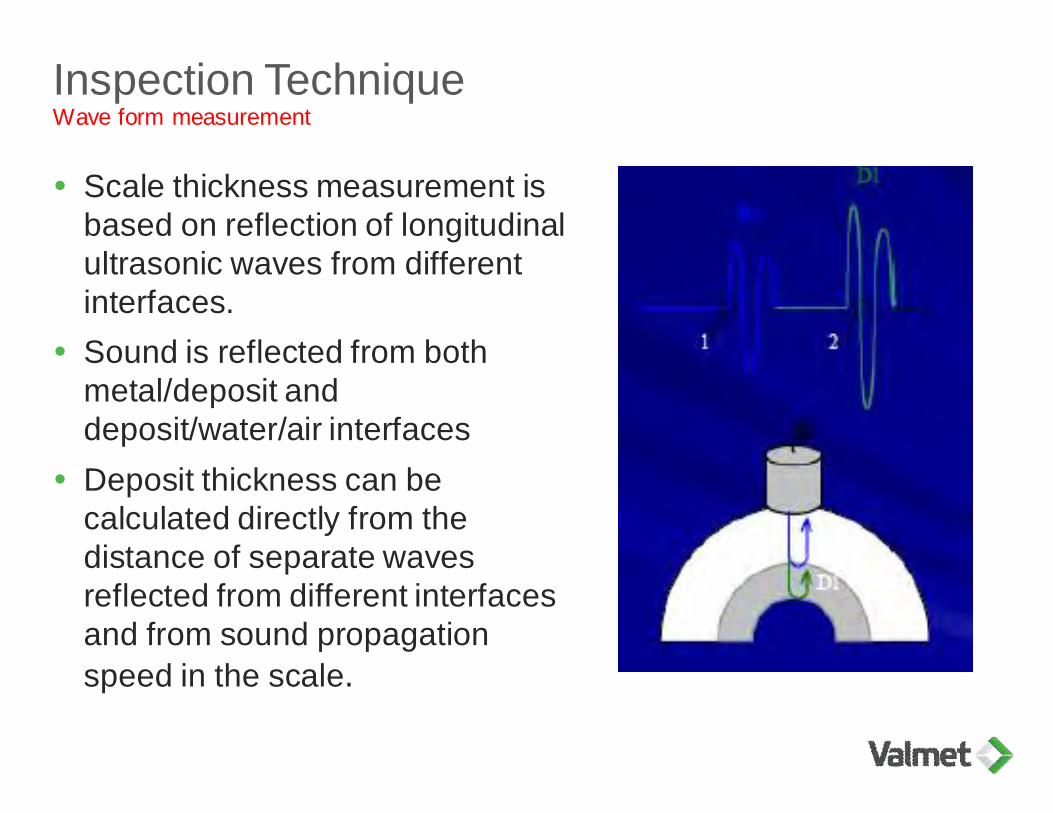
Inspection TechniqueWave form measurement
� Scale thickness measurement isbased on reflection of longitudinalultrasonic waves from differentinterfaces.
� Sound is reflected from bothmetal/deposit anddeposit/water/air interfaces
� Deposit thickness can becalculated directly from thedistance of separate wavesreflected from different interfacesand from sound propagationspeed in the scale.

Inspection TechniqueWave form measurement
� With a deposit the waves reflectedfrom the deposit and water/airinterface widen noticeably. Thewaves are combined (B1+D1).
� B1+D1 is gain adjusted andcompared to the known metalmaterial wave.
� The change in wave width (Dt) is thescale thickness.
� Calibration is by checking the zeropoint from a scale free tube. If a tubesample containing scale is available,the measurement can be fine tuned.
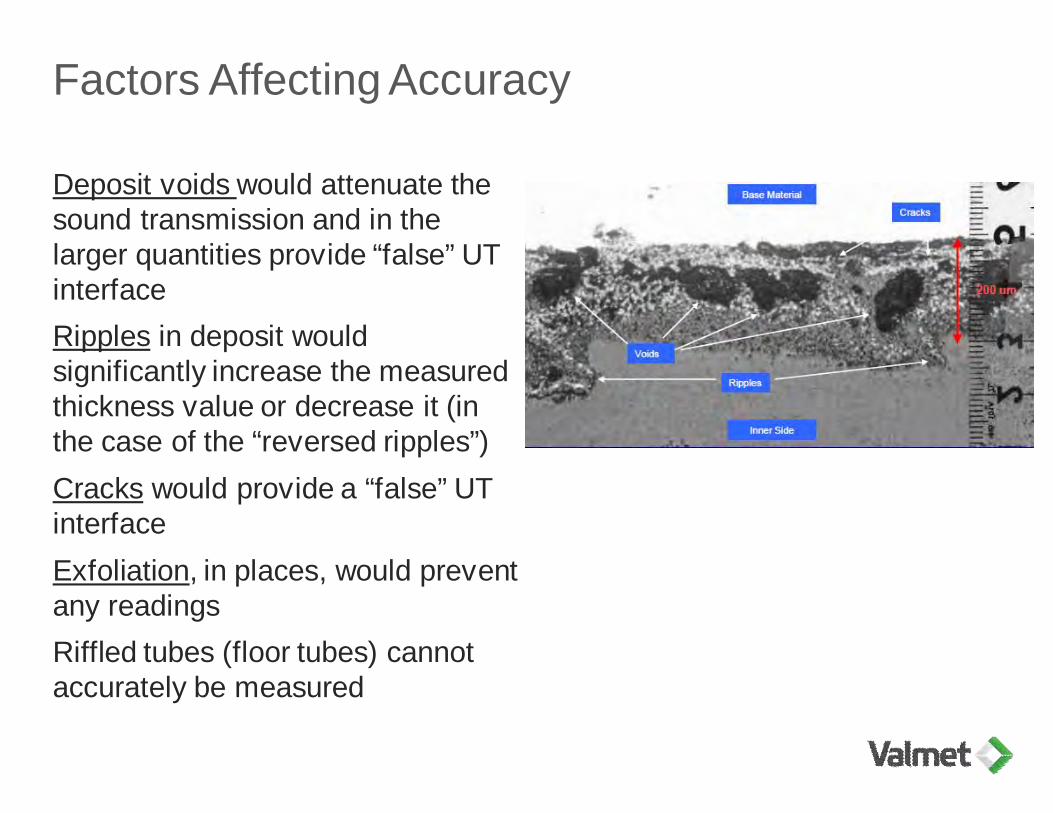
Factors Affecting Accuracy
Deposit voids would attenuate thesound transmission and in thelarger quantities provide “false” UTinterfaceRipples in deposit wouldsignificantly increase the measuredthickness value or decrease it (inthe case of the “reversed ripples”)Cracks would provide a “false” UTinterfaceExfoliation, in places, would preventany readingsRiffled tubes (floor tubes) cannotaccurately be measured
Benefits• Measures tube scale deposit thickness with direct correlation to
standard Deposit Weight Density (DWD) method using advanced UTmethod.
• Internal scales in furnace tubes can be measured in hundreds ofpoints.
• Tube samples are taken only when needed where needed.• When scale growth is monitored frequently, corrective actions can be
carried out in time (before corrosion risks increase).• The impacts of water treatment become clearly visible: water treatment
can be optimized so that acid cleaning interval can be extended oracid cleanings can be completely prevented.
• On-line monitoring of acid cleaning: acid treatment phase can beextended or terminated as needed. Cleaning results can be verified(vs. guarantees).
• Results can be used to replace a few “problem” tubes instead of acidcleaning entire boiler.

Technology Enhances Chemical Cleaning
Equipment can be usedto monitor effectivenessof cleaning§ Minimizes potential for
tube damage due toexcessive cleaning
§ Cleaning time isoptimized to improveboiler availability

Internal Scale In Furnace Wall TubesSample Tubes
Sample Scale thickness on the average ≈ 6 milsmaximum 8 – 12 mils
3 – 4 mils consider cleaning(20-25 g/ft2) DWD
Thick scales are not detectable by endoscopy
Damaged tube
Detectable by endoscopy
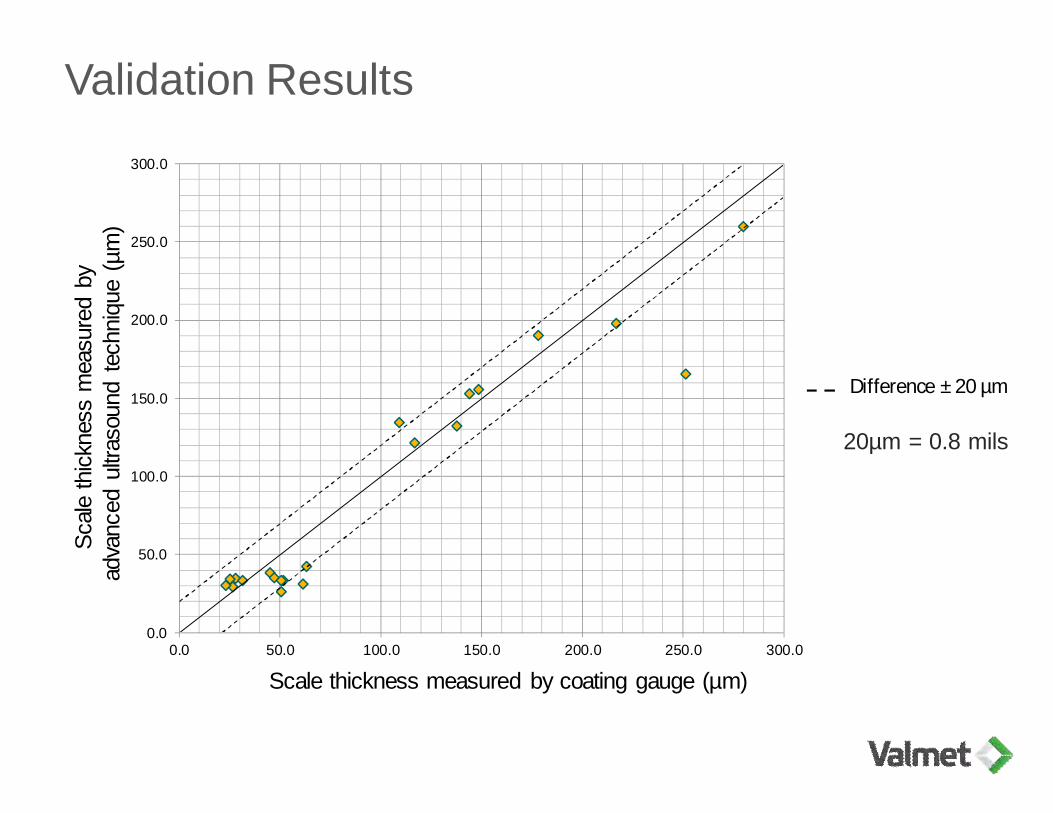
Validation Results
0.0
50.0
100.0
150.0
200.0
250.0
300.0
0.0 50.0 100.0 150.0 200.0 250.0 300.0
Ultr
aään
imitt
auks
entu
los
[µm
]
Pintakalvomittarin tulos [µm]
Difference ± 20 µm
Scale thickness measured by coating gauge (µm)
Scal
eth
ickn
ess
mea
sure
dby
adva
nced
ultra
soun
dte
chni
que
(µm
)
20µm = 0.8 mils
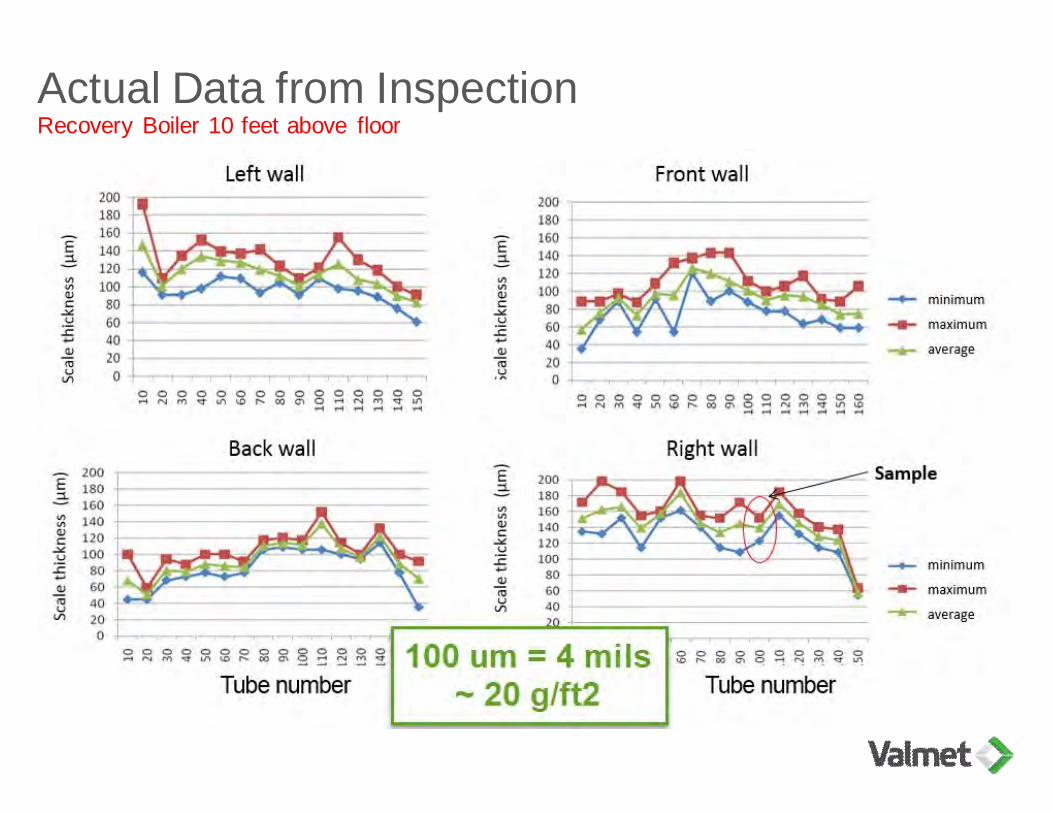
Actual Data from InspectionRecovery Boiler 10 feet above floor
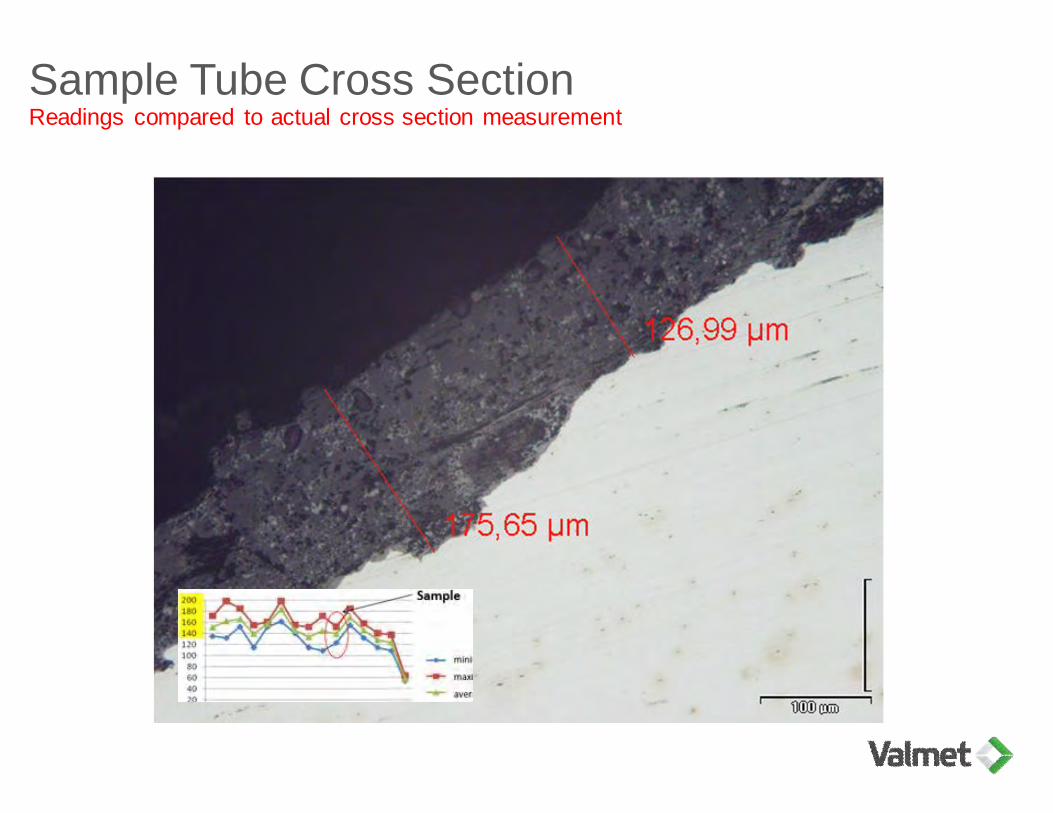
Sample Tube Cross SectionReadings compared to actual cross section measurement
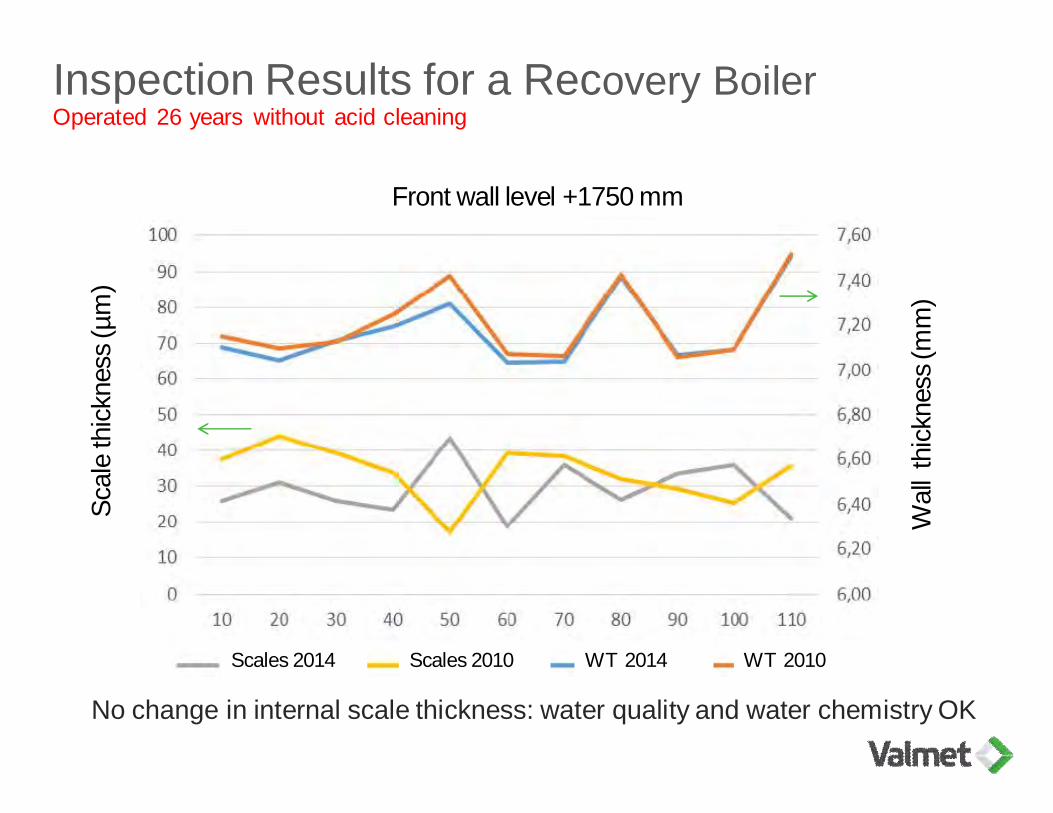
Inspection Results for a Recovery BoilerOperated 26 years without acid cleaning
Front wall level +1750 mm
Scales 2014 Scales 2010 WT 2014 WT 2010
Scal
eth
ickn
ess(
µm)
Wal
lthi
ckne
ss(m
m)
No change in internal scale thickness: water quality and water chemistry OK
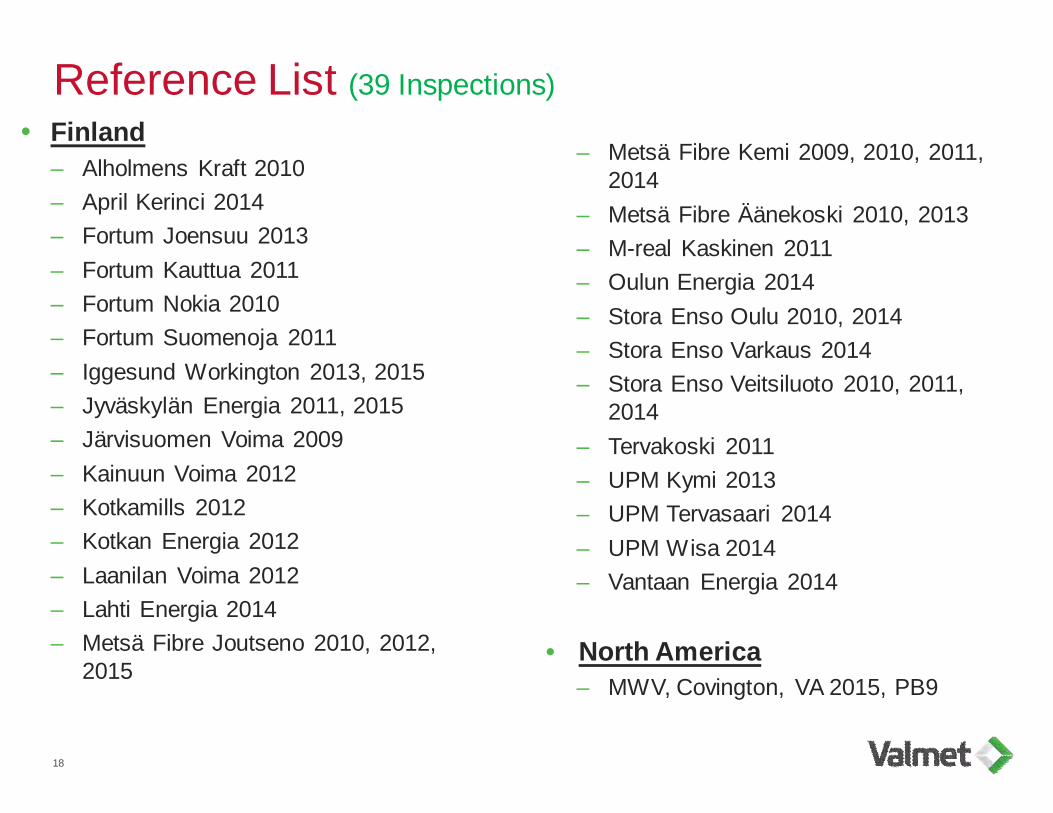
Reference List (39 Inspections)� Finland
– Alholmens Kraft 2010– April Kerinci 2014– Fortum Joensuu 2013– Fortum Kauttua 2011– Fortum Nokia 2010– Fortum Suomenoja 2011– Iggesund Workington 2013, 2015– Jyväskylän Energia 2011, 2015– Järvisuomen Voima 2009– Kainuun Voima 2012– Kotkamills 2012– Kotkan Energia 2012– Laanilan Voima 2012– Lahti Energia 2014– Metsä Fibre Joutseno 2010, 2012,
2015
18
– Metsä Fibre Kemi 2009, 2010, 2011,2014
– Metsä Fibre Äänekoski 2010, 2013– M-real Kaskinen 2011– Oulun Energia 2014– Stora Enso Oulu 2010, 2014– Stora Enso Varkaus 2014– Stora Enso Veitsiluoto 2010, 2011,
2014– Tervakoski 2011– UPM Kymi 2013– UPM Tervasaari 2014– UPM Wisa 2014– Vantaan Energia 2014
• North America– MWV, Covington, VA 2015, PB9
SummarySuccessful program
The best results are achieved when inspections are made at regularintervals so that fast deposit growth rates can be detected at an earlystage.ValueMethod would provide more data to support chemical cleaning strategy.Mills could extend their chemical clean cycle and/or this technology couldbe used to determine where best to take a tube sample –or-not take atube sample and instead rely on this technology.To draw a direct correlation to DWD would require deposit analysis, so atleast one sample is recommended. Then shift to annual (or greater)deposit UT method.