BOGLE INVESTMENT MANAGEMENT SMALL CAP GROWTH FUND
24
BOGLE INVESTMENT MANAGEMENT SMALL CAP GROWTH FUND Privacy Notice (Unaudited) The Bogle Investment Management Small Cap Growth Fund of The RBB Fund, Inc. (the “Fund”) is committed to protecting the confidentiality and security of your private invest- ment records and personal information. Our policies and procedures are designed to safe- guard your information and to permit only appropriate and authorized access to and use of this information. In order to carry out the functions necessary to service your investment account, our ser- vice providers collect certain nonpublic personal information from you from the following sources: • Information we receive from you over the telephone, on applications, e-mails or other forms (e.g., your name, social security number and address); and • Information about your transactions with the Fund We restrict access to your personal and account information to those service providers and their employees who need to know that information to service your account. The Fund may also share all of the information (as described above) that we collect with companies that perform marketing services on our behalf or with other financial institutions with whom we have joint marketing agreements who may suggest additional Fund services or other invest- ment products which may be of interest to you. We maintain physical, electronic, and proce- dural safeguards that comply with federal standards to guard your nonpublic personal information. You can be assured that the Fund considers your data to be private and confidential, and we will not disclose any nonpublic personal information about you to any unaffiliated third parties, except as permitted by law. If you decide to close your account(s) or become an inac- tive customer, we will adhere to the privacy policies and practices as described in this notice. If you have any questions or comments about our privacy practices, please call us at (877) 264-5346. April 2001
-
Upload
khanyasmin -
Category
Documents
-
view
672 -
download
3
description
Transcript of BOGLE INVESTMENT MANAGEMENT SMALL CAP GROWTH FUND

BOGLE INVESTMENT MANAGEMENTSMALL CAP GROWTH FUND
Privacy Notice(Unaudited)
The Bogle Investment Management Small Cap Growth Fund of The RBB Fund, Inc. (the“Fund”) is committed to protecting the confidentiality and security of your private invest-ment records and personal information. Our policies and procedures are designed to safe-guard your information and to permit only appropriate and authorized access to and use ofthis information.
In order to carry out the functions necessary to service your investment account, our ser-vice providers collect certain nonpublic personal information from you from the followingsources:
• Information we receive from you over the telephone, on applications, e-mails orother forms (e.g., your name, social security number and address); and
• Information about your transactions with the Fund
We restrict access to your personal and account information to those service providers andtheir employees who need to know that information to service your account. The Fund mayalso share all of the information (as described above) that we collect with companies thatperform marketing services on our behalf or with other financial institutions with whom wehave joint marketing agreements who may suggest additional Fund services or other invest-ment products which may be of interest to you. We maintain physical, electronic, and proce-dural safeguards that comply with federal standards to guard your nonpublic personalinformation.
You can be assured that the Fund considers your data to be private and confidential, and wewill not disclose any nonpublic personal information about you to any unaffiliated thirdparties, except as permitted by law. If you decide to close your account(s) or become an inac-tive customer, we will adhere to the privacy policies and practices as described in thisnotice.
If you have any questions or comments about our privacy practices, please call us at (877) 264-5346.
April 2001

Fellow Shareholder:
Results for the fiscal year ended August 31, 2001, were impacted by the negative economicand market environment that took hold right around the start of our fiscal year one yearago. Although our results were negative for this period, the Fund held up quite well com-pared to its small cap benchmark. As is our custom, we will report our results, attributethem to various market factors, critique our performance, and share with you recent devel-opments at our firm.
Investment Performance. The Bogle Small Cap Growth Fund returned -3.45% for theInvestor shares and -3.39% for the Institutional shares for the one-year period endedAugust 31, 2001. As mentioned above, these returns compare favorably with our benchmark,the unmanaged Russell 2000 index of smaller companies, which fell -11.63%. Since incep-tion on October 1, 1999 through August 31, 2001 the Fund’s annualized return has been+31.05% for the Investor shares (cumulative unannualized return of 68.08%) and +31.15%for the Institutional shares (cumulative unannualized return of 68.34%) versus the annu-alized return of +6.25% (cumulative unannualized return of 12.34%) for the benchmarkRussell 2000.
The fund outperformed the Russell 2000 in seven of the last twelve months, with its mostdifficult period in the three-month stretch between November 2000 and January 2001. It wasduring these three months that the economy appeared to reach a turning point and many com-panies with previously consistent growth and strong financial characteristics began to expe-rience powerful shifts in their business prospects. These shifts, which frequently result ina break in previous earnings trends, often make it more difficult for our process to addvalue.
Market Environment. A slowing economy, falling earnings, Federal Reserve rate cuts, anda decline in what investors were willing to pay for stocks (i.e. price multiple compressionand a renewed interest in “value” stocks) characterized the market environment fromSeptember 1, 2000 through August 31, 2001. Negative earnings pre-announcements rampedup significantly in September of last year. The negative news continued into the third quar-ter of this year, and as we are writing this letter, the situation continues to deterioratewith the horrific terrorist attacks in New York and Washington D.C. Please refer to ourearlier correspondence regarding these events. The Federal Reserve reacted to this weak-ness with its most aggressive easing campaign since 1982, reducing the Fed Funds rate bythree percentage points during the first eight months of this year (from 6.5% to 3.5%).Despite the Federal Reserve’s apparent efforts to orchestrate a “soft landing” in the econ-omy, the economy, earnings and stock prices experienced broad and significant declines. Wefeel that Small cap stocks have held up surprisingly well in the face of this economic con-traction and heightened uncertainty; typically such conditions lead to a preference forquality and liquidity and therefore larger cap stocks. However, small cap stocks have con-tinued their lead over large cap stocks, a lead that began two and a half years ago. Webelieve attractive valuation levels in small cap stocks relative to large caps explain muchof this phenomenon. In fact, it is small cap value stocks that have boosted the performanceof the small cap index. A strong and consistent return to value stocks over the last 16months is coincident with significant multiple compression as prices, and therefore pricemultiples, have fallen sharply from extremely (in retrospect) inflated levels.
BOGLE SMALL CAP GROWTH FUNDPORTFOLIO MANAGER’S LETTER
2

3
Past performance is not predictive of future performance
D
O
L
L
A
R
S
Bogle institutional Shares Russell 2000 Index Russell 2000 Growth Index
10/31/9910/1/99
8/31/00
9/30/00
10/31/00
11/30/00
12/31/001/31/01
2/28/01
3/31/01
4/30/01
5/31/01
6/30/01
7/31/01
8/31/01
5/31/00
2/29/00
1/31/00
12/31/993/31/00
7/31/00
6/30/00
4/30/00
11/30/99
$9,000
$8,000
$10,000
$11,000
$12,000
$16,000
$13,000
$14,000
$15,000
$19,000
$18,000
$23,000
$22,000
$21,000
$20,000
$17,000
Small Cap Growth Fund
Institutional Class $16,834 (3.39)% 31.15%
Russell 2000 Index $11,234 (11.63)% 6.25%
Russell 2000 Growth Index $8,876 (34.94)% (6.02)%
Total ReturnsOne Year EndedAugust 31, 2001
Value onAugust 31, 2001
AverageAnnual(3)
(1) The chart assumes a hypothetical $10,000 initial investment in the Fund made on October 1, 1999 (inception) and reflects Fund expenses. Investors should note that theFund is an actively managed mutual fund while the index is either unmanaged and doesnot incur expenses and/or is not available for investment.
(2) Bogle Investment Management waived a portion of its advisory fee and agreed toreimburse a portion of the Fund’s operating expenses, if necessary, to maintain theexpense limitation as set forth in the notes to the financial statements. Total returnsshown include fee waivers and expense reimbursements, if any; total returns wouldhave been lower had there been no waivers and reimbursements of fees and expensesin excess of expense limitations. Returns shown include the reinvestment of all divi-dends and other distributions. Past performance is not predictive of future perfor-mance. Investment return and principal value will fluctuate, so that your shares, whenredeemed, may be worth more or less than their original cost.
(3) For the period October 1, 1999 (commencement of operations) through August 31, 2001.
Comparison of Change in Value of $10,000 investment in Bogle Investment ManagementSmall Cap Growth Fund Institutional Class(1)(2) vs. Russell 2000 Index and
Russell 2000 Growth Index

4
Past performance is not predictive of future performance
D
O
L
L
A
R
S
Bogle investor Shares Russell 2000 Index Russell 2000 Growth Index
10/31/9910/1/99
8/31/00
9/30/00
10/31/00
11/30/00
12/31/001/31/01
2/28/01
3/31/01
4/30/01
5/31/01
6/30/01
7/31/01
8/31/01
5/31/00
2/29/00
1/31/00
12/31/993/31/00
7/31/00
6/30/00
4/30/00
11/30/99
$9,000
$8,000
$10,000
$11,000
$12,000
$16,000
$13,000
$14,000
$15,000
$19,000
$18,000
$23,000
$22,000
$21,000
$20,000
$17,000
Small Cap Growth Fund
Investor Class $16,808 (3.45)% 31.05%
Russell 2000 Index $11,234 (11.63)% 6.25%
Russell 2000 Growth Index $8,876 (34.94)% (6.02)%
Total ReturnsOne Year EndedAugust 31, 2001
Value onAugust 31, 2001
AverageAnnual(3)
(1) The chart assumes a hypothetical $10,000 initial investment in the Fund made on October 1, 1999 (inception) and reflects Fund expenses. Investors should note that theFund is an actively managed mutual fund while the index is either unmanaged and doesnot incur expenses and/or is not available for investment.
(2) Bogle Investment Management waived a portion of its advisory fee and agreed toreimburse a portion of the Fund’s operating expenses, if necessary, to maintain theexpense limitation as set forth in the notes to the financial statements. Total returnsshown include fee waivers and expense reimbursements, if any; total returns wouldhave been lower had there been no waivers and reimbursements of fees and expensesin excess of expense limitations. Returns shown include the reinvestment of all divi-dends and other distributions. Past performance is not predictive of future perfor-mance. Investment return and principal value will fluctuate, so that your shares, whenredeemed, may be worth more or less than their original cost.
(3) For the period October 1, 1999 (commencement of operations) through August 31, 2001.
Comparison of Change in Value of $10,000 investment in Bogle Investment ManagementSmall Cap Growth Fund Investor Class(1)(2) vs. Russell 2000 Index and
Russell 2000 Growth Index

Performance Attribution. This market environment proved somewhat challenging for ourinvestment process. Not only was there a sharp shift in the economy to deal with, but theportfolio tends to have a growth bias, a tilt that was strongly out of favor over this period.Although it was much more difficult for us to consistently add value this year, our stockselection process held up well overall. Our ability to pick good stocks compensated for thefact that the Fund was slightly more “growthy” than the benchmark. Positive stock selec-tion allowed us to tread water relative to the benchmark through most of the annualperiod. Three very strong months (last October and this April and July), contributed sig-nificantly to our benchmark-relative performance and accounted for most of our approxi-mately eight percentage points of value-added during the fiscal year. It is worth noting thatthese three months are months during which the bulk of quarterly earnings announcementswere made, confirming that our process is particularly productive when company-specificinformation, as opposed to widespread market movement, is driving prices of individual equi-ties. Finally, our biggest winners during the annual period were in the consumer-orientedsectors, including the following: Activision, a developer of video games; homebuilder NVR,Inc.; and Movie Gallery, a video retailer.
Investment Strategy and Current Positioning. We invest in companies that we believe havesustainable earnings growth and relatively attractive valuations. Conceptually, we combine1) an understanding of what analysts on Wall Street are saying about the growth and earn-ings prospects for companies with 2) our own analysis of firms’ financial strength to deter-mine whether or not accounting “techniques” (a euphemism for gimmicks) present simply theappearance of growth, with 3) a degree of price sensitivity. Importantly, we have developeda systematic and disciplined quantitative process designed to capture these fundamentalconcepts. In light of this framework, it is not surprising that elements of both growth(above-benchmark expected growth rates) and value (below-benchmark price-to-sales ratios)can be seen in the Fund’s fundamental characteristics presented in the chart below.
Report Card. We find it useful tocritique ourselves on how well wehave performed for you over thepast year. We measure ourselves onboth the risk-adjusted returns wegenerate in our portfolio, as wellas the level and quality of servicewe provide to our clients.
Our investment performanceapproximately met our expectationsthis fiscal year, albeit with lessconsistency than we would like.That said, in light of the marketenvironment over the last year weare pleased to have added valuewhen and where we could. Considering our outperformance relative to benchmark over aperiod of economic uncertainty, we grade ourselves B+ for this year.
Fundamental CharacteristicsAugust 31, 2001
RussellMedian BOGLX 2000________ _______ ________Median Market Cap (mil.) $715mm $731mmLong-Term Estimated
Earnings Growth Rate 17.3% 15.9%Price/Forward Earnings 16.4x 16.1xPrice/Sales 0.9x 1.6x
5

Improvements have been made in the area of client service, which lead us to grade ourselvesB in this category. We are making average cost basis information available, our technologyhas improved, and we have been able to quickly respond to all of your inquiries. Please feelfree to let us know if you disagree with our grading, particularly if you feel we can improveyour investment experience with us in any way. We take very seriously and will respond toany criticisms you have about our investment program or service.
Progress at Bogle Investment Management. Since Bogle Investment Management beganoperations on October 1, 1999, assets in the mutual fund have grown to approximately $80million with firm-wide assets slightly north of $450 million. We reiterate our commitmentto closing our mutual fund at a size of no more than $150 million. We plan to close at alevel at which our current shareholders, many of whom committed assets to us in the earlydays of our business, will be able to continue investing with us for the foreseeable future.We have always believed that an early closing will give us a great advantage in deliveringthe best returns we can. Finally, as our assets under management have grown, so has ourprofessional team. In addition to our same four founding partners, we recently hired aresearch analyst and an office manager.
As always, we thank you for your support and your business. Having said that, we recognizethat gaining your support is one thing; keeping it is another. Therefore, we will continu-ally strive to improve our investment process, communicate with you about matters we think you will find interesting and topical, and minimize the expenses required to deliverour services to you. Please feel free to contact us with any thoughts or questions you mayhave.
Respectfully,
Bogle Investment Management, L.P.
Management Office: 781-283-5000Shareholder Services Toll Free: 1-877-BOGLEIM (264-5346)
Past performance is not a guarantee of future performance. The investment return andprincipal value of an investment in the Fund will fluctuate, so that an investor’s shares,when redeemed, may be worth more or less than original cost. This material must be preceded or accompanied by a current prospectus. The Russell 2000 is an index of stocks1001 through 3000 in the Russell 3000 Index as ranked by total market capitalization.The Russell 2000 Growth Index measures the performance of those Russell 2000 companies with higher price-to-book ratios and higher forecasted growth rates. A directinvestment in the indices is not possible. Investing in small companies can involve morevolatility, less liquidity, and less publicly available information than investing in largecompanies.
6

7
The accompanying notes are an integral part of the financial statements.
7
COMMON STOCKS—98.1%
Basic Industry—1.7% Cabot Corp. . . . . . . . . . . 13,900 $ 561,143Titanium Metals Corp.* . 46,300 481,057UCAR International,
Inc.* . . . . . . . . . . . . . . . 39,400 500,380————––––––———————
1,542,580————––––––———————
Consumer Cyclical—10.1% Action Performance Cos.,
Inc.* . . . . . . . . . . . . . . . 18,300 505,995Activision, Inc.* . . . . . . . 21,500 796,575Applica, Inc.* . . . . . . . . . 54,500 613,125Burlington Coat Factory
Warehouse Corp. . . . . 14,300 232,947Direct Focus, Inc.* . . . . . 15,450 432,600Finish Line, Inc. (The),
Class A* . . . . . . . . . . . 41,100 400,725Group 1 Automotive,
Inc.* . . . . . . . . . . . . . . . 17,900 528,050Hollywood Entertainment
Corp.* . . . . . . . . . . . . . 42,600 511,200Hovnanian Enterprises,
Inc., Class A* . . . . . . . 28,800 408,960ITT Educational Services,
Inc.* . . . . . . . . . . . . . . . 15,300 510,102Landry’s Restaurants,
Inc. . . . . . . . . . . . . . . . 23,800 411,740NVR, Inc.* . . . . . . . . . . . . 4,200 676,200Priceline.com* . . . . . . . . 45,400 250,608Sonic Automotive, Inc.,
Class A* . . . . . . . . . . . 25,600 450,560Ticketmaster* . . . . . . . . 24,200 395,670Toro Co. (The) . . . . . . . . 16,000 728,800Venator Group, Inc.* . . . 44,300 795,185Wet Seal, Inc. (The),
Class A* . . . . . . . . . . . 26,050 520,739————––––––———————
9,169,781————––––––———————
Consumer Growth—27.7% AaiPharma, Inc.* . . . . . . . 6,500 124,475AdvancePCS* . . . . . . . . . 9,500 712,120AmerisourceBergen
Corp.* . . . . . . . . . . . . . 9,879 636,603
Consumer Growth—(continued)Anchor Gaming* . . . . . . . 8,300 $ 443,635Apollo Group, Inc.,
Class A* . . . . . . . . . . . 9,300 366,141Atrix Laboratories, Inc.* . 8,700 234,639Aztar Corp.* . . . . . . . . . . 37,200 600,408Caremark Rx, Inc.* . . . . . 29,200 510,124Carriage Services, Inc.,
Class A* . . . . . . . . . . . 86,000 675,100Charles River
Laboratories International, Inc.* . . 14,200 506,940
Circuit City Stores, Inc. – CarMax Group* . 36,400 541,632
Coinstar, Inc.* . . . . . . . . 18,400 432,400Coventry Health Care,
Inc.* . . . . . . . . . . . . . . . 24,100 562,735D&K Healthcare
Resources, Inc.* . . . . . 10,600 470,640DaVita, Inc.* . . . . . . . . . . 23,300 481,145Diagnostic Products
Corp. . . . . . . . . . . . . . . 13,700 537,725DIMON, Inc. . . . . . . . . . . . 69,100 511,340Edwards Lifesciences
Corp.* . . . . . . . . . . . . . 20,900 549,461Express Scripts, Inc.* . . 11,200 599,424Fleming Cos., Inc. . . . . . . 20,400 603,840Fresh del Monte
Produce, Inc.* . . . . . . . 40,400 599,940Genencor International,
Inc.* . . . . . . . . . . . . . . . 30,600 373,320H&R Block, Inc. . . . . . . . 14,300 556,413Haemonetics Corp.* . . . . 14,400 516,384Health Net, Inc.* . . . . . . 21,400 403,818Henry Schein, Inc.* . . . . 10,300 374,096Hillenbrand Industries,
Inc. . . . . . . . . . . . . . . . 8,500 461,550King Pharmaceuticals,
Inc.* . . . . . . . . . . . . . . . 12,066 521,854Laboratory Corp. of
America Holdings* . . . 7,600 592,040Magellan Health
Services, Inc.* . . . . . . . 35,800 474,350Mentor Corp. . . . . . . . . . 18,700 561,000
BOGLE INVESTMENT MANAGEMENTSMALL CAP GROWTH FUND
Portfolio of InvestmentsAugust 31, 2001
Numberof Shares Value—————— ———————————
Numberof Shares Value—————— ———————————

The accompanying notes are an integral part of the financial statements.
8
Consumer Growth—(continued)Merit Medical Systems,
Inc.* . . . . . . . . . . . . . . . 44,875 $ 708,128Movie Gallery, Inc.* . . . . 20,700 548,550NBTY, Inc.* . . . . . . . . . . . 25,000 431,500North American
Scientific, Inc.* . . . . . . 35,000 500,850Perrigo Co.* . . . . . . . . . . 38,100 614,934Possis Medical, Inc.* . . . 28,400 414,924Quest Diagnostics, Inc.* . 10,300 645,295Reebok International
Ltd.* . . . . . . . . . . . . . . 10,600 285,034SICOR, Inc.* . . . . . . . . . . 28,000 660,800Sierra Health Services,
Inc.* . . . . . . . . . . . . . . . 53,100 531,000Sola International,
Inc.* . . . . . . . . . . . . . . . 30,700 491,200Standard Commercial
Corp. . . . . . . . . . . . . . . 44,500 827,700STERIS Corp.* . . . . . . . . 20,600 445,784Topps Co., Inc. (The)* . . . 42,800 492,200U.S. Physical Therapy,
Inc.* . . . . . . . . . . . . . . . 21,850 360,525USA Networks, Inc.* . . . . 10,100 233,916Varian Medical Systems,
Inc.* . . . . . . . . . . . . . . . 10,200 673,200Wellpoint Health
Networks, Inc.* . . . . . . 6,900 734,712————––––––———————25,135,544
————––––––———————
Energy—4.4% Covanta Energy Corp.* . 29,500 472,000Equitable Resources,
Inc. . . . . . . . . . . . . . . . 14,400 460,800Frontier Oil Corp. . . . . . 21,300 364,230Plains Resources, Inc.* . 18,200 494,130Sunoco, Inc. . . . . . . . . . . 15,400 582,582Tesoro Petroleum
Corp.* . . . . . . . . . . . . . 33,900 443,412Ultramar Diamond
Shamrock Corp. . . . . . . 10,400 537,056Western Gas Resources,
Inc. . . . . . . . . . . . . . . . 21,800 670,350————––––––———————
4,024,560————––––––———————
Financial—15.9% Actrade Financial
Technologies Ltd.* . . . 15,000 $ 343,650Affiliated Managers
Group, Inc.* . . . . . . . . . 8,200 581,380American Home Mortgage
Holdings, Inc. . . . . . . . 48,100 716,690Banco Latinoamericano
de Exportaciones, S.A., Class E . . . . . . . . . . . . 18,800 613,820
BankAtlantic Bancorp, Inc., Class A* . . . . . . . 70,800 652,776
BankUnited Financial Corp., Class A* . . . . . . 44,800 567,168
BOK Financial Corp.* . . . 21,500 650,805Coastal Bancorp, Inc. . . 15,700 563,630Commercial Federal
Corp. . . . . . . . . . . . . . . 22,800 574,560Commerce Group, Inc.
(The) . . . . . . . . . . . . . . 23,400 875,160Dime Community
Bancshares . . . . . . . . . 15,850 431,595Doral Financial Corp. . . 19,700 649,312First Essex Bancorp,
Inc. . . . . . . . . . . . . . . . 18,900 481,950FirstFed Financial
Corp.* . . . . . . . . . . . . . 25,700 745,300Golden State Bancorp,
Inc. . . . . . . . . . . . . . . . 24,700 741,494Independence Community
Bank Corp. . . . . . . . . . 36,600 795,318IndyMac Bancorp, Inc.* . . 22,600 595,962LandAmerica Financial
Group, Inc. . . . . . . . . . 17,500 550,900UCBH Holdings, Inc. . . . 24,400 666,364UICI* . . . . . . . . . . . . . . . . 30,300 454,500Vesta Insurance Group,
Inc. . . . . . . . . . . . . . . . 51,500 601,005W.R. Berkley Corp. . . . . 11,700 445,770WesBanco, Inc. . . . . . . . . 17,800 432,540Wintrust Financial
Corp. . . . . . . . . . . . . . . 22,600 711,900————––––––———————14,443,549
————––––––———————
BOGLE INVESTMENT MANAGEMENTSMALL CAP GROWTH FUND
Portfolio of Investments (Continued)August 31, 2001
Numberof Shares Value—————— ———————————
Numberof Shares Value—————— ———————————
The accompanying notes are an integral part of the financial statements.
9
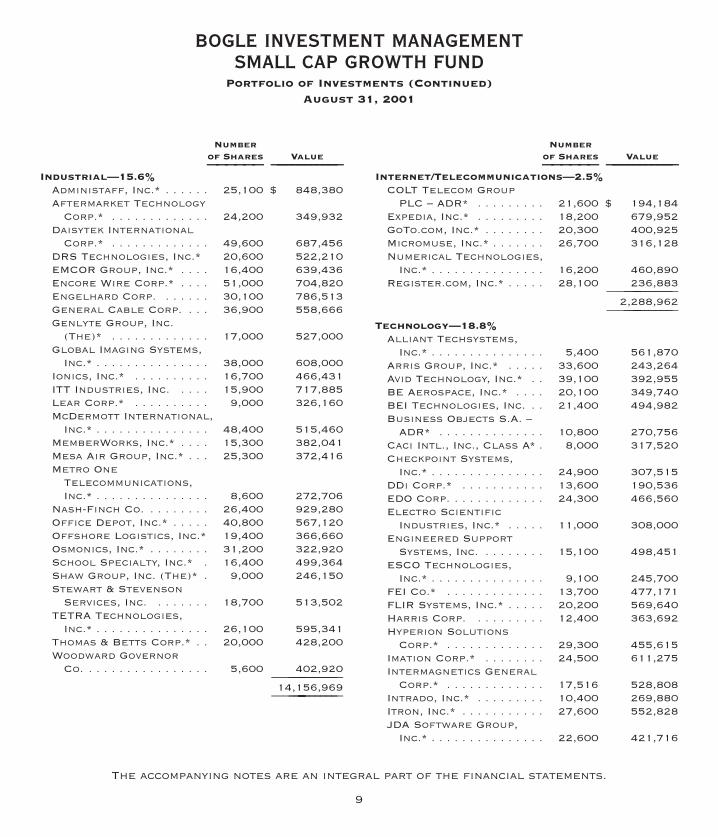
Industrial—15.6% Administaff, Inc.* . . . . . . 25,100 $ 848,380Aftermarket Technology
Corp.* . . . . . . . . . . . . . 24,200 349,932Daisytek International
Corp.* . . . . . . . . . . . . . 49,600 687,456DRS Technologies, Inc.* 20,600 522,210EMCOR Group, Inc.* . . . . 16,400 639,436Encore Wire Corp.* . . . . 51,000 704,820Engelhard Corp. . . . . . . 30,100 786,513General Cable Corp. . . . 36,900 558,666Genlyte Group, Inc.
(The)* . . . . . . . . . . . . . 17,000 527,000Global Imaging Systems,
Inc.* . . . . . . . . . . . . . . . 38,000 608,000Ionics, Inc.* . . . . . . . . . . 16,700 466,431ITT Industries, Inc. . . . . 15,900 717,885Lear Corp.* . . . . . . . . . . 9,000 326,160McDermott International,
Inc.* . . . . . . . . . . . . . . . 48,400 515,460MemberWorks, Inc.* . . . . 15,300 382,041Mesa Air Group, Inc.* . . . 25,300 372,416Metro One
Telecommunications, Inc.* . . . . . . . . . . . . . . . 8,600 272,706
Nash-Finch Co. . . . . . . . . 26,400 929,280Office Depot, Inc.* . . . . . 40,800 567,120Offshore Logistics, Inc.* 19,400 366,660Osmonics, Inc.* . . . . . . . . 31,200 322,920School Specialty, Inc.* . 16,400 499,364Shaw Group, Inc. (The)* . 9,000 246,150Stewart & Stevenson
Services, Inc. . . . . . . . 18,700 513,502TETRA Technologies,
Inc.* . . . . . . . . . . . . . . . 26,100 595,341Thomas & Betts Corp.* . . 20,000 428,200Woodward Governor
Co. . . . . . . . . . . . . . . . . 5,600 402,920————––––––———————14,156,969
————––––––———————
Internet/Telecommunications—2.5% COLT Telecom Group
PLC – ADR* . . . . . . . . . 21,600 $ 194,184Expedia, Inc.* . . . . . . . . . 18,200 679,952GoTo.com, Inc.* . . . . . . . . 20,300 400,925Micromuse, Inc.* . . . . . . . 26,700 316,128Numerical Technologies,
Inc.* . . . . . . . . . . . . . . . 16,200 460,890Register.com, Inc.* . . . . . 28,100 236,883
————––––––———————2,288,962
————––––––———————
Technology—18.8% Alliant Techsystems,
Inc.* . . . . . . . . . . . . . . . 5,400 561,870Arris Group, Inc.* . . . . . 33,600 243,264Avid Technology, Inc.* . . 39,100 392,955BE Aerospace, Inc.* . . . . 20,100 349,740BEI Technologies, Inc. . . 21,400 494,982Business Objects S.A. –
ADR* . . . . . . . . . . . . . . 10,800 270,756Caci Intl., Inc., Class A* . 8,000 317,520Checkpoint Systems,
Inc.* . . . . . . . . . . . . . . . 24,900 307,515DDi Corp.* . . . . . . . . . . . 13,600 190,536EDO Corp. . . . . . . . . . . . . 24,300 466,560Electro Scientific
Industries, Inc.* . . . . . 11,000 308,000Engineered Support
Systems, Inc. . . . . . . . . 15,100 498,451ESCO Technologies,
Inc.* . . . . . . . . . . . . . . . 9,100 245,700FEI Co.* . . . . . . . . . . . . . 13,700 477,171FLIR Systems, Inc.* . . . . . 20,200 569,640Harris Corp. . . . . . . . . . 12,400 363,692Hyperion Solutions
Corp.* . . . . . . . . . . . . . 29,300 455,615Imation Corp.* . . . . . . . . 24,500 611,275Intermagnetics General
Corp.* . . . . . . . . . . . . . 17,516 528,808Intrado, Inc.* . . . . . . . . . 10,400 269,880Itron, Inc.* . . . . . . . . . . . 27,600 552,828JDA Software Group,
Inc.* . . . . . . . . . . . . . . . 22,600 421,716
BOGLE INVESTMENT MANAGEMENTSMALL CAP GROWTH FUND
Portfolio of Investments (Continued)August 31, 2001
Numberof Shares Value—————— ———————————
Numberof Shares Value—————— ———————————

The accompanying notes are an integral part of the financial statements.
10
Technology—(continued)KLA-Tencor Corp.* . . . . . 5,500 $ 270,270Kronos, Inc.* . . . . . . . . . 6,600 322,080MTS Systems Corp. . . . . . 39,000 507,000McAfee.com Corp.* . . . . . 30,600 443,700Mentor Graphics Corp.* 18,200 300,300Mettler-Toledo
International, Inc.* . . 5,900 270,043Microsemi Corp. . . . . . . . 15,100 430,350Network Associates,
Inc.* . . . . . . . . . . . . . . . 33,800 535,730Opticnet, Inc.*(1) . . . . . . 3,100 0Photronics, Inc.* . . . . . . 9,800 233,828Planar Systems, Inc.* . . . 14,500 384,250Spectrian Corp.* . . . . . . 31,600 492,328Storage Technology
Corp.* . . . . . . . . . . . . . 30,100 430,430Sykes Enterprises, Inc.* . 44,600 412,996SymmetriCom, Inc.* . . . . . 31,200 221,520Systems & Computer
Technology Corp.* . . . 39,000 519,870Tech Data Corp.* . . . . . . 15,600 638,040Ultratech Stepper,
Inc.* . . . . . . . . . . . . . . . 12,300 211,560Vignette Corp.* . . . . . . . 57,800 394,774Visteon Corp. . . . . . . . . . 39,900 682,290Xicor, Inc.* . . . . . . . . . . . 45,500 483,210
————––––––———————17,083,043
————––––––———————
Utility—1.4% Unisource Energy
Corp. . . . . . . . . . . . . . . 27,100 449,860UtiliCorp United, Inc. . . 24,100 775,056
————––––––———————1,224,916
————––––––———————TOTAL COMMON STOCKS
(Cost $82,072,337) . . . . . . . . . 89,069,904————––––––———————
SHORT-TERM INVESTMENTS—1.3% Wilmington Fund Cash Sweep
3.25% 09/04/01 . . . . . . $1,136 $ 1,135,994————––––––———————
TOTAL SHORT-TERM INVESTMENTS (Cost $1,135,994) . . . . . . . . . . 1,135,994
————––––––———————TOTAL INVESTMENTS—99.4%
(Cost $83,208,331) . . . . . . . . . . . . 90,205,898————––––––———————
OTHER ASSETS IN EXCESS OF LIABILITIES—0.6% . . . . . . . . . 574,927
————––––––———————NET ASSETS—100.0% . . . . . . . . . . . $90,780,825
————––––––———————————––––––———————
*Non-income producing.ADR—American Depository Receipt.(1) This security was received as a distribution
from BEI Technologies, Inc. and is currentlynot trading.
BOGLE INVESTMENT MANAGEMENTSMALL CAP GROWTH FUND
Portfolio of Investments (Concluded)August 31, 2001
Numberof Shares Value—————— ———————————
Par(000) Value
—————— ———————————

The accompanying notes are an integral part of the financial statements.
11
BOGLE INVESTMENT MANAGEMENTSMALL CAP GROWTH FUNDStatement of Assets and Liabilities
August 31, 2001
AssetsInvestments, at value (cost – $83,208,331) . . . . . . . . . . . . . . . . . . . . . . . . . . . . . . . . . . . . . $90,205,898Receivable for Investments Sold . . . . . . . . . . . . . . . . . . . . . . . . . . . . . . . . . . . . . . . . . . . . . 3,282,301Receivable for Fund shares sold . . . . . . . . . . . . . . . . . . . . . . . . . . . . . . . . . . . . . . . . . . . . . 361,786Dividends and interest receivable . . . . . . . . . . . . . . . . . . . . . . . . . . . . . . . . . . . . . . . . . . . . 56,663Prepaid expenses and other assets . . . . . . . . . . . . . . . . . . . . . . . . . . . . . . . . . . . . . . . . . . . 13,676
–————––—–––——Total assets . . . . . . . . . . . . . . . . . . . . . . . . . . . . . . . . . . . . . . . . . . . . . . . . . . . . . . . . . . . . . 93,920,324
–————––—–––——Liabilities
Payable for investments purchased . . . . . . . . . . . . . . . . . . . . . . . . . . . . . . . . . . . . . . . . . . . 2,939,425Accrued expenses and other liabilities . . . . . . . . . . . . . . . . . . . . . . . . . . . . . . . . . . . . . . . . 105,816Payable for fund shares redeemed . . . . . . . . . . . . . . . . . . . . . . . . . . . . . . . . . . . . . . . . . . . 94,258
–————––—–––——Total liabilities . . . . . . . . . . . . . . . . . . . . . . . . . . . . . . . . . . . . . . . . . . . . . . . . . . . . . . . . . 3,139,499
–————––—–––——Net Assets
Capital stock, $0.001 par value . . . . . . . . . . . . . . . . . . . . . . . . . . . . . . . . . . . . . . . . . . . . . . . 4,655Additional paid-in capital . . . . . . . . . . . . . . . . . . . . . . . . . . . . . . . . . . . . . . . . . . . . . . . . . . . 86,310,882Accumulated net realized loss from investments . . . . . . . . . . . . . . . . . . . . . . . . . . . . . . . (2,532,279)Net unrealized appreciation on investments. . . . . . . . . . . . . . . . . . . . . . . . . . . . . . . . . . . . 6,997,567
–————––—–––——Net assets . . . . . . . . . . . . . . . . . . . . . . . . . . . . . . . . . . . . . . . . . . . . . . . . . . . . . . . . . . . . . . $90,780,825
–————––—–––——–————––—–––——Institutional Class
Net assets . . . . . . . . . . . . . . . . . . . . . . . . . . . . . . . . . . . . . . . . . . . . . . . . . . . . . . . . . . . . . . . . $36,526,298–————––—–––——
Shares outstanding . . . . . . . . . . . . . . . . . . . . . . . . . . . . . . . . . . . . . . . . . . . . . . . . . . . . . . . . 1,871,326–————––—–––——
Net asset value, offering and redemption price per share . . . . . . . . . . . . . . . . . . . . . . . . $ 19.52–————––—–––——–————––—–––——
Investor ClassNet assets . . . . . . . . . . . . . . . . . . . . . . . . . . . . . . . . . . . . . . . . . . . . . . . . . . . . . . . . . . . . . . . . $54,254,527
–————––—–––——Shares outstanding . . . . . . . . . . . . . . . . . . . . . . . . . . . . . . . . . . . . . . . . . . . . . . . . . . . . . . . . 2,783,403
–————––—–––——Net asset value, offering and redemption price per share . . . . . . . . . . . . . . . . . . . . . . . . $ 19.49
–————––—–––——–————––—–––——

The accompanying notes are an integral part of the financial statements.
12
BOGLE INVESTMENT MANAGEMENTSMALL CAP GROWTH FUND
Statement of Operations
For the Year Ended
August 31, 2001—–————––———
Investment Income
Dividends . . . . . . . . . . . . . . . . . . . . . . . . . . . . . . . . . . . . . . . . . . . . . . . . . . . . . . . . . . . . . $ 334,743
Interest . . . . . . . . . . . . . . . . . . . . . . . . . . . . . . . . . . . . . . . . . . . . . . . . . . . . . . . . . . . . . . 155,274–——–—––—–——
Total investment income . . . . . . . . . . . . . . . . . . . . . . . . . . . . . . . . . . . . . . . . . . . . . . . 490,017–——–—––—–——
Expenses
Advisory fees . . . . . . . . . . . . . . . . . . . . . . . . . . . . . . . . . . . . . . . . . . . . . . . . . . . . . . . . . . 551,334
Administration fees . . . . . . . . . . . . . . . . . . . . . . . . . . . . . . . . . . . . . . . . . . . . . . . . . . . . 111,593
Transfer agent fees and expenses . . . . . . . . . . . . . . . . . . . . . . . . . . . . . . . . . . . . . . . . 94,542
Shareholder servicing fees . . . . . . . . . . . . . . . . . . . . . . . . . . . . . . . . . . . . . . . . . . . . . . 88,419
Printing fees . . . . . . . . . . . . . . . . . . . . . . . . . . . . . . . . . . . . . . . . . . . . . . . . . . . . . . . . . . 24,301
Federal and state registration fees . . . . . . . . . . . . . . . . . . . . . . . . . . . . . . . . . . . . . . . 20,588
Custodian fees and expenses . . . . . . . . . . . . . . . . . . . . . . . . . . . . . . . . . . . . . . . . . . . . . 22,056
Audit and Legal fees . . . . . . . . . . . . . . . . . . . . . . . . . . . . . . . . . . . . . . . . . . . . . . . . . . . . 12,699
Administrative service fees . . . . . . . . . . . . . . . . . . . . . . . . . . . . . . . . . . . . . . . . . . . . . . 29,649
Trustee fees and expenses . . . . . . . . . . . . . . . . . . . . . . . . . . . . . . . . . . . . . . . . . . . . . . . 4,427
Insurance and other expenses . . . . . . . . . . . . . . . . . . . . . . . . . . . . . . . . . . . . . . . . . . . . 912–——–—––—–——
Total expenses before waivers and reimbursements. . . . . . . . . . . . . . . . . . . . . . . . 960,520
Less: waivers and reimbursements . . . . . . . . . . . . . . . . . . . . . . . . . . . . . . . . . . . . . . . (235,713)–——–—––—–——
Net expenses after waivers and reimbursements. . . . . . . . . . . . . . . . . . . . . . . . . . . 724,807–——–—––—–——
Net investment loss . . . . . . . . . . . . . . . . . . . . . . . . . . . . . . . . . . . . . . . . . . . . . . . . . . . . (234,790)–——–—––—–——
Net realized and unrealized loss on investments
Net realized loss from investments . . . . . . . . . . . . . . . . . . . . . . . . . . . . . . . . . . . . . . . (2,525,980)
Net change in unrealized appreciation on investments . . . . . . . . . . . . . . . . . . . . . . . 2,377,604–——–—––—–——
Net realized and unrealized loss from investments . . . . . . . . . . . . . . . . . . . . . . . . . . (148,376)–——–—––—–——
Net decrease in net assets resulting from operations . . . . . . . . . . . . . . . . . . . . . . . . $ (383,166)–——–—––—–——–——–—––—–——

The accompanying notes are an integral part of the financial statements.
13
BOGLE INVESTMENT MANAGEMENTSMALL CAP GROWTH FUND
Statement of Changes in Net Assets
For the PeriodFor the October 1, 1999*
Year Ended throughAugust 31, 2001 August 31, 2000————–––—————————— ————–––——————————
Increase/(decrease) in net assets from Operations
Net investment loss . . . . . . . . . . . . . . . . . . . . . . . . . . . . . . . . . . . $ (234,790) $ (71,086)
Net realized gain (loss) from investments . . . . . . . . . . . . . . . . . (2,525,980) 1,240,784
Net change in unrealized appreciation on investments . . . . . . 2,377,604 4,619,963———————— ————————
Net increase (decrease) in net assets resulting
from operations . . . . . . . . . . . . . . . . . . . . . . . . . . . . . . . . . . . . . (383,166) 5,789,661———————— ————————
Less distributions to shareholders from:
Net realized capital gains Institutional shares . . . . . . . . . . . . (370,538) —
Net realized capital gains Investor shares . . . . . . . . . . . . . . . . (805,459) ————————— ————————
Total dividends and distributions to shareholders . . . . . . . . (1,175,997) ————————— ————————
Increase in net assets derived from
capital share transactions (Note 4) . . . . . . . . . . . . . . . . . . . 67,389,714 19,160,613———————— ————————
Total increase in net assets . . . . . . . . . . . . . . . . . . . . . . . . . . . . 65,830,551 24,950,274———————— ———————————————— ————————
Net assets
Beginning of period . . . . . . . . . . . . . . . . . . . . . . . . . . . . . . . . . . . 24,950,274 ————————— ————————
End of period . . . . . . . . . . . . . . . . . . . . . . . . . . . . . . . . . . . . . . . . . $90,780,825 $24,950,274———————— ———————————————— ————————
* Commencement of investment operations.

The accompanying notes are an integral part of the financial statements.
14
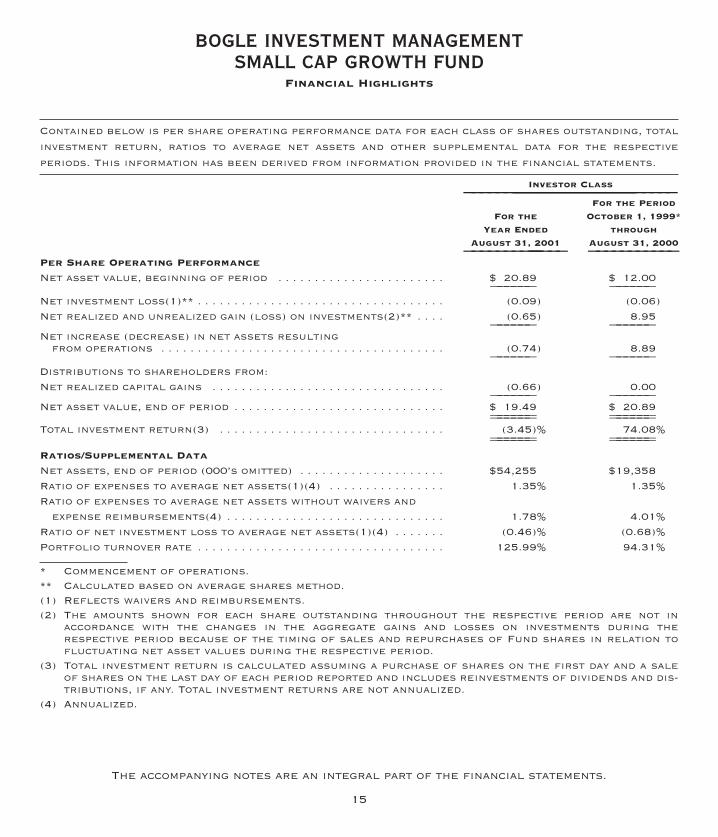
BOGLE INVESTMENT MANAGEMENTSMALL CAP GROWTH FUND
Financial Highlights
Contained below is per share operating performance data for each class of shares outstanding, total
investment return, ratios to average net assets and other supplemental data for the respective
periods. This information has been derived from information provided in the financial statements.
Institutional Class——————––––––––––––––––––––––––––––––––––––––––––––––––––––––––––––—————
For the PeriodFor the October 1, 1999*
Year Ended throughAugust 31, 2001 August 31, 2000
——————————––––––——— ———————————Per Share Operating Performance
Net asset value, beginning of period . . . . . . . . . . . . . . . . . . . . . . . $ 20.91 $ 12.00—————— ——————
Net investment loss(1)** . . . . . . . . . . . . . . . . . . . . . . . . . . . . . . . . . . (0.07) (0.05)
Net realized and unrealized gain (loss) on investments(2)** . . . . (0.66) 8.96—————— ——————
Net increase (decrease) in net assets resulting from operations . . . . . . . . . . . . . . . . . . . . . . . . . . . . . . . . . . . . . . . (0.73) 8.91
—————— ——————
Distributions to shareholders from:
Net realized capital gains . . . . . . . . . . . . . . . . . . . . . . . . . . . . . . . . (0.66) 0.00—————— ——————
Net asset value, end of period . . . . . . . . . . . . . . . . . . . . . . . . . . . . . $ 19.52 $ 20.91—————— ———————————— ——————
Total investment return(3) . . . . . . . . . . . . . . . . . . . . . . . . . . . . . . . (3.39)% 74.25%—————— ———————————— ——————
Ratios/Supplemental Data
Net assets, end of period (000’s omitted) . . . . . . . . . . . . . . . . . . . . $36,526 $5,593
Ratio of expenses to average net assets(1)(4) . . . . . . . . . . . . . . . . 1.25% 1.25%
Ratio of expenses to average net assets without waivers and
expense reimbursements(4) . . . . . . . . . . . . . . . . . . . . . . . . . . . . . . 1.68% 3.91%
Ratio of net investment loss to average net assets(1)(4) . . . . . . . (0.36)% (0.58)%
Portfolio turnover rate . . . . . . . . . . . . . . . . . . . . . . . . . . . . . . . . . . 125.99% 94.31%
* Commencement of operations.** Calculated based on average shares method.(1) Reflects waivers and reimbursements.(2) The amounts shown for each share outstanding throughout the respective period are not in
accordance with the changes in the aggregate gains and losses on investments during therespective period because of the timing of sales and repurchases of Fund shares in relation tofluctuating net asset values during the respective period.
(3) Total investment return is calculated assuming a purchase of shares on the first day and a saleof shares on the last day of each period reported and includes reinvestments of dividends and dis-tributions, if any. Total investment returns are not annualized.
(4) Annualized.
The accompanying notes are an integral part of the financial statements.
15
BOGLE INVESTMENT MANAGEMENTSMALL CAP GROWTH FUND
Financial Highlights
Contained below is per share operating performance data for each class of shares outstanding, total
investment return, ratios to average net assets and other supplemental data for the respective
periods. This information has been derived from information provided in the financial statements.
Investor Class——————––––––––––––––––––––––––––––––––––––––––––––––––––––––––––––—————
For the PeriodFor the October 1, 1999*
Year Ended throughAugust 31, 2001 August 31, 2000
————————––––––——— ———————————Per Share Operating Performance
Net asset value, beginning of period . . . . . . . . . . . . . . . . . . . . . . . $ 20.89 $ 12.00—————— ——————
Net investment loss(1)** . . . . . . . . . . . . . . . . . . . . . . . . . . . . . . . . . . (0.09) (0.06)
Net realized and unrealized gain (loss) on investments(2)** . . . . (0.65) 8.95—————— ——————
Net increase (decrease) in net assets resulting from operations . . . . . . . . . . . . . . . . . . . . . . . . . . . . . . . . . . . . . . . (0.74) 8.89
—————— ——————
Distributions to shareholders from:
Net realized capital gains . . . . . . . . . . . . . . . . . . . . . . . . . . . . . . . . (0.66) 0.00—————— ——————
Net asset value, end of period . . . . . . . . . . . . . . . . . . . . . . . . . . . . . $ 19.49 $ 20.89—————— ———————————— ——————
Total investment return(3) . . . . . . . . . . . . . . . . . . . . . . . . . . . . . . . (3.45)% 74.08%—————— ———————————— ——————
Ratios/Supplemental Data
Net assets, end of period (000’s omitted) . . . . . . . . . . . . . . . . . . . . $54,255 $19,358
Ratio of expenses to average net assets(1)(4) . . . . . . . . . . . . . . . . 1.35% 1.35%
Ratio of expenses to average net assets without waivers and
expense reimbursements(4) . . . . . . . . . . . . . . . . . . . . . . . . . . . . . . 1.78% 4.01%
Ratio of net investment loss to average net assets(1)(4) . . . . . . . (0.46)% (0.68)%
Portfolio turnover rate . . . . . . . . . . . . . . . . . . . . . . . . . . . . . . . . . . 125.99% 94.31%
* Commencement of operations.** Calculated based on average shares method.(1) Reflects waivers and reimbursements.(2) The amounts shown for each share outstanding throughout the respective period are not in
accordance with the changes in the aggregate gains and losses on investments during therespective period because of the timing of sales and repurchases of Fund shares in relation tofluctuating net asset values during the respective period.
(3) Total investment return is calculated assuming a purchase of shares on the first day and a saleof shares on the last day of each period reported and includes reinvestments of dividends and dis-tributions, if any. Total investment returns are not annualized.
(4) Annualized.

16
BOGLE INVESTMENT MANAGEMENTSMALL CAP GROWTH FUND
Notes to Financial Statements
1. Organization and Significant Accounting Policies
The RBB Fund, Inc. (“RBB”) was incorporated under the laws of the State of Maryland onFebruary 29, 1988 and is registered under the Investment Company Act of 1940, as amended,(the “Investment Company Act”) as an open-end management investment company. RBB is a“series fund”, which is a mutual fund divided into separate portfolios. The portfolio istreated as a separate entity for certain matters under the Investment Company Act, and forother purposes, and a shareholder of one portfolio is not deemed to be a shareholder ofany other portfolio. Currently RBB has fourteen investment portfolios, including theBogle Investment Management Small Cap Growth Fund (the “Fund”), which commenced invest-ment operation on October 1, 1999. As of the date hereof, the Fund offers two classes ofshares, Institutional Class and Investor Class.
RBB has authorized capital of thirty billion shares of common stock of which 20.97 billion are currently classified into ninety-four classes. Each class represents an inter-est in one of fourteen investment portfolios of RBB. The classes have been grouped intofourteen separate “families,” eight of which have begun investment operations includingthe Bogle Investment Management Small Cap Growth Fund.
Portfolio Valuation — The net asset value of the Fund is determined as of 4:00 p.m. east-ern time on each business day. The Fund’s securities are valued at the last reported salesprice on the national securities exchange or national securities market on which suchshares are primarily traded. If no sales are reported, as in the case of some securitiestraded over-the-counter, portfolio securities are valued at the mean between the lastreported bid and ask prices. Securities for which market quotations are not readily avail-able are valued at fair market value as determined in good faith by or under the directionof RBB’s Board of Directors. With the approval of RBB’s Board of Directors, the Fund mayuse a pricing service, bank or broker-dealer experienced in such matters to value its secu-rities. Short-term obligations with maturities of 60 days or less are valued at amortizedcost that approximates market value. Expenses and fees, including investment advisory andadministration fees are accrued daily and taken into account for the purpose of determin-ing the net asset value of the Fund.
Use of Estimates — The preparation of financial statements in conformity with accounting prin-ciples generally accepted in the United States of America requires management to make estimatesand assumptions that affect the reported amounts of assets and liabilities and disclosure of con-tingent assets and liabilites at the date of the financial statements and the reported amounts ofrevenues and expenses during the period. Actual results could differ from those estimates.
Repurchase Agreements — The Fund has agreed to purchase securities from financialinstitutions subject to the seller’s agreement to repurchase them at an agreed-upon timeand price (“repurchase agreements”). The financial institutions with whom the Fund entersinto repurchase agreements are banks and broker/dealers that Bogle InvestmentManagement, L.P. (the “Adviser”) considers creditworthy. The seller under a repurchaseagreement will be required to maintain the value of the securities as collateral, subjectto the agreement at not less than the repurchase price plus accrued interest. The Adviser

17
BOGLE INVESTMENT MANAGEMENTSMALL CAP GROWTH FUND
Notes to Financial Statements (Continued)
marks to market daily the value of the collateral, and, if necessary, requires the seller to main-tain additional securities, to ensure that the value is not less than the repurchase price. Defaultby or bankruptcy of the seller would, however, expose the Fund to possible loss because ofadverse market action or delays in connection with the disposition of the underlying securities.
Investment Transactions and Investment Income — Securities are accounted for on thetrade date. The cost of investments sold is determined by use of the specific identificationmethod for both financial reporting and income tax purposes in determining realized gains andlosses on investments. Interest income is recorded on the accrual basis. Dividend income isrecorded on the ex-dividend date. The Fund’s net investment income (other than class specificdistribution fees) and unrealized and realized gains and losses are allocated daily to eachclass of shares based upon the relative proportion of net assets of each class at the begin-ning of the day (after adjusting for current capital share activity of the respective classes).Expenses incurred on behalf of a specific class, fund or fund family are charged directly tothe class, fund or fund family (in proportion to net assets). Expenses incurred for all of theRBB families (such as trustee or professional fees) are charged to all funds in proportion totheir net assets of the RBB Funds.
Dividends and Distributions — Dividends from net investment income, if any, will bedeclared and paid at least annually to shareholders. Distributions from net realized capitalgains, if any, will be distributed at least annually. Income and capital gain distributions aredetermined in accordance with U.S. federal income tax regulations which may differ fromgenerally accepted accounting principles.
U.S. Federal Tax Status — No provision is made for U.S. federal income taxes as it is theFund’s intention to qualify for and elect the tax treatment applicable to regulated invest-ment companies under Subchapter M of the Internal Revenue Code of 1986, as amended, andmake the requisite distributions to its shareholders which will be sufficient to relieve itfrom U.S. federal income and excise taxes.
For U.S. federal income tax purposes, realized capital losses incurred after October 31,2000, within the fiscal year (“post-October losses”), are deemed to arise on the first day ofthe following fiscal year (September 1, 2001). The fund incurred and elected to defer suchlosses of $1,097,395.
2. Transactions with Affiliates and Related Parties
Bogle Investment Managment, L.P. serves as the Fund’s investment adviser. For its advi-sory services, the Adviser is entitled to receive 1.00% of the Fund’s average daily netassets, computed daily and payable monthly.
The adviser has agreed to limit the Fund’s total operating expenses to the extent thatsuch expenses exceeded 1.25% of the Fund’s Institutional Class average daily net assetsand 1.35% of the Fund’s Investor Class average daily net assets. As necessary, this limita-tion is effected in waivers of advisory fees and reimbursements of expenses exceeding theadvisory fee. For the year ended August 31, 2001, investment advisory fees and waiverswere as follows:

18
BOGLE INVESTMENT MANAGEMENTSMALL CAP GROWTH FUND
Notes to Financial Statements (Continued)
Gross NetAdvisory Fees Waivers Advisory Fees———————— ————————— ————————
Bogle Investment ManagementSmall Cap Growth Fund $551,334 $(90,728) $460,606
The Fund will not pay the Adviser at a later time for any amounts it may waive or anyamounts which the Adviser has assumed.
PFPC Inc. (“PFPC”), a wholly-owned subsidiary of PFPC Worldwide Inc., and an indirectmajority-owned subsidiary of The PNC Financial Services Group, Inc., serves as administra-tor for the Fund. For providing administrative services, PFPC is entitled to receive amonthly fee equal to an annual rate of 0.115% of the Fund’s average daily net assets.
For the year ended August 31, 2001, PFPC, at its discretion, voluntarily agreed to waivea portion of its administration fees for the Fund. During this period, (unless otherwise indicated) PFPC’s administration fees and related waivers were as follows:
NetPFPC Gross Administration
Administration Fees Waivers Fees————————————— ————— —————————
Bogle Investment ManagementSmall Cap Growth Fund $111,593 $(37,500) $74,093
In addition, PFPC serves as the Fund’s transfer and dividend disbursing agent. PFPC, atits discretion, voluntarily agreed to waive a portion of its transfer agency fees for theFund. For the year ended August 31, 2001, transfer agency fees and waivers were asfollows:
Gross Transfer Net TransferAgency Fees Waivers Agency Fees
————————————— ————— —————————
Bogle Investment Management Small Cap Growth Fund $94,542 $(36,000) $58,542
From September 1, 2000 through January 1, 2001, Provident Distributors, Inc. (PDI)provided certain administrative services to the Institutional Class Shares of the Fund. Ascompensation for such administrative services, PDI received a monthly fee equal to anannual rate of 0.15% of the Fund’s average daily net assets. PDI, at its discretion, volun-tarily agreed to waive a portion of its administrative services fees for the Fund.
For this period, administrative services fees and waivers were as follows:
Gross Administrative Net AdministrativeServices Fees Waivers Services Fees
————————————— ———— ————————————
Bogle Investment ManagementSmall Cap Growth Fund $4,699 $(3,758) $941
19
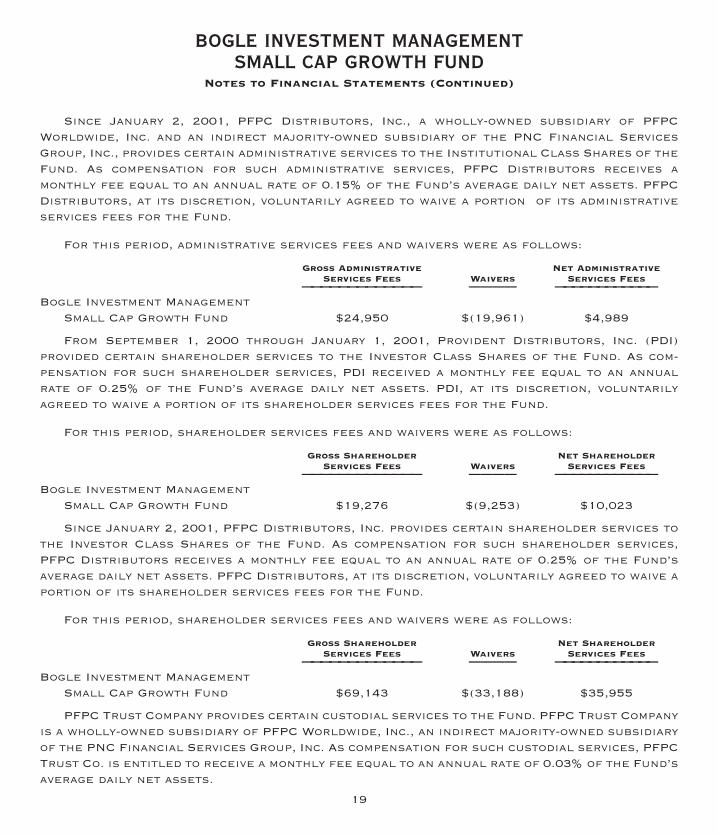
BOGLE INVESTMENT MANAGEMENTSMALL CAP GROWTH FUND
Notes to Financial Statements (Continued)
Since January 2, 2001, PFPC Distributors, Inc., a wholly-owned subsidiary of PFPCWorldwide, Inc. and an indirect majority-owned subsidiary of the PNC Financial ServicesGroup, Inc., provides certain administrative services to the Institutional Class Shares of theFund. As compensation for such administrative services, PFPC Distributors receives amonthly fee equal to an annual rate of 0.15% of the Fund’s average daily net assets. PFPCDistributors, at its discretion, voluntarily agreed to waive a portion of its administrativeservices fees for the Fund.
For this period, administrative services fees and waivers were as follows:
Gross Administrative Net AdministrativeServices Fees Waivers Services Fees
————————————— ———— ————————————
Bogle Investment ManagementSmall Cap Growth Fund $24,950 $(19,961) $4,989
From September 1, 2000 through January 1, 2001, Provident Distributors, Inc. (PDI)provided certain shareholder services to the Investor Class Shares of the Fund. As com-pensation for such shareholder services, PDI received a monthly fee equal to an annualrate of 0.25% of the Fund’s average daily net assets. PDI, at its discretion, voluntarilyagreed to waive a portion of its shareholder services fees for the Fund.
For this period, shareholder services fees and waivers were as follows:
Gross Shareholder Net ShareholderServices Fees Waivers Services Fees
————————————— ———— ————————————
Bogle Investment ManagementSmall Cap Growth Fund $19,276 $(9,253) $10,023
Since January 2, 2001, PFPC Distributors, Inc. provides certain shareholder services tothe Investor Class Shares of the Fund. As compensation for such shareholder services,PFPC Distributors receives a monthly fee equal to an annual rate of 0.25% of the Fund’saverage daily net assets. PFPC Distributors, at its discretion, voluntarily agreed to waive aportion of its shareholder services fees for the Fund.
For this period, shareholder services fees and waivers were as follows:
Gross Shareholder Net ShareholderServices Fees Waivers Services Fees
————————————— ———— ————————————
Bogle Investment ManagementSmall Cap Growth Fund $69,143 $(33,188) $35,955
PFPC Trust Company provides certain custodial services to the Fund. PFPC Trust Companyis a wholly-owned subsidiary of PFPC Worldwide, Inc., an indirect majority-owned subsidiaryof the PNC Financial Services Group, Inc. As compensation for such custodial services, PFPCTrust Co. is entitled to receive a monthly fee equal to an annual rate of 0.03% of the Fund’saverage daily net assets.

20
BOGLE INVESTMENT MANAGEMENTSMALL CAP GROWTH FUND
Notes to Financial Statements (Continued)
For the year ended August 31, 2001, PFPC Trust Co. has, at its discretion, voluntarilyagreed to waive a portion of its custodial fees for the Fund. During this period (unlessotherwise indicated), custodial fees and waivers were as follows:
Gross Custodial Net CustodialFees Waivers Fees
—————————— ————— ——————————
Bogle Investment ManagementSmall Cap Growth Fund $22,056 $(5,325) $16,731
3. Investment in Securities
For U.S. federal income tax purposes, the cost of securities owned at August 31, 2001was $83,436,861. Accordingly, the net unrealized appreciation/(depreciation) of investmentswas as follows:
Net Appreciation/Appreciation Depreciation (Depreciation)
————————— —————––––––——–— ———————————
Bogle Investment ManagementSmall Cap Growth Fund $10,365,916 $(3,596,879) $6,769,037
For the year ended August 31, 2001, aggregate purchases and sales of investment secu-rities (excluding short-term investments) were as follows:
Investment Securities—————————————————Purchases Sales——————— ———————
Bogle Investment ManagementSmall Cap Growth Fund $132,522,938 $66,261,855
4. Capital Share Transactions
As of August 31, 2001, the Fund has 100,000,000 shares of $0.001 par value common stockauthorized for the Institutional Class and 100,000,000 shares of $0.001 par value commonstock authorized for the Investor Class.

21
BOGLE INVESTMENT MANAGEMENTSMALL CAP GROWTH FUND
Notes to Financial Statements (Concluded)
Transactions in capital shares were as follows:
Institutional Class————————––––––––––––––––––––––––––––––––––––––––––––––––––––––––——————––—
For the For the Period Year ended Ended
August 31, 2001 August 31, 2000——————————————––— ——————————————––—Shares Value Shares Value
—––——— ——––—–––––––—————— —––——— —————––————
Sales . . . . . . . . . . . . . . . . . . . . . 1,627,098 $31,538,382 267,615 $4,265,056Redemptions . . . . . . . . . . . . . . . . (42,401) (818,960) (115) (2,059)Reinvestments . . . . . . . . . . . . . . 19,129 362,502 — —
——––—–––––––—––––——— ——––—–––––––—————— —––————— ——––———————
Net Increase . . . . . . . . . . . . . . . 1,603,826 $31,081,924 267,500 $4,262,997——––—–––––––—––––——— ——––—–––––––—————— —––————— ——––—————————––—–––––––—––––——— ——––—–––––––—————— —––————— ——––———————
Investor Class ————————––––––––––––––––––––––––––––––––––––––––––––––––––––––––––——————––—
For the For the Period Year ended Ended
August 31, 2001 August 31, 2000—————————–——––––———––— ————————–——————––—
Shares Value Shares Value——––—–––––––—––––——— ——––—–––––––—————— —––——— —————––———
Sales . . . . . . . . . . . . . . . . . . . . 2,427,827 $ 47,223,625 989,101 $15,965,080Redemptions . . . . . . . . . . . . . . . (608,924) (11,647,144) (62,615) (1,067,464)Reinvestments . . . . . . . . . . . . . 38,014 731,309 — —
——––—–––––––—––––——— ——––—–––––––—————— —––————— ———––———————
Net Increase . . . . . . . . . . . . . . 1,856,917 $ 36,307,790 926,486 $14,897,616——––—–––––––—––––——— ——––—–––––––—————— —––————— ———––—————————––—–––––––—––––——— ——––—–––––––—————— —––————— ———––———————
5. Reclass of Capital Accounts
In accordance with accounting pronouncements, the Fund has recorded reclassificationsin the capital accounts. These reclassifications have no impact on the net asset value of theFund and are designed generally to present undistributed income and realized gains on a taxbasis which is considered to be more informative to the shareholder. As of August 31, 2001,the Fund recorded the following reclassification to increase (decrease) the accounts listedbelow:
AccumulatedUndistributed net realized Additionalnet investment gain on Paid-in
loss investments Capital————————— ——————––––—–— ———————
Bogle Investment ManagementSmall Cap Growth Fund $234,790 $ — $(234,790)
6. Capital Loss Carryover
At August 31, 2001 capital loss carryovers were available to offset future realized gainsof: $1,206,354 which expire in 2009.

22
BOGLE INVESTMENT MANAGEMENTSMALL CAP GROWTH FUNDReport of Independent Accountants
To the Shareholders and Board of Directors ofBogle Investment Management Small Cap Growth Fund:
In our opinion, the accompanying statement of assets and liabilities, including the port-folio of investments, and the related statements of operations and of changes in net assetsand the financial highlights present fairly, in all material respects, the financial positionof Bogle Investment Management Small Cap Growth Fund, a separately managed portfolio ofThe RBB Fund, Inc. (the “Fund”) at August 31, 2001, the results of its operations for theyear then ended and, the changes in its net assets and the financial highlights for the yearthen ended and the period October 1, 1999 (commencement of operations) through August 31,2000. In conformity with accounting principles generally accepted in the United States ofAmerica. These financial statements and financial highlights (hereafter referred to as“financial statements”) are the responsibility of the Fund’s management; our responsibilityis to express an opinion on these financial statements based on our audits. We conductedour audits of these financial statements in accordance with auditing standards generallyaccepted in the United States of America, which require that we plan and perform the auditto obtain reasonable assurance about whether the financial statements are free of mater-ial misstatement. An audit includes examining, on a test basis, evidence supporting theamounts and disclosures in the financial statements, assessing the accounting principlesused and significant estimates made by management, and evaluating the overall financialstatement presentation. We believe that our audits, which included confirmation ofsecurities at August 31, 2001, by correspondence with the custodian and brokers, provide areasonable basis for our opinion.
PricewaterhouseCoopers LLP
Philadelphia, PennsylvaniaOctober 15, 2001

23
BOGLE INVESTMENT MANAGEMENTSMALL CAP GROWTH FUND
Shareholder Tax Information(Unaudited)
The Fund is required by subchapter M of the Internal Revenue Code of 1986, as amended,to advise its shareholders within 60 days of each Fund’s fiscal year end (August 31, 2001) asto the U.S. federal tax status of distributions received by each Fund’s shareholders inrespect of such fiscal year. During the fiscal year ended August 31, 2001, the following dividends and distributions per share were paid by the Fund:
Ordinary Income Capital Gains——————————–——––––———––— ——————————–——––––———––—Institutional Investor Institutional Investor
Class Class Class Class——––——–––––––—––––——— ——––——–––––––—––––——— ——––——–––––––—––––——— ——––——–––––––—––––———
$0.66 $0.66 — —
The percentage of total ordinary income dividends qualifying for the corporate dividends received deduction for the Fund is 28.35%.
These amounts were reported to shareholders as income in 2000. Because the Fund’s fiscal year is not the calendar year, another notification will be sent with respect to calendar year 2001. The second notification, which will reflect the amount, if any, to beused by calendar year taxpayers on their U.S. federal income tax returns, will be made inconjunction with Form1099-DIV and will be mailed in January 2002.
Foreign shareholders will generally be subject to U.S. withholding tax on the amountof their dividend. They will generally not be entitled to a foreign tax credit or deductionfor the withholding taxes paid by the Fund, if any.
In general, dividends received by tax exempt recipients (e.g., IRAs and Keoghs) need notbe reported as taxable income for U.S. federal income tax purposes. However, some retire-ment trusts (e.g., corporate, Keogh and 403(b)(7) plans) may need this information for theirannual information reporting.
Shareholders are advised to consult their own tax advisers with respect to the tax consequences of their investment in the Fund.
Investment AdviserBogle Investment Management, L.P.57 River StreetSuite 206Wellesley, MA 02481
Administrator/Transfer AgentPFPC Inc.400 Bellevue ParkwayWilmington, DE 19809
DistributorPFPC Distributors, Inc.3200 Horizon DriveKing of Prussia, PA 19046
CustodianPFPC Trust Company8800 Tinicum Blvd.Suite 200Philadelphia, PA 19153
Independent AccountantsPricewaterhouseCoopers LLPTwo Commerce Square2001 Market StreetPhiladelphia, PA 19103-7042
CounselDrinker Biddle & Reath LLPOne Logan Square18th and Cherry StreetsPhiladelphia, PA 19103-6996
BOGLEINVESTMENTMANAGEMENT
SMALL CAPGROWTH FUND
Annual Report
August 31, 2001
This report is submitted for the general informationof the shareholders of the Fund. It is not authorizedfor the distribution to prospective investors in theFund unless it is preceded or accompanied by a cur-rent prospectus which includes details regarding theFund’s objectives, policies and other information.Total investment return is based on historicalresults and is not intended to indicate future perfor-mance. The investment return and principal value ofan investment in the Fund will fluctuate, so that aninvestor’s shares, when redeemed, may be worth moreor less than original cost.