

BofAML GLOBAL AG & CHEMICALS CONFERENCEiclgroupv2.s3.amazonaws.com/corporate/wp-content/... ·...
84
BofAML GLOBAL AG & CHEMICALS CONFERENCE
Transcript of BofAML GLOBAL AG & CHEMICALS CONFERENCEiclgroupv2.s3.amazonaws.com/corporate/wp-content/... ·...
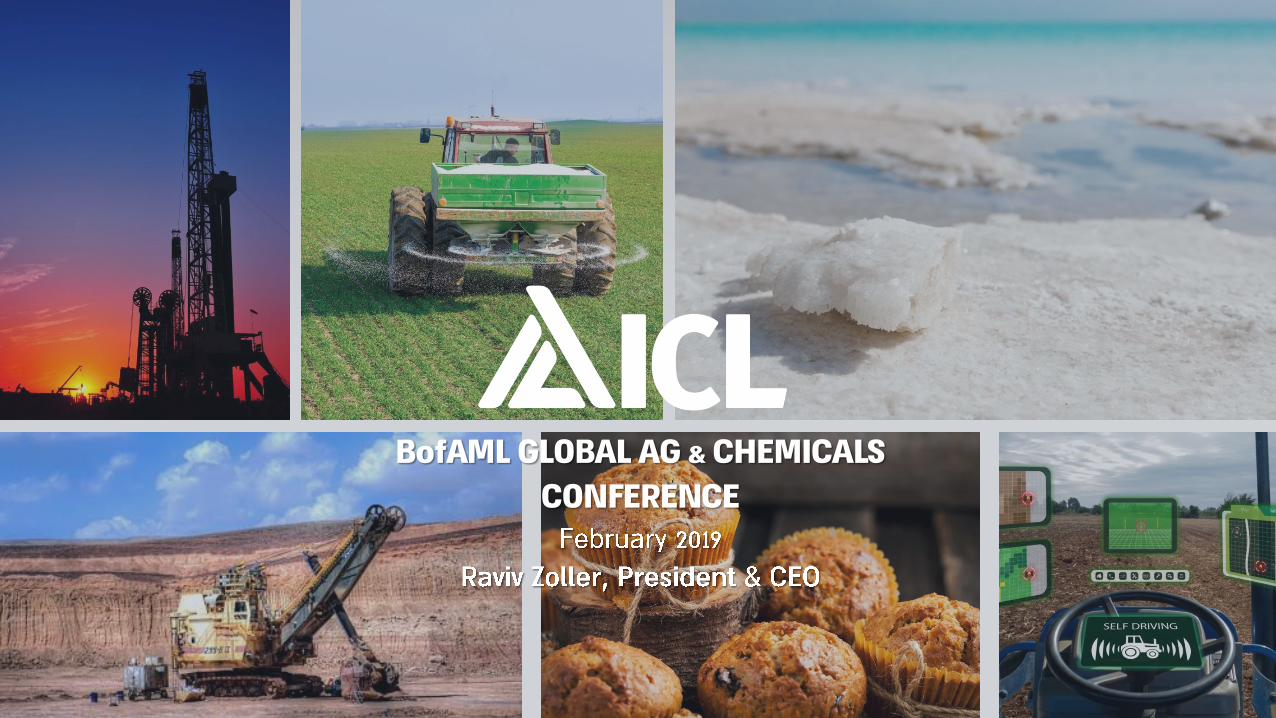
BofAML GLOBAL AG & CHEMICALS
CONFERENCE

IMPORTANT LEGAL NOTES

49$5.6B
$7.1B #2
TOP 3~11,000
ICL- AT A GLANCE
<3% BBB-

Production site Sales & marketing office
35%*
25%
1%
22%
12%
* Percentage of sales by main geographical areas, 2017
LEADING GLOBAL COMPANY
2%
3%

proximity to ports &
customers
STRATEGIC
LOCATIONS
innovation
STARTUP
NATION
accumulated over
decades
KNOW-HOWUNIQUE
ASSETS
ICL – STRATEGIC ADVANTAGES

#1
#1
#1
#1
#1
#3
DNA OF LEADERSHIP
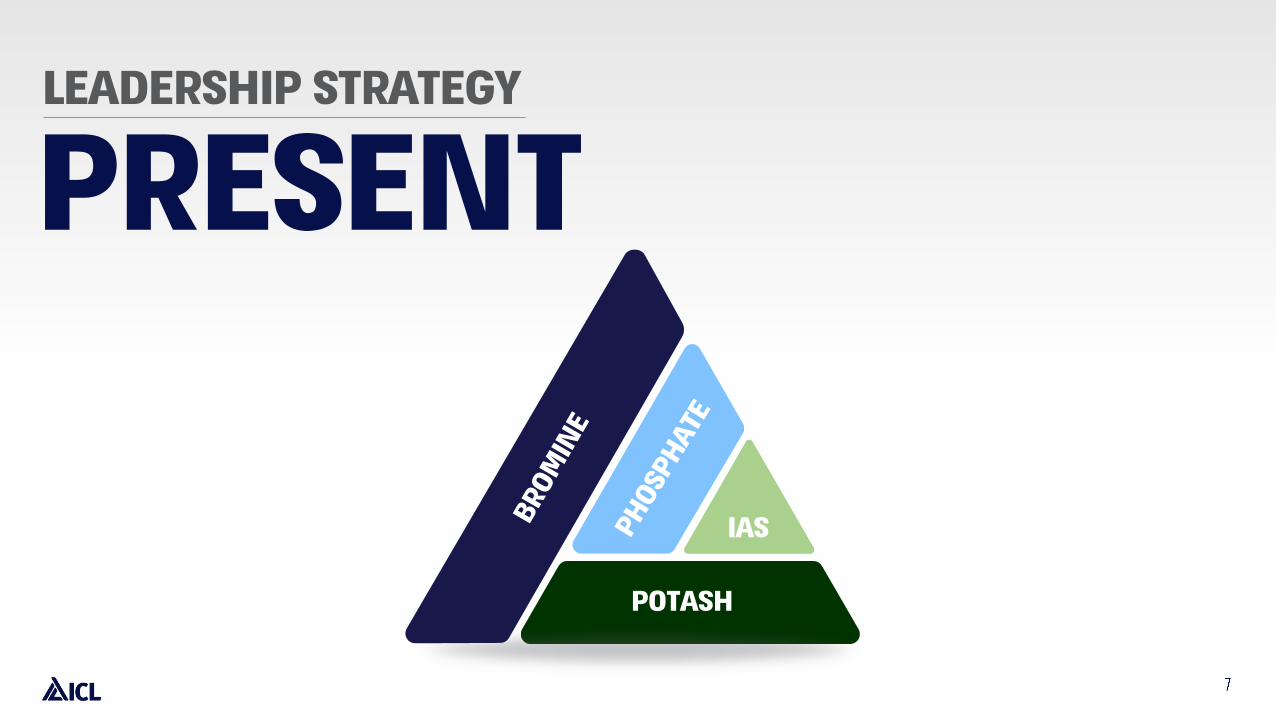
PRESENT
LEADERSHIP STRATEGY
POTASH
IAS
essential ingredients
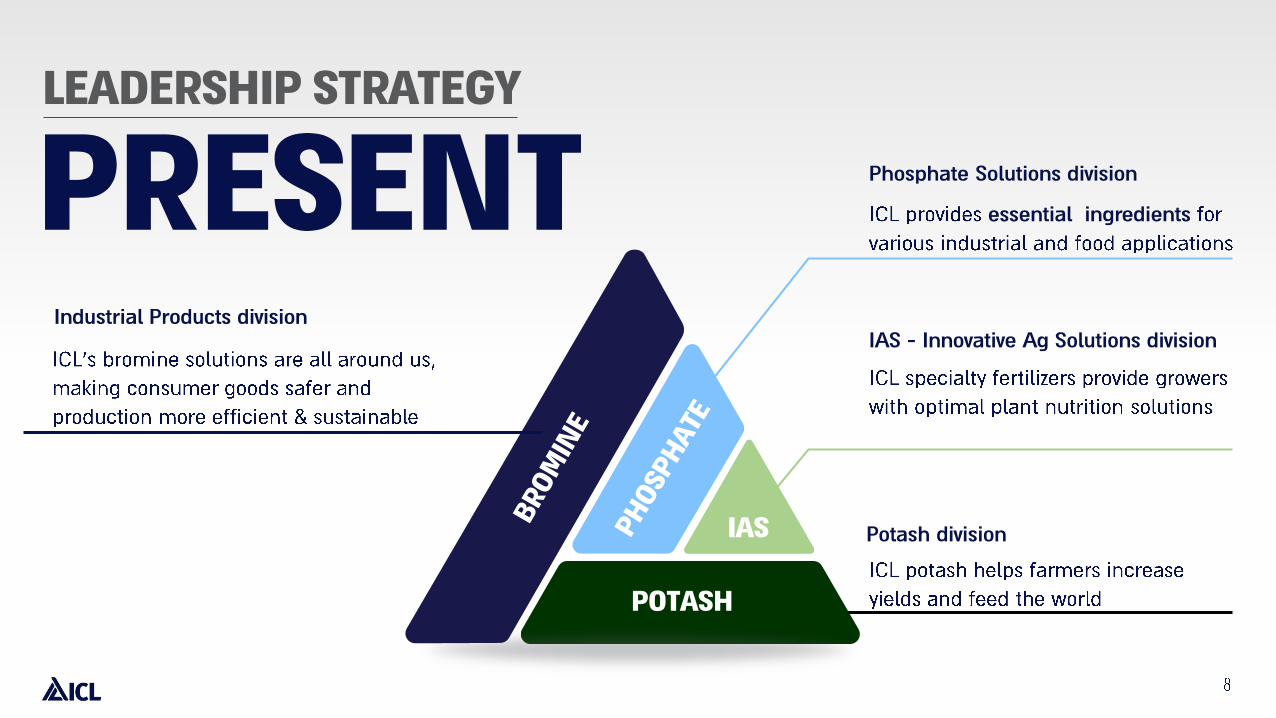
LEADERSHIP STRATEGY
PRESENTPhosphate Solutions division
Potash division
Industrial Products division
IAS - Innovative Ag Solutions division
POTASH
IAS
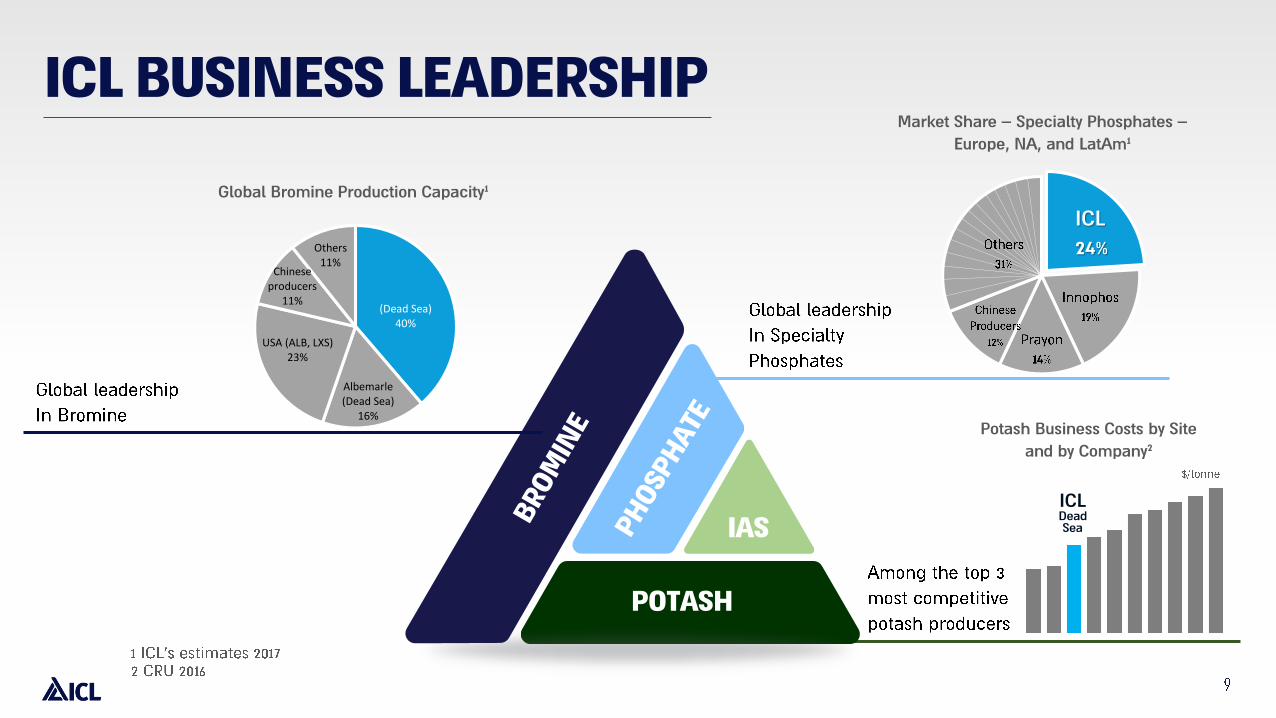
ICL BUSINESS LEADERSHIP
Potash Business Costs by Site
and by Company2
ICL
24%
ICLDead
Sea
Market Share – Specialty Phosphates –
Europe, NA, and LatAm1
ICL
POTASH
IAS
(Dead Sea)40%
Albemarle (Dead Sea)
16%
USA (ALB, LXS)23%
Chinese producers
11%
Others11%
Global Bromine Production Capacity1
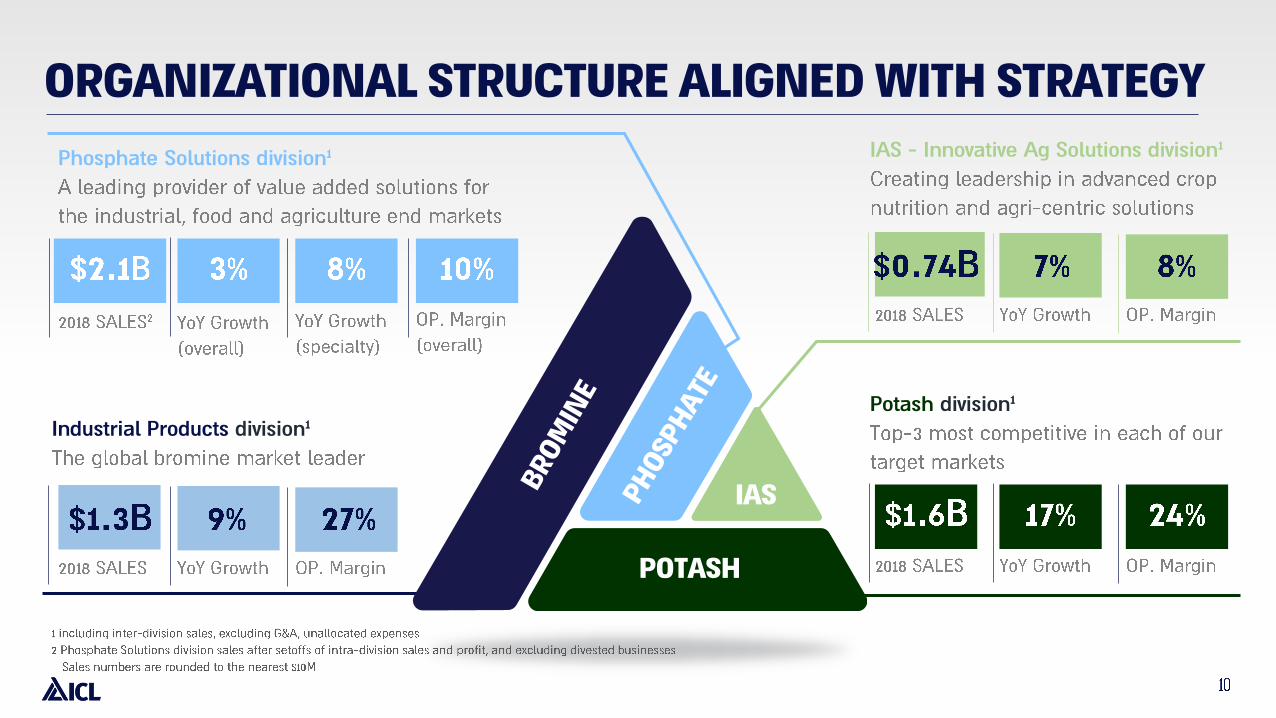
ORGANIZATIONAL STRUCTURE ALIGNED WITH STRATEGY
Phosphate Solutions division1
Potash division1
Industrial Products division1
IAS - Innovative Ag Solutions division1
POTASH
IAS

LEADERSHIP STRATEGY
FUTURE
POTASH

Industrial Products
Anat Tal
President ICL Industrial Products Division

LEADERSHIP STRATEGY
POTASH

Industrial Products in a Snapshot

Industrial Products Geographical Sales Distribution

Industrial Products Sales Distribution
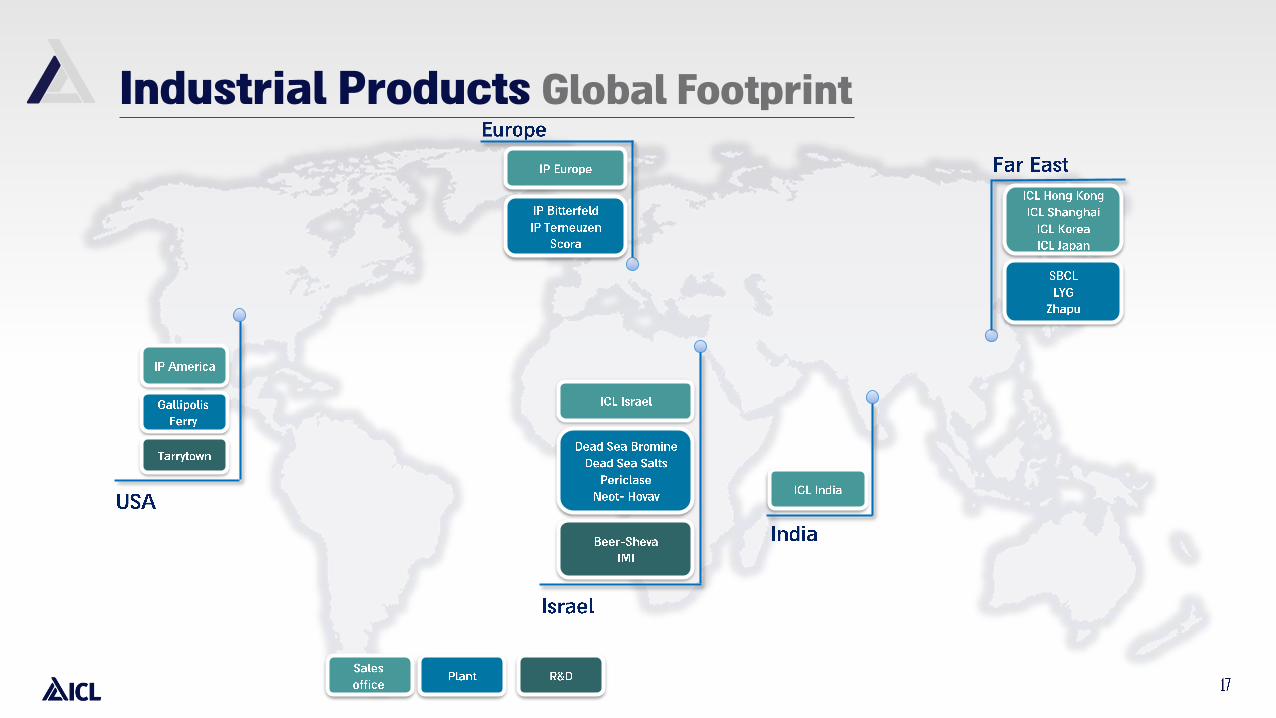
Industrial Products Global Footprint

Industrial Products Supply Chain

Industrial Products’ 4-Pillar Strategy
A WORLD LEADER AND BEYOND

Industrial Products Market Leadership

Industrial Products Business Performance
✓
✓
✓83
73
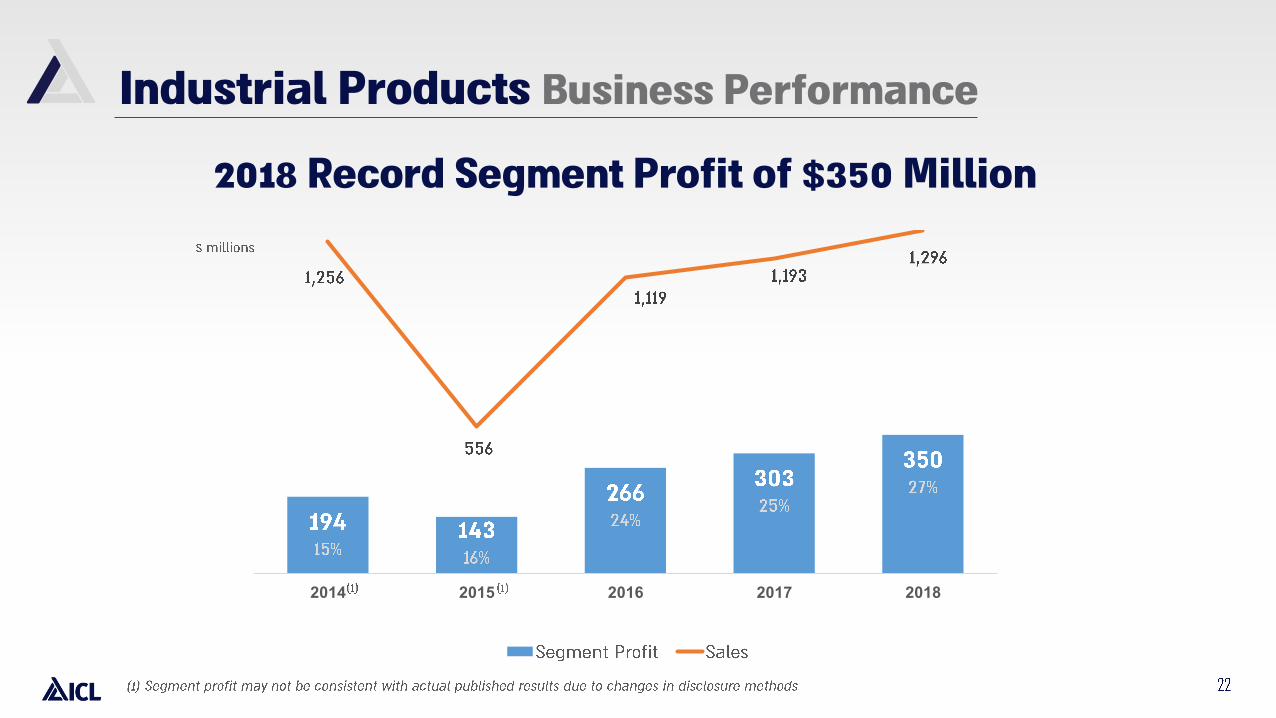
2018 Record Segment Profit of $350 Million
2014 2015 2016 2017 2018
Industrial Products Business Performance
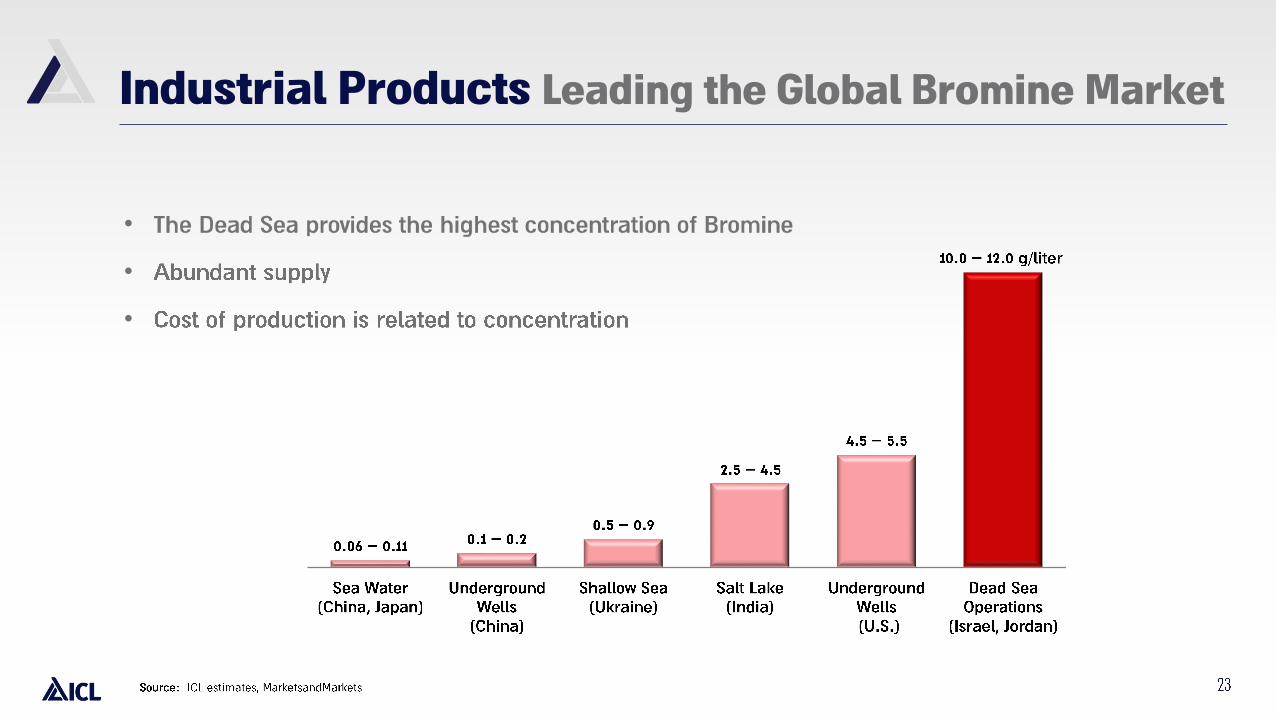
Industrial Products Leading the Global Bromine Market
•
•
•

Flame Retardants
41%
Brominated organic
intermediates & Industrial
34%
Clear brine fluids
15%
Biocides7%
Mercury Control
4%
280 280
120 120
170 165
70 50
8090
2018 2023
Industrial Products Leading the Global Bromine Market

Industrial Products Global Trends & Major End-Markets

Industrial Products Benefitting from Higher Bromine Prices

Trends ICL’s Solutions
Major Trends and ICL-IP’s Solutions
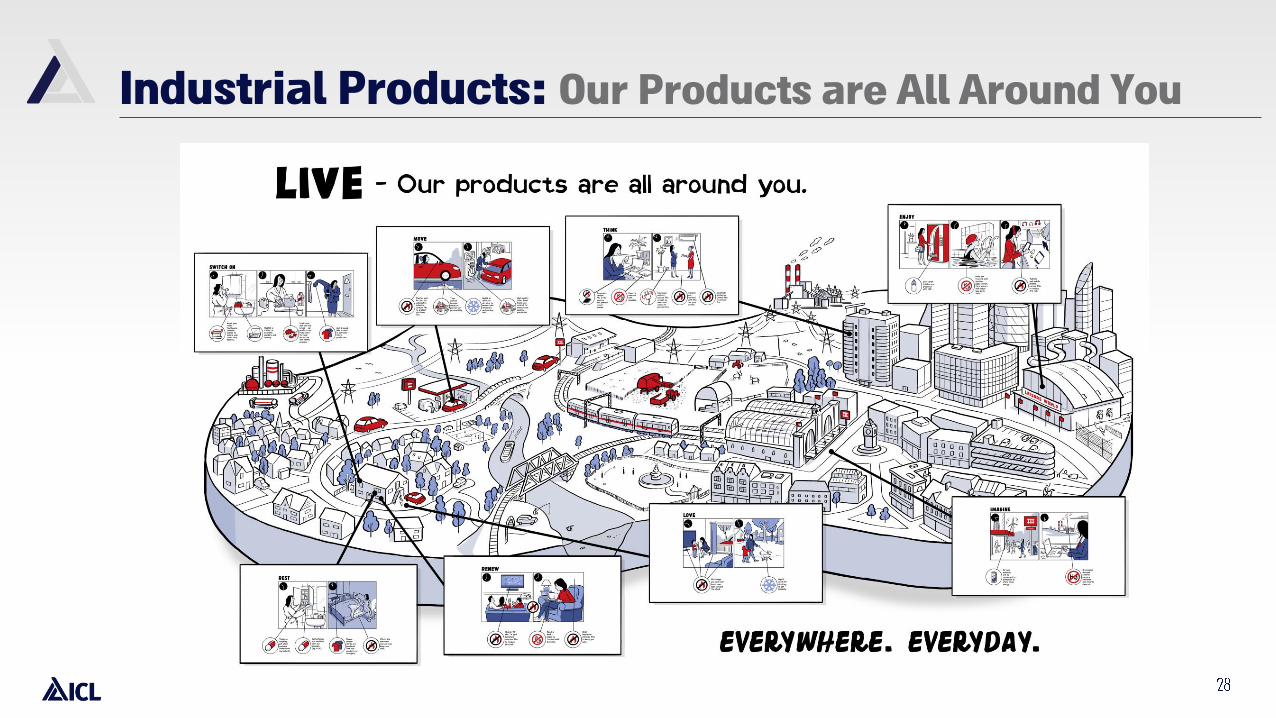
Industrial Products: Our Products are All Around You

Appendix

ICL- 90 YEARS OF HISTORY
Focusing on innovation and
solidifying leadership
2000s -
Establishing & growing operations
in Israel
1920s - 1970s
Consolidating & expanding
globally
1970s - 2014
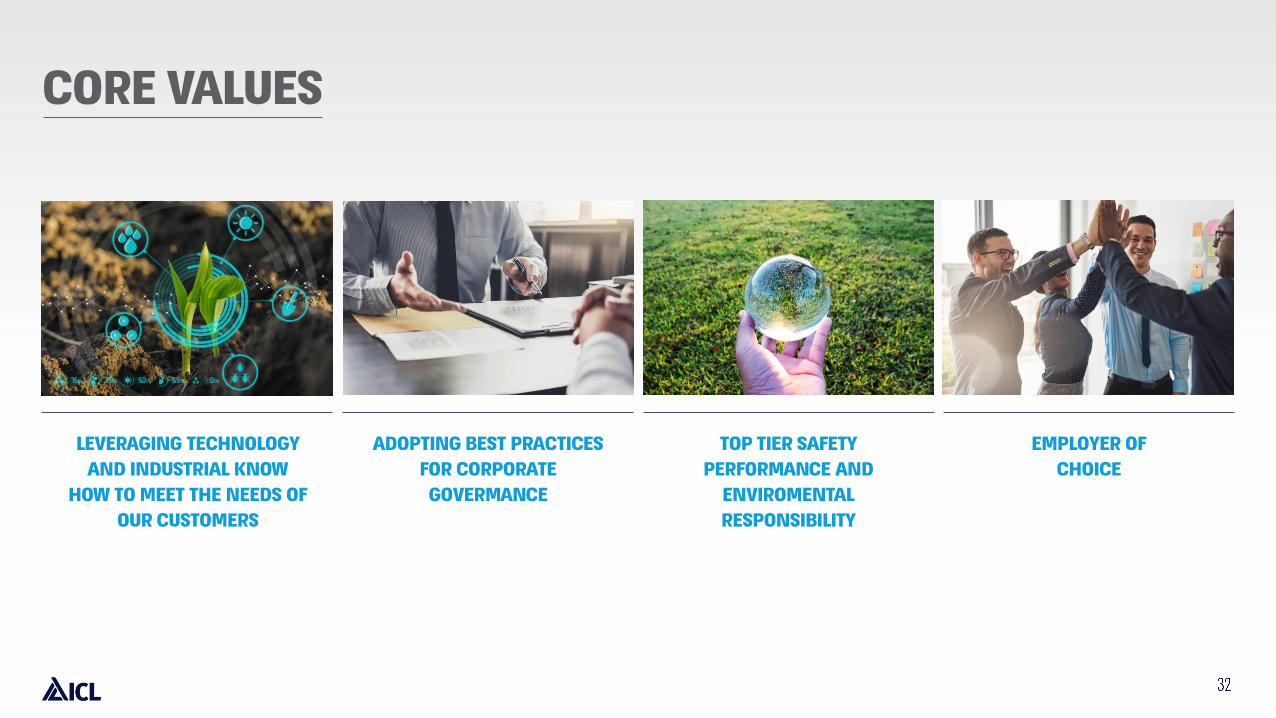
CORE VALUES
TOP TIER SAFETY
PERFORMANCE AND
ENVIROMENTAL
RESPONSIBILITY
EMPLOYER OF
CHOICE
LEVERAGING TECHNOLOGY
AND INDUSTRIAL KNOW
HOW TO MEET THE NEEDS OF
OUR CUSTOMERS
ADOPTING BEST PRACTICES
FOR CORPORATE
GOVERMANCE

SUSTAINABILITY
99%
$115M
89%
SILVER RANKING
TfS
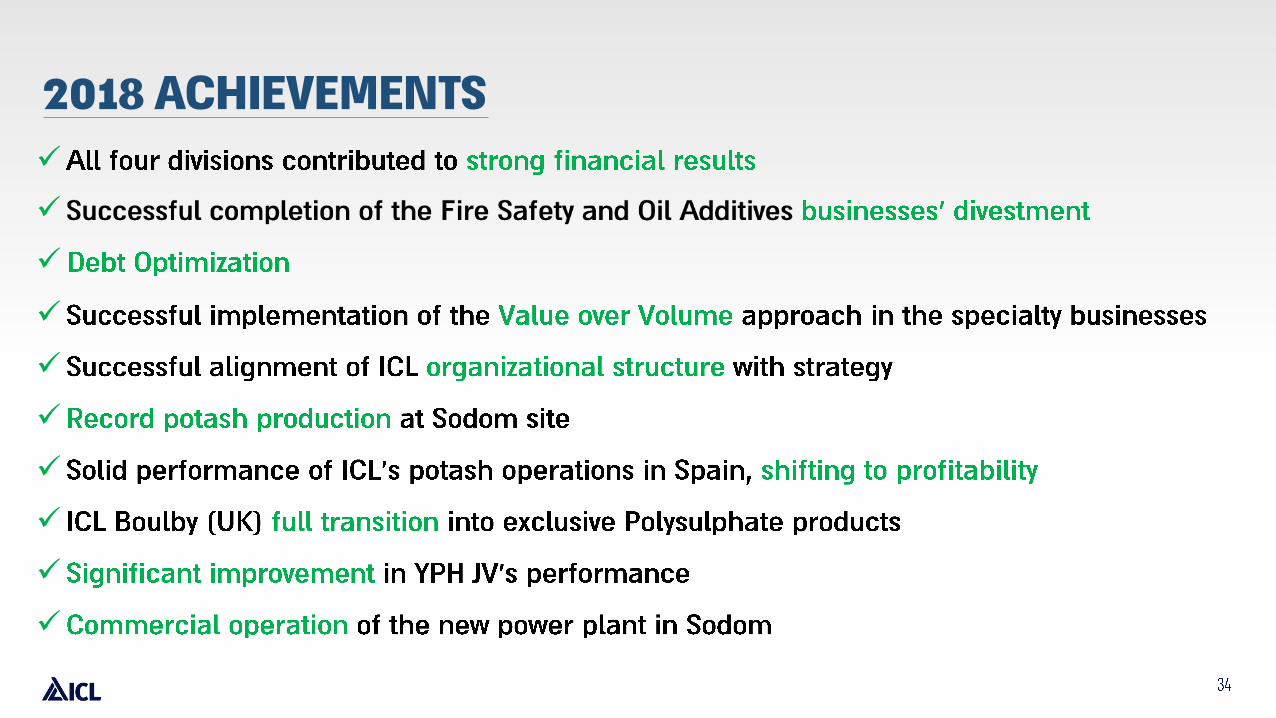
2018 ACHIEVEMENTS
✓
✓
✓
✓
✓
✓
✓
✓
✓
✓

Financial Overview

Additional Data Regarding Aligned Divisions
Sales FY 2015 Q1 2016 Q2 2016 Q3 2016 Q4 2016 FY 2016 Q1 2017 Q2 2017 Q3 2017 Q4 2017 FY 2017 Q1 2018 Q2 2018 Q3 2018 Q4 2018 FY 2018
Potash 1,515 273 299 351 415 1,338 283 314 372 414 1,383 353 346 409 515 1,623
Phosphate Solutions 2,049 556 584 548 498 2,186 523 507 520 487 2,037 525 532 530 495 2,082
Industrial Products (Bromine) 1,034 268 294 275 283 1,120 310 291 289 303 1,193 317 331 328 320 1,296
Innovative Ag Solutions 680 188 189 147 137 661 192 190 154 156 692 221 212 161 147 741
Setoffs and eliminations (239) (59) (55) (53) (34) (202) (48) (48) (46) (53) (196) (53) (59) (57) (67) (236)
Sub-Total 5,039 1,226 1,311 1,268 1,299 5,103 1,260 1,254 1,289 1,307 5,109 1363 1362 1371 1410 5,506
Divested businesses' contribution 366 39 66 115 39 260 35 68 151 54 309 41 9 - - 50
Total Sales - ICL 5,405 1,265 1,377 1,383 1,338 5,363 1,295 1,322 1,440 1,361 5,418 1,404 1,371 1,371 1,410 5,556
Profit FY 2015 Q1 2016 Q2 2016 Q3 2016 Q4 2016 FY 2016 Q1 2017 Q2 2017 Q3 2017 Q4 2017 FY 2017 Q1 2018 Q2 2018 Q3 2018 Q4 2018 FY 2018
Potash 637 50 64 75 93 282 37 61 65 119 282 62 76 97 158 393
Phosphate Solutions 340 65 70 48 41 224 37 37 52 23 149 51 53 62 38 204
Industrial Products (Bromine) 225 62 71 77 76 286 77 76 77 73 303 78 94 95 83 350
Innovative Ag Solutions 63 20 23 7 5 55 20 19 9 8 56 25 23 7 2 57
G&A & other (349) (86) (91) (92) (84) (353) (64) (65) (64) (73) (266) (71) (56) (60) (67) (254)
Sub-Total 916 111 137 115 131 494 107 128 139 150 524 145 190 201 214 750
Divested businesses' contribution 78 4 26 49 9 88 9 25 76 18 128 6 (2) (1) - 3
Total - adjusted operating income - ICL 994 115 163 164 140 582 116 153 215 168 652 151 188 200 214 753
(1) (1) (1)(1) (1)
(1)
(1)
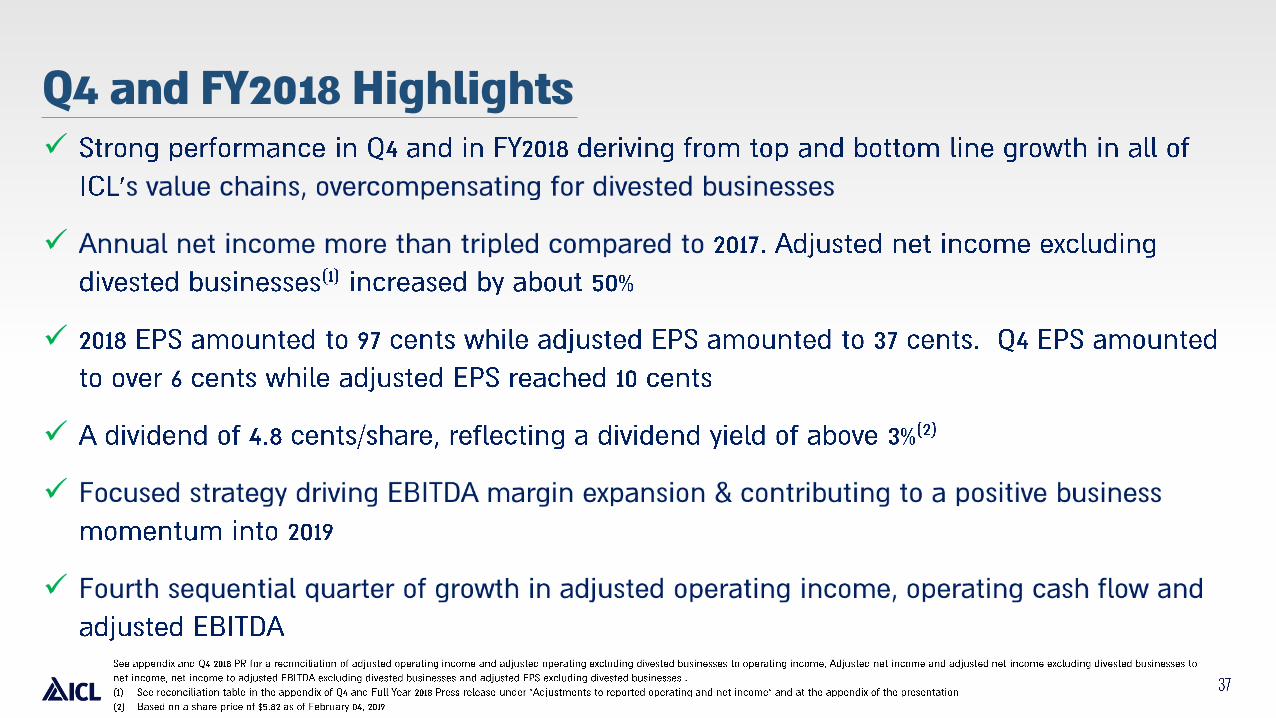
Q4 and FY2018 Highlights
✓
✓
✓
✓
✓
✓

Q4 and Full Year 2018 Results
Summary

Sequential Growth Throughout 2018

Effective Tax Rate

2019 2020 2021 2022 2023 2024 2025 2026 2038
Successful Optimization of Debt Structure

Decreasing Net Debt/EBITDA Ratio
2013 2014 2015 2016 2017 2018

2018 KEY TAKEAWAYS

Industrial Products

THE GLOBAL BROMINE
MARKET LEADER
175K TONNES
NO.1
SOLID LEADERSHIP
230K TONNES
NO.1
BROMINE PRICES
IN CHINA
INDUSTRIAL PRODUCTS
UNIQUE
ADVANTAGE
2,600
3,100
3,600
4,100
4,600
5,100

Potash

LEADERSHIP STRATEGY
POTASH

INCREASE YIELDS AND FEED THE WORLD
POTASH

100
200
World CropProduction in 2005-
2007
Expansion ofArable Land
Crop Rotation Increase in Yields World CropProduction in 2050
POTASH
0.16
0.24
0.32
0.40
0.48
3
4
5
6
7
8
9
10
11
1961 1972 1983 1994 2005 2016 2027E 2038E 2049E
World population (Bn) Arable land (Ha/Person)

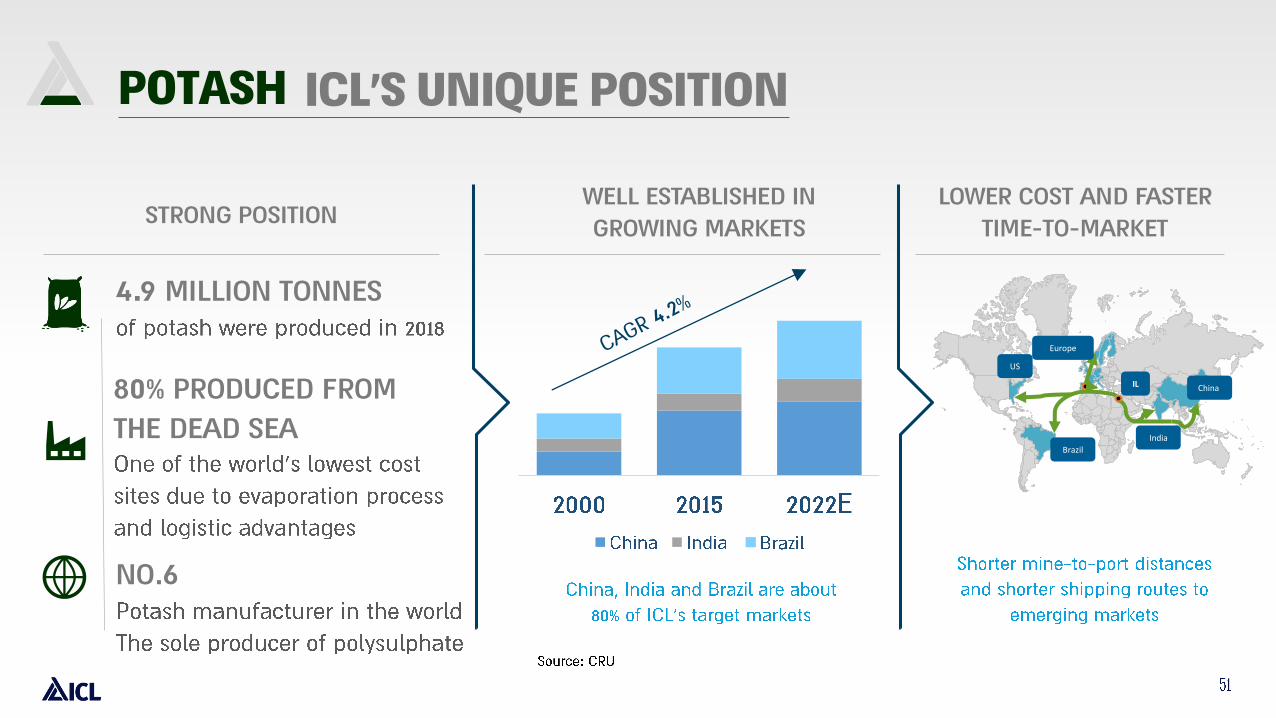
ICL’S UNIQUE POSITION
4.9 MILLION TONNES
STRONG POSITION
POTASH
80% PRODUCED FROM
THE DEAD SEA
WELL ESTABLISHED IN
GROWING MARKETS
LOWER COST AND FASTER
TIME-TO-MARKET
NO.6
ICL’S UNIQUE POSITION
4.9 MILLION TONNES
STRONG POSITION
POTASH
LOWER COST AND FASTER
TIME-TO-MARKET
China
India
IL
Europe
Brazil
US
WELL ESTABLISHED IN
GROWING MARKETS
80% PRODUCED FROM
THE DEAD SEA
NO.6

POTASH OUR GOALS
TOP-3 5MT
10% 1M

Total Fertilizer Use by Crop at Global Level

World Main Crops Long Term Forecast
Consumption, Stock and Stock to Use Ratio
Consumption

World Grains Production & Consumption:
Current Stock to Use Ratio
196
0/6
1
196
2/6
3
196
4/6
5
196
6/67
196
8/69
19
70
/71
19
72
/73
19
74
/75
19
76
/77
19
78
/79
19
80
/8
1
19
82
/8
3
19
84
/8
5
19
86
/8
7
19
88
/8
9
19
90
/9
1
19
92
/9
3
19
94
/9
5
19
96
/9
7
19
98
/9
9
20
00
/0
1
20
02
/0
3
20
04
/0
5
20
06
/0
7
20
08
/0
9
20
10
/11
20
12
/13
20
14
/15
20
16
/17
20
18
/19

ICL’s Potash Market Share in Fast Growing Markets
10%
25%
25%
16%
20%4%
APC BPC Canpotex ICL Uralkali K+S
5%
20%
23%9%
29%
14%
SQM BPC Uralkali K+S Canpotex ICL
20%
23%
31%
12%
9%5%
Uralkali BPC Canpotex ICL APC Others
India Brazil China
31%
16%13%
23%
15% 2%
Canpotex Uralkali APC BPC ICL K & S
30%
24%2%
19%
12%
13%
Canpotex Uralkali SQM BPC ICL K&S
21%
19%
38%
4%
11%3% 4%
Uralkali BPC Canpotex APC ICL K+S Other

Positive Potash Spot Pricing trend
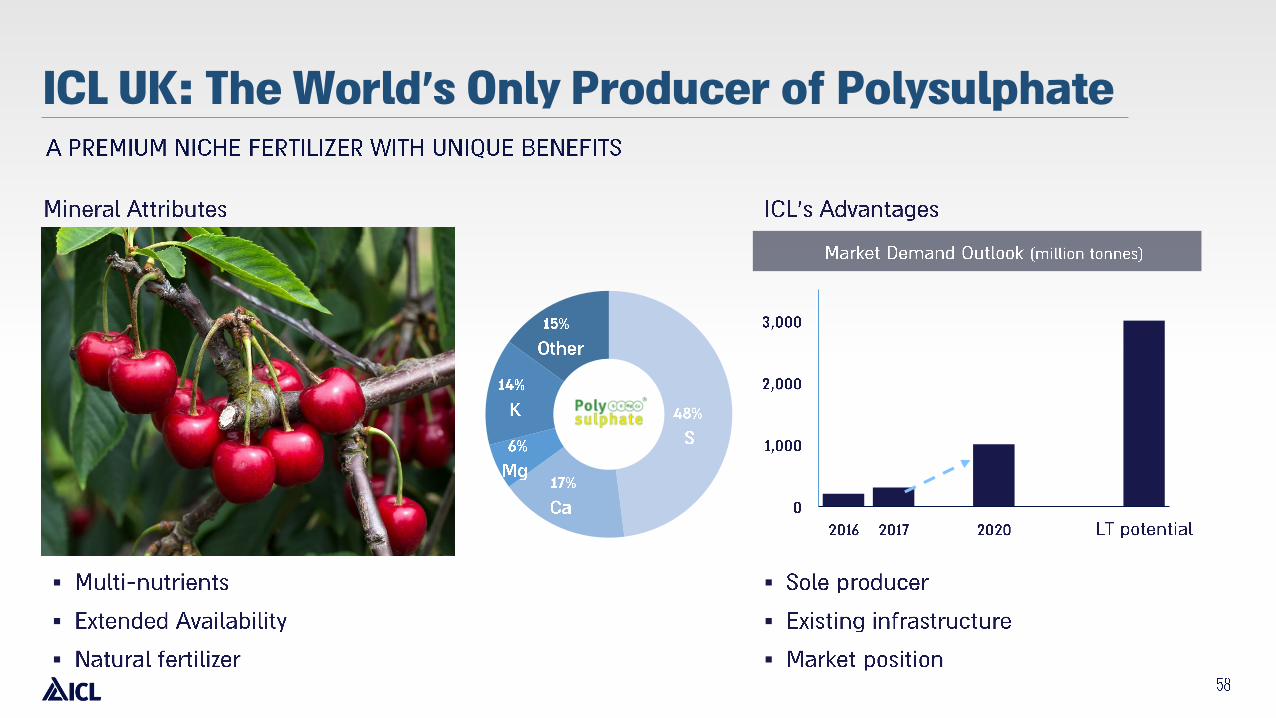
ICL UK: The World’s Only Producer of Polysulphate
▪
▪
▪
▪
▪
▪

Phosphate Solutions

LEADERSHIP STRATEGY
POTASH

PHOSPHATE SOLUTIONS - FOOD
ESSENTIAL
MINERALS
BITE
TASTE &
MOUTH FEELTEXTURE &
LAST LONGER
RISE

Oil drilling MiningOral care Cleaning
products
Metals
Leather Construction AsphaltPaints & coatings
- INDUSTRIALPHOSPHATE SOLUTIONS
Water
treatment

UNIQUE BACKWARD
INTEGRATION MODEL
5,000K TONNES
Over 90% of phosphate rock
AND VALUABLE
INNOVATIVE PRODUCTS
ICL’S RECIPE FOR LEADERSHIPPHOSPHATE SOLUTIONS
1,190K TONNES
290K TONNES
ICL
24%
WITH A LEADING MARKET
POSITION
Source: ICL estimates (2017)
Market Share – Specialty Phosphates –
Europe, NA, and LatAm1

OUR GOALSPHOSPHATE SOLUTIONS
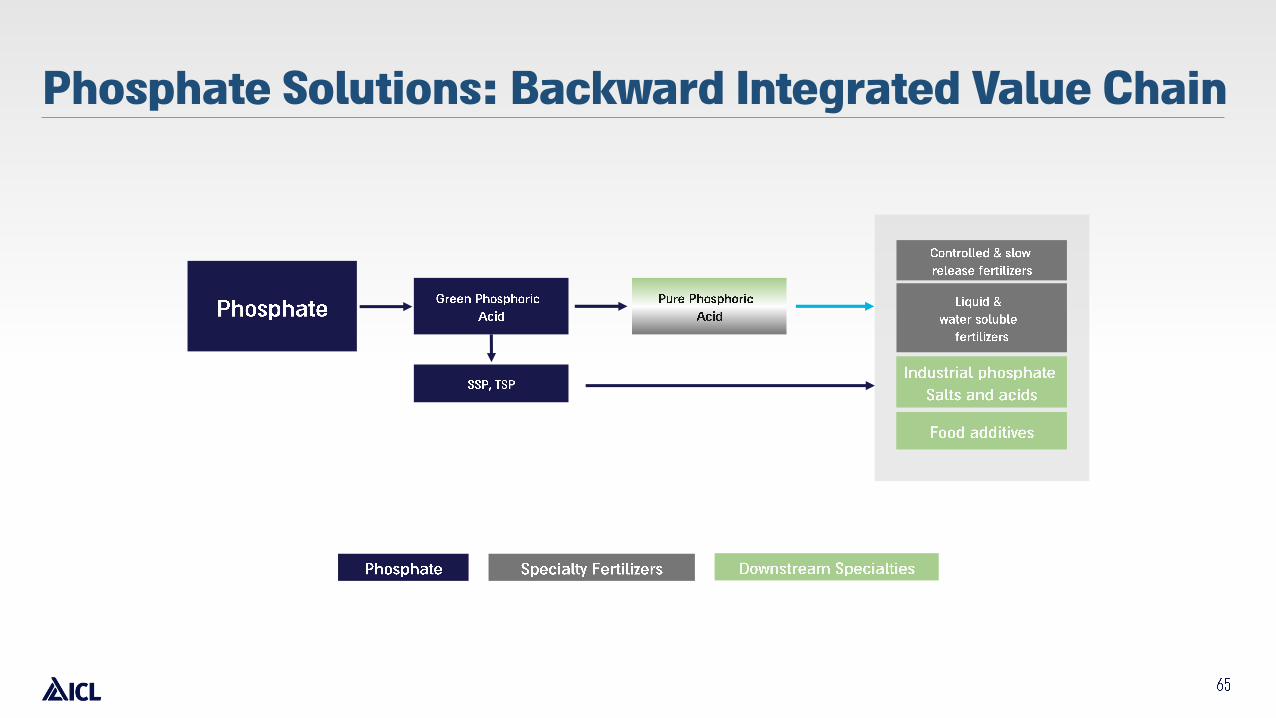
Phosphate Solutions: Backward Integrated Value Chain

Phosphoric Acid Pricing Trends
%

We Have Built a World-Class
Advanced Additives Portfolio
• •
• •

Vast Product Portfolio Serving a
Variety of End Food Additives Markets
••
•
•
••
•
•
•
•

Food Specialties: Markets and Competition

Innovative Ag Solutions

LEADERSHIP STRATEGY
POTASH

0.4
1.8
FAST GROWING INDUSTRY
1.8
3.2
SPECIALTY FERTILIZERS - THE
FOUNDATION FOR THE FUTURE
~850K TONNES
OVER 300
INNOVATIVE AG SOLUTIONS CREATING LEADERSHIP
FASTEST GROWING
DIVERSIFIED PORTFOLIO
25 YEARS
Coated
FertilizersSolubles / Straights Liquids
SRF CRFSolubl
e NPK
MAP/
MKPSOP/CN NOP
Bulk
Liquids
Foliar
Liquids
ICL-SF ^ ^ ^ ^ ^ ^
Compo ^ ^ ^ ^
Haifa ^ ^ ^ ^
YARA ^ ^ ^
SQM ^ ^ ^ ^
Kingenta ^ ^ ^ ^

THE PERFECT STORM
CHANGEGROW MORE
WITH LESS
GROUNDBREAKING
SOLUTIONS
2B MORE PEOPLE
WITHIN 20 YEARS

ACADEMIC TECHNOLOGICAL BUSINESS
IAS LEVERAGING ISRAEL'S HIGH-TECH AND AGRI-TECH ECO SYSTEM
TARANIS
ICL AIMS TO OFFER FARMERS
CUTTING-EDGE SOLUTIONS

INNOVATIVE AG SOLUTIONS
UNIQUE R&D CAPABILITIES
GET CLOSER TO GROWER
PORTFOLIO GROWTH
INNOVATION DIGITAL TRANSFORMATION
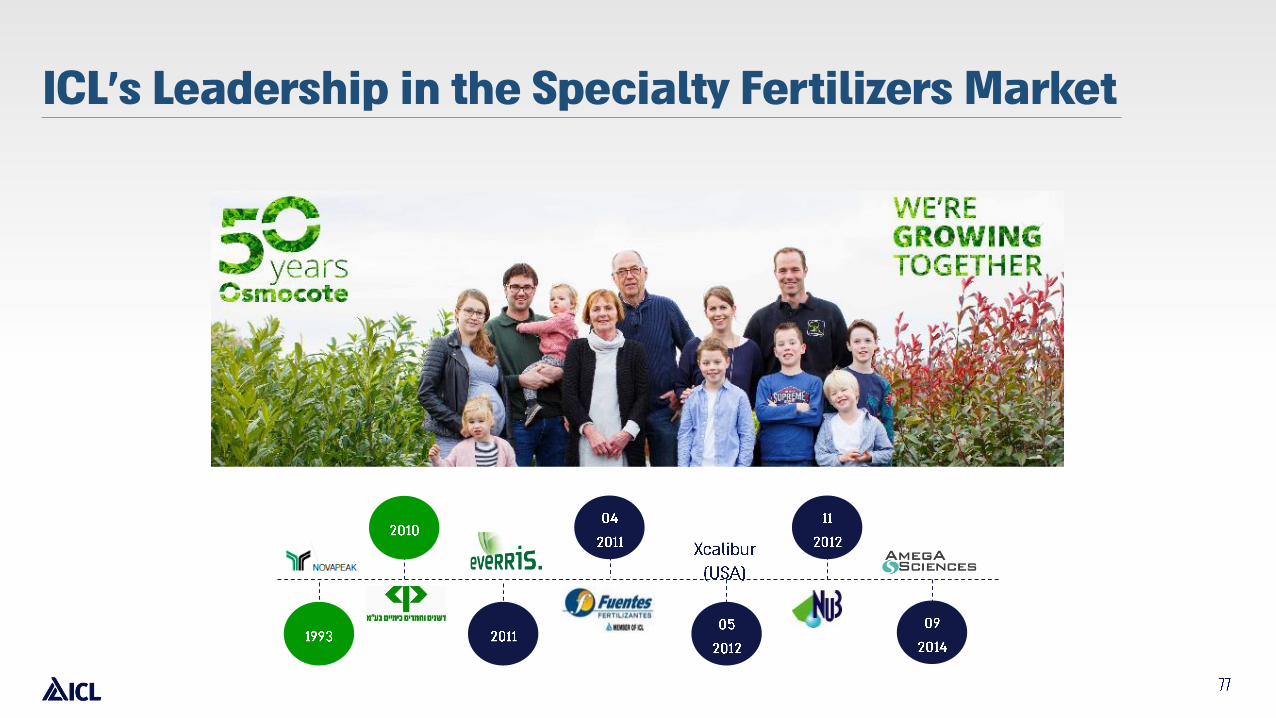
ICL’s Leadership in the Specialty Fertilizers Market

ICL Specialty Fertilizers: Our Strengths
▪
▪
▪
▪
▪
▪
▪
▪

Our Core Markets and Products Today

Specialty Fertilizers and Bio Solutions Have
Became An Important Part of the Ag Input
~$150bn
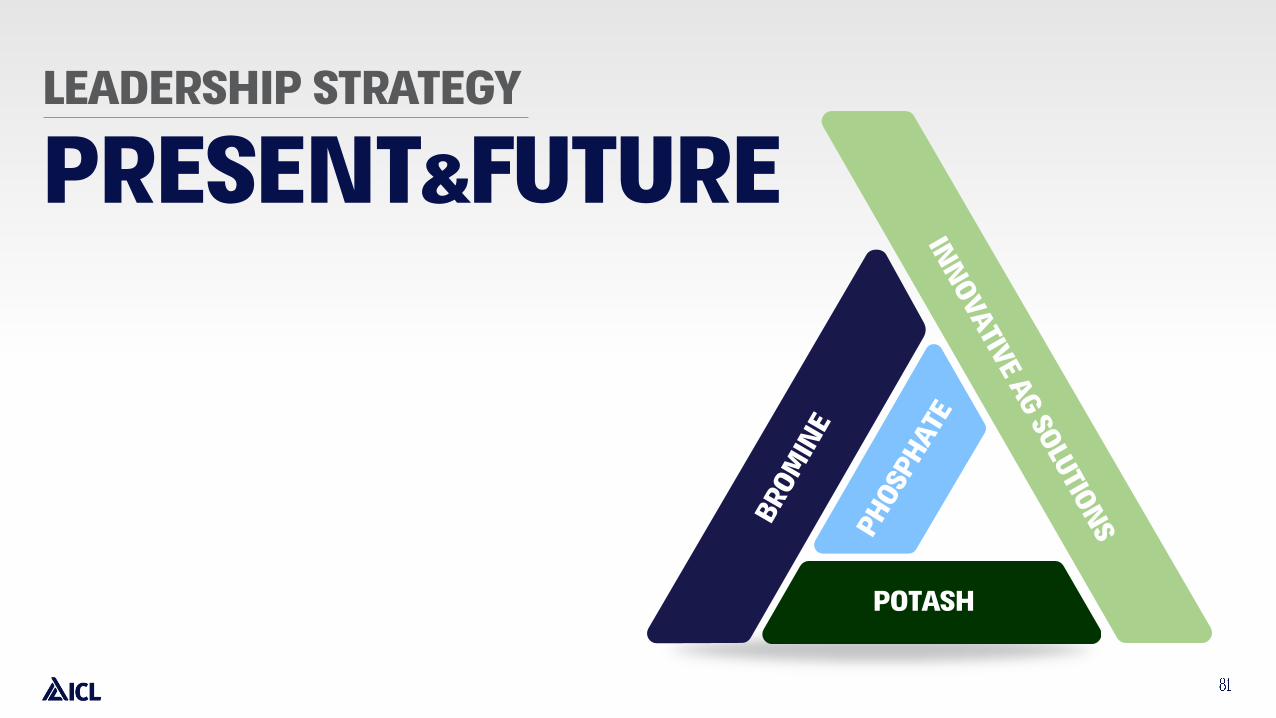
PRESENT&FUTURE
LEADERSHIP STRATEGY
POTASH

Reconciliation Tables (1/2)

Reconciliation Tables (2/2)


