Body -on -a-Chip Simulation with Gastrointestinal Tract ...
35
Body-on-a-Chip Simulation with Gastrointestinal Tract and Liver Tissues Suggests that Ingested Nanoparticles Have the Potential to Cause Liver Injury Journal: Lab on a Chip Manuscript ID: LC-ART-03-2014-000371.R1 Article Type: Paper Date Submitted by the Author: 16-May-2014 Complete List of Authors: Esch, Mandy; Cornell Nanofabrication Facility, Mahler , Gretchen ; Binghamton University, Bioengineering Stokol, Tracy; Cornell University, Shuler, Michael; Cornell University, Department of Chemical and Biomolecular Engineering; Cornell University, Lab on a Chip
Transcript of Body -on -a-Chip Simulation with Gastrointestinal Tract ...

Body-on-a-Chip Simulation with Gastrointestinal Tract and
Liver Tissues Suggests that Ingested Nanoparticles Have
the Potential to Cause Liver Injury
Journal: Lab on a Chip
Manuscript ID: LC-ART-03-2014-000371.R1
Article Type: Paper
Date Submitted by the Author: 16-May-2014
Complete List of Authors: Esch, Mandy; Cornell Nanofabrication Facility,
Mahler , Gretchen ; Binghamton University, Bioengineering Stokol, Tracy; Cornell University, Shuler, Michael; Cornell University, Department of Chemical and Biomolecular Engineering; Cornell University,
Lab on a Chip

Body-on-a-Chip Simulation with Gastrointestinal Tract and Liver Tissues Suggests that Ingested Nanoparticles Have the Potential to Cause Liver Injury
Mandy B. Esch,1 Gretchen J. Mahler,2 Tracy Stokol,4 Michael L. Shuler1,*
1) Department of Biomedical Engineering, 305 Weill Hall, Cornell University, Ithaca, NY, 14853, United States
2) Department of Bioengineering, Binghamton University, Binghamton, NY 13902, United States
3) Plant, Soil and Nutrition Laboratory, Agricultural Research Services, U.S. Department of Agriculture, Tower Road, Ithaca, NY 14853, United States
4) Department of Population Medicine and Diagnostic Sciences, College of Veterinary Medicine, S1-058 Schurman Hall, Cornell University Ithaca, NY, 14853, United States
*) Corresponding author, phone (607) 255-3293, fax (607) 255-1136
Abstract: The use of nanoparticles in medical applications is highly anticipated, and at the same time
little is known about how these nanoparticles affect human tissues. Here we have simulated the oral
uptake of 50 nm carboxylated polystyrene nanoparticles with a microscale, body-on-a-chip system (also
referred to as multi-tissue microphysiological system or micro Cell Culture Analog). Using this system,
we combined in vitro models of the human intestinal epithelium, represented by a co-culture of
enterocytes (Caco-2) and mucin-producing (HT29-MTX) cells, and the liver, represented by
HepG2/C3A cells, within one microfluidic device. The device also contained chambers that together
represented all other organs of the human body. Measuring the transport of 50 nm carboxylated
polystyrene nanoparticles across the Caco-2/HT29-MTX co-culture, we have found that this multi-cell
layer presents an effective barrier to 90.5 ± 2.9% of the nanoparticles. Further, our simulation suggests
that a larger fraction of the 9.5 ± 2.9% of nanoparticles that travelled across the Caco-2/HT29-MTX cell
layer were not large nanoparticle aggregates, but primarily single nanoparticles and small aggregates.
Page 1 of 34 Lab on a Chip
After crossing the GI tract epithelium, nanoparticles that were administered in high doses estimated in
terms of possible daily human consumption (240 and 480 x 1011 nanoparticles/mL) induced the release
of aspartate aminotransferase (AST), an intracellular enzyme of the liver that indicates liver cell injury.
Using the GI ‘tract – liver – other tissue’ system allowed us to observe compounding effects and detect
liver tissue injury at lower nanoparticle concentrations than expected from experiments with liver tissue
only. Our results indicate that body-on-a-chip devices are highly relevant in vitro models for evaluating
nanoparticle interactions with human tissues.
INTRODUCTION
Because of the enormous potential nanoparticles could have on how we treat and diagnose
disease, studies that address nanoparticle effects on human tissues have become a priority. In addition to
medical uses, there are a number of commercial products that contain nanoparticles (Nanotechnology
Consumer Product Inventory. Washington, DC: Project on Emerging Nanotechnologies, Woodrow
Wilson International Center for Scholars. Available at
http://www.nanotechproject.org/consumerproducts). Currently over 1030 products are available and
their applications range from antibacterial coatings and paints to cosmetics such as suncreen.1, 2, 3, 4, 5
However, little in known about the effects of nanoparticles on the tissues in the human body.
Recent studies have found that charged nanoparticles can affect phospholipid bilayers bearing
phosphocholine headgroups, causing surface reconstruction 6, and that carboxylated polystyrene
nanoparticles can alter the absorption of some nutrients through the intestines of poultry.7 Further
evaluation of the implications of nanoparticle consumption through intended or accidental exposure is
needed to estimate safe consumption levels.8,9
Here we simulate non-life-threatening effects of ingested 50 nm carboxylated polystyrene
nanoparticles on liver tissue using a ‘GI tract – liver – other tissues’ body-on-a-chip device. Previous
Page 2 of 34Lab on a Chip

studies of oral nanoparticle uptake have focussed on nanoparticle behavior directly in the intestine. One
of these studies has shown that small drug delivery nanoparticles (< 670 nm) travel farther into the
mucous layer of the intestine than do millimeter-sized nanoparticles, thus enhancing the bioavailability
of orally administered drugs.10,11 It is also known that both epithelial cells and microfold cells (M-cells)
of the Peyer’s patches in the intestine-associated lymphoid tissue facilitate particle uptake.12-14 Small,
charged nanoparticles (50 nm carboxylated nanoparticles) travel through the epithelial cell layer via
para-cellular, energy-independent processes.7 A recent study by the authors has found that the uptake of
50 nm, carboxylated nanoparticles through the intestine changes the absorption of iron as well as the
sizes of macro-villi found in the tissue.7 More experiments are needed to determine non-life-threatening
effects, if any, that may occur in tissues downstream of the intestine.
In this present study we use 50 nm, carboxylated polystyrene nanoparticles as a model for inert,
negatively charged nanoparticles and assess the nanoparticle’s potential to cause injury of in vitro liver
tissue. We choose 50 nm carboxylated polystyrene nanoparticles because these nanoparticles had the
most pronounced effects on iron uptake through the GI tract epithelium when compared to neutral and
positively charged nanoparticles.7 The concentrations used in this previous study had effects that were
non-lethal. Here we determine how 50 nm carboxylated polystyrene nanoparticles that crossed the GI
tract epithelium affect the liver. Testing the nanoparticle’s effects on the liver is important since in vivo
the blood stream coming from the GI tract transports ingested substances directly to the liver, exposing
the liver to the highest nanoparticle concentrations and potentially causing damage.
To quantify liver damage due to ingested nanoparticles, we monitored changes in the integrity of
the cell membranes of liver cells by measuring concentration of cytosolic enzymes in the cell culture
medium. Cells whose membranes are at least temporarily compromised, release cytosolic enzymes,
which are routinely used as in vivo biomarkers of tissue injury in animals and in humans.15 Thus the data
Page 3 of 34 Lab on a Chip
obtained with our measurements are more relevant when correlating in vitro and in vivo evaluations of
tissue damage than those obtained with other methods of assessing cellular injury.
We hypothesized that the GI tract presents a significant barrier to 50 nm carboxylated
polystyrene nanoparticles and that the limited nanoparticle travel across the GI tract epithelium would
have the effect of limiting exposure of the liver to the nanoparticles. To quantify nanoparticle travel
across the GI tract epithelium, we used fluorescently labeled nanoparticles and measured the magnitude
of fluorescence in the medium that was collected from the apical and basolateral sides of the GI tract
epithelium. We also quantified changes in the level of nanoparticle aggregation with other nanoparticles
and with macromolecules and changes in the magnitudes of zeta potentials of 50 nm carboxylated
polystyrene nanoparticles that travelled across the GI tract epithelium.
Since body-on-a-chip devices are well suited to simulate the uptake and circulation of
therapeutics or environmental compounds in vitro, we utilized a ‘GI tract – liver – other tissues’ body-
on-a-chip device to conduct our experiments.16-18 While both in vivo and in vitro studies can uncover
mechanisms that influence particle uptake and circulation, simulations with body-on-a-chip devices can,
inexpensively, direct our attention to effects that should be investigated further. These microfluidic
devices contain several tissue analogs in the form of cell cultures in chambers that are arranged in
physiologically correct order and with cell to fluid ratios that are close to in vivo values.19,20 The tissues
that are explicitly represented in the device are exposed to fluid flow rates and shear stresses that are
comparable to those observed in vivo. With these devices the combined response of several tissues to
nanoparticle exposure (or more generally, exposure to drugs, drug delivery systems, and environmental
toxins) may be predicted. We have previously demonstrated a body-on-a-chip device that contained a
multi-cellular model of the GI tract epithelium in combination with a model of the liver. We have used
this device to successfully simulate the uptake, metabolism, and toxicity of acetaminophen.21 Here we
Page 4 of 34Lab on a Chip

use a system that mimics the first pass metabolism (i.e. we combine GI tract tissue and liver tissue) to
simulate the oral uptake of 50 nm carboxylated polystyrene nanoparticles and the nanoparticle’s effects
on the liver.
MATERIALS AND METHODS
Microfabrication: The microfluidic silicon chips include explicit chambers for liver, kidney, fat
and bone marrow (Figure 1A). In this study we utilized the liver tissue chamber. The other three tissue
chambers will be used in further studies on responses of these tissues to nanoparticle exposure. The
silicon chips were fabricated at the Cornell Nanofabrication Facility using standard photolithography
and etching techniques. The pattern was designed with the layout editor L-EDIT (Tanner EDA
Monrovia, CA, USA) and transferred to 5” glass masks using a 3600 F optical pattern generator
(Mann/GCA Corp. Burlington, MA, USA). Silicon nitride layers (87 nm) were grown at 1100°C on
silicon <100> wafers (Silicon Quest, Santa Clara, CA) using the process gases SiH2Cl2, NH3, and N2O
in a furnace tube. The silicon wafers were then coated with photoresist S1813 (Shipley, Marlborough,
MA) at a spin speed of 3000 rpm and exposed for 4 seconds using an AB-M HTG 3HR contact aligner
(AB-M, San Jose, CA). They were then developed for 2 minutes and the exposed silicon nitride was
removed using a reactive ion etcher (Oxford 80, Oxford Instruments, Tubney Woods, Abingdon,
Oxfordshire, OX13 5QX, UK) with 50 sccm CHF3 and 2 sccm O2 at 50 mTorr and 200 W. The exposed
tissue chambers (liver and other tissues) were etched to a depth of 20 µm using a deep reactive ion etch
process in a UNAXIS etcher (Unaxis USA, Inc., St.Petersburg, FL). The resist was removed with 1165
resist remover (Shipley Company). Silicon nitride was grown again as described above. Resist (SPR
1045) was spun over the chambers at a thickness of 10 µm and baked on a ramping hotplate at 115°C for
90 seconds. The fluidic channels that connect the organ chambers with the inlet and outlet of the chip
Page 5 of 34 Lab on a Chip

were then exposed with an HTG contact aligner (AB-M) and developed for 5 minutes. The nitride was
etched using a reactive ion etch process with 50 sccm CHF3 and 2 sccm O2. The exposed channels were
then etched with deep reactive ion etching to a depth of 100 µm. The resist was removed with 1165
resist remover and the chips were separated using a silicon dicing saw.
The silicon chips were cleaned with a solution of sulfuric acid and hydrogen peroxide (3:1) at
70°C before every use. This cleaning step is particularly important when the chip is re-used several
times. The solution removes extracellular matrix components that are deposited by cells grown on the
chip in previous experiments.
The microfluidic GI tract module of the body-on-a-chip device was machined in plexiglass with
round apical and basolateral chambers so that transwell membrane inserts fit into it (Figure 1C). The
resulting cell culture chambers (apical and basolateral, separated by the transwell insert membrane) were
0.5 mm deep and 12 mm in diameter.
Body-on-a-chip systems operation: Two fluidic circuits were constructed (Figure 1B): The first
recirculated medium between a container that contained medium with 50 nm carboxylated polystyrene
nanoparticles and the apical chamber of the GI tract module. The second fluidic circuit represents the
systemic circulation of the human body. This fluidic loop connects the basolateral side of the GI tract
module with the silicon chip and the ‘other organ’ container. The silicon chip contained the liver
chamber as well as three other organ chambers (adipose, kidney, and bone marrow) to be used in future
studies. The ‘other organ’ container represents spaces for all other organs of the body (skin, muscle,
brain, spleen, lung, heart, all glands, etc.). The containers and chambers that represent other organs than
the ones of interest in this study (gastrointestinal tract and liver) were filled with medium. The medium
in both circulation loops was re-circulated with a peristaltic pump.
Body-on-a-chip systems design: We have previously described the design, operation and
Page 6 of 34Lab on a Chip

characterization of the ‘GI tract – liver – other organ’ system.21 Briefly, the human body (based on a 70
kg body) is scaled down by a factor of 400,000 (considering that we are using cell monolayers of a
height between 3-5 µm), requiring an overall flow rate of 3.59 µL/min through the entire systemic
fluidic circuit, and a flow rate of 1.47 µL/min through the liver chamber. The scaling was based on
physiologic values obtained from data collections by Davis et al. and Price et al.22,23 A flow rate of 1.47
µL/min in the liver chamber is needed to achieve a physiologic level of fluid residence time. The fluid
residence time is calculated by dividing the scaled organ volume by the scaled blood flow rate. The fluid
residence time in the liver compartment of a system that is scaled by a factor of 400,000 should be 1.2
min to correspond to fluid residence time in the liver in vivo.
To achieve this flow rate on a chip on which several organs are represented, the fluidic stream of
the systemic circulation is passively divided between the organ compartments on chip so that each
fluidic stream experiences the same pressure drop. Keeping the pressure drop across each fluidic stream
constant allows us to reach organ-specific fluid flow by adjusting the hydraulic resistance across each
fluidic branch. This goal can be achieved by choosing appropriate channel widths and lengths for the on
chip fluidic channels that lead to and from each scaled organ chamber, whose volume was already
determined by the scaling factor. The resulting shear stress in the liver chamber was estimated to be 1.01
dyn/cm2 21. Since the system was designed to support several studies and we used it here without
adipose, kidney and bone marrow cells, the fluidic flow was slightly biased on the chip. We measured
the residence time in the liver chamber for this configuration and found that the fluid residence time in
the liver chamber with only liver cells and GI tract cells, is 2.1 ± 0.3 min.21
Cell Culture: HepG2/C3A cells were obtained from the American Type Culture Collection
(Manassas, VA, USA) and cultured at 37°C in a 5% carbon dioxide atmosphere using Minimal Essential
Medium (MEM, Invitrogen, Carlsbad, CA, USA) with 1.0 mM sodium pyruvate and 10% FBS
Page 7 of 34 Lab on a Chip

(Invitrogen). Intestinal cell cultures consisted of layers of human colon carcinoma Caco-2 cells and
HT29-MTX mucous producing cells in a ratio of 9:1. Caco-2 cells were obtained from Prof. Raymond
Glahn’s laboratory at Cornell University at passage 17 and used at passages 25 to 30. HT29-MTX cells
were kindly provided by Dr. Thécla Lesuffleur of INSERM U560 in Lille, France at passage 11 and
were used at passages 20 to 25. Both cell lines were maintained at 37°C in a 5% carbon dioxide
atmosphere using Dulbecco's Modified Eagle Medium (DMEM, Invitrogen, Carlsbad, CA, USA)
containing 4.5 g/L glucose, 25 mM HEPES buffer and 10% heat inactivated fetal bovine serum
(Invitrogen).
Single tissue experiments: For nanoparticle exposure experiments with body-on-a-chip devices
that contained only HepG2/C3A liver cells, HepG2/C3A cells were seeded onto silicon chips at 62,500
cells (suspended in a volume of 80 µL) per liver chamber (0.68 cm2, 20 µm high). The remaining organ
chambers were left empty in the experiments conducted for this study. Prior to use the chambers were
cleaned with Piranha solution (H2O2 and H2SO4 mixed at a ratio of 3:1). After cleaning, the chambers
were pre-coated with poly-d-lysine for 5 minutes at a concentration of 4 µg/cm2 and with fibronectin for
one hour at a concentration of 8 µg/cm2. The cells were allowed to attach in the liver chamber of the
silicon chip for 30 minutes and were then covered with medium. On the next day the chips were placed
into Plexiglas housings and tubing for medium recirculation was connected to a peristaltic pump.
Multi-organ experiments: For experiments with body-on-a-chip devices that contained both
HepG2/C3A liver cells and Caco-2/HT29-MTX cell cultures, silicon chips were prepared with
HepG2/C3A cells as described above and transwells with Caco-2/HT29-MTX cells were prepared 16
days prior to silicon chip preparation as follows. Transwell culture plates (6-well) were treated with
collagen at 8 µg/cm2 membrane surface, diluted in acetic acid (0.02N) for one hour. After washing with
phosphate-buffered saline (PBS) Caco-2 and HT29-MTX cells were seeded into each well at 101,000
Page 8 of 34Lab on a Chip

and 11,000 cells per well respectively. The cells were cultured for 16 days so that the transepithelial
resistance was 200 Ω cm2 or higher at the time of body-on-a-chip device assembly, indicating that tight
junctions between cells were fully developed. On day 17, the GI tract module and the silicon chip were
connected to a microfluidic pump via tubing and medium was flown through the apical and basolateral
fluidic loops at a flow rate of 3.59 µL per minute (Figure 1).
Nanoparticle Dose Calculations: 50 nm fluorescent, carboxylated polystyrene nanoparticles
(Cat# 17149, YG-Fluoresbrite) were obtained from Polysciences Inc. (Warrington, PA). The doses of 50
nm nanoparticles used in this study were in the mid and high range (16 - 480 x 1011 nanoparticles/mL
cell culture medium) of those used previously. These concentrations were formulated to mimic realistic
human exposure (Mahler, et al. 2012 ).
Nanoparticle Exposure Experiments: 50 nm carboxylated polystyrene nanoparticles were diluted
in medium to yield various concentrations of 15 – 480 x 1011 nanoparticles/mL. Vehicle-treated control
medium and medium containing nanoparticles were supplied to the assembled body-on-a-chip systems
via the medium container in the apical fluidic circuit. After 24 hours, medium was removed from the
‘other tissue’ chamber of the basolateral/systemic fluidic circuit for enzyme measurements and
nanoparticle characterization.
On-chip cell viability: After 24 hours of exposure of cells within the body-on-a-chip device to
nanoparticles or vehicle control, the medium within the tissue chambers was replaced with PBS
containing fluorescent viability stains (Molecular Probes, Carlsbad, CA) in both fluidic loops. The
solution was circulated through the apical and basolateral/systemic circulation for 30 minutes. The
solution was then replaced with PBS that washed out the dye. Pictures of the cell culture chambers were
taken with a fluorescence microscope and attached camera and the area covered with viable cells was
estimated with image processing software (ImageJ).
Page 9 of 34 Lab on a Chip

Enzyme Quantitation in culture medium: To determine which cellular enzymes commonly used
as biomarkers of liver injury in vivo would be useful for detecting tissue injury in our model, we
measured concentrations of alanine aminotransferase (ALT), aspartate aminotransferase (AST),
glutamate dehydrogenase (GDH), and gamma-glutamyl transpeptidase (GGT) in the medium of cells
cultured in 12-well plates. Testing was performed at the clinical pathology laboratory in the Animal
Health Diagnostic Center at Cornell University, using an automated chemistry analyzer (Hitachi
Modular P, Roche Diagnostics) with manufacturer’s reagents. To compare the maximum amount of
enzymes released from each cell type (Caco-2, HT29-MTX, and HepG2/C3A), 100,000 cells were lysed
with ethanol and enzyme concentrations were measured in the cell lysate that was diluted ten-fold,
yielding enzyme concentrations per 10,000 cells.
Quantification of nanoparticle passage across the intestinal co-culture: To estimate the number
of nanoparticles that traversed across Caco-2/HT29-MTX co-cultures from the apical to the basolateral
chamber of the GI tract module, we used fluorescent nanoparticles (Cat# 17149, YG-Fluoresbrite,
Polysciences Inc., Warrington, PA, excitation: 441 nm, emission: 486 nm). After 24 hours of
nanoparticle exposure, we collected 170 µL of medium from the “other organ” compartment and used a
plate reader (Spectra Max Gemini EM, Molecular Devices, Sunnyvale, CA) to conduct fluorescence
measurements.
Quantification of apparent permeability coefficients for 10kDa dextran: The amount of
transported 10kDa Lucifer Yellow-conjugated dextran (Fisher Scientific Inc.) was measured with a
fluoresecent plate reader using an excitation wavelength of 425 nm and an emission wavelength of 528
nm. The apparent permeability coefficient was calculated using the equation
Papp =ΔQΔt* 1A*C0
where ΔQ/Δt is the amount of lucifer yellow dextran transported from the apical to the
Page 10 of 34Lab on a Chip
basolateral compartment per time interval(t). C0 is the initial concentratin in the apical compartment and
A is the area of the membrane on which Caco-2/HT29-MTX cells were cultured.
Measurement of pH: To determine if the cultured cells alter the pH of the medium within the
body-on-a-chip device, we collected 170 µL of medium from the apical and basolateral sides of the GI
tract module and measured the pH with a pH meter equipped with a micro pH electrode (DJ glass
Ag/AgCl, Thermo Scientific, Beverly, MA).
Particle Analysis with Zetasizer: To determine whether the surface charge of the nanoparticles
changes as a result of travelling through the GI tract epithelium, nanoparticles were collected from the
apical and basolateral sides of the GI tract module and diluted with 830 µL medium. They were then
analyzed with a Zetasizer (Malvern Instruments LTD, Worcestershire, UK) to determine their zeta
potential and diameters. To yield nanoparticle size distributions, we measured 100 nanoparticles per
sample and measured every sample three times to minimize instrument errors.
Immunofluorescent Staining of Adherens Junctions: To visually determine whether nanoparticles
damage the tight junctions of the intestinal tissue cultures, we immunostained the epithelial co-culture
for the tight junction protein occludin and imaged the cell layers with a confocal fluorescence
microscope. After 24 hours of exposure to nanoparticles, the cells in the transwells were washed with
PBS three times and fixed in situ with 2% paraformaldehyde, rinsed with PBS containing 1% bovine
serum albumin, permeabilized with 0.1% Triton X-100, and then immunostained with an antibody
against occludin (rabbit anti-human occludin, 2 µg/mL, Invitrogen Inc., Eugene, OR) for 40 minutes at
room temperature (at 0.04 µg/mL). After washing, fluorescent secondary antibodies (Alexa-555-
conjugated goat anti-rabbit antibody, 250µg/mL, Invitrogen Inc., Eugene, OR) were added at a
concentration of 1.25 µg/mL for 40 minutes in the dark at room temperature. Cultures incubated with
the rabbit IgG (0.04 µg/mL) and secondary goat anti-rabbit IgG (Invitrogen Inc., Eugene, OR) served as
Page 11 of 34 Lab on a Chip

negative immunofluorescent control (at a concentration of 1.25 µg/mL). Images were captured using a
Leica SP2 confocal microscope (Leica Microsystems, Bannockburn, IL).
Transmission electron microscopy (TEM): Samples were coated with carbon on a TEM grid and
imaged with a FEI T12 spirit TEM system at the Cornell Center for Materials Research.
Statistical Analysis: Data represent mean ± the standard deviation of 3 to 6 experiments.
Multiple means were compared with a one-way ANOVA, followed by a Bonferroni adjustment for the
number of pairwise comparisons, whereas comparisons of two means was performed with a paired T test
(JMP software). For AST measurements the one-way ANOVA was modeled on a log-transformed
response. A p value of < 0.05 was considered significant.
RESULTS
Quantifying Cellular Damage to Caco-2, HT29-MTX and HepG2/C3A Cells By Measuring
Cytosolic Enzyme (AST) Release
Quantifying cellular damage in our in vitro system with a method that allows us to later
compare our data with in vivo data is important, considering that our results will need to be confirmed
with animal models. Since liver injury in animals and humans is estimated by measuring concentrations
of intracellular enzymes in the blood, we first quantified the amounts of intracellular enzymes that are
released from cells in vitro due to cellular injury. For this purpose we prepared lysates of Caco-2, HT29-
MTX, and HepG2/C3A cells, confirmed complete lysis with fluorescent viability stains, and then
measured cytosolic enzyme concentrations in the medium. Our measurements show increased, but
varying concentrations of AST in lysates of all three cell types (Table 1). HepG2/C3A cells released
comparatively more AST than the other two cell types. Caco-2 and HT29-MTX cells contained only
~30% and ~23% of AST present in HepG2/C3A cells. HepG2/C3A cells, but not the two epithelial cell
Page 12 of 34Lab on a Chip
types, also released low amounts of ALT and GGT (Table 1). GDH was not released from any of the
cell types used here. Since ALT, GGT, and GDH were either not detected or detected at very low
amounts after cell lysis, we chose AST as a quantitative indicator of cellular damage in all subsequent
experiments. Besides providing a quantitative measure for cellular injury, measuring concentrations of
this enzyme in plasma is used routinely to assess liver damage in vivo.15 Similarly the in vitro data
generated with our devices can be compared to data obtained with in vivo studies.
Since the goal of our study is to measure cellular injury in response to 50 nm carboxylated
polystyrene nanoparticles, we tested whether these nanoparticles interfere with the assay we used to
measure AST concentrations. We added the maximum amount of nanoparticles used in this study (480 x
1011 nanoparticles/mL) to fresh cell culture medium that had not been exposed to cells and measured
AST concentrations. In these samples, AST concentrations were undetectable, indicating that any AST
measured in nanoparticle-exposed cells is not due to the interference of nanoparticles with the assay and
can be attributed to cellular release of this enzyme.
Exposure to 50 nm Carboxylated Polystyrene Nanoparticles Causes Cellular Injury in
HepG2/C3A Cells
A) Experiments with ‘GI tract – Liver – Other tissues’ Devices
To simulate the oral uptake of 50 nm carboxylated polystyrene nanoparticles and their effects on
liver tissue, we used a microfluidic ‘GI tract – liver – other tissue’ body-on-a-chip device in which we
cultured Caco-2/HT29-MTX cells and HepG2/C3A cells and recirculated the medium through two
closed fluidic circuits, one that served the apical side of the Caco-2/HT29-MTX cultures and a second
that served the basolateral side of the Caco-2/HT29-MTX culture as well as the HepG2/C3A culture and
Page 13 of 34 Lab on a Chip

the ‘other tissue’ compartment that were located downstream of it. We supplied the nanoparticles to the
apical side of the Caco-2/HT29-MTX culture and measured AST concentrations in the medium
collected from the basolateral fluidic circuit after 24 hours.
When nanoparticles were added at a concentration of 240 x 1011 or 480 x 1011 nanoparticles per
mL medium, AST concentrations in the basolateral fluidic circuit rose significantly during 24 hours of
medium recirculation compared to controls (Figure 2a). However, fluorescent live/dead staining did not
indicate a significant decrease in cell viability of HepG2/C3A cultures (Figure 2b), indicating that
cellular injury took place at a level that was not detected with dye-based optical viability measurements.
Optical viability assessment of Caco-2/HT29-MTX cell layers did not reveal any differences between
treatments, however, these cell layers are dense and can be multilayered, making it difficult to detect
small differences in cell viability.
B) Experiments with ‘Liver – Other tissues’ and ‘GI tract – Other tissues’ Configurations
Since it is likely that the GI tract tissue contributed to the rise in AST concentration measured in
the device setup in which both tissue cultures (Caco-2/HT29-MTX and HepG2/C3A) were present, we
subjected each of the tissues alone to 50 nm carboxylated polystyrene nanoparticles. For this purpose we
operated the body-on-a-chip devices with one tissue at a time. This is accomplished by leaving one of
the tissue chambers empty, meaning that medium still flows through the chamber, but no cells are
present. When the 50 nm carboxylated polystyrene nanoparticles were supplied to a system that
contained HepG2/C3A cells only, they caused an increase in AST levels at a nanoparticle concentration
of 480 x 1011 nanoparticles/mL, but not at lower concentrations (Figure 2a). The increase in AST levels
in the medium during 24 hours of device operation with only HepG2/C3A cells was not significantly
higher than that seen with devices in which both, Caco-2/HT29-MTX co-cultures and HepG2/C3A
Page 14 of 34Lab on a Chip
cultures were present. No significant change in HepG2/C3A cell viability was observed in response to
any of the tested particle concentrations (Figure 2b), indicating that the amount of cellular injury was
significant, but not detectable via dye-based viability measurements.
When Caco-2/HT29-MTX co-cultures were cultured alone within the body-on-a-chip devices, no
significant changes in AST concentrations were observed on either side (apical and basolateral) of the
cell culture for any of the tested nanoparticle concentrations (Figure 2a). Similar to our earlier
observations, no significant changes in Caco-2 or HT29-MTX cell viability was observed, keeping in
mind that the Caco-2/HT29-MTX cell layers were dense.
The GI tract Tissue Limits Nanoparticle Exposure to 50 nm Carboxylated Nanoparticles
To estimate the number of nanoparticles that transferred from the apical to the basolateral side of
the Caco-2/HT29-MTX cell cultures, we used the body-on-a-chip device with Caco-2/HT29-MTX cell
only. Fluorescently labeled 50 nm carboxylated polystyrene nanoparticles were introduced into the
system at the apical side of the GI tract chamber and the fluorescence was measured in the medium
collected from the basolateral side. When supplied at a concentration of 480 x 1011 nanoparticles/mL,
9.5% ± 2.9% of the nanoparticles reached the basolateral side after 24 hours of device operation.
Nanoparticles that remained on the apical side of the Caco-2/HT29-MTX cell layer were accumulated in
high concentration spots, in addition to being evenly distributed across the cell layer at a low
concentration. Confocal microscopy images show that the nanoparticles in high concentration spots
resided mostly on the apical side of the Caco-2/HT29-MTX cell layer (Figures 3 a, b, and c). The
nanoparticles resided mostly on the apical side of the Caco-2/HT29-MTX cell layer (Figures 3 a, b, and
c). The tight junction complexes were stained immunofluorescently and, judging by confocal microscoy
images, they appeared intact, indicating no gross damage to the junctions. The functionality of the tight
Page 15 of 34 Lab on a Chip

junctions was also confirmed with transport measurements of fluorescently labeled 10 kDa dextran. We
found that nanoparticle exposure did not change the apparent permeability coefficient exhibited by
Caco-2/HT29-MTX cell layers for this molecule (Table 2).
Nanoparticles and Nanoparticle Aggregates that Cross the GI tract Barrier are Smaller in Size
Size measurements of 50 nm carboxylated polystyrene nanoparticles that were collected from the
basolateral side of the GI tract chamber showed that nanoparticles that crossed the Caco-2/HT29-MTX
co-cultures were on average smaller than those that remained on the apical side. The size distributions of
nanoparticles that were collected from the basolateral side of the microfluidic GI tract module showed a
peak at 55 ± 7 nm, indicating largely single nanoparticles. Size distributions of nanoparticles collected
from the apical side exhibited a peak at 97 ± 7 nm (Figure 4), consistent with aggregates of a small
number of nanoparticles. We confirmed the existence of such aggregates in the nanoparticle population
using transmission electron microscopy of nanoparticles (Figure 6). Particle size distributions of
nanoparticles collected from the basolateral side also contained a particle population of smaller size.
These nanoparticles were not present in any of the other samples, indicating that they are either cellular
debris, or small vesicles released due to Caco-2 cell transport activity. The size distributions of
nanoparticles that were stored in medium at 37°C exhibited a peak at 97 ± 1 nm, and those of
nanoparticles stored in water had a peak at 39 ± 5 nm. Nanoparticles that were collected from
microfluidic devices that were operated with HepG2/C3A liver cells, but without intestinal epithelial
cells were 99 ± 5 nm according to the peak of the distribution.
Changes in Zeta Potential
Page 16 of 34Lab on a Chip

The zeta potential of 50 nm carboxylated polystyrene nanoparticles that were collected from the
basolateral side of the microfluidic GI tract module after 24 hours of nanoparticle exposure was
significantly smaller in magnitude (-11.7 ± 0.8) than that of nanoparticles that were stored in cell culture
medium for 24 hours (-17.5 ± 3.3), and that of nanoparticles that were stored in water (-36 ± 2.2) (Figure
5). The pH of the medium collected from the basolateral chambers was more basic than that of fresh cell
culture medium, but not significantly different from that of medium collected from the apical chambers.
DISCUSSION
50 nm Carboxylated Polystyrene Nanoparticles Cause Liver Injury In Vitro
Simulations with the ‘GI tract – liver – other tissue’ body-on-a-chip device suggest that ingested
50 nm carboxylated polystyrene nanoparticles cause cellular injury of in vitro liver tissue. We estimated
liver tissue injury by measuring the release of the cytosolic enzyme AST into the cell culture medium
after 24 hours of nanoparticle exposure. Correlating AST concentrations with cellular injury is based on
measurements with lysed cells, where lysates showed elevated AST concentrations as a result of cellular
injury. Using the ‘GI tract – liver – other tissues’ device we found elevated AST concentrations (up to 8-
fold compared to controls) in the cell culture medium as a result of adding 50 nm carboxylated
polystyrene nanoparticles to the apical side of the GI tract tissue at concentrations that would constitute
a relatively high level of daily nanoparticle consumption. Considering that the GI tract tissue contribute
only small amounts of AST to the total AST concentration measured, our results indicate that orally
taken nanoparticles have the potential for causing injury to liver tissue after ingestion.
Additionally, as hypothesized, the GI tract tissue presents a significant barrier to the majority of
50 nm carboxylated polystyrene nanoparticles. Fluorescence confocal microscopy images (taken at
Page 17 of 34 Lab on a Chip

different planes) of Caco-2/HT29-MTX cell layers that were exposed to these nanoparticles at their
apical side, show that after 24 hours many nanoparticles are still situated on the apical side of the cell
layer. The presence of the nanoparticles on the apical side of the imaged cell layer was likely due to
interactions between the cell layer and nanoparticles. These interactions captured the nanoparticles from
the fluidic stream and accumulated them in regions of high nanoparticle concentrations. We assume that
the nanoparticles arrest on the apical side in high concentration spots because they interact either with
patches of mucous produced by the HT29-MTX cells or with the membranes of Caco-2 and HT29-MTX
cells. However, despite this interaction, the GI tract cell layer prevented the majority of the nanoparticles
from entering the systemic circulation of the ‘GI tract – liver - other tissues’ devices. This result is
supported by fluorescence measurements and by confocal microscopy images that show that the
majority of nanoparticles resides on the apical side of the Caco-2/HT29-MTX cell layer.
We have also found that the presence of the GI tract tissue upstream of the liver could be the
source of a number of injury compounding factors, making the ‘GI tract- liver – other organs’ system
more responsive than the ‘liver – other organs’ system. The fact that a significant increase in AST
concentrations as a result of nanoparticle exposure was observed at a lower nanoparticle concentration
when the GI tract tissue was present in the device prompted us to investigate the possible nature of
factors that could have caused this unexpected result. Operating the devices with only GI tract tissue
showed that cellular injury did not occur to Caco-2/HT29-MTX cell cultures at measurable levels as a
result of nanoparticle exposure. To offer an explanation for the observed toxicity at lower nanoparticle
concentrations in the presence of the GI tract tissue: it is possible that soluble mediators released by low-
level liver injury compounds the initial injury, causing additional injury to Caco-2 and HT29-MTX cells.
The possibility of such an interaction between the two tissues is supported by previous studies in which
the tissues were found to influence each other.24-26 However, any injury to Caco-2 or HT29-MTX cells
Page 18 of 34Lab on a Chip

was not significant enough to result in the loss of barrier function since we did not observe a significant
increase in the transport of 10 kDa dextran as a result of nanoparticle exposure. We believe that a
destructive interaction between the two tissues is possible, but perhaps not the only mechanism that
caused the increased sensitivity to nanoparticles.
A second source of injury compounding factors could be the characteristics of the nanoparticles
themselves. More specifically, we observed that nanoparticle populations that traversed the Caco-
2/HT29-MTX cell barrier have significantly different properties than nanoparticle populations that did
not. We would like to emphasize that we are discussing the overall populations of nanoparticles.
Nanoparticle size distributions measured with nanoparticles collected from the basolateral side of the GI
tract chamber, showed a peak at 55 ± 7nm, a size that is almost half of that obtained with nanoparticles
that were collected from the apical side of the GI tract chamber. Considering that the peak in
nanoparticle size distributions was at 39 ± 5 nm when the nanoparticles were stored in water and 97 ± 1
nm when they were stored in cell culture medium, it is likely that the nanoparticles associate with
proteins and lipids that are constituents of the cell culture medium or the cells themselves. This
possibility is supported by results of our previous studies in which 50 nm carboxylated nanoparticles
traveled across the GI tract epithelium at low temperatures, i.e. nanoparticle transport occurred via
paracellular, non-energy-dependent processes, supporting the assumption that 50 nm carboxylated
nanoparticles interact with the cell membranes of epithelial cells. We and other have also observed
previously observed significant protein association with 50 nm carboxylated polystyrene
nanoparticles.7,27 It is also possible that nanoparticles aggregate into small clusters of two to four. We
assume that the association of two to four nanoparticles would result in an overall nanoparticle size
measurement of around 100 nm. We have seen ~100 nm sized aggregates of 50 nm carboxylated
polystyrene nanoparticles when imaging them with transmission electron microscopy (Figure 6). Given
Page 19 of 34 Lab on a Chip

these assumptions, the data suggest that the nanoparticle population that arrived at the basolateral side of
the Caco-2/HT29-MTX cell layer consisted of a larger fraction of single nanoparticles and smaller
nanoparticle aggregates (nominal diameter of 55 nm with low-level protein associations) than the
nanoparticle population that did not cross the Caco-2/HT29-MTX cell layer. The data suggest that the
Caco-2/HT29-MTX cell layer presents a higher level barrier to the transport of 50 nm carboxylated
polystyrene nanoparticles that associate with a significant amount of proteins or that aggregate into
larger clusters of a nominal diameter of 97 nm. It is not clear, however, how this fact impacts the
observed increased sensitivity of the GI tract – liver – other tissues device to nanoparticle exposure,
since the original nanoparticle population may contain a higher fraction of aggregates, but also contains
single nanoparticles in a concentration that is likely not lower than the single nanoparticle concentration
in the filtrate. Perhaps the constitution of the macromolecular corona around the nanoparticles plays a
role in increasing or decreasing the toxic potential of single nanoparticles.
Nanoparticles collected from the basolateral side of the Caco-2/HT29-MTX cell layer also
showed a decreased magnitude of their zeta potential compared to those that were stored in cell culture
medium. This decrease in magnitude is probably due to association with and masking of the charge by
ions, proteins and lipids that occurs during the 24 hours of exposure to cell cultures. This assumption is
supported by the fact that the magnitude of zeta potential is significantly higher when the nanoparticles
are stored in water. Nanoparticles that crossed the GI tract barrier via the paracellular route likely
experience the greatest exposure to lipids. The fact that the trend of decrease in zeta potential magnitude
as a result of exposure to cell cultures becomes significant when the nanoparticles have crossed the GI
tract cell layer indicates that nanoparticles that were in close contact with cells and cellular membranes
associate with more ions, proteins, or lipids than those that were not. As mentioned above, perhaps the
macromolecule corona of these nanoparticles differs in its constitution from that of nanoparticles that
Page 20 of 34Lab on a Chip

were not in close contact with cell cultures. However, a detailed analysis of the macromolecules that are
associated with the nanoparticles would be necessary to make more conclusive statements.
These changed nanoparticle properties, namely the level of aggregation with other nanoparticles
or macromolecules, and the magnitude of zeta potential of nanoparticles that traversed the GI tract
barrier could reflect an increased toxic potential of the nanoparticles that reached the liver tissue in the
device configuration in which both the GI tract and the liver tissues were present.
Since the viability data measured here do not suggest a significant decrease in cell viability as a
result of exposure to 50 nm carboxylate polystyrene nanoparticles at the tested concentrations, it is
possible that the injury that occurred as a result of nanoparticle exposure is either too small to be
detected with viability stains, or that the injury is of transient and sublethal nature. AST normally resides
in the cytoplasm and the mitochondria of cells and is released into the culture medium when cells
undergo cell lysis or membrane damage.28 The enzyme is also released when the membrane damage is of
transient nature. We have previously shown that 50 nm carboxylated polystyrene nanoparticles at the
same dose affect iron uptake through Caco-2/HT29-MTX cell layers and cause a decrease in
transepithelial resistance (TER).7 An interaction between nanoparticles and phospholipid bilayers has
also been suggested by Wang et.al,6 who showed that negatively charged nanoparticles induce local
gelation in otherwise fluid membranes. These findings support our data, which suggest transient or low-
level membrane damage as a result of nanoparticle exposure at the concentrations used here.
In addition to the advantage of being a more sensitive quantitative measure for cellular damage
than cell viability dyes, measurement of enzyme concentrations in body-on-a-chip in vitro models can
be more directly correlated to tissue injury in future in vivo studies of nanotoxicity than cell viability
assays, which are restricted to in vitro use. AST is a recognized plasma biomarker of liver injury in
animals and humans and is thus suitable for such measurements.15,28
Page 21 of 34 Lab on a Chip

The percentage of transported 50 nm carboxylated polystyrene nanoparticles measured here with
the body-on-a-chip device is slightly higher than that reported earlier from experiments in static culture
(4.55%).7 This difference may be due to the fact that the cells within microfluidic body-on-a-chip
devices are cultured under shear stress, which has been shown to affect cell morphology and function in
other cell types.29-31
Systems Design and Operation
To reflect the multi-cell type composition of GI tract tissue better, we utilized a co-culture of
Caco-2 cells and mucous producing HT29-MTX cells. In a previous study we conducted with seeding
ratios of 10:1, 5:5, 7.5:2.5 and 9:1 we found that, when evaluated after 16 days of cell culture, seeding
ratios of 7.5:2.5 and 9:1 resulted in mucous-covered cell layers that simulated the uptake of iron with
physiologic relevance.32 Here we selected the seeding ratio of 9:1 to conduct experiments. Since HT/29-
MTX cell overgrowth can lead to a decrease in barrier function, we selected only those cultures for
experiments that exhibited a transepithelial resistance of 200 Ohm x cm2 or higher. This practice insured
that nanoparticle transport did not occur through large gaps in the cell layer caused by HT/29-MTX cell
overgrowth.
Representing the total volume of fluid in the human body using a body-on-a-chip system requires
a reservoir for fluid of organs (we call this the “other tissue” reservoir) that are not explicitly expressed.
This fluid represents the blood and interstitial fluid volume in the body. The use of an “other tissue”
chamber allows a crude mimic of fluid volume, which will dilute the concentration of any excreted
metabolite or nanoparticles to a value representative of that in the circulation. An important assumption
in such a model is that none of the metabolites and nanoparticles are sequestered or modified chemically
in any tissues other than the GI or liver compartments. Clearly, this system is idealized, but we believe it
Page 22 of 34Lab on a Chip

is a useful model.
A more sophisticated model would break the other tissues compartments into various organ
compartments. The chip we have fabricated contains compartments for kidney, adipose tissue, and bone
marrow. For this initial study we have not populated these compartments with tissue constructs. The
details of nanoparticle distributions in this system with these empty compartments plus an “other tissue”
compartment (now reduced in size by the volume of the fluid retained in the kidney, adipose, and bone
marrow compartments) is not significantly different than a system with a chip without these empty
compartments.
In our devices we used monolayer cell cultures, which are easily observed. However, the use of
3D tissues will make our simulations more realistic. In particular, such tissues may allow for more
authentic cellular behavior, as well as a more physiologic liquid to cell ratio than we were able to
achieve with the current device. Such 3D constructs could consist of cells that were entrapped in
hydrogels, cultured in a polymeric matrix, or grown as organoids.
Since nanoparticle uptake and transport in the human body has been of interest to the research
community, there have been several techniques and systems that were used for the study or oral
nanoparticle uptake.33 Some of these systems allow for the study of nanoparticle uptake under conditions
of peristalsis, 34 and in the presence of gastric fluids.35,36
CONCLUSIONS
Simulations with a ‘GI tract – liver – other tissue’ body-on-a-chip device suggest that ingested
50 nm carboxyletd polystyrene nanoparticles cause sublethal cellular injury to in vitro liver tissue. The
injury occurred at concentrations of 240-480 x 1011 nanoparticles/mL, a high concentration estimated in
terms of possible daily consumption. Although, the GI tract tissue presents a significant barrier to
Page 23 of 34 Lab on a Chip

nanoparticles, the presence of the GI tract tissue upstream of the liver could add a number of injury
compounding factors. It is possible that soluble mediators released by low-level cellular injury from
liver cells compound the initial injury by causing damage to Caco-2 and HT29-MTX cells. It is also
possible that the changed properties of nanoparticles that crossed the Caco-2/HT29-MTX cell layer
could reflect an increased toxic potential. The level of aggregation with other nanoparticles and with
macromolecules was significantly reduced in nanoparticles that traversed the GI tract barrier. These
nanoparticles also exhibited a decreased zeta potential compared to those that were stored in cell culture
medium, a finding that is probably due to the combined effects of a more basic pH in cell cultures as
well as associations with macromolecules that has occurred as a result of close contact of the
nanoparticles with Caco-2/HT29-MTX cell cultures. The two-organ systems allowed us to observe
compounding effects of tissue-tissue interactions between the GI tract and the liver that cause an
increased level of injury than would be expected by experimenting with either tissue alone. Our
experiments suggest that multi-organ in vitro devices are useful and important tools for assessing
toxicities of environmental toxicants and engineered nanoparticles.
ACKNOWLEDGEMENTS
Financial support for this work was provided by the National Institutes of Health/National Center
for Advancing Translational Sciences (grant # is UH2 TR000516-01), the National Science Foundation
under grant No. CBET-1106153, the Army Corps of Engineers under Agreement ID W9132T-07-2-
0010. This work was performed in part at the Cornell NanoScale Facility, a member of the National
Nanotechnology Infrastructure Network, which is supported by the National Science Foundation (Grant
ECS-0335765). The HT29-MTX cell line was kindly contributed by Dr. Thecla Lesuffleur of INSERM
U560 in Lille, France. We would also like to acknowledge John Grazul of the CCMR of Cornell
University for imaging nanoparticle samples using transmission electron microscopy.
Page 24 of 34Lab on a Chip

REFERENCE
1. S. Kaida, H. Cabral, M. Kumagai, A. Kishimura, Y. Terada, M. Sekino, I. Aoki, N. Nishiyama, T.
Tani, and K. Kataoka, Cancer research, 2010, 70, 7031–7041. 2. N. W. S. Kam and H. Dai, phys. stat. sol. (b), 2006, 243, 3561–3566. 3. R. G. Ellis-‐Behnke, Y.-‐X. Liang, D. K. C. Tay, P. W. F. Kau, G. E. Schneider, S. Zhang, W. Wu, and
K.-‐F. So, Nanomedicine: Nanotechnology, Biology and Medicine, 2006, 2, 207–215. 4. A. Schroeder, D. A. Heller, M. M. Winslow, J. E. Dahlman, G. W. Pratt, R. Langer, T. Jacks, and
D. G. Anderson, Nature Reviews Cancer, 2011, 12, 39–50. 5. E. Lavik and J. Ustin, Science, 2012, 337, 658–659. 6. B. Wang, L. Zhang, S. C. Bae, and S. Granick, Proceedings of the National Academy of Sciences,
2008, 105, 18171–18175. 7. G. J. Mahler, M. B. Esch, E. Tako, T. L. Southard, S. D. Archer, R. P. Glahn, and M. L. Shuler,
Nature Nanotech, 2012, 7, 264–271. 8. M. A. Dobrovolskaia, D. R. Germolec, and J. L. Weaver, Nature Nanotech, 2009, 4, 411–414. 9. R. F. SERVICE, Science(Washington, D. C.), 2004, 304, 1732–1734. 10. C. Durrer, J. M. Irache, F. Puisieux, D. Duchêne, and G. Ponchel, Pharmaceutical Research,
1994, 11, 674–679. 11. C. Durrer, J. M. Irache, F. Puisieux, D. Duchêne, and G. Ponchel, Pharmaceutical Research,
1994, 11, 680–683. 12. A. Hillery, P. Jani, and A. Florence, Journal of Drug Targeting, 1994, 2, 151–156. 13. G. J. RUSSELL-‐JONES, Advanced Drug Delivery Reviews, 2001, 46, 59–73. 14. M. Shakweh, G. Ponchel, and E. Fattal, Expert Opin. Drug Deliv., 2004, 1, 141–163. 15. N. Enomoto, S. Yamashina, H. Kono, P. Schemmer, C. A. Rivera, A. Enomoto, T. Nishiura, T.
Nishimura, D. A. Brenner, and R. G. Thurman, Hepatology, 1999, 29, 1680–1689. 16. M. Baker, Nature, 2011, 471, 661–665. 17. P. Neuži, S. Giselbrecht, K. Länge, T. J. Huang, and A. Manz, Nature Reviews Drug Discovery,
2012, 11, 620–632. 18. R. Khamsi, Nature, 2005, 435, 12–13. 19. M. B. Esch, T. L. King, and M. L. Shuler, Annual review of biomedical engineering, 2011, 13,
55–72. 20. J. H. Sung, M. B. Esch, and M. L. Shuler, Expert Opinion on Drug Metabolism & Toxicology,
2010, 6, 1063–1081. 21. G. J. Mahler, M. B. Esch, R. P. Glahn, and M. L. Shuler, Biotechnology and bioengineering, 2009,
104, 193–205. 22. P. S. Price, R. B. Conolly, C. F. Chaisson, E. A. Gross, J. S. Young, E. T. Mathis, and D. R. Tedder,
Critical Reviews in Toxicology, 2003, 33, 469–503. 23. B. Davies and T. Morris, Pharmaceutical Research, 1993, 10, 1093–1095. 24. S. Hyung Choi, M. Nishikawa, A. Sakoda, and Y. Sakai, Toxicology in vitro, 2004, 18, 393–402. 25. P. M. van Midwoud, M. T. Merema, E. Verpoorte, and G. M. M. Groothuis, Lab on a Chip, 2010,
10, 2778–2786. 26. S. H. Choi, O. Fukuda, A. Sakoda, and Y. Sakai, Materials Science & Engineering C, 2004, 24,
333–339. 27. M. Lundqvist, J. Stigler, G. Elia, I. Lynch, T. Cedervall, and K. A. Dawson, Proceedings of the
Page 25 of 34 Lab on a Chip

National Academy of Sciences, 2008, 105, 14265–14270. 28. S. K. Ramaiah, Food and chemical toxicology: an international journal published for the British
Industrial Biological Research Association, 2007, 45, 1551–1557. 29. E. Tzima, The EMBO journal, 2001, 20, 4639–4647. 30. M. B. Esch, D. J. Post, M. L. Shuler, and T. Stokol, Tissue Engineering Part A, 2011, 17, 2965–
2971. 31. P. Fernandez, C. Bourget, R. Bareille, R. Daculsi, and L. Bordenave, Tissue Engineering, 2007,
13, 1607–1614. 32. G. J. Mahler, M. L. Shuler, and R. P. Glahn, The Journal of nutritional biochemistry, 2009, 20,
494–502. 33. J. M. Gamboa and K. W. Leong, Advanced Drug Delivery Reviews, 2013, 65, 800–810. 34. H. J. Kim, D. Huh, G. Hamilton, and D. E. Ingber, Lab on a Chip, 2012, 12, 2165–2174. 35. F. Ingels, S. Deferme, E. Destexhe, M. Oth, G. Van den Mooter, and P. Augustijns, International
journal of pharmaceutics, 2002, 232, 183–192. 36. N. Patel, B. Forbes, S. Eskola, and J. Murray, Drug development and Industrial Pharmacy,
2006, 32, 151–161.
Page 26 of 34Lab on a Chip

Figure 1: Schematic of the silicon chip (A) and GI tract module (C) of the body-on-a-chip system, and the corresponding PBPK of the entire system (B). The device was operated with Caco-2/HT29-MTX co-cultures in the GI tract module and HepG2/C3A cells in the liver chamber. Cell culture medium was recirculated through
two fluidic circuits: The fluidic connections between the components of the system are represented as arrows in (B) (upper circuit in green = apical circulation and lower circuit in black = basolateral (systemic) circulation). The two fluidic circuits are separated by Caco-2/HT29-MTX cell layers with developed barrier
function. We added 50 nm carboxylated polystyrene nanoparticles to the apical circulation at varying concentrations and measured the amount of aspartate aminotransferase (AST) in the medium of the
basolateral/systemic circulation.
Page 27 of 34 Lab on a Chip

Figure 2: (A) Mean concentrations of aspartate aminotransferase (AST), measured in medium collected from the systemic circulation side of body-on-a-chip devices that were operated with one tissue only (either GI
tract or liver), or with both tissues. AST concentrations significantly increased as a result of 50 nm carboxylated polystyrene nanoparticle exposure when HepG2/C3A cultures were present in the device, and when Caco-2/HT29-MTX cell cultures were combined with HepG2/C3A cells. Caco-2/HT29-MTX cell cultures alone did not respond to nanoparticle exposure. To determine significant differences in measurements, a one-way ANOVA was modeled on a log-transformed response. Mean concentrations that were significantly different according to the one-way ANOVA with Tukey’s post-test are indicated with an asterisk (P < 0.05, n
= 3-6). Data represent mean ± one standard deviation of 3 to 6 experiments. (B) Percent area of on-chip liver chambers that was covered with viable HepG2/C3A cells after 24 hours of exposure to 50 nm
carboxylated polystyrene nanoparticles at varying concentrations. Measurements were conducted with viability stains, and no significant differences were found according to a one-way ANOVA with Tukey’s post-test (n = 3-6, values were considered significantly different when P < 0.05). Data represent mean ± one
standard deviation of 3 to 6 experiments.
Page 28 of 34Lab on a Chip

Figure 3: Representative confocal images taken of nanoparticle accumulations at different focal planes (A: z = 0, B: z = -1.5 µm, and C: z = -3 µm) of Caco-2/HT29-MTX co-cultures that were exposed to fluorescently labeled 50 nm carboxylated polystyrene nanoparticles (green) at their apical side. Tight junctions between cells were immunofluorescently labeled with anti-occludin antibodies (red). The majority of nanoparticles
that were observed with confocal microscopy associated with the apical side of the cell layer, shown here as the top side. Their slightly higher location and grouping in such accumulations as shown here suggests that
the nanoparticles could reside in or above patches of mucous layers. 934x311mm (72 x 72 DPI)
Page 29 of 34 Lab on a Chip

Figure 4: Size distributions of 50 nm carboxylated polystyrene nanoparticles that were stored at 37°C in water or medium (A), or collacted from the apical or basolateral/systemic circulation loop of body-on-a-chip devices that were operated with Caco-2/HT29-MTX and HepG2/C3A cell cultures (B). The data shown were
obtained using a zetasizer in intensity measurement mode. The peaks of the particle distributions of particles stored in water and collected from the basolateral side of the body-on-a-chip devices were
significantly different from those of nanoparticles that were stored in medium and those that were collected from the apical side of the body-on-a-chip device. Each distribution represents one hundred nanoparticles
measured in each of the 3 to 6 samples. Data represent mean ± one standard deviation of 3 to 6
experiments. Peaks nanoparticle sizes were significantly different from each other according to a one-way ANOVA with Tukey’s post-test P < 0.05.
Page 30 of 34Lab on a Chip
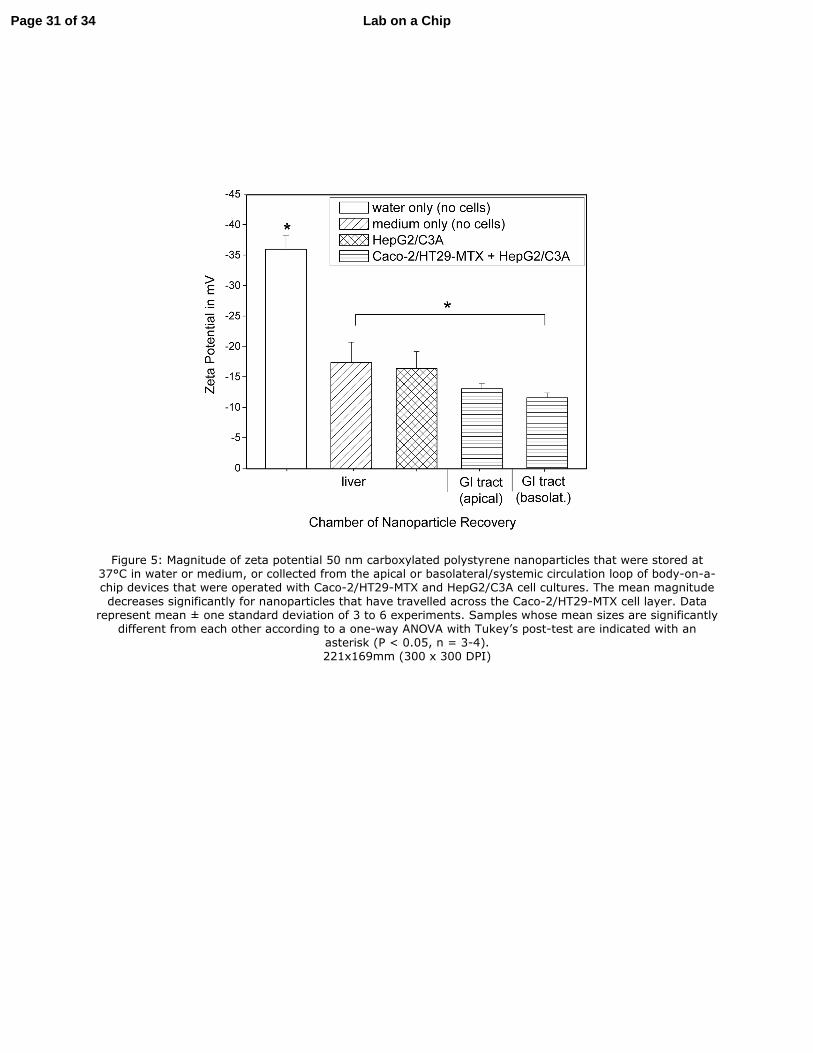
Figure 5: Magnitude of zeta potential 50 nm carboxylated polystyrene nanoparticles that were stored at 37°C in water or medium, or collected from the apical or basolateral/systemic circulation loop of body-on-a-chip devices that were operated with Caco-2/HT29-MTX and HepG2/C3A cell cultures. The mean magnitude
decreases significantly for nanoparticles that have travelled across the Caco-2/HT29-MTX cell layer. Data represent mean ± one standard deviation of 3 to 6 experiments. Samples whose mean sizes are significantly
different from each other according to a one-way ANOVA with Tukey’s post-test are indicated with an asterisk (P < 0.05, n = 3-4). 221x169mm (300 x 300 DPI)
Page 31 of 34 Lab on a Chip

Figure 6: Transmission electron microscopy image of 50 nm carboxylated polystyrene nanoparticles that were collected from the apical side of the Caco-2/HT29 MTX co-culture. The image shows that nanoparticles
in the solution associate with each other to form larger aggregates.
227x170mm (72 x 72 DPI)
Page 32 of 34Lab on a Chip

HepG2/C3A Caco-2 HT29-MTX
aspartate
aminotransferase
(AST)
187.7 ± 11.2 U/L 43.7 ± 6.66 U/L 56.3 ±15.5 U/L
alanine
aminotransferase
(ALT)
1.33 ± 0.58 U/L not detected not detected
gamma-glutamyl
transpeptidase
(GGT)
1.7 ± 1.53 U/L not detected not detected
Table 1: Amounts of cytosolic enzymes released from cells after complete lysis.
Concentrations are given per 10,000 cells.
Page 33 of 34 Lab on a Chip

Concentration of 50 nm
carboxylated polystyrene
nanoparticles x 1011 in
particles/mL
Papp for 10 kDa dextran in
cm/s x 10-9 ± standard
deviation
Caco-2/HT29-MTX cells
only
Papp for 10 kDa dextran in
cm/s x 10-9 ± standard
deviation
Caco-2/HT29-MTX and
HepG2/C3A cultures
vehicle control 8.45 ± 2.74 11.16 ± 1.89
120 8.27 ± 3.88 8.28 ± 1.84
240 9.47 ± 3.64 9.94 ± 1.75
480 10.5 ± 2.68 8.07 ± 0.61
Table 2: Apparent permeability coefficients (Papp) of 10 kDa dextran in Caco-
2/HT29-MTX cultures and Caco-2/HT29-MTX + HepG2/C3A cultures that were
exposed to 50 nm carboxylated polystyrene nanoparticles at varying
concentrations. The data suggest no significant differences in tight junction
functionality as a result of nanoparticle exposure.
Page 34 of 34Lab on a Chip