Body composition of parents and their infants...
69
Linköping University Medical Dissertation No. 1456 B o d y c o m p o s i t i o n o f p a r e n t s a n d t h e i r i n f a n t s m e t h o d o l o g i c a l , a n t h r o p o m e t r i c , m e t a b o l i c a n d g e n e t i c s t u d i e s P o n t u s H e n r i k s s o n Department of Clinical and Experimental Medicine Faculty of Health Sciences Linköping University, Sweden Linköping, 2015
Transcript of Body composition of parents and their infants...

Linköping University Medical Dissertation No. 1456
Body composition of parents and their infants
methodological, anthropometric, metabolic and genetic studies
Pontus Henriksson
Department of Clinical and Experimental Medicine Faculty of Health Sciences
Linköping University, Sweden Linköping, 2015
© Pontus Henriksson, 2015.
Cover drawing by Per Lagman.
Published articles (Papers I, II and IV) have been reprinted with permission from the
respective copyright holder.
Permission to reproduce pictures of Bod Pod and Pea Pod has been obtained from COSMED.
Printed by Liu-tryck, Linköping, Sweden, 2015.
ISBN 978-91-7519-094-5
ISSN 0345-0082
2

To Hanna
and our wonderful children
Elias and Siri
3

Drawing by Elias, 4 years old
4

CONTENTS
1. ABSTRACT ..................................................................................................................................... 7
2. LIST OF PUBLICATIONS ................................................................................................................ 8
3. RELATED PUBLICATIONS ............................................................................................................. 9
4. ABBREVIATIONS ......................................................................................................................... 10
5. INTRODUCTION ......................................................................................................................... 11
5.1 Background .......................................................................................................................... 11
5.2 Parental influences on infant body composition ............................................................... 12
5.3 Genetic influences on infant body composition ................................................................ 13
5.4 Advances in human body composition assessment .......................................................... 14
5.5 Principles of densitometry .................................................................................................. 15
5.6 Air displacement plethysmography .................................................................................... 16
5.6.1 Bod Pod and Pea Pod .................................................................................................... 16
5.6.2 Methodological principles ............................................................................................ 16
6. SPECIFIC AIMS ............................................................................................................................ 19
7. MATERIALS AND METHODS ...................................................................................................... 20
7.1 Participants and study outline (Papers I-IV) ....................................................................... 20
7.2 Measurement of parents (Papers I-III) ............................................................................... 20
7.3 Measurement of infants (Papers II-IV) ............................................................................... 22
7.4 Ethics .................................................................................................................................... 22
7.5 Methods ............................................................................................................................... 22
7.5.1 Thoracic gas volume and body composition of pregnant women (Paper I) ............... 22
7.5.2 Body composition assessment of parents (Papers II and III) ....................................... 23
7.5.3 Body composition assessment of infants (Papers II-IV)............................................... 23
7.5.4 Analysis of glucose homeostasis variables in pregnant women (Paper III) ................ 23
7.5.5 Genotyping of the FTO locus rs9939609 (Paper IV) .................................................... 23
7.6 Statistics ............................................................................................................................... 24
7.7 Considerations concerning data analysis ........................................................................... 24
5

8. RESULTS ..................................................................................................................................... 26
8.1 Predicted versus measured thoracic gas volume (Paper I) ............................................... 26
8.2 Parental variables versus infant size and body composition (Papers II and III)................ 31
8.2.1 Characteristics of parents and infants (Papers II and III) ............................................ 31
8.2.2 Parental FFM in relation to infant body size and composition (Paper II) ................... 33
8.2.3 Parental FM in relation to infant body size and composition (Paper II) ..................... 33
8.2.4 Glucose homeostasis variables in pregnancy in relation to body composition of
mothers and infants (Paper III) .............................................................................................. 35
8.2.5 Insulin/HOMA-IR of pregnant women in relation to fat mass of daughters and sons
(Paper III) ................................................................................................................................ 37
8.3 FTO genotype in relation to infant size and body composition (Paper IV) ....................... 42
9. DISCUSSION ............................................................................................................................... 45
9.1 Comments on the study population ................................................................................... 45
9.2 Strengths and limitations .................................................................................................... 45
9.3 Prediction of thoracic gas volume in gestational week 32 (Paper I) ................................. 46
9.4 Parental body composition versus infant size and body composition (Paper II) ............. 47
9.5 Glucose homeostasis variables in gestational week 32 versus maternal and infant body
composition (Paper III) .............................................................................................................. 48
9.6 FTO genotype versus infant size and body composition (Paper IV) ................................. 49
9.7 General discussion ............................................................................................................... 49
10. CONCLUSIONS ......................................................................................................................... 51
11. FUTURE PERSPECTIVES ........................................................................................................... 52
12. ACKNOWLEDGEMENTS ........................................................................................................... 54
13. SAMMANFATTNING PÅ SVENSKA ........................................................................................... 57
14. REFERENCES ............................................................................................................................ 59
15. PAPERS I-IV ..................................................................................................................................
6
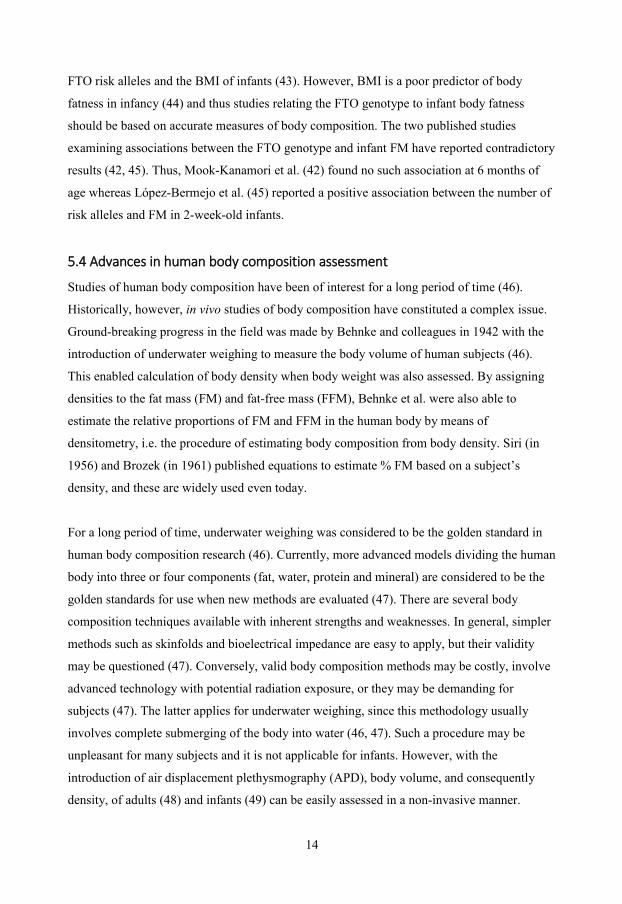
1. ABSTRACT
Body composition in infancy may be of importance for later health. In particular, infant body composition may be relevant regarding obesity risk in childhood. Recent advances in body composition methodology using air displacement plethysmography (ADP) have provided possibilities to accurately measure body composition of infants in a quick and non-invasive manner. The aims of this thesis were to study associations of parental body composition using ADP, glucose homeostasis during pregnancy and infant genetics with infant body composition also using ADP. When using ADP in adults, a correction for the thoracic gas volume (TGV) is needed and TGV can be predicted using equations developed in non-pregnant adults. Thus another aim was to study the validity of using such equations during pregnancy. Parent couples were invited to this study at a routine visit to a maternity clinic in Linköping between September 2008 and October 2010. When the mother was in gestational week 32, parental body composition using ADP and maternal glucose homeostasis variables were assessed. Size and body composition of healthy, singleton and full term (≥ 37 gestational weeks) infants were measured at 1 and 12 weeks of age and a total of 211 infants were included in the studies. Weight and length at 1 year of age were reported by parents. Saliva samples were collected from the infants to obtain DNA for genotyping of the fat mass and obesity associated (FTO) gene. Body composition results calculated using measured and predicted TGV were compared in 27 women. Results showed that predicted TGV yields a very marginal overestimation (0.5 %) of fat mass (FM). Further, each kg increase in maternal and paternal fat-free mass (FFM) was associated with 15.6 g (P=0.001) and 9.1 g (P=0.007), respectively, more FFM in their 1-week old infants. FM of fathers was not related to infant FM. However, maternal FM was positively associated with FM of daughters (5.8 g/kg, P=0.007), but not of sons (P=0.79) at 1 week of age. Similarly, each standard deviation increase in maternal HOMA-IR (homeostatic model assessment-insulin resistance) was related to 52.7 more g of FM (P<0.001) in 1-week-old daughters, but no such relationship was found for sons (P=0.79). The number of risk alleles at the FTO locus rs9939609 was not associated with infant body mass index (BMI) or infant FM at 1 or 12 weeks of age. However, the number of risk alleles was positively associated (P≤0.033) with infant length at 1 and 12 weeks of age, and the results suggested that this association was stronger in boys than in girls. The results presented in this thesis show that: i) The use of predicted TGV when applying ADP in gestational week 32 overestimated % FM only slightly. ii) Associations between parental and infant body composition are present early in life. Thus, parental FFM was positively related to FFM in 1-week-old infants. Furthermore, maternal FM and insulin resistance (HOMA-IR) were positively related to FM of 1-week-old daughters, but no such relationships were observed for sons. iii) The FTO genotype is not associated with infant body fatness at 1 or 12 weeks of age. However, the results suggested that the number of FTO risk alleles is positively associated with infant length, especially in boys. In conclusion, parental and genetic factors were associated with infant size and body composition and these relationships may be of importance for future body composition and health.
7

2. LIST OF PUBLICATIONS
I. Henriksson P, Löf M, Forsum E. Assessment and prediction of thoracic gas
volume in pregnant women: an evaluation in relation to body composition
assessment using air displacement plethysmography. Br J Nutr 2013;109:111-7
II. Henriksson P, Löf M, Forsum E. Parental fat-free mass is related to the fat-free
mass of infants and maternal fat mass is related to the fat mass of infant girls.
Acta Paediatr 2015 doi: 10.1111/apa.12939. [Epub ahead of print]
III. Henriksson P, Löf M, Forsum E. Glucose, insulin, and the insulin-like growth
factor binding protein 1 in the circulation of pregnant women in relation to their
own body composition and to that of their infants. (Manuscript)
IV. Henriksson P, Löf M, Soderkvist P, Forsum E. Variation in the fat mass and
obesity-related (FTO) genotype is not associated with body fatness in infants,
but possibly with their length. Pediatr Obes 2014;9:e112-5.
8

3. RELATED PUBLICATIONS (NOT INCLUDED IN THE THESIS)
I. Henriksson P, Eriksson B, Forsum E, Löf M. Gestational weight gain according
to Institute of Medicine recommendations in relation to infant size and body
composition. Pediatr Obes 2014 doi: 10.1111/ijpo.276. [Epub ahead of print]
II. Forsum E, Henriksson P, Löf M. The two-component model for calculating
total body fat from body density: an evaluation in healthy women before, during
and after pregnancy. Nutrients 2014;6:5888-99.
III. Forsum E, Flinke Carlsson E, Henriksson H, Henriksson P, Löf M. [BMI can
not safely identify 4-year-olds with high body fat]. Läkartidningen
2013;110:1553.
IV. Forsum E, Flinke Carlsson E, Henriksson H, Henriksson P, Löf M. Total body
fat content versus BMI in 4-year-old healthy Swedish children. J Obes
2013;2013:206715
9

4. ABBREVIATIONS
ADP Air displacement plethysmography
BMI Body mass index
BV Body volume
BVpredTGV Body volume calculated using predicted thoracic gas volume
BVmeasTGV Body volume calculated using measured thoracic gas volume
CV Coefficient of variation
d Body density
dFM Density of fat mass
dFFM Density of fat-free mass
FAO Food and Agricultural Organization
FFM Fat-free mass
FFMI Fat-free mass index
FM Fat mass
FMpredTGV Fat mass calculated using predicted thoracic gas volume
FMmeasTGV Fat mass calculated using measured thoracic gas volume
FMI Fat mass index
FTO gene Fat mass and obesity associated gene
GDM Gestational diabetes mellitus
GWAS Genome-wide association studies
HbA1c Haemoglobin A1c
HAPO study Hyperglycemia and Adverse Pregnancy Outcome study
HOMA-IR Homeostatic model assessment-insulin resistance
IGFBP-1 Insulin-like growth factor binding protein 1
IOM Institute of Medicine
PATHOS Parents And THeir Offspring Study
SD Standard deviation
SDS Standard deviation score
TGV Thoracic gas volume
TGVpred Predicted thoracic gas volume
TGVmeas Measured thoracic gas volume
10

5. INTRODUCTION
5.1 Background
According to the World Health Organization, childhood obesity is one of the most serious
public health challenges of the 21st century (1), and the proportion of overweight and obese
children is high in many countries (1, 2). This is of great concern, since obese children tend to
remain obese in adulthood (1, 3), when they are more likely to develop disorders such as
diabetes and cardiovascular disease (1). Data from Ng et al. suggest that there will be
continued increases in the prevalence of obesity in the developing world, where today
approximately two thirds of the world´s obese people live (2). Furthermore, although the
increase in obesity prevalence in developed countries has attenuated in the past decade, no
county has reported a substantial decrease in this prevalence (2). This is consistent with
Swedish data showing that although the increase in overweight/obesity prevalence appears to
have levelled off both in adults (4) and children (4, 5), it is still high.
Overweight and obesity may be established early in life (3, 6), and even factors during
intrauterine life may be of importance in relation to obesity development and health (7-10).
For example, Barker suggested that the intrauterine environment, reflected by a low birth
weight, is associated with impaired health in adulthood (7). Indeed, recent meta-analyses have
confirmed the relationships between a low birth weight, on the one hand, and high blood
pressure (11), increased cardiovascular mortality (9), and increased all-cause mortality (9)
later in life on the other hand. Furthermore, a high birth weight has been associated with an
increased obesity risk, as defined by body mass index (BMI; [body weight (kg)/height2 (m)]),
later in life (12). However, when Wells et al. (13) reviewed the literature relating birth weight
to body composition in childhood and in adulthood, they concluded that birth weight was
strongly related to the amount of fat-free mass (FFM) in the body, whereas the corresponding
association between birth weight and body fat mass (FM) was considerably weaker.
Interestingly, a low FFM and a high FM have both been reported to be independent risk
factors for premature mortality in adulthood (14). It has also been suggested that the positive
association between birth weight and later FFM may explain the link between low birth
weight and later cardiovascular disease (i.e. the Barker hypothesis) (15). It may thus be
relevant to note that not only the weight at birth, but also the components of the body, i.e. the
contributions of FFM and FM to birth weight, may be of relevance for adult health.
11

Consequently, some researchers have discussed the potential influence of infant body
composition on later health. For example, Yajnik et al. speculated that the so-called thin-fat
Indian infant, with a low FFM but a well-preserved FM at birth, may have an increased risk
for insulin resistance later in life (16). Furthermore, Wells (10) proposed that poor intrauterine
growth may permanently restrict the FFM, leading to a lower “metabolic capacity, i.e. a
reduced ability to tolerate an energy dense diet, and consequently an increased risk for
excessive fat retention. Finally, Hull et al. observed that infants of overweight and obese
mothers had more FM than infants of normal-weight mothers (17). These authors also
suggested that a high FM and a low FFM, rather than birth weight, are mediators between
foetal growth and adult health (17). Although infant FM and FFM may be important for later
health, very little is known about their determinants. One of the main reasons for this is that
accurate body composition methodology that is applicable during infancy has not been
available until recently.
5.2 Parental influences on infant body composition
Previous studies have indicated that maternal BMI is positively associated with infant FM
(17-19). Interestingly, Lingwood et al. reported that the BMI in women with gestational
diabetes was positively related to infant FM in infant girls, but not in infant boys (20). Also,
the BMI of fathers has been suggested to influence infant birth weight (21). However, BMI is
a relatively poor measure of body fatness (22), especially in pregnant women (23), and thus
studies using appropriate methodology when investigating associations between body
composition of parents and their infants are motivated. In such a study Butte et al. (24)
reported no associations between maternal and infant body composition, although their study
may have been too small (n=63) to identify such associations. Furthermore, I have not
identified any studies investigating associations between body composition of fathers and
their infants. Thus, further larger studies investigating relationships between parental and
infant body composition are motivated.
Since very little is known regarding associations between maternal and infant body
composition, there is limited knowledge regarding the mechanisms by which maternal body
composition may influence infant body composition. However, variables related to the
glucose homeostasis of the pregnant woman may be of interest in this respect since as early as
1952 Pedersen (25) proposed that the high blood glucose concentration in gestational
12

diabetes mellitus (GDM) is transferred to the foetus, with a subsequent stimulation of foetal
growth and fat retention. Recently, the Hyperglycemia and Adverse Pregnancy Outcome
(HAPO) study concluded that pregnancy glycaemia is positively associated with infant FM,
measured by skinfolds, even in women considered to be non-diabetic (25). Using dual x-ray
absorptiometry, Friis et al. have also reported that higher glycaemia in pregnancy is related to
more infant FM (26). Hence, variables such as concentrations of glucose and insulin in the
circulation of pregnant women, as well as homeostasis model assessment-insulin resistance
(HOMA-IR), may be relevant when investigating the influence of maternal metabolism on
infant size and body composition. Also, the insulin-like growth factor binding protein 1
(IGFBP-1) may be of interest in this context since its concentration in serum is inversely
related to that of insulin (27) as well as to infant birth weight (28, 29). Interestingly, all these
variables (glucose, insulin, HOMA-IR, IGFBP-1) describing maternal glucose homeostasis
have been related to the BMI (26) or FM (30, 31) of women during pregnancy. Thus, these
variables may represent mechanisms by which maternal body composition influences infant
body composition. Importantly, previous studies have not accurately measured body
composition of mothers and infants, but have relied on maternal BMI (26, 32) and/or
skinfolds as an estimate of infant body fatness (25, 33).
5.3 Genetic influences on infant body composition
It is well-established that obesity has a strong genetic component (34, 35). Despite this fact,
efforts to identity genetic loci associated with obesity have been unsuccessful until recently
(36, 37). However, with the introduction of large genome-wide association studies (GWAS) a
number of obesity associated loci have been identified. In 2007, the fat mass and obesity
associated (FTO) gene was the first such locus discovered by means of GWAS (38). In this
study the addition of each risk allele at the single nucleotide polymorphism, rs9939609, was
associated with an increased risk for obesity (odds ratio=1.31) and an increased body weight
of ≈ 1.0 kg. Associations between the FTO genotype and BMI have been replicated in
numerous studies (36, 37) and such relationships between the FTO genotype and body fatness
have also been presented (39). Although FTO is the locus with the strongest association with
BMI, variation in FTO explains less than 1 % of the variation in BMI (36, 37). Associations
between the FTO genotype and body fatness, BMI and FM have also been found in children
(38). In infancy, however, several studies report no relationship between the FTO genotype
and BMI (40-42), and Sovio et al. even reported an inverse association between the number of
13
FTO risk alleles and the BMI of infants (43). However, BMI is a poor predictor of body
fatness in infancy (44) and thus studies relating the FTO genotype to infant body fatness
should be based on accurate measures of body composition. The two published studies
examining associations between the FTO genotype and infant FM have reported contradictory
results (42, 45). Thus, Mook-Kanamori et al. (42) found no such association at 6 months of
age whereas López-Bermejo et al. (45) reported a positive association between the number of
risk alleles and FM in 2-week-old infants.
5.4 Advances in human body composition assessment
Studies of human body composition have been of interest for a long period of time (46).
Historically, however, in vivo studies of body composition have constituted a complex issue.
Ground-breaking progress in the field was made by Behnke and colleagues in 1942 with the
introduction of underwater weighing to measure the body volume of human subjects (46).
This enabled calculation of body density when body weight was also assessed. By assigning
densities to the fat mass (FM) and fat-free mass (FFM), Behnke et al. were also able to
estimate the relative proportions of FM and FFM in the human body by means of
densitometry, i.e. the procedure of estimating body composition from body density. Siri (in
1956) and Brozek (in 1961) published equations to estimate % FM based on a subject’s
density, and these are widely used even today.
For a long period of time, underwater weighing was considered to be the golden standard in
human body composition research (46). Currently, more advanced models dividing the human
body into three or four components (fat, water, protein and mineral) are considered to be the
golden standards for use when new methods are evaluated (47). There are several body
composition techniques available with inherent strengths and weaknesses. In general, simpler
methods such as skinfolds and bioelectrical impedance are easy to apply, but their validity
may be questioned (47). Conversely, valid body composition methods may be costly, involve
advanced technology with potential radiation exposure, or they may be demanding for
subjects (47). The latter applies for underwater weighing, since this methodology usually
involves complete submerging of the body into water (46, 47). Such a procedure may be
unpleasant for many subjects and it is not applicable for infants. However, with the
introduction of air displacement plethysmography (APD), body volume, and consequently
density, of adults (48) and infants (49) can be easily assessed in a non-invasive manner.
14
5.5 Principles of densitometry
The body weight can be divided into FM and FFM (i.e. a two-component model). Main
components of the FFM are water, protein and mineral, and their respective densities are
relatively well-established (46). If densities of FM (dFM) and FFM (dFFM) are known and the
subject’s body density (d) is measured, the following equation can be used: 1/d = x/dFM + (1-
x)/dFFM where x is the proportion of FM in the body. By using appropriate densities of FM
and FFM, the equation can be rearranged, enabling calculation of percent FM (46). The
density of FM (0.9007 g/cm3) is well-established and considered to be constant (46), while the
density of FFM is more variable. This is due to the fact that its proportions of water, protein
and mineral vary depending, for example, on age and physiological status (46). For healthy
non-pregnant adults, a FFM density of 1.1 g/cm3 is considered to be appropriate (50)
In infants, the water content in the FFM is substantially higher than in adults (51), and
consequently their FFM density is lower than in adults. Data regarding growth and body
composition, including FFM-density, from birth to 10 years of age were published by Fomon
et al. in 1982 (51). These data have to some extent been confirmed by Wells et al. (52),
Eriksson et al. (53) and Andersen et al. (54).
During pregnancy the composition of the FFM is altered. Thus, the water content of FFM
increases while its concentrations of protein and mineral decrease slightly (55, 56) resulting in
a lower FFM-density. Van Raaij et al. (56) calculated average changes in FFM-density
throughout pregnancy using data by Hytten (55). The Institute of Medicine (IOM) (57) as well
as the Food and Agricultural Organization (FAO) (58) have stated that body composition
methods taking into account the changes in FFM-density described by van Raaij (56) are
satisfactory for use with pregnant women. Studies based on densitometry have provided
further support for this statement (59, 60). Thus, Hopkinson et al. (60) found the use of the
FFM-density by Van Raaij (56) to yield reliable mean estimates of FM in gestational week 36
when compared to results obtained using a four-component model. Furthermore, our research
group has published results showing that use of the FFM-density estimated by van Raij (56) in
gestational week 32 (1.092 g/ml) gives satisfactory estimates of FM when compared to results
obtained using a three-component model (59).
15

5.6 Air displacement plethysmography
5.6.1 Bod Pod and Pea Pod
The Bod Pod was introduced in the mid-1990s and applies ADP (air displacement
plethysmography) in order to measure body volume of adults and children (50, 61). The Bod
Pod consists of a scale and a chamber in which the volume of the subject is measured. The
measurement starts with weighing the subject, and subsequently the subject's body volume is
determined using ADP. Body composition is then calculated by means of the Bod Pod
software using appropriate densities of FFM and FM. The ability of the Bod Pod to determine
body volume and thus body composition has been well documented for subjects with a large
variation in size and body composition (50, 61).
The introduction of the Pea Pod, also based on ADP, provided new possibilities to accurately
investigate the body composition of infants (62, 63). The measurement procedure is quick,
safe, non-invasive (49, 62, 63) and is therefore acceptable to parents, infants and health
personnel. The Pea Pod, introduced in 2004, can measure the body composition of infants
from birth until approximately 6 months of age (≈ 8 kg) (49), and it consists of a scale and a
chamber with a tray that can be pulled out. The weight of the infant is measured on the scale
and body volume is subsequently measured in the chamber. The complete test procedure takes
about 3 minutes (62). The density of the subject is calculated using the measured body weight
and volume. Body composition is then calculated by means of the Pea Pod software using
appropriate densities of FFM and FM. Results obtained using Pea Pod have been found to be
in good agreement with results obtained by means of a four-component model (62) as well as
by isotope dilution (63).
5.6.2 Methodological principles
When applying ADP, the body volume is measured in a chamber utilizing the relationship
between pressure and volume, i.e. the gas laws of Boyle and Poisson (48-50). The measured
body volume needs to be corrected, since the air close to the subject's body behaves
differently than the remaining air in the chamber, which results in an underestimation of the
subject's volume (48-50). To correct for this a correction volume, the so-called “surface area
artifact”, is calculated based on the length/height and weight and is added to the body volume
of the subject (48-50).
16
The air in the lungs and thorax also behaves differently than air not adjacent to the body
during an ADP measurement (48-50). This results in an underestimation of body volume
corresponding to 40% of the thoracic gas volume (TGV), which is equivalent to the average
amount of air in the lungs and thorax during an ADP measurement. Therefore, TGV is
measured or predicted and then 40% is added to the measured body volume. In infants, TGV
is predicted using infant age, length and weight (49). In adults, TGV can be measured as a
part of the measurement procedure in Bod Pod (50, 64). However, this assessment can be
difficult to perform and subjects may be unable to produce satisfactory results. A more
convenient approach is to predict the TGV based on height and age using established sex-
specific equations developed in non-pregnant adults (65, 66). In such subjects McCrory et al.
showed that body composition results obtained using predicted TGV were in good agreement
with those obatined using measured TGV (67). However, the effect of using such predicted
TGV on body composition results has not been assessed in pregnancy. This is a relevant topic,
since physiological and anatomical changes during pregnancy such as increased subcostal
angle, dislocation of the diaphragm and the growing uterus may affect the TGV (68, 69).
17

Bod Pod
Pea Pod
18

6. SPECIFIC AIMS
To measure and to predict TGV, using an equation developed for non-pregnant women, in
women in gestational week 32 and to compare body composition and BV results obtained
using these two kinds of TGV (Paper I).
To study the body composition of women in gestational week 32 in relation to the size and
body composition of their 1-week-old infants (Paper II).
To study the body composition of fathers in relation to the size and body composition of their
1-week-old infants (Paper II).
To study relationships between body composition and glucose homeostasis variables (glucose,
insulin, HOMA-IR, IGFBP-1 and HbA1c,) in the circulation of women in gestational week 32
(Paper III).
To study relationships between glucose homeostasis variables (glucose, insulin, HOMA-IR,
IGFBP-1 and HbA1c) in the circulation of women in gestational week 32 versus infant size
and body composition at 1 week of age (Paper III).
To study relationships between the number of risk alleles in the FTO gene (rs9939609) in
relation to infant size and body composition (Paper IV).
19

7. MATERIALS AND METHODS
7.1 Participants and study outline (Papers I-IV)
Figure 1 describes the recruitment of participants. A total of 1530 parent couples, from a
well-educated middle income population, received an invitation to participate in the study
called PATHOS (Parents And THeir Offspring Study) at a routine visit to the “Kvinnohälsan”
maternity clinic in Linköping (September 2008-October 2010) during early pregnancy. Of
those, 249 couples agreed to participate and both parents were measured when the woman
was in gestational week 32. A subgroup of 40 consecutively included women (non-smoking,
non-asthmatic) were invited to participate in a study in which the effect of pregnancy on TGV
was investigated (Paper I). Two women declined participation in this study and 11 failed to
produce three acceptable estimates of TGV, and thus the sample size consisted of 27 women.
Healthy, singleton and full term (≥ 37 gestational weeks) offspring of the 249 parent couples
were included in further studies. Infants born prematurely (n=11), not healthy (n=2) or born to
a mother with preeclampsia (n=5) or gestational diabetes (n=1) were excluded. In addition, 19
parent couples withdraw from the study. In total, 211 infants were measured at 1 and 12
weeks of age. Body composition of two infants was not measured, but their weight and length
were measured. Thus the sample size was 209 infants in Papers II and III. Parents reported the
weight and length of their 1-year-old children and we were able to collect such data for 209
infants. Since weight, length and BMI were important outcomes in Paper IV, all infants with
data regarding weight and length at 1 and 12 weeks (n=211) were included in this study.
7.2 Measurement of parents (Papers I-III)
Gestational age was assessed by means of a routine ultrasound examination in approximately
gestational week 12-14 (70). Parents were investigated in the morning after an overnight fast
when the woman was in gestational week 32 (31.4±0.3). On this occasion, a blood sample
was collected from the woman and then both parents had their height measured. Subsequently
their weight and body composition were assessed by means of Bod Pod. TGV was measured
for women in Paper I. Additional information (maternal smoking habits, parity, weight before
pregnancy, gestational weight gain, parental education level, infant birth weight and infant
feeding, etc.) were obtained by means of questionnaires administered at this measurement or
when infants were measured.
20

Figure 1. Recruitment of participants in the thesis
Invited parent couples
(n=1530)
Parent couples measured when woman
was in gestational week 32 (n=249)
Women invited to
thoracic gas volume study
(n=40)
Infants assessed
at 1 and 12 weeks of age (n=211)
as well as at 1 year of age (n=209)
Women included in
thoracic gas volume study
(n=27)
Excluded (n=13) Declined participation (n=2) Failed to perform three measurements of TGV (n=11)
Excluded (n=38) Declined further participation (n=19) Born prematurely (n=11) Infant sickness (n=2) Preeclampsia (n=5) Gestational diabetes (n=1)
21

7.3 Measurement of infants (Papers II-IV)
Infant size and body composition were investigated at 1 week (1.0±0.3 weeks), and at 12
weeks (12.1±0.5 weeks) of age when infant length was measured and body composition was
assessed using Pea Pod. The weight and length of 1-year-old infants were reported by their
parents after a routine visit at a child health care centre. Saliva samples were collected from
the infants, generally at the first measurement, to obtain DNA for FTO-genotyping.
7.4 Ethics
The project was conducted according to the guidelines laid down in the Declaration of
Helsinki and all studies were approved by the Research Ethics Committee, Linköping,
Sweden (M187-07, 2010/68-32). Informed consent, witnessed and formally recorded, was
obtained from all parents.
7.5 Methods
7.5.1 Thoracic gas volume and body composition of pregnant women (Paper I)
TGV was measured while the subject was sitting in the Bod Pod using a technique
comparable to that used in standard plethysmography (48, 50). Measurements were defined as
acceptable according to criteria recommended by the manufacturer (50). Measured TGV
(TGVmeas) was the average of three acceptable measurements. The average within - subject
standard deviation (SD) for measured TGV was 0.184 litres and its corresponding coefficient
of variation was 5.9 %. The technical error of measurement (71) was 0.210 litres. These
figures are in agreement with those reported in previous studies (65, 72), indicating that the
repeatability of the measurements is satisfactory. Predicted TGV (TGVpred) was calculated
using height and age of the women by means of Bod Pod Software 4.2.4 (65, 66). Height was
measured with a wall stadiometer to the nearest 0.5 cm. Body weight and volume were
assessed by means of Bod Pod (48, 50). Body composition was calculated using Bod Pod
software 4.2.4, and 1.092 g/cm3 was used as FFM density. Calculation of FM was based on
TGVpred (FMTGVpred) as well as on TGVmeas (FMTGVmeas).
22

7.5.2 Body composition assessment of parents (Papers II and III)
Height was measured with a wall stadiometer to the nearest 0.5 cm. Body weight and volume,
in tight fitting underwear or spandex-type swim suit/pants, were measured using the Bod Pod
(COSMED USA, Inc., Concord, CA, USA) (48, 50). Bod Pod software 4.2.4. was used to
predict TGV (65, 66) and to calculate body composition. The FFM density values used were
1.1 g/cm3 (men) (73) and 1.092 g/cm3 (women) (56).
7.5.3 Body composition assessment of infants (Papers II-IV)
The procedure used to assess body composition by means of Pea Pod has been described
previously (44, 62). In brief, infant length was measured to the nearest 0.5 cm using a length
board. Then infants were weighed without clothing and subsequently their body volume was
measured in Pea Pod (COSMED USA, Inc., Concord, CA, USA). Body composition was
calculated by means of the Pea Pod software 3.0.1. using the FFM density model published by
Fomon et al. (51).
7.5.4 Analysis of glucose homeostasis variables in pregnant women (Paper III)
Blood collected in EDTA-containing vacutainer tubes was used for high-performance liquid
chromatography analysis of HbA1c (74). Plasma glucose was analysed by means of the
glucose hexokinase method and serum insulin using the Elecsys electrochemiluminescence
immunoassay on a Cobas 602 (Roche Diagnostics Scandinavia AB, Bromma, Sweden).
HOMA-IR was calculated according to Matthews et al. (75). Serum samples were stored at
-70° C prior to analysis of IGFBP-1 by means of a one-step enzyme-linked immunosorbent
assay (R&D Systems, Minneapolis, MN, USA). Inter assay coefficients of variation were 7.8
and 20.0 % for samples with high (1688 ng/ml) and low (4 ng/ml) IGFBP-1 concentrations,
respectively. Plasma glucose, serum insulin and HbA1c were analysed at the Department of
Clinical Chemistry, Linköping University Hospital, which is accredited for these analyses
(ISO/IEC 17025).
7.5.5 Genotyping of the FTO locus rs9939609 (Paper IV)
The FTO locus (rs9939609) was genotyped as described in Paper IV. In brief, DNA from
saliva samples was extracted using QuickExtract DNA Extraction Solution 1.0 (Epicentre
Biotechnologies, Madison, WI, USA). Genotyping, i.e. assessing the number of risk (A) or
wild type (T) alleles, was based on real-time PCR (polymerase chain reaction) using the
23
TaqMan Genotyping Assay (ID: C__30090620_10), and was analysed on a ABI Prism
7900HT “Sequence Detection System” (Applied Biosystems, Carlsbad, CA, USA). Of the
211 subjects, saliva samples were not available for 2 subjects, and 207 (99 %) of the
remaining samples were successfully genotyped.
7.6 Statistics
Values are given as means and SD or as n and %. For all studies P<0.05 was considered
statistically significant and all hypothesis tests were two-sided. Statistical analysis was
performed using PASW Statistics 18 (IBM, Sowers, NY, USA) or Statistica software 9.1
(StatSoft, Inc., Tulsa, OK, USA). Agreement between two methods was evaluated as
suggested by Bland and Altman (Paper I) (76). Linear regression (Papers I-IV), and t-tests
(Papers I and II) were performed according to Kleinbaum et al. (77) as described in these
papers. Glucose homeostasis variables were log transformed to obtain normality since they
were positively skewed (Paper III). For easier interpretation, internal standard deviation
scores (SDS) were calculated by subtracting the sample mean from each observation and
dividing the difference obtained by the SD of the sample (Paper III). Correlations for
dependent observations were compared (Paper III) as described by Kleinbaum et al. (77). A
chi square test was performed to test if the allele frequencies of the FTO gene were in Hardy
Weinberg equilibrium (Paper IV). In order to statistically test whether relationships differed
between sexes (Papers II-IV), an interaction term was added to the model as described in
these papers.
7.7 Considerations concerning data analysis
Since maternal parity, infant sex, infant gestational age at birth and infant age are related to
infant size and/or body composition (44, 78-80), results that are adjusted for these variables
are presented when infants are studied (Papers II-IV). It is noteworthy that in these studies
unadjusted estimates were very similar to estimates adjusted for these variables. Adjusting for
additional potential confounders such as breast feeding, maternal educational attainment and
age also yielded very similar results. Furthermore, sex-differences in offspring body
composition in relation to maternal BMI (20), glycaemia (33, 81, 82) and infant genetics (83)
have been reported. This provided motivation to investigate sex differences in relation to
parental body composition, maternal glucose homeostasis variables and infant genetics.
Finally, since most previous knowledge regarding the influence of intrauterine factors on later
24
health and body composition is based on birth weight, weight of the infants was used as an
outcome measure. Since weight is the combination of FFM and FM, the outcomes are
presented in absolute values (g) and not only in percent. Relationships were observed between
maternal FFM and infant length (Paper II) as well as between the FTO genotype and infant
length (Paper IV). In these papers infant body composition results were also adjusted for
length (Papers II and IV) and/or presented as fat-free mass index (FFMI) and fat mass index
(FMI) (Paper II). FMI was [FM (kg)/height2 (m)] and FFMI was [FFM (kg)/height2 (m)].
25

8. RESULTS
8.1 Predicted versus measured thoracic gas volume (Paper I)
Descriptive data for the women participating in this study are presented in Table 1. As shown
in Table 2, TGVpred was significantly higher, by 0.187 litres (6 %), than TGVmeas. In the
Bland and Altman analysis, a significant negative correlation between TGVpred minus
TGVmeas and the average of TGVpred and TGVmeas was found (Figure 2b). Further, the limits
of agreement were wide (from – 0.675 to + 1.049 litres), corresponding to – 21.0 and 32.6 %
of the average of TGVpred and TGVmeas.
Table 1. Characteristics of 27 women in the study (Paper I).
Mean ± SD
Age at measurement (years) 31 ± 5
Stage of gestation at measurement* (weeks) 31.4 ± 0.3
Height (m) 1.68 ± 0.06
Weight before pregnancy† (kg) 66 ± 12
BMI before pregnancy‡ (kg/m2) 23.5 ± 3.9
Weight at measurement (kg) 75.3 ± 11.5
Gestational weight gain†§ (kg) 14 ± 5
Infant birth weight† (kg) 3.48 ± 0.57
BMI, body mass index. *Calculated from a routine ultrasound examination in approximately gestational week 12 (70). †Self-reported data. ‡Calculation based on self-reported weight before pregnancy and height measured in gestational week 32. §Calculated as the last known weight in pregnancy minus weight before pregnancy.
26

Table 2. Predicted* and measured thoracic gas volume as well as body volume and fat mass
calculated using predicted and measured thoracic gas volume for women (n=27) in gestational
week 32 (Paper I).
Mean ± SD
TGVpred (litres) 3.314† ± 0.206
TGVmeas (litres) 3.127 ± 0.488
BVpredTGV (litres) 74.211‡ ± 11.919
BVmeasTGV (litres) 74.136 ± 11.878
FMpredTGV (%) 35.0§ ± 5.3
FMmeasTGV (%) 34.5 ± 5.2
TGV, thoracic gas volume; BV, body volume; FM, fat mass; TGVpred, predicted thoracic gas volume; TGVmeas, measured thoracic gas volume; BVpredTGV, body volume calculated using TGVpred; BVmeasTGV, body volume calculated using TGVmeas, FMpredTGV, fat mass calculated using TGVpred; FMmeasTGV, fat mass calculated using TGVmeas. * TGV was predicted using an equation developed in non-pregnant women as described in Materials and Methods. † Significantly (P = 0·033) higher than TGVmeas. ‡ Significantly (P = 0·033) higher than BVmeasTGV § Significantly (P = 0·043) higher than FMmeasTGV.
Average BVpredTGV was very slightly (0.075 litres or 0.1 %) but significantly higher than
average BVmeasTGV (Table 2). Furthermore, the limits of agreement were small (from – 0.271
to + 0.421 litres), equivalent to – 0.4 and + 0.6 % of the average of BVpredTGV and BVmeasTGV
(Figure 3b).
Average FMpredTGV (%) was significantly, but only very slightly (0.5 % FM) higher than
average FMmeasTGV (Table 2). Furthermore, a strong significant correlation was observed
between FMpredTGV and FMmeasTGV (Figure 4a). There was no significant association between
FMpredTGV and FMmeasTGV on the one hand and the average of FMpredTGV and FMmeasTGV on the
other hand (Figure 4b). Finally, the limits of agreement in the Bland and Altman analysis
were small (from – 1.9 to + 2.9 % FM), corresponding to – 5.5 to + 8.3 % of the average of
FMpredTGV and FMmeasTGV.
27

Figure 2. (a) TGVmeas (measured thoracic gas volume) (y) regressed on TGVpred (predicted
thoracic gas volume) (x). The slope of the regression line (y = - 0.568 + 1.115x, r = 0.471,
standard error of the estimate = 0.439, P = 0.013) is not significantly (P = 0.786) different
from the line of identity (y = x). (b) Bland-Altman scatter plot; TGVpred minus TGVmeas (y)
regressed on the average of TGVpred and TGVmeas (x). The solid line represents the mean
difference between TGVpred and TGVmeas (0.187 litres) and the dashed lines are the limits of
agreement (2 SD = 0.862 litres). The regression equation is y = 3.546 – 1.043x, r = - 0.741 (P
< 0.001). Data collected from 27 women in gestational week 32.
28

Figure 3. (a) BVmeasTGV (body volume calculated using measured thoracic gas volume) (y)
regressed on BVpredTGV (body volume calculated using predicted thoracic gas volume) (x).
The slope of the regression line (y = 0.186 + 0.996x, r > 0.999, standard error of the estimate
= 0.171, P < 0.001) is not significantly (P = 0.194) different from the line of identity (y = x).
(b) Bland-Altman scatter plot; BVpredTGV minus BVmeasTGV (y) regressed on the average of
BVpredTGV and BVmeasTGV (x). The solid line represents the mean difference between BVpredTGV
and BVmeasTGV (0.075 litres) and the dashed lines are the limits of agreement (2 SD = 0.346
litres). The regression equation is y = - 0.179 + 0.003x, r = 0.236 (P = 0.235). Data collected
from 27 women in gestational week 32.
29

Figure 4. (a) FMmeasTGV (fat mass calculated using measured thoracic gas volume) (y)
regressed on FMpredTGV (fat mass calculated using predicted thoracic gas volume) (x). The
slope of the regression line (y = 1.139 + 0.953x, r = 0.974, standard error of the estimate =
1.2, P < 0.001) is not significantly (P = 0.296) different from the line of identity (y = x). (b)
Bland-Altman scatter plot; FMpredTGV minus FMmeasTGV (y) regressed on the average of
FMpredTGV and FMmeasTGV (x). The solid line represents the mean difference between
FMpredTGV and FMmeasTGV (0.5 % FM) and the dashed lines are the limits of agreement (2 SD =
2.4 % FM). The regression equation is y = - 0.267 + 0.022x, r = 0.095 (P = 0.638). Data
collected from 27 women in gestational week 32.
30

8.2 Parental variables versus infant size and body composition (Papers II and III)
8.2.1 Characteristics of parents and infants (Papers II and III)
Descriptive data for the parents are found in Table 3.
Table 3. Characteristics of parents (n=209) at the time of investigation (Papers II and III).
Mothers Fathers*
Stage of gestation† (weeks) 31.4 ± 0.3
Age (years) 31 ± 4 33 ± 5
Weight (kg) 76.1 ± 10.4‡ 83.0 ± 12.3
Height (cm) 169 ± 6 182 ± 6
BMI (kg/m2) 26.6 ± 3.4§ 25.0 ± 3.7
FFM (kg) 49.6 ± 5.3 63.3 ± 6.7
FM (kg) 26.5 ± 7.4 19.7 ± 9.7
FM (%) 34.3 ± 5.8 22.9 ± 8.6
Glucose in plasma (mmol/l) 4.8 ± 0.4
Insulin in serum (pmol/l) 66 ± 37
HOMA-IR 2.1 ± 1.3
HbA1c¶ (mmol/mol) 31 ± 3
IGFBP-1 in serum¶ (ng/ml) 108 ± 71
Level of education**
Primary school 0 (0 %) 2 (1.0 %)
High school 60 (28.7 %) 92 (44.0 %)
University degree 149 (71.3 %) 115 (55.0 %)
Parity**
0 106 (50.7 %)
≥1 103 (49.3 %)
Data are means ± SD or n (%). BMI, body mass index; FFM, fat-free mass; FM, fat mass. HOMA-IR, homeostatic model assessment-insulin resistance; HbA1c haemoglobin A1c, IGFBP-1, insulin-like growth factor binding protein 1. * Fathers were measured when the pregnant woman was in gestational week 32 † Based on a routine ultrasound examination in approximately gestational week 12 (70). ‡ Weight before pregnancy was 66 ± 10 kg (self-reported). § BMI before pregnancy was 23 ± 3 kg/m2, calculated using self-reported weight. ¶ HbA1c (n=208), IGFBP-1 (n=204) ** Self-reported
31

Six (2.9%) women were underweight (BMI<18.5 kg/m2), 160 (76.6%) were of normal weight
(BMI=18.5-24.9 kg/m2), 32 (15.3%) were overweight (BMI=25.0-29.9 kg/m2) and 11 (5.3%)
were obese (BMI≥ 30.0 kg/m2) before pregnancy. Corresponding figures for fathers were:
underweight (0.5%, n=1), normal weight (56.5%, n=118), overweight (34.4%, n=72) and
obesity (8.6%, n=18). Maternal weight gain for the complete pregnancy was 15 ± 5 kg. Infant
data are presented in Table 4. Compared to boys, girls were significantly shorter and lighter
and contained significantly more FM and less FFM.
Table 4. Characteristics of infant boys and girls (Papers II and III).
Girls (n=99) Boys (n=110) All (n=209)
At birth
Weight* (g) 3540 ± 460 3660 ± 450 3600 ± 460
Gestational age (weeks) 40.0 ± 1.2 40.1 ± 1.2 40.1 ± 1.2
At the time of measurement
Age (weeks) 1.0 ± 0.3 1.1 ± 0.2 1.0 ± 0.3
Length (cm) 51.0† ± 1.5 52.0 ± 1.5 51.5 ± 1.5
Length-for-age z score‡ 0.26 ± 1.13 0.11 ± 1.07 0.18 ± 1.10
Weight (g) 3523† ± 445 3653 ± 462 3591 ± 458
Weight-for-age z score‡ -0.14 ± 1.01 -0.20 ± 1.03 -0.17 ± 1.02
FFM (g)
FFMI (kg/m2)
3049† ± 318
11.61† ± 0.79
3243 ± 339
12.07 ± 0.74
3151 ± 343
11.85 ± 0.80
FM (g)
FMI (kg/m2)
474† ± 171
1.79† ± 0.59
409 ± 188
1.51 ± 0.66
440 ± 183
1.64 ± 0.64
FM (%) 13.2† ± 3.6 10.9 ± 4.1 12.0 ± 4.0
Mode of feeding
Breast milk 94 (94.9 %) 104 (94.5 %) 198 (94.7 %)
Breast milk and formula 5 (5.1 %) 6 (5.5 %) 11 (5.3 %)
Formula 0 (0 %) 0 (0 %) 0 (0 %)
Data are means ± SD or n (%). FFM, fat-free mass; FFMI, fat-free mass index; FM, fat mass; FMI, fat mass index. * Reported by a parent. † Significantly (P<0.05) different from the corresponding value for boys. ‡ Calculated using Swedish reference data (80).
32

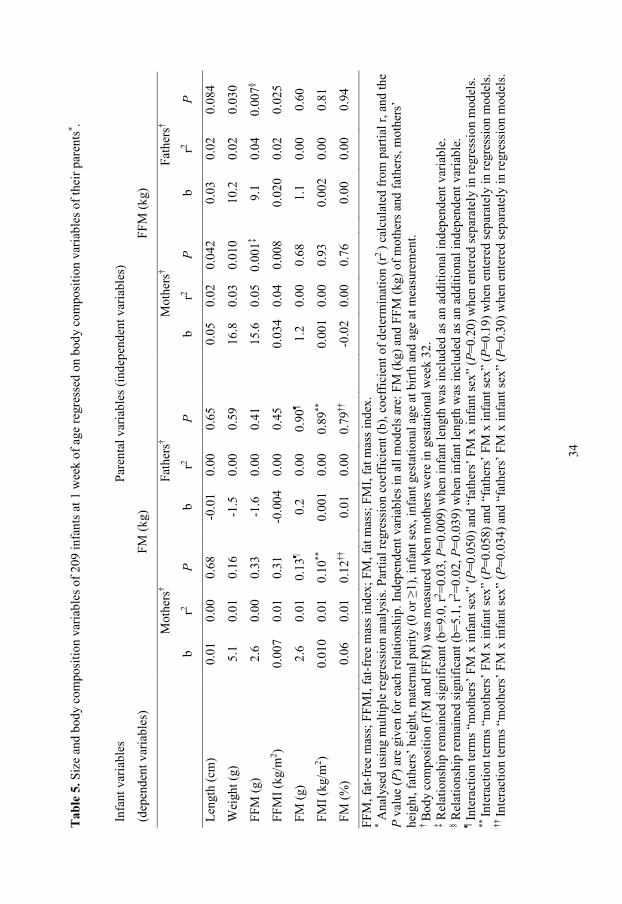
8.2.2 Parental FFM in relation to infant body size and composition (Paper II)
Associations between parental FFM and infant size and body composition are presented in
Table 5. FFM of mothers (P=0.042), but not of the fathers, was positively associated with
infant length. Furthermore, the FFM of both mothers and fathers was positively related to the
weight (P≤0.030), FFM (P≤0.007) and FFMI (P≤0.025) of their infants. More specifically,
each kg increase in FFM of mothers and fathers was associated with an increase in infant
FFM of 15.6 g and 9.1 g, respectively. Parental FFM remained significantly related to infant
FFM when associations were further adjusted for infant length (footnotes ‡ and § Table 5). No
interactions (P>0.10) between infant sex and parental FFM for infant FFM or FFMI were
observed.
8.2.3 Parental FM in relation to infant body size and composition (Paper II)
The results of a regression analysis between parental FM (independent variables) and infant
size and body composition (dependent variables) are shown in Table 5. No significant
associations between parental FM and any of the variables describing infant size and body
composition were found. However, a significant (P=0.034) interaction between maternal FM
and infant sex was identified when the infant % FM was the dependent variable (footnote †† in
Table 5). As shown in Table 5 (footnotes ¶ and **), corresponding P values for this interaction
(maternal FM x infant sex) were P=0.050 and P=0.058 when infant FM (g) and infant FMI,
respectively, were dependent variables. Finally, no significant interactions between FM of
fathers and infant sex were observed in any of the models with infant FM or FMI as
dependent variables (Table 5).
33
Tab
le 5
. Siz
e an
d bo
dy c
ompo
sitio
n va
riabl
es o
f 209
infa
nts a
t 1 w
eek
of a
ge re
gres
sed
on b
ody
com
posi
tion
varia
bles
of t
heir
pare
nts* .
Infa
nt v
aria
bles
Pare
ntal
var
iabl
es (i
ndep
ende
nt v
aria
bles
)
(dep
ende
nt v
aria
bles
)
FM
(kg)
FFM
(kg)
Mot
hers
†
Fath
ers†
M
othe
rs†
Fa
ther
s†
b r2
P
b r2
P
b r2
P
b r2
P
Leng
th (c
m)
0.
01
0.00
0.
68
-0
.01
0.00
0.
65
0.
05
0.02
0.
042
0.
03
0.02
0.
084
Wei
ght (
g)
5.
1 0.
01
0.16
-1.5
0.
00
0.59
16.8
0.
03
0.01
0
10.2
0.
02
0.03
0
FFM
(g)
2.
6 0.
00
0.33
-1.6
0.
00
0.41
15.6
0.
05
0.00
1‡
9.1
0.04
0.
007§
FFM
I (kg
/m2 )
0.
007
0.01
0.
31
-0
.004
0.
00
0.45
0.03
4 0.
04
0.00
8
0.02
0 0.
02
0.02
5
FM (g
)
2.6
0.01
0.
13¶
0.
2 0.
00
0.90
¶
1.2
0.00
0.
68
1.
1 0.
00
0.60
FMI (
kg/m
2 )
0.01
0 0.
01
0.10
**
0.
001
0.00
0.
89**
0.00
1 0.
00
0.93
0.00
2 0.
00
0.81
FM (%
)
0.06
0.
01
0.12
††
0.
01
0.00
0.
79††
-0.0
2 0.
00
0.76
0.00
0.
00
0.94
FFM
, fat
-fre
e m
ass;
FFM
I, fa
t-fre
e m
ass i
ndex
; FM
, fat
mas
s; F
MI,
fat m
ass i
ndex
. * A
naly
sed
usin
g m
ultip
le re
gres
sion
ana
lysi
s. Pa
rtial
regr
essi
on c
oeff
icie
nt (b
), co
effic
ient
of d
eter
min
atio
n (r
2 ) c
alcu
late
d fr
om p
artia
l r, a
nd th
e P
valu
e (P
) are
giv
en fo
r eac
h re
latio
nshi
p. In
depe
nden
t var
iabl
es in
all
mod
els a
re: F
M (k
g) a
nd F
FM (k
g) o
f mot
hers
and
fath
ers,
mot
hers
’ he
ight
, fat
hers
’ hei
ght,
mat
erna
l par
ity (0
or ≥
1), i
nfan
t sex
, inf
ant g
esta
tiona
l age
at b
irth
and
age
at m
easu
rem
ent.
† B
ody
com
posi
tion
(FM
and
FFM
) was
mea
sure
d w
hen
mot
hers
wer
e in
ges
tatio
nal w
eek
32.
‡ Rel
atio
nshi
p re
mai
ned
sign
ifica
nt (b
=9.0
, r2 =0
.03,
P=0
.009
) whe
n in
fant
leng
th w
as in
clud
ed a
s an
addi
tiona
l ind
epen
dent
var
iabl
e.
§ Rel
atio
nshi
p re
mai
ned
sign
ifica
nt (b
=5.1
, r2 =0
.02,
P=0
.039
) whe
n in
fant
leng
th w
as in
clud
ed a
s an
addi
tiona
l ind
epen
dent
var
iabl
e.
¶ Inte
ract
ion
term
s “m
othe
rs’ F
M x
infa
nt se
x” (P
=0.0
50) a
nd “
fath
ers’
FM
x in
fant
sex”
(P=0
.20)
whe
n en
tere
d se
para
tely
in re
gres
sion
mod
els.
** In
tera
ctio
n te
rms “
mot
hers
’ FM
x in
fant
sex”
(P=0
.058
) and
“fa
ther
s’ F
M x
infa
nt se
x” (P
=0.1
9) w
hen
ente
red
sepa
rate
ly in
regr
essi
on m
odel
s. ††
Inte
ract
ion
term
s “m
othe
rs’ F
M x
infa
nt se
x” (P
=0.0
34) a
nd “
fath
ers’
FM
x in
fant
sex”
(P=0
.30)
whe
n en
tere
d se
para
tely
in re
gres
sion
mod
els.
34
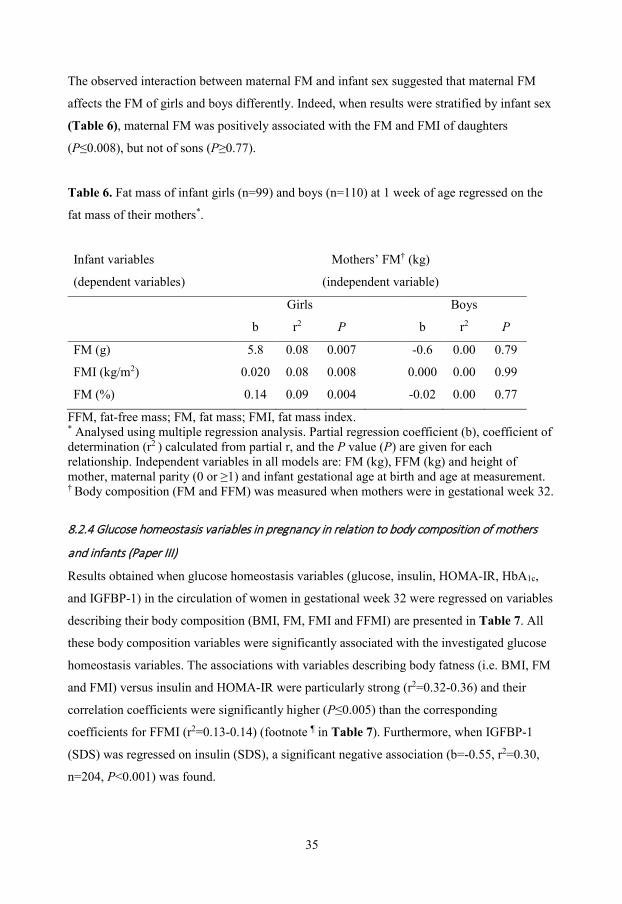
The observed interaction between maternal FM and infant sex suggested that maternal FM
affects the FM of girls and boys differently. Indeed, when results were stratified by infant sex
(Table 6), maternal FM was positively associated with the FM and FMI of daughters
(P≤0.008), but not of sons (P≥0.77).
Table 6. Fat mass of infant girls (n=99) and boys (n=110) at 1 week of age regressed on the
fat mass of their mothers*.
Infant variables Mothers’ FM† (kg)
(dependent variables) (independent variable)
Girls Boys
b r2 P b r2 P
FM (g) 5.8 0.08 0.007 -0.6 0.00 0.79
FMI (kg/m2) 0.020 0.08 0.008 0.000 0.00 0.99
FM (%) 0.14 0.09 0.004 -0.02 0.00 0.77
FFM, fat-free mass; FM, fat mass; FMI, fat mass index. * Analysed using multiple regression analysis. Partial regression coefficient (b), coefficient of determination (r2 ) calculated from partial r, and the P value (P) are given for each relationship. Independent variables in all models are: FM (kg), FFM (kg) and height of mother, maternal parity (0 or ≥1) and infant gestational age at birth and age at measurement. † Body composition (FM and FFM) was measured when mothers were in gestational week 32.
8.2.4 Glucose homeostasis variables in pregnancy in relation to body composition of mothers
and infants (Paper III)
Results obtained when glucose homeostasis variables (glucose, insulin, HOMA-IR, HbA1c,
and IGFBP-1) in the circulation of women in gestational week 32 were regressed on variables
describing their body composition (BMI, FM, FMI and FFMI) are presented in Table 7. All
these body composition variables were significantly associated with the investigated glucose
homeostasis variables. The associations with variables describing body fatness (i.e. BMI, FM
and FMI) versus insulin and HOMA-IR were particularly strong (r2=0.32-0.36) and their
correlation coefficients were significantly higher (P≤0.005) than the corresponding
coefficients for FFMI (r2=0.13-0.14) (footnote ¶ in Table 7). Furthermore, when IGFBP-1
(SDS) was regressed on insulin (SDS), a significant negative association (b=-0.55, r2=0.30,
n=204, P<0.001) was found.
35

Tab
le 7
. Glu
cose
hom
eost
asis
var
iabl
es (g
luco
se, i
nsul
in, H
OM
A-IR
, HbA
1c a
nd IG
FBP-
1) in
the
circ
ulat
ion
of w
omen
, pre
gnan
t in
gest
atio
nal
wee
k 32
, reg
ress
ed o
n va
riabl
es d
escr
ibin
g th
eir b
ody
com
posi
tion
(BM
I, fa
t mas
s, fa
t mas
s ind
ex a
nd fa
t-fre
e m
ass i
ndex
) †.
Bod
y co
mpo
sitio
n‡
(inde
pend
ent v
aria
bles
)
Glu
cose
(SD
S§ )
n 20
9
Insu
lin (S
DS§ )
n 20
9
HO
MA
-IR
(SD
S§ )
n 20
9
HbA
1c (S
DS§ )
n 20
8
IGFB
P-1
(SD
S§ )
n 20
4
b
r2 b
r2 b
r2 b
r2 b
r2
BM
I (kg
/m2 )
0.10
***
0,11
0.
18**
* 0.
36¶
0.18
***
0.36
¶ 0.
08**
* 0.
06
-0.1
3***
0.19
FM (k
g)
0.04
***
0.07
0.
08**
* 0.
33¶
0.08
***
0.32
¶ 0.
02*
0.03
-0
.05**
* 0.
14
FMI (
kg/m
2 ) 0.
10**
* 0.
07
0.22
***
0.33
¶ 0.
22**
* 0.
32¶
0.08
**
0.04
-0
.14**
* 0.
14
FFM
I (kg
/m2 )
0.22
***
0.10
0.
25**
* 0.
13¶
0.26
***
0.14
¶ 0.
16**
0.
05
-0.2
6***
0.13
BM
I, bo
dy m
ass i
ndex
; FFM
I, fa
t-fre
e m
ass i
ndex
; FM
, fat
mas
s; F
MI,
fat m
ass i
ndex
; HO
MA
-IR, h
omeo
stat
ic m
odel
ass
essm
ent-i
nsul
in
resi
stan
ce; H
bA1c
hae
mog
lobi
n A
1c, I
GFB
P-1,
insu
lin-li
ke g
row
th fa
ctor
bin
ding
pro
tein
1.
Glu
cose
hom
eost
asis
var
iabl
e an
d bo
dy c
ompo
sitio
n va
riabl
e w
as a
ssoc
iate
d: *
P<0.
05, **
P<0
.01,
*** P
<0.0
01.
† A
naly
sed
usin
g si
mpl
e re
gres
sion
ana
lysi
s. R
egre
ssio
n co
effic
ient
(b),
coef
ficie
nt o
f det
erm
inat
ion
(r2
), an
d th
e P
valu
e (P
) are
giv
en fo
r eac
h re
latio
nshi
p.
‡ Bod
y co
mpo
sitio
n (F
M a
nd F
FM) o
f pre
gnan
t wom
en w
as m
easu
red
in g
esta
tiona
l wee
k 32
. §
Inte
rnal
stan
dard
dev
iatio
n sc
ores
(SD
S), c
alcu
late
d as
des
crib
ed in
Mat
eria
ls a
nd M
etho
ds.
¶ C
orre
latio
n co
effic
ient
s bet
wee
n va
riabl
es d
escr
ibin
g bo
dy fa
tnes
s (i.e
. BM
I, FM
and
FM
I), o
n th
e on
e ha
nd, a
nd in
sulin
and
HO
MA
-IR
, on
the
othe
r han
d, w
ere
sign
ifica
ntly
hig
her (
P≤0.
005)
than
the
corr
espo
ndin
g va
lues
for F
FMI v
ersu
s ins
ulin
and
HO
MA
-IR
.
36

No significant (P≥0.18) relationships between any of the investigated glucose homeostasis
variables and infant length were found and no significant associations were observed between
HbA1c and any variable describing infant size or body composition. Figure 5 shows
associations between maternal glucose, insulin, HOMA-IR and IGFBP-1 (independent
variables) and infant weight (a), infant FFM (b) and infant FM (c) (dependent variables). As
shown in Figure 5a, significant relationships were identified between maternal glucose,
HOMA-IR and IGFBP-1, on the one hand, and infant weight on the other hand. Further, none
of these glucose homeostasis variables were significantly related to infant FFM, but they were
all significantly associated with infant FM (P≤0.009), (Figure 5c).
8.2.5 Insulin/HOMA-IR of pregnant women in relation to fat mass of daughters and sons (Paper
III)
Significant interactions between maternal insulin and infant sex (P=0.034) as well as between
maternal HOMA-IR and infant sex (P=0.042) were identified when infant FM (g) was the
dependent variable. No such sex interactions were observed for maternal glucose (P=0.33) or
IGBFP-1 (P=0.93). The observed sex interactions provided motivation to investigate
associations between maternal insulin/HOMA-IR and infant FM for girls and boys separately.
As shown in Figure 6, maternal insulin and HOMA-IR were positively related to FM of
infant girls (P<0.001), but not to FM of infant boys (P≥0.065).
37

Figure 5
38
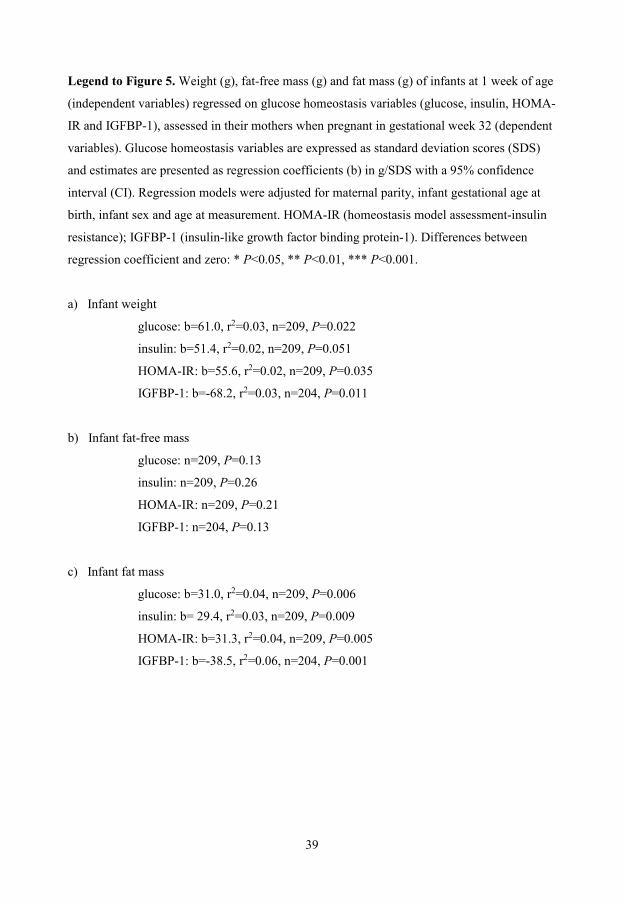
Legend to Figure 5. Weight (g), fat-free mass (g) and fat mass (g) of infants at 1 week of age
(independent variables) regressed on glucose homeostasis variables (glucose, insulin, HOMA-
IR and IGFBP-1), assessed in their mothers when pregnant in gestational week 32 (dependent
variables). Glucose homeostasis variables are expressed as standard deviation scores (SDS)
and estimates are presented as regression coefficients (b) in g/SDS with a 95% confidence
interval (CI). Regression models were adjusted for maternal parity, infant gestational age at
birth, infant sex and age at measurement. HOMA-IR (homeostasis model assessment-insulin
resistance); IGFBP-1 (insulin-like growth factor binding protein-1). Differences between
regression coefficient and zero: * P<0.05, ** P<0.01, *** P<0.001.
a) Infant weight
glucose: b=61.0, r2=0.03, n=209, P=0.022
insulin: b=51.4, r2=0.02, n=209, P=0.051
HOMA-IR: b=55.6, r2=0.02, n=209, P=0.035
IGFBP-1: b=-68.2, r2=0.03, n=204, P=0.011
b) Infant fat-free mass
glucose: n=209, P=0.13
insulin: n=209, P=0.26
HOMA-IR: n=209, P=0.21
IGFBP-1: n=204, P=0.13
c) Infant fat mass
glucose: b=31.0, r2=0.04, n=209, P=0.006
insulin: b= 29.4, r2=0.03, n=209, P=0.009
HOMA-IR: b=31.3, r2=0.04, n=209, P=0.005
IGFBP-1: b=-38.5, r2=0.06, n=204, P=0.001
39

Figure 6. Fat mass (g) of 1-week-old girls and boys (dependent variables) regressed on
insulin (SDS) and HOMA-IR (SDS) of their mothers when pregnant in gestational week 32
(independent variables). Estimates are presented as regression coefficients (b) in g/SDS with a
95% confidence interval (CI). Regression models were adjusted for maternal parity, infant
gestational age at birth and age at measurement. HOMA-IR (homeostasis model assessment-
insulin resistance). Differences between regression coefficient and zero: * P<0.05, ** P<0.01,
*** P<0.001. † Refers to the P value obtained when the interaction terms (insulin x infant sex)
and (HOMA-IR x infant sex) were entered separately in the regression models as described in
Materials and Methods.
Insulin
Girls: b=52.5, r2=0.12, n=99, P<0.001; Boys: b=5.4, r2=0.00, n=110, P=0.75
HOMA-IR
Girls: b=52.7, r2=0.13, n=99, P<0.001; Boys: b=7.8, r2=0.00, n=110, P=0.65
40

Table 8 shows an analysis where the FM of infant girls is regressed on the FM and HOMA-
IR of their pregnant mothers. As shown in this table, maternal FM and HOMA-IR are both
significantly related to the FM of their daughters when fitted in separate models (a and b).
However, when both maternal FM and HOMA-IR were included as independent variables in
a multiple regression analysis (model c), only the relationship with HOMA-IR remained
significant (P=0.017). Using insulin instead of HOMA-IR in a corresponding analysis yielded
very similar results (data not shown).
Table 8. FM of 1-week-old girls regressed on FM and HOMA-IR of their mothers when
pregnant in gestational week 32.
Model Maternal (independent)
variables
b r2 P Model adjusted r2
a* FM (kg) 5.8 0.09 0.004 0.27
b* HOMA-IR (SDS†) 52.7 0.13 <0.001 0.30
c* FM (kg) 2.7 0.01 0.24 0.31
HOMA-IR (SDS†) 41.4 0.06 0.017
FM, fat mass; SDS, standard deviation score; HOMA-IR, homeostatic model assessment-insulin resistance. * Analysed using multiple regression analysis. Partial regression coefficient (b), coefficient of determination (r2 ) calculated from partial r, and the P value (P) are given for each relationship. FM (g) of girls was the dependent variable. Model also included maternal parity, infant gestational age at birth and age at measurement as independent variables. † Refers to internal SDS, calculated as described in Materials and Methods.
41

8.3 FTO genotype in relation to infant size and body composition (Paper IV)
Table 9 shows characteristics of the infants in this study. Girls were born after 40.0±1.2
gestational weeks and weighed 3530±450 g at birth. Corresponding figures for boys were
40.1±1.2 weeks and 3680±490 g, respectively. Of the girls, 33.0% (n=32) had no risk allele,
45.4% (n=44) had 1 risk allele, and 21.6 % (n=21) had 2 risk alleles (for rs9939609). Of the
boys, 38.2% (n=42) had no risk allele, 44.5% (n=49) had 1 risk allele, and 17.3 % (n=19) had
2 risk alleles for rs9939609. Allele frequencies were in Hardy-Weinberg equilibrium both for
girls (P=0.73) and boys (P=0.53).
Associations between the number of risk alleles (A) at the FTO locus rs9939609 (i.e. FTO
genotype) and infant size and body composition are shown in Table 10. No significant
relationships were observed between the FTO genotype and infant BMI at any of the
investigated ages. Furthermore, the FTO genotype was not associated with infant FM at 1 or
12 weeks of age. In contrast, the number of risk alleles was positively related (P<0.05) to
infant FFM and weight both at 1 and 12 weeks of age. However, these relationships were not
significant after adjustment for infant length. This may indicate that the observed associations
between the FTO genotype and infant FFM/weight were explained by an effect on infant
length. Indeed, positive associations were found between the number of risk alleles and length
at 1 (P=0.033) and 12 (P=0.007) weeks but not quite at 1 year of age (P=0.052). Also, some
evidence of an interaction between the FTO genotype and infant sex (footnote ‡ in Table 10)
was found when infant length was the dependent variable. Thus, the number of risk alleles
was positively related to length at the age of 1 week (P=0.004), 12 weeks (P=0.001) and 1
year (P=0.012) for boys, but not for girls.
42

Tab
le 9
. Cha
ract
eris
tics o
f girl
s and
boy
s in
the
stud
y at
1 a
nd 1
2 w
eeks
as w
ell a
s at 1
yea
r of a
ge (P
aper
IV).
1 w
eek
of a
ge
12
wee
ks o
f age
1 ye
ar o
f age
Girl
s
(n=9
7)
Boy
s
(n=1
10 )
G
irls
(n=9
7)
Boy
s
(n=1
10 )
G
irls
(n=9
6)
Boy
s
(n=1
09)
Age
(wee
k)
1.
0 ±
0.3
1.1
± 0.
3
12.1
± 0
.4
12.1
± 0
.4
53
.1 ±
2.4
52
.7 ±
2.1
Leng
th (c
m)
51
.0 ±
1.5
52
.0 ±
2.0
60.5
± 2
.0
62.0
± 2
.0
75
.5 ±
2.5
77
.0 ±
2.5
Leng
th-f
or-a
ge z
scor
e*
0.24
± 1
.12
0.15
± 1
.11
0.
32 ±
0.9
7 0.
27 ±
1.1
2
0.31
± 0
.95
0.45
± 0
.94
Wei
ght (
g)
35
15 ±
438
36
82 ±
497
5856
± 5
73
6427
± 8
58
97
00 ±
940
10
580
± 10
70
Wei
ght-f
or-a
ge z
scor
e*
-0.1
5 ±
0.99
-0
.15
± 1.
09
-0
.20
± 0.
87
0.13
± 1
.17
-0
.14
± 0.
98
0.11
± 1
.07
BM
I (kg
/m2 )
13
.4 ±
1.1
13
.6 ±
1.2
15.9
± 1
.1
16.8
± 1
.7
17
.0 ±
1.3
17
.7 ±
1.4
FFM
(g)
30
42 ±
312
32
45 ±
339
†
4263
± 3
64
4750
± 4
63†
FM (g
)
473
± 17
2 41
1 ±
190†
15
93 ±
356
16
23 ±
440
†
FM (%
)
13.2
± 3
.6
10.9
± 4
.1†
27
.0 ±
4.2
25
.2 ±
4.5
†
Mod
e of
feed
ing
B
reas
t milk
92 (9
4.8
%)
104
(94.
5 %
)
79 (8
1.4
%)
84 (7
6.4
%)
B
reas
t milk
and
form
ula
5
(5.2
%)
6 (5
.5 %
)
15 (1
5.5
%)
22 (2
0.0
%)
Fo
rmul
a
0 (0
%)
0 (0
%)
3
(3.1
%)
4 (3
.6 %
)
Dat
a ar
e M
eans
± S
D o
r n (%
). B
MI,
body
mas
s ind
ex; F
FM, f
at-f
ree
mas
s; F
M, f
at m
ass.
*
Cal
cula
ted
usin
g Sw
edis
h re
fere
nce
data
(80)
. † n
=108
43

Tab
le 1
0. R
esul
ts o
f reg
ress
ion
anal
ysis
rela
ting
the
num
ber o
f FTO
(rs9
9396
09) r
isk
alle
les (
0, 1
or 2
) as i
ndep
ende
nt v
aria
ble
to b
ody
size
and
com
posi
tion
(dep
ende
nt v
aria
bles
) in
a lo
ngitu
dina
l stu
dy o
f inf
ants
at 1
and
12
wee
ks a
s wel
l as a
t 1 y
ear o
f age
.
Dep
ende
nt
varia
ble
1 w
eek
of a
ge*
12 w
eeks
of a
ge*
1 ye
ar o
f age
*
n b
r2 P
n
b r2
P
n b
r2 P
Leng
th† (c
m)
20
7 0.
31
0.02
3 0.
033‡
20
7 0.
47
0.03
6 0.
007‡
20
5 0.
41
0.01
9 0.
052‡
G
irls
97
0.
01
0.00
0 0.
98
97
0.
08
0.00
1 0.
76
96
0.
04
0.00
0 0.
90
B
oys
11
0 0.
56
0.07
8 0.
004
11
0 0.
77
0.09
6 0.
001
10
9 0.
73
0.05
9 0.
012
Wei
ght† (g
)
207
93.3
0.
030
0.01
4§
207
149.
3 0.
023
0.03
3§
205
0.22
0.
024
0.02
8§
BM
I (kg
/m2 )
20
7 0.
18
0.01
6 0.
071
20
7 0.
14
0.00
5 0.
32
20
5 0.
18
0.00
9 0.
17
FFM
(g)
20
5 56
.4
0.02
2 0.
036§
20
5 10
3.3
0.03
4 0.
008§
FM (g
)
205
22.7
0.
010
0.16
205
8.1
0.00
0 0.
83
FM (%
)
205
0.36
0.
005
0.31
205
-0.2
3 0.
002
0.57
b, sl
ope
of re
gres
sion
line
(eff
ect p
er ri
sk a
llele
); r2 , co
effic
ient
of d
eter
min
atio
n ca
lcul
ated
from
par
tial r
; P, P
-val
ue; B
MI,
body
mas
s ind
ex;
FFM
, fat
-fre
e m
ass;
FM
, fat
mas
s.
* FTO
was
cod
ed a
s: 0
, no
risk
alle
le; 1
, one
risk
alle
le; 2
, tw
o ris
k al
lele
s. Th
us th
e re
gres
sion
ana
lysi
s ass
umed
an
addi
tive
effe
ct o
f the
num
ber
of ri
sk a
llele
s. M
odel
s wer
e ad
just
ed fo
r mat
erna
l par
ity, i
nfan
t ges
tatio
nal a
ge a
t birt
h, in
fant
age
at m
easu
rem
ent a
nd in
fant
sex
(exc
ept w
hen
the
sexe
s are
ana
lyse
d se
para
tely
). † L
engt
h an
d w
eigh
t at t
he a
ge o
f 1 y
ear w
ere
repo
rted
by p
aren
ts a
fter a
vis
it to
a h
ealth
clin
ic.
‡ P
for s
ex-in
tera
ctio
n (i.
e. n
umbe
r of F
TO ri
sk a
llele
s x in
fant
sex)
was
0.0
67 (1
wee
k), 0
.047
(12
wee
k), 0
.11
(1 y
ear)
. Fur
ther
mor
e, w
hen
incl
udin
g a
sex-
inte
ract
ion
(toge
ther
with
infa
nt se
x) in
una
djus
ted
mod
els c
orre
spon
ding
P-v
alue
s wer
e: 0
.026
(1 w
eek)
, 0.0
24 (1
2 w
eeks
), 0.
048
(1 y
ear)
. § N
ot si
gnifi
cant
(P≥0
.19)
whe
n ad
just
ed fo
r inf
ant l
engt
h.
44

9. DISCUSSION
9.1 Comments on the study population
The proportion of parents with a university degree in the studies was considerably higher as
compared to Swedish national data (84). Further, the parents had similar BMIs (means and
SD) as reported in a previous study conducted in a similar population in Linköping, Sweden
(44). The proportion of overweight and obese men in the studies was comparable to Swedish
national data whereas the proportion of overweight/obese women was slightly lower (4).
Further, the average and the variation in maternal gestational weight gain were similar to
those reported in the Swedish maternity care registry (85). The proportion of breastfed infants
was high, as is common in Sweden (86). Finally, the average and the variation in weight and
length of the infants in the studies were in agreement with Swedish reference data (80) and
their body composition was similar to that reported in a previous study conducted in
Linköping, Sweden (44), and in other well-nourished populations (79, 87).
9.2 Strengths and limitations
A major strength of this thesis was that the body composition of the parents and infants was
measured using accurate body composition methodology (50, 62). Furthermore, mothers and
infants were measured within a narrow time frame. This is especially important for infants,
who grow very rapidly during the first weeks of life (44, 80). Finally, several previous studies
have investigated sex differences only by stratifying the results by sex (33, 81-83). In this
thesis, sex interactions were statistically tested, which can be considered to be a more
satisfactory way of identifying sex differences.
A potential limitation is that the weight and composition of the foetus contribute to the weight
and composition of the pregnant women, which may have influenced the results. Previous
studies show that the weight and FM content of the foetus in gestational weeks 31-32 are
approximately 1.65 ± 0.17 kg (29) and 6 % (88), respectively. Consequently, the contribution
of FM from the foetus is small, on average circa 100 g, representing only about 0.4 % of the
FM of the average women in this study. Furthermore, foetal weight is mainly FFM (88), and
the variation in foetal weight (SD = 0.17 kg) (29) is small in relation to the variation in FFM
(SD=5.3 kg) of our women in gestational week 32. Hence, it is unlikely that the contributions
of FM and FFM from the foetus have affected the results of this thesis in any important way.
45

It is impossible to differentiate between the effects of preconceptional body composition and
body composition changes during pregnancy. However, as indicated in Paper II, FFM (kg)
and FM (% and kg) before pregnancy, in a previous study, were closely correlated (r≥0.9) to
the corresponding values in week 32. Furthermore, it may be relevant to consider that some of
the fathers in the studies may not have been biological fathers (i.e. paternal discrepancy).
However, this phenomenon is not very common in populations with high socioeconomic
status such as ours (89). Also, the study included collection of DNA from both parents, who
were of course informed of that before participation. Hence, it is not likely that paternal
discrepancy represents a major issue in this thesis. Further, the sample size in Paper IV was
relatively small for a genetic study. Hence, the findings regarding a relationship between FTO
genotype and infant length, especially for boys, need confirmation. Finally, many hypothesis
tests were conducted, increasing the risk of type 1 errors.
9.3 Prediction of thoracic gas volume in gestational week 32 (Paper I)
Predicting TGV, using an equation developed for non-pregnant women, overestimated TGV
in gestational week 32. Further, the Bland-Altman evaluation (Figure 2b) showed that the
bias introduced by using such predicted TGV was affected by the size of TGV. Similar biases
have also been presented by Minderico et al. in obese non-pregnant women (72). Since only
40% of TGV is added to the measured BV (48, 50), the overestimation in BV using predicted
TGV is relatively small, corresponding to 75 ml on average. Consequently, the effect on body
composition results was also relatively small. Indeed, the overestimation of FM corresponded
to only 0.5 % FM, and as shown in Figure 4b there was no evidence that this overestimation
was affected by maternal %FM. As discussed in Paper I, the correlation between FMpredTGV
(%) and FMmeasTGV (%) and its standard error of the estimate in this study were very similar to
corresponding figures for non-pregnant women (67, 90). It can thus be argued that predicting
TGV is as applicable for pregnant women as it is for non-pregnant women. Consequently,
predicting TGV when applying ADP in gestational week 32, using an equation developed for
non-pregnant women, yields results for BV and FM with a very slight, and for many
purposes unimportant, overestimation.
46

9.4 Parental body composition versus infant size and body composition (Paper II)
An important finding was that the FFM of both mothers and fathers was positively related to
infant FFM and weight at 1 week of age. These results are in accordance with previous studies
where maternal FFM was found to be positively related to infant birth weight (91-93). The
findings in this thesis contribute additional knowledge, since it was demonstrated that it was
the FFM of infants, rather than the FM, that is related to maternal FFM. Given the present
results, it is possible that the reported positive association between maternal BMI and infant
birth weight (91-93) may to a large extent be due to an effect of the FFM rather than the FM
of the mother. Further, Starling et al. found that maternal BMI was associated with both infant
FM and FFM (19). Given the association between maternal and infant FFM identified in this
thesis, it is reasonable to suggest that it is the FFM component of the BMI that is related to
infant FFM. To my knowledge, associations between paternal and infant FFM have not been
investigated before. Thus, the finding regarding a postive relationship between the FFM of
fathers and their infants is novel and needs confirmation in further studies. The effect size
regarding the association between maternal FFM and infant FFM was 171 % of the
corresponding effect size for the association between paternal and infant FFM. This can be
reconciled with findings showing that maternal weight has a larger influence on birth weight
than the weight of the father (94). Such differences between mothers and fathers may be due
to the intrauterine influence on foetal growth. Also, genetic factors may be of importance
regarding how parental FFM influences infant FFM.
It is noteworthy that no significant relationships were identified between maternal and infant
FM when girls and boys were analysed together. This is in agreement with the results of Butte
et al. (24), which to my knoweldge is the largest study in this area that has applied accurate
body composition methodology both in mothers and infants. The finding that maternal FM
was positively related to infant FM only in girls can be reconciled with the results presented
by Lingwood et al. (20). Also, it may be possible that previous observations regarding a
higher body fatness of infants born to women with a high BMI (17-19) can be explained by a
relationship between the FM of mothers and daughters.
47

9.5 Glucose homeostasis variables in gestational week 32 versus maternal and
infant body composition (Paper III)
All glucose homeostasis variables in the study were correlated with the FMI of the women
and also with their FFMI. Interestingly, for insulin and HOMA-IR, correlations with FMI
were especially strong, and stronger than corresponding correlations with FFMI. This is in
agreement with the contention that body fatness (as in obesity) increases insulin resistance
and the concentration of insulin in blood. The positive relationships between HOMA-
IR/insulin in gestational week 32 and the FM of infant girls are of interest regarding the
observed positive relationship between the FM of mothers and their infant girls. As shown in
Table 8, this relationship was no longer significant when maternal HOMA-IR was included in
the regression model. A possible interpretation of this observation is that the relationship
between mothers' and daughters' FM is mediated by maternal insulin resistance. An increased
insulin resistance is considered to be part of the physiological response to pregnancy for the
purpose of directing glucose to the foetus. A previous study showed a positive relationship
between the plasma glucose concentration and placental weight for women carrying a female
foetus but not for women with a male foetus (95). Since the weight of the placenta is
commonly associated with its capacity to transport glucose and other nutrients from mother to
foetus (96), placental growth may represent a mechanism by which an increased maternal
insulin-resistence results in increased FM of infant girls, but not of infant boys. Furthermore,
the results of Simón-Muela et al. (33) may be of interest, since these authors found that
insulin concentrations in cord blood were positively related to skinfold thickness in newborn
girls, but not in newborn boys. It may also be relevant to note results from an Indian study in
which girls of mothers with diabetes had larger skinfolds at 2 and 5 (81) as well as at 9.5
years of age (82) than had girls of healthy mothers. Conversely, no such difference was found
for boys. These observations suggest that the observed sex difference may also persist during
childhood, although it should be noted that the study by Krishnevi et al. (81, 82) was small.
The observed inverse relationship between the serum concentration of IGFBP-1 in the
maternal circulation and infant birth weight is in accordance with the two previously
conducted studies (28, 29) in this area. A new observation from the present study is that
IGFBP-1 was related to the FM component of infant weight. Clearly, there is a need for future
studies investigating how IGFBP-1 affects foetal size and body composition.
48

9.6 FTO genotype versus infant size and body composition (Paper IV)
The results relating variation in the FTO gene to infant size and body composition can be
compared to previous studies. In the present study no associations were observed between the
FTO genotype and infant body fatness, which is in agreement with results in 6-month-old
infants reported by Mook-Kanamori et al. (42). However, the results disagree with those of
López-Bermejo et al. (45), who found an association between the FTO genotype and FM at 2
weeks of age. Another finding in the present study was the significant association between the
FTO genotype and infant length, which appeared to be particularly strong for boys. Earlier
studies have shown no such relationship (45), although one study (97), which used a risk
score based on several obesity-associated loci including FTO (rs9939609), showed this score
to be associated with length as early as at 6 weeks of age.
9.7 General discussion
The observed associations between parental factors and infant FFM and FFM were relatively
weak, explaining less than 10 % of the variation in infant size or body composition. This is
rather expected given the results of comparable studies in the field (20, 98). The magnitude of
the effect of variations in parental variables on infant body composition can be calculated
based on the information presented in Tables 3-6 and Figures 5-6. For example, a difference
in maternal and paternal FFM, both equivalent to 1 SD, corresponds to a difference of 144 g
FFM (0.42 SD) in their infants. Similarly, 1 SD difference in maternal FM and HOMA-IR
was associated with a difference in FM of infant girls corresponding to 43 g (0.25 SD) and 53
g (0.31 SD), respectively. Thus, although the identified associations are probably less useful
on an individual level, they may well be of importance in a population perspective.
This thesis has presented several relationships involving infant body composition which may
be of importance in relation to obesity development and/or health later in life. For instance,
parental FFM was related to infant FFM and maternal FM was related to the FM of infant
girls. These relationships may be of relevance in relation to body composition development.
However, there is a lack of longitudinal data relating body composition in infancy to later
body composition. To my knowledge, the longest follow-up of body composition data at birth
has been presented in the Southampton Women's Survey (8). In this study (8), birth FM was
positively, but quite weakly, related to FM at 6 years of age. Further, birth FFM was
positively related to FFM at 6 years of age. Although the results from the
49

Southampton Women's Survey were unadjusted and did not take into account important
covariates such as infant length (8), they suggest that body composition at birth may
contribute to later body composition. Also, it is important to note that factors during foetal life
may influence later obesity risk through other mechanism than the influence of infant FM on
later FM. One such potential mechanism may be through developmental programing of
appetite and energy balance (99).
Unpublished data from the infants in this thesis show that parental FFM is still positively
associated with infant FFM at 12 weeks of age. Furthermore, the relationship between
maternal FM and the FM of infant girls could still be identified at 12 weeks of age, but was
then slightly weaker. Further studies are needed to confirm the relationships between parental
and infant FFM as well as the relationship between maternal FM and the FM of infant girls,
and to investigate if these relationships remain later in life. The body composition of children
in the thesis is currently being assessed at 4.5 years of age and it may be relevant to publish
this data in conjunction with the 12-week data.
The influence of infant body size and growth on later body composition has been investigated
in several studies (13, 100). For example, accelerated growth during infancy is a well-known
risk factor for later obesity (100), and a previous study showed that infants with an increased
genetic risk for obesity grew more rapidly (97). Thus, the observed association between the
FTO genotype and infant length observed in this thesis may be relevant in relation to obesity
development. Another interesting finding was that parental FFM was positively related to
infant weight (and FFM). Previous studies have shown that birth weight is positively related
to FFM both in childhood and adulthood (13). Hence, it is conceivable that the associations
between parental and infant FFM are maintained later in life. In this context it may be relevant
to note that a low FFMI has been associated with higher all-cause mortality in adulthood (14).
Therefore it is possible that the relationships between parental and infant FFM identified in
this thesis are relevant in relation to human health.
50

10. CONCLUSIONS
Using TGV predicted by an equation developed for non-pregnant women when applying ADP
in gestational week 32 overestimated % FM. This overestimation was small and therefore
probably unimportant in many situations (Paper I).
The FFM of parents was positively related to weight and the FFM of their 1-week-old infants
and this relationship may well be relevant in a population perspective (Paper II).
Maternal FM in gestational week 32 was positively related to the FM of their 1-week-old
infant daughters, while no such relationship was found for sons (Paper II).
Variables describing body composition (BMI, FM, FMI, FFMI) of women in gestational
week 32 were all related to glucose homeostasis variables (glucose, insulin, HOMA-IR,
HbA1c, IGFBP-1) in their circulation. The associations between variables describing body
fatness (BMI, FM and FMI) and insulin/HOMA-IR were positive and particularly strong
(Paper III).
Glucose homeostasis variables in the circulation of the mothers, when pregnant in gestational
week 32, were positively (glucose, insulin, HOMA-IR) and negatively (IGFBP-1) related to
the weight and FM of their 1-week-old infants (Paper III).
Insulin resistance (measured as HOMA-IR) of the mothers in gestational week 32 was
positively related to the FM of infant daughters, but not to the FM of infant sons. The results
suggest that insulin resistance mediates the positive association between the FM of mothers
and daughters identified in paper II (Paper III).
Variation in the FTO genotype was not related to infant FM or BMI. However, the number of
risk-alleles at the FTO locus rs9939609 was positively related to infant length at 1 and 12
weeks of age, relationships which may be stronger in boys than in girls (Paper IV).
51
11. FUTURE PERSPECTIVES
Results from this thesis have provided new information regarding associations between body
composition of parents and their infants. Also, results have been presented regarding
associations of maternal glucose homeostasis and the FTO genotype with infant size and body
composition. However, knowledge regarding factors that influence infant body composition
and the effect infant body composition has on later body composition is limited. Thus,
additional studies in this area are needed.
Studies investigating potential mechanisms explaining relationships between maternal and
infant body composition are motivated. In particular, the mechanism underlying the observed
association between maternal FM and the FM of infant girls may be of special interest.
The studies in this thesis were conducted to investigate determinants of infant body
composition, which may be of relevance for obesity development and future health. To clarify
the significance of relationships between parental factors and offspring body composition,
there is a need for future longitudinal studies investigating such relationships beyond infancy.
Such future studies may consider the following aspects:
Firstly, forthcoming studies should be relatively large, since associations between parental
factors and infant body composition in this thesis, as well as in previous research, tend to be
relatively weak (20, 98).
Secondly, an association between the FFM of fathers and their infants was observed in this
thesis. This can reconciled with previous cross-sectional studies which have identified
associations between fathers and their children regarding their body composition or BMI
(101, 102). Thus, the investigation of paternal influences on offspring body composition
should be considered in future studies.
Thirdly, evidence that maternal FM and insulin-resistance. as well as genetics, may affect size
and body composition of infant girls and boys differently has been presented in this thesis and
in previous studies (20, 33, 81-83). Hence, the investigation of potential sex differences may
be considered in forthcoming studies.
52

Finally, future studies investigating associations between parental variables and offspring
body composition should be conducted using valid body composition methods. ADP
represents attractive methodology in this respect since it provides a possibility to measure
parents (50), infants (62) and children (103) accurately. Since the measurement procedures in
Bod Pod and Pea Pod are standardised and relatively robust, these devices may be suitable for
multicentre studies. Also, it is possible that some of the data obtained by cohort studies using
ADP (17, 19, 44, 79, 87) may be useful in meta-analyses.
To the best of my knowledge, PATHOS is the largest study so far that applies ADP in parents
and their infants, and this study may provide a basis for future studies. The children in
PATHOS are currently being investigated at 4.5 years of age, when their body composition is
measured using ADP as previously described (104). To date (April 2015), approximately 165
children have been examined, and based on preliminary data we expect a participation rate of
circa 85 %. My hope is that the children in PATHOS will also be investigated in adolescence
and adulthood, which may provide further knowledge regarding longitudinal relationships of
body composition in parents and their offspring.
53

12. ACKNOWLEDGEMENTS
First of all I would like to express my deepest gratitude to all the families who participated in
this study during a very delicate and sensitive time. I am so thankful for all the time and
effort you invested. Without you this thesis would not have been possible.
I would also like to thank:
The Department of Clinical and Experimental Medicine for giving me the opportunity to
conduct the studies in this thesis.
Elisabet Forsum, my supervisor, for sharing your expertise in this research area, for teaching
me the thoroughness of research, for always having time for me, and for your encouragement.
Marie Löf, my co-supervisor, for sharing your expertise in this research area, for many
constructive scientific discussions and for always being so considerate.
Peter Söderkvist, for your help regarding the genetic analysis and for always being positive
and helpful.
Eva Flinke Carlsson for all your help and for bringing joy to the office.
Britt Eriksson for introducing my to the world of PhD studies and for all the fun times we
have shared during these years.
Caroline Törnqvist for performing some of the infant measurements and for the many
enjoyable lunches we have had.
Åsa Schippert, Annette Molbaek, Naomi Yamada-Fowler for your assistance with the
genetic analysis, for patience with my limited lab experience, and for all the nice coffee
breaks at Cellbiologen.
54

Pia Cederholm, Ulla Hallström, Margareta Jönsson and all the staff at Kvinnohälsan,
Linköping, for your invaluable help regarding the recruitment of parents and infants.
Per Magnusson and the staff at Clinical Chemistry at the University Hospital, Linköping, for
the analyses of the blood samples.
Anna-Kristina Granat for analysing IGBFP-1 and Hans Arnqvist for valuable discussions
regarding IGFBP-1.
Eva Sofia Svensson for sharing her expertise in literature searches.
Christine Delisle for always being so helpful and for linguistic advice.
Katrin Bergström and Elin Rondahl for conducting some of the parental measurements.
Elin Johansson for analysing the FTO gene.
Ann-Christine Gilmore-Ellis, Martina Klefbeck, Chatarina Malm, Monica Hardmark,
Anette Wiklund, Annelie Munther, Gunilla Linghammar, Birgitta Öberg and Viveca
Axén for excellent help with administrative matters.
Erik Mård and Emad Saleh for valuable IT support.
Jane Wigertz and Maria Hedman for excellent linguistic advice.
Karl Wahlin for discussing statistical matters with me and providing relevant feedback.
Marie Blomberg, Elisabeth Olhager and Ann Josefsson for medical coverage.
Peter Bang and Magdalena Josefsson for providing valuable comments.
Ewa-Carin Sehlstedt, Kurt Bergh, Linda Hagfors, Agneta Hörnell, Inger Öhlund and all
of the staff at the Department of Food and Nutrition, Umeå University, for an excellent
education and for providing me with the confidence to undertake this thesis.
55

All my friends, especially Daniel Bello Henriksson, Jens Nilsson, Marcus Martinsson and
Martin Carlberg, for good times and for all your encouragement regarding this thesis.
My mother Susanne Henriksson and my late grandmother Mari-Anne Yliniemi and late
great grandmother Asta Henningsson for all your love and encouragement during my
childhood and for being such positive role models. Without you I do not think I would have
had the courage to undertake this thesis.
My father, Michael Henriksson, for your encouragement and for not giving up on me
despite my genuine disinterest in cars . My aunt, Ann-Charlotte Yliniemi, for your love
and consideration. Anders Hortlin, for being a great bonus grandfather and for all your
encouragement through the years.
My sister, Angelica Sundblad, for always being so considerate. My brother, Marcus
Henriksson, for your sense of humour and both of you for all the good times we have shared.
And to those I hold dearest:
My children, Elias and Siri, for bringing so much joy and meaning to my life. You are my
greatest achievement.
Hanna Henriksson, my wife, the love of my life, for loving me unconditionally, for your
kindness and for your constant support and encouragement. Life with you is always
wonderful.
The studies in this thesis were supported by grants from the Swedish Research Council
(project no. 15402), Research Council Formas (222-2006-614, 222-2008-1332), the Magnus
Bergvall Foundation, the Thuring Foundation, the Swedish Society of Medicine, the Medical
Faculty at Linköping University, and the County Council of Östergötland.
56
13. SAMMANFATTNING PÅ SVENSKA
Kroppssammansättning under spädbarnstiden kan vara av betydelse för senare hälsa och för
risken att utveckla fetma under barndomen. Utrustning som tillämpar så kallad
helkroppspletysmografi gör det möjligt att mäta kroppssammansättningen hos spädbarn (Pea
Pod) och vuxna (Bod Pod) på ett snabbt, tillförlitligt och icke-invasivt sätt. Syftet med denna
avhandling var att studera om föräldrars kroppssammansättning, moderns glukosomsättning
under graviditet och barnets egen genetik har samband med nyfödda barns storlek och
kroppssammansättning. Då helkroppspletysmografi används hos vuxna görs en korrigering
för lungvolym (TGV; thoracic gas volume). TGV kan predikteras med ekvationer som
utvecklats för icke-gravida vuxna. Ett ytterligare syfte var att undersöka om sådana
ekvationer kan användas under graviditet.
Blivande föräldrapar tillfrågades om deltagande i denna studie vid inskrivningsbesöket vid en
mödravårdscentral i Linköping, mellan september 2008 och oktober 2010. När modern var i
graviditetsvecka 32, bestämdes föräldrarnas kroppssammansättning (dvs andelen fett och
fettfri vikt i kroppen) och blodprov togs från modern för att undersöka hennes
glukosomsättning, bland annat HOMA-IR (homeostatic model assessment-insulin resistance).
Längd, vikt och kroppssammansättning hos friska och fullgångna (≥ 37 graviditetsveckor)
spädbarn undersöktes vid 1 och 12 veckors ålder. Totalt 211 barn ingick i studierna. Barnens
vikt och längd vid 1 års ålder rapporterades av föräldrarna. Salivprover togs från spädbarnen
för att erhålla DNA för bestämning av antalet riskanlag i den så kallade FTO-genen (fat mass
and obesity associated gene; locus rs9939609).
Resultat från 27 kvinnor visade att predikterad TGV ger en obetydlig överskattning (0,5 %)
av fettmassan. En ökning i den fettfria massan hos föräldrarna var associerad till mer fettfri
massa hos spädbarnen vid 1 veckas ålder. För varje kg mer fettfri massa hos mamman
innehöll barnen 15.6 g mer fettfri massa. Motsvarande siffra för sambandet mellan pappor
och barn var 9.1 g. Fettmassan hos pappor var ej associerad till spädbarnens fettmassa.
Däremot motsvarade varje kg mer fettmassa hos modern 5.8 g mer fettmassa hos döttrar vid 1
veckas ålder och en ökning av mammans insulinresistens, motsvarande en standardeviation
för hennes HOMA-IR, innebar då 52.7 g mer fettmassa hos döttrarna. Motsvarande samband
saknades för söner. Det fanns inga samband mellan antalet riskanlag i FTO-genen och
57

spädbarns fettmassa. Däremot var detta antal relaterat till längd hos spädbarn vid 1 och 12
veckors ålder och dessa samband tycktes vara starkare hos pojkar än hos flickor.
De resultat som presenteras i denna avhandling visar att: i) Användningen av predikterad
TGV vid tillämpning av helkroppspletysmografi i graviditetsvecka 32 överskattade
fettmassan mycket marginellt. Denna överskattning är förmodligen oviktig i många
situationer. ii) Samband mellan föräldrars och barns kroppssammansättning kan finnas tidigt i
livet. Exempelvis var föräldrarnas fettfria massa relaterad till den fettfria massan hos deras
spädbarn. Dessutom var moderns fettmassa och insulinresistens relaterat till fettmassan hos
döttrar, men ej hos söner. iii) FTO-genen har inget samband med fettmassan vid 1 och 12
veckors ålder men tycks då ha ett samband med barnens längd, särskilt hos pojkar.
Sammanfattningsvis visade denna avhandling att föräldrars kroppssammättning, mammans
glukosomsättning och barnets egen genetik var associerade till barnens storlek och
kroppssammansättning. Dessa samband kan vara av betydelse för barnens framtida
kroppssammansättning och hälsa. Då de observerade sambanden är relativt svaga är de inte
användbara för enskilda individer. De är dock tillräckligt starka för att kunna vara av
betydelse ur ett befolkningsperspektiv.
58

14. REFERENCES
1. World Health Organization. Childhood overweight and obesity. Internet: http://www.who.int/dietphysicalactivity/childhood/en/ (accessed April 1 2015).
2. Ng M, Fleming T, Robinson M, et al. Global, regional, and national prevalence of
overweight and obesity in children and adults during 1980-2013: a systematic analysis for the Global Burden of Disease Study 2013. Lancet 2014;384:766-81.
3. Freedman DS, Khan LK, Serdula MK, Dietz WH, Srinivasan SR, Berenson GS. The
relation of childhood BMI to adult adiposity: the Bogalusa Heart Study. Pediatrics 2005;115:22-7.
4. Public Health Agency of Sweden. Internet:
http://www.folkhalsomyndigheten.se/amnesomraden/statistik-och-undersokningar/enkater-och-undersokningar/nationella-folkhalsoenkaten/levnadsvanor/overvikt-och-fetma/ (accessed April 1 2015).
5. Braback L, Gunnel B, Ekholm L. [No further increase of obesity among Swedish 4-
year old children. Large regional differences indicate the significance of socioeconomic factors]. Lakartidningen 2009;106:2758-61.
6. Timpka T, Angbratt M, Bolme P, Hermansson G, Hager A, Valter L. A high-
precision protocol for identification of preschool children at risk for persisting obesity. PLoS One 2007;2:e535.
7. Barker DJ. Maternal nutrition, fetal nutrition, and disease in later life. Nutrition
1997;13:807-13.
8. Crozier SR, Inskip HM, Godfrey KM, et al. Weight gain in pregnancy and childhood
body composition: findings from the Southampton Women's Survey. Am J Clin Nutr 2010;91:1745-51.
9. Risnes KR, Vatten LJ, Baker JL, et al. Birthweight and mortality in adulthood: a
systematic review and meta-analysis. Int J Epidemiol 2011;40:647-61.
10. Wells J. The programming effects of early growth. Early Hum Dev 2007;83:743-8.
11. Mu M, Wang SF, Sheng J, et al. Birth weight and subsequent blood pressure: a meta-
analysis. Arch Cardiovasc Dis 2012;105:99-113.
59

12. Yu ZB, Han SP, Zhu GZ, et al. Birth weight and subsequent risk of obesity: a systematic review and meta-analysis. Obes Rev 2011;12:525-42.
13. Wells JC, Chomtho S, Fewtrell MS. Programming of body composition by early
growth and nutrition. Proc Nutr Soc 2007;66:423-34.
14. Bigaard J, Frederiksen K, Tjonneland A, et al. Body fat and fat-free mass and all-
cause mortality. Obes Res 2004;12:1042-9.
15. Singhal A, Wells J, Cole TJ, Fewtrell M, Lucas A. Programming of lean body mass: a
link between birth weight, obesity, and cardiovascular disease? Am J Clin Nutr 2003;77:726-30.
16. Yajnik CS, Fall CH, Coyaji KJ, et al. Neonatal anthropometry: the thin-fat Indian
baby. The Pune Maternal Nutrition Study. Int J Obes Relat Metab Disord 2003;27:173-80.
17. Hull HR, Dinger MK, Knehans AW, Thompson DM, Fields DA. Impact of maternal
body mass index on neonate birthweight and body composition. Am J Obstet Gynecol 2008;198:416 e1-6.
18. Sewell MF, Huston-Presley L, Super DM, Catalano P. Increased neonatal fat mass,
not lean body mass, is associated with maternal obesity. Am J Obstet Gynecol 2006;195:1100-3.
19. Starling AP, Brinton JT, Glueck DH, et al. Associations of maternal BMI and
gestational weight gain with neonatal adiposity in the Healthy Start study. Am J Clin Nutr 2015;101:302-9.
20. Lingwood BE, Henry AM, d'Emden MC, et al. Determinants of body fat in infants of
women with gestational diabetes mellitus differ with fetal sex. Diabetes Care 2011;34:2581-5.
21. L'Abee C, Vrieze I, Kluck T, Erwich JJ, Stolk RP, Sauer PJ. Parental factors affecting
the weights of the placenta and the offspring. J Perinat Med 2011;39:27-34.
22. Flegal KM, Shepherd JA, Looker AC, et al. Comparisons of percentage body fat,
body mass index, waist circumference, and waist-stature ratio in adults. Am J Clin Nutr 2009;89:500-8.
23. Lindsay CA, Huston L, Amini SB, Catalano PM. Longitudinal changes in the
relationship between body mass index and percent body fat in pregnancy. Obstet Gynecol 1997;89:377-82.
60

24. Butte NF, Ellis KJ, Wong WW, Hopkinson JM, Smith EO. Composition of gestational weight gain impacts maternal fat retention and infant birth weight. Am J Obstet Gynecol 2003;189:1423-32.
25. Hapo Study Cooperative Research Group. Hyperglycemia and Adverse Pregnancy
Outcome (HAPO) Study: associations with neonatal anthropometrics. Diabetes 2009;58:453-9.
26. Friis CM, Qvigstad E, Paasche Roland MC, et al. Newborn body fat: associations
with maternal metabolic state and placental size. PLoS One 2013;8:e57467.
27. Murphy LJ. The role of the insulin-like growth factors and their binding proteins in
glucose homeostasis. Exp Diab Res 2003;4:213-24.
28. Asvold BO, Eskild A, Jenum PA, Vatten LJ. Maternal concentrations of insulin-like
growth factor I and insulin-like growth factor binding protein 1 during pregnancy and birth weight of offspring. Am J Epidemiol 2011;174:129-35.
29. Olausson H, Lof M, Brismar K, Lewitt M, Forsum E, Sohlstrom A. Longitudinal
study of the maternal insulin-like growth factor system before, during and after pregnancy in relation to fetal and infant weight. Horm Res 2008;69:99-106.
30. Eriksson B, Lof M, Olausson H, Forsum E. Body fat, insulin resistance, energy
expenditure and serum concentrations of leptin, adiponectin and resistin before, during and after pregnancy in healthy Swedish women. Br J Nutr 2010;103:50-7.
31. Olausson H, Lof M, Brismar K, Forsum E, Sohlstrom A. Maternal serum
concentrations of insulin-like growth factor (IGF)-I and IGF binding protein-1 before and during pregnancy in relation to maternal body weight and composition and infant birth weight. Br J Nutr 2010;104:842-8.
32. Hapo Study Cooperative Research Group. Hyperglycaemia and Adverse Pregnancy
Outcome (HAPO) Study: associations with maternal body mass index. Bjog 2010;117:575-84.
33. Simon-Muela I, Naf S, Ballesteros M, et al. Gender determines the actions of
adiponectin multimers on fetal growth and adiposity. Am J Obstet Gynecol 2013;208:481 e1-7.
34. Elks CE, den Hoed M, Zhao JH, et al. Variability in the heritability of body mass
index: a systematic review and meta-regression. Front Endocrinol (Lausanne) 2012;3:29.
61

35. Maes HH, Neale MC, Eaves LJ. Genetic and environmental factors in relative body weight and human adiposity. Behav Genet 1997;27:325-51.
36. Loos RJ. Genetic determinants of common obesity and their value in prediction. Best
Pract Res Clin Endocrinol Metab 2012;26:211-26.
37. Loos RJ, Yeo GS. The bigger picture of FTO: the first GWAS-identified obesity gene.
Nat Rev Endocrinol 2014;10:51-61.
38. Frayling TM, Timpson NJ, Weedon MN, et al. A common variant in the FTO gene is
associated with body mass index and predisposes to childhood and adult obesity. Science 2007;316:889-94.
39. Kilpelainen TO, Qi L, Brage S, et al. Physical activity attenuates the influence of FTO
variants on obesity risk: a meta-analysis of 218,166 adults and 19,268 children. PLoS Med 2011;8:e1001116.
40. Hakanen M, Raitakari OT, Lehtimaki T, et al. FTO genotype is associated with body
mass index after the age of seven years but not with energy intake or leisure-time physical activity. J Clin Endocrinol Metab 2009;94:1281-7.
41. Kaakinen M, Laara E, Pouta A, et al. Life-course analysis of a fat mass and obesity-
associated (FTO) gene variant and body mass index in the Northern Finland Birth Cohort 1966 using structural equation modeling. Am J Epidemiol 2010;172:653-65.
42. Mook-Kanamori DO, Ay L, Hofman A, et al. No association of obesity gene FTO
with body composition at the age of 6 months. The Generation R Study. J Endocrinol Invest 2011;34:16-20.
43. Sovio U, Mook-Kanamori DO, Warrington NM, et al. Association between common
variation at the FTO locus and changes in body mass index from infancy to late childhood: the complex nature of genetic association through growth and development. PLoS Genet 2011;7:e1001307.
44. Eriksson B, Lof M, Forsum E. Body composition in full-term healthy infants
measured with air displacement plethysmography at 1 and 12 weeks of age. Acta Paediatr 2010;99:563-8.
45. Lopez-Bermejo A, Petry CJ, Diaz M, et al. The association between the FTO gene
and fat mass in humans develops by the postnatal age of two weeks. J Clin Endocrinol Metab 2008;93:1501-5.
46. Heymsfield SB, Lohman TG, Wang ZM, SB. G. Human Body Composition. Leeds,
UK: Human Kinetics, 2005.
62

47. Wells JC, Fewtrell MS. Measuring body composition. Arch Dis Child 2006;91:612-7.
48. Dempster P, Aitkens S. A new air displacement method for the determination of
human body composition. Med Sci Sports Exerc 1995;27:1692-7.
49. Urlando A, Dempster P, Aitkens S. A new air displacement plethysmograph for the
measurement of body composition in infants. Pediatr Res 2003;53:486-92.
50. Fields DA, Goran MI, McCrory MA. Body-composition assessment via air-
displacement plethysmography in adults and children: a review. Am J Clin Nutr 2002;75:453-67.
51. Fomon SJ, Haschke F, Ziegler EE, Nelson SE. Body composition of reference
children from birth to age 10 years. Am J Clin Nutr 1982;35:1169-75.
52. Wells JC, Fuller NJ, Dewit O, Fewtrell MS, Elia M, Cole TJ. Four-component model
of body composition in children: density and hydration of fat-free mass and comparison with simpler models. Am J Clin Nutr 1999;69:904-12.
53. Eriksson B, Lof M, Eriksson O, Hannestad U, Forsum E. Fat-free mass hydration in
newborns: assessment and implications for body composition studies. Acta Paediatr 2011;100:680-6.
54. Andersen GS, Girma T, Wells JC, et al. Body composition from birth to 6 mo of age
in Ethiopian infants: reference data obtained by air-displacement plethysmography. Am J Clin Nutr 2013;98:885-94.
55. Hytten FE, Chamberlain G. Clinical Physiology in Obstetrics. Oxford, UK: Blackwell
Scientific Publications, 1980.
56. van Raaij JM, Peek ME, Vermaat-Miedema SH, Schonk CM, Hautvast JG. New
equations for estimating body fat mass in pregnancy from body density or total body water. Am J Clin Nutr 1988;48:24-9.
57. Institute of Medicine and National Research Council. Weight gain during pregnancy -
reexaming the guidelines. In: Rasmussen KM, Yaktine AL, eds. Washington, D.C.: The National Academies Press, 2009.
58. Food and Agricultural Organization of the United Nations. Energy requirements of
pregnancy. In Human Energy Requirements; Report of a Joint FAO/WHO/UNU Expert Consultation, Food and Nutrition Technical Report Series 1; Food and Agricultural Organization of the United Nations: Rome, Italy, 2004; pp. 53–62.
63

59. Forsum E, Henriksson P, Lof M. The two-component model for calculating total body fat from body density: an evaluation in healthy women before, during and after pregnancy. Nutrients 2014;6:5888-99.
60. Hopkinson JM, Butte NF, Ellis KJ, Wong WW, Puyau MR, Smith EO. Body fat
estimation in late pregnancy and early postpartum: comparison of two-, three-, and four-component models. Am J Clin Nutr 1997;65:432-8.
61. Ginde SR, Geliebter A, Rubiano F, et al. Air displacement plethysmography:
validation in overweight and obese subjects. Obes Res 2005;13:1232-7.
62. Ellis KJ, Yao M, Shypailo RJ, Urlando A, Wong WW, Heird WC. Body-composition
assessment in infancy: air-displacement plethysmography compared with a reference 4-compartment model. Am J Clin Nutr 2007;85:90-5.
63. Ma G, Yao M, Liu Y, et al. Validation of a new pediatric air-displacement
plethysmograph for assessing body composition in infants. Am J Clin Nutr 2004;79:653-60.
64. Davis JA, Dorado S, Keays KA, Reigel KA, Valencia KS, Pham PH. Reliability and
validity of the lung volume measurement made by the BOD POD body composition system. Clin Physiol Funct Imaging 2007;27:42-6.
65. Crapo RO, Morris AH, Clayton PD, Nixon CR. Lung volumes in healthy nonsmoking
adults. Bull Eur Physiopathol Respir 1982;18:419-25.
66. Higgins PB, Silva AM, Sardinha LB, et al. Validity of new child-specific thoracic gas
volume prediction equations for air-displacement plethysmography. BMC Pediatr 2006;6:18.
67. McCrory MA, Mole PA, Gomez TD, Dewey KG, Bernauer EM. Body composition
by air-displacement plethysmography by using predicted and measured thoracic gas volumes. J Appl Physiol 1998;84:1475-9.
68. De Swiet M. The respiratory system. In: Chamberlain G, Broughton Pipkin F, eds.
Clinical Physiology in Obstetrics. Oxford: Blackwell Science, 1998:111-28.
69. Hegewald MJ, Crapo RO. Respiratory physiology in pregnancy. Clin Chest Med
2011;32:1-13, vii.
70. Jörgensen C. Fetometri och graviditetsbestämning. In: Sjöberg SO, ed. Obstetriska
ultraljud. Västerås: Västra Aros tryckeri AB, 1997:37-44.
64

71. Ulijaszek SJ, Kerr DA. Anthropometric measurement error and the assessment of nutritional status. Br J Nutr 1999;82:165-77.
72. Minderico CS, Silva AM, Fields DA, et al. Changes in thoracic gas volume with air-
displacement plethysmography after a weight loss program in overweight and obese women. Eur J Clin Nutr 2008;62:444-50.
73. Siri W. Body composition from fluid spaces and density: analysis of methods. In:
Brozek J, Henschel A, eds. Techniques for measuring body composition. Washington DC: Natl Acad Sciences/Natl Res Council, 1961:223-24.
74. Jeppsson JO, Kobold U, Barr J, et al. Approved IFCC reference method for the
measurement of HbA1c in human blood. Clin Chem Lab Med 2002;40:78-89.
75. Matthews DR, Hosker JP, Rudenski AS, Naylor BA, Treacher DF, Turner RC.
Homeostasis model assessment: insulin resistance and beta-cell function from fasting plasma glucose and insulin concentrations in man. Diabetologia 1985;28:412-9.
76. Bland JM, Altman DG. Statistical methods for assessing agreement between two
methods of clinical measurement. Lancet 1986;1:307-10.
77. Kleinbaum DG, Kupper LL, Nizam A, Muller KE. Applied regression analysis and
other multivariable methods: Thomson, 2008.
78. Andersen GS, Girma T, Wells JC, Kaestel P, Michaelsen KF, Friis H. Fat and fat-free
mass at birth: air displacement plethysmography measurements on 350 Ethiopian newborns. Pediatr Res 2011;70:501-6.
79. Fields DA, Gilchrist JM, Catalano PM, Gianni ML, Roggero PM, Mosca F.
Longitudinal body composition data in exclusively breast-fed infants: a multicenter study. Obesity (Silver Spring) 2011;19:1887-91.
80. Niklasson A, Albertsson-Wikland K. Continuous growth reference from 24th week of
gestation to 24 months by gender. BMC Pediatr 2008;8:8.
81. Krishnaveni GV, Hill JC, Leary SD, et al. Anthropometry, glucose tolerance, and
insulin concentrations in Indian children: relationships to maternal glucose and insulin concentrations during pregnancy. Diabetes Care 2005;28:2919-25.
82. Krishnaveni GV, Veena SR, Hill JC, Kehoe S, Karat SC, Fall CH. Intrauterine
exposure to maternal diabetes is associated with higher adiposity and insulin resistance and clustering of cardiovascular risk markers in Indian children. Diabetes Care 2010;33:402-4.
65

83. Jacobsson JA, Danielsson P, Svensson V, et al. Major gender difference in association of FTO gene variant among severely obese children with obesity and obesity related phenotypes. Biochem Biophys Res Commun 2008;368:476-82.
84. Public Health Agency of Sweden. Internet:
http://www.folkhalsomyndigheten.se/amnesomraden/livsvillkor-och-levnadsvanor/folkhalsans-utveckling-malomraden/ekonomiska-och-sociala-forutsattningar/utbildningsniva/ (accessed April 1 2015).
85. Swedish maternity care registry. Internet: www.ucr.uu.se/mhv/index.php/arsrapporter
(accessed April 1 2015).
86. The National Board of Health and Welfare. Internet:
http://www.socialstyrelsen.se/Lists/Artikelkatalog/Attachments/19537/2014-9-37.pdf (accessed April 1 2015).
87. Carberry AE, Colditz PB, Lingwood BE. Body composition from birth to 4.5 months
in infants born to non-obese women. Pediatr Res 2010;68:84-8.
88. Widdowson EM. Changes in body proportions and composition during growth. In:
Davis JAE, Dobbing JE, eds. Scientific foundations of paediatrics: Heinemann Medical, 1981:330-42.
89. Bellis MA, Hughes K, Hughes S, Ashton JR. Measuring paternal discrepancy and its
public health consequences. J Epidemiol Community Health 2005;59:749-54.
90. Demerath EW, Guo SS, Chumlea WC, Towne B, Roche AF, Siervogel RM.
Comparison of percent body fat estimates using air displacement plethysmography and hydrodensitometry in adults and children. Int J Obes Relat Metab Disord 2002;26:389-97.
91. Farah N, Stuart B, Donnelly V, Kennelly MM, Turner MJ. The influence of maternal
body composition on birth weight. Eur J Obstet Gynecol Reprod Biol 2011.
92. Kulkarni B, Shatrugna V, Balakrishna N. Maternal lean body mass may be the major
determinant of birth weight: A study from India. Eur J Clin Nutr 2006;60:1341-4.
93. Sanin Aguirre LH, Reza-Lopez S, Levario-Carrillo M. Relation between maternal
body composition and birth weight. Biol Neonate 2004;86:55-62.
94. Griffiths LJ, Dezateux C, Cole TJ. Differential parental weight and height
contributions to offspring birthweight and weight gain in infancy. Int J Epidemiol 2007;36:104-7.
66

95. Roland MC, Friis CM, Godang K, Bollerslev J, Haugen G, Henriksen T. Maternal factors associated with fetal growth and birthweight are independent determinants of placental weight and exhibit differential effects by fetal sex. PLoS One 2014;9:e87303.
96. Brett KE, Ferraro ZM, Yockell-Lelievre J, Gruslin A, Adamo KB. Maternal-fetal
nutrient transport in pregnancy pathologies: the role of the placenta. Int J Mol Sci 2014;15:16153-85.
97. Elks CE, Loos RJ, Sharp SJ, et al. Genetic markers of adult obesity risk are associated
with greater early infancy weight gain and growth. PLoS Med 2010;7:e1000284.
98. Knight B, Shields BM, Hill A, Powell RJ, Wright D, Hattersley AT. The impact of
maternal glycemia and obesity on early postnatal growth in a nondiabetic Caucasian population. Diabetes Care 2007;30:777-83.
99. Remmers F, Delemarre-van de Waal HA. Developmental programming of energy
balance and its hypothalamic regulation. Endocr Rev 2011;32:272-311.
100. Ong K, Loos R. Rapid infancy weight gain and subsequent obesity: Systematic
reviews and hopeful suggestions. Acta Paediatr 2006;95:904-8.
101. Ohlund I, Hernell O, Hornell A, Stenlund H, Lind T. BMI at 4 years of age is
associated with previous and current protein intake and with paternal BMI. Eur J Clin Nutr 2010;64:138-45.
102. Treuth MS, Butte NF, Ellis KJ, Martin LJ, Comuzzie AG. Familial resemblance of
body composition in prepubertal girls and their biological parents. Am J Clin Nutr 2001;74:529-33.
103. Fields DA, Allison DB. Air-displacement plethysmography pediatric option in 2-6
years old using the four-compartment model as a criterion method. Obesity (Silver Spring) 2012;20:1732-7.
104. Forsum E, Flinke Carlsson E, Henriksson H, Henriksson P, Lof M. Total body fat
content versus BMI in 4-year-old healthy Swedish children. J Obes 2013;2013:206715.
67


Papers
The articles associated with this thesis have been removed for copyright reasons. For more details about these see: http://urn.kb.se/resolve?urn=urn:nbn:se:liu:diva-117435