Bob Torkelson
50
-
Upload
audrey-anne -
Category
Entertainment & Humor
-
view
320 -
download
1
Transcript of Bob Torkelson


Sutter Home Winery was shut down during Prohibition. It remained abandoned until 1947, when it was purchased by Mario and John Trinchero. They were immigrant brothers from NYC whose family had long been active
in the Italian wine business.
Mario Trinchero
Mario and Mary Trinchero with their
children Bob, Vera and Roger

The 1950s and 1960s
Sutter Home WineryBob Trinchero

1972: While experimenting with new ways to make his Zinfandel more robust, Bob drew off some of his free-run juice and fermented it as a “white” wine. When the first vintage of Oeil de Pedrix (Eye of the Partridge) was released it became an instant hit and all 220
cases sold out.
1975: The family changed the name of their successful pink wine to White Zinfandel and in 1987, it became the best selling premium wine in the USA!
Roger, Mario, and Bob Trinchero

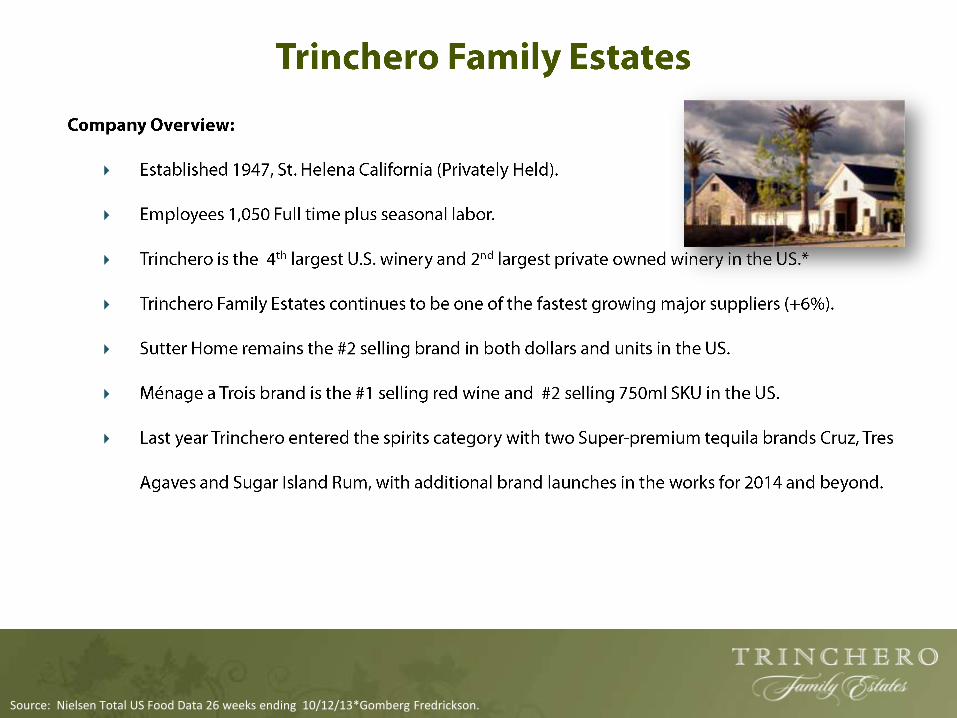
Source: Nielsen Total US Food Data 26 weeks ending 10/12/13*Gomberg Fredrickson.


Source: Nielsen: Total US Retail Plus 52 Wks Ending 11/9/13
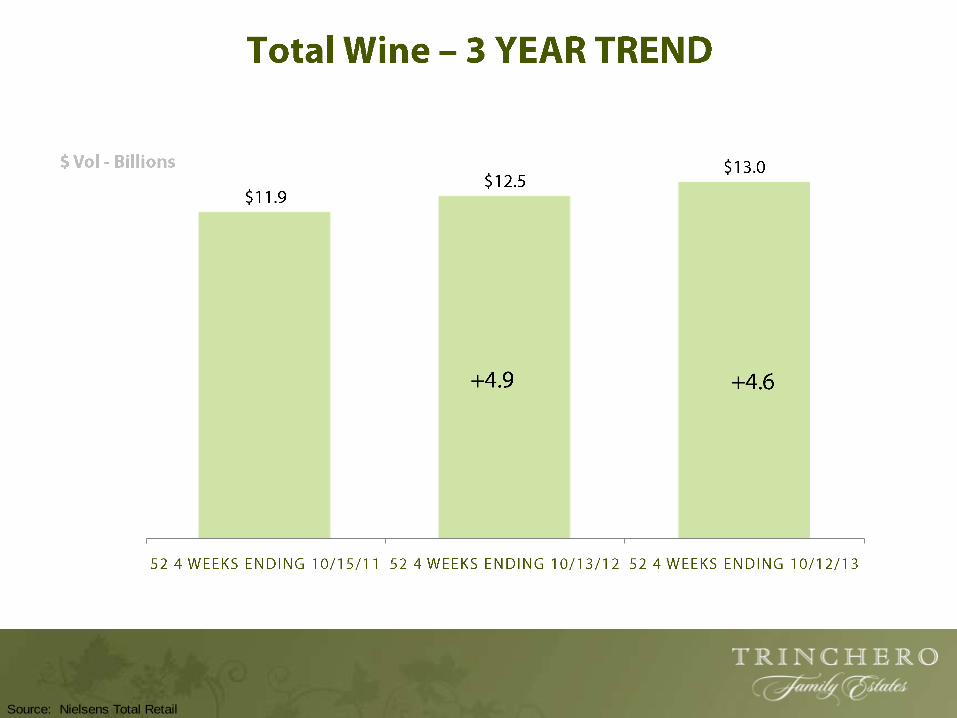
$10.0 $13.1
$30.7
$55.8
TTL SPIRITS TTL WINE TTL BEER TTL ALCH BEV
Source: Nielsens Total Retail
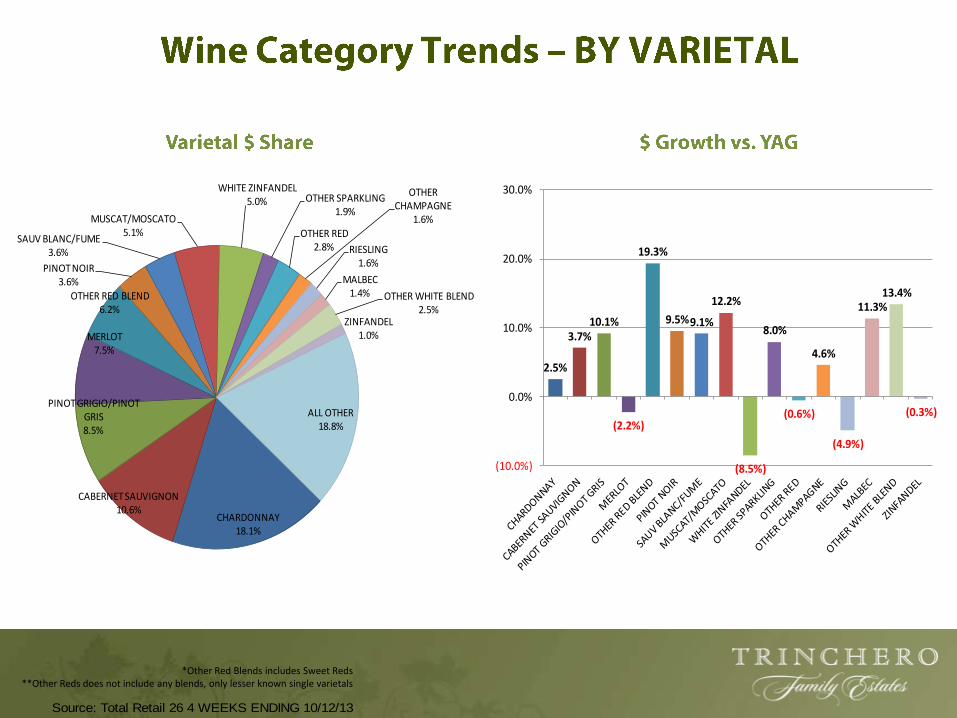
CHARDONNAY 18.1%
CABERNET SAUVIGNON 10.6%
PINOT GRIGIO/PINOT GRIS 8.5%
MERLOT 7.5%
OTHER RED BLEND 6.2%
PINOT NOIR 3.6%
SAUV BLANC/FUME 3.6%
MUSCAT/MOSCATO 5.1%
WHITE ZINFANDEL 5.0% OTHER SPARKLING
1.9%
OTHER RED 2.8%
OTHER CHAMPAGNE
1.6%
RIESLING 1.6%
MALBEC 1.4% OTHER WHITE BLEND
2.5%ZINFANDEL
1.0%
ALL OTHER18.8%
2.5%
3.7% 10.1%
(2.2%)
19.3%
9.5%9.1%
12.2%
(8.5%)
8.0%
(0.6%)
4.6%
(4.9%)
11.3%13.4%
(0.3%)
(10.0%)
0.0%
10.0%
20.0%
30.0%
*Other Red Blends includes Sweet Reds**Other Reds does not include any blends, only lesser known single varietals
Source: Total Retail 26 4 WEEKS ENDING 10/12/13


Source: Total Retail 26 4 WEEKS ENDING 10/12/13
750 MILLITERS , 67.9%
1.5 LITERS , 19.1%
5 LITERS , 4.1%3 LITERS , 3.6%
187 MILLITERS , 2.2%
4 LITERS , 1.1%
296 MILLITERS , 0.9%
500 MILLITERS , 0.6%
375 MILLITERS , 0.3%
1 LITERS , 0.3%
5.1%1.7% 3.8% 6.0% 5.1%
(3.2%)
(31.3%)
24.2%
(22.0%)
0.1%
(40.0%)
(30.0%)
(20.0%)
(10.0%)
0.0%
10.0%
20.0%
30.0%

$20+4.2%
$15-19.995.8%
$12-14.9910.7%
$9-11.9922.6%
$6-8.9914.5%
$3-5.9934.9%
$0-2.997.2%
14.8%
8.8%
11.9%10.6%
(2.8%)
1.2% 1.3%
(10.0%)
0.0%
10.0%
20.0%
Source: Total Retail 26 4 WEEKS ENDING 10/12/13

24%
17%
14%
5% 4%4%
2% 2% 1% 1% 1% 1% 1% 1% 1%
21.0%
0%
5%
10%
15%
20%
25%
E&J G
ALLO
THE W
INE G
RO
UP
CO
NSTELLA
TION
TRIN
CH
ERO
FAM
ILY
TREA
SUR
Y WIN
E ESTATES
DEU
TSCH
FAM
ILY
STE MIC
HELLE ESTA
TES
BA
NFI V
INTN
ERS
JAC
KSO
N FA
MILY W
INES
DFV
WIN
ES
PA
LM B
AY IN
TERN
TL
DIA
GEO
BR
ON
CO
WIN
E CO
MP
AN
Y
BO
GLE V
INEYA
RD
S
FETZER V
INEYA
RD
S
All O
thers
Total WineCases +0.6%
Source: Nielsen 52 weeks ending 10/12/13
E&J GALLO THE WINE
GROUP CONSTELLAT
ION TRINCHERO
FAMILY TREASURY
WINE ESTATES DEUTSCH FAMILY
STE MICHELLE ESTATES
BANFI VINTNERS
JACKSON FAMILY WINES
DFV WINES PALM BAY INTERNTL
DIAGEO BRONCO
WINE COMPANY
BOGLE VINEYARDS
FETZER VINEYARDS
Case Growth
1% -4% 5% 1% -1% 5% 7% -3% 4% 22% 0% -10% -19% 20% 0%
Price Change
$ 0.25 $ 0.16 $(0.05) $ 0.22 $ (0.12) $ 0.01 $ 0.28 $ 0.07 $(0.10) $ 0.24 $ 0.14 $ 0.53 $ 0.14 $(0.09) $ 0.07
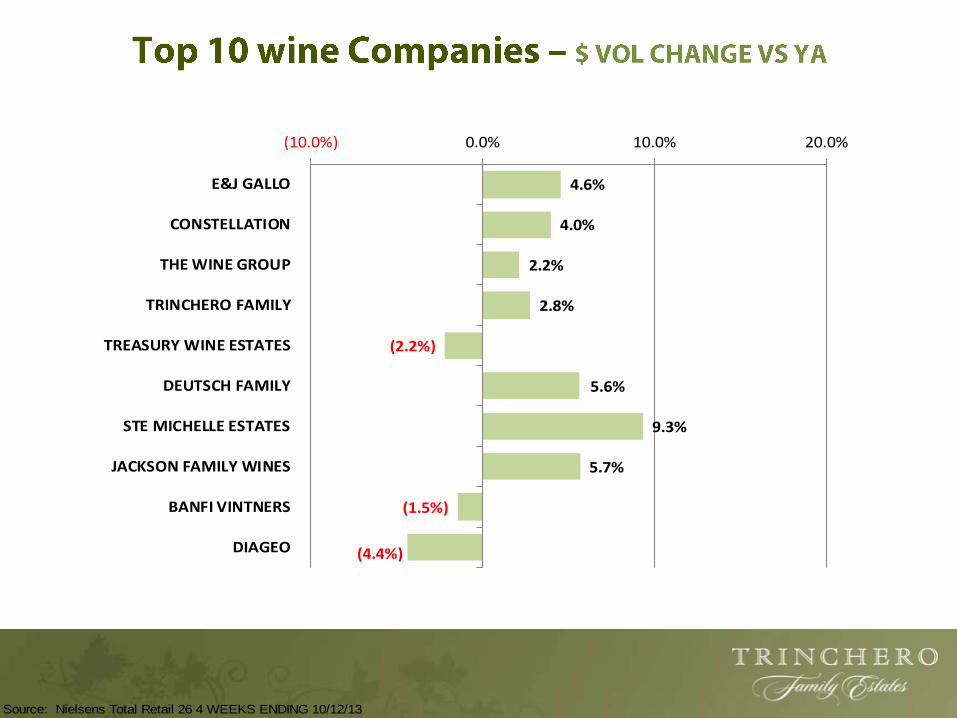
4.6%
4.0%
2.2%
2.8%
(2.2%)
5.6%
9.3%
5.7%
(1.5%)
(4.4%)
(10.0%) 0.0% 10.0% 20.0%
E&J GALLO
CONSTELLATION
THE WINE GROUP
TRINCHERO FAMILY
TREASURY WINE ESTATES
DEUTSCH FAMILY
STE MICHELLE ESTATES
JACKSON FAMILY WINES
BANFI VINTNERS
DIAGEO
Source: Nielsens Total Retail 26 4 WEEKS ENDING 10/12/13

•
•
•
•
•
•
•
•
Source: Total Retail 26 4 Weeks Ending 10/12/13

% Beer % Wine % Liquor
1994 71 14 13
2013 41 24 28
Change -30 10 15
Source: Gallup Poll, Aug. 2013

Key Bev-Al Category Trends
Consume Differently
• Nostalgic, Authentic, Local
• New is good; new brands, new flavors, new formats
Sweet and Decadent
• Sweeter wines(red blends, Moscatos) flavored spirits and liqueurs
• RTD Cocktails and mixers (pouch, glass, plastic)
Beyond Beer
• Premiumization; dark, craft, local
• Ciders, shandys, premium FMB’s
Source: Nielsen Scantrack - Total U.S. – All Outlets Combined ; 52 w/e 7-20-2013 versus prior year; UPC-coded; 119 categories (>$100MM annually)Bev Al; 52 w/e 5-25-2013; Nielsen Food, Drug, Mass, Walmart, Club, Dollar, Conv, MilitaryNote: Spirits excludes WA State

items
More Access Points
• Emerging channels; Convenience, Dollar Stores, Drug
• DTC, $1.46 B, growing at 10%
Source: Nielsen Scantrack - Total U.S. – All Outlets Combined ; 52 w/e 10-14-2013 versus prior year; UPC-coded; 119 categories (>$100MM annually)Bev Al; 52 w/e 5-25-2013; Nielsen Food, Drug, Mass, Walmart, Club, Dollar, Conv, MilitaryNote: Spirits excludes WA State

Key Retail Marketing Trends
Loyalty/Rewards Program
• E-coupons
• Fuel Rewards Programs
Private Label/Control Label
• Margin Makers
• Differentiation
Account Specific – Shopper Marketing
• Dunhumby/News America/In-store Radio
• Catalina
Source: Nielsen Scantrack - Total U.S. – All Outlets Combined ; 52 w/e 7-20-2013 versus prior year; UPC-coded; 119 categories (>$100MM annually)Bev Al; 52 w/e 5-25-2013; Nielsen Food, Drug, Mass, Walmart, Club, Dollar, Conv, MilitaryNote: Spirits excludes WA State


99
111
121
128
131
154
307
350
450
454
0 100 200 300 400 500
Germany
Chile
South Africa
Australia
Argentina
China
USA
Spain
France
Italy
Source: Trade Data and Analysis
Millions of Cases Produced

$0
$200
$400
$600
$800
$1,000
$1,200
$1,400
$1,600
2008 2009 2010 2011 2012 2013
$930 $974
$800
$1,234$1,291
$1,410
*In Millions of US$
Source: Dept. of Commerce, Excludes re-exports of imported wines, 2013 results adjusted for apparent $70 million reporting error
+9%


•
•
•
•

•
•
•
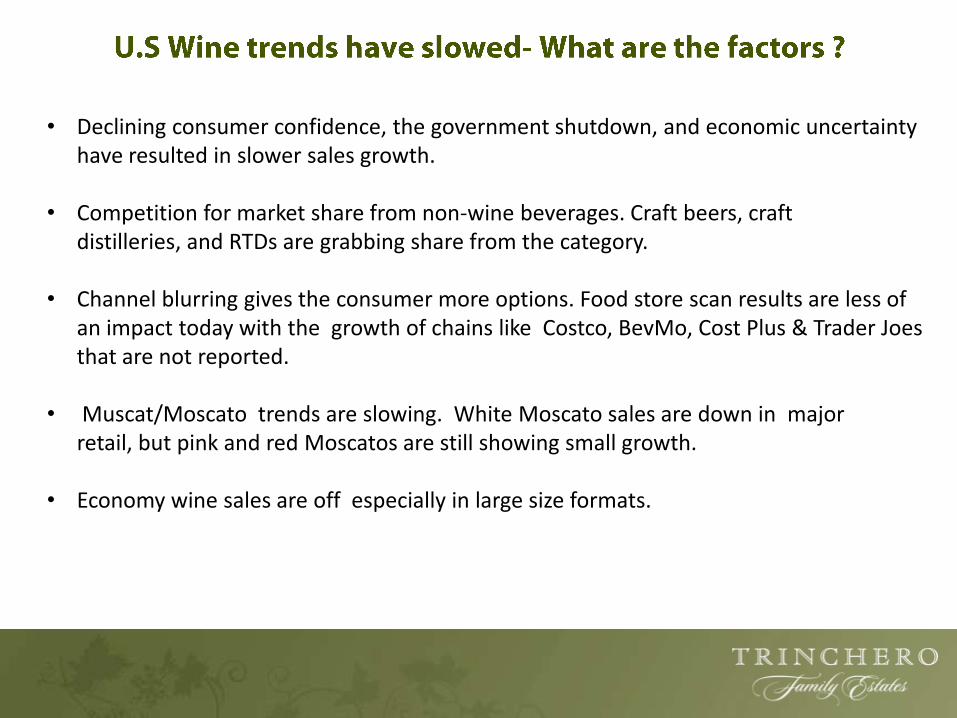
• Declining consumer confidence, the government shutdown, and economic uncertainty have resulted in slower sales growth.
• Competition for market share from non-wine beverages. Craft beers, craft distilleries, and RTDs are grabbing share from the category.
• Channel blurring gives the consumer more options. Food store scan results are less of an impact today with the growth of chains like Costco, BevMo, Cost Plus & Trader Joes that are not reported.
• Muscat/Moscato trends are slowing. White Moscato sales are down in major retail, but pink and red Moscatos are still showing small growth.
• Economy wine sales are off especially in large size formats.

0
500000
1000000
1500000
2000000
2500000
3000000
3500000
4000000
4500000
2002 2003 2004 2005 2006 2007 2008 2009 2010 2011 2012
White
Red
Total
20%
-7%
-3%21%
-6%4%
-16%
35%
-3%-8%

2003 2004 2005 2006 2007 2008 2009 2010 2011 2012
Coastal
Interior
Source: California Department of Food & Agriculture. Prepared by Gomberg Fredrickson & Associates


•
•
•
•