
Bo¤aziçi Journal - Amazon Simple Storage...
151
Currency and Yield Co-Integration between a Developed and an Emerging Country: The Case of Turkey Ahmet Can ‹nci Determinants of Brand Loyalty and the Link between Brand Loyalty and Price Tolerance Ebru Tümer Kabaday›, ‹nci Aygün Layoff Survivors’ Perceptions of Fairness as Determinant of Affective Commitment following Downsizing Alper Ertürk The Influence of theTurkish Republic’s Revolutions on Accounting Applications (1926-1928) Bar›fl Sipahi, ‹rem Nuho¤lu Direct Selling Ethics: An Exploratory Investigation on Turkish Direct Sellers Baht›flen Kavak, Sanem Alkibay, Mahmut Arslan A Note on the Cross-Section of Stock Returns on the Istanbul Stock Exchange N. Volkan Çetin, Z. Nuray Güner Turkish Money Demand Revisited: Some Implications for Inflation and Currency Substitution under Structural Breaks Cem Saatcio¤lu, Levent Korap Analyzing the Perceptions of Turkish Universities Using Multidimensional Scaling (MDS) Analysis Ulafl Akküçük, Selin Küçükkancabafl VOLUME 21 NUMBER 1-2 2007 ISSN: 1300-9583 Bo¤aziçi Journal Review of Social, Economic and Administrative Studies
Transcript of Bo¤aziçi Journal - Amazon Simple Storage...

Currency and Yield Co-Integration between a Developed and anEmerging Country: The Case of Turkey Ahmet Can ‹nci
Determinants of Brand Loyalty and the Link between BrandLoyalty and Price ToleranceEbru Tümer Kabaday›, ‹nci Aygün
Layoff Survivors’ Perceptions of Fairness as Determinant ofAffective Commitment following Downsizing Alper Ertürk
The Influence of theTurkish Republic’s Revolutions on AccountingApplications (1926-1928)Bar›fl Sipahi, ‹rem Nuho¤lu
Direct Selling Ethics: An Exploratory Investigation on TurkishDirect Sellers Baht›flen Kavak, Sanem Alkibay, Mahmut Arslan
A Note on the Cross-Section of Stock Returns on the IstanbulStock Exchange N. Volkan Çetin, Z. Nuray Güner
Turkish Money Demand Revisited: Some Implications forInflation and Currency Substitution under Structural BreaksCem Saatcio¤lu, Levent Korap
Analyzing the Perceptions of Turkish Universities UsingMultidimensional Scaling (MDS) AnalysisUlafl Akküçük, Selin Küçükkancabafl
VOLUME 21 NUMBER 1-2 2007
ISSN: 1300-9583
Bo¤aziçi JournalReview of Social, Economic and Administrative Studies
M. Tolga Akçura (Purdue Univerity)Vedat Akgiray (Bo¤aziçi University)Güven Alpay (Bo¤aziçi University)Emre Alper (Bo¤aziçi University)Yeflim Arat (Bo¤aziçi University)Kürflat Aydo¤an (Bilkent University)Cem Behar (Bo¤aziçi University)Faruk Birtek (Bo¤aziçi University)Muzaffer Bodur (Bo¤aziçi University)Eser Borak (Bo¤aziçi University)Nakiye Boyac›giller (Sabanc› University)Tamer Çavuflgil (Michigan State University)Üstün Ergüder (Sabanc› University)Refik Erzan (Bo¤aziçi University)Y›lmaz Esmer (Bahçeflehir University)Metin Heper (Bilkent University)Hayat Kabasakal (Bo¤aziçi University)Ersin Kalayc›o¤lu (Sabanc› University)Mehmet Kaytaz (Ifl›k University)
Fuat Keyman (Koç University)Kemal Kiriflçi (Bo¤aziçi University)Ahmet Koç (Okan University)Semih Koray (Bilkent University)fierif Mardin (Sabanc› University)Ayfle Mumcu (Bo¤aziçi University)Ayfle Öncü (Sabanc› University)Ziya Önifl (Koç University)fiemsa Özar (Bo¤aziçi University)Ferhunde Özbay (Bo¤aziçi University)Süleyman Özmucur (University of Pennsylvania)Remzi Sanver (Istanbul Bilgi University)Diane Sunar (Istanbul Bilgi University)‹lkay Sunar (Bahçeflehir University)Suna Tevruz (Marmara University)Zafer Toprak (Bo¤aziçi University)Cengiz Y›lmaz (Bo¤aziçi University)Ünal Zenginobuz (Bo¤aziçi University)
Bo¤aziçi Journal: Review of Social, Economic and Administrative Studiesis published and edited by the Faculty of Economics and Administrative Sciences, Bo¤aziçi University.
Owner / Sahibi: Eser Borak (Dean / Dekan)Managing Editor / Sorumlu Müdür: Binnaz Toprak
For correspondence, e-mail: [email protected]
Abstracted by The Middle East Journal, International Development Abstracts and Geographical Abstracts: Human Geography and GEOBASE; and covered in the Elsevier Geo Abstracts.
Published by Yaflar Matbaas› (2008)ISSN: 1300 - 9583
Bo¤aziçi Journal is sponsored by
EditorBinnaz Toprak
Associate EditorsFikret AdamanGülden Asugman
Executive EditorKadem fienkal
Copy EditorKathryn Kranzler
Editorial Board

We wish to express our appreciation of our Editorial Board and the following reviewers,whose advice and encouragement helped make possible the evaluation in 2006-2007 of thearticles submitted to the Journal.
Fikret Adaman, Bo¤aziçi UniversityVedat Akgiray, Bo¤aziçi UniversityZeynep Ak›n, Bo¤aziçi UniversityUlafl Akküçük, Bo¤aziçi UniversityNesrin Okay Akman, Bo¤aziçi UniversityElif Alakavuk, Bo¤aziçi UniversityGüven Alpay, Bo¤aziçi UniversityLütfihak Alpkan, Gebze Institute of Technology‹pek Alt›nbaflak, Bahçeflehir UniversityMaria D. Alvarez, Bo¤aziçi UniversityOya P›nar Ard›ç, Bo¤aziçi UniversityIlgaz Ar›kan, Georgia State UniversityNoyan Arsan, Koç UniversityYonca Aslanbay, ‹stanbul Bilgi UniversityGülden Asugman, Bo¤aziçi UniversityAsl› Aflç›o¤lu, Bryant UniversitySerap Atakan, ‹stanbul Bilgi UniversityKürflat Aydo¤an, Bilkent UniversityAhmet Faruk Aysan, Bo¤aziçi UniversitySandrine Bertaux, Galatasaray UniversityAyflen Candafl Bilgen, Bo¤aziçi Universityfiebnem Burnaz, ‹stanbul Technical UniversityDilek Ç›nar, Bo¤aziçi UniversityBeril Dedeo¤lu, Galatasaray UniversityMustafa Dilber, Fatih University‹rem Erdo¤mufl, Marmara UniversityÖzer Ertuna, Okan UniversityÖmer Faruk Gençkaya, Bilkent UniversityNisan Selekler Gökflen, Bo¤aziçi UniversityLale Güler, The City University of New YorkEmine Nur Günay, Bo¤aziçi UniversityMehmet Cahit Güran, Hacettepe UniversityNilgün Gürkaynak, Yeditepe University
Ozan Hatipo¤lu, Bo¤aziçi UniversityAyfer Hortaçsu, Bo¤aziçi UniversityK›vanç ‹nelmen, Bo¤aziçi UniversityGüler ‹slamo¤lu, Marmara UniversityHayat Kabasakal, Bo¤aziçi UniversityAbdülmecit Karatafl, Bo¤aziçi UniversityBaht›flen Kavak, Hacettepe UniversitySelcan Kaynak, Bo¤aziçi UniversityHande K›m›lo¤lu, Bo¤aziçi UniversityStefan Koch, Bo¤aziçi Universityfiule Kut, ‹stanbul Bilgi University‹brahim Mazlum, Marmara UniversityAsl› Yüksel Mermod, Marmara UniversityAlövsat Müslümov, Do¤ufl UniversityAsl›han Nas›r, Bo¤aziçi UniversityAttila Odabafl›, Bo¤aziçi Universityfiemsa Özar, Bo¤aziçi UniversityHakan Özçelik, California State University,SacramentoCenktan Özy›ld›r›m, ‹stanbul Bilgi UniversityÖzlem Sand›kç›, Bilkent UniversityHakan Sarao¤lu, Bryant UniversitySerdar Sayman, Koç UniversityFunda fierifo¤lu, Abant ‹zzet Baysal UniversityU¤ur Tando¤an, Okan UniversityArzu Tektafl, Bo¤aziçi University‹lter Turan, ‹stanbul Bilgi UniversityMine U¤urlu, Bo¤aziçi UniversityMurat Usman, Koç UniversitySibel Yamak, Galatasaray UniversityCengiz Y›lmaz, Bo¤aziçi UniversityFatih Y›lmaz, ‹stanbul UniversityAyd›n Yüksel, Bilkent University

CONTENTS
Currency and Yield Co-Integration between a Developed and an 1Emerging Country: The Case of Turkey Ahmet Can ‹nci
Determinants of Brand Loyalty and the Link between Brand 21Loyalty and Price ToleranceEbru Tümer Kabaday›, ‹nci Aygün
Layoff Survivors’ Perceptions of Fairness as Determinant of 37Affective Commitment following Downsizing Alper Ertürk
The Influence of theTurkish Republic’s Revolutions on Accounting 59Applications (1926-1928)Bar›fl Sipahi, ‹rem Nuho¤lu
Direct Selling Ethics: An Exploratory Investigation on Turkish 73Direct Sellers Baht›flen Kavak, Sanem Alkibay, Mahmut Arslan
A Note on the Cross-Section of Stock Returns on the Istanbul Stock 93Exchange N. Volkan Çetin, Z. Nuray Güner
Turkish Money Demand Revisited: Some Implications for Inflation 107and Currency Substitution under Structural BreaksCem Saatcio¤lu, Levent Korap
Analyzing the Perceptions of Turkish Universities Using 125Multidimensional Scaling (MDS) AnalysisUlafl Akküçük, Selin Küçükkancaba


1
CurrenCy and yield Co-integration between a developed and an emerging Country:
the Case of turkey*
Ahmet CAn İnCİ*
Sabancı University
AbstrAct
The relationship between currencies and the interest rates of different maturities is examined in the Turkish-US context. The real exchange rate between the new Turkish lira (YTL) and the US dollar is found to depend on both short- and long-term real US-Turkish interest rate differences. Cointegrating regressions generate negative and significant coefficients for long-rate differential, consistent with uncovered interest parity and the expectations hypothesis. On the other hand, positive coefficients for real short-term rate differential reveal the forward premium puzzle and the failure of uncovered interest parity for short-horizons. Results are partly driven by the very different risk characteristics of short-term US bonds and the Turkish currency.
JEL Classification: f31, e43, g14
Key words: exchange rates, interest rates, uncovered interest parity, forward premium puzzle.
Gelİşmİş ve Gelİşmekte Olan Ülkeler arasında kur-Getİrİ eşbÜtÜnleşmesİ: tÜrkİye Örneğİ
ÖZET
Döviz kurları ve değişik vadeli faiz oranları arasındaki ilişki Türkiye-ABD ekonomileri içeriğinde incelenmiştir. Yeni Türk Lirası (YTL) ve Amerikan Doları arasındaki reel kur oranı, hem kısa vadeli Amerikan-Türk reel faiz oranı farkına, hem de uzun vadeli Amerikan-Türk reel faiz oranı farkına bağlı olduğu bulunmuştur. Eşbütünleşme gerilemeleri uzun vadeli faiz farkı için negatif ve belirgin katsayılar elde etmiştir. Bu sonuç Garantisiz Faiz Oranı Hipotezi ve Beklentiler Hipotezi ile uyumludur. Öte yandan, reel kısa vadeli faiz oranı farkı için bulunan pozitif katsayılar, vadeli prim bilmecesini ortaya çıkarmaktadır. Bu sonuç da kısa vadeler için Garantisiz Faiz Oranı Hipotezinin geçersizliğini göstermektedir. Elde edilen bulgular kısmen kısa vadeli Amerikan tahvillerinin ve Türk Lirasının çok farkl risk özelliklerinden kaynaklanmaktadır.
Jel sınıflaması: f31, e43, g14
anahtar kelimeler: döviz kurları, faiz oranları, garantisiz faiz oranı hipotezi, vadeli prim bilmecesi.
* I would like to thank Josh coval, Meltem Denizel, David Humphrey, Gautam Kaul, Nejat seyhun, and the two anonymous referees for their suggestions, and seminar participants at Florida State University and Sabancı University for their comments.
** Ahmet Can İnci is an Assistant Professor in the Faculty of Management at Sabancı University, Orhanlı - Tuzla, 34956, Istanbul, Turkey. E-mail: [email protected]
Boğaziçi Journal Vol. 21, no. 1-2 (2007), pp. 1-20.

2
Monetary authorities use interest rates to achieve numerous economic policy goals. For example, the central bank may want to stimulate or slow down an economy, attract foreign capital, reduce the trade deficit, or influence the domestic currency dynamics by utilizing interest rates. In addressing the relationship between interest rates and currency dynamics, rational expectations theory says that high interest rates are to compensate for future currency depreciation. However, empirical studies demonstrate the complete opposite: high interest rate currencies appreciate and become more valuable. The anomaly is called the forward premium puzzle (FPP), documented first by Frankel (1979) and named by Fama (1984). Studies in the literature, such as Bekaert et al. (2002), Brandt and Santa-Clara (2002), and Collin-Dufresne et al. (2004), have generally examined the puzzle and the currency-interest rate dynamics among developed countries. Bekaert et al. (2002) find evidence for the puzzle when short-rates are used, while the puzzle diminishes when long horizon rates are used. The latter two studies employ sophisticated stochastic diffusion models for their statistical analyses using developed country data. However, the globalization of financial markets over the last two decades and the attractive profit prospects in emerging economies warrant an examination of the dynamics between developed and developing countries.(1) In this paper, a theoretical framework is proposed to expose and to account for the puzzle between an emerging country, turkey, and a developed country, the Us. Empirical investigation based on the model will show that the FPP appears in the short-term rate and exchange rate relationship. On the other hand, the expectations theory will hold in the relationship between long-term rates and the exchange rate.
Previous studies in the literature, such as Bali (2000), generally explore short-term rates since they can be changed more directly by the monetary authority. However, the longer maturity bond yield reaction to these changes should also be taken into account. since the term structure of interest rates conforms to humped, upward sloping, or downward sloping patterns, there is not a positive, linear response in long-term yields as short-term rates change. Accordingly, this article examines both the short- and the long-term in establishing the relationship between the $/YTL dynamics and interest rates.
both the turkish economy and the Us economy exhibit different trends and characteristics during the period of investigation from March 1996 through August 2006. The Turkish nominal rates are very high during the late 1990s. The 1-year rate is above 100% and averages around 120%, while the short-term rate is below 100%, averaging roughly 80%. This period also corresponds to chronically high inflation with Us (2004) demonstrating the impact of depreciation of the Turkish currency on high inflation rates with vector auto-regression analyses. 2000 and 2001 are marked by financial and economic crises, which are especially severe from February through October 2001.(2) During this time, the term structure in Turkey is inverted with higher short-term rates compared to long term-rates. Since the crisis, the interest rates are in decline reaching roughly 20% by August 2006. During this recent period, the long-term rates are higher than the corresponding short-term rates.
Before 1980, Turkey followed a fixed exchange rate system with controls on foreign currency transactions. Throughout the 1980s, Turkey moved towards an export-influenced growth strategy along with the liberalization of the markets. Foreign investors were allowed to invest in domestic markets and to repatriate their proceeds starting from August 1989. Convertibility of the Turkish lira was put into effect in the beginning of 1990. Also following August 1989, the Central Bank of the Republic of Turkey (CBT) introduced the interbank spot exchange market to determine the official exchange rate. this system led to real appreciation of the turkish currency and increased the foreign deficit, which eventually led to the April 1994 financial crisis. there were two unsuccessful

3
IMF-backed stabilization programs between 1994 and December 1999. Turkey adopted a crawling peg regime in December 1999 (Tastan, 2005). As examined in Ertuğrul and Selçuk (2001) and Erlat (2003), following the financial turmoil in December 2000 and another crisis in February 2001, the turkish lira was eventually left to float.
The exchange rate between the YTL and the US dollar during the 1996-2006 period shows a depreciating turkish currency in general, but there are very different patterns. Up until the crises of 2001, the depreciation displays a stable pattern. During the crises, the YTL/$ rate jumps from 0.67 to 1.60 from February through October 2001, which is almost a 140% depreciation. As a matter of fact, in just a few days from February 23 to February 26, the Turkish lira depreciates by 56%. Since the crises, the Turkish lira exhibits a stabile pattern. The old Turkish lira is replaced by the new YTL during this stable period by practically crossing out six zeros from the old currency.
The financial crises from late 2000 through 2001 can be considered a repercussion of the Asian and Russian economics crises. On the other hand, the stable depreciation of the Turkish lira adopted as the official exchange rate policy by the Central Bank of Turkey (CBT) throughout the 1990s may not have been favored by all national and international institutional investors. the coordinated efforts of these investors may have been another factor in the depreciation of the turkish currency.
The Turkish macro-economy and its related indicators exhibited significantly higher risks and different characteristics compared to those of the US economy. Berüment and Dinçer (2004) focus on the effect of the exchange rate risk on the turkish economy and use the ratio of the total foreign exchange liabilities to (1) the total reserves, (2) the reserves of the CBT and (3) the Turkish lira liabilities as the three measures for the exchange rate risk obtained from the cbt, since these variables directly measure the strength of the cbt in stabilizing the real exchange rate. the empirical evidence provided by Berüment and Dinçer (2004) is such that the higher exchange rate risk is associated with a depreciation of the local currency, an increase in prices, and a decrease in output.
Selçuk (2005) examines the post-2001 floating exchange rate period and finds that the CBT was effective in containing volatility and reducing the average inflation rate. the cbt followed the developments in the exchange rate market when making interest rate cutting decisions. However, it was proactive on the volatility through selling auctions. these findings provide support for the cbt claim that it was only concerned about exchange rate volatility, not the level or direction of exchange rates. It is also shown by Selçuk (2005) that the degree of exchange rate pass-through is low in Turkey, and that has helped the monetary authority to switch into an explicit inflation targeting policy. the negative effect of the substantial appreciation of the turkish lira on external competitiveness during the float was offset to a large extent by an increase in productivity and a fall in real wages. Akıncı et al. (2006) and Berüment (2007) also provide evidence for the effectiveness of foreign exchange purchase interventions for the Turkish economy conducted by the CBT in the post-crisis period, especially after 2003.(3)
Finally, when the Us interest rates are examined, patterns of stability and low values are seen, typical of developed country rates. The average rates of 5.5% in the late 1990s drop all the way down to 1.5% in the beginning of 2004 and increase back to the 5% level by late 1996. Long term-rates are higher than short-term rates with the only exception of the inverted term structure from October 2000 to April 2001. As these characteristics demonstrate, the analyses in this study correspond to a period of different interest rate and exchange rate patterns.
4
The theoretical framework in this study starts with a portfolio that consists of short- and long-term US government bonds and Turkish lira (YTL) (representing the short-term Turkish investment). Many fixed income portfolio decisions are driven by asset allocation, investment horizon, or immunization. Here the goal is to maintain a desired risk level as individual assets become less or more attractive. This is achieved by studying the supply-demand dynamics of the assets in the portfolio. The long-term bond is more risky than the short-term bond but less risky than the foreign bond and can be a substitute to both assets. In this setting, when the short-term rate increases in the US relative to Turkey, the short-term bond price declines because yields and prices move in opposite directions. the demand for these US T-bills increases while the demand for the alternative long-term bonds declines. The decline in demand for long-term bonds increases the demand for the other alternative, the Turkish lira (YTL), and this is reflected to an instant increase in the value of the turkish lira (i.e., an instant depreciation of the US dollar). Furthermore, high priced long-term bonds with lower yields will be negatively associated with the instant turkish lira appreciation. In steady state equilibrium, the demand functions of US bonds will adjust to the shock and lead to an appreciation of the US dollar, which is the FPP. Similarly, the supply-demand dynamics will work in the reverse direction if short rates are reduced.
The empirical analyses document the following relationships in real terms:
- The contemporaneous US dollar-Turkish lira exchange rate and the short-term US-Turkish interest rate differential are positively correlated;
- The change in the $/YTL exchange rate and the short-term US -Turkish interest rate differential are negatively correlated;
- The contemporaneous $/YTL exchange rate and the long-term rate differential are negatively correlated;
- The change in the exchange rate and long-term rate differential are positively correlated.
REvIEw OF LITERATURE
The often tested theory in the literature is the Expectations Hypothesis (EH) or Uncovered Interest Parity (UIP). EH says that forward/futures rates are unbiased estimates of expected future spot rates. In other words, the futures–spot basis, or the interest rate difference from covered interest parity, can predict changes in future exchange rates. Empirically, if the change in the exchange rate is regressed on the domestic and foreign interest rate difference, the regression slope coefficient is expected to be equal to one according to EH (which says forward rates are expected future spot rates). However, numerous studies have consistently found the coefficient to be significantly negative. the studies range from Frankel (1979), Flood and Rose (2001), Bekaert and Hodrick (2001), to wu (2007) and have used different currencies, time periods, sample sizes, and estimation methods, reaching the same conclusion. This is the forward premium puzzle (FPP) named by Fama (1984).
studies since then have examined the issue using different forecast horizons and empirical models. Chinn and Meredith (2002), Meredith and Chinn (1998), and Alexius (1993) report evidence in line with the uncovered interest rate parity with positive slope coefficients for long-term interest rates over long horizons. On the other hand, Dornbusch (1976), Baxter (1994), and Kempa et al. (1999) have proposed that prices are sticky and move slowly over time in reaction to economic shocks and innovations. term structure modeling studies using stochastic diffusion processes have focused on single countries and tried to explain the interest rates of all maturities. Dai and Singleton (2002, 2003)

5
and Duarte (2004) have developed affine models where the interest rates are linear functions of the underlying macroeconomic factors. the statistical characteristics of these factors are identified in these studies; however, the factors themselves are left undefined. Ang and Piazzesi (2002) and Iwata and wu (2005) try to identify these macroeconomic factors that impact interest rates. Ahn et al. (2002) develop quadratic term structure models with better empirical performance. Although these studies have introduced sophisticated theoretical models, the major drawback is that they are not concerned with the intuitive or practical explanations of how the theoretical model works.
Another strand of research has focused on the statistical distributions of currency returns. Zhou (2002) has modeled the volatility of returns using GARCH models, while Sarno and valente (2005) have developed risk management strategies using density forecasts of exchange rates. Finally, many currency and interest rate data are nonstationary and have unit roots. cointegrating regression models have been developed to filter the nonstationarity and to extract the actual relationship between currencies and interest rates. These studies have produced mixed results. For example, Meese and Rogoff (1988) find no evidence of a significant relationship between real exchange rates and long-term real interest rate differentials, but they do not examine long- and short-rates simultaneously. Barkaulas et al. (2003) test the forward premiums of currencies and find that the risk premium is time-varying but stationary. the majority of the studies examine the relationship among developed countries. this article provides a detailed analysis of the dynamics between an emerging country, turkey, and a developed country, the Us, with the sticky price approach and cointegrating regressions.(4)
the common conclusion in the literature is that the relationship between currency returns and interest rate differentials depends on the term structure of the interest rates and the financial risks embedded in the country as perceived by investors. this paper addresses these points with a simple term structure of short- and long-term rates and with its impact on the $/YTL dynamics.
The empirical analyses start by justifying the theoretical risk ranking of the US short- and long-term bonds, and the turkish currency. cointegrating regressions of contemporaneous $/YTL rate generate negative and significant coefficients for long-term interest rate differentials. This is consistent with UIP, and therefore, the EH is valid for long horizons. On the other hand, positive coefficients obtained for the real short-term interest rate differentials demonstrate the FPP, and the failure of the UIP. The results are robust to regressions where the dependent variable is the future $/YTL depreciation.
In the next section, the general theory is presented. the following sections explain the empirical tests and describe the data and the descriptive statistics. the final section presents the results, followed by the conclusion.
GEnERAL THEORY
The failure of the UIP can be accounted for in a more realistic risk-averse world where the term structure of interest rates is relevant. The investor is assumed to have three assets: short-term US bonds, long-term US bonds, and short-term Turkish government bonds (where the change in the $/YTL exchange rate is the main source of risk). The investor forms a portfolio based on his/her risk tolerance and changes the proportions of the three assets as they become more attractive or less attractive, while maintaining the desired risk level. the portfolio update depends on whether these assets are alternatives or complements of each other. Any two assets having similar risk characteristics

6
are termed substitutes and have demand functions that move in opposite directions. On the other hand, two assets with different risk characteristics, i.e., a very risky asset and an almost riskless one, are complements and have demand and price functions moving in the same direction.In the portfolio of three securities, each asset pair has a direct substitution effect and an indirect complementary effect due to the third asset (see Driskill and McCafferty, 1987, for details). whether assets end up as net substitutes or complements depends on the underlying parameters describing their risk characteristics. The short-term US bond has minimal risk for practical purposes. The risk associated with the short-term Turkish bond can be proxied by the volatility of the $/YTL return conditional on time. Finally, the risk proxy for the US long-term bond is the conditional volatility of long-term rates. The conditional risks of the latter two assets relative to each other lead to the four cases summarized in Figure 1.
The assets are short-term US bond (S) with no risk, long-term US bond (L), and Turkish currency/bond (F). σL is
the standard deviation of long-term US returns; σF is the standard deviation of change in the $/YTL. The correlation
coefficient between US long-term bond and YTL is α. In case 1, σF is much higher than σ
L. YTL and long-term US
bonds (F&L) are substitutes; so are long-term and short-term US bonds (L&S). YTL and short-term US bonds (F&S) have very different risk characteristics and act as complements. case 2 and case 3 correspond to σ
F ≈ σ
L and case 4
corresponds to σF << σ
L.
the empirical study here is based on the more realistic and plausible case 1, where the volatility of the $/YTL return is higher than the volatility of the US long-term-interest rates. The fact that the exchange rate return has higher volatility is empirically justified in Backus et al. (2001) and Engle and west (2004). Moreover, as explained in the data and preliminary analysis section and shown in Panel C of Table 1, $/YTL volatility is much higher than that of the US long-term interest rate. The US long-term rate volatility in turn is higher than the US short-term volatility, validating Case 1. The US long-term bond is more risky than the US short-term bond but less risky than the Turkish currency and ends up as a substitute for both. And the YTL and US short-term bonds are complements of each other.(5) the empirical verification is provided in the section on data and preliminary analysis.
In this theoretical setting, suppose that the US short-term interest rate rises. The price of the bond is lower (since yields and prices move in opposite directions), and the investor wants to increase the proportion of this higher return asset while keeping the risk level the same. this has two opposite effects on the demand for the YTL in the portfolio. The first, negligible effect is due to the very weak substitution between the US short-term bond and the YTL. The second is the dominant complementary
Figure 1Substitute and Complement Assets based on Relative Risk
case 4 case 3 case 2 Case 1
| α |σL σL |1/ α |σL
F&S: ComplementsF&L: SubstitutesL&S: Substitutes
F&S: Foreign and Short-term bondsF&L: Foreign and Long-term bondsL&S: Long and Short-term bonds
σF
7
effect which increases the demand for the YTL.(6) This will immediately increase the value of the YTL (US dollar will depreciate immediately). Empirical investigation of this conjecture should lead to a positive relationship between short-term interest rate differentials and the contemporaneous exchange rate.(7)
The relationship between long-term interest rate differentials and the $/YTL is more direct. Both are strong substitutes for each other. Therefore, as the demand for the US long-term bond decreases, the demand for the YTL increases, leading to an immediate increase in the value of the YTL. The empirical consequence is a negative relationship between long-term interest rate differentials and the contemporaneous exchange rate.
EMPIRICAL MODEL
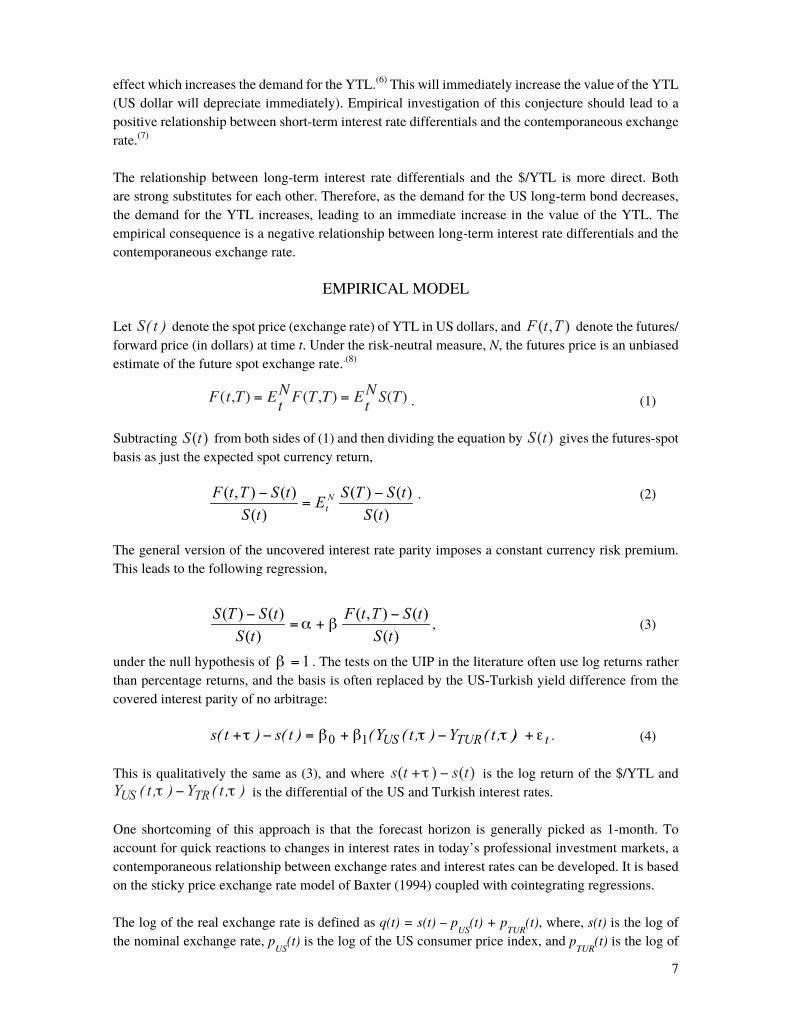
Let denote the spot price (exchange rate) of YTL in US dollars, and denote the futures/forward price (in dollars) at time t. Under the risk-neutral measure, N, the futures price is an unbiased estimate of the future spot exchange rate..(8)
. (1)
subtracting from both sides of (1) and then dividing the equation by gives the futures-spot basis as just the expected spot currency return,
. (2)
the general version of the uncovered interest rate parity imposes a constant currency risk premium. this leads to the following regression,
, (3)
under the null hypothesis of . The tests on the UIP in the literature often use log returns rather than percentage returns, and the basis is often replaced by the US-Turkish yield difference from the covered interest parity of no arbitrage:
(4)
This is qualitatively the same as (3), and where is the log return of the $/YTL and is the differential of the Us and turkish interest rates.
One shortcoming of this approach is that the forecast horizon is generally picked as 1-month. To account for quick reactions to changes in interest rates in today’s professional investment markets, a contemporaneous relationship between exchange rates and interest rates can be developed. It is based on the sticky price exchange rate model of Baxter (1994) coupled with cointegrating regressions.
the log of the real exchange rate is defined as q(t) = s(t) – pUS
(t) + pTUR
(t), where, s(t) is the log of the nominal exchange rate, p
US(t) is the log of the Us consumer price index, and p
TUR(t) is the log of
8
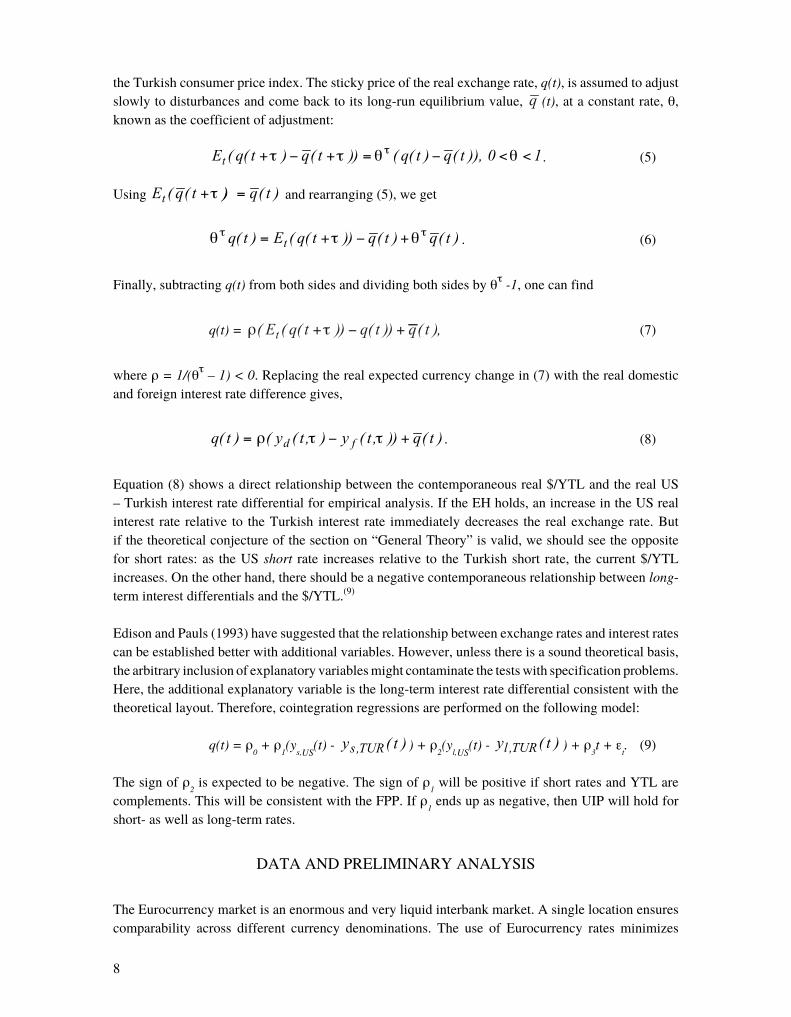
the turkish consumer price index. the sticky price of the real exchange rate, q(t), is assumed to adjust slowly to disturbances and come back to its long-run equilibrium value, (t), at a constant rate, θ, known as the coefficient of adjustment:
. (5)
Using and rearranging (5), we get
. (6)
Finally, subtracting q(t) from both sides and dividing both sides by θτ -1, one can find
q(t) = (7)
where ρ = 1/(θτ – 1) < 0. Replacing the real expected currency change in (7) with the real domestic and foreign interest rate difference gives,
. (8)
Equation (8) shows a direct relationship between the contemporaneous real $/YTL and the real US – turkish interest rate differential for empirical analysis. If the EH holds, an increase in the Us real interest rate relative to the turkish interest rate immediately decreases the real exchange rate. but if the theoretical conjecture of the section on “General theory” is valid, we should see the opposite for short rates: as the US short rate increases relative to the Turkish short rate, the current $/YTL increases. On the other hand, there should be a negative contemporaneous relationship between long-term interest differentials and the $/YTL.(9)
Edison and Pauls (1993) have suggested that the relationship between exchange rates and interest rates can be established better with additional variables. However, unless there is a sound theoretical basis, the arbitrary inclusion of explanatory variables might contaminate the tests with specification problems. Here, the additional explanatory variable is the long-term interest rate differential consistent with the theoretical layout. Therefore, cointegration regressions are performed on the following model:
q(t) = ρ0 + ρ
1(y
s,US(t) - ) + ρ
2(y
l,US(t) - ) + ρ
3t + ε
t. (9)
the sign of ρ2 is expected to be negative. the sign of ρ
1 will be positive if short rates and YTL are
complements. This will be consistent with the FPP. If ρ1 ends up as negative, then UIP will hold for
short- as well as long-term rates.
DATA AnD PRELIMInARY AnALYSIS
the Eurocurrency market is an enormous and very liquid interbank market. A single location ensures comparability across different currency denominations. the use of Eurocurrency rates minimizes

9
possible frictions caused by differences in capital controls, and other government regulations. therefore, end of month Eurocurrency deposit rates from Global Insight are used for the interest rate data. For short-term rates, 1-month Eurocurrency yields are used. For long-term interest rates, 1-year Eurocurrency yields are used. Longer maturity yields for Turkey were not available for an equal or longer sample period. Price changes are measured by the seasonally unadjusted consumer price index data. The monthly exchange rate is defined as the new Turkish lira -YTL- in terms of US dollars and is also from Global Insight. The sample extends from March 1996 through August 2006 mainly because that is as far back as the 1-year Turkish Eurocurrency yields go. The ex-ante real short-term interest rate and the real long-term interest rate are constructed by computing a measure of expected inflation under the assumption that it follows an autoregressive process.(10)
the first goal is to determine whether the data are empirically consistent with the theoretical discussion. Is the risk of the short-term US bond (represented by the standard deviation of the US 1-month yield) less than that of the long-term US bond? Is the risk associated with the US long-term bond less than the risk associated with the Turkish bond (measured by the standard deviation of the change in the $/YTL)? Affirmative answers to both questions will correspond to Case 1 of Figure 1 described above.
table 1 Country Risk Rankings
Panel A. Country Risk Rankings – march 1990 through September 2006Institutional Investor country credit survey
us turMean 4.65 60.06
st. Error 1.74 14.03
Euromoney country risk rankings
us turMean 4.11 61.09
st. Error 2.37 13.08
Panel B. Country Risk Rankings – march 1996 through September 2006Institutional Investor country credit survey
us turMean 4.82 68.82
st. Error 2.04 8.39
Euromoney country risk rankings
us turMean 3.50 68.95
st. Error 1.16 7.47
Panel C. Coefficient of Variation (CV) and St.Dev. of US returns vs. YtL Returns
us tur
Rs rist. Deviation 0.0026 0.0036 0.0842
cV 1.86 2.12 19.14
Panel A and Panel B present mean and standard deviation of Institutional Investor and Euromoney country risk rankings. The rankings have been compiled and computed from semi-annual issues of Euromoney and Institutional Investor. The lower the mean value of the rank, the lower the country risk. In Panel C Rs is the US short-rate and Rl is the US long-rate.
10
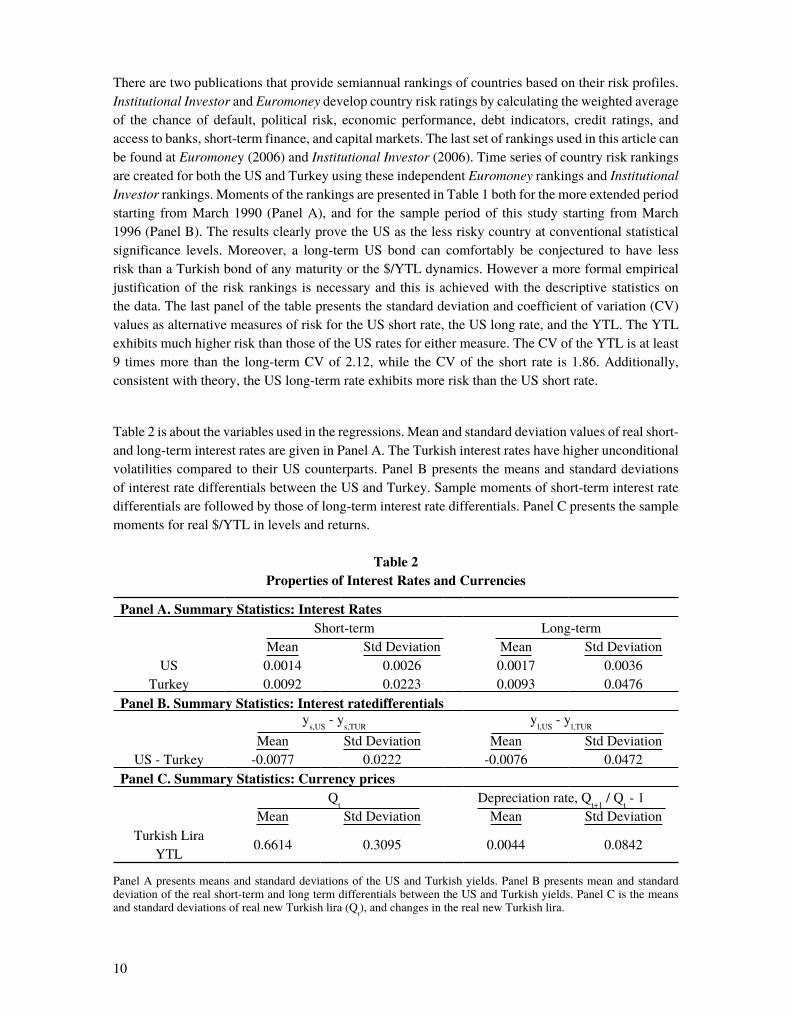
there are two publications that provide semiannual rankings of countries based on their risk profiles. Institutional Investor and Euromoney develop country risk ratings by calculating the weighted average of the chance of default, political risk, economic performance, debt indicators, credit ratings, and access to banks, short-term finance, and capital markets. The last set of rankings used in this article can be found at Euromoney (2006) and Institutional Investor (2006). Time series of country risk rankings are created for both the Us and turkey using these independent Euromoney rankings and Institutional Investor rankings. Moments of the rankings are presented in table 1 both for the more extended period starting from March 1990 (Panel A), and for the sample period of this study starting from March 1996 (Panel B). The results clearly prove the US as the less risky country at conventional statistical significance levels. Moreover, a long-term US bond can comfortably be conjectured to have less risk than a Turkish bond of any maturity or the $/YTL dynamics. However a more formal empirical justification of the risk rankings is necessary and this is achieved with the descriptive statistics on the data. The last panel of the table presents the standard deviation and coefficient of variation (Cv) values as alternative measures of risk for the US short rate, the US long rate, and the YTL. The YTL exhibits much higher risk than those of the US rates for either measure. The Cv of the YTL is at least 9 times more than the long-term Cv of 2.12, while the Cv of the short rate is 1.86. Additionally, consistent with theory, the US long-term rate exhibits more risk than the US short rate.
Table 2 is about the variables used in the regressions. Mean and standard deviation values of real short- and long-term interest rates are given in Panel A. The Turkish interest rates have higher unconditional volatilities compared to their US counterparts. Panel B presents the means and standard deviations of interest rate differentials between the US and Turkey. Sample moments of short-term interest rate differentials are followed by those of long-term interest rate differentials. Panel C presents the sample moments for real $/YTL in levels and returns.
table 2Properties of Interest Rates and Currencies
Panel A. Summary Statistics: Interest RatesShort-term Long-term
Mean std Deviation Mean std DeviationUs 0.0014 0.0026 0.0017 0.0036
turkey 0.0092 0.0223 0.0093 0.0476Panel B. Summary Statistics: Interest ratedifferentials
ys,Us
- ys,tUr
yl,Us
- yl,tUr
Mean std Deviation Mean std DeviationUS - Turkey -0.0077 0.0222 -0.0076 0.0472
Panel C. Summary Statistics: Currency pricesQ
tDepreciation rate, Q
t+1 / Q
t - 1
Mean std Deviation Mean std DeviationTurkish Lira
YTL0.6614 0.3095 0.0044 0.0842
Panel A presents means and standard deviations of the US and Turkish yields. Panel B presents mean and standard deviation of the real short-term and long term differentials between the US and Turkish yields. Panel C is the means and standard deviations of real new turkish lira (Q
t), and changes in the real new Turkish lira.

11
The cross-sectional results show that the $/YTL data have much higher volatility than the interest rate differentials. Standard deviation of the $/YTL is higher than those of the short and long-term interest rate differentials by as much as six times. these statistics also demonstrate the difficulty researchers have in trying to forecast exchange rate returns as explained in Engel and west (2004). Finally, long-term differentials have twice the standard deviation of short-term differentials.
the results support case 1 of Figure 1 and are consistent with previous studies such as those of backus et al. (2001) and Baxter (1994). The Turkish currency/bond has much higher risk than the US short-term bond, making it a substitute for the US long-term bond only. The US long-term bond, on the other hand, can also be a rough substitute for the US short-term bond since it is less risky than the YTL. YTL acts therefore as a substitute of a substitute for the US short-term bond. They are at opposite ends of the risk spectrum and are complements of one another.(11)
next, the immediate and steady state reactions of the $/YTL to short rate changes are examined. The goal is to answer whether there is indeed a positive contemporaneous relationship between the YTL and the short rate difference demonstrating the FPP.
EMPIRICAL RESULTS
Unit Root tests
Previous studies report that real currencies and interest differentials may be non-stationary and have unit roots (Meese and Rogoff, 1988). Such data are known to have long memory, where a shock will have a persistent long term impact. cointegrating regressions should be conducted in such cases.
Unit root tests notoriously have low power. therefore, five different tests are conducted to determine whether the data indeed contain unit roots. three of them are independent versions of augmented Dickey-Fuller tests: ADF based on the OLS t-statistic, ADF2 based on the rho test from the OLS autoregressive coefficient estimates, and ADF3 based on the OLS F statistics. Serial correlations in the tests are controlled by including higher order autoregressive terms. the critical values and the details of these tests are provided in Dickey and Fuller (1981), Said and Dickey (1984), and Fuller (1996). The last two tests are the Phillips-Perron Zrho unit root test and the Phillips-Perron Zt unit root test following Perron (1988). The test results are reported in Table 3, Panel A. Evidence against non-stationarity is strongest for the $/YTL. Overall, neither the Dickey-Fuller nor the Phillips-Perron tests rejects the null hypothesis of difference stationarity for any of the data at conventional significance levels. The only exception is the Phillips-Perron Zrho test of the short-term real interest rate differential. Since each time series is nonstationary at least by one test and since real long- and short-term interest differentials possess at least a near unit root, the relationship between the real $/YTL and real long- and short-term interest differentials should be determined using cointegrating regressions.
If the short and long term yield differentials are cointegrated with one another, then there is more than one cointegrating relationship between the real $/YTL, real short, and real long rate differentials. therefore, the explanatory variables should be investigated to see if they are cointegrated with each other (Phillips and Hansen, 1990). Panel B reports the results of augmented Dickey-Fuller, Phillips’ Zrho and Zt cointegration tests between real long- and real short-term interest rate differentials. The results fail to reject the null of no cointegration at 5% significance.

12
table 3 Unit Root and Co-integration tests
Panel A. Unit Root testsq
ty
s,Us - y
s,tUry
l,Us - y
l,tUr
ADFADF2ADF3
Phillips-Perron ZrhoPhillips-Perron Zt
-1.1460-2.7286
0.0015275-2.9603-1.2008
-1.8405-18.9203
0.0158946-20.3666-2.2234
-2.7270-13.80040.6395-7.9421-2.1327
Panel B. Co-integration tests among explanatory Variables
Zrho -13.8808
Zt -2.6442
ADFt -2.0597
In Panel A qt: real $/YTL; y
s,Us - y
s,tUr: short-term real interest difference; y
l,Us - y
l,tUr: long-term real interest difference.
Accept the null of a unit root if ADF > critical Value or if ADF2 > critical Value or if ADF3 < critical Value or if Phillips-Perron Zrho > Critical value, or if Phillips-Perron Zt > Critical value. The critical values for ADF and Phillips-Perron Zt are -3.485, -2.885, -2.575; for ADF2 and Phillips-Perron Zrho -20.05, -13.85, -11.1; and for ADF3 6.61, 4.66, 3.835 at 1%, 5%, and 10%. In Panel B if Zrho = Phillips Z
ρ statistic < critical Value, there is evidence
against no cointegration. Critical values are -28.3, -20.5, -17.0 at 1%, 5%, and 10%. If Zt = Phillips Zt statistic < critical
value or if ADFt = Augmented Dickey-Fuller t Statistic < Critical value, there is evidence against no cointegration. Critical values for Zt and ADFt are -3.39, -2.76, -2.45 at 1%, 5%, and 10%.
Cointegrating Regressions
The last result of the previous section allows proceeding with Phillips and Hansen’s fully modified OLS cointegrating regression (Phillips and Hansen, 1990). Real $/YTL is regressed on both short- and long-term real interest rate differentials along with a constant term and a deterministic trend term. The results are reported in Panel A of Table 4. Point estimates have signs consistent with the theoretical conjectures. The point estimate for the real long-term interest rate difference is -0.0792 and is significant at 1%. A higher long-term real interest rate in the US relative to Turkey causes a real and immediate appreciation of the dollar. In long run equilibrium, the dollar depreciates as suggested by the EH. Therefore, the UIP holds for long horizon rates. These results are consistent with those reported by Alexius (1993), Meredith and Chinn (1998), and Chinn and Meredith (2002), who also find that UIP holds in long-term analyses.
The slope coefficient for the short-term real interest rate differential is positive and significant. The point estimate of 0.8 indicates that the YTL and US short-term bonds are complements. This is consistent with Case 1 of Figure 1. Dulger and Cin (2002) examine cointegrating relationships between the nominal exchange rate and monetary variables for turkey in a different context.
They reject the UIP for short-horizon interbank loan rates. The findings here are consistent with theirs in the short-term.
Gonzalo (1994) has shown that Johansen’s maximum likelihood error correction model (Johansen, 1988) has better properties than the OLS, nonlinear least squares, principle component, and canonical

13
correlation estimators. to make sure that the results are not specific to the choice of the estimation technique, the empirical analysis is replicated with Johansen’s model. The results are reported in Panel b of table 4.
table 4Cointegrating Regressions
Panel A. Phillips-hansen’s Fully modified OLS Cointegrations
0.8011
(1320)
-0.0792
(58)
1.5440
(10)
Panel B. Johansen’s Full Information maximum Likelihood estimates
1.59
-3.46
tracestats 48.25
Eigenvalue stats 35.05
Panel A: The regression has the form qt = ρ
0 + ρ
1(y
s,Us - y
s,tUr) + ρ
2(y
l,Us - y
l,tUr) + ρ
3t + ε
t, where q
t is the real $/YTL,
(ys,Us
- ys,tUr
) and (yl,Us
- yl,tUr
) are real short- and long-term interest rate differentials. χ2 statistics are in parentheses. Critical values are, 6.63, 3.84, 2.71 at 1%, 5%, and 10%. Panel B presents normalized eigenvector values for short- and long-term interest rate differentials. Critical values for Trace and Eigenvalue statistics are 35.46 and 25.87 at 1%.
the Johansen maximum likelihood method provides two different likelihood ratio tests to answer whether there is cointegration or not. these are the trace test and the maximum eigenvalue test. the vector error correction model representation uses a long run impact matrix, Π, which is the product of two matrices: one used to determine the deterministic part of the variables, and the other used for the cointegrating relationships. the trace likelihood ratio test statistic is obtained from Π as , where r is the number of cointegrating vectors, p is the rank of Π, T is the sample size, and λ
i are the eigenvalues, ordered from smallest to largest, which arise in the solution
of the reduced rank regression problem. the maximum eigenvalue likelihood ratio test statistic is defined as . If the trace statistic is greater than its critical value, then the null of no cointegration is rejected. similarly, if the maximum eigenvalue statistic is greater than its critical value, then the null of no cointegration is rejected. the asymptotic distributions of the test statistics are nonstandard and their asymptotic critical values along with further details of the procedure are provided in MacKinnon et al. (1999), where the response surface approach has been adopted and Monte carlo simulations have been conducted. Neither trace nor eigenvalue test statistics reject the null of no cointegration. the normalized eigenvector coefficients are consistent with previous regressions. Short rate difference has a positive (larger than 1) and long rate difference has a negative (less than -1) coefficient in explaining the YTL.
14
Robustness tests
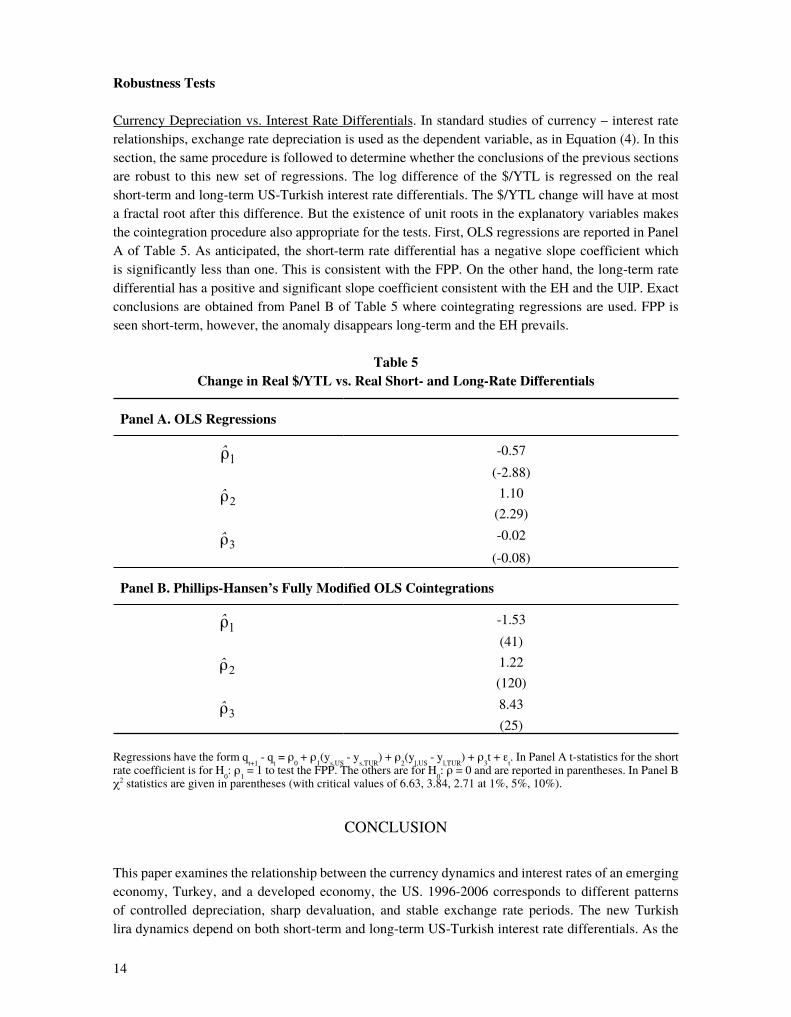
currency Depreciation vs. Interest rate Differentials. In standard studies of currency – interest rate relationships, exchange rate depreciation is used as the dependent variable, as in Equation (4). In this section, the same procedure is followed to determine whether the conclusions of the previous sections are robust to this new set of regressions. The log difference of the $/YTL is regressed on the real short-term and long-term US-Turkish interest rate differentials. The $/YTL change will have at most a fractal root after this difference. but the existence of unit roots in the explanatory variables makes the cointegration procedure also appropriate for the tests. First, OLS regressions are reported in Panel A of Table 5. As anticipated, the short-term rate differential has a negative slope coefficient which is significantly less than one. This is consistent with the FPP. On the other hand, the long-term rate differential has a positive and significant slope coefficient consistent with the EH and the UIP. Exact conclusions are obtained from Panel B of Table 5 where cointegrating regressions are used. FPP is seen short-term, however, the anomaly disappears long-term and the EH prevails.
table 5 Change in Real $/YtL vs. Real Short- and Long-Rate Differentials
Panel A. OLS Regressions
-0.57
(-2.88)
1.10
(2.29)
-0.02
(-0.08)
Panel B. Phillips-hansen’s Fully modified OLS Cointegrations
-1.53
(41)
1.22
(120)
8.43
(25)
regressions have the form qt+1
- qt = ρ
0 + ρ
1(y
s,Us - y
s,tUr) + ρ
2(y
l,Us - y
l,tUr) + ρ
3t + ε
t. In Panel A t-statistics for the short
rate coefficient is for H0: ρ
1 = 1 to test the FPP. The others are for H
0: ρ = 0 and are reported in parentheses. In Panel B
χ2 statistics are given in parentheses (with critical values of 6.63, 3.84, 2.71 at 1%, 5%, 10%).
COnCLUSIOn
this paper examines the relationship between the currency dynamics and interest rates of an emerging economy, Turkey, and a developed economy, the US. 1996-2006 corresponds to different patterns of controlled depreciation, sharp devaluation, and stable exchange rate periods. the new turkish lira dynamics depend on both short-term and long-term US-Turkish interest rate differentials. As the

15
Turkish central bank changes short-term rates to affect the $/YTL movements, the reaction of long-term rates to these changes should also be taken into account because of the indirect influence of the long-term rate differential on the YTL. The term structure as a whole will determine the net impact of monetary policies on the $/YTL.
Cointegrating regressions are performed on the contemporaneous $/YTL with real short-term and real long-term interest differentials as explanatory variables. Regressions generate negative and significant coefficients for long-term rate differentials. This is consistent with uncovered interest parity, and the expectations hypothesis seems to be valid for long horizons. On the other hand, positive coefficients for real short-term interest rate differentials are consistent with the forward premium puzzle, which is the failure of uncovered interest parity for short-horizons. The results are robust to a different set of regressions where the dependent variable is the future $/YTL change. The conclusions are consistent with the theoretical discussion in the paper. The US short-term bonds and the Turkish currency have very different risk characteristics. In a portfolio of securities, they serve as complements of each other. On the other hand, the long-term US bond is a suitable substitute for both the short-term US bond and the YTL. This particular risk order is one explanation of the empirical results.
the Us was chosen as the developed country in the study. Even though the largest trading partner for Turkey is the European Union, Sayek and Selover (2002) find that the business cycles do not coincide, European and Turkish GDPs do not co-integrate, GDP growth rates are not correlated, and the income transmission effects due to trade may not be very large. Moreover, the composition of turkish exports is in relatively income-inelastic goods, further weakening the transmission effects. Finally, much of the divergence of business cycles between turkey and Europe may be due to many domestic and regional shocks specific to turkey and unfelt in Europe. these were some reasons as to why the Us was chosen as the foreign country in the study. Furthermore, the conversion of most European currencies into the Euro makes it difficult to find exchange rate and interest rate data which are not subject to government regulations and/or restrictions, and which can be used for an extended sample period. The requirement by the European Monetary Union from its member states to keep their currencies within a tight band relative to each other before the introduction of the Euro is one example of such restrictions. the analysis in the article can be applied to the Euro as more data become available.
nOTES
An exception is a study that examines both developed and emerging countries by bansal and 1. Dahlquist (2000). However, the study focuses on empirical panel analysis rather than theoretically explaining the dual country interest.
The statistical distribution of the interest rate data conducted by Gencay and Selçuk (2006) indicates 2. abnormally high interest rates during the period. Telatar et al. (2003) examine the relationship between the term structure and inflation during the period and conclude that stability is only possible by reducing inflation through circumscribing substantial government budget deficits and the political instability underlying them.
These studies imply that the government should take further action to reduce the debt-ratio and real 3. interest rates, and to accelerate structural reforms to attract foreign direct investment. Otherwise, the floating exchange rate period may just be another episode of appreciation-depreciation and/or boom-bust cycle in the Turkish economy.

16
In a separate stream of research, rigorous stochastic models of the term structure of interest rates 4. denominated in different currencies have been developed by Heath et al. (1992) and others to explain sudden and non-market driven changes in the exchange rate (e.g., during the Spring of 2001). The study here focuses on providing an explanation of the FPP. The comprehensive term structure model is left for future research.
As the demand for the Us short bond increases, the demand for the Us long bond decreases, which 5. implies that the demand for YTL increases. US short bonds and the YTL are complements since their demand functions move in the same direction.
The strong substitutability between the US short-term and long-term bonds means that the demand 6. for long-term bonds decreases. This decrease has the indirect effect of increasing the demand for YTL since long-term and foreign bonds are also strong substitutes.
In the next period under rational equilibrium, the YTL will lose value and the US dollar will 7. appreciate, which is the forward premium anomaly. In a regression trying to explain the future changes in currency rates, the slope coefficient should be negative for short-term rates consistent with this anomaly.
The representative agent/investor uses the risk-neutral measure, 8. N, to calculate expectations in a risk-neutral world. In such a world, the representative agent is indifferent to risk and requires no additional compensation.
In the steady state equilibrium next period, the currency will depreciate as suggested by the FPP, 9. producing a negative slope coefficient between the currency change and short-term interest rate differentials. On the other hand, the long-term interest rate differentials will have positive slope coefficients when regressed against the exchange rate change.
The order of the AR process is determined from Schwarz, Akaike, Final Prediction Error, Shibata, 10. and Hannan-Quinn information criteria. In both Turkey and the US, the order suggested by most criteria is used.
considering interest rate in addition to the currency in the calculation of the turkish investment 11. volatility would not change the risk ranking of the three assets.
rEFErENcEs
Ahn, D.H., Dittmar, R.F., and Gallant, A.R. (2002). “Quadratic Gaussian Models: Theory and Evidence,” Review of Financial Studies, 15: 243-288.
Akıncı, O., Culha, O.Y., Özlale, U. and Şahinbeyoğlu, G. (2006). “The Effectiveness of Foreign Exchange Interventions under a Floating Exchange Rate Regime for the Turkish Economy: A Post-Crisis Period Analysis,” Applied Economics, 38: 1371-1389.
Alexius, A. (1993). “UIP for Short Investments in Long-Term Bonds,” Sveriges Riksbank Working Paper Series, No. 115.
17
Ang, A. and Piazzesi, M. (2002). “A no-Arbitrage vector Autoregression of Term Structure Dynamics with Macroeconomic and Patent variables,” Journal of Monetary Economics, 50: 745-787.
Backus, D., Foresi, S. and Telmer, C. (2001). “Affine Term Structure Models and the Forward Premium Anomaly,” Journal of Finance, 56: 279-304.
Bali, T.G. (2000). “Modeling the Conditional Mean and variance of the Short Rate Using Diffusion, GArcH, and Moving Average Models,” Journal of Futures Markets, 20: 717-757.
Bansal, R. and Dahlquist, M. (2000). “The Forward Premium Puzzle: Different Tales from Developed and Emerging Economies,” Journal of International Economics, 51: 115-144.
Barkoulas, J., Baum, C.F., and Chakraborty, A. (2003). “Forward Premiums and Market Efficiency: Panel Unit-Root Evidence from the Term Structure of Forward Premiums,” Journal of Macroeconomics, 25: 109-123.
Baxter, M. (1994). “Real Exchange Rates and Real Interest Differentials: Have we Missed the Business-Cycle Relationship,” Journal of Monetary Economics, 33: 5-37.
Bekaert, G., wei, M., and Xing, Y. (2002). “Uncovered Interest Rate Parity and the Term Structure,” NBER Working Paper, no. 8759.
Bekaert, G. and Hodrick, R.J. (2001). “Expectations Hypotheses Tests,” Journal of Finance, 56: 115-138.
Berüment, H. (2007). “Measuring Monetary Policy for a Small Open Economy: Turkey,” Journal of Macroeconomics, 29: 411-431.
Berüment, H. and Dinçer, n. (2004). “The Effects of Exchange Rate Risk on Economic Performance: the turkish Experience,” Applied Economics, 36: 2429-2442.
Brandt, M.w. and Santa-Clara, P. (2002). “Simulated Likelihood Estimation of Diffusions with an Application to Exchange rate Dynamics in Incomplete Markets,” Journal of Economics, 63: 161 210.
Chinn, M. and Meredith, G. (2002). “Testing Uncovered Interest Parity at Short and Long Horizons during the Post-Bretton woods Era,” University of California, Santa Cruz Working Paper.
Collin-Dufresne, P., Goldstein, R.S., and Jones, C.S. (2004). “Can Interest Rate volatility Be Extracted from the Cross Section of Bond Prices? An Investigation of Un-Spanned Stochastic volatility,” NBER Working Paper, no. 10756.
Dai, Q. and Singleton, K.J. (2002). “Expectation Puzzles, Time-varying Risk Premia, and Affine Models of the term structure,” Journal of Financial Economics, 63: 415-441.
------ (2003). “Term Structure Dynamics in Theory and Reality,” Review of Financial Studies, 16: 631-678.

18
Dickey, D.A. and Fuller, w.A. (1981). “Likelihood Ratio Statistics for Autoregressive Time Series with a Unit root,” Econometrica, 49: 1057-1072.
Dornbusch, R. (1976). “Expectations and Exchange Rate Dynamics,” Journal of Political Economy, 84: 1161-1176.
Driskill, R. and McCafferty, S. (1987). “Exchange-Rate Determination: An Equilibrium Approach with Imperfect capital substitutability,” Journal of International Economics, 23: 241-261.
Duarte, J. (2004). “Evaluating an Alternative Risk Preference in Affine Term Structure Models,” Review of Financial Studies, 17: 379-404.
Dülger, F. and Cin, M.F. (2002). “The Determination of Foreign Exchange Rate Dynamics in Turkey: Monetary Approach and testing with cointegration Analysis,” METU Studies in Development, 29: 47-68.
Edison, H. and Pauls, B.D. (1993). “A Re-Assessment of the Relationship between Real Exchange Rates and Real Interest Rates: 1974-1990,” Journal of Monetary Economics, 31: 165-187.
Engel, C. and west, K.D. (2004). “Accounting for Exchange Rate variability in Present-value Models when the Discount Factor is near One,” NBER Working Paper, no. 10267.
Erlat, H. (2003). “The nature of Persistence in Turkish Real Exchange Rates,” Emerging Markets Finance and Trade, 39: 70-97.
Ertuğrul, A. and Selçuk, R. (2001). “A Brief Account of the Turkish Economy, 1980-2000,” Russian and East European Finance and Trade, 37: 6-30.
Euromoney Publications, PLC. (2006). “Country Risk Rankings,” Euromoney, no. 443: 168-177.Fama, E. (1984). “Forward and Spot Exchange Rates,” Journal of Monetary Economics, 14: 319-338.
Flood, R.P. and Rose, A.K. (2001). “Uncovered Interest Parity in Crisis: The Interest Rate Defense in the 1990s,” IMF Working Paper, no. 01/207.
Frankel, J. (1979). “On the Mark: A Theory of Floating Exchange Rates Based on Real Interest Differentials,” American Economic Review, 69: 610-622.
Fuller, w.A. (1996). Introduction to Statistical Time Series. new York: wiley.
Gencay, R. and Selçuk, F. (2006). “Overnight Borrowing, Interest Rates and Extreme value Theory,” European Economic Review, 50: 547-564.
Gonzalo, J. (1994). “Five Alternative Methods of Estimating Long-Run Equilibrium Relationships,” Journal of Econometrics, 60: 203-233.
19
Hansen, L.P. and Hodrick, R.J. (1980). “Forward Exchange Rates as Optimal Predictors of Future Spot Rates: An Econometric Analysis,” Journal of Political Economy, 88: 829-853.
Heath, D., Jarrow, R., and Morton, A. (1992). “Bond Pricing and the Term Structure of Interest Rates: A New Methodology for contingent claims Valuation,” Econometrica, 60: 77-105.
Hsieh, D.A. (1993). “Using non-Linear Methods to Search for Risk Premia in Currency Futures,” Journal of International Economics, 35: 113-132.
İnci, A.C. and Lu, B. (2004). “Exchange Rates and Interest Rates: Can Term Structure Models Explain currency Movements,” Journal of Economic Dynamics & Control, 28: 1595-1624.
Institutional Investor, Inc. (2006). “Country Credit Ratings,” Institutional Investor, 40(3): 99-104.
Iwata, S. and wu, S. (2005). “what Macroeconomic Risks Are (not) Shared by International Investors?” Journal of Money, Credit, and Banking, 37: 1121-1141.
Johansen, S. (1988). “Statistical Analysis of Co-Integration vectors,” Journal of Economic Dynamics and Control, 12: 231-254.
Kempa, B., nelles, M., and Pierdzioch, C. (1999). “The Term Structure of Interest Rates in a Sticky-Price Target Zone Model,” Journal of International Money and Finance, 18: 817-834.
MacKinnon, J.G., Haug, A., and Michelis, L. (1999). “numerical Distribution Functions of Likelihood ratio tests for cointegration,” Journal of Applied Econometrics, 14: 563-577.
Meredith, G. and Chinn, M.D. (1998). “Long-Horizon Uncovered Interest Rate Parity,” NBER Working Paper Series, No. 6797.
Meese, R. and Rogoff, K. (1988). “was it Real? The Exchange Rate-Interest Differential Relation over the Modern Floating-Late Period,” Journal of Finance, 43: 933-948.
Perron, P. (1988). “Trends and Random walks in Macroeconomic Time Series,” Journal of Economic Dynamics and Control, 12: 297-332.
Phillips, P.C.B. and Hansen, B.E. (1990). “Statistical Inference in Instrumental variables Regression with I(1) Processes,” Review of Economic Studies, 57: 99-125.
Said S.E. and Dickey, D.A. (1984). “Testing for Unit Roots in Autoregressive-Moving Average Models of Unknown Order,” Biometrika, 71: 599-607.
Sarno, L. and valente, G. (2002). “Empirical Exchange Rate Models and Currency Risk: Some Evidence from Density Forecasts,” Journal of International Money and Finance, 24: 363-386.
Sayek, S. and Selover, D.D. (2002). “International Interdependence and Business Cycle Transmission between turkey and the European Union,” Southern Economic Journal, 69: 206-239.

20
Selçuk, F. (2005). “The Policy Challenge with Floating Exchange Rates: Turkey’s Recent Experience,” Open Economies Review, 16: 295-313.
Tastan, H. (2005). “Do Real Exchange Rates Contain a Unit Root? Evidence from Turkish Data,” Applied Economics, 37: 2037-2054.
Telatar, E., Telatar, F. and Ratti, R.A. (2003). “On the Predictive Power of the Term Structure of Interest Rates for Future Inflation Changes in the Presence of Political Instability: The Turkish Economy,” Journal of Policy Modeling, 25: 931-947.
Us, v. (2004). “Inflation Dynamics and Monetary Policy Strategy: Some Prospects for the Turkish Economy,” Journal of Policy Modeling, 26: 1004-1014.
wu, S. (2007). “Interest Rate Risk and the Forward Premium Anomaly in Foreign Exchange Markets,” Journal of Money, Credit, and Banking, 39: 23-442.
Zhou, A. (2002). “Modeling the volatility of the Heath-Jarrow-Morton Model: A Multi-Factor GArcH Analysis,” Journal of Empirical Finance, 9: 35-56.

21
DETERMINANTS OF BRAND LOYALTY AND THE LINK BETWEEN BRAND LOYALTY AND PRICE TOLERANCE
EBRu TüMER KABADAYI* İncİ Aygün**
Gebze Institute of Technology Gebze Institute of Technology
ABSTRACT
The aim of this study is to investigate the integrated relationships between brand satisfaction, brand trust and brand affect through the brand loyalty development process and price tolerance as an outcome of the brand loyalty process. Data are collected based on a survey of 1085 students from various universities in Istanbul, Turkey. The findings indicate that brand affect and brand trust are key constructs in the brand loyalty formation process. Brand satisfaction is effective on brand loyalty indirectly through strengthening these constructs. Additionally, brand loyalty is a strong antecedent of consumers’ tolerance to price. The research findings will help provide clarification on how brand loyalty comes about and brings about price tolerance.
Key words: brand loyalty, brand trust, brand satisfaction, brand affect and price tolerance.
MARKA BAĞLILIĞINI BELİRLEYEN FAKTÖRLER VE MARKA BAĞLILIĞI İLE FİYAT TOLERANSININ İLİŞKİSİ
ÖZET
Bu çalışmanın amacı, marka bağlılığı geliştirme süreci içinde marka memnuniyeti, markaya duyulan güven ve markanın oluşturduğu duygular arasında iç içe geçmiş ilişkilerin ve marka bağlılığı sürecinin çıktısı olarak fiyat toleransın incelenmesidir. Veriler İstanbul’daki çeşitli üniversitelerde okuyan 1085 öğrenci üzerinde yapılan anket çalışması ile toplanmıştır. Bulgular, markanın oluşturduğu duyguların ve markaya duyulan güveninin marka bağlılığı oluşturma sürecindeki temel faktörler olduğunu göstermektedir. Marka memnuniyeti ise, bu temel faktörleri güçlendirerek marka bağlılığı üzerinde dolaylı olarak etkili olmaktadır. Ayrıca, marka bağlılığının müşterilerin fiyata olan toleransının güçlü bir öncülü olduğu ortaya çıkmıştır. Araştırmanın bulguları marka bağlılığının nasıl oluştuğunu ve fiyat toleransını nasıl meydana getirdiğini anlamamıza yardımcı olacaktır.
Anahtar kelimeler: marka bağlılığı, markaya duyulan güven, marka memnuniyeti, markanın oluşturduğu duygular
ve fiyat toleransı.
* EbruTümerKabadayıisanAssistantProfessorintheFacultyofBusinessAdministrationattheGebzeInstituteofTechnology,ÇayırovaFabrikaYolu,No:101,41400,Gebze,Kocaeli,Turkey.E-mail:[email protected]
** İnciAygünisaResearchAssistantintheFacultyofBusinessAdministrationattheGebzeInstituteofTechnology,ÇayırovaFabrikaYolu,No:101,41400,Gebze,Kocaeli,Turkey.E-mail:[email protected]
Boğaziçi Journal Vol. 21, no. 1-2 (2007), pp. 21-35.
22
Thelong-termsuccessofabrandisnotbasedonthenumberofconsumerswhobuyitonce,butonthenumberofconsumerswhobecomeregularbuyersofthebrand(Odinetal.,2001).Thisstatementsimplydemystifiesfirms’strictaimstoseek,manageandincreasebrandloyaltytogainadvantageoratleasttosurviveespeciallyinintenselycompetitive,uncertain,andhardlypredictablemarkets.
Aaker(1996)statesthatabrand’svaluetoafirmislargelycreatedbythecustomerloyaltyitcommands.Theliteratureonbrandmanagementprovidesalargeamountofevidenceconcerningpositiveoutputsrelatedtobrandloyalty,suchashighprofitabilityandcompetitiveadvantageforfirms.Theincreasedprofitfromloyaltycomesfrompricepremiums,greatermarketshare(ChaudhuriandHolbrook,2001)andreducedmarketing-operationalcosts(BowenandChen,2001).AsChaudhuriandHolbrook(2001)proposedandconfirmedthatbrandshigherinpurchaseloyaltyarealsohigherinmarketsharebecauseofgreaterlevelsofrepeatpurchasebybrandusersandthatgreaterattitudinalloyaltyshouldleadtogreaterwillingnesstosacrificebypayingapremiumpriceforavaluedbrand.Brandloyaltymayalsohelptoincreasemarketshareindirectlybyprovidingpositivewordofmouth,whichisoneofthemostpowerfulsourcesinpersuasion(Selnes,1993).Becausefindingnewcustomersanddoingbusinesswiththemtakestime,effortandmoney(MittalandLassar,1998)brandloyaltyreducesmarketingcostssinceloyalconsumersalreadyknowtheproductandrequirelessinformation.BallesterandAlleman(2001)indicateotheradvantagesbystatingthatbrandloyaltyprovidesacompetitiveadvantagebygeneratingasubstantialentrybarrier tocompetitors,an increase in thefirm’sability torespondtocompetitivethreats,andacustomerbaselesssensitivetothemarketingeffortsofcompetitorsinhighlycompetitivemarkets.Inaddition,brandloyaltyhasbeenshowntobeassociatedwithhigherratesofreturnoninvestmentthroughincreasesinmarketshare(GounarisandStathakopoulos,2004).
Thebenefitsofbrandloyaltymentionedabove,hasmadeitapopularissueforfirmsandmarketingresearchinthelastthreedecades.Itisoneofthemainpurposesofthisstudytoexplore theprocessthroughwhichbrandloyaltyisformed.Forthispurpose,theeffectsofbrandsatisfaction,brandtrustandbrandaffectareinvestigated.
Anotherpurposeofthisstudyistoinvestigatepricetoleranceasanoutcomeofbrandloyalty.Theconstructs representing consumers’ actual or intended reactions to different price levels such aspricetolerance,brandacceptanceandpricepremiumsareincreasinglystudiedinconsumerbehaviorliterature.Aaker’s(1996)descriptionofpricepremiumasareasonablesummaryofthestrengthofthebrandhelptounderstandtheimportanceoftheseconstructsinbranddomain.Pricetolerancewasincludedinourresearchmodelasaconstructrepresentingconsumer’sdifferingreactionstodifferentpricelevels.Althoughpricetoleranceismoreoftenproposedtobedirectlyrelatedtosatisfactioninpreviousstudies(e.g.,Anderson,1996;Herrmannetal.,2004),inthecurrentstudyitisinvestigatedasaconsequentofbrandloyalty.
Althoughvarious antecedents and consequentsofbrand loyaltyhavebeen separately evaluated innumerousstudies thatare formedondifferent relationshipnetworks, there isstilla lackofaclearunderstanding about the roles of these constructs. For extended and clearer knowledge about thebrandloyaltyconcepttheinteractionofantecedentsandconsequentsofbrandloyaltyneededtobeinvestigated.Forthispurpose,amodelwasdevelopedusingthestructuralequationmodelingapproach,which is adequate for evaluating an integratedmodel. Themodel contained the key determiningconstructsthataremostcommonlymentionedinthebrandloyaltyliteraturesuchasbrandsatisfaction,brandtrustandbrandaffectandpricetoleranceasapositiveoutcome.

23
Thestudybeginswithdescribingtheliterarybackgroundofthismodel.Next,themodelistestedandtheresultsaresummarizedanddiscussed.Finally,suggestionsforfutureresearcharegiven.
FRAMEWORKANDTHEHYPOTHESES
Brand Loyalty
Brandloyaltyhasbeeninvestigatedforalongtimebyresearchersandthereareamplestudiesonthisconcept.However,duetothedifferentperspectivesintheliterature,therearediversedefinitionsofbrandloyalty.In1973,JacobyandKynerpointedouttheproblemofthedefinitionsandoperationalizationoftheconstruct,statingthatsomanydefinitionsmadeitdifficultandhazardoustocompare,synthesizeandaccumulatefindings.Itappearsthatthecomplexityoftheconstructofloyaltystillpreventstheformulationofauniquedefinitionintherecentliterature.ThieleandMackay(2001)statethatinthemarketingliteraturetheterm“loyalty”hasbeenusedinterchangeablywithitsoperationaldefinitionto refer to repeatpurchase,preference,commitment, retentionandallegiance.These termsare theoutputsofdefinitionsthatarerelatedtothedifferentaspectsofbrandloyalty.
QuesterandLim(2003) state that the literature shows twoalternativeapproaches to theconstructofbrandloyalty.Thefirstoneisconcernedwith“aconsistentpurchasebehaviorofaspecificbrandovertime.”Thisisthebehavioralapproachtobrandloyaltyandithasbeenwidelyusedtodefinetheconstruct.Thesecondonereliesonafavorableattitudetowardsabrand.
Neitherapproachseemstobesufficientbyitselftodefinebrandloyaltycompletelyasbothignoreeitherthepsychologicalorbehavioraldynamicsoftheconcept.Oneproblemwiththebehavioralapproachisthatrepeatpurchasesarenotalwaystheresultofapsychologicalcommitmenttothebrand(BowenandChen,2001).Especiallyforlowinvolvementproducts,repeatpurchasingofthesamebrandmaybeahabitualactiontoavoidspendingthetimeandeffortnecessaryforevaluatingalternativebrands.The attitudinal approach,which includes emotional andpsychological attachment to abrand, also

24
hassomeproblemsas theremaybe reasons thatprevent theconsumer frompurchasing thebrandhe/shelovesorhasanattachment.QuesterandLim(2003)indicatethattruebrandloyaltyimpliesacommitmenttoaspecificbrandandgoesbeyondrepetitivebehavior.Inthisstudy,consistentwiththisidea,theconceptofbrandloyaltyincludesbehavioralintentiontobuythesamebrandandrecommendittoothers.Toencourageotherstobuywithstrongrecommendationemphasizestheattitudinalaspectofbrandloyaltyandthepurchaseintentionemphasizesthebehavioralaspect.
Inthemarketingliterature,therearenumerousstudiesthataimedtoexplorethesourcesandoutputsofbrandloyalty.Ashasbeenstatedbefore,theinteractionofbrandsatisfaction,trustandaffectthroughgeneratingbrandloyaltyandpricetoleranceasapositiveoutcomeofitwillbeexaminedinthisstudy.TheproposedmodelispresentedinFigure1.
Brand Satisfaction
Satisfactionisdefinedaspleasurablefulfillment,whichmeanstheconsumersensesthatconsumptionfulfillssomeneed,desire,goalorsoforthandthatthisfulfillmentispleasurable(Oliver,1999).Itis the resultofacognitiveandaffectiveevaluationwhere somecomparisonstandard iscomparedto actually perceived performance (Homburg and Giering, 2001). When the subject is a brand,the evaluation output appears as brand satisfaction versus brand dissatisfaction. Consistent withsatisfactiondefinitionsabove, in thisstudy,brandsatisfaction isconceptualizedas theoutcomeofthesubjectiveevaluationthatthechosenalternativebrandmeetsorexceedsexpectations(LouandLee,1999).Satisfactionisregardedasafundamentaldeterminantoflong-termconsumerbehavior(Ranaweera and Prabhu, 2003), thereby, as one of the key global constructs predicting consumerbehavior(GarbarinoandJohnson,1999).
Althoughitisknownthatbrandsatisfactionhasaroleindevelopingbrandloyalty,thecomplexityofthelinkbetweenthesetwoconstructsmakesithardtogetafullunderstanding.Becauseofthefactthatonlyarelativelysmallportionofsatisfiedcustomersreturnstothesameserviceorproduct(WhiteandYu,2005)andbecausemerelysatisfyingcustomersthathavethefreedomtomakechoicesisnotenoughtokeepthemloyal(Oliver,1999),brandsatisfactionislikelytoneedsomeotherconstructsasmediatingactorstobeeffectiveonbrandloyalty.Inthisstudy,itisproposedthatbrandsatisfactionhasanindirecteffectonbrandloyaltythroughstrengtheningbrandtrustandbrandaffect.
Consumersbuyproducts/services toobtaincertainphysical and/orpsychologicalbenefits.So tobewillingtostayinalong-termrelationshipwiththebrandtheyareverylikelytoneedtobelievethatthebrandwillconstantlyprovidethesamebenefitsandsatisfactionwitheveryproductwiththesamebrandname.Sobrandtrustisneededasamediatingactorbetweenbrandsatisfactionandbrandloyalty.
Thesatisfaction trustrelationshipcanbeproposedbasedonthecharacteristicsanddevelopmentprocessesof theseconstructs.Because trust requires anassessmentof theotherparty’s credibilityandbenevolence,onepartymusthaveinformationabouttheotherparty’spastbehaviorandpromises(DoneyandCannon,1997);thatis,consumptionexperienceisthemostrelevantandimportantsourceofbrandtrustbecauseitgeneratesassociations,thoughtsandinferencesthataremoreself-relevantandheldwithcertainty(BalesterandAleman,2005).Satisfaction,asmentionedabove,isapost-choiceevaluativejudgmentofaspecifictransaction(Selnes,1993)andcanprovidethenecessaryinformationforthebrandtrustassessment.LouandLee(1999)alsostatesatisfactionwithpastoutcomesindicatesequity in the exchange. This increases the perception of the exchange partner’s benevolence and

25
credibility,becausewhenaconsumerissatisfiedwithabrandafterusingit,thissituationissimilartopromisefulfillment.Sincethebrandhaskeptitspromise,theconsumerisliabletotrustitmore.
Hypothesis 1: Brand satisfaction is positively related to brand trust.
Furthermore,thebrandsatisfaction-brandloyaltyrelationshipissuggestedalsotohavebrandaffectas anothermediating actor.Brand satisfaction affects brand loyalty indirectlyby evokingpositivefeelingsaboutthebrandbecauseofthebenefitsitprovides.
Hypothesis 2: Brand satisfaction is positively related to brand affect
Thissuggestedrelationshipmayalsomeantheindirecteffectofsatisfactiononbrandtrustbecauseofthesuggestedeffectofbrandaffectonbrandtrustthatwillbediscussedbelow.
Brand Trust
MorganandHunt(1994)conceptualizetrustasexistingwhenonepartyhasconfidenceinanexchangepartner’sreliabilityandintegrity.Probablybecauseitisgenerallyviewedasanessentialingredientforsuccessfulrelationships,asstatedinGarbarinoandJohnson(1999),trustisoneofthemostfrequentlymentionedfactorsintherelationalmarketingliterature(MorganandHunt,1994;DoneyandCannon,1997; Selnes, 1998; Lau and Lee, 1999; Chaudhuri and Holbrook, 2001; Ballester and Aleman,2005).
In thebrand-consumer relationship, trust shouldalsobeacrucial factor. It shouldbe important tobuildatrustworthyimageforthebrandbecauseinmostcasesconsumersseemtomeetthebrandofaproduct/servicebeforemeetingtheproducer,salesperson,etc.BallesterandAleman(2005)defineatrustworthybrandasonethatconsistentlykeepsitspromiseofvaluetoconsumersthroughthewaytheproductisdeveloped,produced,sold,servicedandadvertised,eveninbadtimeswhensomekindofbrandcrisisarises.Followingthedefinitions,itisnothardtorelatebrandtrusttobrandloyalty,logically.Previousstudiesstrengthenthisexpectation.
Morgan and Hunt (1994) explain the trustcommitment link by pointing out that relationshipscharacterized by trust are so highly valued that partieswill desire to commit themselves to suchrelationships.DoneyandCannon(1997)alsostatethatthehighleveloftrustcharacteristicofrelationalexchangeenablespartiestofocusonthelong-termbenefitsoftherelationship.
Chaudhuri and Holbrook (2001) suggest that brand trust leads to brand loyalty or commitment,becausetrustcreatesanexchangerelationshipthatoneishighlyinvolved.Indeed,commitmenthasbeendefinedasanenduringdesiretomaintainavaluedrelationship.Thus,loyaltyorcommitmentunderlies theongoingprocess ofmaintaining a valued relationship that has been createdby trust.Inotherwords, trustandcommitmentshouldbeassociatedbecause trust is important inrelationalexchangesandcommitmentisalsoreservedforsuchvaluedrelationships.
Inthiscontext,itcanbeproposedthatatrustedbrandshouldbepurchasedmoreoftenandshouldevokeahigherdegreeofattitudinalcommitment.Iftheconsumertruststhebrandhe/shewillbemorelikelytobuildalong-termrelationshipwiththebrandthatincludespositivebehavioralintentionandattitudinalloyalty.

26
Hypothesis 3: Brand trust is positively related to brand loyalty
Brand Affect
According toWestbrook (1987), affect is to compromise a class of mental phenomena uniquelycharacterized by a consciously experienced, subjective feeling state, commonly accompanyingemotionsandmoods.Inthesamestudy,Westbrook(1987)pointsoutthatadvancesinsocialcognition,cognitivepsychologyandsocialpsychologysuggestthataffectiveprocessesmayconstitutenotonlyapowerfulsourceofhumanmotivation,butalsoinfluenceinformationprocessingandchoice.Itappearsthattheaffectiveprocessmaybeadeterminantofconsumerbehaviorinthelongterm.Inthisstudy,affectiveresponsesrelatedtousageofabrandareproposedasantecedentsofbrandtrustandbrandloyalty.FollowingChaudhuriandHolbrook(2001),brandaffectisdefinedasabrand’spotentialtoelicitapositiveemotionalresponseintheaverageconsumerasaresultofitsuse.
Asmentionedabove, thebrandaffectissupposedtobeeffectiveonbrandloyaltybothinadirectandanindirectway.Indirectly,positivebrandaffectwillbeeffectiveonbuildingbrandloyaltybyincreasingtrustfeelingforthatbrand.Asaffectiveresponseshavebeenshowntobeabletoinfluencecognitiveprocessessuchasevaluation,recallandjudgment(Nyer,1997),consumers’affectiveresponsetoabrandusageislikelytobeeffectiveontheformationofbrandtrust.Soitcanbeproposedthathavingpositiveconsumptionelicitedaffectiveresponserelatedtobrandmayenableattributingatrustworthyimagetothatbrand.
Hypothesis 4: Brand affect is positively related to brand trust
Inaddition,brandaffectcanbeproposedasbeingaffectiveonloyaltydirectlybecauseloyaltywillbegreaterundertheconditionofmorepositiveemotionalmoodoraffect.Thatis,brandsthatmakeconsumers happy or joyful or affectionate should prompt greater purchase and attitudinal loyalty(ChaudhuriandHolbrook,2001).Inotherwords,positiveemotionalmoodoraffectaboutabrandwillencourageloyalty.
Hypothesis 5: Brand affect is positively related to brand loyalty
Price Tolerance
Pricetolerancecanbedescribedasthereactionofcustomerstothepriceincreaseofaspecificproductandisconstructedasapricespanwithintheboundariesofwhichtheconsumerdoesnotchangehis/herbuyingbehavior.Inthisway,thetoleratedpricerangestretchesfromtheactualpricepaidbytheconsumer to themaximumprice thataconsumer iswilling topay for theproduct (Hermanetal.,2004).Definitionsoftheconstructsabovearelikelytohelpusbuildthelogicallinkbetweenbrandloyaltyandpricetolerance.Butitisalsopossibletofindevidenceforthislinkinsomestudiesthatinvestigateconsumers’priceacceptance.Forinstance,Huberetal., (2000)investigatetherelationshipbetweencustomersatisfactionandpriceacceptancethatwasconceptualizedasthepotentialbuyers’willingnesstopurchaseasafunctionofvariousprices.Asseeninthisaspect,pricetoleranceislikelyto represent the latitudeofbrandacceptance. Latitudeofbrandacceptance is a concept that alsowasusedinKalyanaramandLittle(1994),whomadeanempiricalanalysisofthelatitudeofpriceacceptanceinconsumerpackagedgoods.Theysuggestthatconsumerswhoareontheaveragemore

27
brandloyalinagivenproductcategorywouldbelikelytohaveawiderlatitudeofpriceacceptanceforthatbrandbecausebrandloyaltywouldkeeptheconsumermorefocusedonthebenefitsofthebrandand less focused on price.Chaudhuri andHolbrook (2001) found a positive relationship betweenfavorablebrandattitudeandbeingmorewillingtopaypremiumpricesforabrand.
Hypothesis 6: Brand loyalty is positively related to price tolerance
METHOD
Data collection
Althoughitmayreducetheexternalvalidityofthestudybylimitingthegeneraluseofthefindings,datawerecollectedwithrespecttoonlyoneproductcategory,namelyjeans.Studyingonlyoneproductcategorymayhighlighttheprocessthroughwhichbrandloyaltyformsandleadstopricetolerancemoreclearlybyeliminatingthedifferencesinresponsepatternsduetodifferentreferencepoints.Jeanswerechosenastheproductcategorybecausemostpeoplearefamiliarwiththem,theyarepurchasedbydifferentsegmentsofthepopulationandtherearemanyalternativebrandswithdifferentquality,price,reputation,etc.Also,thisproductmayaddressbothutilitarianandhedonicneedsthatmayhelptosatisfyconstructs’differentaspectsifavailable.
DatawerecollectedfromasamplecomposedofstudentsfromnineuniversitieslocatedinIstanbul,Turkey.Theuniversitieswerechosenconsideringtheirtypeandlocation.TwoprivateandtwopublicuniversitiesontheEuropeansideofIstanbulandthreepublicandtwoprivateuniversitiesonAsiansidewerechosen.Atotalof1117questionnairesweredeliveredtostudentsonthecampusesoftheseuniversities.
Respondentswereasked toname the jeanbrand theyhadboughtmost recently andanswered thequestions thinking about that brand.After the elimination of some receivedquestionnaires due toexcessiveamountsofmissingdata,1085wereusedforanalysisthatweresubstantiallycompleteandresultedinavalidresponserateof82.74%.
Measurement
BrandsatisfactionwasmeasuredusingascaledevelopedbyLauandLee(1999).Ofthesevenitemsinthescale,fiveitemswereused,ofwhichthreewerereversed.Itemsaimed tomeasureconsumers’cognitivereactionsrelatedtoproductusage.TheoperationalizationofbrandaffectinvolvedadaptingChaudhuri andHolbrook’s (2001) three-itemscale,whichmeasures consumer’spost-consumptionpositiveaffectiveresponses.ChaudhuriandHolbrook’s(2001)three-itemscalewassupplementedbyanadditionalitemfromthestudyofLouandLee(1999),andtheresultingfour-itemscalewasusedtomeasurebrandtrust.Itinvolveditemsthataimedtoexploredirectlywhethertheconsumerfeltsecurityaboutthebrand.Eightitemswereusedtomeasurebrandloyalty,composedofthebehavioralandattitudinalaspectsoftheconstruct.ItemsweredrawnfromLouandLee’sscale(1999).Finally,following Ballester and Aleman (2001), price tolerance was measured by asking respondents iftheywouldbewillingtopaymoreforthebrandcomparedtootherbrands.MeasurementitemsarerepresentedinTable2.

28
All variables were measured based on a five-point Likert scale ranging from 1=strongly disagreeto 5=strongly agree. The questionnaire was pre-tested with 45 university students, and the finalquestionnairewasdevelopedwithrevisionofsomeitemsforclarityofwording.Toavoidresponsebias,thequestionnairewasdesignedintwoformsincludingthesamescaleitemsbutindifferentorder.
DATAANALYSISANDRESEARCHRESULTS
Table1givessummaryinformationaboutthesampleprofile.Ascanbeseen,thesampleishighlyconcentrated(74.9%)inthe20-24agerange.Mostoftheparticipantswereunemployedrespondentsfrompublicuniversitieswithincomesinthe1000-2500YTLincomerange.
Table 1Sample Statistics
Monthlypersonalincome*
Monthlyhouseholdincome
Percent Percent Percent Percent
Gender Employmentstatus Lessthan300YTL
22.7 1.3
Male 40.4 Employed (fullorpart-time)
15 300-600YTL
36.7 9.3
Female 59.6 Unemployed 85 601-999YTL
15.1 13.8
Age 1000-1499YTL
12.6 22.3
From15to19
19 Universitytype 1500-2499YTL
10.9 17.5
From20to24
74.9 Publicuniversity 68.1 2500-3499YTL
10.1
From25to29
5.9 Privateuniversity (withscholarship)
9.1 3500-5000YTL
1.7 9.1
30andolder
0.4 Privateuniversity (noscholarship)
22.8 Morethan5000YTL
0.8 16.6
*Monthlypersonalincomerepresentsincomeofemployedrespondents
Validity and Reliability of Scale
Initiallyanexploratoryfactoranalysiswascarriedoutemployingprincipalcomponentanalysisandrotatedusingvarimaxrotation.Atotaloftwoitemswereeliminated,onefromthebrandsatisfactionscaleandonefromthebrandloyaltyscale,ofwhichtheloadingonrespectivefactorwasbelow0.5.Thenallmeasureswereanalyzedforvalidityandreliabilitythroughconfirmatoryfactoranalysis.

29
Apurifiedfullmeasurementmodelwasproposedwith four reflectivemultiple itemfactors:brandsatisfaction, brand trust, brand affect, brand loyalty (with attitudinal and behavioral dimensions).The single item factor “price tolerance” was added to the model, setting its measurement errorat 10%variance of respective factor. This fullmeasurementmodelwas tested inAMOS5 usingthe maximum likelihood estimation techniques. As presented in Table 2, Goodness of Fit Index (GFI) = 0.91; Comparative Fit Index (CFI) = 0.92; Root Mean Square Error of Approximation(RMSEA) = 0.07 were in acceptable ranges although the chi-square statistic was very large (χ2
(141)=1027.032p<0.01),probablyduetothelargesamplesize.
To assess the reliability, the Cronbach’s alpha coefficient and composite reliability scores werecalculated.AspresentedinTable2compositereliabilityscoreswerewelloverthecriticallevel0.6(Fornell andLarcker,1981)and theCronbach’salphacoefficientswereover0.7 (Nunnaly,1978)indicatingreliabilityof themeasurementmodel.Estimatesofpathsfromindividual itemsto latentfactorsarealsoshowinTable2andtheyareallsignificant(p<0.01),providingevidenceforconvergentvalidity.
Discriminant validity was evaluated based on Fornell and Larcker’s (1981) criterion. The sharedvariance between pairs of latent factors in the structuralmeasurementmodelwas comparedwithaveragevarianceextractedthatwascalculatedforeachcomponentofpairs.Itwasfoundthataveragevarianceextractedwasgreater,providingevidencefordiscriminantvalidity.Itcanbeconcludedonthebasisofthereliabilityandvalidityanalysisthatscalesfortheconstructsappeartohaveacceptablemeasurementquality.Themeans,standarddeviations(SD)andinter-correlationsamongvariablesarerepresentedinTable3.Inthistable,theupperpartrepresentsthecorrelationsamonglatentfactors,andthepartbelowrepresentsthecorrelationsamongaggregatedmeasures.
Tests of the Hypotheses
The proposed research model, presented in Figure 1, was tested using the maximum likelihoodmethodinAMOS5.Goodnessoffitstatisticswereattheacceptablelevels(GFI=0.90;CFI=0.91;RMSEA=0.07),supportingtheoverallfitofproposedmodeltoourdata,althoughthechi-squarestatisticwasχ2
(141)=1028.974p<0.01.Theunexpectedlylargechi-squarevaluecanbeattributedtotherelativelylargesamplesizeinourresearch.Alsothestandardizedestimates,showninTable4,areallsignificantatp<0.01indicatingthatallofthehypothesizedlinksaresupported.Links,theirstandardizedestimates,andsignificancelevelsarepresentedinTable4.
TheresultsforH1and H2 supporttheconclusionthatconsumers’satisfactionwithabrandiseffectiveonbothdevelopingtrustandpositiveaffecttothatbrand.AlsoH4,suggestingthepositiverelationshipbetweenbrandaffectandbrandtrust,wassupported,meaningthatconsumers’positivefeelingaboutusingthatbrandiseffectiveonbuildingtrusttowardsthatbrand.
Continuingwiththeantecedentsofbrandloyalty,theresearchresultspresentempiricalsupportforthepositiveeffectofbrand trustandbrandaffectondevelopingbrand loyaltyashypothesizedbyH3andH5. Thestandardizedestimatesrevealthatbrandloyaltydependsonbrandtrustalittlemorethanbrandaffect(0.497and0.428;p<0.01).Finally,consideringtheconsequentsofbrandloyalty,resultsconfirmthatbrandloyaltyhasaninfluenceonthepricetoleranceofconsumers.Thus,thelasthypothesisH6wasalsosupported.

30
Table 2Measurement Items
Measurement item Estimates Alpha SCR AVE
Brand Satisfaction (BS) .80 .80 .50
ThisbrandhasnotworkedoutaswellasI
thoughtitwould.
.695**
Iamsatisfiedwithmydecisiontobuythis
brand
.574**
IamnothappythatIboughtthisbrand .796**
Ifeelbadaboutmydecisiontobuythisbrand .737**
Brand Trust (BT) .88 .88 .64
Itrustthisbrand .830**
Irelyonhisbrand .806**
Thisisanhonestbrand .747**
IfeelsecurewhenIbuythisbrandbecauseI
knowthatwillneverletmedown
.825**
Brand Affect (BA) .90 .90 .75
IfeelgoodwhenIusethisbrand .818**
Thisbrandmakesmehappy .883**
Thisbrandgivesmepleasure .897**
Brand Loyalty (BL) .76 .92 .85
Behavioral(intentional) .961** .74
Idointendtokeepbuyingthisbrand .689**
Ifthisbrandisnotavailableinthestorewhen
Ineedit,Iwillbuyitanothertime
.654**
Ifthisbrandisnotavailableinthestorewhen
Ineedit,Iwillbuyitsomewhereelse
.512**
IfanotherbrandishavingasaleIwillbuythe
otherbrandinsteadofthisone*
.689**
Attitudinal(emotional) .893** .75
Ifsomeonemakesanegativecommentabout
thisbrandIwoulddefendit
.742**
Ioftentellmyfriendshowgoodthisbrandis .653**
Iwouldnotrecommendthisbrandto
someonewhocannotdecidewhichbrandto
buyinthisproductclass*
.713**
Price Tolerance (PT) Not
available
Not
available
Not
available
Iwouldbewillingtopaymoreforthisbrand .950**
χ2 (141)=1027.032p<0.01;GFI=0.91;CFI=0.92;RMSEA=0.07
**p<0.01

31
Table 3Descriptive Statistics
Mean Std.Deviation 1 2 3 4 5
1.BrandSatisfaction 4.0645 .7321 1 .47** .29** .36** .25**
2.BrandTrust 3.4126 .8775 .41** 1 .65** .78** .55**
3.BrandAffect 3.3015 1.0532 .29** .58** 1 .75** .56**
4.BrandLoyalty 2.8890 .8127 .28** .63** .61** 1 .74**
5.PriceTolerance 2.79 1.32 .24** .49** .51** .61** 1
**p<0.01
Table 4The Standardized Path Estimates and Fit Statistics
Hypotheses Link Estimate S.E. C.R. P
H1 BrandSatisfaction BrandTrust .302 .039 9,611 .000
H2 BrandSatisfaction BrandAffect .294 .052 8,270 .000
H3 BrandTrust BrandLoyalty .497 .035 12,629 .000
H4 BrandAffect BrandLoyalty .428 .028 11,466 .000
H5 BrandAffect BrandTrust .556 .026 17,973 .000
H6 BrandLoyalty BrandTolerance .732 .061 19,604 .000
Chi-square=1028.974Degreesoffreedom=145Probabilitylevel=0.000Goodnessoffitindex(GFI)=0.90Comparativefitindex(CFI)=0..91Rootmeansquareerrorofapproximation(RMSEA)=0.07
Table 5Results of the Hypothesis Tests
Hypotheses Link Results
H1 BrandSatisfaction BrandTrust Supported
H2 BrandSatisfaction BrandAffect Supported
H3 BrandTrust BrandLoyalty Supported
H4 BrandAffect BrandLoyalty Supported
H5 BrandAffect BrandTrust Supported
H6 BrandLoyalty BrandTolerance Supported

32
DISCUSSION
Thisstudy investigates therolesofbrandsatisfaction,affectand trustas interactedantecedentsofbrand loyaltyand the linkbetweenbrand loyaltyandprice tolerance.Theanalysis resultsprovidesupportforalllinkagesthatarehypothesizedintheresearchmodel.
Intheliterature,satisfactionisfrequentlyinvestigatedinvariouspositionsasoneofthemainantecedentsofloyalty.Inthepresentstudy,itwassupposedthatsatisfactionwouldbeinanindirectrelationshipwithbrandloyalty.Intheresearchmodelproposingthatconsumer’ssatisfactionwouldrequiresomemediatingactorstoaffectbrandloyalty,thesatisfactionbrandloyaltydirectrelationshipwasnotallowed. The acceptable fit statistics confirmed this overall proposition. Moreover, modificationindiceswerecheckedand itwasfound that therewasnoother linkneeded.This findingprovidesadditionalsupportforthesuggestionabouttheindirectrelationshipbetweenbrandsatisfactionandbrandloyalty.Inthisindirectrelationship,themediatingroleofbrandtrustandbrandaffectcanbeseenclearly.TheresultsconfirmedH1thatsupposedthelinkofbrandsatisfactionbrandtrust(estimate1
=0.30p<0.01).Brandsatisfactionwasalsofoundtohaveaneffectonbrandaffect(estimate2 =0.29p<0.01)asstatedinH2.Itseemsthatconsumer’ssatisfactionlevelwaseffectiveatasimilarlevelbothonbeing formedofpositive feelingsaboutusing thebrandand the trustworthy imageof thebrand.Intheresearchmodelitwasalsoproposedthatconsumerswholikeusingabrandwouldbemoreinclinedtofindapositiveresultattheendoftheevaluationaboutthetrustworthinessofthatbrand.AnalysisresultsconfirmedH4,whichproposedthatbrandaffectwouldbeeffectiveonbrandtrust.Inotherwords,consumersareinfluencedbytheirfeelingsofusingthatbrandinattributingatrustworthyimagetothatbrand(estimate4=0.56p<0.01).Inthisrelationshipnetwork,halfof thevarianceinbrandtrustisexplainedbybrandsatisfactionandbrandaffect.Butthebrandaffectfactorwasexplainedintheratioof9%.Itseemsthatthereisanotherfactor(s)effectingconsumer’sfeelingsaboutbrandthatwasnotproposedintheresearchmodel.
Intheresearchmodel,brandtrustandbrandaffectwereproposedtobeantecedentsofbrandloyalty.ItwasnotunexpectedtoseeadirectandquitestrongeffectofbrandtrustonbrandloyaltyasH3 (estimate3=0.50p<0.01)becausetheimportantroleoftrustasadirectandalsoasamediatingfactorwasmentionedbefore in thebrandand relationship literature (LauandLee,1999;ChaudhuriandHolbrook,2001;BallesterandAleman,2005,e.g.)andsupportedbyempiricalevidence.Inthisstudy,additionallyanotherkeyvariable,brandaffectwasproposedtobeeffectiveonbrandloyaltydirectly.The roleofbrandaffect in theprocess inwhichbrand loyaltycomesabout isnearlyas strongasbrandtrusthavingasignificantdirecteffectasstatedinH5(estimate5= 0.43p<0.01) andalsoplayingamediating role betweenbrand satisfaction and brand loyalty.The strong role of brand affect inthisprocesscanbeattributedtothesampleprofileandtheproductcategoryforwhichtheresearchdatawerecollected.Clothesmaybeperceivedasasocialstatussymbolamonguniversitystudent,whichmayincreasetherelativeeffectoffeelingsondecisions,choiceorjudgmentsaboutthebrand.Futureexaminationoftheresultsabouttheserelationshipshasshownthatbrandtrustandbrandaffectexplain a very satisfactory amount of the observedvariance in brand loyaltywith a 0.70 squaredmultiplecorrelationvalue.Itwasanimportantfindingasoneofthemainpurposesofthestudywastoexaminetheprocessthroughwhichbrandloyaltydevelops.
33
The results also present some important explanations about how consumers would bemotivatedto be ready to pay premiumprices for the brand.Different from some earlier findings (Hermannetal.,2004;Huberetal.,2000,e.g.)indicatingadirectrelationshipbetweensatisfactionandpricetolerance,thepresentresultsshowthatsatisfactionaffectspricetoleranceindirectlythroughbrandaffect,brandtrust,andbrandloyalty.Evaluationofthemodificationindicesstrengthensthisfindingofferingnoadditionallink.AsstatedinH6,consumers’willingnesstopaypremiumpriceforabrandisdirectlyrelatedtohowloyaltheyaretothatbrand.Andthisrelationwasfoundsostrong(estimate6
= 0.73p<0.01)thatbrandloyaltywasabletoexplainmorethanhalfofthevarianceobservedinpricetolerance.Itappearsthattheacceptabilityofpricelevelsforabrandisstronglyinfluencedbyhowstronglyconsumersintendtobuythesamebrandagainandre-patronizeit.
Itisaclearfactthatfirmsthataimnotonlytomaketheirbrandssurviveinintensivelycompetitivemarketsbutalsooutperformtherivalshavetopaygreatattentiontobrandloyalty.Firmscantakeadvantageofpricetoleranceandsomeotherconsequencesiftheysucceedatcreating,maintainingandincreasingbrandloyalconsumerportfolios.Butitisnotalwayseasytoacquireconsumerswillinginalong-termrelationshipwithabrand,especiallyinsomemarketswherenumerousalternativeswithsimilarofferingsexist.
Asfortheantecedents,satisfactionwasseenasthemainfactorintheprocessofestablishingbrandloyalty.But the findings of this research extend some previous insights that satisfactionmay notbeenoughtomakeconsumersloyaltoonebrandoverothers.Inparallelwiththetheoreticalsuggestionsofpreviousstudies,ourcurrentempiricalfindingsalsostress thenecessityofa trustworthyimageforabrandtogainaloyalconsumerportfolio.Anotherimportantfindingistheevidenceabouttherelationshipbetweenconsumption-evokedemotionsandbrandloyalty. Intheirmarketingpoliciescompaniesshouldconcentrateondeepermarketresearchtoacquirecompleteknowledgeaboutthedynamicsofaffectiveresponsestobecapableofprovidingconsumerstofeelsohappy,pleasantandsoforth.Throughtheseeffortscompaniescandevelopconsumerwillingnesstostayinalong-termrelationshipwiththeirbrands.
LIMITATIONSANDFURTHERRESEARCHIMPLICATIONS
Theresultsofthisstudyhaveseverallimitationsthatshouldbeconsidered.Thegeneralizationofthefindingsislimitedbecauseofthelimitedvarietyinthesampleprofile.Anotherlimitationisthatthedatawerecollectedwithrespecttoonlyoneproduct.Intermsoffutureresearch,theselimitationspointtotheneedtoexpandthevarietyofsampleprofilesandproductsonwhichtheresearchisbased.
Thefindingsofthisstudyalsoleadtosomeothersuggestionsforfutureresearch.Theresearchmodelcanberefinedbyevaluatingsomeotherprimaryconsequentsofbrandloyalty.Ontheotherhand,a better understanding of the process inwhich brand loyalty is secured through brand affect canbereintroducedintothemodelasamulti-dimensionalconstructprovidingmoreinformationaboutconsumers’ affective response to brand usage. In addition, future research can provide extendedknowledgeaboutthebrandloyaltyconceptbyalsoconsideringsomecomponentsofthecognitiveprocessinwhichconsumerengageindecision-makingaboutbrands.
34
REFERENCES
Anderson,E.W.(1996).“ConsumerSatisfactionandPriceTolerance,”Marketing Letters,7(3):265-274.
Aaker,D.A.(1996).Building Strong Brand.London:FreePress.
------ (2006). “Measuring Brand Equity across Products and Markets,”California Management Review,38(3):102-120.
Ballester, E.D. andAlleman, J.L.M. (2001). “BrandTrust in theContext ofConsumer Loyalty,”European Journal of Marketing,35(11/12):1238-1258.
------ (2005).“DoesBrandTrustMatter toBrandEquity?”Journal of Brand Management,14(3):187-196.
Bowen, J.T. andChen, S.L. (2001). “TheRelationship betweenCustomerLoyalty andCustomerSatisfaction,”International Journal of Contemporary Hospitality Management,13(5):213-217.
Chaudhuri,A.andHolbrookM.B.(2001).“TheChainEffectsfromBrandTrustandBrandAffecttoBrandPerformance:TheRoleofBrandLoyalty,”Journal of Marketing,65(2):81-93.
DoneyM.P. and Cannon, J.P. (1997). “An Examination of the Nature of Trust in Buyer–SellerRelationships,”Journal of Marketing,61(2):35-51.
Fornell,C. andLarcker,D.F. (1981). “EvaluatingStructuralEquationModelswithUnobservableVariablesandMeasurementError,”Journal of Marketing Research,18(01):39-50.
Garbarino,E.andJohnson,M.S.(1999).“TheDifferentRolesofSatisfaction,TrustandCommitmentinCustomerRelationship,” Journal of Marketing,63(2):70-87.
Gounaris,S.andStathakopoulos,V.(2004).“AntecedentsandConsequencesofBrandLoyalty:AnEmpiricalStudy,”Journal of Brand Management,11(4):283-306.
Hermann, A., Huber, F., Sivakumar, K., andWricke,M. (2004). “An Empirical Analysis of theDeterminantsofPriceTolerance,”Psychology & Marketing,21(7):533.
Homburg,C. andGiering,A. (2001). “PersonalCharacteristics asModeratorsof theRelationshipbetween Customer Satisfaction and Loyalty-An Empirical Analysis,”Psychology and Marketing,18(1):43-66.
Huber,F.,Herrmann,A.,andWricke,M.(2001).“ConsumerSatisfactionAsanAntecedentofPriceAcceptance:ResultsofanEmpiricalStudy,”Journal of Product and Brand Management,10(3):160-169.
35
Jacoby, J. andKyner,D.B. (1973). “BrandLoyalty vs.Repeat PurchasingBehavior,” Journal of Marketing Research,10(01):1-9.
Kalyanaram,G.andLittle,J.D.C.(1994).“AnEmpiricalAnalysisofLatitudeofPriceAcceptanceinConsumerPackageGoods,” Journal of Consumer Research,21(3):408-41.
Lou,G.T.andLee,S.H.(1999).“Consumers’TrustinaBrandandLinktoBrandLoyalty,”Journal of Market Focused Management,4:341-370.
Mittal,B. andLassar,W.M. (1998). “WhyDoCustomersSwitch?TheDynamics ofSatisfactionVersusLoyalty,”The Journal of Services Marketing,12(3):177-194.
Morgan,R.M.andHunt,S.D.(1994).“TheCommitmentTrustTheoryofRelationshipMarketing,”Journal of Marketing,53(3):20-38.
Nyer, P.U. (1997). “A Study of Relationships between Cognitive Appraisals and ConsumptionEmotions,”Academy of Marketing Science Journal,25(4):296-304.
Nunnaly,J.C.(1978).Psychometric Theory.2nded.NewYork:McGrawHill.
OdinY.,Odin,N.,andFlorence,P.V.(2001).“ConceptualandOperationalAspectsofBrandLoyalty:AnEmpiricalInvestigation,”Journal of Business Research,53:75-84.
Oliver,R.L.(1999).“WhenceConsumerLoyalty?”Journal of Marketing,63:33-44.
Quester, P. andLim,A.L. (2003). “Product Involvement /BrandLoyalty: Is There aLink?” The Journal of Product and Brand Management,12(1):22-38.
Ranaweera,C.andPrabhu,J.(2003).“TheInfluenceofSatisfaction,TrustandSwitchingBarriersonCustomerRetentioninaContinuousPurchasingSetting,”International Journal of Service Industry Management,14(4):374-395.
Selnes,F.(1993).“AnExaminationofEffectofProductPerformanceonBrandReputation,SatisfactionandLoyalty,”European Journal of Marketing,27(9):19-35.
------ (1998). “Antecedents and Consequences of Trust and Satisfaction in the Buyer-SellerRelationship,”European Journal of Marketing, 32(3/4):305.
Thiele,S.R.andMackay,M.M.(2001).“AssessingthePerformanceofBrandLoyaltyMeasures,”The Journal of Services Marketing,15(7):529-546.
Westbrook, R.A. (1987). “Product/Consumption-Based Affective Responses and Post PurchaseProcesses,”The Journal of Marketing Research,24(3):258-270.
White,C.andYu,Y.T.(2005).“SatisfactionEmotionsandConsumerBehavioralIntentions,”Journal of Service Marketing,19(6):411-420.


37
LAYOFF SURVIVORS’ PERCEPTIONS OF FAIRNESS AS DETERMINANT OF AFFECTIVE COMMITMENT FOLLOWING
DOWNSIZING
ALPER ERTÜRK*
Turkish Naval Academy
ABSTRACT
This study examines the effects of fairness perceptions on the organizational commitment of downsizing survivors during the February 2001 economic crisis. Samples were drawn from blue-collar employees in the service industry. In the statistical analysis, distributive justice was found to be significantly related to the affective commitment of survivors, while procedural justice was not found to be positively associated with the affective commitment of survivors in the service industry. The analysis also yields that interactional justice is strongly and positively associated with the affective commitment of survivors. The managerial and theoretical implications of study are also discussed.
Key words: distributive justice, procedural justice, interactional justice, affective commitment.
Küçülme SonraSı DuyguSal Bağlılığı Belİrleyen FaKtör olaraK İşten çıKarılmayan çalışanların aDalet algıları
ÖZET
Bu çalışma, Şubat 2001 döneminde personel çıkarma yoluyla küçülme stratejisi izleyen firmalarda, küçülmeden sonra işten çıkarılmayan çalışanların adalet algılarının firmalarına karşı hissettikleri duygusal bağlılık üzerindeki etkilerini incelemektedir. Örneklem, hizmet sektöründe faaliyet gösteren firmalardan seçilmiştir. Yapılan istatistiksel analiz neticesinde, hizmet sektöründe prosedür adaleti işten çıkarılmayanların duygusal bağlılıkları üzerinde etkili değil iken, dağıtım adaletinin işten çıkarılmayanların duygusal bağlılıkları üzerinde etkili olduğu bulunmuştur. Analiz sonucunda ayrıca, etkileşim adaletinin işten çıkarılmayanların duygusal bağlılıkları üzerinde kuvvetli bir pozitif etkiye sahip olduğu da tespit edilmiştir. Çalışmanın teorik ve pratik sonuçları da tartışılmıştır.
anahtar kelimeler : dağıtım adaleti, prosedür adaleti, etkileşim adaleti, duygusal bağlılık.
Turkey has been confronted with a series of deep economic crises in the last 14 years, two of them in 1994, 1999, and the last one in 2001. These crises affected all major industrial sectors (Zehir, 2005). Although the consequences of the crises varied across firms and industries, the threat it presented was
* Dr. Alper Ertürk is an instructor in the Naval Sciences and Engineering Institute at Turkish Naval Academy, 34944, Tuzla, Istanbul, Turkey. E-mail: [email protected]
Boğaziçi Journal Vol. 21, no. 1-2 (2007), pp. 37-58.
38
nationwide. Therefore, firms had to adjust their strategies in order to cope. Employee downsizing was preferred by most companies attempting to cope with fundamental structural changes in this crisis situation. In other words, employee downsizing was realized as the only feasible restructuring strategy in the short term during the February 2001 crisis.
Employee downsizing can be defined as intentionally and strategically laying off employees during times of economic crisis (Filatotchev et al., 2000). Employee downsizing is a systematic reduction of a workforce by an employer, usually as a result of financial losses, cash flow difficulties, loss of government contracts, technological changes, or international competition (Applebaum, Simpson and Shapiro, 1987). Companies downsize by terminating or transferring employees, offering early retirement, or imposing hiring freezes (Tang and Fuller, 1995). It is understandable why executives in a crisis choose downsizing. Labor costs are one of the largest expenses. Layoffs are also a management consultant’s dream that can yield immediate financial results and rescue the company. Thus, downsizing is a short-term “money maker” (Rayburn, 1999).
Compared to portfolio and financial restructuring strategies, which have received considerable attention in the strategic restructuring literature, organizational downsizing is still relatively under-researched (Bowman et al., 1999). However, employee downsizing has been identified as a distinctive and important element of strategic choice aimed at bringing a firm’s output in line with demand through permanent reductions in human resources (Filatotchev et al., 2000). Researchers have not focused on labor retrenchment as a mode of restructuring and in general “downsizing is probably the most pervasive yet under-studied phenomenon in the business world” (Cameron, 1994: 183).
Prior research has shown that downsizing can have strong effects on survivors’ (those who remain employed subsequent to downsizing) behavior, such as job involvement (Allen, et al., 2001; Brockner et al., 1988), organizational citizenship behaviors (Bies et al., 1993) and work effort (Brockner et al., 1992a). Although a great deal is known about survivors’ immediate reactions to downsizing, such as job involvement and work effort, little is known about survivors’ longer-term behavioral responses, particularly in terms of their willingness to remain in the organization or organizational commitment.
Most research about downsizing and its effect on employees has been realized in the western empirical context. So as a different perspective, this article focuses on the effect of employees’ justice perceptions on their organizational commitment under conditions of job-insecurity created by considerable employee layoffs in Turkey. Our aim is to examine the effect of managerial fairness on survivors’ organizational commitment to their organization while experiencing the downsizing in the organization. In the theoretical model, it is explicitly emphasized that employees’ justice perceptions will be positively associated with survivors’ organizational commitment.
Accordingly, the present study explores the relationship between perceived organizational fairness and affective commitment across blue-collar workers who remain employed after layoffs in five different service companies in Turkey. The data were collected during the most influential days of the February 2001 economic crisis. Therefore, the present sampling context represents a unique opportunity to explore the relationship between fairness perceptions and the commitment of employees -layoff survivors-, under highly unstable economic conditions and strong feelings of job insecurity. Indeed, in the companies chosen as the sample substantial employee layouts had been realized shortly before or during the data collection.
39
Most of the literature on organizational psychology has been focused on western countries, which have relatively more stable economic conditions. Especially, research in work-related psychology, conducted in different cultural context and economic conditions, is weak and has a lot of room for expansion, innovation and improvement (Glazer, 2002). After the economic crises in the late 1990s, Turkey went through a major change process in the strategies and structures of public and private organizations. Thus, those changes in the business environment created new opportunities for researchers to test and validate the applicability of organizational psychology theories in different economic conditions. So, results from Turkish samples provide valuable insights for practicing business managers in Middle Eastern and Central Asian countries, where research is almost non-existent. Testing the cross-national applicability of western-based management theories on Turkish employees may also provide benefits to Turkish managers and the strategic alliances between foreign-owned firms and existing Turkish firms.
ORGANIZATIONAL JUSTICE
Cropanzano and Greenberg (1997) have noted that organizational justice was one of the primary topics of interest during the 1990s for scientists in industrial-organizational psychology, human resources management, and organizational behavior. They also indicate that this interest continues today and shows no sign of decreasing in the foreseeable future. Furthermore, recent research (Martin and Bennett, 1996) suggests that justice perceptions are critical for understanding the emergence of behavioral dimensions, such as commitment. Moorman (1991: 845) states that, “In essence, the belief of researchers who support the value of organizational justice is if employees believe that they are treated fairly, they will be more likely to hold positive attitudes about their work, work outcomes and their supervisors.”
“Organizational justice” is the term used to describe the role of fairness as it directly relates to the workplace (Greenberg, 1987). Specifically, organizational justice focuses on the ways in which employees determine if they have been treated fairly in their jobs and the ways in which those perceptions influence other organizational outcomes (Alexander and Ruderman, 1987; Fryxell and Gordon, 1989; Greenberg, 1990a; Moorman, 1991).
Organizational justice theory (Greenberg, 1990b) posits that employees’ feelings of equity in the workplace are determined mainly by (a) how decisions affecting them are made, and (b) the outcomes of these decisions. This theory also holds that employees judge whether the decisional processes and mechanisms (procedural justice) and the consequences of those decisions are fair (distributive justice). Greenberg (1990b) also argues that procedural and distributive justice are independent determinants of perceived fairness that are typically distinguished from each other. In practice, however, the two are usually positively associated. Subsequently, Tyler and Bies (1990) suggest that the strength of the perceived procedural-distributive justice relationship varies widely: it is stronger among employees committed to their organization and weaker among those who value their membership much less.
If employees perceive the outcome allocation to be fair or perceive the procedures on which outcome allocation decisions are based to be fair, they will likely reciprocate by showing behaviors that go beyond the in-role performance of their jobs (Niehoff and Moorman, 1993). Similarly, fair treatment by management also demonstrates respect for the rights and dignity of employees, leading to the development of trust (Folger and Konovsky, 1989).

40
It is therefore reasonable to assert that the specific antecedent justice factors that give rise to organizational commitment, as well as the relative effect of each antecedent factor, will be dependent upon a variety of situational factors pertaining to the organizational and general environmental context. Concerning the relative effects of fairness perceptions, economic conditions affecting feelings of job security, wage stability, and long-term predictability are critical contingency factors determining the importance of each justice category. That is, under highly unstable economic conditions employee perceptions of managerial fairness could vary through effects on organizational commitment after downsizing. Our data, collected just after the February 2001 economic crisis, represent a unique job environment in which massive employee layoffs and wage reductions took place in the sampled industrial establishments.
Studies indicate that cross-cultural differences exist in justice perceptions. In a sample from Mexico, Konovsky, Elliot and Pugh (1995) found distributive justice was more important than procedural justice in predicting citizenship behavior. Konovsky and Pugh (1994) found the opposite in a sample from the United States, where procedural justice, not distributive justice, predicted citizenship behavior. Similarly, Pillai and Williams (1999) found that procedural justice was a stronger predictor of trust in Germany. Collectively, the studies reviewed above indicate similarity across cultures in the predictors of justice judgments, but different findings could be yielded in the consequences of justice dimensions across different cultures. Moreover, Greenberg (2001) also suggests that people may have different perceptions of fairness because they have internalized different norms and values, and a major reason why people differ with respect to norms and values is that they come from different cultures.
Distributive Justice
Most of the early organizational justice research focused on distributive justice, which reflects the perceived fairness of pay and other rewards received. Since its focus is on outcome fairness, Adams’ (1963; 1965) equity theory has been commonly used to operationalize the construct. Equity theory emphasizes an employee’s beliefs of how he or she is treated in relation to others. The perceived ratio of what an employee puts into his/her job is one of the factors helping to determine equity or inequity. When an employee is evaluating whether an outcome is appropriate or fair in comparison to others, he or she is making a distributive justice decision (Folger and Cropanzano, 1998).
Due to its focus on outcomes, distributive justice is predicted to be related mainly with the person’s emotions (e.g., happiness or pride), cognitions (e.g., cognitively distort inputs and outcomes of oneself or the other) and their behavior (e.g., performance and withdrawal) (Weiss, et al., 1999; Cohen-Charash and Spector, 2001). In general terms, research has shown that distributive justice predicts specific personal outcomes, such as pay satisfaction, better than general organizational outcomes, such as organizational commitment and turnover (Folger and Cropanzano, 1998; Greenberg, 1990; Sweeney and McFarlin, 1993).
Procedural Justice
The procedural justice perspective focuses on the process used to make decisions about how outcomes are determined (Alexander and Ruderman, 1987; Cropanzano and Schminke, 2001). The procedures used in determining pay raises uniquely contribute to trust in the leader and to organizational commitment (Folger and Konovsky, 1989).

41
Furthermore, research has shown that the perceived fairness of the procedures used in making reward allocations are strongly related to authority and institution evaluations, such as organizational commitment (Florkowski and Schuster, 1992; Folger and Konovsky, 1989; Sweeney and McFarlin, 1993; McFarlin and Sweeney, 1992; Scarpello and Jones, 1996; Welbourne, 1998).
Lind and Tyler (1988) suggest that procedural justice is related to more general evaluations of organizations (e.g., trust in supervisor, commitment), whereas distributive justice is related to evaluations of specific outcomes. Similarly, Konovsky and Cropanzano (1991) examined the role of procedural justice perceptions of drug testing programs on employee attitudes (such as job satisfaction and commitment) and found that procedural justice, but not distributive justice, predicted these attitudes.
A review by Greenberg (1990) identifies two components of procedural justice. The first component is fair formal procedures. Having fair procedures for the distribution of rewards or tasks is a fundamental issue in fostering overall fairness perceptions (Leventhal, 1980). The second component of procedural justice is interactional justice. This term refers to the fairness of the treatment an employee receives in the enactment of formal procedures or in the explanation of those procedures (Bies, 1987; Bies and Moag, 1986; Bies and Shapiro, 1987; Tyler and Bies, 1990).
Interactional Justice
Interactional justice, an extension of procedural justice, refers to the human side of organizational practices, that is, to the way the management behaves toward the recipient of justice (Bies and Moag, 1986; Bies, 1987; Bies and Shapiro, 1987). Therefore, interactional justice relates to the aspects of the communication process between the source (or those controlling rewards and resources) and the recipient of justice, such as politeness, respect and honesty (Bies and Moag, 1986; Tyler and Bies, 1990).
Furthermore, in some research interactional justice is composed of two components, informational and interpersonal justice (Greenberg, 1993; Colquitt et al., 2001). Informational justice refers to “providing knowledge about procedures that demonstrate regard for people’s concerns” (Greenberg, 1993: 84) and interpersonal justice refers to “showing concern for individuals regarding the distributive outcome they receive” (Greenberg, 1993: 85).
AFFECTIVE COMMITMENT DURING AND FOLLOWING EMPLOYEE LAYOFFS
The roots of affective-oriented organizational commitment are based on the theory of Buchanan (1974). Buchanan defines organizational commitment as “a partisan, affective attachment to the goals and values of the organization, to one’s role in relation to goals and values, and to the organization for its own sake, apart from its purely instrumental worth” (Buchanan, 1974: 533). Organizational commitment is characterized by three factors: (i) a strong belief in and acceptance of the goals and values of the organization, (ii) Readiness to exert considerable effort on behalf of the organization, and (iii) a strong desire to maintain membership in the organization (Mowday et al., 1982). Meyer and Allen (1991) conceptualized organizational commitment into three components: affective, continuance and normative commitment.

42
Affective commitment consists of three components: emotional attachment, identification and involvement. Employees with a strong affective commitment continue their organizational membership because they want to do so. Affective commitment has been found to be positively associated with organizational outcomes, such as high satisfaction, high productivity and lower turnover (Meyer and Allen, 1997; Mathieu and Zajac, 1990).
When an organization engages in downsizing, such a decision affects employees who are adversely affected by being laid off, as well as employees who remain with the organization, often known as survivors. This should be of concern to organizations, given that the remaining employees may experience a change in their commitment to the organization. However, organizations neglect the psychological impact of downsizing on employees who remain after the layoff. Some research has analyzed the effects of layoffs on the individuals who remain after the layoff, the survivors (e.g., Brockner et al., 1987; Brockner, 1988; Mishra and Spreitzer, 1998; Mone, 1997).
During downsizing, reduction in job security, along with a decline of real wages, and continual demands for increased production concur with a general decline of employee commitment to the employing organizations (Bishop, 1999). Research suggests that an organizational downsizing strongly affects survivors’ feeling of attachment to the organization, whether or not their job security is threatened (Brockner et al., 1992b). Those employees who survive repeated downsizing are often less loyal and committed to the organization (Hoskisson and Hitt, 1994; Kaye, 1998; Mishra et al., 1998; Filatotchev et al., 2000). Reduction in employee commitment is not surprising given the substantial employee layoffs and deterioration of real wages. This situation is remarkably serious since research shows that organizational commitment has a positive effect on such organizationally valued outcomes as extra-role behaviors, job performance (e.g., Meyer and Allen, 1997; Mathieu and Zajac, 1990), and lower turnover (e.g., Bishop et al., 1997; Mathieu and Zajac, 1990). In some research, it was found that negative attitudinal changes after the layoff, such as lowered commitment to the organization, were reflected in survivors’ reduced work performance (Brockner et al., 1987).
Retrenchments and downsizing often result in the demoralization of the workforce, loss of skilled and experienced employees, disruption of production schedules, and an increased probability of unionization or strikes. Losing skilled workers also results in higher training costs when hiring new inexperienced employees. Consistent low wages and layoffs create morale and productivity problems. An organization will find it difficult to achieve its goals if the workforce is dissatisfied and/or demoralized. Lower-paid employees will not be motivated to give their best and thus productivity will decline. The organization then suffers constant problems of turnover, absenteeism, and lower productivity. Employees that survive a layoff receive additional tasks, leaving them little time to be creative (Rayburn, 1999). At least, survivors are likely to experience significant changes in their context following a downsizing, including possibly new job responsibilities, reporting relationships, and changes in processes (Spreitzer and Mishra, 2002; Allen et al., 2001). At the first sign of crisis, if management shows that the organization is prepared to sacrifice its employees easily, then it will be difficult for the organization to keep highly committed employees. This causes poor morale among survivors and additional costs arriving from severance pay, accrued vacation and sick-day payouts, outplacement, pension and benefits payoffs, and administrative costs (Rayburn, 1999). One of the most prevalent factors contributing to unsuccessful restructuring is a lack of commitment by employees (Hersovitch and Meyer, 2002).

43
Downsizing may also condition employees to be risk averse, worried that their own jobs will be the next to go. Having experienced or known the fear of downsizing in the past, employees who manage to survive keep their resumes up to date and their commitments to a minimum. Certainly, extensive layoffs cause employees to question their loyalty to their employers. Managers stress the importance of them being loyal to their organization, but fail to exercise loyalty in their relationships with employees. The likely result is demoralized employees fearful of losing their jobs (Rayburn, 1999).
The effects of downsizing have tended to be theoretically euphemized by indicating that the “psychological contract” between employer and employees has been violated and the employer can no longer offer job security (Rousseau, 1995). During the periods of employee layoffs, work relationships can take the form of “backstabbing and placing of blame” (Mohrman and Mohrman, 1983: 459). The impact of psychological contract is also discussed by Meyer and his colleagues (1998), in describing how organizational downsizing affects employee commitment. A psychological contract is essentially an employee’s belief about the obligation that exists between him/her and the organization. Thus a key challenge is becoming increasingly clear that a new psychological contract must be created that is not built around the notion of loyalty through lifetime employment (Conger et al., 1999).
MODEL DEVELOPMENT
The Relationship between Organizational Justice and Organizational Commitment
Organizational commitment is an identification with and interest in the overall effectiveness and success of the organization (Mowday et al., 1982). Over the past two decades, organizational commitment has become an important research subject.
Both distributive and procedural justice have been linked to organizational commitment in prior research (Folger and Konovsky, 1989; McFarlin and Sweeney, 1992; Konovsky and Cropanzano, 1991). Moreover, Robinson and his colleagues suggest that commitment is dependent on maintaining a relationship of consistency and good faith, which, in turn, is likely to be associated with justice perceptions (Robinson, Draatz and Rousseau, 1994). Similarly, other research has revealed that positive procedural and distributive justice perceptions are associated with increased organizational commitment (Hendrix et al., 1998).
Some other research has found a strong positive correlation among justice dimensions and organizational commitment (Organ, 1994; Cobb and Frey, 1996). However, Lowe and Vodanovich (1995) found that perceptions of the outcome fairness of a job restructuring were more closely related to commitment than were perceptions of the procedural fairness of the restructuring.
Distributive justice ought to influence organizational commitment since an equitable distribution of pay raises strengthens the bonds of loyalty between employees and their company (Folger and Konovsky, 1989). Sweeney and McFarlin (1993) suggest that perceptions of fair procedures are likely to cause workers to have faith in the system, which may lead to higher organizational commitment, regardless of outcomes. More specifically, interpersonal treatment is also likely to be associated with one’s satisfaction of the need for praise and approval, which are important determinants of commitment (Mowday, Porter and Steers, 1982). Additionally, interpersonal treatment ought to lead employees to

44
feel respected by, and proud of, the organization. In turn, they are more likely to identify with and internalize the values of the organization (Brewer and Kramer, 1996).
Research has shown that procedural justice is important in determining the degree of employees’ commitment to the organization (Fields, Pong and Chiu, 2000; Folger and Cropanzano, 1998; Konovsky and Cropanzano, 1991; Schaubroeck, May and Brown, 1994; Sweeney and McFarlin, 1993; Moorman, 1991; Pillai, Schriesheim and Williams, 1999; Moorman, Niehoff and Organ, 1983). Employees perceiving that they have been treated fairly in the process of allocating rewards will be more satisfied with supervisors and display greater organizational commitment. In general, research suggests a link between procedural justice perceptions and organizational commitment.
In a longitudinal study, Tansky (1993) found support for the relationship between perceptions of overall fairness and organizational commitment. She suggests that a “culture of fairness” was responsible for influencing employee attitudes over time. In some research, it was found that justice influence organizational commitment both directly and indirectly through its effects on satisfaction (e.g., Folger and Konovsky, 1989; Kim and Mauborgne, 1993; Konovsky and Cropanzano, 1991).
The Relationship between Justice Perceptions and the Organizational Commitment of Survivors
Research has shown a relationship between justice perceptions and attitudinal commitment (Cohen-Charash and Spector, 2001). Studies have shown that the organizational commitment of employees remaining with the organization after downsizing is dependant upon the perceived fairness of the layoffs and/or restructuring (Spreitzer and Mishra, 2002; Brockner, Wiesenfeld and Martin, 1995; Brockner et al., 1993; Brockner et al., 1992a).
In the downsizing context, distributive justice reflects the fairness of the outcomes resulting from the downsizing (Brockner and Greenberg, 1990). Since people are concerned with receiving desired outcomes, attachment and commitment will decrease as desired outcomes become less available. If survivors believe that the victims of the downsizing have received fair outcomes, they will be less likely to consider top management as adversarial, and will feel more commitment to the organization. Another constituent of distributive justice is the extent to which the burden of the downsizing is shared fairly across the levels of organizational hierarchy (Spreitzer and Mishra, 2002). Mostly, survivors are likely to believe that the allocation of scarce resources has been unfair (Brockner and Greenberg, 1990). Sharing the burden of downsizing across organizational levels may create the perception that everyone is in this “together,” thus increasing survivors’ commitment (Spreitzer and Mishra, 2002). Survivors would have less commitment to the organization if they perceive an unfair layoff. Therefore, it is hypothesized that:
Hypothesis 1: Distributive justice will be positively associated with survivors’ affective commitment.
Procedural justice reflects the fairness of the processes and procedures used to implement and realize the downsizing (Brockner and Greenberg, 1990). One important element of procedural justice is the decision rule to determine who is laid off. When this decision rule to determine whom to lay-off is based on a clearly defined decision rule rather than favoritism or politics, a survivor is more likely to appraise the downsizing as more predictable and will feel less threatened. Another important element is advance notice provided about the timing of downsizing. If they have the assurance of advance notice, survivors will know they will be given adequate time to prepare for a downsizing in the near future, if

45
necessary (Spreitzer and Mishra, 2002). These attributes will reduce the survivors’ perception of threat and create greater commitment. Hence, research has demonstrated that the organizational commitment of survivors is dependent on how they perceive distributive justice, which is defined as looking after those who left the organization, as well as procedural justice, which is defined as whether the organization has provided a clear and reasonable explanation as to why the restructuring or downsizing has occurred (Spreitzer and Mishra, 2002; Brockner, Wiesenfeld and Martin, 1995; Brockner et al., 1993; Brockner et al., 1992a). Therefore, to increase survivors’ commitment, determining processes of layoff decisions needs to be fair. So, it is hypothesized that:
Hypothesis 2: Procedural justice will be positively associated with survivors’ affective commitment.
Besides procedural and distributive justice, effective communication between employees and managers is vital. Interactional justice is focused on the interpersonal side of organizational practices, specifically the interpersonal treatment and communication by management to employees, in terms of dignity, respect and politeness. Management must explain fully why and how the layoffs will take place. In terms of interactional justice, first of all, survivors will feel more committed to the organization when the basis of downsizing addresses the circumstances in the external environment, rather than the enrichment of shareholders or top management (Spreitzer and Mishra, 2002; Brockner and Greenberg, 1990). Second, communicating a clear vision of how the downsizing will benefit all stakeholders increases commitment, since survivors can see a clear future for the organization. Third, when survivors are treated with dignity and respect, they will feel more committed to the organization because they feel appreciated, rather than feel blamed (Spreitzer and Mishra, 2002). Brockner and his colleagues (1990) studied the relationship between management’s explanation for a layoff and survivors’ attitudes toward the organization, and found a strong positive effect on survivor attitudes. Hence, it is hypothesized that:
Hypothesis 3: Interactional justice will be positively associated with survivors’ affective commitment.
METHODOLOGY
Procedure and Sample
The target population of this study comprised blue-collar employees who remained employed subsequent to downsizing in Turkish service organizations. Five companies from the service sector were chosen randomly from companies that had adopted and implemented employee downsizing strategies and had realized big lay-offs.
All measures were originally developed in English and translated into Turkish via the back-translation technique (see Brislin, 1980). Prior to administering the questionnaire, all questions were revised and adapted to measure justice perceptions and affective commitment related to downsizing. Afterward, a pilot study was conducted. The results of the pilot study revealed that the scales were easily understood by blue-collar employees.
Questionnaires were sent to each company. A cover letter was used to explain the purpose of the survey and note that participation was voluntary as all participants were assured of confidentiality.

46
Moreover, respondents were asked to return the completed questionnaires directly to the research assistant to ensure their anonymity and to avoid a social desirability response bias.
Of the 500 questionnaires sent, 288 completed questionnaires were returned with a response rate of 57%. After deleting records with missing cases, 278 questionnaires remained and constituted the sample for this study. Some demographic data were also collected, such as age, gender, tenure in the organization and education level. No personal data were collected besides demographics. The average respondent age was 36 (standard deviation of 9.17) and ages ranged from 23 to 64. Sixty-eight percent of the respondents were male and 72% were married. Survey participants had worked for their organizations for an average of 10.8 years (standard deviation of 6.31) and 94% of the respondents were at least high school graduates. Demographic data are summarized in Table 1.
Table 1
Demographics of the Participants
Number of Questionnaires Analyzed/Sent
Age Sex Tenure(Years)
Education Marital Status
278/500Avg. 36
St.Dev. 9.17Min. 23Max. 64
Male 68%Female 32%
Avg. 10.8St.Dev. 6.31
At least High School
Grads. 94%.
Married 72%
Single 28%
Measures
All items were measured on a five-point Likert-type scale where 1 = strongly disagree and 5= strongly agree. Mean scale scores were calculated for all measures. The Cronbach’s Alpha was used to estimate reliability for scales.
All organizational justice dimensions were measured with scales adapted from the scales originally developed and tested by Niehoff and Moorman (1993). The distributive justice scale included five items. Six items were used to measure procedural justice and the interactional justice scale included nine items. Organizational commitment was tapped by a scale adapted from the affective commitment scale developed by Meyer and Allen (1991). Affective commitment was assessed by seven items. All items are presented in Table 2.
RESULTS
Exploratory Factor Analysis and Reliabilities
Principal factor analysis with varimax rotation was used for each variable to demonstrate the factor structure. Consistent with our expectations, all items loaded with high-standardized coefficients onto their respective factors and with substantially lower standardized coefficients on other factors. Factor loadings of the items in the scales are presented in Table 2.

47
Table 2
Factor Loadings of Items in Scales
DJ PJ IJ AC
My work schedule after downsizing is fair .682
I think that my level of pay after downsizing is fair .783
I consider my work load after downsizing to be quite fair. .814
Overall, the rewards I receive as a survivor here are quite fair. .807
I feel that my job responsibilities after downsizing are fair. .789
Downsizing decisions are made by the general manager in an unbiased manner. .798
My general manager makes sure that all employee concerns are heard before downsizing decisions are made.
.857
To make downsizing decisions, my general manager collects accurate and complete information.
.910
My general manager clarifies downsizing decisions and provides additional information when requested by employees.
.884
All downsizing decisions are applied consistently across all affected employees. .880
Employees are allowed to challenge or appeal downsizing decisions made by the general manager.
.788
When downsizing decisions are made, the general manager treats me with kindness and consideration.
.843
When downsizing decisions are made, the general manager treats me with respect and dignity.
.819
When downsizing decisions are made, the general manager is sensitive to my personal needs.
.832
When downsizing decisions are made, the general manager deals with me in a truthful manner.
.824
When downsizing decisions are made, the general manager shows concern for my rights as an employee.
.848
Concerning decisions made about downsizing, the general manager discusses the implications of the downsizing decisions with me.
.827
The general manager offers adequate justification for downsizing decisions made. .831
When making downsizing decisions, the general manager offers explanations that make sense to me.
.840
My general manager explains very clearly downsizing decisions made. .767
Even after downsizing, I feel like part of a family at this organization. .774
Even after downsizing, I feel emotionally attached to this organization. .755
Working at this organizaztion as a survivor after downsizing has a great deal of personal meaning for me.
.797
Even after downsizing, I feel a strong sense of belonging to this organization. .867
I would be happy to work at this organization after downsizing. .841
I really feel that any problems faced by my organization are also my problems. .809
Even after downsizing, I enjoy talking about my organization with people outside of it. .679
DJ: Distributive Justice, PJ:Procedural Justice, IJ: Interactional Justice, AC: Affective Commitment
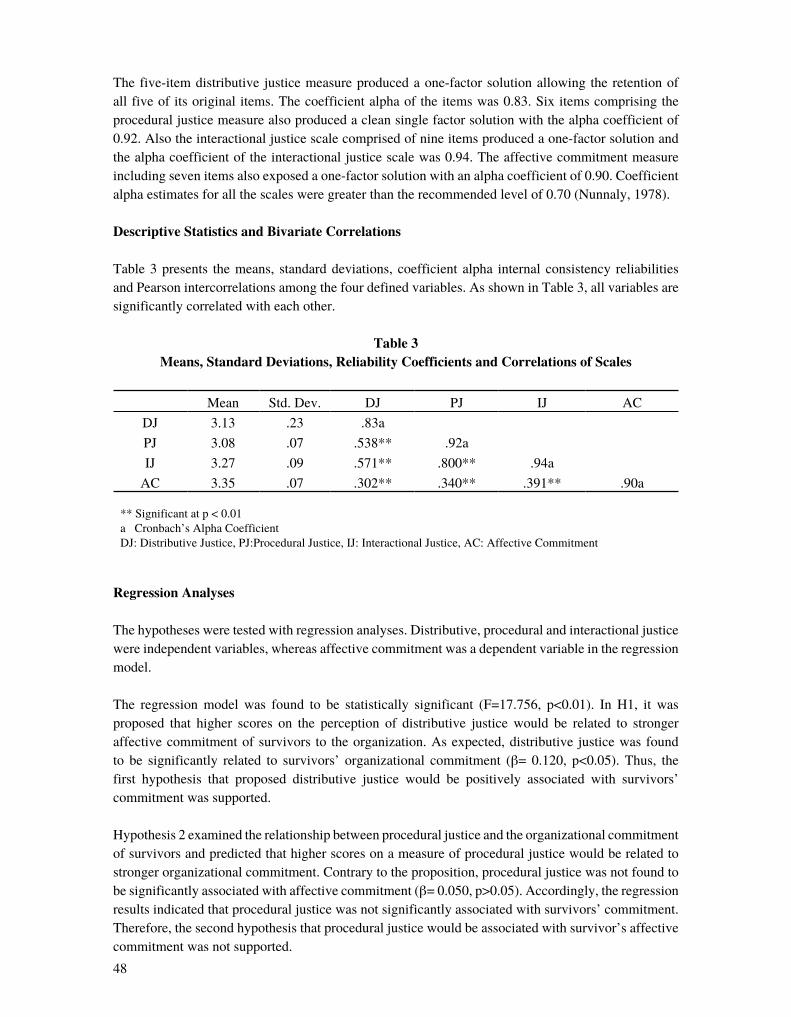
48
The five-item distributive justice measure produced a one-factor solution allowing the retention of all five of its original items. The coefficient alpha of the items was 0.83. Six items comprising the procedural justice measure also produced a clean single factor solution with the alpha coefficient of 0.92. Also the interactional justice scale comprised of nine items produced a one-factor solution and the alpha coefficient of the interactional justice scale was 0.94. The affective commitment measure including seven items also exposed a one-factor solution with an alpha coefficient of 0.90. Coefficient alpha estimates for all the scales were greater than the recommended level of 0.70 (Nunnaly, 1978).
Descriptive Statistics and Bivariate Correlations
Table 3 presents the means, standard deviations, coefficient alpha internal consistency reliabilities and Pearson intercorrelations among the four defined variables. As shown in Table 3, all variables are significantly correlated with each other.
Table 3Means, Standard Deviations, Reliability Coefficients and Correlations of Scales
Mean Std. Dev. DJ PJ IJ AC
DJ 3.13 .23 .83a
PJ 3.08 .07 .538** .92a
IJ 3.27 .09 .571** .800** .94a
AC 3.35 .07 .302** .340** .391** .90a
** Significant at p < 0.01a Cronbach’s Alpha CoefficientDJ: Distributive Justice, PJ:Procedural Justice, IJ: Interactional Justice, AC: Affective Commitment
Regression Analyses
The hypotheses were tested with regression analyses. Distributive, procedural and interactional justice were independent variables, whereas affective commitment was a dependent variable in the regression model.
The regression model was found to be statistically significant (F=17.756, p<0.01). In H1, it was proposed that higher scores on the perception of distributive justice would be related to stronger affective commitment of survivors to the organization. As expected, distributive justice was found to be significantly related to survivors’ organizational commitment (β= 0.120, p<0.05). Thus, the first hypothesis that proposed distributive justice would be positively associated with survivors’ commitment was supported.
Hypothesis 2 examined the relationship between procedural justice and the organizational commitment of survivors and predicted that higher scores on a measure of procedural justice would be related to stronger organizational commitment. Contrary to the proposition, procedural justice was not found to be significantly associated with affective commitment (β= 0.050, p>0.05). Accordingly, the regression results indicated that procedural justice was not significantly associated with survivors’ commitment. Therefore, the second hypothesis that procedural justice would be associated with survivor’s affective commitment was not supported.

49
It was also hypothesized (H3) that interactional justice would be positively associated with survivors’ organizational commitment. This hypothesis received statistically significant support (β= 0.288, p<0.01). Therefore, the positive relationship between interactional justice and survivors’ organizational commitment was significantly and fully supported. Table 4 summarizes the regression analysis.
Table 4 Regression Coefficients
Dependent VariableAffective Commitment
Independent Variables β t Sig.Distributive Justice 0.120 2.094* 0.034
Procedural Justice 0.050 0.541 0.618
Interactional Justice 0.288 3.000** 0.001
F 17.756**
R2 0.163
Adjusted R2 0.154
** Significant at p<0.01.* Significant at p<0.05
DISCUSSION AND CONCLUSION
In this study, the main focus was to examine how survivors’ justice perceptions affect their commitment, which is a long-term behavioral response, after actual downsizing realized during the 2001 economic crisis in Turkey. The long-term attachment of survivors, such as commitment, is believed to be critical for the organization to turn its performance around following downsizing (Mishra, Spreitzer and Mishra, 1998). The relationship between distributive justice perceptions and affective organizational commitment among survivors was found to be statistically significant in service organizations. Contrarily, procedural justice was not found to be significantly or positively associated with survivors’ affective commitment.
Fairness in the allocation of decisions is vital for organizations realizing a downsizing process. Distributive justice reflects the delivery of the decisions used to implement and realize the downsizing. Since employees put more emphasis on what they see and how fairly the lay-off decisions were realized, the fairness of the allocation of the decisions determining who is going to be laid off is more critical than the fairness of the procedures on which the lay-off decisions are based. So, when the lay-off decisions are realized fairly among all employees, a survivor is likely to feel less threatened and more committed.
Interactional justice was found to be significantly and positively related to survivors’ organizational commitment. When managers explain clearly the basis of the downsizing decision and how layoffs will take place, survivors feel more committed to the organization. Informing all survivors about how

50
the downsizing will benefit all employees increases commitment, since survivors have a clear vision for the organization. Furthermore, courteous and well-mannered treatment will affect survivors’ commitment positively.
In an unstable economic situation, like the February 2001 crisis in Turkey, contrary to previous research (e.g., Fields, Pong and Chiu, 2000; Folger and Cropanzano, 1998; Konovsky and Cropanzano, 1991; Schaubroeck, May and Brown, 1994; Sweeney and McFarlin, 1993; Pillai, Schriesheim and Williams, 1999), no significant relationship was found between procedural justice and the affective commitment of survivors under the strong feelings of job insecurity. In a psychological situation like job insecurity, employees might be more strongly affected by what they see or get after the downsizing decisions were made. Especially after downsizing was realized, survivors would care more about the new workload, new responsibilities and new level of pay applied throughout the organization. Thus, the consistency of the distribution of factors brought by the new situation is more important for the survivors after downsizing.
Admittedly, downsizing may be the only option open for an organization facing possible bankruptcy. Under these circumstances, survivors may need some help to stay focused on performing effectively as employees feel insecure because of the layoffs. If survivors believe that the process used to decide who to let go was fair, their productivity and the quality of their job performance may not suffer as much. Certainly, how management handle the termination is important.
Downsizing may affect employees on many levels, resulting in mental and physical disorders, such as depression, anxiety, stress, and diseases like ulcers and hypertension (Tang and Fuller, 1995). It can also affect employees’ organizational commitment, loyalty, morale, job satisfaction and productivity. Considering these negative consequences, managers should do everything to avoid those outcomes. They should encourage the participation of employees in the decision-making process, and communicate clearly to employees the purpose of the downsizing decision. Managers can minimize the negative effects by making sure that all layoffs are conducted fairly and ethically. Managers can soften the blow of downsizing by showing consideration, providing adequate explanations and providing organizational justice throughout the organization. Managers should practice such preventive measures as interactional justice. Facilitating perceptions of fairness is critical for influencing the hoped outcomes of downsizing. To help ease some of the stress, managers should make clear to employees which courses of action will improve their lives so more employees can focus on creating value. It is most important for companies to carefully structure their performance appraisal and termination procedures. They should spell out those procedures in writing and clearly communicate them before hiring an employee. This would help employees perceive the organizational justice more clearly.
Organizational commitment will likely decline when the survivors perceive a lack of fairness during the layoffs. Fairness should be one of the foremost thoughts of the senior management team when commencing a downsizing exercise. Individuals perceive organizational justice differently based upon their own personal experiences. However, senior management must convince the employees who remain that the downsizing exercise was a fair procedure. Also, the employees remaining should be given correct and clear information about the rationale of the downsizing. By creating a strong perception of fairness in the organization, management may create a considerable effect on employees and even help reverse some of the negative perceptions that survivors may have about the organization. Because survivors’ reactions will vary depending on the fairness perceived during the layoff procedure, management’s role is critical to the success of the downsizing process.

51
In addition, managers should treat employees with respect. In a highly unstable and insecure job environment, managers should recognize their employees’ need for open, honest communication, fair and ethical treatment, and employment support in the event of a layoff. Management must look very carefully at the company’s particular situation to determine the best and most ethical route to cut personnel.
Finally, a good long-term managerial relationship with employees is very important, particularly in terms of managerial fairness, beginning long before an announcement to downsize. In this way, effective downsizing is not a short-term treatment, but rather a long-term investment in the human resources of the organization.
The results of this study should be examined with its limitations in mind. First, our framework does not include economic determinants of downsizing decisions. Second, the data are cross sectional and, therefore causality cannot be tested. Third, since all the data used in the study were acquired from the employees themselves as self-report instead of being acquired from the managers, this procedure might have led to a common-method bias. However, to test for common method variance, Harman’s one-factor test, a post-hoc remedy that was recommended as providing evidence of the validity of self-report measures, was used (Podsakoff and Organ, 1986). Harman’s one-factor test revealed that no one factor emerged to account for the majority of the covariance in the independent and dependent variables, and thus suggested that common method variance is not a problem in our study. Fourth, the generalizability of these results is limited because the study was conducted in five service organizations in Turkey. Finally, other variables that could affect the relationship between the independent and dependent variables were not considered, since the variables other than fairness perceptions and commitment were beyond the scope of this study.
Despite the limitations, it is believed that the study achieved its primary purpose. Moreover, the results of this study demonstrate that it is worthwhile to investigate the underpinnings of work outcomes and behaviors in Turkey. Note that the data were collected from companies that had realized big layoffs during the most influential days of the February 2001 economic crisis. Therefore, the present sampling context represented a unique opportunity to explore the relationship between the fairness perceptions and the organizational commitment of survivors under highly unstable economic conditions and strong feelings of job insecurity.
REFERENCES
Adams, J.S. (1963). “Toward an Understanding of Inequity,” Journal of Abnormal Social Psychology, 67: 422-436.
------ (1965). “Inequity in Social Exchange,” in L. Berkowitz (ed.), Advances in Experimental Social Psychology, 2: 267-299. New York: Academic Press.
Alexander, S. and Ruderman, M. (1987). “The Role of Procedural and Distributive Justice in Organizational Behavior,” Social Justice and Responsibility, 1: 177-198.
Allen, T.D., Freeman, D.M., Russell, J.E.A., Reizenstein, R.C., and Rentz, J.O. (2001). “Survivor Reactions to Organizational Downsizing: Does Time Ease the Pain,” Journal of Occupational and Organizational Psychology, 74: 145-164.

52
Applebaum, S., Simpson, R., and Shapiro, B. (1987). “The Tough Test of Downsizing,” Organizational Dynamics, 16(2): 68-79.
Aycan, Z. (2001). “Human Resource Management in Turkey: Current Issues and Future Challenges,” International Journal of Manpower, 22(3): 252-260.
Bies, R., Martin, C., and Brockner, J. (1993). “Just Laid Off, but Still a Good Citizen? Only If the Process Is Fair,” Employee Rights and Responsibilities Journal, 6: 227-238.
Bies, R.J. and Moag, J.S. (1986). “Interactional Justice: Communication Criteria of Fairness,” in R.J. Lewicki, B.H. Sheppard, and M.H. Bazerman (eds.), Research on Negotiations in Organizations, 1: 43-55. Greenwich, CT: JAI Press.
Bies, R.J. and Shapiro, D.L. (1987). “Interactional Fairness Judgments: The Influence of Causal Accounts,” Social Justice Research, 1: 199-218.
Bies, R.J. (1987). “The Predicament of Injustice: The Management of Moral Outrage,” in L.L. Cummings, and B.M. Staw (eds.), Research in Organizational Behavior, 9: 289-319. Greenwich, CT: JAI Press.
Bishop, J.W., Scott, K.D., and Casino, L.S. (1997). “The Differential Effects of Team Commitment and Organizational Commitment on Job Performance and Intention to Quit.” Paper presented at the Annual Meeting of the Academy of Management, Boston.
Bishop, J.W. (1999). “Do Layoff Practices Matter? Their Relationship to Commitment and Perceived Organizational Support of Permanent and Temporary Employees,” Academy of Strategic and Organizational Leadership Journal, 3(2): 29-38.
Bowman, E.H., Singh, H., Useem, M., and Bhadury, R. (1999). “When Does Corporate Restructuring Improve Economic Performance?” California Management Review, 41(2): 33-54.
Brewer, M.B. and Kramer, R.M. (1986). “Choice Behavior in Social Dilemmas: Effects of Social Identity, Group Size and Decision Framing,” Journal of Personality and Social Psychology, 50: 543-549.
Brislin, R.W. (1980). “Translation and Content Analysis of Oral and Written Materials,” in H.C. Triandis and J.W. Berry (eds.), Handbook of Cross-Cultural Psychology, 2: 389-444). Boston: Allyn and Bacon.
Brockner, J., Grover, S.L., Reed, T.F., DeWitt, R.L., and O’Malley, M.N. (1987). “Survivors’ Reactions to Layoffs: We Get by with a Little Help for Our Friends,” Administrative Science Quarterly, 32: 526-541.
Brockner, J. (1988). “The Effects of Work Layoffs on Survivors: Research Theory, and Practice,” in B.M. Staw and L.L. Cummings (eds.), Research in Organizational Behavior, 10:213-255), Greenwich, CT: JAI Press.
Brockner, J., Grover, S.L., and Blonder, M.D. (1988). “Predictors of Survivors’ Job Involvement Following Layoffs: A Field Study,” Journal of Applied Psychology, 73: 436-442.

53
Brockner, J., DeWitt, R.L., Grover, S.L., and Reed, T.F. (1990). “When It Is Especially Important to Explain Why: Factors Affecting the Relationship between Managers’ Explanations of a Layoff and Survivors’ Reactions to the Layoff,” Journal of Experimental Social Psychology, 26(5): 389-407.
Brockner, J. and Greenberg, J. (1990). “The Impact of Layoffs on Survivors: An Organizational Justice Perspective,” in J.S. Carroll (ed.), Applied Social Psychology and Organizational Settings: 45-75. Hillsdale, NJ: Erlbaum.
Brockner, J., Grover, S.L., Reed, T.F., and DeWitt, R.L. (1992a). “Layoffs, Job Insecurity, and Survivors’ Work Effort: Evidence of an Inverted-u Relationship,” Academy of Management Journal, 35: 413-425.
Brockner, J., Tyler, T.R., and Cooper-Schneider, R. (1992b). “The Influence of Prior Commitment to an Institution on Reaction to Perceived Unfairness: The Higher They Are the Harder They Fall,” Administrative Science Quarterly, 37: 241-261.
Brockner, J., Wiesenfeld, B.M., Reed, T.F., Grover, S., and Martin, C.L. (1993). “Interactive Effect of Job Content and Context on the Reactions of Layoff Survivors,” Journal of Personality and Social Psychology, 64: 187-197.
Brockner, J., Wiesenfeld, B.M., and Martin, C.L. (1995). “Decision Frame, Procedural Justice, and Survivors’ Reactions to Job Layoffs,” Organizational Behavior and Human Decision Processes, 63: 59-68.
Buchanan, B. (1974). “Building Organizational Commitment: The Socialization of Managers in Work Organizations,” Administrative Science Quarterly, 19: 533-546.
Cameron, K.S. (1994). “Investigating Organizational Downsizing Fundamental Issues, Human Resource Management, 33(2): 183-188.
Cobb, A.T. and Frey, F.M. (1996). “The Effects of Leader Fairness and Pay Outcomes on Superior/Subordinate Relations,” Journal of Applied Social Psychology, 26: 1401-1426.
Cohen, J. and Cohen, P. (1983). Applied Multiple Regression/Correlation Analysis for the Behavioral Sciences, 2nd ed. Hillsdale, NJ: Lawrence Erlbaum.
Cohen-Charash, Y. and Spector, P. (2001). “The Role of Justice in Organizations: A Meta Analysis,” Organizational Behavior and Human Decision Processes, 86(2): 278-321.
Colquitt, J.A., Conlon, D.E., Wesson, M.J., Porter, C., and Ng, K.Y. (2001). “Justice at the Millennium: A Meta-analytic Review of 25 Years of Organizational Justice Research,” Journal of Applied Psychology, 86: 425–445.
Conger, J.A., Spreitzer, G.M., and Lawler III, E.E. (1999). Leader’s Change Handbook: An Essential Guide to Setting Direction and Taking Action. San Francisco, CA: Jossey-Bass Publishers.
54
Cropanzano, R. and Greenberg, J. (1997). “Progress in Organizational Justice: Tunneling through the Maze,” in C.L. Cooper and I.I. Robertson (eds.), International Review of Industrial and Organizational Psychology, 12: 317-372. New York: John-Wiley.
Cropanzano, R. and Schminke, M. (2001). “Using Social Justice to Build Effective Work Groups,” in M. Turner (ed.), Groups at Work: Theory and Research: 143-171. Hillsdale, NJ: Erlbaum.
DeWitt, R.L. (1998). “Downsizing Strategically,” in D.L. Katchen (ed.), Advances in Applied Business Strategy: 21-36. Greenwich: CT: JAI Press.
Fields, D., Pong, M., and Chiu, C. (2000). “Distributive and Procedural Justice as Predictors of Employee Outcomes in Hong Kong,” Journal of Organizational Behavior, 21: 547-562.
Filatotchev, I., Buck, T., and Zhukov, V. (2000). “Downsizing in Privatized Firms in Russia, Ukraine and Belarus,” Academy of Management Journal, 43(3): 286-304.
Florkowski, G.W. and Schuster, M.H. (1992). “Support for Profit Sharing and Organizational Commitment: A Path Analysis,” Human Relations, 45: 507-523.
Folger, R. and Cropanzano, R. (1998). Organizational Justice and Human Resource Management. Beverly Hills (CA): Sage.
Folger, R. and Konovsky, M.A. (1989). “Effects of Procedural and Distributive Justice on Reactions to Pay Decisions,” Academy of Management Journal, 32: 115-130.
Fryxell, G.E. and Gordon, M.E. (1989). “Workplace Justice and Job Satisfaction as Predictors of Satisfaction with Union and Management,” Academy of Management Journal, 32: 851-866.
Glazer, S. (2002). “Past, Present and Future of Cross-cultural Studies in Industrial and Organizational Psychology,” in C. Cooper and I.T. Robertson (eds.), International Review of Industrial and Organizational Psychology: 17. Chichester, UK: Wiley.
Greenberg. J. (1987). “A Taxonomy of Organizational Justice Theories,” Academy of Management Review, 12: 9-22.
------ (1990a). “Organizational Justice: Yesterday, Today and Tomorrow,” Journal of Management, 16: 399-432.
------ (1990b). “Looking Fair versus Being Fair: Managing Impressions of Organizational Justice,” in B.M. Staw and L.L. Cummings (eds.), Research in Organizational Behavior, 12: 111-157, Greenwich, CT: JAI Press.
------ (1993). “The Social Side of Fairness: Interpersonal and Informational Classes of Organizational Justice,” in R. Cropanzano (ed.), Justice in the Workplace: Approaching Fairness in Human Resource Management: 79-103. Hillsdale, NJ: Erlbaum.
55
------ (2001). “Studying Organizational Justice Cross-culturally: Fundamental Challenges,” The International Journal of Conflict Management, 12(4): 365-375.
Hendrix, W.H., Robbins, T., Miller, J., and Summers, T.P. (1998). “Effects of Procedural and Distributive Justice on Factors Predictive of Turnover,” Journal of Social Behavior and Personality, 13: 611-633.
Hersovitch, L. and Meyer, J.P. (2002). “Commitment to Organizational Change: Extension of a Three-component Model,” Journal of Applied Psychology, 87: 474-487.
Hoskisson, R.E and Hitt, M.A. (1994). Downscoping: How to Tame the Diversified Firm. New York: Oxford University Press.
Kaye, B.L. (1998). “The Kept-on Workforce,” Training and Development, March, 52(3): 32-38.
Kim, W.C. and Mauborgne, R.A. (1993). “Procedural Justice, Attitudes and Subsidiary Top Management Compliance with Multinationals’ Corporate Strategic Decision,” Academy of Management Journal, 36: 502-526.
Konovsky, M.A. and Cropanzano, R. (1991). “Perceived Fairness of Employee Drug Testing as a Predictor of Employee Attitudes and Job Performance,” Journal of Applied Psychology, 76: 698-707.
Konovsky, M.A. and Pugh, S.D. (1994). “Citizenship Behavior and Social Exchange,” Academy of Management Journal, 37: 656-669.
Konovsky, M.A., Elliott, J., and Pugh, S.D. (1995). “Citizenship Behavior and Its Determinants in Mexico.” Paper Presented at The National Academy of Management Meetings, Vancouver, Canada.
Konovsky, M.A. (2000). “Understanding Procedural Justice and Its Impact on Business Organizations,” Journal of Management, 26: 489-511.
Leventhal, G.S: (1980). “What Should Be Done with Equity Theory? New Approaches to the Study of Fairness in Social Relationships,” in K.S. Gergen, M.S. Greenberg, and R.H. Willis (eds.), Social Exchange: Advances in Theory and Research: 27-55. New York: Plenum Press.
Lind, E.A., and Tyler, T.R. (1988). The Social Psychology of Procedural Justice. New York: Plenum Press.
Lowe, R.H. and Vodanovich, S.J. (1995). “A Field Study of Distributive and Procedural Justice as Predictors of Satisfaction and Organizational Commitment,” Journal of Business and Psychology, 10: 99-114.
Martin, C.L. and Bennett, N. (1996). “The Role of Justice Judgmnts in Explaining the Relationship between Job Satisfaction and Organizational Commitment,” Group and Organization Management, 21: 84-104.

56
Mathieu, J.E. and Zajac, D.M. (1990). “A Review and Meta-analysis of the Antecedents, Correlates and Consequences of Organizational Commitment, Psychological Bulletin, 108: 171-194.
McKinley, W., Zhao, J., and Rust, K.G. (2000). “A Socio-cognitive Interpretation of Organizational Downsizing,” Academy of Management Review, 25: 227-243.
McFarlin, D.B. and Sweeney, P.D. (1992). “Distributive and Procedural Justice as Predictors of Satisfaction with Personal and Organizational Outcome,” Academy of Management Journal: 35, 626-637.
Meyer, J.P. and Allen, N.J. (1991). “A Three-component Conceptualization of Organizational Commitment,” Human Resource Management Review, 1: 61-89.
Meyer, J.P. and Allen, N.J. (1997). Commitment in the Workplace: Theory, Research and Application. Thosand Oaks, CA: Sage Publication.
Meyer, J.P., Allen, N.J. and Topolnytsky, L. (1998). “Commitment in a Changing World of Work,” Canadian Psychology, 39: 83-93.
Mishra, K., Spreitzer, G.M., and Mishra, A. (1998). “Preserving Employee Morale during Downsizing,” Sloan Management Review, 39: 83-95.
Mishra, K. and Spreitzer, G.M. (1998). “Explaining How Survivors Respond to Downsizing: The Roles of Trust, Empowerment, Justice and Work Redesign,” Academy of Management Review, 23: 567-588.
Mohrman, S.A. and Mohrman, A.M., Jr. (1983). “Employee Involvement in Declining Organizations,” Human Resources Management, 22(4): 445-465.
Mone, M.A. (1997). “How We Get Along after the Downsizing: Post-downsizing Trust as a Double-edged Sword,” Public Administration Quarterly, 21: 309-336.
Moorman, R.H. (1991). “Relationship between Organizational Justice and Organizational Citizenship Behaviors: Do Fairness Perceptions Influence Employee Citizenship?” Journal of Applied Psychology, 76: 845-855.
Moorman, R.H., Niehoff, B.P., and Organ, D.W. (1993). “Treating Employees Fairly and Organizational Citizenship Behavior: Sorting the Effects of Job Satisfaction, Organizational Commitment and Procedural Justice,” Employees Responsibilities and Rights Journal, 6: 209-225.
Mowday, R.T., Porter, L.W., and Steers, R. (1982). Organizational Linkages: The Psychology of Commitment, Absenteeism, and Turnover. San Diego, CA: Academic Press.
Niehoff, B.P. and Moorman, R.H. (1993). “Justice as a Mediator of the Relationship between Methods of Monitoring and Organizational Citizenship Behavior,” Academy of Management Journal, 36: 527-556

57
Nunnally, J.C. (1978). Psychometric Theory. New York: McGraw-Hill.
Organ, C. (1994). “The Effect of Organizational Commitment on the Relationship between Procedural and Distributive Justice,” Journal of Social Psychology, 134: 135-140.
Pillai, R., Schriesheim, C.A., and Williams, E.S. (1999). “Fairness Perceptions and Trust as Mediators for Transformational and Transactional Leadership: A Two-sample Study,” Journal of Management, 25: 897-933.
Pillai, R. and Williams, E.S. (1999). “Are the Scales Tipped in Favor of Procedural or Distributive Justice? An Investigation of the U.S., India and Germany.” Paper Presented at the National Academy of Management Meetings, Chicago, IL.
Podsakoff, P.M. Organ, D.W. (1986). “Self-reports in Organizational Research: Problems and Prospects,” Journal of Management, 12: 531-544.
Rayburn, J.M. (1999). “The Impact of Downsizing,” Academy of Strategic and Organizational Leadership Journal, 3(2): 64-73.
Robinson, S.L., Draatz, M.S., and Rousseau, D.M. (1994). “Changing Obligations and the Psychological Contract: A Longitudinal Study,” Academy of Management Journal, 37: 137-152.
Rousseau, D. (1995). Psychological Contracts in Organizations: Understanding Written and Unwritten Agreements. Thousand Oaks, CA: Sage.
Scarpello, V. and Jones, F.F. (1996). “Why Justice Matters in Compensation Decision Making,” Journal of Organizational Behavior, 17: 285-299.
Schaubroeck, J., May, D.R., and Brown, F.W. (1994). “Procedural Justice Explanations and Reactions to Economic Hardship: A Field Experiment,” Journal of Applied Psychology, 79: 455-460.
Sronce, R. and McKinley, W. (2003). “Perceptions of Organizational Downsizing.” Paper Presented at the 65th Annual Conference of German-Speaking Business Economists, University of Zurich, Zurich, Switzerland, June 11.
Spreitzer, G.M. and Mishra, A.K. (2002). “To Stay or to Go: Voluntary Survivor Turnover Following an Organizational Downsizing,” Journal of Organizational Behavior, 23:707-729.
Sweeney, P.D. and McFarlin, D.B. (1993). “Workers’ Evaluations of the ‘Ends’ and ‘Means’: An Examination of Four Models of Distributive and Procedural Justice,” Organizational Behavior and Human Decision Processes, 55: 23-40.
Tang, T.L.P. and Fuller, R.M. (1995). “Corporate Downsizing: “What Managers Can Do to Lessen the Negative Effects of Layoffs,” SAM Advanced Management Journal, 60(4): 12.

58
Tansky, J.W. (1993). “Justice and Organizational Citizenship Behavior: What Is the Relationship?” Employee Responsibilities and Rights Journal, 6: 195-207.
Tyler, T.R. and Bies, R.J. (1990). “Beyond Formal Procedures: The Interpersonal Context of Procedural Justice,” in J.S. Carroll (ed.), Applied Social Psychology and Organizational Settings: 77-98. Hillsdale, NJ: Erlbaum.
Weiss, H.M., Suckow, K., and Cropanzano, R. (1999). “Effects of Justice Conditions on Discrete Emotions,” Journal of Applied Psychology, 84: 786-794.
Welbourne, T.M. (1998). “Untangling Procedural and Distributive Justice: Their Relative Effects on Gain Sharing Satisfaction,” Group and Organization Management, 23: 325-346.
Zehir, C. (2005). “The Activation Level of Crises and the Change of Strategic Targets of Enterprises in Turkey during the Depression Era,” The Journal of American Academ Business, 6(2).

59
THE INFLUENCE OF THE TURKISH REPUBLIC’S REVOLUTIONS ON ACCOUNTING APPLICATIONS
(1926 – 1928)*
BARIŞ SİPAHİ** İREM NUHOĞLU*** Marmara University Boğaziçi University
ABSTRACT
The purpose of this article is to review the influence of Atatürk’s revolutions, which were made during the period of the foundation of the Turkish Republic, on the modernization of the concept of accounting and accounting applications. The actors of the Republic made an effort to ensure the community attained a contemporary structure through social and administrative reforms, on the one hand, and took measures in order to strengthen the economic infrastructure on the other. The measures included such legislative actions as the Turkish Commercial Code and the Income Tax Code. The new codes and the transition to the Latin alphabet all positively influenced the modernization of accounting practice and education, and the adoption of the double-entry recording method. These laws, by mandating the keeping of records of transactions in Turkish extended the application of accounting throughout the country. In this article, the developments between the years 1926 and 1928, when the relevant legislative regulations were made, are reviewed. Key words: Atatürk revolutions, Turkish Commercial Code, double-entry recording method.
TÜRKİYE CUMHURİYETİ DEVRİMLERİNİN MUHASEBE UYGULAMALARINA ETKİLERİ (1926 -1928)
ÖZET
Bu makalenin amacı Türkiye Cumhuriyeti’nin kuruluş yıllarında, Atatürk devrimlerinin muhasebe düşüncesinin çağdaşlaşmasına ve muhasebe uygulamalarına etkilerini incelenmektir. Cumhuriyet’in kadroları, bir yandan idari ve sosyal reformlarla toplumun çağdaş bir yapıya kavuşmasını temin etmeye çalışırken, bir yandan da iktisadi yapıyı güçlendirecek önlemler alıyorlardı. Bu önlemler arasında Türk Ticaret Kanunu, Kazanç Vergisi Kanunu gibi yasal düzenlemeler de vardı. Bu yasal düzenlemeler ve Latin alfabesine geçiş, şirketlerin muhasebe kayıtlarını Türkçe tutmalarını öngören
Boğaziçi Journal Vol. 21, no. 1-2 (2007), pp. 59-72.
* An earlier draft of this study was presented at “The Balkan Countries’ 1st International Conference on Accounting and Auditing,” March, 2007, Trakya University, Edirne, Turkey. The authors extend their gratitude to Prof. Oktay Güvemli, who kindly helped them to obtain the historical documents and guided the paper.
** Barış Sipahi is anAssociate Proffesor in theDepartment of Accounting and Finance atMarmaraUniversity,Bahçelievler, Istanbul, Turkey. E-mail: [email protected]
***İremNuhoğluisanAssistantProfessorintheDepartmentofManagementatBoğaziçiUniversity,34342,Bebek,Istanbul Turkey. E-mail: [email protected]

60
yasal düzenlemeler, muhasebe uygulamaları ve eğitimin çağdaşlaşmasını, çift yanlı kayıt yönteminin gelişmesini temin edici etkide bulunuyordu. Bu makalede bütün bu gelişmeleri sağlayan yasal düzenlemelerin yapıldığı 1926-1928 yılları arasındaki gelişmeler inceleme konusu yapılmıştır.
Anahtar kelimeler: Atatürk devrimleri, Türk Ticaret Kanunu, çift yanlı kayıt yöntemi.
Atatürk’s revolutions were made between the two World Wars. The Turkish Republic’s revolutions, innature,weredistinctfromcommunism,fascismandNationalSocialism,whichallweretotalitarianideologies,whiledefendingtheFrenchrevolutionandideologicalenlightenment.ThoughtheRepublicanregime was an authoritative one, as it was a revolution, it never adopted a totalitarian identity and always preserved its intention to transit to democracy. In spite of the revolutions made in the areas of law and culture, a bureaucratic conservatism was observed because the bureaucracy sustained its influence on thedecision-makingmechanismssincemodernizationcouldnotbeensuredinallsectors.
To Atatürk, revolution meant “replacing by force the existing institutions. It is the demolition of the institutions that have caused the Turkish nation to remain underdeveloped during recent centuries and replacing them with new ones that ensure the development of the nation according to the highest civil requirements.” Atatürk thus introduced his own program by which he would radically and compulsorily make changes to the culture. The fundamental point that differentiates Atatürk’s revolution project frompreviousmodernizationmovementsliesinthedefinitionofculture.
The western-oriented practices of the Turkish Republic were significantly reflected in the accounting system, accounting training and accounting applications. The adoption of western laws that started withlegislativeregulationswasalsoreflectedonaccounting.Duringthefirsthalfofthecentury,thesectorwasundertheinfluenceoftheGermanandFrenchaccountingsystems,whereas,inthesecondhalf, a transition to the practices of U.S. was observed.
DespitethefactthatamongtherevolutionsmadebyAtatürkandhiscolleaguestherewerelawsandregulations that directly influenced accounting applications and the double-entry recording method, therewasalsoan indirect influenceon themodernizationofaccountingby increasing the levelofeducation and intellectuality of the public.
Somelegalreformswithinthismodernizationmovement,calledtherevolutionsofAtatürk,hadaninfluenceonthemodernizationoftheaccountingconceptandthedevelopmentofthedouble-entrysystemineducationandinpractice.Thatthesemodernizationmovementsshapingthe20thcenturywererealizedwithinashortperiodbetween1926and1928indicatesthepersistentcharacteroftheAtatürk revolutions. The best example is the adoption of the Latin alphabet throughout the country in as short a time as three months. Atatürk visited towns throughout the country and introduced the new Turkish alphabet. He was then named the Head Instructor.
ACCOUNTINGAPPLICATIONSBEFORETHEREVOLUTIONSOFTHETURKISH REPUBLIC
Accountingapplicationsanddevelopmentsineducationwerenotatsatisfactorylevelsuntilthe1880s.Accounting in the government sector was carried out according to the traditional Ottoman accounting

61
system. The system did not resemble the simple recording system of the West. It was an accounting system peculiar to the Ottomans, called the “Step System.” The Step System, which was used by Turkishstatesbetweenthe14thand16thcenturies,originatedintheIlkhans.Itisassertedinthebookswritten on accounting during the time of the Ilkhans that the Step System was a method developed by those wishing to shortcut the way of recording. The Ilkhans, Seljuks and Ottomans used the Siyakat script and figures in their accounting records. Some sources indicate that the use of this script was essentialforsecrecy,preventingunauthorizedaccessbythepublic(Sertoğlu,1986).
The Ottomans were greatly influenced by the Ilkhans in terms of public finance. The similarity of the property and taxation systems further facilitated interaction between the two states. Financialstructures and accounting systems were similar as well.
The information pertaining to the first half of the 14th century ismore relevant to governmentalaccounting.Inthesecondhalfofthe14thcentury,modernizationstartedintheaccountingconcept.ThoughtheCommercialCode(Kanunname-i Ticaret)thatwaspassedin1850wasnotenforced,itcontributed much to defining commercial rules, forming corporate entities and keeping account books and records towards the end of the century. At that time the use of the double-entry recording system became possible, although the account records of the State were kept according to the traditional Ottomanaccountingprinciples(Güvemli,2000).Towardstheendofthecentury,implementationofthe double-entry accounting system started and it was decided that the double-entry recording method wouldbeemployedingovernmentalaccounting(1879-1880).
Although the Ottomans had been introduced to the double-entry recording method in the second half ofthe14thcentury,theymadeeffortstoadoptthesimplemethodthatwaswelldevelopedinwesterncountriesonlyinthelate19thcentury.Thedouble-entryrecordingmethodwasadoptedinthe1890sandthefirstapplicationwasmadeintheSecurityDepartment.
Europe was busy with the improvement of the double-entry method while the Ottomans were just being introduced to the double-entry system. The script that the Ottomans used at that time however, delayed the transition to the double-entry system because the Ottoman script was written with Arabic letters, from right to left. In the double-entry system, writing from right to left brought forward some difficulties because in the ledger, the debit account and its balance were to be written from right to left first. The writing of the credit account and its balance from right to left caused various difficulties. The double-entry recording method was based on the Latin culture, the script of which goes from left to right.
The Books on accounting written before the Turkish Republic’s revolutions were translated from French toTurkish.Later,Turkishauthorswrotebooksonaccounting,but in the firstyearsof theRepublic French culture continued to have an influence on accounting applications. In the bookswritten by Turkish authors that were not directly translated, the double-entry recording system was not adopted and no satisfactory explanations were given for inventory keeping, balance sheets or income statements. The books written using the Step System were written in Arabic letters and therefore the assets and liabilities sides were generally interchanged.
Turkey adopted the double-entry recording system during the last 25 years of the 19th century and added it to the curricula of almost all educational institutions from rüştüye(juniorhighschool)todarülfünun

62
(university).Theuseofthissysteminaccountingcoursesensuredtheinstructionanddisseminationofthedouble-entryrecordingsystem.Byalawpassedin1913followingthedeclarationoftheSecondConstitution, junior high schools were joined with primary schools and the accounting courses that had previously been in the curriculum were removed. High schools named Ticaret Mekteb-i Alisi and Kısm-ı Evvel, however, were opened. These were the predecessors of today’s commercial high schools.
Asforpre-Republicaccountingeducation,theSchoolforFinanceOfficers(Darül Muallimin) opened in 1909. The school adopted its identity from a new regulation passed in 1915. The Mekteb-i Mülkiye, whichwasmoved toAnkara in the academic year 1936-1937 and became the foundation for theFacultyofPoliticalSciencesofAnkaraUniversity,aswellasTicaret Mekteb-i Alisi(thefoundationfortoday’sMarmaraUniversity)areworthmention.
THETURKISHREPUBLIC’SREVOLUTIONS
The Turkish Republic’s Revolutions in Terms of Their Political, Social, Legal and Economic Nature
Therevolutionsobviouslyweredesignedforthedevelopmentandmodernizationofthecountryinallaspects. The political and social revolutions deeply influenced the way of thinking and life in general. They increased the level of education, literacy and the involvement of the public in social life and introduced the concept of social responsibility, thereby improving the level of intellectuality and interest in business life indirectly, which led to the development of accounting applications and the adoption of western accounting methods.
RevolutionsofaPoliticalNatureThe revolutions of a political nature undertaken in the Turkish Republic were as follows:
a) TheabolitionoftheSultanate(November1,1922),b) ThedeclarationoftheRepublic(October29,1923),c) TheabolitionoftheCaliphates(March3,1924).
InnovativeLegislationsofaSocialNatureThe innovative legislations of a social nature passed in the Turkish Republic were as follows:
a) Thegrantofequalrightstomenandwomen(1926-1934).AlongwiththeAtatürkrevolutions,Turkish women, who had been ignored for centuries, were granted new rights. According to the new civil law that was passed women possessed the same rights as men. They were then able to have official duties, to vote and to be elected as members of parliament.
b) The revolution on hat and clothing (November 25, 1925).With this revolution,womenstopped wearing veils and started wearing modern clothing. Men started wearing hats insteadoffez.
c) Theclosureofrecluse’scells,dervishlodgesandtombs(November30,1925).d) TheSurnameCode(June21,1934).TurksadoptedsurnamesandtheNation’sLeaderwas
giventhesurnameAtatürk,meaning“theFatherofTurks”.e) Theabolitionoftitlesandnicknames(November26,1934).f) Theadoptionofinternationalhour,calendar(1925)andlengthmeasuringunits(1931).

63
RevolutionsofaLegalNatureAtatürk, who was well aware of the need for a new law system for the new Turkish Republic introduced the Swiss Civil Law instead of the traditional Mecelle, law depending on religious rules. Also he replaced the existing Criminal Law with the Italian Criminal Code. In short, the Turkish legal system wasthoroughlymodernizedaccordingtocontemporaryrequirements.Therevolutionsofalegalnaturewere as follows:
a) TheCodeontheAbolitionofReligiousCourtsandtheEstablishmentofNewCourts(April8,1924).
b) TheTurkishCivilCodeandtheCodeofLiabilities(February17,1926).c) TheCriminalCode(1926).d) TheLegalProceduresCode(1927).e) TheCriminalProceduresCode(1929).f) TheExecutionandBankruptcyLaw(1923).g) TheCodeforLandandSeaCommerce(1926,1929).h) Religionwas separated from the law system and contemporary secular law systemwas
introduced.i) TheSourceTaxCode.
Revolutions in Education and CultureUntil the beginning of the 19th century, various education systems existed in the Ottoman Empire. Theleadersoftheyoungrepublicrealizedthetraditionalmedrese system, giving Islamic education, could not address the needs of the new community and that a new education system resembling western models had to be launched. Thereupon, first a law was passed to combine various education institutesunderoneroof.Foreignschools,theocraticschoolsandallinstitutesunderDar-ül Fünun aswellasalleducationalaffairsweremergedundertheroofoftheMinistryofEducation.In1933,aUniversity Reform was passed. The revolutions undertaken in the fields of education and culture were as follows:
a) TheCodeforCombiningEducationalInstitutes(Tevhid-i Tedrisat)(March3,1924).Withthis code, all scientific and educational institutes were merged under the roof of the Ministry of Education.
b) TheCodefortheAdoptionandUseoftheNewTurkishAlphabet(November1,1928).c) ThefoundationoftheTurkishHistoryResearchSociety(April12,1931).Thesocietywas
later named theTurkishHistory Institute (October 3, 1935).With the foundationof theinstitute, which introduced a new history concept, the concept of history of community was replaced by the concept of history of nation.
d) ThefoundationoftheTurkishLanguageResearchSociety(July12,1932).ThesocietywaslaternamedtheTurkishLanguageInstitute(August24,1936).Thepurposeoftheinstitutewas to unveil the beauty of and to enrich the Turkish language and promote it to its deserved level among world languages.
e) TheCodeforClosingIstanbulDar-ül FünunandtheFoundationofanewuniversitybytheMinistryofEducation(May31,1933).IstanbulUniversitystarteditsacademicyearonNovember18,1933.
InnovativeMovementsintheFieldofEconomyAfter the War of Independence was won, the economy of the country was in recession. Almost no industryexisted.Also,theRepublictookoverthedebtsoftheOttomanEmpire(Kongar,1999).

64
Atatürk underlined the importance of economic independence by his words, “The aim of our struggle isfullindependence.Fullindependenceisonlypossiblewithfinancialindependence,”inhisNutuk (theSpeech)concerningtheimprovementoftheeconomy(Atatürk,1959).
The revolutions made in economy were as follows: a)Theabolitionoftithes.b) Subsidizingfarmers.c) Themotivationoffarmingthroughtheestablishmentofmodelfarms.d)Themotivationofindustrialestablishmentsbypassingalawforindustrialincentives.e) Launchingthe2ndDevelopmentPlan(1933-1937)andconstructingnewroads.
The condition precedent for the modernization of the Turkish Republic in the 1920s was notonly winning wars on battle fields and attaining political success, but also achieving the required improvements in fields such as national education, national culture, and science that determine the social level of a nation. Atatürk, always giving priority to this issue, saw the War of Independence not as an ultimate goal but as a step that had to be passed over in order to attain the ultimate goal. He, believing in the notion that improvement of any kind was contingent on improvements in education and culture, pointed out at the very beginning of the War of Independence and throughout the war that thestorywouldnotendwithamilitaryvictory,butalsothataWarofCivilizationhadtobewon.TherevolutionsoftheTurkishRepublicplayedakeyroleintheTurkishNationachievingcontemporarycivilization.TherevolutionshadsuchabigrolebecauseboththeTurkishpeopleacknowledgedtherevolutions with great excitement and Atatürk was very decisive.
The revolutionary legislations during the foundation of the Turkish Republic targeted the fundamentals of a cultural and social change. These legislations provided a basis for understanding the importance ofaccounting.Fourlawsensuredthedevelopmentandmodernizationofthedouble-entryaccountingmethod, indirectlyhelpingthemodernizationof thepracticeofaccounting.Thisarticlefocusesonthese four laws:
a) TheTurkishCommercialCode(1926).b) The Code on the Compulsory Use of the Turkish Language in Economic Enterprises
(1926).c) TheCodeontheAdoptionandUseoftheTurkishAlphabet(1928).d)TheIncomeTaxCode(1926).
The Code Stipulating the Obligation to Keep Records in the Turkish Language
At the time when the Turkish Republic was founded there were many economic enterprises in Turkey. MostofthemwereownedbyItalianandFrenchnationalswhohadresidedinTurkeyforlongyears.These enterprises kept their books and issued their financial statements in their native languages. Because the double-entry accounting system initially had been developed in their native languages, recording was facilitated in such languages. Because the spread of the double-entry system depended on the creation of Turkish terminology for this system, all foreign and Turkish companies were required toprepare their recordsandfinancialstatements inTurkish.For thisaim, thefoundersoftheRepublic passed Law no.805, “CompulsoryUse of the Turkish Language in theAccounts ofEconomic Enterprises.” This law was published in the Official Gazette,no.353,onApril26,1926.Some of the provisions of the Law were as follows:

65
Article 1: Any and all companies and enterprises of foreign nationality must keep their books, records and transactions in the Turkish language.
Article 2: This obligation for foreign companies and enterprises is limited to their correspondence, transactions and contacts with Turkish enterprises and persons of Turkish nationality and to the documents and books that they must present to any government official and institute.
Article3:ThecompaniesandenterprisesdepictedinArticle2arepermittedtousealanguageotherthan Turkish, but the Turkish text must be added underneath. Only the Turkish text added under the text written in another language shall prevail. Article4:DocumentsandrecordspreparedcontrarytoArticles1and2aboveafterthislawisputintoeffect shall not be considered.
Article 6: The reports to be issued by ministries and government officials about those who violate this law shall be valid until otherwise proven.
Preparation of records and financial statements in Turkish was accelerated by means of this Law. When the foreign companies started keeping their records and books in Turkish, the Turkish government started levying tax on such records and books, facilitating the Republic’s administration.
After the adoption of the Turkish Latin alphabet the double-entry method rapidly developed and spread because the method itself had been born and developed with the script from left to right.
The Code on the Adaptation and Application of the Turkish Alphabet
The conflict between the Arabic alphabet and the double-entry system culture at the beginning of the 20thcenturywasreflectedinaccountingapplicationstoagreatextent.Forexample,theinventoryonpages35 and36ofFenn-i Defteri, a bookon accountingwrittenbyMülayım-ıEvvelAhmedZiyaeddin in 1892, is quoted atTable 1.Themerchandise and their values in the shopofAhmetEfendi,oneofthemerchantsatAsmaaltı,asofMarch12,1890,asconvertedintotheLatinalphabetwereasfollows(Güvemli,2000).
This inventory was like a balance sheet. Profit and loss were included to capital account. But assets and liabilities were on reverse sides. This is interesting because it reflects how writers of the Ottoman script viewed the double-entry system.
The main difficulty created by the right to left script of the Ottoman language in terms of the double-entry method emerged in the writing of daily entries in the book. The Ottomans tried to solve this problem by shifting total columns to the left side of the page.

66
Table 1Balance Sheet as of 12 March 1890
LIABILITIES ASSETSDEBTS AVAILABLE IN
SHOP
Promissory note payable to Ali EfendibyFebruaryNo4
800 00 MERCHANDISE
Promissory note payable to Mustafa EfendibyFebruary15No:6
6,000 00 6,800 Coffeeat2.70Francs/eachkıyye 1,202 50
VARIOUS DEBTS
1.468kgsoapin29crates,at29Franc/eachkıyye
6,148 00
Balance payable to Mustafa Efendi
6,001 50 53bailsofcotton,total7.049kgsat2Franc/eachkıyye
14,098 00 21,447 50
Balance payable to HasanAğa
15,906 21,961 50 FIXTURES
SHARE CAPITAL
Upholstery, tools, equipment, etc., and accessories
8,000
My share capital 87,307 43 NOTES RECEIVABLES
BALANCE 116,068 43 Promissory note of HakkıEfendidatedFebruary10
940 00
PromissorynoteofRızaEfendidatedFebruary15
1,346 50
PromissorynoteofRızaEfendidated March 15
1,940 50
PromissorynoteofRızaEfendidated April 15
1,325 50 5,552 50
VARIOUS RECEIVABLES
FromHakkıEfendi’saccount 1,600 00
FromAliEfendi’saccount 300 00
FromHasanEfendi’saccount 1,968 75
FromRüstemEfendi’saccount 1,226 80 10,035 55
CASH
Cash reserve against debts 70,973 38
BALANCE 116,068 43
It is hereby certified that my assets amount to one hundred and sixteen thousand sixty eight Francsandforty-threecentimes;whereasmyliabilities amount to twenty eight thousand seven hundredandsixty-oneFrancsfiftycentimes.

67
WiththelawthatcameintoeffectasofNovember1,1928,Arabicfiguresandletterswereabolishedand the Turkish alphabet comprised of Latin letters was adopted. This was one of the most important reforms of theRepublic.Atatürk, in a speech given in the TurkishGrandNationalAssembly onNovember1,1928,talkedaboutthealphabetrevolutionasfollows:
...before all, the Turkish nation must be given the key for easy reading instead of the infertile method that has made all its efforts useless. The great Turkish nation can only overcome ignorance with a key that best suits it beautiful language with the least effort and in the shortest time. This key for reading and writing is the Turkish alphabet based on Latin culture. Simple experience has revealed how suitable the Latin-based Turkish letters are for the Turkish language and how easily elderly Turkish people, in cities and in villages, are able to read and write.
Thechangeinthealphabet,whichhadbeendiscussedanddebatedforfifteenyears,waslegitimizedand the new Turkish alphabet replaced the Arabic letters that had played a role in the very low literacy rate. The adoption of the new alphabet and its spread throughout the country took a very short period of time, like three months. Some of the provisions of the Code about the adoption and use of Turkish alphabet were as follows:
Article 1: Instead of the Arabic letters that have so far been used in writing Turkish, the letters of the Turkish alphabet based on the Latin alphabet shown in the enclosed list have been adopted with all titles and rights pertaining thereto. Article 2: As from the date of the publication of this law, it is compulsory to use the scripts written in the Turkish alphabet in all government offices and institutes, companies, associations and private enterprises.
Article 6: The old Arabic alphabet can be used by the typists of government and private institutes until thebeginningofJune1930.Alsoallbooks,laws,instructions,recordsandsimilarprintedmaterialthatarealreadyinuseinallgovernmentofficesanddepartmentscanbeuseduntilJune1930.
Article8:UseoftheTurkishalphabetinallTurkishcorrespondenceandthetransactionsofbanks,privileged and non-privileged companies, associations and institutes shall commence not later than January1929.Provided,however,anyapplicationtobemadebythepublicintheoldArabicalphabettosuch bodies shall be honored. Such printed materials as books, catalogues, instructions and regulations writtenintheoldArabiclettersavailabletosuchbodiescanbeuseduntilJune1930.
The Income Tax Law
In all periods of the Republic, one of the main factors affecting Turkish accounting applications and contributing to the overall structure of accounting were improvements in the taxation system. However, the developments in the tax regime were mainly intended to meet the requirements of an accounting system that was mostly government-oriented. As collecting taxes on income, revenue and profit was commenced,itbroughtforwardthenecessitytostandardizerecordingsandfinancialstatements.
In this respect, the first tax law with an important influence on accounting applications was the Income Tax Law. When tithes, which had been the most important tax during the Ottoman Empire, were abolished in 1925, efforts were made to cover the deficit in the budget by the imposition of new taxes.

68
TheIncomeTaxLawwasreplacedwithanewtaxcodeonFebruary26,1926.
The most important influence of this law on accounting applications was that taxes were levied on the profitappearingonfinancialstatementsasdeclared.Forthispurpose,taxpayerskeptbooksandpreparedbalance sheets and income statements showing their profits, and delivered them to the tax office. Since there were not enough qualified personnel to enforce the Law and because the tax authorities did not have the required knowledge, some complaints were raised and then the law was amended by the Law no.1038onJune21,1927.Withthisamendment,thedutytogivefinancialstatementwasassignedto commercial companies, foreign companies and their branches. This amendment was a natural consequence of the fact that the new law had narrowed the scope of application and the double-entry culture had not yet spread throughout the country.
In Article 15 of the Law, the use of a ledger book, which had not been classified as compulsory in the Commercial Code, became compulsory with the provision that the merchants keep ledgers in addition to the books that must be kept according to the Law. Also, in the same article it was provided that correspondencescouldbestoredinbindersinsteadofkeepingCopiesBooks.Asforthenotarizationofbooks,itwasprovidedinArticle16thatbooksmustbenotarizedatthebeginningofeachyear.
The Income Tax Law was also very important in terms of rules of evaluation. The provisions of Article 12 concerning balance sheets were significant.
The provisions of this article concerning assets were as follows:
On the assets side:With the provision that such tangible assets as buildings, lands, tools, equipment and furniture as well as such intangible assets as initial incorporation expenses must be entered on their costs, the concept of both tangible and intangible assets was introduced. On the other hand, with the provision that cost of depreciated items was the cost after deduction of depreciation, the concept of items subject to depreciation was brought forward.
As for foreign currency and bonds: ForeigncurrencyaswellasbondsandsecuritiesquotedontheStockExchangeMarketshallbeenteredat their current Stock Exchange Market prices.
As for notes receivables and their discounting and accounting: Notesreceivablesshallbeenteredattheirnominalvalues.Thedifferenceduetodiscountsbetweenthese values and the values during issue of balance sheet will be entered in a special account on the Liabilities side.
As for inventories:Inventories shall be entered at their cost prices. The cost prices will be calculated by adding the purchasingpriceandtheexpensesrealizeduntilthegoodsarereceived.
As for bad debts:Bad debts are entered in a special account. Receivables not collected within three years following maturity shall be considered bad debts.

69
Provisions of Article 12 concerning the Liabilities side were as follows:
On the liabilities side:a)ThereisaShareCapitalaccount.b)Bondsissuedbycompaniesareenteredattheirnominalvalues.c)Upto5%ofnetprofitcanbereserveduntilitaddsuptoone-fifthoftheregisteredandpaid
up capital.
Article13detailshowtheincomestatementshouldbeprepared.Whatshallbeconsideredasincomesand expenses and what shall be not are explained in detail.
The Income Tax Law influenced both taxation practices and accounting applications to a great extent. The speed of the revolutions made at that time, however, justified the hesitation to enforce the law because of the shortage of qualified personnel. Therefore, we note that an intensive program to train accountants was started.
REVOLUTIONSOFTHETURKISHREPUBLICTHATINFLUENCEDACCOUNTINGAPPLICATIONS
TheTurkishCommercialCodewasrevisedonJanuary4,1926.TheCommercialCodethathadbeenpassed under the Acte de Commerce inNapoleon’stimein1807hadbeenadoptedandappliedbymanyEuropeancountries,andadoptedbytheOttomanEmpirein1850followingtheDeclarationofReformsin1839.Itcouldnotbeenforced,however,becauseIslamicrulesprevailedincommerce.It was this Commercial Code, revised in 1926, that the Republic adopted as suitable to its needs and on which today’s Commercial Code is based. The 1926 Code was completely revised and supported byotherCodesandenforced.TheearlierversionoftheCommercialCodethatwaspassedin1850contained some provisions regarding the keeping of books. These provisions pertained to such issues as eligible writing in account books, leaving no space between lines so as not to permit later insertions, inserting no words between lines and words, not erasing mistakes but simply crossing them out with alineandre-writingtherecords(Ziya,1928).TheseprovisionswerenotincludedintheCommercialCode that was revised in 1926.
In the 1926 Commercial Code books were classified under two main headings, as Optional Books and CompulsoryBooks. OptionalBooksweredefinedasLedger,CashBook,DraftBook,PromissoryNotesBook,BookforMerchandiseandGoodsandInvoiceBook.Thesebookswerenotsubjecttoany attestation. The books that merchants were required to keep were described in Section 66 of the Code.TheywereBooksofInventoryandBalanceSheet,aJournalBookandaCopiesBook.Ledgerwas not classified as a compulsory one.
The Journal Book
TheJournalBook,oneofthecompulsoryrecords,wassubjecttoattestationpursuanttoSection74ofthe Code. The attesting authority was the judicial clerk pursuant to Section 69 of the Code. The book had to be attested before the commencement of operations. Beside that attestation, the books had to be attestedatyearendingbeforeclosure,accordingtoSection74.

70
TheJournalBookwasdefinedinSection71andgivenmoreimportancewhencomparedwithothers.It was subject to two different attestations because it was the basis for the Balance Sheet Book. After the merchant had recorded his share capital, he was supposed to record his financial transactions daily in chronological order, and the total at the end of the month.
The Inventory – Balance Sheet Book
The Inventory-Balance Sheet Book was defined in Section 70 of the Code. It would be kept once a year and all records to be made in this book would be not with their nominal values, but with current stock exchange prices. Also bad debts would not be recorded in this book.
The Copies Book
The Copies Book was defined as a book in which the correspondence of the merchant would be recorded in chronological order, as defined in Section 72 of the Code. It was an old practice to record the letters sent by a merchant regarding his operations. It seems that that the book was intended to createanaccountingdocument(Güvemli,2001).
Chartered Accountants
Merchants were not obliged to keep their books personally. They could employ staff for this purpose, asprovidedinSection68.IntheCommercialCodetheterm“accountant”wasnotused,butitwasprovided that books could be kept by employees. Also, it was explained that the responsibility to keep records and to safeguard the books belonged to the merchant himself, not to the party keeping them, in Section 79.
Archives
According to Section 75 of the Code, the books and the documents had to be archived for 15 years. In Franceinthesameperiod,theamountoftimewas10years.
The Ledger
In the Code, Ledger was not classified as a compulsory book. The obligation to keep this book was imposed by the Tax Codes that were later passed.
The Turkish Commercial Code was the first law of the Turkish Republic containing provisions about accounting applications in terms of its content, approaching such issues empirically.
ACCOUNTINGAPPLICATIONSFOLLOWINGTHEREVOLUTIONSOFTHETURKISH REPUBLIC
As already explained in relevant sections of this paper, the revolutions of the Turkish Republic, particularly the Turkish Commercial Code, the adoption of the Turkish Alphabet and keeping account records in the Turkish alphabet, had great influence on accounting applications and training. The

71
obligation imposed on foreigners to keep their book in Turkish and the legislations in this regard were the harbingers of the future taxation practice of the Turkish Republic. The efforts to adapt to the double-entry system during the first years of the Republic were simultaneous with the transition to the Republic and the establishment of the Republic’s institutions. The instructors of accounting education started writing books on accounting initially by translating from developed European sources. Later they wrote their own books. The authors of books on accounting were also practitioners.
There were two reasons for the prominence of the books on accounting. The first was that the use of Latin alphabet facilitated the use of the double-entry system that had originally developed according to the script from left to right. The second was the importance given to accounting by industrial and serviceorganizationswhichwereestablishedunder theconceptofetatism. Inaddition, it isworthnoting the obligations brought forward by legislation such as the Turkish Commercial Code and the Income Tax Law.
Inthe1930sattemptsweremadetocreateageneralaccountingplanfortheaccountingapplicationsofthestateeconomicenterprises,whichwereorganizedundertheconceptofetatism,buttheyfailed.In the same period, accounting education was more widely applied due to the facilities created by the Latin alphabet and the double-entry system. The leading accounting school was İstanbul Ulum-i Aliye-i Ticariye Mektebi, later Marmara University. Its share of the students who underwent accounting educationintheacademicyear1927-1928was14%.Todaythisrateisalmost23%(Güvemli,2001).
CONCLUSION
While accounting underwent the process of becoming a science in Western countries in the 19th century, theOttomanEmpiremade efforts tomodernize startingwith theDeclarationofReformsin1839.WiththeseeffortstheEmpiresoughttoadoptthedouble-entrysysteminsteadoftheStepMethod that had been used for centuries. In spite of the long-lasting wars at the beginning of the 20th century,theeffortstomodernizecontinued.
AsecondmovementofmodernizationtookplaceintheTurkishRepublicintheadministrative,social,legalandeconomicsectorsfollowingtheDeclarationofReform.Theimplicationsanddecisivenessof the revolutions were not immediately reflected in accounting practices, but they absolutely formed a strong basis of understanding of the concept of western accounting by increasing the levels of education,globalizationandmodernization.
The reforms of Mustafa Kemal Atatürk have been discussed in this paper. The Turkish Commercial Code and the Income Tax Law providing the taxation of profit shown in financial statements were amended according to the changing conditions and survived through the 20th century. The transition to the Latin alphabet was a great reform, speeding up the process of the dissemination and the institutionalizationoftheuniversaldouble-entrymethodthatwasoriginallydevelopedaccordingtothe script from left to right.

72
REFERENCES
Atatürk;M.K.(1922).Nutuk (Speech),MeclisinÜçüncüToplantıYılınıAçışKonuşması(OpeningSpeechofthe3rdMeetingoftheGrandNationalAssemblyofTurkey).
Atatürk’ün Söylev ve Demeçleri (TheSpeechesandtheDeclarationsofAtatürk)(1959).Nutuk, Cilt II (Speech,Vol.2). Ankara.
Güvemli,O.(2000).Muhasebe Tarihi, Cilt3 (HistoryofAccounting,Vol.3).IstanbulYeminliMaliMüşavirlerOdasıYayını.
------(2001).Muhasebe Tarihi, Cilt4 (HistoryofAccounting,Vol.4).Istanbul:ProjeDanışA.Ş.
Kongar,E.(1999).21. Yüzyılda Türkiye (Turkeyinthe21stCentury).Istanbul:RemziKitabevi.
Resmi Gazete (The Official Gazette) (1926). Kazanç Vergisi Kanunu (The Income Tax Code),February26,No:755.
------ (1926).İktisadiMüesseselerdeMecburiTürkçeKullanılmasıHakkındaKanun(TheCodeontheCompulsoryUseoftheTurkishLanguageinEconomicEnterprises),April26,No:805.
------(1928).TürkHarflerininKabulveTatbikiHakkındaKanun(TheCodefortheAdoptionandUseoftheNewTurkishAlphabet),November1,No:1353.
Sertoğlu, M. (1986) Osmanlı Tarih Lügatı (Dictionary of Ottoman History). Istanbul: EnderunYayınevi.
Türk Ticaret Kanunu(1926).(TheTurkishCommercialCode).
TürkiyeBüyükMilletMeclisiZabıtCeridesi (TheMinutesof theMeetingsof theGrandNationalAssemblyofTurkey).
Ünaydın,R.E.(1957).Atatürk’ü Özleyiş (LongingforAtatürk).Istanbul:TürkiyeİşBankasıYayını.
Ziya,A.(1928).Ticaret Kanunu Şerhi(TheExplanationof theTurkishCommercialCode).Ankara:SeçkinYayınevi.

73
DIRECT SELLING ETHICS: AN EXPLORATORY INVESTIGATION ON TURKISH DIRECT SELLERS*
BAHTIŞEN KAVAK** SANEM ALKİBAY*** MAHMUT ARSLAN**** Hacettepe University Gazi University Hacettepe University
ABSTRACT
This study investigates the ethical evaluations of Turkish direct sellers of ethical dilemmas involving consumer complaints. In addition, the effects of market competition as well as some individual factors such as demographics, ethical ideology, locus of control, and Machiavellianism on direct sellers’ judgments are also examined. The results suggest that the level of perceived market competition, formal education, external locus of control, relativism, and Machiavellianism explain the ethical evaluations of Turkish direct sellers.
Key Words: direct selling ethics, consumer complaints, Turkey.
DOĞRUDAN SATIŞ ETİĞİ: TÜRKİYE’DEKİ DOĞRUDAN SATIŞ ELEMANLARI ÜZERİNDE KEŞİFSEL BİR ARAŞTIRMA
ÖZET
Bu çalışmanın amacı, Türkiye’deki doğrudan satış elemanlarının, tüketici şikayetlerinden oluşturulmuş ahlaki olaylar hakkındaki değerlendirmelerini araştırmaktır. Bunun yanı sıra, piyasadaki rekabet ile satışcıların demografik özellikleri, ahlaki ideolojileri, denetim odaklılık ve Machevelizm düzeyleri gibi kişisel bir takım özelliklerinin de ahlaki değerlendirmeler üzerindeki etkisi incelenmiştir. Elde edilen sonuçlara göre, piyasadaki rekabetin algılanan düzeyi, eğitim düzeyi, dışsal denetim odaklılık, görecelilik ve Makyevelizm doğrudan satışçıların ahlaki değerlendirmelerini etkilemektedir.
Anahtar Kelimeler: doğrudan satış etiği, tüketici şikayetleri, Türkiye
This study explores the ethical evaluations of direct sellers who sell in a non-store environment, primarily at home, and hence, are different from typical salespeople who sell at stores.
Boğaziçi Journal Vol. 21, no. 1-2 (2007), pp. 73-92.
* We would like to thank the reviewers for their insightful comments.** BahtışenKavakisanAssociateProfessorintheDepartmentofManagementatHacettepeUniversity,06532,
Beytepe, Ankara, Turkey. E-mail: [email protected]*** SanemAlkibay is a Professor in theDepartment ofBusinessEducation atGaziUniversity, 06830,Gölbaşı,
Ankara,Turkey.E-mail:[email protected]****MahmutArslan isanAssociateProfessor in theDepartmentofManagementatHacettepeUniversity,06532,
Beytepe, Ankara, Turkey. E-mail: [email protected]

74
Ethicsisaboutwhattodo,whatwouldbegoodorbad,rightorwrong,wiseorunwisetodo(Postetal.,2005).Thephilosophicalstudyofmoralityhasbeenconcernedespeciallywithfindingasetofmoral principles or rules that would hold appropriate forallpeople(Narvesson,1998). Ethics can also be defined as the study of human action and its moral adequacy. Business ethics, then, is the study of businessaction–individualorcorporate-withspecialattentiontoitsmoraladequacy(Goodpaster,1998).Businesspeopleatdifferenthierarchicallevelsinorganizationsofdifferentsizesanddegreesofcomplexity confront ethical issues (Goodpaster,1998).Inexplainingethicalresponsibilitiesbusinessethics generally uses the concept of stakeholders. Stakeholders are individuals or group that can affect orcanbeaffectedbyanorganization’sactivities,policies,anddecisions(Postetal.,2005).
Stakeholder theory includes a set of propositions that suggest managers of business corporations have obligations to some group of stakeholders. “Stakeholder” is an ironic twist of stockholder to signal that firms may well have broader obligations than the traditional economic theory has assumed. The main stakeholder groups are owners, creditors, customers, employees, unions, competitors, suppliers, government, political groups, activist groups, customer advocate groups, and trade associations (Freeman, 1999). Customers are the primary stakeholders; that is, their existence is vital for thesurvivalofabusinessorganization.
Therelationshipbetweencustomersandorganizationsisgenerallystudiedinthemarketingfield,andtheethicalaspectsofthisrelationshipareinvestigatedinthemarketingethicsfield.“Marketingethics”is the study of how moral standards are applied to marketing decisions, behaviors, and institutions (Tsalikis andFritzche, 1989).Amongother topics such aspricing, promotion activities, and salespromotion, personal selling has appeared as the major research area in marketing ethics. This is mainly because a personal seller is like a bridge between the firm and its customers, and it has been revealed that(McClaren,2000) salespeople seem to be most prone to act unethically when one or more of the following situations exist:
• Competitionisintense• Crisestimesintheeconomy• Compensationisbasedexclusivelyoncommission• Questionabledealingsarecommonindustrypractice
Sales training is non-existing or abbreviated•The individual has limited selling experience•Lackofformalorganizationalcontrolwithanexistingcodeofconducts•
Sales managers operate in a position above the sales representatives and are charged with administering the territories of salespersons and competitors as well as regular communication with their salespersons aboutcompanypoliciesandpersonalethicalconcerns.Personalethicalconcernismoreimportantforadirectsellerthanforothersalespersons.Directsellingisanon-storeretailing,andthereisalackofformalorganizationalcontrolovertherelationshipbetweendirectsellersandcustomers.As Frederick etal. (1992)specify,consumersshouldbeprotectedagainstdirect sellers’unethicalactivities thatviolate consumer rights, such as:
The right to safety• :Tobeprotectedagainstthemarketingofgoodsthatarehazardoustohealthorlife;The right to be informed• : To be protected against fraudulent, deceitful, or grossly misleading information, advertising, labeling, or other practices, and to be given the facts to make an informedchoice;

75
The right to choose• : To be assured, wherever possible, access to a variety of goods and services atcompetitiveprices;The right to be heard• : To be assured that consumer interests will receive full and sympathetic consideration in the formulation of government policy and fair treatment in its administrative tribunals.
Based on the above discussion, it can be proposed that the ethical evaluations of direct sellers might bedifferentfromthoseofsalespersonsinpersonalselling.Inasimilarmanner,Chonkoetal.(2002)suggested that the ethics of the direct selling industry should be discussed.
The ethical evaluations of salespersons in personal selling has been examined in the literature (SchneiderandJohnson,1992;Verbekeetal.,1996);however,thereisalackofstudiesthatfocusonthe ethical evaluations of direct sellers. This lack is the basic reason underlying the present study, which aims to investigate the ethical evaluations of Turkish direct sellers of ethical dilemmas that involve consumer complaints. Another reason for conducting this study is the importance of the direct selling industry in Turkey. This importance comes from the magnitude of volume as well as recent studies aboutestablishingtheTurkishEthicalCodesofDirectSellingEthicsinaccordancewiththeFEDSAstandardsoftheEuropeanUnion.Bothareexplainedinthesectionsbelow.Beforethesesections,thedifferences between direct selling and direct marketing, which are often used interchangeably, are discussed.Hence,thefollowingsectionsarerelatedtothedifferenceofdirectsellingandpersonalselling, and the direct selling industry in Turkey.
Direct Selling versus Direct Marketing
Directsellingisoftenthoughttobethesamethingasdirectmarketing.Directmarketingistheuseof consumer-direct channels to reach and deliver goods and services to customers without using marketingmiddlemen.Thesechannelsincludedirectmail,catalogs,tele-marketing,interactiveTV,kiosks,Websites,andmobiledevices(Kotler,2003:620).Directsellingis,ontheotherhand,atypeof consumer goods marketing and a distribution method involving face-to-face contact between an independent salesperson and a buyer away from a fixed business location, primarily at home (Wotruba, 1992;Kotler, 2003: 536).Thus, even thoughboth are typical examplesof non-store retailing, themiddleman is the vital actor in direct selling. Tupperware and Avon are some well-known examples oforganizationsinthedirectsellingindustry.
The importance of direct selling has been growing, and there are many opportunities for direct selling bothfromtheeconomicandthehumanresponsepointsofview(Millar,1995).Directsellingprovidesmany goods and services that are not available through traditional retail outlets, and that are new for themarketaswell.Inaddition,manypeopleareemployedinthedirectsellingindustriesofmanyEuropeancountries.Moreover,directsellingplaysakeyroleinthedevelopmentofentrepreneurship.This is because direct selling allows individuals to start their own businesses with little or no previous sales experience. Another function of direct selling is that it is still an important distribution channel for a number of goods and services and it has a very loyal group of participants on both the supply and demandsidesinmanycountriesaroundtheworld(Rosenbloom,1995).
Inspiteoftheimportanceofthedirectsellingindustry,therearemanyfraudulenttradingschemesagainstwhichconsumersandsellersneedtobeprotected.TheWorldFederationofDirectSelling

76
AssociationandtheFederationofEuropeanDirectSellingAssociation, for instance,set theirowncodes of conduct to protect buyers and sellers in an attempt to promote direct selling as an ethical channelofdistribution(Euromonitor,2000).
Differences of Direct Selling Ethical Conduct from the Others in Marketing
The discussion in the previous section provides some cues that help explain why ethical codes of conduct in direct selling may be evaluated differently from those in traditional marketing. There are anumberofreasonsthatmakedirectsellingethicsadifferenttopic(Chonkoetal.,2002).Thefirstreason is that salespeopleindirectsellingorganizationsareconsideredtobeindependentcontractorsratherthanemployeesoftheorganization(Chonkoetal.,2002:87).Unlikeothersalespersonsworkingin a company, direct sellers are typically autonomous due to the lower level of control or impact of the company. Therefore, the willingness of a direct seller to engage in an unethical or ethical action is influenced by the ethical judgments of buyers and sellers. This argument is supported by Robertson (2003),whofoundthatdirectandindirectsituationalfactorscontributetounethicalactionsinthesalescontext.
The position in the channel of distribution may influence the ethical judgments of buyers and sellers (DubinskyandLevy,1985).Directsalespeopleareguests inthehomesof theircustomers.Duetothe absence of external managerial control of the seller, the communication at home may be affected by the sellers’ personalmoral values (Buchanan, 1996).For this reason, salespersons’ personalitycharacteristicsandvaluessuchasethicalideology(Barnettetal.,1998;Malhotraetal.,1998;Rawwasetal.,1998;ChanandLeung,2006),locusofcontrol(Trevino,1986;Vitell,1991;Whalenetal.,1991),andMachiavellianism(HuntandChonko,1984;RayburnandRayburn,1996) might be important contributors to the unethical behaviors of direct sellers.
AccordingtoWotrubaandPribova(1995),consumersperceivedirectsellersaspushy,invadingtheirprivacy,andunreliable.Therefore,customers’perceivedriskofbuyingproductsthroughdirectsalesathomemightbehighercomparedtoothermodesofshopping(Rosenbloom,1995).Thisisbecausethere is a negative impression held by a significant portion of potential customers toward direct selling ingeneral(BaranoweandMcNabb,1992).
The economic benefit/loss of the activity might affect the ethical sensitivity of both buyers and sellers. The primary objective of the buyer and the seller is to receive as high an individual economic benefit aspossible;therefore,ifapurchasingactivityprovideslessbenefittohimorher,thecustomerand/orthe seller can behave unethically in order to gain more benefit. Evidence for this argument is provided bythestudyofNebenzahletal.(2001).ThisstudyfoundthatTurkishandIsraelicustomersignorean unethical event if their economic benefit is low and economic loss is high. This argument is also supportedbySchneiderandJohnson(1992).Hence,itcanbeconcludedthatthehighertheeconomicbenefit of the consumer, the higher the possibility of ignoring the unethical behavior of the direct seller.
Inadditiontoeconomicbenefit,someotherantecedentsoftheethicalbehaviorrelatedtothepersonalcharacteristicsofindividualssuchasethicalideology(Malhotraetal.,1998),locusofcontrol(ChanandLeung2006),andMachiavellianism(RayburnandRayburn,1996),maymoderateorregulatetheunethical involvement for both the buyer and the seller in a direct selling situation. The effects of these personal characteristics on ethical behavior are addressed in the following sections.

77
Ethical Ideology
Forsyth (1980) classifies people into two broad and four subcategories according to their ethicalideology:Relativists(situationist,subjectivist),andidealists(exceptionists,absolutists).Situationistsrejectmoralrulesandanalyzeeachmoralactineachsituation.Subjectivistsevaluateeachethicalact/dilemmaaccordingtotheirpersonalvaluesandperspectivesratherthanuniversalmoralprinciples.Inother words, ethical relativism states there is no definitive right or wrong. Thus, behavior cannot be judgedtobeabsolutelyright/ethicalorwrong/unethical;rather,ethicalcoursesofactionaredeterminedby the individual.
According to idealism, on the other hand, there are absolute “rights and wrongs” in all situations and cultures. Exceptionists are utilitarians who judge in terms of moral absolutes but accept some exceptions to these standards. Exceptionists could be called lesser idealists. However, both highidealists and absolutists will assume that if universal moral rules are followed, the best possible outcomewillbeachieved.Anempiricalstudy(Barnettetal.,1998)supportedthesignificantinfluenceof personal moral philosophy on the ethical decision making of marketing professionals, and revealed that“marketers’ethicaljudgmentsaboutthesituationsdifferedbasedontheirethicalideology,withabsolutistsratingtheactionsasmostunethical”(p.715).Inaddition,therelationshipbetweenethicalideology and ethical behavior is also supported formarketing researchers (Malhotra et al., 1998),finalconsumers(Rawwasetal.,1998),andaccountingstudents(ChanandLeung2006).However,no studies have been done on direct sellers. Therefore, the present study tries to evaluate the effect of ethicalideologyondirectsellers’ethicalbehavior.
Machiavellianism
Machiavellianorientation isan individual’sgeneral strategy fordealingwithotherpeopleand thedegree to which individuals feel they can manipulate others in interpersonal situations (Rayburn and Rayburn,1996).AMachiavellianistindividualisonewhohasanimmoralreputationfordealingwithothers to accomplish his or her own objectives, and for manipulating others for his or her own purpose (ChristieandGeis,1970:1).
AsformarketingandMachiavellianism,“Marketinghasitsshareofmachiavellians-nomorenoless”(HuntandChonko,1984:39).Intheirstudy,HuntandChonko(1984)didnotfindsupportfortherelationshipofMachiavellianismandsuccessinmarketing;however,theyfoundthat“peoplewhoarehighinMachiavellianismseemtobelesssatisfiedwiththeirmarketingcareersthenthosewhoarelowinMachiavellianism”(p.40).
Moreover,Machiavellianismwasdefinedasanexplanatoryvariableforethicalevaluationsofsalespeople(SinghapakdiandVitell,1991,1992),andthesalesperformanceofstockbrokers(Azizetal.,2002).
Dependingontheabovefindings,thepresentstudyaimstoinvestigatewhetherdirectsellerswhoarehighinMachiavellianismignoretheunethicalnessoftheirownbehaviors.
Locus of Control
Locusofcontrolreferstoanindividual’sexternalityandinternality.Theexternalindividualperceivesthattheeventiscontingentuponchance,fate,luck,andheisunderthecontrolofothers;Locusinternals,

78
however, believes that reinforcements are primarily contingent on his own behavior or permanent characteristics(Rotter,1966:1).Inotherwords,itconcernsindividuals’perceivedabilitytoaffecttheeventsinsocialcircumstances.Anindividualwithaninternallocusofcontrol(i.e.,internalindividual)believesthatpersonalpoweroreffortisabasicdeterminantoftheoutcomesofsocialevents;whereas,anindividualwithanexternallocusofcontrol(i.e,external)believesthateventsinsociallifearenotunderhisorhercontrol(Trevino,1986).ArecentstudyfromChanandLeung(2006)supportedthatinternalaccountingstudentsaremorelikelytoshowanabilitytorecognizeethicalissuesthanthosecharacterizedasexternals.
Few studies have examined the role of locus of control in marketing ethics. One study found that marketers with a high external locus of control tend to be lower in their deontological norms (Singhapakdi andVitell, 1991).Another study (Cherry andFraedrich, 2000) showed that internalsalesmanagers showgreater disapproval of unethical behavior.Whalen et al. (1991) investigatedthe differences of ethical evaluations of internal and external consumer.However, there has beennostudyaboutdirectsellers’locusofcontrolandtheirethicalevaluations.Hence,thepresentstudyinvestigates this correlation.
Direct Selling Industry in Turkey
InTurkey,theimportanceofthedirectsellingindustryisgrowingwith600,000directsellersassociatedwiththeDirectSellingAssociation,whichcreatedsalesof800millionNewTurkishLirasin2005(Ekonomist,2005:2).Thesefiguresarequitecomparablewiththeemploymentlevelof13,300,000directsellersandthesalesof$29.5billionintheUS(Ekonomist,2005:6).InAugust1994,theDirectSelling Association of Turkey issued the first publication of the Ethical Codes of Conduct among firms,directsellers,andcustomers.ThegoalsoftheDirectSellingAssociationofTurkeyare:(1)todevelopthedirectsellingindustryinTurkey,(2)todeveloptheworkethicsproperlyindirectselling,and(3)toimprovetheimageofdirectsellingfirmsanddirectsalespeople.Nowadays,thisassociation,asamemberoftheFederationofEuropeanDirectSellingAssociation(FEDSA),isworkingtomodifythecodesofconductinaccordancewiththeconsumers’ethicalconcerns.
In order to establish thework ethics standards of business efficiently in Turkish direct selling inaccordancewiththoseoftheFEDSAstandardsoftheEuropeanUnion,andtoachievetheothergoalsspecified above, it is crucial to understandwhat theTurkish direct sellers’ ethical judgments are.The present study, therefore, examines the ethical evaluations of the direct sellers of certain ethically questionable actions, which were based on consumer complaints.
Recent Research on Direct Selling Ethics
According to the ethics literature review of Loe et al. (2000) “research on the ethics of personalsellingandsalesmanagementhascontinuedtoincreaseinvolumeandimportance”(p.285);however,veryfewstudieshavebeenconductedondirectsellers’ethicalevaluations.Oneofthesestudies,forexample,belongstoWotrubaetal.,(2001),inwhichtheimpactofethicscodefamiliarityonmanagerbehaviorinthedirectsellingindustryoftheUSAwasinvestigated.Anotherone(Chonkoetal.,2002)found that direct selling executives perceive opportunities for unethical behavior in direct selling, and served as a benchmark for subsequent research on ethics in the direct selling industry.
79
Furthermore, there is a lack of studies that examine the relationship between the ethical/unethical intentions of direct sellers and their individual characteristics such as ethical ideology, Machiavellianism, and locus of control. Even though many studies have investigated the impactof individual characteristics on ethical intentions, they mainly have concentrated on the ethics of salespersonswhoworkincompaniesratherthanthoseofdirectsellers.StudiesonMachiavellianismmostlyhavefocusedontherelationshipbetweentheMachiavellianistictendenciesofsalespeopleandtheirperceptionsofethicalproblems(SinghapakdiandVitell1991,1992),andthesalesperformanceofstockbrokers(Azizetal.,2002).LocusofcontrolasapersonalitycharacteristicwasinvestigatedbySrivastavaandSager(1999)asadeterminantoftheProblem-FocusedCoping(PFC)style,andbyCherryandFraedrich(2000)asanindicatorofsalesmanagers’decision-makingprocess.Studiesonethical ideology also have focused on salespeople in companies rather than direct sellers, examining theeffectsoftheidealismandrelativismlevelsofmarketingprofessionals(Barnettetal,.1998),theethical judgmentsofsalespeople (Boyle2000),and therelationshipbetween theethical ideologiesofsalesmanagers,andtheirhiringintentionsandethicalevaluations(Sivadasetal.,2002).Finally,astudy(ErgeneliandArıkan,2002)conductedinTurkeyinvestigatedthegenderdifferencesintheethical perceptions of salespeople, not of direct sellers.
Research Questions
The review of the literature presented above shows that ethical behaviors of direct sellers is an underestimated area in the marketing ethics field. Thus, the present study intends to contribute to the related area by investigating the following research questions: 1. What level of ethical/unethical intentions do Turkish direct sellers have?2. Doindividualvariablessuchasdemographiccharacteristics,ethicalideology,locusofcontrol,andMachiavellianismhaveinfluencesontheethicaljudgmentsofTurkishdirectsellers?
RESEARCHMETHODOLOGY
Questionnaire Development and Measurement
Inordertoexaminetheresearchquestionsofthisstudy,datawerecollectedusingaquestionnaire. ThefirstpartofthequestionnaireincludedtheLocusofControlIndexdevelopedbyRotterconductedbyWhalenetal.(1991).ThisscalewasemployedbyNebenzahletal.(2001)inastudyonIsraeliandTurkish students and hadChronbach’s alphas of 0.74 for the Israeli sample and 0.65 for theTurkish sample; thus, this provides anopportunity to compare the findings of that studywith thepresentone.Thescaleconsistsof14statementsofwhich12arerelatedtoexternallocusofcontrol(i.e.,externality)andtwoarerelatedtointernallocusofcontrol(i.e.,internality)(SeeAppendix1).Respondents were asked to indicate their disagreement and agreement with those statements using a five-point Likert scale. The two statements representing internality were reverse-coded so that the wholescalemeasuredthedegreeofexternalityoftheindividual.Thereliability(i.e.,coefficientalpha)oftheLocusofControlIndexinthepresentstudywas71%.
ThesecondpartofthequestionnairecoverstheEthicsPositionQuestionnairedevelopedbyForsyth(1980) tomeasuresethical ideology.Thismeasure includes twoscalesof10statementseach.Thefirst10statementsaredesignedtomeasureIdealism,andtheremaining10statementsaredesigned
80
tomeasureRelativism (SeeAppendix2).The respondentswereasked to indicate their agreementor disagreement with these statements using a five-point Likert scale. According to the mean scores ofone’sresponsetotheidealismandrelativismscales,respondentswhohavehighscoresonbothscales are “situationists” and those who are high on the idealism scale but low on relativism are classified as “absolutists.” Respondents low on idealism but high on relativism are “subjectivists” and those lowonboth scales are considered “exceptionists.”Chronbach’s coefficient alphaswere0.77fortheIdealismscaleand0.80fortheRelativismscale.Thesealphavaluesarecomparablewiththoseofpreviousstudies.Forexample,alphavaluesforidealismandrelativismwere0.62and0.64,relatively,inthestudyofRawwasetal.(1996)ontheethicalbeliefsofAustrianconsumers,and0.85and0.83inthestudyofVitelletal.(1991)ofelderlyconsumers.Amorerecentstudy(Rawwasetal.,1998)investigatingtheethicalbeliefsandtheethicalideologyofIrishandLebaneseconsumershadChronbach’salphasof0.85and0.84foridealism,and0.81and0.79forrelativism.
The third part of the questionnaire consisted of 12 short scenarios that included ethical situationsrepresentingTurkishconsumers’writtencomplaintsregardingdirectsellingactivities.Thesesituationswere obtained from a list of 14,977 written customer complaints from all around Turkey related to direct selling thatwerecollected (butnotpublished)by theMinistryof IndustryandTradeof theTurkishRepublicbetween1999and2001.Theconsumercomplaints regardingdirect sellerswereclassifiedbytheauthorsofthepresentstudyintothefollowing12issues,orderedbyfrequencyofmention:(1)Overpricing,(2)Notgivingthewithdrawalcertificate,(3)Notacceptingthecustomer’sreturnofproduct,(4)Falsepromises(e.g.,gift)usedtoclosesale,(5)Intentionallylyingabouttheexpirationdateofwithdrawalcertificate,(6)Notgivingthesalesreceipt,(7)Usingstrongpressuretacticstocloseasale,(8)Notfillingoutthecontractinaccordancewiththedirectsellingrules,(9)Notgivingtheguaranteecertificate,(10)Notdeliveringontime,(11)Deliveringadifferentproduct,and(12)Notacceptingthefaultyproducttopreventlosses.
ConsumercomplaintsshouldbeemphasizedbecauseofthecontinuingprocessofECfullmembershipof Turkey. Consumer protection should be improved by better response to consumer complaints (Kaynaketal.,1992).Inordertomanageconsumercomplaintsandconcerns,especiallyindirectsellingenvironment, direct sellers who are the major actors should accept that those issues are critical.
Therefore, direct sellers were asked to indicate whether they agree that these activities were unethical onafive-pointLikertscalerangingfrom1(highlydisagree)to5(highlyagree),sothatahighscorewould indicatehighethicalness. Internalreliabilityof these12 itemswas0.75.Thus, theseethicalstatements appeared to be adequate for further analysis.
The fourth part of the questionnaire included theMach IV scale (SeeAppendix 3) adopted fromChristieandGeis(1970)withaChronbachalphaof0.79,andtranslatedintoTurkishandemployedbyKavak(2001)withaChronbachalphaof0.58.Thereliabilityofthescaleinthepresentstudywas0.72.Thisisinthesatisfactoryrangeforfurtheranalysiscomparedto0.67inthestudyofVerbekeetal.(1996).Forthese20statements,afive-pointLikertscalewasused.
Inthelastpartofthequestionnaireseveraldemographicvariableswereincludedtoseeiftheremightbe any differences in ethical judgments based on these variables. The demographics included gender, age, marital status, education level, job experience, existence of social security, major source of income, and perceived intensity of market competition.
81
Sample and Data Collection Procedure
In thesamplingstage thebasicproblemwas themagnitudeof themainpopulation.Asmentionedabove, the number of direct sellers that aremembers of theTurkishDirect SellersAssociation is600,000.However,thisisnotanaccuratenumbersincethedirectsellerstobeincludedinthelistwerenot determined in an appropriate way, thereby making it impossible to know the actual population size.Therefore,thenumberofrespondentsforeachpartofthequestionnairewascomputedusingtheformula, n = t2 x σ2/α2(Hairetal.2000,p.339),wheretisthestandardizedt-valueassociatedwiththelevelofconfidenceof95%(1.96),σ is the estimate of the population standard deviation based on some typeofpriorinformation(0.15),andαistheacceptabletoleranceleveloferror(0.5).Theminimumsamplesizeforeachpartofthequestionnairewascalculatedtobe36,thusatotalof144respondents.Inordertoguaranteeatleast144usablequestionnaires,500questionnairesweredistributed.ThesequestionnairesweregiventotheheadoftheTurkishDirectSellersAssociation,whichmailedthemto the sales managers of six firms in the cosmetics and kitchen utensils sectors that are members of the Association. The authors explained the purpose and the contents of the questionnaire to the sales managerswhodistributed thequestionnaires todirect sellers.A totalof210usablequestionnaireswerereturned.Additionally,asaresultofcallbackandasecondmailing190usablequestionnaireswerereturned.Therefore,atotalof400questionnaireswereincludedintheanalysis.Ofthe400directsellers,91%werefemaleand9%weremale.Eventhoughthesampleofthisstudyconsistsof91%females, this does not create a major burden since the questionnaires were sent to six companies in the cosmeticsandkitchenutensilssectors,whicharegenerallydominatedbyfemalesellers.Hence,thenature of the examined sectors necessitates the employment of female salespersons. The percentage distributionforagewas23.3%,58.0%,18.8%fortherangeof17-30,31-45,and45+,respectively.Other demographic information is presented in Table 1.
Methods of Analysis
Two types of analyses were conducted in this study. First, the overall evaluations of the direct salespeople were examined, and the relationships between ethical evaluations and demographic variables (gender, age, marital status, education level, job experience, existence of social security, majorsourceofincome),andperceivedmarketcompetitionlevelweretestedusingone-wayANOVA.Then, multiple regression analysis was conducted to examine the relationships between the ethical evaluationsofthesalespeopleandlocusofcontrol,ethicalideology,andMachiavellianismlevels.
Findings
Descriptive statistics for theTurkishdirect sellers’ evaluationsof theunethical activities indirectsellingcircumstancesarepresentedinTable2.Ascanbeseenfromthetable,firstofall,theoverallmeanoftheevaluationsofunethicalactivitieswas2.6155(withastandarddeviationof.7531),andwasunder the middle point of three, suggesting a lower degree of ethicalness. Secondly, the Turkish direct sellers divide the presented ethically questionable actions into three categories: The most unethical actions, less unethical actions, and neither ethical nor unethical actions. According to the Turkish direct sellers, not giving a guarantee certificate, not delivering on time, delivering a different product, not accepting the faulty product to prevent losses, false promises used to close sale, intentionally lying about the expiration date of withdrawal certificate, and not giving the sales receipt are the most

82
unethical actions in direct selling. On the other hand, not filling out the contract in accordance with the direct selling rules, and using high pressure tactics to close sale are considered less unethical. The directsellersevaluatedtheactionsofnotgivingwithdrawalcertificate,notacceptingthecustomer’sreturnofproduct,andoverpricingasbeingneitherethicalnorunethical.Inotherwords,theydonothave a certain opinion about whether these are unethical activities, since the mean values were highly close to the mid-point of three.
Table I
Demographic Characteristics of the Respondents
Characteristics % Characteristics %
Age17-3031-4545+
23.358.018.8
Job experience0-6month7-11 month1-2years3years+No response
24.013.320.342.40.3
GenderFemaleMale
91.09.0
Social securityYesNo
58.341.8
Marital statusSingleMarried
25.075.0
Major source of incomeSales commissionSalaryCommission+Salary
74.36.819.0
Education levelPrimaryHighSchoolUniversity
22.051.227.8
Perceived Intensity of market competitionHighlycompetitiveModeratelycompetitiveNo competitionNo response
47.038.514.20.3
One-wayANOVAwasusedtodeterminewhetherdirectsellersdifferedintheirethicalevaluationswith respect to individual factors of gender, age, marital status, education level, job experience, existence of social security, and major source of income, and factors related to the industry, e.g., the intensity of market competition.

83
Table 2
Descriptive Statistics for the Unethical Activities and Individual Attributes of the Respondents
Unethical Activities and Individual Attributes N Mean Std. Deviation
1. Over pricing 400 2.9700 1.6235
2.Notgivingwithdrawalcertificate 400 3.0600 1.7216
3.Notacceptingthecustomer’sreturnofproduct 400 3.5125 1.6375
4.Falsepromises(e.g.,gift)usedtoclosesale 400 2.2300 1.6489
5.Intentionallylyingabouttheexpiration date of withdrawal certificate
400 2.4475 1.6835
6.Notgivingthesalesreceipt 400 2.2400 1.6399
7.Usinghighpressuretacticstoclosesale 400 4.0900 1.1939
8.Notfillingoutthecontractinaccordance with the direct selling rules
400 4.1125 1.4578
9. Not giving the guarantee certificate 400 1.7175 1.3331
10.Notdeliveringontime 400 1.9425 1.3430
11.Deliveringdifferentproduct 400 1.7200 1.2945
12.Notacceptingthefaultyproducttopreventlosses 399 1.3133 0.9820
Overall 399 2.6155 0.7531
Locus of Control 400 2.6098 0.6212
Idealism 400 4.5603 0.5180
Relativism 400 3.6807 0.8543
Machiavellianism 399 3.3030 0.5172
Note: Higher mean values for the activities refer to higher degrees of ethicalness.

84
Before that, whether the results can be influenced by an unequal sample distribution such as percentage ofgenderandmaritalstatusshouldbetested(seeTable1).Forthispurposethecoefficientsofvariationsofthosedistributionsarecomputed.Theresultsshowedthatthecoefficientsare0.22,0.37,0.30,0.28for female, male, single and married groups, and standard errors are 1.45, 1.35, 0.85 and
Table 3
Mean Values of the Unethical Activities with Respect to Individual Factors
Individual/IndustrialFactors N Mean F Significance(p)
GenderFemaleMale
Age17-3031-4545+
Marital statusSingleMarried
Education levelPrimaryHighSchoolUniversity
Job experience0-6month7-11 month1-2years3years+
Social securityYesNo
Major source of incomeCompensationSalaryCompensation+Salary
Perceived Intensity of market competitionHighlycompetitiveModeratelycompetitiveNo competition
36363
9223275
100299
84205110
955381169
233166
2972775
18815457
2.61142.3542
2.67662.54632.7544
2.72752.5780
2.32882.66462.8710
2.48032.62262.66982.7930
2.61842.6114
2.62012.44142.6600
2.80992.70082.4867
1.974
2.578
2.966
14.117
3.809
0.008
0.859
5.7772
0.161
0.077
0.086
0.000
0.010
0.928
0.425
0.003

85
0.76respectively.Sincethecoefficientsarelessthan0.50andstandarderrorsarelessthantwo,itcanbe assumed that female and male sample distributions and single and married sample distribution are similarandcomparablewitheachothereventhoughthesamplesizesaredifferent.
In thisframetheresultsofANOVAarepresented inTable3.Thefindings indicate that themeanscoresofthesalespeoplediffersignificantlyat95%confidencelevelonlywithrespecttoeducationlevel(F=14.117,p=.000),thelengthofjobexperience(F=3,809,p=0.010),andintensityofmarketcompetition(F=5.777,p=.003).Astheeducationleveloftherespondentincreases,thetendencyforethicalevaluationalsosignificantlyincreases.ThisfindingsupportsthestudyconductedbyKavak(2001),inwhichformaleducationwasfoundtobeanexplanatoryvariableofethical/unethicalbehaviors.Ethicalevaluationsalsodiffereddependingonthelengthofthedirectseller’sworkexperience.Directsellers with more work experience had higher levels of ethical involvement in the customer-seller relationship.Moreover,theperceivedlevelofcompetitioninthemarkethadasignificantroleintheethical evaluations of Turkish direct sellers, suggesting that salespeople in highly competitive markets have higher ethical tendencies than those in less competitive markets. This might be due to the overall regulatory power of competition on markets, in other words, external control on salespeople. This findingsupports thestudyofSchneiderandJohnson(1992),whichasserts that increasedlevelsofcompetition led to higher levels of ethics.
In order to examine the effects of individual attributes of locus of control, ethical ideology, andMachiavellianismondirectsellers’ethicalevaluationsmultipleregressionanalysiswasconducted.The findings of this analysis are presented in Table 4.
Itshouldbenotedherethatwhencheckingfortheappropriatenessofthedataforthemultipleregressionanalysis,multicollinearitywasassessedusingtheVarianceInflationFactor(VIF).AsshowninTable4,theVIFsrangedfrom1.131to1.190,wellbelowthecut-offof10recommendedbyHankeetal.(2001).Thisfindingsuggeststhatcollinearitywasnotalikelythreattotheconclusionsdrawnfromthe parameter estimates of the regression analysis. Thus, it was possible to go on with the analysis. As can be seen fromTable 4, direct sellers’ unethical judgmentswere significantly explained bytheir externality (b= 0.254, p=0.000), relativism (b= 0.117, p= 0.003), andMachiavellianism (b=0.612,p=0.000).Theseresultssuggestthatexternal,relativist,andMachiavellistsellershavehighertendencytowardsunethicalactivities.Ontheotherhand,Idealismwasnotanexplanatoryvariableforunethical evaluations, even though the sign of the regression coefficient was in the expected direction aspreviousworksuggests(Loeetal.,2000).
Table 4
Multiple Regression Analysis of the Unethical Activities in Direct Selling
Variable B Beta T Significance VIF
ConstantLocus of ControlIdealismRelativismMachiavellianism
0.1310.254-0.0800.1170.612
0.209-0.0560.1310.420
-0.3964.680-1.2502.9609.229
0.6930.0000.2120.0030.000
1.1501.1311.1331.190
Dependentvariable:MeanScoreofUnethicalScenariosAdjusted R2=0.32

86
CONCLUSIONANDIMPLICATIONS
This study was conducted to examine the level of ethical evaluations of Turkish direct sellers of certain unethicalactivitiesandtoinvestigatetheeffectsoflocusofcontrol,ethicalideology,Machiavellianism,individual variables on the ethical evaluations of direct sellers.
The analysis showed that the level of ethical tendency of the respondents was under the middle point. This suggests that the ethical tendency of Turkish direct sellers is low. Another result showed that formaleducationaffectsthedirectseller’sethicaltendencyinapositiveway.Therefore,educationlevelshould be an important selection criterion when hiring direct sellers. Besides, it might be recommended to the current and potential direct selling firms to educate their direct sellers for business ethics.
Inadditiontoformaleducation,someotherindividualindicatorsnamely,externality,relativism,andMachiavellianism,areexplanatoryvariablesfordirectsellers’unethicalevaluations.Eventhoughtheidealism level of Turkish direct sellers is higher than their relativism level, idealism is not influential in explaining their unethical evaluations.
In sum,unethical tradingactivities arepromotedbydirect sellerswhoare external, relativist, andMachiavellist.So,firmmanagersofdirectsellingindustryinTurkeyshouldcontrolthedirectsellers.Forthis,customerfeedbackscanbeutilized.
The low level of ethical tendencies of direct sellers can also be improved by the growth of market competition. This is because, according to the results of the present study, the ethical tendency of direct sellers is significantly higher with higher levels of perceived competition. The reason underlying the significant effect of competition may be due to the external regulatory power of competitors. Therefore, competition in the direct selling industry must be supported and developed. For this purpose, first, new firmsmightbeencouragedtoentertheTurkishDirectSellingMarket.Second,directsellers,whoarethe major actors in direct selling industry, should be trained in competition. Thus, a better functioning of the marketplace will be improved in order to eliminate unethical activities.
Another result of this study reveals that direct sellers classified the unethical activities into three categories as follows:
1)Unethical actions;Not giving guarantee certificate, •Not delivering on time, •Deliveringadifferentproduct,•Not accepting the faulty product to prevent losses, •False promises used to close sale, •Intentionallylyingabouttheexpirationdateofwithdrawalcertificate,andnotgivingthesales•receipt.
2)Less unethical actions; Not filling out the contract in accordance with the direct selling rules,•Usinghighpressuretacticstoclosesale.•

87
3)Neither ethical nor unethical actions;Overpricing, •Not giving a withdrawal certificate, •Notacceptingthecustomer’sreturnofproduct.•
Even though actions specified as neither ethical nor unethical have a high frequency of mention in the listofTurkishconsumercomplaints,theywerenotperceivedastotallyunethical.DuetotheFEDSAdirect selling ethical codes, this type of ethical evaluation will lead to some problems in terms of consumerprotectionwhenTurkey joinsEUasa fullmember. However, “withdrawalcertificate”and“acceptingthecustomer’sreturnofproduct”arerelativelynewpracticesinTurkey.Thus,itisrecommendedthattheTurkishDirectSellersAssociationeducateitsdirectsellermembersonthesenew practices. Furthermore, Turkish direct sellers need further ethical education regarding filling out contract in accordance with the rules and not using high pressure on customers.
Finally, it should be noted that the findings of this study might be specific to Turkey, which has a developing market economy. The factors that were shown to influence ethical evaluations in this study might not have significant roles in other countries. Studies using the same ethical activities in different countries with similar and/or different market structures should be conducted in order to obtaincomparableresults.Itissuggestedthatadditionalcross-culturalinvestigationsondirectsellingethics be conducted in the future.
REFERENCES
Aziz, A., May, K., and Crotts, J.C. (2002). “Relations of Machiavellian Behavior with SalesPerformanceofStockbrokers,” Psychological Reports, 90:451-460.
Baranowe,Y.T. andMcNabb,D.E. (1992). “ConsumerResponses toDirect Selling: Love,Hate,Buy,” Journal of Marketing Channels, (winter):25-40.
Barnett,T.,Bass,K.,Brawn,G.,andHebert,F.J.(1998).“EthicalIdeologyandtheEthicalJudgmentsofMarketingProfessionals,” Journal of Business Ethics,17:715-723.
Boyle, B.A. (2000). “The Impact of CustomerCharacteristics andMoral Philosophies on EthicalJudgments of Salespeople,” Journal of Business Ethics,23:249-267.
Buchanan,A.(1996).“PerfectingImperfectDuties:CollectiveActiontoCreateMoralObligation,”Business Ethics Quarterly,6:27-42.
Chan, S.Y.S. and Leung, P. (2006) “The Effects ofAccounting Students’ Ethical Reasoning andPersonalFactorsonTheirEthicalSensitivity,”Managerial Auditing Journal,21(4):436-457.
Cherry,J.andFraedrich,J.(2000).“AnEmpiricalInvestigationofLocusofControlandtheStructureofMoralReasoning:ExaminingtheEthicalDecision-MakingProcessesofSalesManagers,”Journal of Personal Selling & Sales Management,20(3):173-188.
Chonko,L.B.,Wotruba,T.R.,andLoe,T.W.(2002)“DirectSellingEthicsattheTop:AnIndustryAudit and Status Report,” Journal of Personal Selling & Sales Management,22(12):87-95.
88
Christie,R.andGeis,F.L.(1970).Studies in Machiavellianism. NewYork:AcademicPress.
Dubinsky,A.J.andLevy,M.(1985).“EthicsinRetailing:PerceptionsofRetailSalespeople,”Journal of the Academy of Marketing Science,13(1):1-16.
Ekonomist.(2005).“DirectSellingAssociation,” Nisan(April).
Ergeneli,A.andArıkan,S.(2002).“GenderDifferencesinEthicalPerceptionsofSalespeople:AnEmpirical Examination in Turkey,” Journal of Business Ethics,40:247-260.
Euromonitor.(2000).“DirectSelling:AGlobalMarketFocusReport.”
Forsyth, D.R. (1980). “A Taxonomy of Ethical Ideologies,” Journal of Personality and Social Psychology, 39(1):175-184.
Frederick,W.C.,Post,J.E.,andDavis,K.(1992).Business and Society Corporate Strategy Public Policy and Ethics.NewYork:McGraw-Hill.
Freeman R.E.(1999).“Response:DivergentStakeholderTheory,”Academy of Management Review, 24:233-236.
Goodpaster, K.E. (1998). “Business Ethics and Stakeholder Analysis, the Corporation and ItsStakeholders,” inM.B.E. Clarkson (ed.),Classic and Contemporary Reading: 102-123. Toronto: TorontoPress.
Hair,J.F.,Bush,R.P.,andOrtinau,D.J.(2000).Marketing Research: A Practical Approach for the New Millennium.McGraw-HillInternationalEd.
Hanke,J.E.,Wichern,D.W.,andReitsch,A.G.(2001).Business Forecasting, Seventh Edition. New Jersey:PrenticeHall.
Hunt,S.D.andChonko,L.B.(1984).“MarketingandMachiavellianism,”Journal of Marketing,48:30-42.
Kaynak, E., Küçükemiroğlu, O., and Odabaşı, Y. (1992) “Consumer Complaint Handling in anAdvancedDevelopingEconomy:AnEmpiricalInvestigation,”Journal of Business Ethics,11:813-829.
Kavak,B.(2001).“AnInvestigationontheRelationshipbetweenMachiavellianismandConsumers’Ethical Judgments,” Journal of Home Economics,7(8):11-20.
Kotler,P.(2003).Marketing Management. NewJersey:PrenticeHall.
Loe,T.W.,Ferrell,L.,andMansfield,P.(2000).“AReviewofEmpiricalStudiesAssessingEthicalDecisionMakinginBusiness,”Journal of Business Ethics,25:185-204.

89
Malhotra,N.K.andMiller,G.L.(1998).“AnIntegratedModelforEthicalDecisions inMarketingResearch.” Journal of Business Ethics,17:263-280.
McClaren,N.(2000)“EthicsinPersonalSellingandSalesManagement:AReviewoftheLiteratureFocusing on Empirical Findings and Conceptual Foundations,” Journal of Business Ethics,27(3).
Millar,C.(1995).“DirectSellingandConsumers’ValuesinCentralandEasternEurope,” inT.R.Wotruba(ed.), Direct Selling in Central & Eastern Europe: An International Academic Symposium (Proceedings):33-62.Prague:26-29March.
Narveson,J.(1998).“Wrongness,WisdomandWilderness,”Journal of Agricultural and Environmental Ethics,11(1):58-61.
Nebenzahl,I.D.,Jaffe,E.D.,andKavak,B.(2001).“Consumers’PunishmentandRewardingProcessviaPurchasingBehavior,”Teaching Business Ethics, 5(3):283-305.
Post, J.E., Lawrence, A.T., and Weber; J. (2005). Business and Society: Stakeholders, Ethics, PublicPolicy,11th.Edition.Irwin:McGraw-Hill.
Rayburn,J.M.andRayburn,L.G.(1996).“RelationshipbetweenMachiavellianismandtheTypeAPersonalityandEthicalOrientation,”Journal of Business Ethics, 15:1209-1216.
Rawwas,Y.A.M. (1996). “ConsumerEthics:AnEmpirical Investigation of theEthicalBeliefs ofAustrian Consumers,” Journal of Business Ethics,15:1009-1019.
Rawwas,Y.A.M.,Patzer,G.L.,andVitell,S.J.(1998).“ACross-CulturalInvestigationoftheEthicalValuesofConsumers:ThePotentialEffectofWarandCivilDisruption,” Journal of Business Ethics,17:435-448.
Rosenbloom,B.(1995).“DirectSellingAsaChannelofDistribution,”inT.R.Wotruba(ed.),Direct Selling in Central & Eastern Europe: An International Academic Symposium(Proceedings):129-142.Prague:26-29March.
Robertson,D.C.(2003).“ATypologyofSituationalFactors:ImpactonSalespersonDecision-MakingAboutEthicalIssues,”Journal of Business Ethics, 46:213-234.
Rotter,J.B.(1966).“GeneralizedExpectanciesforInternalVersusExternalControlofReinforcement,”Psychological Monographs: General and Applied,80(1),WholeNo:609:1-28.
Schneider,K.C.andJohnson,J.C.(1992).“ProfessionalismandEthicalStandardsAmongSalespeopleinaDeregulatedEnvironment:ACaseStudyoftheTruckingIndustry,” Journal of Personal Selling & Sales Management, 12:33-44.
Singhapakdi, A. and Vitell, S.J. (1991a). “Analyzing the Ethical Decision Making of SalesProfessionals,”Journal of Personal Selling & Sales Management,11(4):1-12.
90
------ (1991b). “Selected Factors Influencing Marketers’ Deontological Norms,” Journal of the Academy of Marketing Science,19(1)37-42.
------(1992).“MarketingEthics:SalesProfessionalsVersusOtherMarketingProfessionals,”Journal of Personal Selling & Sales Management,12(2):27-31.
Sivadas, E., Kleiser, S.B., Kellaris, J., and Dahlstrom, R. (2002). “Moral Philosophy, EthicalEvaluations,andSalesManagerHiringIntentions,”Journal of Personal Selling & Sales Management, 23(1):7-21.
Srivastava,R.andSager,J.K.(1999).“InfluenceofPersonalCharacteristicsonSalespeople’sCopingStyle,” Journal of Personal Selling & Sales Management,14(2):47-57.
Trevino,L.K.(1986).“EthicalDecisionMakinginOrganisations:APersonSituationInteractionistModel,”Academy of Management Review, 11(3):601-617.
Tsalikis, J. and Fritzche, D.J. (1989). “Business Ethics: A Literature Review with a Focus onMarketing,”Journal of Business Ethics,8(9):695-743.
Verbeke,W.,Ouwerkerk,C.,andPeelen,E.(1996).“ExploringtheContextualandIndividualFactorsontheEthicalDecisionMakingofSalespeople,”Journal of Business Ethics, 15:1175-1187.
Vitell,S.J.,Lumpkin,J.R.,andRawwas,M.Y.A.(1991).“ConsumerEthics:AnInvestigationoftheEthical Beliefs of Elderly Consumers,” Journal of Business Ethics,10:365-375.
Whalen,J.,Pitts,R.E.,andWong,J.K.(1991).“ExploringtheStructureofEthicalAttributionsasaComponentoftheConsumerDecisionModel:TheVicariousVersusPersonalPerspective,”Journal of Business Ethics,10:285-293.
Wotruba,T.R.(1992).“DirectSellingintheYear2000,”The Future of U.S. Retailing:187-211.NewYork:QuorumBooks.
Wotruba,T.R.,Chonko,L.B., andLoe,T.W. (2001). “The Impact ofEthicsCodeFamiliarity onManagerBehavior,”Journal of Business Ethics,33:59-69.
Wotruba,T.R.andPribova,M.(1995).“DirectSellinginCentralEurope:AComparisionWiththeU.S.”inT.R.Wotruba (ed.),Direct Selling in Central & Eastern Europe: An International Academic Symposium(Proceedings):87-104.Prague:26-29March.

91
APPENDIX
Locus of Control Index1. Mylifeischieflycontrolledbypowerfulothers.- Inordertohavemyplanswork,Imakesurethattheyfitinwiththedesiresofpeoplewhohave- power over me.If important people were to decide they didn’t like me, I probably wouldn’t make many- friends.Ifeellikewhathappensinmylifeismostlydeterminedbypowerfulothers.- GettingwhatIwantrequirespleasingthosepeopleaboveme.- ManytimesIfeelIhavelittleinfluenceoverthethingsthathappentome.- Peoplelikemyselfhaveverylittlechanceofprotectingourpersonalinterestswhentheyconflict- with those of strong pressure groups.It’schieflyamatteroffatewhetherornotIhavefewfriendsormanyfriends.- IsometimesfeelthatIdon’thaveenoughcontroloverthedirectionmylifeistaking.- Itisnotalwayswiseformetoplantoofaraheadbecausemanythingsturnouttobeamatter- of good or bad fortune.Mylifeisdeterminedbymyownactions.- Most students don’t realize the extent to which their grades are influenced by accidental- happenings.Iamusuallyabletoprotectmypersonalinterests.- Gettingagoodjobdependsmainlyonbeingintherightplaceattherighttime.-
2.The Ethics Position QuestionnaireA person should make certain that his/her actions never intentionally harm another even to a - small degree.Risks to another should never be tolerated, irrespective of how small the risks might be.- The existence of potential harm to others is always wrong, irrespective of the benefits to be - gained.One should never psychologically or physically harm another person.- One should not perform an action which might in any way threaten the dignity and welfare of - another individual.Ifanactioncouldharmaninnocentother,thenitshouldnotbedone.- Decidingwhetherornottoperformanactbybalancingthepositiveconsequencesoftheact- against the negative consequences of the act is immoral.The dignity and welfare of people should be the most important concern in any society.- Itisnevernecessarytosacrificethewelfareofothers.- Moralactionsarethosewhichcloselymatchidealsofthemost‘perfect’action.- There are no ethical principles that are so important that they should be a part of any code of - ethics.What is ethical varies from one situation and society to another.- Moralstandardsshouldbeseenasbeingindividualistic;whatonepersonconsiderstobemoral- may be judged to be immoral by another person.Differenttypesofmoralitiescannotbecomparedasto‘rightness’.- Questionsofwhatisethicalforeveryonecanneverberesolvedsincewhatismoralorimmoral- is up to the individual.

92
Moralstandardsaresimplypersonalruleswhichindicatehowapersonshouldbehave,andare- not to be applied in making judgments of others. Ethical considerations in interpersonal relations are so complex that individuals should be - allowed to formulate their own individual codes.Rigidly codifying an ethical position that prevents certain types of actions could stand in the - way of better human relations and adjustment.Noruleconcerning lyingcanbeformulated;whethera lie ispermissibleornotpermissible- totally depends upon the situation.Whether a lie is judged to be moral or immoral depends upon the circumstances surrounding - the action.
3. Mach IV Scale- Never tell anyone the real reason you did something unless it is useful to do so.- The best way to handle people is to tell them what they want to hear.- One should take action only when sure it is morally right. -Mostpeoplearebasicallygoodandkind.-Itissafesttoassumethatallpeoplehaveaviciousstreakanditwillcomeoutwhentheyare
given a chance.-Honestyisthebestpolicyinallcases. - There is no excuse for lying to someone else.- Generallyspeaking,peoplewon’tworkhardunlessthey’reforcedtodoso. - All in all, it is better to be humble and honest than to be important and dishonest. - When you ask someone to do something for you, it is best to give the real reasons for wanting
it rather than giving reasons which carry more weight. - Mostpeoplewhogetaheadintheworldleadclean,morallives. - Anyone who completely trusts anyone else is asking for trouble. - The biggest difference between most criminals and other people is that the criminals are stupid
enough to get caught. - Mostpeoplearebrave.- Itiswisetoflatterimportantpeople.- Itispossibletobegoodinallrespects.- P.T.Barnumwaswrongwhenhesaidthatthere’sasuckerborneveryminute.- Itishardtogetaheadwithoutcuttingcornershereandthere.- People suffering from incurable diseases should have the choice of being put painlessly to
death. - Mostpeopleforgetmoreeasilythedeathoftheirparentsthanthelossoftheir property.

93
A NOTE ON THE CROSS-SECTION OF STOCK RETURNS ON THE ISTANBUL STOCK EXCHANGE*
N. VolkaN kayaçetiN** Z. Nuray GüNer***University of Alberta School of Business Middle East Technical University
AbstrAct
This paper investigates the explanatory powers of firm size, book-to-market, sales-to-price, debt-to-equity ratio, and dividend yield on the cross-section of returns on the Istanbul Stock Exchange (ISE). Our results indicate that each of these variables (except dividend yield), commands a significant return premium when included in a simple regression model with the highest premium being associated with sales-to-price ratio. Our results suggest that sales-to-price ratio and debt-to-equity ratio have higher explanatory powers on the cross-sectional variability of returns on the ISE than firm size and book-to-market ratio, firm-specific variables that are documented to have the greatest explanatory power on the cross-section of U.S. stock returns (Fama and French, 1992).
Key words: stock returns, Fama-French factors, Istanbul Stock Exchange.
İSTANBUL MENKUL KIYMETLER BORSASI’NDA HİSSE SENEDİ GELİRLERİ ÜZERİNE BİR NOT
ÖZET
Bu makale şirket büyüklüğü ile defter değeri-piyasa değeri, satış-piyasa değeri, borç-özkaynak ve temettü verim oranlarının İstanbul Menkul Kıymetler Piyasası’nda (İMKB) işlem gören hisse senetlerinin getirilerini açıklama gücünü incelemektedir. Analizlerimiz temettü verim oranı dışındaki bütün değişkenlerin tek başlarına regresyona dahil edildiklerinde hisse senedi getirileri üzerinde önemli etkileri bulunduğu ve en yüksek etkinin satış-fiyat oranına ait olduğu sonucunu vermistir. Bununla beraber, bulgularımız satış-fiyat ve borç-özkaynak oranlarının İMKB hisse senedi getirilerini, uluslararası literatürde zaman kesiti değişkenliğini açıklamada önemli adledilen şirket büyüklüğü ve defter değeri-piyasa değeri oranına (Fama ve French, 1992) göre, daha iyi açıkladığını göstermektedir.
Anahtar kelimeler: hisse senedi getirileri, Fama-French faktörleri, İstanbul Menkul Kıymetler Borsası
Boğaziçi Journal Vol. 21, no. 1-2 (2007), pp. 93-105.
* Z. Nuray Güner, would like to acknowledge the support of the turkish Academy of sciences in the framework of the Young Scientist Award Program. (EA-TÜBA-GEBİP/2001-1-1). This paper is part of Mr. Kayaçetin’s MBA thesis. The paper benefited significantly from the comments of participants of the Global Business and Technology Association’s meetings in 2004 in Cape Town, South Africa.
** N. Volkan Kayaçetin is a doctoral candidate in the Department of Finance and Management Science at the University of Alberta School of Business, Edmonton, AB, Canada. E-mail: [email protected]
*** The corresponding author, Z. Nuray Güner is an Associate Professor in the Department of Business Administration at Middle East Technical University, İnönü Bulvarı, 06531, Ankara, Turkey. E-mail: [email protected]

94
Fama and French (1992) show that two firm-specific variables, size and BE/ME, capture the cross-sectional variation in stock returns quite well and subsume the explanatory power of earnings-to-price ratio, leverage, and market beta. Allowing for variation in beta unrelated to size, the authors demonstrate that the relation between market beta and average return is flat, a finding that has had a great impact on both academic and non-academic frontiers of finance. Particularly, the three-factor model introduced by Fama and French (1993, 1996), which includes the excess market return, the return on a portfolio long on small stocks and short on big stocks (SMB), and the return on a portfolio that has a long position in high book-to-market stocks and a short position in low book-to-market stocks (HML), now plays an integral part in many asset-pricing tests.
This paper examines the explanatory powers of firm size, book-to-market, sales-to-price (and gross profit-to-price), debt-to-equity, and dividend yield for the cross-section of returns on the Istanbul Stock Exchange (ISE) in a period from July 1993 to December 2002. One important reason to conduct such a study is the fact that emerging markets display very different characteristics compared to those of established markets, such as the New York Stock Exchange or Tokyo Stock Exchange. In particular, emerging markets offer higher yields, have higher return volatilities, and demonstrate auto-correlated returns that are not integrated to global markets (Muradoğlu, Taşkın and Bigan, 2000). These differences, coupled with the crisis-prone nature of the turkish economy,(1) may alter the set of factors that proxy for equity risk. Specifically, we expect (i) firm leverages to have a more pronounced effect on the cross-section of returns due to increased bankruptcy risk in an unstable economic environment and (ii) book-to-market ratio to have lower explanatory power than cash flow-multiples like sales-to-price ratio, since high inflation rates will make book values of firm assets far less informative compared to established markets.
We conduct univariate tests of mean differences and Fama-MacBeth regressions and run a horse-race between the set of variables under study. Our results indicate that each of these variables (except dividend yield) has significant explanatory power for the cross-section of security returns on the ISE securities. Consistent with our expectations, the highest premiums are associated with sales-to-price ratio and debt-to-equity ratio, while the explanatory powers of firm size and book-to-market ratio for the cross-section of returns are subsumed by these two variables.
By examining the explanatory power of a larger set of company-specific variables over a longer time period, our paper expands on the results of a previous study by Akdeniz, Altay-Salih, and Aydoğan (2000), in which size and book-to-market are found to explain the cross-section of returns on the ISE and subsume the explanatory powers of market beta and earnings-to-price ratio in absence of sales-to-price and debt-to-equity ratios. To the best of our knowledge, sales-to-price, gross profit-to-price and debt-to-equity ratios have not yet been tested for the ISE securities.
The rest of the paper is organized as follows. The next section summarizes the relevant literature, followed by a description of our data and methodology. The next section provides a discussion of our results. the final section has our conclusions.
RELEVANT LITERATURE AND CONTRIBUTIONS
A particularly rich subject area in financial research relates to the way capital assets are priced in the market. From the 1950s until the present, financial researchers have tried a variety of approaches to tackle the asset-pricing puzzle. However, the complex stochastic processes associated with

95
fundamentals, i.e., interest rates, and expected asset returns, render this puzzle difficult to solve.
The first and probably the most influential step was taken when Sharpe (1964), Lintner (1965), and Black (1972) introduced the Capital Asset Pricing Model (CAPM). The CAPM suggests that in a one-period economy in which investors follow the mean-variance optimization principles of Markowitz (1952), everyone will hold a mixture of the risk-free asset and a market portfolio, and that the returns on securities will be explained by the market beta (β), which measures the sensitivity of asset returns to the return on the market as a whole.
The CAPM provides a simple and elegant framework in which asset returns can be studied; but in doing so, it requires very stringent assumptions to hold. The model’s main premise that the β should capture all the variation in security returns has constantly been called into question. A good number of firm-specific variables, including the dividend yield (Brennan, 1970), earnings-price ratio (Basu, 1977), firm size (Banz, 1981), book-to-market ratio (Stattman, 1980), financial leverage (Bhandari, 1988), sales-to-price ratio (Senchack and Martin, 1987), and cash flow-to-price ratio (Chan, Hamao, and Lakonishok, 1991), are shown to have significant explanatory powers on the cross-section of returns, over and above that of β. these findings, initially, are regarded as anomalies.
The Arbitrage Pricing Theory (APT) of Ross (1976) provides an alternative framework within which the puzzling significance of above listed firm-specific variables can be recognized. Assuming the individuals believe in a k-factor return-generating model, the APT suggests security returns may be represented as linear combinations of variables that are correlated with these k systematic risk sources. This implies that variables like size, book-to-market, and leverage may be factors correlated with the underlying risk sources.
An influential paper by Fama and French (1992) initiates the rise of size and book-to-market as important asset pricing factors. The authors show that these two specific variables explain the cross-section of returns well and subsume the explanatory power of β and earnings-to-price ratio. It is also shown that, controlling for differences in size, the relation between β and asset returns is flat. In two subsequent studies, Fama and French (1993, 1996) establish SMB and HML as the time-series factors for size and book-to-market and show that a three-factor model that also includes the excess market return (i) explains the average returns quite well and (ii) dismisses certain return anomalies related to size, book-to-market, earnings-to-price, and dividend yield.
The cross-section of returns on the ISE, an important emerging market, was previously investigated by Akdeniz, Altay-Salih, and Aydoğan (2000). The authors study average returns on ISE securities over the period from January 1992 to December 1998 and find, consistent with the results reported in Fama and French (1992), that size and book-to-market explain the cross-section of returns on the ISE and subsume the explanatory powers of market beta and earnings-to-price ratio. By analyzing and comparing the explanatory powers of a larger set of variables over a longer sample period, our paper expands on these results and provides additional insights.
DATA AND METHODOLOGY
Our sample includes all the firms that are listed on the ISE during the period from July 1992 to 2002 with the exception of financial firms, holdings, and firms with more than one type of share quoted

96
on the market.(2) As of the end of 1992, there were a total of 145 securities listed on the ISE. After taking out financial firms, holdings and firms with more than one type of share quoted on the market, our sample size reduces to 94 securities. For December 2002, our sample includes 204 securities. During our sample period, we have 19,487 firm months. The financial information required for a firm to be included in the cross-sectional regressions for the measurement period July t through June t+1 consists of the stock price (P
i,6,t-1) and number of shares outstanding (NSO
i,6,y-1) as of the end of June of
year t-1, and annual dividends (DIVi,t-1
), book value of total assets (TAi,t-1
), book value of total equity (TE
i,t-1), sales (S
i,t-1), and cost of goods sold (C
i,t-1) as reported in the December-end financial statements
of year t-1. Therefore, the return data used in our analysis cover a period from July 1993 to December 2002. Data on monthly stock prices and number of shares outstanding are obtained from databases maintained by the ISE while data on accounting figures are from the database of financial statements of the ISE firms published on the official web site of the ISE (www.imkb.gov.tr).
Following Fama and French (1992), we calculate the market value of equity (MVE) for each firm in year t using the end of June values for NSO and stock prices in year t-1. the year t values for book-to-market ratio (BE/ME), sales-to-price ratio (S/P), gross profit-to-price ratio (GP/P), debt-to-equity ratio (D/E), and dividend yield (DY) are calculated using the December-end financial statement figures from year t-1 and the market value of equity at the end of June in year t-1. The market beta and earnings-to-price ratio are not included in the set of explanatory variables, based on the results reported in Akdeniz, Altay-Salih, and Aydoğan (2000) that these two variables fail to have any significant explanatory power on the cross-section of returns over that of BE/ME and MVE. The six month lag between the measurement period and the date at which the information contained in explanatory variables are made public follows Fama and French (1992) and aims to avoid the potential look-ahead bias that might be induced by possible lags in firm’s financial statement submissions.(3) the firm-specific variables are defined as follows:
MVE i,t
= Pi,6,t-1
* NSOi,6,t-1
BE/MEi,t
= TEi,t-1
/ MVEi,t-1
S/Pi,t
= Si,t-1
/ MVEi,t
GP/Pi,t
= (Si,t – C
i,t) / MVE
i,t
D/Ei,t
= (TAi,t
– TEi,t) / TE
i,t
DYi,t = DIV
i,t-1 / P
i,12,t-1
univariate analysis
At the beginning of each measurement period (i.e., from July t to June t+1), the sample of stocks is sorted on the firm-specific factors (X
it), one at a time, and equally weighted portfolios of the top
30%, the middle 40%, and the bottom 30% of the ranked list are formed, which we refer to as high (H), medium (M), and low (L) factor portfolios. The twelve-month measurement period returns on these portfolios and the portfolio averages of the firm-specific factors are computed. We calculate the differences between the returns on high and low factor X portfolios (R
HX – R
LX) and conduct a one-
tailed t-test to find out whether these differences verify our prior expectations on how these factors should be related to asset returns. The mean return differential calculated for factor X is hereafter referred to as HML
X. We also observe and report, for each factor, whether the returns on H, M, and L
portfolios uniformly increase or decrease as we go from high to low values of the factor under study.

97
Fama-MacBeth regressions
The 12-month return measurement periods start on July 1 of each year t and end on June 30 of year t+1. Following the Fama-MacBeth (1971) procedure, we run cross-sectional regressions of monthly returns observed over each measurement period on different combinations of firm-specific factors, which are computed using the previous year’s accounting figures as described earlier. This procedure yields a total of 113(4) coefficient estimates for each company-specific variable (β
X) for each model
tested. the time-series averages of the βs are computed and tested using a simple t-test.
First, we run simple regressions of the returns on each firm-specific variable. The variables that fail to obtain significant coefficients in these models are eliminated from further analysis. Next, we run multiple regressions of the returns on all possible combinations of the remaining set of factors and compare the explanatory power of size and book-to-market to those of cash flow-to-price ratios (S/P and GP/P), D/E and D/P by looking at (i) the significance of coefficient estimates for models in which the variables are used together and (ii) the time-series means of adjusted R2 for models in which the variables are used separately.
The next section presents a discussion of the results that we obtain from the univariate tests of mean differences across high and low factor portfolios and the Fama-MacBeth cross-sectional regressions.
RESULTS AND DISCUSSION
Descriptive Statistics
Panel A of Table 1 reports the time-series averages of the cross-sectional means for the firm-specific variables under examination for the market as a whole. For an average ISE firm, the average market capitalization is approximately 54 trillion TL during our sample period. Similarly, over the ten years under study, average book-to-market ratio, average sales-to-price ratio, average gross profit-to-price ratio, average debt-to-equity ratio and average dividend yield for an average ISE firm are 0.618, 1.498, 0.395, 0.920, and 0.2, respectively.
Panel B of Table 1 presents the cross-sectional averages of the stock-level time-series correlations between the firm specific variables. All of the correlations, with the exception of those between dividend yield and other firm specific variables, are statistically significant at the one percent level. MVE is negatively related to BE/ME, S/P, GP/P and D/E with correlation coefficients ranging from -0.26 to -0.31. BE/ME, GP/P, and D/E are all positively related to each other. The correlations of 0.45 between BE/ME and D/E, 0.62 between S/P and D/E, and 0.53 between D/E and GP/P are worth noting. Returns display the highest correlation with MVE (-0.268), followed by S/P (0.216), GP/P (0.197), and BE/ME (0.141). All of these correlation coefficients are statistically significant at the one percent level as well. Even though dividend yield is positively related to returns (0.006), statistically, the correlation coefficient is not significantly different from zero at any reasonable significance level.

98
table 1Descriptive Statistics
Panel a: Means of relevant Variables for Sample Firms during the Sample Period
Variables all Securities
MVE*(109) 54,000
BE/ME 0.618
S/P 1.498
GP/P 0.395
D/E 0.920
DY 0.002
Panel B: Correlation CoefficientsThe correlation coefficients between subsequent returns, dividend yields, and natural logarithms of MVE, BMR, SPR, SCPR, and DER are reported for aggregate cross-sectional data. return data covers a period from July 1993 to December 2002, while the accounting figures are derived from annual report data for a period from December 1992 to December 2001. The numbers in parentheses are t-values calculated for these coefficients.
MVe Be/Me S/P GP/P D/E DY
BMr-0.278
(-11.15)
SPR-0.257 0.286
(-10.26) (11.49)
SCPR-0.309 0.246 0.802
(-12.51) (9.79) (51.81)
DER-0.257 0.451 0.616 0.530
(-10.27) (19.45) (30.13) (24.07)
DY-0.001 -0.048 -0.031 -0.014 -0.061(-0.05) (-1.87) (-1.19) (-0.53) (-2.34)
return-0.268 0.157 0.216 0.197 0.141 0.006
(-10.72) (6.13) (8.53) (7.74) (5.49) (0.25)

99
univariate analysis
the first stage of our study entails a preliminary analysis of the returns on high, medium, and low factor portfolios formed on each of the company specific factors under study. the statistical tool used in this part of the analysis is a simple one-tailed t-test performed on annual return differentials between high and low factor portfolios. The results are presented in panels A to F of Table 2.
table 2results of univariate Portfolio analysis
Reported in the panels below are the ten-year averages of the annual returns observed on the high, medium, and low portfolios formed through one-way sorts performed for each company-specific variable under study, presented together with the average values of that company-specific variable on which the portfolio is formed. HML is the return differential between high and low portfolios. t-values obtained from one-tailed tests of our preliminary hypotheses performed on these return differentials, and the p-values associated with these tests are also given.
Panel a Panel B Panel C Panel D Panel e Panel F
MVe (*109) returns Be/Me returns S/P returns GP/P returns D/E returns DY returns
High 179,286 0.929 1.165 1.368 3.316 1.540 0.813 1.338 2.122 1.367 0.007 1.056
Medium 13,472 0.921 0.505 1.018 0.989 0.982 0.267 1.019 0.570 1.065 0.000 0.720
Low 3,295 1.400 0.220 0.827 0.360 0.711 0.148 0.857 0.184 0.765 0.000 1.576
HMl -0.470 0.541 0.829 0.481 0.602 -0.520
t-value -1.520 1.920 2.830 2.170 2.120 -2.000
p-value 0.080 0.043 0.010 0.029 0.032 0.077
before interpreting these results, we have to note that the t- and p-values reported might not constitute, by themselves, enough evidence on the nature of the actual relation between returns and a tested variable due to the small size of our sample. Nevertheless, when the patterns displayed by returns on high, medium, and low factor portfolios are combined with the respective t-statistics of the mean return differences between H and L portfolios, it might be possible to obtain a general picture of the nature of the relation between returns and the firm-specific variables. With this in mind, we proceed to discuss the results.
For all variables, except dividend yield, the differences between the returns on high and low factor portfolios confirm our prior expectations. Consistent with the existing evidence, asset returns are negatively related to firm size and positively related to book-to-market, sales-to-price, gross profit-to-price, and debt-to-equity ratios. The dividend yield, on the other hand, demonstrates a negative return differential, a finding that contradicts the general wisdom in financial research. All of the

100
relations are significant at the 10% level. Among the firm-specific variables, S/P commands the highest absolute annual return differential (82.9%), followed by debt-to-equity ratio (60.2%), and book-to-market ratio (54.1%).
Examining the patterns of returns for high, medium, and low factor portfolios, we may be able to get a preliminary notion on whether these factors are related linearly to average annual returns. All portfolios except those formed on firm size and dividend yield display a monotonic pattern with returns increasing as we go from low to high factor portfolios. the violation of the monotonic pattern for size and dividend yield may be viewed as a signal of a non-linear relation between returns and these variables. Furthermore, means reported for the H, M, and L portfolios confirm that our sorts resulted in a reasonable degree of heterogeneity to study the effects of these firm characteristics on the cross-section of returns.
Fama-MacBeth regressions
In the second stage of our study, we conduct cross-sectional regressions of stock returns on company specific variables. The analysis is made using the well-known Fama-MacBeth cross-sectional regression methodology. the average monthly coefficients for each different model are tested and the t-values associated with these coefficients are presented in Table 3.
The coefficients obtained from single-parameter cross-sectional regressions of returns on company-specific factors, and t-values associated with these coefficients are reported in Panel A of Table 3. All factors, except dividend yield, have a statistically significant coefficient at a 95% confidence level. since dividend yield has a statistically insignificant coefficient even when used alone in a regression, this variable is excluded from further analysis. Based on the magnitude of regression coefficients, their significances, and adjusted R-square values, we also decide that, of the two earnings measures, the sales-to-price ratio is superior to the gross profit-to-price ratio. Furthermore, the sales-to-price ratio is less prone to manipulation by management. In line with our a priori expectations, and as confirmed by preliminary portfolio analysis, firm size has a negative coefficient (-0.006), while positive coefficients are obtained for book-to-market ratio (0.010), sales-to-price ratio (0.014), gross profit-to-price ratio (0.012), and debt-to-equity ratio (0.010).
table 3Fama-MacBeth Cross-Sectional regression Coefficients
Results are based on an Ordinary Least Squares model. The full model is:
Ri = γ
0 + γ
1 lnMVE
i + γ
2 lnBE/ME
i + γ
3 lnS/P
i + γ
4 lnGP/P
i + γ
5 lnD/E
i + γ
6 DY
i
ri is the monthly return on security i; lnMVE
i, lnBE/ME
i, lnS/P
i,
lnGP/Pi and lnD/E
i, are the natural logarithms of firm size, book-
to-market ratio, sales-to-price ratio, gross profit-to-price ratio, and debt-to-equity ratio, respectively; DY is the dividend yield. The average single-parameter, two-parameter, and multi-parameter regression coefficients are reported, respectively, in Panel A, Panel B, and Panel C. The numbers in parentheses are the t-values. Average r-square values for different models are also reported in the last column.

101
table 3 (continued)
Panel a
Model MVe Be/Me S/P GP/P D/E DY R2
1 -0.006 0.032
(-2.297)
2 0.010 0.022
(2.240)
3 0.014 0,022
(4.093)
4 0.012 0.017
(3.638)
5 0.010 0.023
(3.329)
6 1.742 0.011
(1.031)
Panel B
Model MVe Be/Me S/P GP/P D/E DY R2
7 -0.005 0.005 0.045
(-1.708) (1.262)
8 -0.002 0.012 0.043
(-0.696) (3.419)
9 -0.004 0.007 0.042
(-1.376) (2.544)
10 0.005 0.013 0.032
(1.330) (4.332)
11 0.005 0.008 0.032
(1.273) (2.966)
12 0.012 0.002 0.029
(3.334) (0.571)
Panel C
Model MVe Be/Me S/P GP/P D/E DY R2
13 -0.002 0.004 0.012 0.051
(-0.704) (1.126) (3.597)
14 -0.003 0.011 0.002 0.046
(-1.015) (2.788) (0.578)
15 -0.004 0.004 0.006 0.049
(-1.509) (0.932) (2.347)
16 0.007 0.013 0.000 0.036
(1.659) (3.438) (-0.004)
17 -0.002 0.005 0.012 0.000 0.055
(-0.818) (1.161) (2.870) (-0.057)

102
The results of the two-parameter regressions are presented in Panel B of Table 3. In these regressions, we find out that the coefficients of firm size and book-to-market ratio lose their statistical significance when sales-to-price ratio or debt-to-equity ratio is added to the model.(5) Sales-to-price and debt-to-equity ratios, on the other hand, display statistically significant coefficients when used together with either firm size or book-to-market ratios. The coefficient for sales-to-price ratio ranges between 0.012 and 0.013 in two parameter regressions. Debt-to-equity ratio, on the other hand, maintains a statistically significant coefficient between 0.007 and 0.008, except in the model that it is used together with sales-to-price ratio. In this model, the debt-to-equity ratio loses its statistical significance.
The results of three- and four-factor models are presented in Panel C of Table 3. These results support the conclusions we drew in the previous paragraph. With coefficients that range between 0.011 and 0.013, the sales-to-price ratio is the only variable that retained its statistical significance in all the models studied. Our measure of financial leverage, i.e., debt-to-equity ratio, has promising results except for the models in which it is used together with sales-to-price ratio. Contrary to the evidence from studies conducted on established stock markets, neither the firm size nor the book-to-market ratio seem to have any explanatory power for the cross-section of returns on the ISE when the sales-to-price ratio is included in the model.
The finding that the explanatory power of BE/ME is subsumed by S/P is interesting given the stylized empirical evidence in the literature in favor of this factor, but not very surprising when viewed in the context of the Turkish economy. Indeed, one may expect the high inflation rates experienced in the country during the early part of our sample period and the partial inflation adjustment in the accounting books of companies during our sample period to reduce the meaningfulness of the book equity figures. As a result, these two factors might result in reduced explanatory power for the book-to-market ratio. S/P, on the other hand, is relatively more robust to the distortion caused by high inflation rates.
Ultimately, our thesis is that S/P captures the same underlying risk factor – financial distress (or behavioral bias, depending on reader’s beliefs) as BE/ME in the Fama and French (1996) three-factor model, without being subject to the adverse effect of inflation on the book value of assets. This line of reasoning, however, does not apply to firm size, which is also subsumed by S/P and D/E. A plausible explanation is that, given the low market capitalization and high proportion of speculative trades on the ISE, and the fragility of the Turkish economy, investors might care more about whether there is demand for the product of a company (short-term stability captured by the sales-to-price ratio) and whether the firm is bankruptcy-prone (leverage captured by the debt-to-equity ratio) than how big the market capitalization of the company is.
CONCLUSIONS
In this paper, the explanatory powers of firm size, book-to-market ratio, sales-to-price ratio, gross profit-to-price ratio, debt-to-equity ratio, and dividend yield for the cross-section of returns on the Istanbul Stock Exchange were examined. Our sample spanned a 114-month time period starting from July 1993 to December 2002, resulting in 113 return observations. In the end, we found that, by themselves, all of these company-specific variables, except dividend yield, commanded statistically significant premia on returns.

103
Using market capitalization as a proxy for the firm size, we showed that a significant negative relationship exists between returns and firm size. The relationship between book-to-market ratio and returns, on the other hand, was positive and statistically significant. the coefficients found in the single-parameter Fama-MacBeth regressions for firm size and book to market ratio were -0.006 and 0.010, respectively. These values are very close to the respective coefficients reported in a similar study conducted on the ISE by Akdeniz et al. (2000).
Sales-to-price ratio and debt-to-equity ratio are two company specific variables that, to the best of our knowledge, have not yet been tested for the ISE. We tested the explanatory powers of these variables and found a positive and statistically significant relationship between returns and these variables. Both debt-to-equity ratio and sales-to-price ratio subsumed the explanatory powers of firm size and book-to-market ratio when used together in regression models that contain either, or both, of these variables. Based on this finding, we reached the conclusion that sales-to-price and debt-to-equity ratios could do a better job in capturing the cross-sectional variability of returns on the ISE compared to firm size and book-to-market ratio.
The gross profit-to-price ratio was also tested and its explanatory power was found to be inferior to that of the sales-to-price ratio. the cost of goods sold figures includes the depreciation related to manufacturing facilities. the inclusion of manipulation-prone depreciation account in calculation of cost of goods sold might cause such a decrease in the explanatory power of gross profit-to-price ratio.
Of all the variables tested, sales-to-price ratio was the most powerful. The univariate portfolio analysis results indicated that the highest return premium was associated with S/P. Furthermore, Fama-MacBeth regression results agreed on a relatively robust coefficient for S/P, which ranged between 0.011 and 0.014. Moreover, the sales-to-price ratio subsumed the statistical significances of all other variables under study when used together in multi-factor Fama-MacBeth regressions. These results on the interrelationship between firm size, book-to-market ratio, sales-to-price ratio, and debt-to-equity ratio comply one-to-one with the results of a study by Barbee, Mukherji, and Reines (1996).
Unfortunately, our study has some limitations. One of these limitations is that market betas are not included in our analysis. Since Akdeniz et al. (2000) find insignificant explanatory power for market betas on the ISE during the period from 1992 to 1998, this exclusion of the market factor may not be that problematic. Also, we have to work with a much smaller sample of returns compared to the tests conducted on established markets such as the New York Stock Exchange or the Tokyo Stock Exchange. The power of our tests, hence, is negatively effected by the size of our sample.
There is still much more to do to understand the behavior of returns on the Istanbul Stock Exchange. Although our study addresses only some company-specific factors, models that contain a combination of external factors (like general economic activity as well as industry-specific factors), extracted factors (like market beta) and company-specific factors (like sales-to-price ratio) might do a better job in explaining the cross-sectional variability in returns.

104
NOTES
The Turkish economy suffered financial crises in 1994, 1997, 2000 and 2001.1.
Financial firms are excluded since characteristically the high debt-to-equity ratios of such firms 2. do not necessarily indicate financial distress, and hence, may distort our analysis. Holdings are excluded, as the stocks of such companies resemble more a mini-portfolio than a single security. Firms with more than one type of share quoted on the stock market are also taken out of the sample since a high correlation among returns to these securities is expected.
Companies listed on the ISE are obliged to report their financial statements to the Capital Market 3. Board (CMB) and the ISE within three months after their fiscal year end. However, more than rarely, extensions, which may take as long as three more months, can be granted to this pre-set deadline. A six-month lag between the computations of firm returns and company specific variables is, thus, seen appropriate in order to avoid a look-ahead bias. This six-month lag is also consistent with lags used in earlier studies (Fama and French [1992, 1993, 1995], Kothari et al. [1995], Akdeniz et al. [2000]).
The price data used start from July 1993 and ends at December 2002, resulting in 113 return 4. measurements.
Results with gross profit-to-sales ratio are essentially the same, but to conserve space they are not 5. reported here. However, these results are available from the authors upon request.
REFERENCES
Akdeniz, L., Altay-Salih, A., and Aydoğan, K. (2000). “Cross-Section of Expected Stock Returns on the Istanbul Stock Exchange,” Russian and East European Finance and Trade, 36: 6-26.
Basu, S. (1977). “Investment Performance of Common Stocks in Relation to their Price-Earnings Ratios: A Test of the Efficient Market Hypothesis,”Journal of Finance, 32: 663-682.
Banz, R.W. (1981). “The Relationship between Return and Market Value of Common Stocks,” Journal of Financial Economics, 9: 3-18.
Barbee, W.C., Mukherji, S., and Reines, G.A. (1996). “Do Sales-Price and Debt-Equity Explain Stock Returns Better than Book-Market and Firm Size?” Financial Analysts Journal, March/April: 56-60.
Bhandari, L.C. (1988). “Debt/Equity Ratio and Expected Common Stock Returns: Empirical Evidence,” Journal of Finance, 43: 507-528.
Black, F. (1972). “Capital Market Equilibrium with Restricted Borrowing,” Journal of Business, 45: 444-454.

105
Brennan, M.J. (1970). “Investor Taxes, Market Equilibrium, and Corporation Finance,” Ph.D. Dissertation (Massachusetts Institute of Technology, Cambridge, Massachusetts).
Chan, K.C., Hamao, Y., and Lakonishok, J. (1991). “Fundamentals and Stock Returns in Japan,”,Journal of Finance, 46(5):1739-1764.
Fama, E.F. and French, K.R. (1992). “The Cross-Section of Expected Stock Returns,” Journal of Finance, 47: 427- 465.
------ (1993). “Common Risk Factors in the Returns on Stocks and Bonds,” Journal of Financial Economics, 33, 3-56.
------ (1996). “Multifactor Explanations of Asset Pricing Anomalies,” Journal of Finance, 51(1): 55-84.
Lintner, J. (1965). “The Valuation of Risk Assets and Selection of Risky Investments in Stock Portfolios and Capital Budgets,” Review of Economics and Statistics, 47: 13-37.
Markowitz, H. (1952). “Portfolio Selection,” Journal of Finance, 7: 77-91.
Merton, R.C. (1973). “An Intertemporal Capital Asset Pricing,” Econometrica, 41: 867-887.
Mossin, J. “Equilibrium in a Capital Asset Market,” Econometrica, 34: 768-783.
Muradoğlu, G., Taşkın, F., and Bigan, I. (2000). “Causality of Stock Returns and Macroeconomic Variables in Emerging Markets,” Russian and East European Finance and Trade, 36. 33-53.
Ross, S.A. (1976). “The Arbitrage Theory of Capital Asset Pricing,” Journal of Economic Theory, 13. 341-360.
Senchack, A., Martin, J. (1987). “The Relative Performance of the PSR and PER Investment Strategies,” Financial Analysts Journal, 43. 45-66.
Sharpe, W. (1964). “Capital Asset Prices: A Theory of Market Equilibrium under Conditions of Risk,” Journal of Finance, 19: 425-442.
Stattman, D. (1980). “Book Value and Stock Returns,” The Chicago MBA, 4.


107
TURKISH MONEY DEMAND, REVISITED: SOME IMPLICATIONS FOR INFLATION AND CURRENCY
SUBSTITUTION UNDER STRUCTURAL BREAKS
CEM SAATCİOĞLU* LEVENT KORAP** İstanbulUniversity Economist
ABSTRACT
In thispaper,amoneydemandmodelconstructedoncurrency incirculation isused todeterminetheappropriatealternativecosttoholdmonetarybalancesintheTurkisheconomy.Ourestimationresults, using contemporaneous multivariate co-integration methodology, indicate that the mostsignificantalternativecosttodemandformoneyisthedepreciationrateofthenominalexchangerate.Thisbringsouttheimportanceofhavingacurrencysubstitutionphenomenonsettledintheeconomywheneconomicagentsmake their decisionsas to theirmonetary transactions.Moreover,we findthatthedomesticinflationaryframeworkhasbeensubjecttoaweaklyexogenouscharacteristicandconcludethatthemainfactorsleadingtodomesticinflationaredeterminedoutofthemoneydemandvariablespace.
Key words: money demand, inflation, currency substitution, Turkish economy.
JEL Classification: C32, E41, E52.
TÜRKİYE’DE PARA TALEBİNİN TEKRAR İNCELENMESİ: YAPISAL KIRILMALAR ALTINDA ENFLASYON VE PARA İKAMESİ İÇİN BAZI
ÇIKARSAMALAR
ÖZET
Buçalışmada,dolaşımdakiparamiktarıüzerinekurulmuşolanbirparatalebimodelieldeparatutumuiçin uygun almaşık maliyet unsurunun Türkiye ekonomisi koşullarında belirlenebilmesi amacıylakullanılmaktadır. Çağdaş çok değişkenli eş-bütünleşim çözümlemesi kullanılarak elde ettiğimizbulgularparatutumuiçinenanlamlıalmaşıkmaliyetunsurununparasaldövizkurudeğerkayıplarıolduğunugöstermektevebudurumekonomideyerleşikparaikamesiolgusununekonomikbirimlerparasalişlemleriileilgilikararlarınıalırkentaşıdığıönemiortayakoymaktadır.Ayrıca,bulgularımızyurtiçienflasyonistyapınınzayıfdışsalbirözelliğesahipolduğunugöstermekteveyurtiçienflasyonubelirleyentemeletkenlerinparatalebideğişkenuzayıdışındabelirlendiğisonucunaulaşılmaktadır.
Anahtar kelimeler: para talebi, enflasyon, para ikamesi,Türkiye ekonomisi.
JEL Sınıflaması: C32, E41, E52.
Boğaziçi JournalVol.21,no.1-2(2007),pp.107-124.
* Cem Saatcioğlu is an Assistant Professor in the Faculty of Economics at İstanbul University, 34452, Beyazıt, İstanbul, Turkey. E-mail: [email protected]
** Levent Korap is an Economist. E-mail: [email protected]

108
Research on demand for monetary balances gives economic agents knowledge of how policy makers must direct monetary policy. Inferences derived from money demand equations can be used to reveal prerequisites in applying stabilization programs, and the appropriate tools used for this purpose can be chosen to achieve program targets. These will enable policy makers to form policy rules for major economic problems in the economy. For example, implications for the income velocity of money and the exogenous/endogenous characteristics of the factors which affect the money demand variable space will yield results for the stability of functional relationships in the monetary markets. If the stability of money demand can be indicated, this will also indirectly mean that, in line with a well-known quantity theoretical relationship, variations in the velocity of money can be foreseen and explained by economic agents considering a stationary economic relationship. On the other side, if the domestic inflationary framework cannot be indicated as a function of monetary aggregates on which money demand variable space is constructed, for example, due to the weakly exogenous characteristic of inflation, such a conclusion will explicitly contradict the quantity theoretical approaches (Özmen, 2003). In this case, money cannot be considered a forcing variable for inflation, and this means that the main factors leading to inflation are determined out of a money demand variable space and that money demand equations should not be appreciated as price equations (MacKinnon and Milbourne, 1988). Therefore, a policy design process that takes into account all of these policy matters will help researchers extract what motives drive the expectations of economic agents.
Dotsey and Hornstein (2003), in their calibrating model on the US economy, warn that even though money communicates information on some policy aggregates such as aggregate output, it is of limited use for policy makers in the sense that it would be a useful signal in an environment driven by productivity shocks, but using it as a signal would have adverse consequences in the presence of money demand disturbances. They suggest that time variation in the behavior of money demand disturbances would imply time variation in a policymaker’s responsiveness to money. Likewise, Estrella and Mishkin (1997) focus on the role of monetary aggregates as information variables considering a monetary policy rule perspective. They show that, for the post-1979 period in the US economy, monetary aggregates represented by either a monetary base or a M2 monetary aggregate fall considerably short of this requirement, and results for German M3 broad money supply measures are hardly more favorable. They conclude that monetary aggregates cannot be used in a straightforward way to signal the stance of monetary policy since they do not seem to provide adequate or consistent information. Thus, the existence of a well-specified and stable relationship between money, income and alternative costs to hold money can be seen as a prerequisite for the use of monetary aggregates in the conduct of monetary policy (Goldfeld and Sichel, 1990). Otherwise, disorderly velocity shocks will lead policy makers to fail in the conduct of monetary policy due to the persistent deviations of the growth of monetary aggregates from estimated values. Beginning with the time of well-known missing money arguments and the stability controversies of the demand for money function (Goldfeld, 1973; Goldfeld, 1976), great importance has been attributed to this subject in the economics literature.
For empirical purposes, two approaches can be related to the behavioral assumptions leading economic agents to demand for money, i.e., the transactions and the asset or portfolio balance approaches. The transactions motive emphasizes mainly money’s role as a medium of exchange. For this approach, money is viewed essentially as an inventory held for transaction purposes. The transaction costs of going between money and other liquid financial assets justify holding such inventories even though other assets offer higher yields (Judd and Scadding, 1982). Especially the seminal papers by Baumol (1952) and Tobin (1956) develop the underpinnings of this approach, according to which demand

109
for money balances increases proportionally with the volume of transactions in the economy. On the other side, the portfolio balance approaches consider that people hold money as a store of value and that money is only one of the assets among which people distribute their wealth. People give more importance to the expected rate of return for the assets held relative to the transactions necessities and take into account the risk factor for these assets because of the changing ratio of returns against each other. Friedman (1956) and Friedman (1959), in an influential empirical study which highlights the new quantity theory, and Tobin (1958) can be considered the main pioneering studies in the economics literature emphasizing the importance of risk factor and portfolio decision to demand for money.
Given the importance of a stable money demand relationship, many studies in recent years have been conducted on various country cases by researchers such as Sriram (1999), Nachega (2001), Kontolemis (2002), Ramachandran (2004) and Dreger et al. (2006). On the other side, Metin (1994), Civcir (2000), Civcir (2003), Bahmani-Oskooee and Karacal (2006) and some papers by Central Bank of the Republic of Turkey (CBRT) researchers such as Mutluer and Barlas (2002), Akıncı (2003) and Altınkemer (2004) try to test the demand for money relationship for the Turkish economy. In our paper, we examine these issues of interest by considering the demand for currency in circulation as a function of real income, domestic inflation and exchange rate depreciation. Such a model specification upon narrowly defined monetary aggregates can help us attain implications for the stability of monetary velocity and reveal the structural breaks incurred by velocity shocks. For this purpose, the next section is devoted to a detailed modeling of the Turkish money demand, and the last section concludes.
MODEL
Preliminary Data Issues
We now construct a money demand model for the investigation period 1987Q1-2007Q2 using quarterly observations. The monetary variable we consider (m) is the currency in circulation in natural logarithms. The real gross domestic product (GDP) data at constant 1987 prices are used for the scale-real income variable (y). The variables representing alternative cost to hold money are 12-months weighted time deposit rate (r), annualized quarterly inflation based on GDP-deflator (p) and annualized quarterly change in the TL/US$ exchange rate (e). Choudry (1995) emphasizes that a significant presence of the rate of the change of exchange rate in the demand function for real money balances may provide evidence of currency substitution in high inflation countries, which reduces domestic monetary control by also reducing the financing of deficit by means of seigniorage. He indicates that for three high inflation countries, i.e., Argentina, Israel and Mexico, the stationary long-run money demand relationship only holds with the inclusion of currency depreciation in the money demand function. Furthermore, Bahmani-Oskooee and Karacal (2006) reveal that the stability of demand for money would be affected by the non-inclusion of the exchange rate variable representing currency substitution in the functional form.
Calvo and Leiderman (1992) and Easterly et al. (1995) state that if the sequential values of an economic time series (x) for the alternative cost to hold money are not very close to each other, the cost of holding money can be considered such as [x/(1+x)], which fits well with the Turkish case. Following such a variable specification, we transform variables (r), (p) and (e) into r2=[r/(1+r)], p2=[p/(1+p)] and e2=[e/(1+e)], respectively. All the data used have been taken from the electronic data delivery system of the CBRT and indicate seasonally unadjusted values. We additionally assume that own rate

110
of return for narrowly defined money balances is zero for simplicity and no impulse-dummy variable representing the exogenous shocks witnessed by the economy is considered in the money demand variable space. We use the GDP deflator to deflate the money supply.
The spurious regression problem analyzed by Granger and Newbold (1974) indicates that using non-stationary time series steadily diverging from the long-run mean will produce biased standard errors, which causes unreliable correlations and an unbounded variance process within regression analysis. In this way, the standard OLS regression will produce a good fit and predict statistically significant relationships between variables where none really exists (Mahadeva and Robinson, 2004). This means that variables must be differenced (d) times to obtain a covariance-stationary process. Therefore, the individual time series properties of variables should be elaborately considered. Dickey and Fuller (1979, 1981) provide one of the commonly used test methods, known as augmented Dickey-Fuller (ADF) test, for detecting whether time series is stationary. This can be formulated such that:
k ∆y
t = µ + βt + (ρ-1)y
t-1 + Σ γ
i∆y
t-i + ε
t (1)
i=1
where yt is the variable of interest and t is a time trend. The k lagged differences are to ensure a white
noise error series and the number of lags is determined by a test of significance on the coefficient γi.
The null hypothesis of the ADF test is the presence of a unit root (ρ=1) against alternative stationary hypothesis. For y
t to be stationary, (ρ-1) should be negative and significantly different from zero. We
compare the estimated ADF statistics with the simulated MacKinnon (1991, 1996) critical values. For the case of stationarity, we accept that these statistics must be larger than critical values in absolute value and have a minus sign.
Besides the conventional ADF test in Eq. (1), we also consider the DFGLS test of Elliot et al. (1996), which proposes a more powerful modified version of the ADF test. In the DFGLS test, data are detrended so that explanatory variables are taken out of data prior to running the test regression. This test is similar to the ADF test, but as suggested by Elliot et al. (1996), has a better performance in terms of small sample size and substantially improved power when an unknown mean or trend is present. The DFGLS substitutes the generalized least squares (GLS) detrended y
td data for the original y
t data in
Eq. 1 above. The DFGLS t-ratio follows a Dickey-Fuller distribution in the constant only case, while asymptotic distribution differs when both a constant and trend are included in the test equation.
However, due to the evidence yielded by DeJong et al. (1989), the Dickey-Fuller type tests may have low power against plausible stationary alternatives and the null hypothesis of a unit root tends to be accepted unless there is strong evidence against it. Considering these facts, the ADF tests are supplemented by the tests proposed by Kwiatkowski et al. (1992), known as KPSS tests. KPSS tests are designed to test the null hypothesis of stationarity against the unit root alternative. Yavuz (2004) highlights the properties of the ADF-type and KPSS tests and tries to compare them by using Turkish stock exchange data. We report in Table 1 results from univariate unit root tests. The numbers in parantheses are the lags used for the ADF and DFGLS stationarity tests, which are augmented up to a maximum of 10 lags, and automatic bandwidth selections for the KPSS test. The choice of optimum lag for the ADF and DFGLS tests was decided on the basis of minimizing the Schwarz information criterion (asterisks denote that variables are of stationary form):

111
Above, τC and τ
T are the ADF test statistics with allowance for only constant and constant&trend items
in the unit root tests respectively, and τC
GLS, τT
GLS, Z(τC) and Z(τ
T) are the relevant DFGLS and KPSS
statistics. ‘∆’ denotes the first difference operator. The results from the unit root tests reveal that the null hypothesis of a unit root cannot be rejected for all the variables in the level form, but inversely, for the first differences the stationary alternative hypothesis cannot be rejected.
Testing Endogenous Breaks in the Unit Root Procedure
The unit root tests applied above indicate that variables can be characterized as a random walk process, which requires differencing to achieve a stationary time series. However, these tests are criticized strongly in the contemporaneous economics literature when they have been subject to structural breaks which yield biased estimations. Perron (1989) in his seminal paper on this issue argues that the conventional unit root tests used by researchers do not consider that a possible known structural break in the trend function may tend too often not to reject the null hypothesis of a unit root in the time series when in fact the series is stationary around a one time structural break. Contrary to the general evidence of many earlier papers which conclude that the US post-war GNP series can be represented by a unit root process, Perron (1989) finds that if the first oil shock in 1973 is treated as a structural breakpoint in the trend function, then the unit root hypothesis of the US post-war GNP series can be rejected in favor of a trend stationary hypothesis.
Selecting the date of a structural break, that is, assuming that the time of break is known apriori, however, may not be the most efficient methodology. The actual dates of structural breaks may not coincide with dates chosen exogenously. To address this issue, several methodologies including Perron (1990), Zivot and Andrews (1992) and Banerjee, Lumsdaine and Stock (1992) have been suggested to allow for the determination of the date of structural breaks endogenously. Considering these issues, in our paper, we follow first the Zivot and Andrews (henceforth ZA) methodology, allowing the data to indicate breakpoints endogenously rather than imposing a breakpoint from outside the system. We then allow for some extensions of this test by following Clemente et al. (1998).
Table 1Unit Root Tests
Var. τC τ
T τ
CGLS τ
TGLS Z(τ
C) Z(τ
T)
m 0.86 (4) -0.18 (4) 0.80 (4) -0.86 (4) 0.79 (6) 0.28 (6)∆m -3.63 (3)* -4.12 (3)* -3.47 (3)* -3.30 (3)* 0.30*(26) 0.14*(19)y -0.08 (8) -2.21 (8) 0.76 (8) -1.52 (8) 1.22 (6) 0.22 (6)∆y -3.02 (7)* -4.03 (7)* -2.68 (7)* -3.23 (7)* 0.10(12)* 0.05(12)*
p2 0.40 (4) -1.15 (4) 0.48 (4) -0.86 (4) 0.77 (6) 0.26 (6)∆p2 -7.77 (3)* -8.05 (3)* -1.57 (6) -7.60 (3)* 0.09 (1)* 0.03 (1)*
e2 -1.30 (5) -1.95 (5) -1.31 (5) -1.82 (5) 0.57 (6) 0.22 (6)∆e2 -4.04 (4)* -4.05 (4)* -3.19 (4)* -3.89 (4)* 0.06 (2)* 0.03 (2)*
r2 -1.57 (0) -2.24 (0) -1.46 (0) -1.68 (0) 0.48 (6) 0.30 (6)∆r2 -7.75 (1)* -7.97 (1)* -7.80 (1)* -8.00 (1)* 0.38 (9)* 0.09 (13)*
5% cv. -2.90 -3.52 -1.95 -3.11 0.46 0.15

112
The ZA methodology as a further development on the Perron (1989) methodology can be explained by considering three possible types of structural breaks in a series, i.e., Model A assuming shift in intercept, Model B assuming change in slope and Model C assuming change in both intercept and slope. For any given time series y
t, ZA (1992) test the equation of the form:
y= µ + yt-1
+ et (2)
Here the null hypothesis is that the series yt is integrated without an exogenous structural break against
the alternative, that the series yt can be represented by a trend-stationary I(0) process with a breakpoint
occurring at some unknown time. The ZA test chooses the breakpoint as the minimum t-value on the autoregressive y
t variable, which occurs at time 1 < TB < T leading to λ = TB / T, λ ∈ 0.15, 0.85,
by following the augmented regressions:
Model A: kyt = µ + βt + θDU
t(λ) + αy
t-1 + Σ c
j∆y
t-j + ε
t (3)
j=1
Model B: kyt = µ + βt + γDT
t*(λ) + αy
t-1 + Σ c
j∆y
t-j + ε
t (4)
j=1
Model C: kyt = µ + βt + θDU
t(λ) + γDT
t*(λ) + αy
t-1 + Σ c
j∆y
t-j + ε
t (5)
j=1
where DUt and DT
t are sustained dummy variables capturing a mean shift and a trend shift occuring at
the break date respectively, i.e., DUt(λ) = 1 if t > Tλ, and 0 otherwise; DT
t*(λ) = t - Tλ if t > Tλ, and 0
otherwise. ∆ is the difference operator, k is the number of lags determined for each possible breakpoint by one of the information criteria and ε
t is assumed to be i.i.d. error term. The ZA method runs a
regression for every possible break date sequentially and the time of structural changes is detected based on the most significant t-ratio for α. To test the unit root hypothesis, the smallest t-values are compared with a set of asymptotic critical values estimated by ZA. We must note that the critical values in the ZA methodology are larger in the absolute sense than the conventional ADF critical values since the ZA methodology is not conditional on the prior selection of the breakpoint. Thus, it is more difficult to reject the null hypothesis of a unit root in the ZA test. For the appropriate lag length, we consider the Schwarz’s Bayesian information criterion (SBIC)-minimizing value.
In addition, considering the case of multiple breakpoints for an economic time series, Clemente et al. (1998) suggest a unit root test that allows for two changes in the mean of a series under the assumption of either innovational (IO) or additive outliers (AO). For the case where the two breaks belong to the IO, we estimate the following regression:

113
k∆y
t = µ + d
1DTB
1t + d
2DTB
2t + θ
1DU
1t + θ
2DU1
2t + αy
t-1 + Σ c
i∆y
t-i + ε
t (6)
j=1
where DTBi (i=1,2) are pulse variables that take the value 1 if t = TB
i + 1 and zero otherwise, DU
i
are defined as above, and TB1 and TB
2 are the dates when the shifts in mean occur. Eq. (6) again is
sequentially estimated and the unit root hyothesis is tested by obtaining minimal value of the t-statistic for the hypothesis α=0 for all break time combinations. An application of the methodology of Clemente et al. (1998) can be found in a recent paper by Abu-Qarn and Abu-Bader (2007).
For estimation purposes, we used EViews 5.1 for the ADF, DFGLS and KPSS tests, and Stata 9.0 for the ZA and Clemente et al. (1998) unit root tests. When we consider the ZA unit root test in Table 2 above allowing endogenous breaks in the time series used, no change occurs in the non-stationary characteristics of the variables. Table 3 presents the results of Clemente et al. (1998) unit root test considering two shifts in the mean of the series for both the AO and IO cases. Allowing two structural breaks in the mean of the series verifies the estimation results found above.
Table 2Zivot-Andrews Unit Root Test
Variable Intercept Trend Both k min t TB k min t TB k min t TBm 2 -2.70 (2003Q3) 2 -3.67 (2002Q1) 2 -3.65 (2001Q2)y 0 -2.97 (1998Q4) 0 -3.55 (1998Q2) 0 -3.86 (1997Q1)p2 0 -4.94 (2001Q2) 0 -4.25 (1996Q4) 0 -4.95 (1993Q2)e2 0 -4.33 (1993Q3) 0 -4.76 (1993Q3) 0 -4.99 (1993Q1)r2 0 -3.98 (2001Q1) 0 -4.12 (2001Q2) 0 -4.80 (2001Q1)
1 Estimation with 0.15 trimmed. Lag length is determined by Schwarz’s Bayesian information criterion. min t is the
minimum t-statistic calculated. 2 Critical values – intercept: -5.43 (1%), -4.80(5%); trend: -4.93 (1%), -4.42 (5%); both: -5.57 (1%), -5.08 (5%)
Table 3Clemente-Montañés-Reyes Unit Root Test with Double Mean Shift
Variable Additive Outliers Innovative Outliers min t Optimal Breakpoints min t Optimal Breakpointsm -2.56 1999Q2, 2003Q2 -2.27 1999Q3, 2003Q2y -2.90 1995Q3, 2001Q2 -3.05 1994Q1, 1999Q2p2 -2.06 1999Q3, 2002Q4 -2.55 1998Q1, 2001Q4e2 -4.07 1991Q2, 2004Q4 -3.08 1991Q1, 2003Q1r2 -4.15 1994Q2, 2001Q1 -4.55 1994Q1, 2001Q1
1 Estimation with 0.15 trimmed. min t is the minimum t-statistic calculated.2 5% critical values – two breaks: -5.49

114
Econometric Methodology
Let us assume a zt vector of non-stationary n endogenous variables and model this vector as an
unrestricted vector autoregression (VAR) involving up to k-lags of zt:
zt = Π
1zt-1
+ Π2zt-2
+ … + Πkzt-k
+ εt (7)
where ε
t follows an i.i.d. process and z is (nx1) and the Π
i is an (nxn) matrix of parameters. Eq. 7 can
be rewritten leading to a vector error correction (VEC) model of the form:
∆zt = Γ
1∆z
t-1 + Γ
2∆z
t-2 + … + Γ
k-1∆z
t-k+1 + Πz
t-k+ε
t (8)
where
Γi = -I + Π
1 + … + Π
i (i = 1, 2, …, k-1) and Π = I - Π
1 - Π
2 - … - Π
k (9)
Eq. 8 can be arrived at by subtracting zt-1
from both sides of Eq. 7 and collecting terms on zt-1
and then adding -(Π
1 - 1)X
t-1 + (Π
1 - 1)X
t-1. Repetition of this process and the collection of terms would yield
Eq. 8 (Hafer and Kutan, 1994). This specification of the system of variables carries on the knowledge of both short- and long-run adjustment to changes in z
t, via the estimates of Γ
i and Π. Following Harris
(1995), Π = αβ′ where α measures the speed of the adjustment coefficient of particular variables to a disturbance in the long-run equilibrium relationship and can be interpreted as a matrix of error correction terms, while β is a matrix of long-run coefficients such that β′z
t embedded in Eq. 8 represents
up to (n-1) cointegrating relations in the multivariate model which ensure that zt converge to their
long-run steady-state solutions. Note that all terms in Eq. 8 which involve ∆zt-i
are I(0) while Πzt-k
must also be stationary for ε
t ~ I(0) to be white noise of an N(0,σ
ε 2) process.
Dealing with the rank conditions, there alternative cases can be considered. If the rank of Π matrix equals zero, there would be no co-integrating relation between the endogenous variables, which means that there would be no linear combinations of the z
t that are I(0). This requires that Π would be (nxn)
matrix of zeros. In this case, a VAR model consisting of a set of variables in first differences could be suggested to examine the variable system. If the Π matrix is of full rank when r=n, then all elements in z
t would be stationary in their levels. Another case is the possibility that there exist r co-
integrating vectors in β′zt ~ I(0) and (n-r) common stochastic trends when Π has reduced rank, i.e., 0
<r≤(n-1). That is, first r columns of β are the linearly independent combinations of the endogenous variables settled in vector z
t which represents stationary relationships. Whereas, the latter (n-r)
columns constitute the non-stationary vectors of I(1) common trends, which require also that the last (n-r) columns of α take insignificantly values highly close to zero, impeding the feedback effects of deviations from the long-run stationary equilibrium process. Thus this method is equivalent to testing which columns of α are zero (Harris, 1995). Gonzalo (1994) indicates that this method performs better than other estimation methods even when the errors are non-normal distributed or when the model is over-parameterized by including additional lags in the error correction model. Further, this method does not suffer from problems associated with normalization (Johansen, 1995).
115
Model Specification
We now construct an unrestricted VAR model consisting of an endogenous variable vector (m, y, p2, e2,r2)′ for the potential long-run money demand space and test whether the expression embedded in (10) below using the multivariate co-integration methodology of the same order integrated variables holds:
β′z: (m, y, p2, e2,r2) ~ I(0) (10)
For the lag length of unrestricted VAR, we consider various information criterions to select the appropriate model between different lag specifications, i.e., sequential modified LR statistics employing small sample modification, the minimized Akaike information criterion (AIC), the final prediction error criterion (FPE), The Schwarz information criterion (SC) and the Hannan-Quinn information criterion (HQ). Considering the maximum lag 5 for the unrestricted VAR model of quarterly frequency data, LR, AIC and FPE criterions suggest to use 3 lags, while SC and HQ information criterion suggests 1 lag order. Thus we choose the lag length 3 to construct unrestricted VAR model. We add a set of centered seasonal dummies which sum to zero over a year as exogenous variable so that the linear term from the dummies disappears and is taken over completely by the constant term, and only the seasonally varying means remain (Johansen, 1995). For instance, the second quarter takes the value of 0.75 while the sum of the remaining three quarters’ dummies is -0.75.
As a next step, we estimate the long run co-integrating relationships between the variables by using two likelihood test statistics. Briefly, the null hypothesis that there are at most r cointegrating vectors and k-r unit roots amounts to: H
0: λ
i=0,i=r+1,…,n (11)
where only the first r eigenvalues are non-zero. This restriction can be imposed for different values of r and then the log of the maximized likelihood function for the restricted model is compared to the log of the maximized likelihood function of the unrestricted model and a standard LR test computed. Using the trace statistic we can test the null hypothesis:
nλtrace=-2log(Q)=-TΣlog(1-λ
i)and r=0,1,2,…,n-2,n-1 (12)
i=r+1
where Q = (restricted maximized likelihood / unrestricted maximised likelihood), T is the sample size. Another test of the significance of the largest λ
i is the maximal-eigenvalue statistic:
λmax=-Tlog(1-λ
r+1) and r=0,1,2,…,n-2,n-1 (13)
which tests that there are rco-integration vectors against the alternative that r+1 exist as expressed above. Table 4 reports the results of the Johansen co-integration test using max-eigen and trace tests based on critical values taken from Osterwald-Lenum (1992) and on newer p-values for the rank test statistics from MacKinnon et al. (1999). Following Johansen (1992), for the co-integration test we restrict intercept and trend factor into our long run variable space following the so-called Pantula principle.
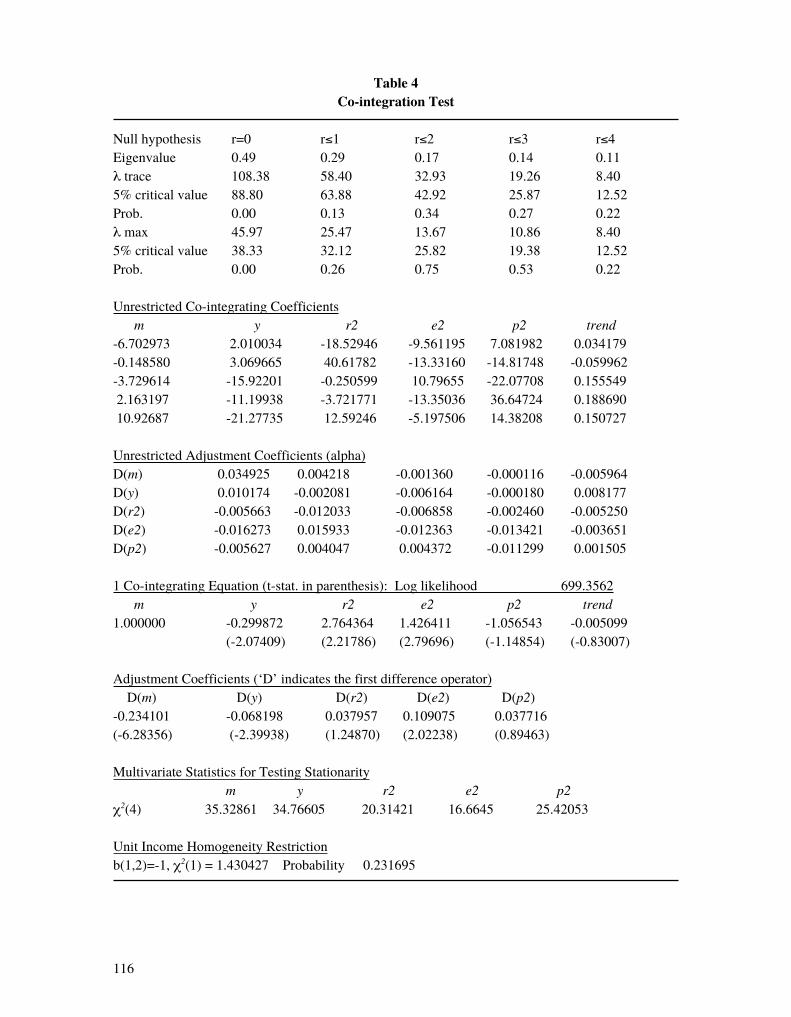
116
Table 4Co-integration Test
Null hypothesis r=0 r≤1 r≤2 r≤3 r≤4Eigenvalue 0.49 0.29 0.17 0.14 0.11λ trace 108.38 58.40 32.93 19.26 8.405% critical value 88.80 63.88 42.92 25.87 12.52Prob. 0.00 0.13 0.34 0.27 0.22λ max 45.97 25.47 13.67 10.86 8.405% critical value 38.33 32.12 25.82 19.38 12.52Prob. 0.00 0.26 0.75 0.53 0.22
Unrestricted Co-integrating Coefficients m y r2 e2 p2 trend-6.702973 2.010034 -18.52946 -9.561195 7.081982 0.034179-0.148580 3.069665 40.61782 -13.33160 -14.81748 -0.059962-3.729614 -15.92201 -0.250599 10.79655 -22.07708 0.155549 2.163197 -11.19938 -3.721771 -13.35036 36.64724 0.188690 10.92687 -21.27735 12.59246 -5.197506 14.38208 0.150727
Unrestricted Adjustment Coefficients (alpha)D(m) 0.034925 0.004218 -0.001360 -0.000116 -0.005964 D(y) 0.010174 -0.002081 -0.006164 -0.000180 0.008177D(r2) -0.005663 -0.012033 -0.006858 -0.002460 -0.005250D(e2) -0.016273 0.015933 -0.012363 -0.013421 -0.003651D(p2) -0.005627 0.004047 0.004372 -0.011299 0.001505
1 Co-integrating Equation (t-stat. in parenthesis): Log likelihood 699.3562 m y r2 e2p2 trend 1.000000 -0.299872 2.764364 1.426411 -1.056543 -0.005099 (-2.07409) (2.21786) (2.79696) (-1.14854) (-0.83007)
Adjustment Coefficients (‘D’ indicates the first difference operator) D(m) D(y) D(r2) D(e2) D(p2) -0.234101 -0.068198 0.037957 0.109075 0.037716(-6.28356) (-2.39938) (1.24870) (2.02238) (0.89463)
Multivariate Statistics for Testing Stationarity m y r2 e2 p2 χ2(4) 35.32861 34.76605 20.31421 16.6645 25.42053
Unit Income Homogeneity Restrictionb(1,2)=-1, χ2(1) = 1.430427 Probability 0.231695

117
Results
From Table 4, both trace and max-eigen tests indicate 1 potential co-integrating vector lying in the long-run variable space:
Rewriting the normalized money demand equation under the assumption of r = 1 and applying to the unit income homogeneity restriction yield below (t-stats. in parentheses):
β′z = m - y + 2.764364r2 + 1.426411e2 - 1.056543p2 + 0.005099trend~ I(0) (14) (2.21786) (2.79696) (-1.14854) (0.83007)
The homogeneity restriction applied to the coefficient of real income is well-accepted by χ2(1) = 1.43 under the null hypthesis. Moreover, co-integrating vector has good diagnostics and fit well with the data generating process in the VEC model using LM(1) = 33.19961 (prob. 0.1262), LM(4) = 28.06211 (prob. 0.3050), Skew(5) = 7.906535 (prob. 0.1615), Kur(4) = 18.38728 (prob. 0.0025), JB(10) = 26.29381 (prob. 0.0034), and Het (525) = 490.7403 (prob. 0.8555), where LM(1) and LM(4) are the 1st and 4th order VEC system residual serial correlation lagrange multiplier statistics under the null of no serial correlation, Skew the skewness, Kur the kurtosis, and JB the Jarque-Bera VEC residual normality statistics assuming Cholesky orthogonalization of Lütkepohl (1991) under the null hypothesis that system residuals are multivariate normal, which indicates no significant outliers in the model. Under the null of no heteroskedasticity or no misspecification, the VEC residual heteroskedasticity test accepts the null hypothesis. For the VEC system residual serial correlation test, probs. come from χ2(16), and the values in parentheses for the system normality and heteroskedasticity tests are the degrees of freedom (d.o.f.) values considered. As for the non-stationarity of the variables, multivariate statistics for testing stationarity are in line with the univariate unit root test results obtained above in the sense that no variable alone can represent a stationary relationship in the co-integrating vector.
In Eq. 14 above, we find that the null hypothesis of homogeneity cannot be rejected for the real income elasticity of money demand. Between the alternative cost variables, the depreciation rate of the nominal exchange rate and the time-deposit rate have found in line with apriori expectations in a significant way. However, the coefficient of inflation rate has a wrong sign and is statistically insignificant as well. Considering t-statistics, the most significant alternative cost for economic agents to hold narrowly defined monetary balances is the depreciation rate of nominal exchange rate inside the period examined. This brings out the importance of the currency substitution phenomenon settled in the economy when economic agents make their decisions about their monetary transactions.
In addition, an important policy conclusion which can be extracted from Table 4 is that domestic inflation is found weakly exogenous in the money demand variable space since the unrestricted adjustment coefficient for domestic inflation is highly close to zero. This requires that no feedback effect of disturbances from the steady-state money demand functional form can be constructed as a dynamic VEC model upon domestic inflation, and such a case reveals explicitly that the main factors leading to the domestic inflation are determined out of the money demand variable space considered in this paper. Whereas, in line with a quantity theoretical perspective, the excess money derived from a money demand equation should have a positive significant effect on the inflation (Civcir, 2000).

118
Table 5Parsimonious VEC Model on Money Demand
Redundant Variables: Dm-1 Dm
-3 Dy
-1 Dy
-3 Dr2
-1 Dr2
-2 De2
-1 De2
-3 Dp2
-2 Dp2
-3
F-statistic 0.750893 Prob. 0.673390Log Likelihood Ratio 10.19797 Prob. 0.423300Test Equation:Dependent Variable: DmMethod: Least SquaresSample(adjusted): 1989Q2 2006Q4White HCSE & CovarianceVariable1,2 Coefficient Std. Error t-Statistic Prob.C 0.022714 0.008226 2.761354 0.0079EC
-1 -0.085659 0.030973 -2.765605 0.0078
D_Q2 -0.412219 0.117301 -3.514208 0.0009D_Q3 -0.264375 0.106879 -2.473583 0.0167D_Q4 -0.248697 0.042127 -5.903502 0.0000Dm
-2 -0.302120 0.130452 -2.315940 0.0245
Dy-2
-0.592103 0.189142 -3.130473 0.0029Dr2
-3 -0.584205 0.158044 -3.696465 0.0005
De2-2 -0.087062 0.029715 -2.929916 0.0050
Dp2-1 0.373352 0.144009 2.592553 0.0123
Adj. R2 0.617524 Akaike info criterion -2.638895S.E. of regression 0.060101 Schwarz criterion -2.295809Durbin-Watson Stat. 2.193092 F-statistic 11.94302
1 ‘D’ indicates the first difference operator2 D_Q2, D_Q3 and D_Q4 are the centered seasonal dummies
- 1 . 2
- 0 . 8
- 0 . 4
0 . 0
0 . 4
0 . 8
1 . 2
9 0 9 2 9 4 9 6 9 8 0 0 0 2 0 4 0 6
C o i n t e g r a t i n g r e l a t i o n 1
Figure 1Co-integrating Relation
We give below the graph of the co-integrating relationship:

119
Having established the long-run money demand co-integrating equilibrium model, we now estimate the dynamic VEC model using both a reduced form model with the econometrically meaningful variables shown and the estimated error correction term produced in the co-integrating relationship. Since all the variables in the model are now of stationary form, statistical inferences using standard t and F tests are valid. We have calculated the t-statistics of each variable by dividing the relevant coefficient by its standard error. We also apply an F-test for the reduction of insignificant variables in our model: where EC is the estimated error correction coefficient upon money demand equation and the latter ‘D’ indicates the first difference operator. As Sriram (1999) emphasizes, in the case of negative significant error correction term of the money demand equation, a fall in excess money balances in the last period would result in a higher level of desired money balances in the current period, that is, it is essential for maintaining long run equilibrium to reduce the existing disequilibrium over time. The parsimonious model has good diagnostics except non-normality problem due to excess kurtosis, using LM(4)=1.75 (0.09), Nor=0.02 (0.99), where LM is the Breusch-Godfrey Serial Correlation LM Test, and Nor is the Jarque-Bera Normality Test. Probs. are in parentheses. In Table 5, we find that nearly 8.5% of the adjustment in money demand disequilibrium conditions to long run static equilibrium is realized within one period.
Stability Tests
Establishing co-integration in the money demand variable space with appropriate signs as a long-run steady-state economic relationship may be interpreted as a sign of a stable money demand functional relationship. However, Bahmani-Oskooee and Bohl (2000) and Bahmani-Oskooee and Karacal (2006) emphasize that evidence of co-integration does not imply constancy of estimated coefficients in co-integrating space. Following Laidler (1993), hence, possible break points inside the period as to our model specification of long-run money demand functional form should be sought:
In Figure 2, we first present the plot of recursive residuals about a zero line for the parsimonious error correction model. Considering ±2 standard error bands, residuals outside the standard error bands suggest instability in the parameters of the equation. A complementary test to the recursive residuals is the one-step forecast test that produces a plot of the recursive residuals and standard errors using sample points whose probability value is at or below 15%. The upper portion of the plot repeats the recursive residuals and standard errors displayed by the recursive residuals and the lower portion of the plot shows the probability values for those sample points where the hypothesis of parameter constancy would be rejected at the 5, 10, or 15% levels. The points with p-values less the 0.05 correspond to those points where the recursive residuals go outside the two standard error bounds. Considering these tests, model stability has been in general satisfied. The possible parameter instability occurs for the post-2003 period.
As with the CUSUM of Squares test, movement outside the critical lines is suggestive of parameter or variance instability. The cumulative sum of squares is within the 5% significance lines suggesting that the residual variance is stable, but they tend to approach to the margin of 5% significance level for the post-2003 period. Finally, recursive error correction (EC) estimates plot the evolution of estimates of the error correction coefficient which comes from the long-run co-integrating model as more and more of the sample data are used in the estimation. If the coefficient displays significant variation as more data is added to the estimating equation, this would be an indicator of instability. Recursive EC estimates yield results in line with recursive residual and one-step forecast tests for the narrowly defined monetary balances in the sense that major instabilities occur for the post-2003 crisis period.
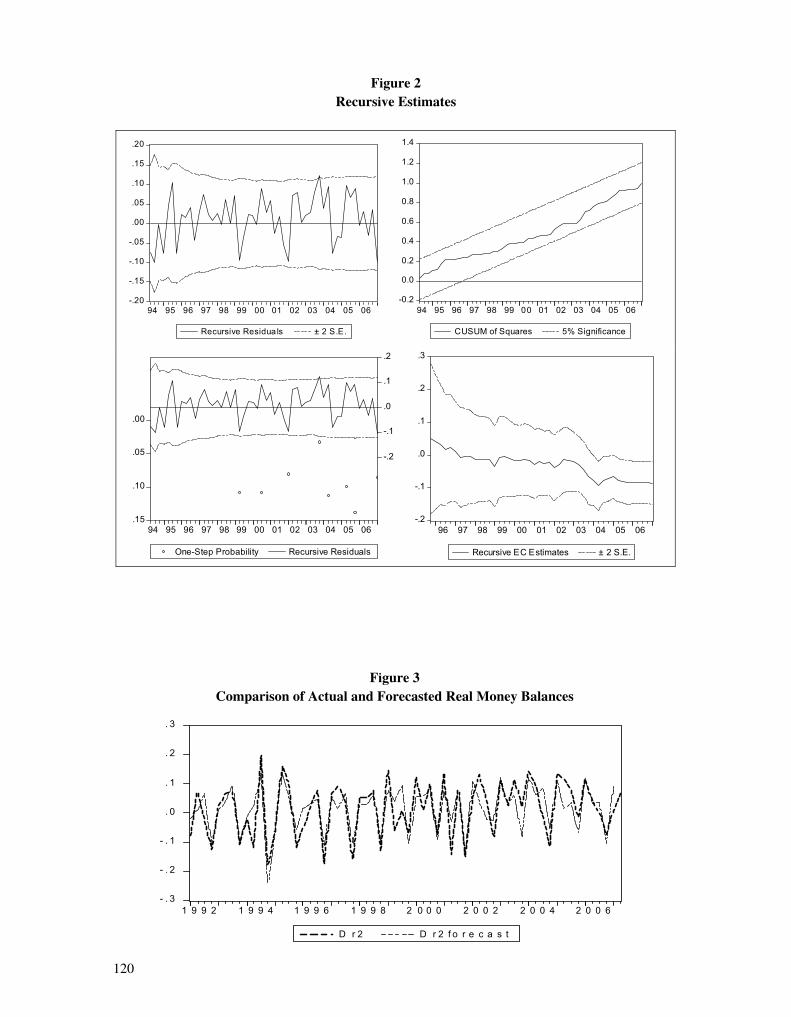
120
Figure 2 Recursive Estimates
-.20
-.15
-.10
-.05
.00
.05
.10
.15
.20
94 95 96 97 98 99 00 01 02 03 04 05 06
Recursive Residua ls ± 2 S.E.
-0.2
0.0
0.2
0.4
0.6
0.8
1.0
1.2
1.4
94 95 96 97 98 99 00 01 02 03 04 05 06
CUSUM of Squares 5% Significance
.00
.05
.10
.15
-.2
-.1
.0
.1
.2
94 95 96 97 98 99 00 01 02 03 04 05 06
One-Step Probability Recursive Residuals
-.2
-.1
.0
.1
.2
.3
96 97 98 99 00 01 02 03 04 05 06
Recursive EC Estimates ± 2 S.E.
Figure 3 Comparison of Actual and Forecasted Real Money Balances
- . 3
- . 2
- . 1
. 0
. 1
. 2
. 3
1 9 9 2 1 9 9 4 1 9 9 6 1 9 9 8 2 0 0 0 2 0 0 2 2 0 0 4 2 0 0 6
D r 2 D r 2 f o r e c a s t
Figure 3Comparison of Actual and Forecasted Real Money Balances
Figure 2 Recursive Estimates
-.20
-.15
-.10
-.05
.00
.05
.10
.15
.20
94 95 96 97 98 99 00 01 02 03 04 05 06
Recursive Residua ls ± 2 S.E.
-0.2
0.0
0.2
0.4
0.6
0.8
1.0
1.2
1.4
94 95 96 97 98 99 00 01 02 03 04 05 06
CUSUM of Squares 5% Significance
.00
.05
.10
.15
-.2
-.1
.0
.1
.2
94 95 96 97 98 99 00 01 02 03 04 05 06
One-Step Probability Recursive Residuals
-.2
-.1
.0
.1
.2
.3
96 97 98 99 00 01 02 03 04 05 06
Recursive EC Estimates ± 2 S.E.
Figure 3 Comparison of Actual and Forecasted Real Money Balances
- . 3
- . 2
- . 1
. 0
. 1
. 2
. 3
1 9 9 2 1 9 9 4 1 9 9 6 1 9 9 8 2 0 0 0 2 0 0 2 2 0 0 4 2 0 0 6
D r 2 D r 2 f o r e c a s t
Figure 2Recursive Estimates

121
Fitness to Turning Points
We now calculate whether the multi-step out-of-sample forecasts of the model can capture the turning points from the actual data of real money balances. For this purpose, we re-estimate the parsimonious money demand model by computing fully dynamic predictions from 1992 Q1 to 2007Q2 so that the previously forecasted values of the lagged real money balances are used in forming the forecasts of the current values of real money balances. Such a forecasting methodology will differ from static forecasts using the actual values in estimation process. In Figure 3, we present a comparison of actual series and dynamic forecasts of real money balances:
In Figure 3, we estimate that VEC modeling is highly successful in tracking down the path of actual data and that the model captures the turning points of actual real money balances well.
CONCLUDING REMARKS
Modeling demand for monetary balances is a useful guide to determine the long-run course of monetary policy and can give policy makers and researchers the knowledge of appropriate tools for stabilization policies. In our paper, we examined the main determinants of currency in circulation by constructing a money demand model upon the Turkish economy. Our estimation results reveal that the most significant alternative cost to demand for money is the depreciation rate of the nominal exchange rate and such a finding brings up the importance of the currency substitution phenomenon settled in the economy when economic agents make their decisions as to their monetary transactions. In addition, we find that domestic inflation is weakly exogenous in the money demand variable space so that no feedback effect of disturbances from the steady-state money demand functional form can be warranted to construct a dynamic vector error correction model upon domestic inflation. In this line, we concluded that the main factors leading to the domestic inflation have been determined out of the money demand variable space, which contradicts especially what proponents of the Monetarist school of economic thought put forward as to the determination of the inflationary process. These all, of course, require additional research and future papers considering money demand equations constructed upon various other monetary aggregates, both narrowly and broadly defined, in order to examine the robustness of the estimation results obtained in this paper.
REFERENCES
Abu-Qarn, A.S. and Abu-Bader, S. (2007). “Structural Breaks in Military Expenditures: Evidence for Egypt, Israel, Jordan and Syria,” MonasterCenterforEconomicResearchDiscussionPaper, June, No. 07-04.
Akıncı, O. (2003). “Modeling the Demand for Currency Issued in Turkey,” CentralBankReview, 1: 1-25.
Altınkemer, M. (2004). “Importance of Base Money Even When Inflation Targeting,”CBRTResearchDepartmentWorkingPaper, No. 04/04.
Bahmani-Oskooee, M. and Bohl, M. (2000). “German Monetary Unification and the Stability of Long-Run German Money Demand Function,” EconomicsLetters, 66: 203-208.

122
Bahmani-Oskooee, M. and Karacal, M. (2006). “The Demand for Money in Turkey and Currency Substitution,” AppliedEconomicsLetters, 13: 635-642.
Banerjee, A., Lumsdaine, R.L., and Stock, J.H. (1992). “Recursive and Sequential Tests of the Unit Root and Trend Break Hypothesis,” JournalofBusinessandEconomicStatistics, 10: 271-287.
Baumol, W.J. (1952). “The Transactions Demand for Cash: An Inventory Theoretic Approach,”QuarterlyJournalofEconomics, 66: 545-556.
Calvo, G.A. and Leiderman, L. (1992). “Optimal Inflation Tax under Precommitment: Theory and Evidence,” AmericanEconomicReview, 82(1): 179-194.
Choudhry, T. (1995). “High Inflation Rates and the Long-Run Money Demand Function: Evidence from Cointegration Tests,” JournalofMacroeconomics, 17(1): 77-91.
Civcir, I. (2000). “Broad Money Demand, Financial Liberalization and Currency Substitution in Turkey,” PaperPresentedtothe7thAnnualConferenceofERF, 26-29 September, Amman.
----- (2003). “Broad Money Demand and Currency Substitution in Turkey,” TheJournalofDevelopingAreas, 36: 127-144.
Clemente, J., Montanes, A., and Reyes, M. (1998). “Testing for a Unit Root in Variables with a Double Change in the Mean,” EconomicsLetters, 59(2): 175-182.
DeJong, D.N., Nankervis, J.C., Savin, N.E., and Whiteman, C.H. (1989). “Integration versus Trend-Stationarity in Macroeconomic Time-Series,” UniversityofIowaWorkingPaperSeries, December, No. 89/31.
Dickey, D.A. and Fuller, W.A. (1979). “Distribution of the Estimators for Autoregressive Time Series with a Unit Root,” JournaloftheAmericanStatisticalAssociation, 74: 427-431.
------ (1981). “Likelihood Ratio Statistics for Autoregressive Time Series with Unit Roots,” Econometrica, 49: 1057-1072.
Dotsey, M. and Hornstein, A. (2003). “Should a Monetary Policymaker Look at Money?” JournalofMonetaryEconomics, 50: 547-579.
Dreger, C., Reimers, H.E., and Roffia, B. (2006). “Long-Run Money Demand in the New EU Member States with Exchange Rate Effects,” EuropeanCentralBankWorkingPaperSeries, May: No. 628.
Easterly, W.R., Mauro, P., and Schmidt-Hebbel, K. (1995). “Money Demand and Seigniorage-Maximizing Inflation,” JournalofMoney,CreditandBanking, 27(2): 583-603.
Elliott, G., Rothenberg, T.J., and Stock, J.H. (1996). “Efficient Tests for an Autoregressive Unit Root,” Econometrica, 64: 813-836.
Estrella, A. and Mishkin, F.S. (1997). “Is There a Role for Monetary Aggregates in the Conduct of Monetary Policy?” JournalofMonetaryEconomics, 40: 279-304.

123
Friedman, M. (1956). “The Quantity Theory of Money - a Restatement,” in M. Friedman (ed.), StudiesintheQuantityTheoryofMoney: 3-21. The University of Chicago Press.
------ (1959). “The Demand for Money: Some Theoretical and Empirical Results,”JournalofPoliticalEconomy,67(4): 327-351.
Goldfeld, S.M. (1973). “The Demand for Money Revisited,” BrookingsPapersonEconomicActivity, 3: 577-638.------ (1976). “The Case of Missing Money,” BrookingsPapersonEconomicActivity, 3: 683-730.
Goldfeld, S.M. and Sichel, D.E. (1990). “The Demand for Money,” in B. M. Friedman and F.H. Hahn (eds.), HandbookofMonetaryEconomics, 1: 300-356.
Gonzalo, J. (1994). “Five Alternative Methods of Estimating Long-Run Equilibrium Relationships,” JournalofEconometrics, 60: 203-233.
Granger, C.W.J. and Newbold, P. (1974). “Spurious Regressions in Economics,” Journal ofEconometrics, 2(2): 111-120.
Hafer, R.W. and Kutan, A.M. (1994). “Economic Reforms and Long-Run Money Demand in China: Implications for Monetary Polic,” SouthernEconomicJournal, 60(4): 936-945.
Harris, R.I.D. (1995). UsingCointegrationAnalysisinEconometricModelling. Prentice Hall.
Johansen, S. (1992). “Determination of Cointegration Rank in the Presence of a Linear Trend,” OxfordBulletinofEconomicsandStatistics, 54(3): 383-397.
----- (1995). Likelihood-basedInferencein CointegratedVector Autoregressive Models. Oxford University Press.
Judd, J.P. and Scadding, J.L. (1982). “The Search for a Stable Money Demand Function: A Survey of the Post-1973 Literature,” JournalofEconomicLiterature, 20(3): 993-1023.
Kontolemis, Z.G. (2002). “Money Demand in the Euro Area: Where Do We Stand (Today)?” IMFWorkingPaper, No. 02/185.
Kwiatkowski, D., Phillips, P.C.B., Schmidt, P., and Shin, Y. (1992). “Testing the Null Hypothesis of Stationary against the Alternative of a Unit Root,” JournalofEconometrics, 54: 159-178.
Laidler, E.W.D. (1993). TheDemand forMoney:Theories,Evidence andProblems, 4th ed. New York: Harper Collins College Publishers.
Lütkepohl, H. (1991). IntroductiontoMultipleTimeSeriesAnalysis. New York: Springer-Verlag.
MacKinnon, J.G. (1991). “Critical Values for Cointegration Tests,” in R.F. Engle and C.W.J. Granger (eds.), Long-run Economic Relationships: Readings in Cointegration: Ch. 13. Oxford: Oxford University Press.
------ (1996). “Numerical Distribution Functions for Unit Root and Cointegration Tests,” JournalofAppliedEconometrics, 11: 601-618.
124
MacKinnon, J.G., Haug, A.A., and Michelis, L. (1999). “Numerical Distribution Functions of Likelihood Ratio Tests for Cointegration,” JournalofAppliedEconometrics, 14: 563-577.
MacKinnon, J.G. and Milbourne, R.D. (1988). “Are Money Demand Equations Really Price Equations on Their Heads,” JournalofAppliedEconometrics, 3: 295-305.
Mahadeva, L. and Robinson, P. (2004). “Unit Root Testing to Help Model Building,” in A. Blake and G. Hammond (eds.), Handbooks inCentralBanking, Centre for Central Banking Studies, Bank of England, July, No. 22
Metin, K. (1994). “Modelling the Demand for Narrow Money in Turkey,” METU Studies inDevelopment, 21: 231-256.
Mutluer, D. and Barlas, Y. (2002). “Modeling the Turkish Broad Money Demand,”CentralBankReview2: 55-75.
Nachega, J.C. (2001). “A Cointegration Analysis of Broad Money Demand in Cameroon,” IMFWorkingPaper, WP/01/26.
Osterwald-Lenum, M. (1992). “A Note with Quantiles of the Asymptotic Distribution of the Maximum Likelihood Cointegration Rank Test Statistics,” OxfordBulletinofEconomicsandStatistics, 54: 461-472.
Özmen, E. (2003). “Testing the Quantity Theory of Money in Greece,” AppliedEconomicsLetters, 10: 971-974.
Perron, P. (1989). “The Great Crash, the Oil Price Shock, and the Unit Root Hypothesis,” Econometrica, 57: 1361-1401.
------ (1990). “Testing for a Unit Root in a Time Series with Changing Mean,” JournalofBusinessandEconomicStatistics, 8: 153-162.
Ramachandran, M. (2004). “Do Broad Money, Output and Prices Stand for a Stable Relationship in India?” JournalofPolicyModeling, 26: 983,1001.
Sriram, S.S. (1999). “Demand for M2 in an Emerging-Market Economy: An Error-Correction Model for Malaysia,” IMFWorkingPaper, WP/99/173.
Tobin, J. (1956). “The Interest-Elasticiy of Transactions Demand for Cash,” TheReviewofEconomicsandStatistics, 38(3): 241-247.
------ (1958). “Liquidity Preference as Behavior towards Risk,” TheReviewofEconomic Studies, 25(2): 65-86.
Yavuz, N.C. (2004). “Durağanlığın Belirlenmesinde KPSS ve ADF Testleri: İMKB Ulusal-100 Endeksi ile bir Uygulama,” İ.Ü.İktisatFakültesiMecmuası, 54(1): 239-247.
Zivot, E. and Andrews, D.W.K. (1992). “Further Evidence of Great Crash, the Oil Price Shock and the Unit Root Hypothesis,” JournalofBusinessandEconomicStatistics, 10: 251-270

125
ANALYZING THE PERCEPTIONS OF TURKISH UNIVERSITIES USING MULTIDIMENSIONAL SCALING (MDS) ANALYSIS
ULAŞ AKKÜÇÜK* SELİN KÜÇÜKKANCABAŞ**
Boğaziçi University Boğaziçi University
ABSTRACT
With the number of public and private universities in Turkey increasing and with the selection mechanisms offering ever more increased freedom of choice to prospective students, it is becoming important to analyze how students perceive differences among the most preferred Turkish universities. Education marketers may use perceptual maps either to see the current state of the market or to plan for new product launches (in this case, new universities). This paper analyzes the perceptions of the ten most preferred Turkish universities as judged by undergraduate students at universities around Turkey. The Multidimensional Scaling (MDS) technique is used to come up with a perceptual map of the ten most preferred Turkish universities in management education, after obtaining data in the form of similarity judgments, attribute ratings and preference ratings from the respondent students. Additional analyses are performed to attribute meaningful names to perceptual map dimensions, and also to determine the ideal point of the perceptual map. The results indicate that the three private universities plus Galatasaray University form a distinct cluster on their own, while the other six public universities are separated into two distinct groups occupying unique positions in separate quadrants of the perceptual map. It is also found that the ideal point indicates the direction of Boğaziçi University, ODTÜ and İTÜ.
Key Words: Turkish universities, perceptual mapping, Multidimensional Scaling, ALSCAL, PROFIT, PREFMAP.
TÜRK ÜNİVERSİTELERİNİN ALGILAMALARININ ÇOK BOYUTLU ÖLÇEKLENDİRME (MDS) ANALİZİ İLE İNCELENMESİ
ÖZET
Giderek artan kamu ve özel üniversite sayısı ve öğrencilerin seçim yapmasında getirilen esneklikler, öğrencilerin üniversiteler arasındaki farkları nasıl gördüklerinin incelenmesini önemli kılmaktadır. Eğitim pazarlamacıları algısal haritaları kullanarak piyasanın mevcut durumunu anlayabilir ya da yeni ürünlerin (yeni üniversitelerin) nasıl konumlandırılması gerektiğine karar verebilirler.
Boğaziçi Journal Vol. 21, no. 1-2 (2007), pp. 125-141.
* UlaşAkküçükisanAssistantProfessorintheDepartmentofManagementatBoğaziçiUniversity,34342,Bebek,Istanbul,Turkey.E-mail:[email protected]
** SelinKüçükkancabaşisaResearchAssistantintheDepartmentofManagementatBoğaziçiUniversity,34342,Bebek,Istanbul,Turkey.E-mail:[email protected]

126
Bu makalede işletme eğitiminde en çok tercih edilen on Türk üniversitesinin, Türkiye’de çeşitli üniversitelerde okuyan öğrenciler tarafından nasıl algılandığını çok boyutlu ölçeklendirme (MDS) yöntemi ile incelenmiştir. Öğrencilerden, üniversitelerin birbirine yakınlığı ile ilgili veri toplandıktan sonra, çok boyutlu ölçeklendirme tekniği kullanılarak üniversitelerin algısal haritasına ulaşılmıştır. Farklı bazı teknikler kullanılarak ise MDS sonucu ortaya çıkan boyutlara anlamlı isimler verilmiş ve “ideal” üniversite noktası bulunmuştur. Sonuçlar göstermiştir ki üç özel üniversite ve Galatasaray Üniversitesi birbirine yakın bir küme oluştururken, diğer altı kamu üniversitesi üçerli gruplar halinde farklı yerlerde konumlanmıştır. Ayrıca bulunan ideal noktanın Boğaziçi Üniversitesi, ODTÜ ve İTÜ’nün bulunduğu noktalar yönünde olduğu görülmüştür.
Anahtar kelimeler: Türk üniversiteleri, algısal haritalama, çok boyutlu ölçeklendirme, ALSCAL, PROFIT,
PREFMAP.
Facingagrowingcompetitiveenvironment,highereducationinstitutionshavedramaticallyincreasedtheireffortsinrecruitingandretainingstudentsandprovidinghighqualityservice.Universitiesaremobilizingalloftheirresourcesforrecruiting,suchaschangingtheirfinancialaidpoliciestoallowstudentsfromlow-incomefamiliestoenroll,andupdatingtheircampusestobecomemorediverseandattractive,asthesearewhathighschoolseniorsandtheirparentsexpect(Dominoetal.,2006).Theeducationalinstitutionneedstomaintainordevelopadistinctimagetocreateacompetitiveadvantageinanincreasinglycompetitivemarket.
ThestatementbyKeever(1998),“Createanimageforyourcompanyoryourcompetitorswilldoitforyou,”isequallyrelevanttothehighereducationsector.Institutionsarebecomingmoreaggressiveintheirmarketingactivitiesandneedtobeclearabouttheirpositioningandtheimagetheywishtoconveytotheirpublic(RussellandMarilyn,2005).
In order for institutions to understand how customers review their products in relation to otherproductsinthemarket,anumberofmultivariatetechniquesfordatavisualizationcanbeused.Thesevisualizationtechniquesgivedecisionmakersasnapshotofhowthecustomersseeproducts(inthiscase,universities)relativetooneanother.MultidimensionalScaling(MDS)isonesuchvisualizationtechnique among other exploratory techniques used to study the interdependence of a number ofvariablessuchasFactorAnalysis,ClusterAnalysisandCorrespondenceAnalysis(Hairetal.,1998).ObtainingperceptualmapsbyMultidimensionalScalingisacommonlyusedmarketingpracticetoshowhowbrandswithinaproductcategoryaresimilartooneanotherandhowtheydifferfromotherbrands(Parasuramanetal.,2004).
InMDS the objective is to convert consumer judgments of similarity (or dissimilarity) betweenobjectsintodistancesrepresentedinmultidimensionalspace(Hairetal.,1998).Thereareanumberofmethodsforhowdatacanbeobtainedorconvertedtoasimilarity(ordissimilarity)measure.Insomecasesdatamaybeoriginallyintheformofsimilaritiesordissimilarities.Agoodexampleisstore-switchingdata(BucklinandLattin,1992).AnotherwidelycitedexampleisMorseCodeconfusiondata(Rothkopf,1957).
Anothermethodwouldbe toobtainsimilarity judgments in the formofasimilarity rating (inourcasewe use a rating scale between one and seven, one corresponding to least similar and sevencorrespondingtomostsimilar)byaskingrespondentstorateallpossiblepairs.Hence,forthethree
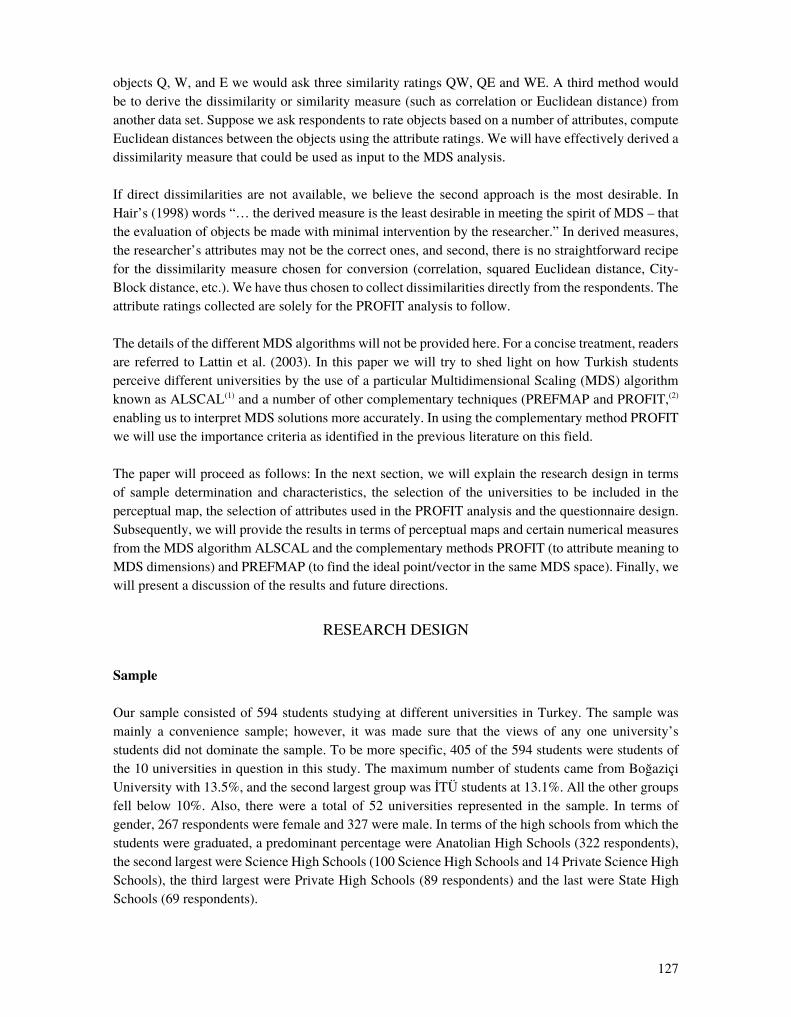
127
objectsQ,W,andEwewouldaskthreesimilarityratingsQW,QEandWE.Athirdmethodwouldbetoderivethedissimilarityorsimilaritymeasure(suchascorrelationorEuclideandistance)fromanotherdataset.Supposeweaskrespondentstorateobjectsbasedonanumberofattributes,computeEuclideandistancesbetweentheobjectsusingtheattributeratings.WewillhaveeffectivelyderivedadissimilaritymeasurethatcouldbeusedasinputtotheMDSanalysis.
Ifdirectdissimilaritiesarenotavailable,webelieve thesecondapproach is themostdesirable. InHair’s(1998)words“…thederivedmeasureistheleastdesirableinmeetingthespiritofMDS–thattheevaluationofobjectsbemadewithminimalinterventionbytheresearcher.”Inderivedmeasures,theresearcher’sattributesmaynotbethecorrectones,andsecond,thereisnostraightforwardrecipefor thedissimilaritymeasurechosenforconversion(correlation,squaredEuclideandistance,City-Blockdistance,etc.).Wehavethuschosentocollectdissimilaritiesdirectlyfromtherespondents.TheattributeratingscollectedaresolelyforthePROFITanalysistofollow.
ThedetailsofthedifferentMDSalgorithmswillnotbeprovidedhere.Foraconcisetreatment,readersarereferredtoLattinetal.(2003).Inthispaperwewill trytoshedlightonhowTurkishstudentsperceivedifferentuniversitiesbytheuseofaparticularMultidimensionalScaling(MDS)algorithmknownasALSCAL(1)andanumberofothercomplementarytechniques(PREFMAPandPROFIT,(2) enablingustointerpretMDSsolutionsmoreaccurately.InusingthecomplementarymethodPROFITwewillusetheimportancecriteriaasidentifiedinthepreviousliteratureonthisfield.
Thepaperwillproceedasfollows:Inthenextsection,wewillexplaintheresearchdesignintermsof sampledetermination and characteristics, the selectionof theuniversities to be included in theperceptualmap,theselectionofattributesusedinthePROFITanalysisandthequestionnairedesign.Subsequently,wewillprovidetheresultsintermsofperceptualmapsandcertainnumericalmeasuresfromtheMDSalgorithmALSCALandthecomplementarymethodsPROFIT(toattributemeaningtoMDSdimensions)andPREFMAP(tofindtheidealpoint/vectorinthesameMDSspace).Finally,wewillpresentadiscussionoftheresultsandfuturedirections.
RESEARCHDESIGN
Sample
Oursampleconsistedof594studentsstudyingatdifferentuniversitiesinTurkey.Thesamplewasmainly a convenience sample; however, it wasmade sure that the views of any one university’sstudentsdidnotdominatethesample.Tobemorespecific,405ofthe594studentswerestudentsofthe10universitiesinquestioninthisstudy.ThemaximumnumberofstudentscamefromBoğaziçiUniversitywith13.5%,andthesecondlargestgroupwasİTÜstudentsat13.1%.Alltheothergroupsfell below10%.Also, therewere a total of52universities represented in the sample. In termsofgender,267respondentswerefemaleand327weremale.Intermsofthehighschoolsfromwhichthestudentsweregraduated,apredominantpercentagewereAnatolianHighSchools(322respondents),thesecondlargestwereScienceHighSchools(100ScienceHighSchoolsand14PrivateScienceHighSchools),thethirdlargestwerePrivateHighSchools(89respondents)andthelastwereStateHighSchools(69respondents).

128
Selection of Objects (Universities) to be Plotted on the Perceptual Map
The total number of universities in Turkey is currently 83, comprising 58 public and 25 privateuniversities(YÖK,2007).Askingpairwise judgmentsfromtheentiresetofpairswouldentail therespondentstoanswer3403questions.Thisisobviouslynotfeasibleandmanystudentswouldnotbefamiliarwithavastmajorityofthe83universities.Inordertoreducethenumberofuniversities,weusedtheresultsofthe2005UniversityEntranceExaminationintermsofthenumberofstudentsuniversitiesreceivedfromthetop500.Generally,themoreprestigiousuniversitiesreceivealargernumberfromthe top500.The tenuniversities,BoğaziçiUniversity,HacettepeUniversity,BilkentUniversity,ODTÜ,SabancıUniversity,KoçUniversity,İstanbulUniversity,GaziUniversity,İstanbulTechnicalUniversityandGalatasarayUniversity,altogetherreceived489studentsoutofthe500intheequallyweightedpoints.Wedecidedthatthissmallgroupofuniversitieswouldhavebeeninthehighlycompetitivesetofschoolsfromwhichcompetitivestudentswouldbemakingtheirselections.
Choice of Attributes to be Used in the PROFIT Analysis
Studentsareveryseriousandcarefulwhenchoosingauniversitytoattend.Whentheymakedecisionsabout attending university, and ultimately what university to attend, they consider factors muchdifferentlythanhowpreviousgenerationsdid,suchaseconomic,academic,geographic,cultural,andevenpoliticalfactors(St.Johnetal.,2005;TeachmanandPaasc,1998;WilsonandWilson,1992;Zuker,2006).Ifuniversitiesaretosatisfystudents’requirements,theymustbeawareoftheirownofferingsandhowtheseareperceivedinthemarketplace.Knowingthoseinfluentialfactorsandtheassociatedimpactonpotentialstudentsisimportantforinstitutionalpolicymakers.
Previousstudieshaveattemptedtodeterminewhatfactorshavethegreatest influenceonstudents’universitychoice.Inaspecificcasestudy,Hanson,NormanandWilliams(1998)reportedthatthethreemostimportantpositivefactorsforstudentsinchoosingtheuniversityinwhichtheywillenrollwereitsnationalacademicreputation,thequalityofeducationalmajorsavailableandtheprestigeoftheuniversity.Other factors thatpositively influencestudents’decisionswerequalityof facilities,varietyofmajors,degreeofacademiccompetition,socialclimateofthecampus,qualityoffaculty,qualityofsociallifeandthedistancetheuniversityisfromhome.
Zuker (2006), theVicePresidentandDeanofStudentServicesat theUniversityofDallas,basedon his personal experience and interactionwith the students and their parents, summarized sevenimportantfactorsthathighschoolstudentsshouldconsiderwhenchoosingauniversity.Thesesevenfactorsare thesizeof theuniversity, the locationof theuniversity, theacademicenvironment, thesocial environment, themajors, the extracurricular activities (e.g., drama,debate, journalism, clubsports,studentgovernment),andthecosts.
MazzarolandSoutar(2002)conductedasurveyamong879studentsatAustralianuniversitiesandfoundthatthemostimportantfactorswerethequalityandreputationoftheuniversityandtherecognitionof the institution’s qualifications in their own country. Jackson (1982) noted that studentswouldremovethealternativesonthebasisofgeographic,economicandacademicfactorswiththeevaluationprocessbeingaffectedbyfamilybackgrounds,socialcontextsandacademicexperiences.Chapman(1981)statedthatuniversitychoicewasinfluencedbystudentcharacteristics(socio-economicstatus,aptitude,levelofeducationalexperiencesandhighschoolcapabilities)aswellasexternalmotivations

129
(influenceofsignificantpersonnel,thefixedfactorsofaninstitutionandtheinstitution’scapabilitiesofcommunicatingwithpotentialstudents).Location,costs,campusenvironment,andtheavailabilityofdesiredprogramswereincludedasrelativelyfixeduniversitycharacteristics.
PreviousworkintheUKconfirmedthatcoursespecifics(content,structure,methodofassessmentofthedegreeprogram)wasthemostpopularlystatedattribute,followedbylocation(distancefromhome,rural/urbanplace,atmosphereofthecampus,facilitiesofthecity/townoftheuniversity)andreputationoftheuniversity(leaguetables,recognizednameordepartment,“old”redbrickuniversities in comparison to “new” universities) (Moogan et al., 1999). For example, somestudentsmightbewillingtochooseauniversitywithanunfavorablelocation(toocloseortoofarfromhome,tooruralortoourban,toobusyortooquiet),inexchangeforamoreappropriatecourse(moreinteresting/relevantmodules,varietyofassessment,inclusionoffieldtrips)whichhadabetterreputation(moreestablisheduniversity) (Mooganetal.,2001).
Gorman(1976)madeadistinctionbetweentheuncontrollablefactorsofhighereducationprovisionsuchaslocationandcontrollablefactorssuchasacademicreputationwherehighstandardscouldbeestablishedandmonitored.Gormanreportedthatlocationandsizewerethecriteriamostfrequentlyused in deciding which university to attend. Reputation for academic quality was of secondaryimportance.
Inthisstudywechosetousefiveattributes,theseare:Theprestigeoftheuniversity1.Qualityofthefacilities2.Qualityofthefaculty3.Qualityofsociallifeandextracurricularactivities4.Thelocationoftheuniversity5.
Questionnaire Design
Thequestionnaireisorganizedinfourparts.Thefirstpart(PartA)askstherespondentstoratethesimilarityofapairofuniversitiesonascale fromone toseven,wheresevencorresponds tomostsimilarandonecorrespondstoleastsimilar.Since10universitiesareselected,thisrepresents45(n(n-1)/2wherenisequaltothenumberofobjects)pairwisesimilarityjudgmentstobecompletedbytherespondents.Thesecondpart(PartB)containsquestionsaboutparticularattributesthathavegenerallybeenusedtoidentifyuniversities,asexplainedintheprevioussection.Inthisparttherespondentsratethe10universitiesonascalefromonetoseven(onebeingverybadandsevenbeingverygood)basedontheaforementionedfiveattributes.Inthethirdpart(PartC)thestudentsareexpectedtoprovidearankorderofthe10universitiesintermsofpreference.Finally,thestudentsansweranumberofdemographicquestions includinggender,and typeofhighschoolgraduated.Thesixcategoriesofdifferent high schools includeAnadoluLisesi (AnatolianHighSchool), FenLisesi (ScienceHighSchool),ÖzelFenLisesi (PrivateScienceHighSchool),ÖzelLise (PrivateHighSchool),DevletLisesi(StateHighSchool),Other(Foreign,VocationalSchool,etc.).Finally,thestudentisaskedtoidentifyatwhichuniversityhe/sheisstudying.Thisparticularvariableisimportantaswedonotwantthesampletobedominatedbymembersofaparticularuniversity.

130
RESULTS
Common Two-Dimensional Space as Seen by the Average University Student
Inordertoseethecommonspaceasseenbytheaveragestudent,the594responsesfromthestudentswereaveragedinordertogetanaveragevalueofperceivedsimilaritybetweentheuniversities.Table1showstheaverageperceivedsimilaritiesbetweentheuniversitiesinthelowerrectangularformat.
Table 1Average Perceived Similarity between Universities
Hct İst Odt Itu Gz Bou Bil Koc Gs
İst 3.68Odt 3.85 3.03Itu 3.45 3.58 4.87Gz 3.95 4.00 3.03 2.83Bou 3.38 3.28 4.83 4.36 2.70Bil 3.63 3.10 4.31 3.82 2.94 4.52Koc 3.39 3.05 3.98 3.77 2.58 4.38 4.85Gs 3.54 3.25 3.79 3.65 2.89 4.47 4.22 4.24Sab 3.23 2.96 3.95 3.75 2.73 4.51 4.93 5.35 4.32
Allofthe45possiblepairsarepresentedhere.ThelowestsimilarityisbetweenKoçandGazi(2.58)and the highest is betweenKoç andSabancı (5.35). In order to get a two-dimensional perceptualmapoftheuniversitiesasseenbythestudents,ALSCAL(YoungandHarris,1990)program(apartofSPSS13.0dataanalysispackage)wasused.SinceALSCALonlyacceptsdissimilaritiesandourdata is originally similarities, the seven-point scalewas reverted such that seven corresponded tomostdissimilarandonecorrespondedtomostsimilar.Afterthisnecessarytransformation,ALSCALwasusedtoobtainatwo-dimensionalsolution.TheresultingmapisgiveninFigure1.Inthismapthefollowingmnemoniccodesareusedinplaceoftheuniversities’fullnames:Bou(Boğaziçi),Bil(Bilkent),Hct (Hacettepe),Odt (ODTÜ),Koc (Koç), Sab (Sabancı), Ist (İstanbulUniversity), Itu(İstanbulTechnicalUniversity),Gz(GaziUniversity),Gs(GalatasarayUniversity).
210-1
Dimension 1
1,5
1,0
0,5
0,0
-0,5
-1,0
-1,5
Dim
ensi
on 2
sab
gs
kocbil
bou
gz
ituodt
ist
hct
Figure 1Two-dimensional Perceptual Map of Average Similarities

131
Itisevidentheretheprivateuniversitiesformadistinctgroupatthetopleftcornerofthemap,whilethesixpublicuniversitiesarescatteredacrossdifferentareasofthemap.AlthoughGalatasarayisapublicuniversity, it is locatednear the threeprivateuniversities.Thepublicuniversities formtwogroups:OnegroupinthelowerleftquadrantconsistingofİTÜ,ODTÜandBoğaziçiandtheothergroup located toward therightof thegraphconsistingofGazi,Hacettepeandİstanbul.Hacettepe,whichisactuallyfoundtobeverydissimilarfromallotheruniversities,occupiesadistinctlocationin the lower right quadrant. The closest universities areGazi and İstanbul; howeverHacettepe issomewhatmoredistantthanthegroupcontainingtheGazi-İstanbulpair.
Thenextsectionoutlinesamoreformalapproachinnamingthedimensions,butevenwithoutanymathematical analysis, an examinationof the twodimensionsmay reveal some insights.The firstdimensionmaybeaprivate-publicdimension(fromleft to righton thisdimension:Sabancı,Koç,Bilkent,Boğaziçi,Galatasaray,ODTÜ,İTÜ,Hacettepe, İstanbul,Gazi). Boğaziçi isplacedclosertoprivateuniversitieson thisdimension,perhapsowing to itspast as anAmericanprivatehighereducationinstitution(RobertCollege)inthenearpast.Theseconddimension(fromuptodowninthisdimension:Galatasaray,İstanbul,Sabancı,Koç,Gazi,Bilkent,Hacettepe,Boğaziçi,ODTÜ,İTÜ)maysomewhatreflectthesocialsciencesversusengineeringorientations.Itmayalsorepresentuniversitysize (in termsofnumberofprogramsofferedandnumberof students)and/orhowestablished theuniversityis(withtheupperpositionspertainingtoneweruniversities).Someexceptionsclearlystandouthere,forexample,İstanbulUniversityiswellestablishedandlargebutisontheupperpositions.
Manyinterpretationscanbemaderegardingtheperceptualmapandtheseinterpretationsareonlytheinitialthoughtsoftheauthors.Itisalsoworthwhiletopointoutanyreflection,rotationortranslationofthepointswouldnotchangetheEuclideandistances,andhencewouldgiveessentiallythesamesolution. Interpretationaftersucharotationmaybemoremeaningful.ThePROFITmethod, tobedescribed shortly, does not suffer from this problem as the attributes are plotted as vectors. Therotationwouldnotalterthelocationsoftheuniversitieswithrespecttothevectors.Anothernoteisthatthedimensionalityusedhereistwo,differentdimensionalitiescanalsobeused,andplotscanbegeneratedcomparingpairsofdimensions.threepossibleplotsinthecaseofthreedimensionsandsixpossibleplotsinthecaseoffourdimensions.Thesesolutionsmayalsoleadtodifferentinterpretationsofthedimensions.Thetwo-dimensionalsolutionwillbepresentedhereandlaterthethree-dimensionalsolutionwillalsobepresented.
Thefitofthesolutionisgenerallygood,althoughitcannotbeclassifiedasaperfectorexcellentfit.Thereareanumberofwaysofdetermininghowwellthetwo-dimensionalsolutionsuitstheaveragesimilaritiescalculatedfromthe594subjects(Table1).Thescatterplotofdistancescalculatedfromthe solution given inFigure 1 against the dissimilarities used as input to theALSCALprocedure(generallycalled“disparities,”thesewouldbethevaluesgiveninTable1,exceptthescaleisreversed).ThesmoothnessofthegraphgiveninFigure2indicatesgoodfit.Thissmoothnessisalsocapturedby the square of the correlation between the disparities and the distances. This value, termedR2,indicateshowmuchofthevariationinthedisparitiesisexplainedbythedistancescalculatedfromtheconfigurationfoundbytheMDSprocedure.TheR2valuehereis73.94%,whichisreasonablyhigh.

132
Therearetwoothermeasures,oftencalled“badnessoffit”functions(KruskalandCarroll,1969),aslowervaluesindicatebetterfit,namelyKruskal’sSTRESSformula1(Kruskal,1964a,1964b),andYoung’sSSTRESS(themeasurethatALSCALprogramtriestominimize).Forbothmeasures“0”representsperfectfit.SSTRESSinthisstudyturnsouttobe0.34whileSTRESS1turnsouttobe0.31.STRESS1valueisclassifiedas“poor”fitaccordingtoKruskal’sruleofthumb(Lattinetal.,2003).Thesevaluesimproveasmoredimensionsareused.Tobemorespecific,thethree-dimensionalsolutionhasSTRESS1of0.18595andthefour-dimensionalsolutionhasaSTRESS1of0.14222.TheR2valuesalsoriseto82.31%and84.92%,respectively.InthissectionandthesubsequenttwosectionsusingPROFITandPREFMAPweprefertousethetwo-dimensionalsolution;however,laterwewillalsopresentthethree-dimensionalsolution.
Attributing Meaning to Dimensions Using the PROFIT Approach
Althoughitispossibletoattributemeaningfulnamestothecoordinateaxesbasedonpureinspectionandjudgment,itisalsopossibletouseanswerstoPartBofthequestionnaireandexaminethecorrelationsbetweencoordinatevaluesandratingsoftheuniversitiesonthefiveattributes.Table2providestheaverageratingsofthe10universitiesonthefiveattributes.Table3providesthecorrelationsoftheattributeratingswiththestimuluscoordinates(MDSgeneratedcoordinates).FromTable3wecanseethatalltheattributesarenegativelycorrelatedwithbothofthedimensions.Hence,negativevaluesonbothdimensionsmeanhigherattributeratings.
ThecomputerprogramPROFIT–shortforpropertyfitting–(ChangandCarroll,1989b)ishelpfulin determiningdimensions that are highly correlatedwith the attribute ratings. It employs amoresophisticatedtechniquethantheoneexplainedabove.PROFITtakesthecoordinatevaluesfromtheALSCALoutputand theaverageattribute ratingson thefiveattributesas input.Theoutput is the“directionalcosines”oftheattributes.ThesearepresentedinTable4.Ascanbeseen,thevaluesareveryclosetothecorrelationsreportedinTable3,buttherearesomedifferences.Thehighestvaluesforthefirstdimensionarequalityoffacilitiesandqualityofsociallife.Asfortheseconddimension,
Figure 2 Distances vs. Disparities
2,52,01,5
Disparities
3,0
2,5
2,0
1,5
1,0
0,5
0,0
Dis
tanc
es
Figure 3
Direction Vectors of Attributes and Universities (PROFIT)
-1,10 -0,10 0,90 1,90
dimension1
-1,50
-0,60
0,30
1,20
dim
ensi
on2
hct
ist
odtitu
gz
bou
bilkoc
gs
sab
prestigefacilitifaculty
social
location
Figure 2Distances vs. Disparities

133
thehighestvaluesareprestigeandlocation(asthesearenegative,thelowervaluesonthesecoordinateaxiscorrespondtohigherratingsontheattributes).Figure3providesaplotoftheoriginalstimuluscoordinatesandthedirectionalvectors.Thedirectionsofthefivevectors(qualityofsociallife,qualityofthefaculty,prestige,location,andqualityoffacilities)aretowardsthethirdquadrant(thequadrantinwhichBoğaziçi,ODTÜandİTÜarelocated).
Table 2Average Attribute Ratings of the Universities
prestige facilities faculty social location
Hct 4.54 4.38 4.50 3.96 3.82İst 4.10 3.79 4.02 3.82 4.39
Odt 6.13 5.67 5.76 5.44 4.77Itu 5.33 5.09 5.22 4.62 5.12Gz 3.26 3.32 3.42 3.29 3.61
Bou 6.38 5.91 6.04 6.25 6.36Bil 5.64 5.58 5.50 5.47 4.72
Koc 5.22 5.41 5.29 5.28 4.05Gs 5.48 5.12 5.24 5.15 6.03Sab 5.37 5.54 5.40 5.14 3.30
Table 3Correlations between Average Attribute Ratings and Dimensions
d1 d2
prestige -0.84 -0.41facilities -0.93 -0.30faculty -0.90 -0.37social -0.90 -0.21location -0.35 -0.27
Table 4PROFIT Output: Directional Cosines of Fitted Vectors
d1 d2
prestige -0.86 -0.51facilities -0.93 -0.35faculty -0.90 -0.44social -0.96 -0.27
location -0.72 -0.69
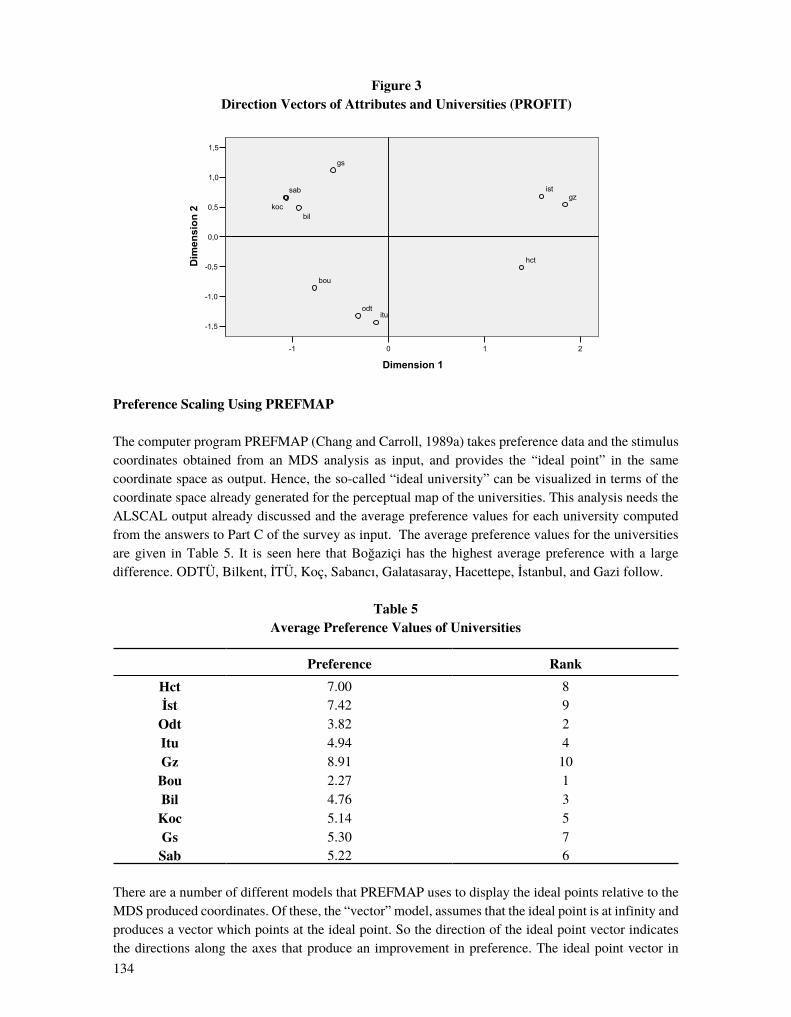
134
Preference Scaling Using PREFMAP
ThecomputerprogramPREFMAP(ChangandCarroll,1989a)takespreferencedataandthestimuluscoordinates obtained from anMDS analysis as input, and provides the “ideal point” in the samecoordinatespaceasoutput.Hence,theso-called“idealuniversity”canbevisualizedintermsofthecoordinatespacealreadygeneratedfortheperceptualmapoftheuniversities.ThisanalysisneedstheALSCALoutputalreadydiscussedandtheaveragepreferencevaluesforeachuniversitycomputedfromtheanswerstoPartCofthesurveyasinput.Theaveragepreferencevaluesfortheuniversitiesaregiven inTable5. It is seenhere thatBoğaziçihas thehighestaveragepreferencewitha largedifference.ODTÜ,Bilkent,İTÜ,Koç,Sabancı,Galatasaray,Hacettepe,İstanbul,andGazifollow.
Table 5Average Preference Values of Universities
Preference Rank
Hct 7.00 8İst 7.42 9
Odt 3.82 2Itu 4.94 4Gz 8.91 10Bou 2.27 1Bil 4.76 3Koc 5.14 5Gs 5.30 7Sab 5.22 6
ThereareanumberofdifferentmodelsthatPREFMAPusestodisplaytheidealpointsrelativetotheMDSproducedcoordinates.Ofthese,the“vector”model,assumesthattheidealpointisatinfinityandproducesavectorwhichpointsattheidealpoint.Sothedirectionoftheidealpointvectorindicatesthedirectionsalongtheaxesthatproduceanimprovementinpreference.Theidealpointvectorin
210-1
Dimension 1
1,5
1,0
0,5
0,0
-0,5
-1,0
-1,5
Dim
ensi
on 2
sab
gs
kocbil
bou
gz
ituodt
ist
hct
Figure 3Direction Vectors of Attributes and Universities (PROFIT)

135
ourcaseisfoundtobe(-0.2690,-0.9631).Theplotofthevectorandtheoriginalobjectcoordinatesare provided in Figure 4.Hence, negative direction in the first axis results in a better evaluationofpreferenceandsimilarlynegativedirection in thesecondaxisalsoresults inabetterpreferencerating.Movementinthesecondaxisresultsinagreaterchangeinthepreferencethananequivalentmovementinthefirstaxis.
Higher Dimensional Solutions and Dimensionality Selection
Asindicatedearlier,whiletwo-dimensionalsolutionsaregenerallypreferableandeasytoobtainasanoutputofcomputersoftware,higherdimensionalsolutionscansometimesleadtobetterresults.This is easily portrayed in the plot of the SSTRESSvalues against dimensionality andR2 againstdimensionalitygiveninFigures5and6,respectively.
Figure 4 Universities and Ideal Point Vector (PREFMAP)
-1,10 -0,10 0,90 1,90
dimension1
-1,50
-0,60
0,30
1,20
dim
ensi
on2
hct
ist
odtitu
gz
bou
bilkoc
gs
sab
ideal
Figure 5 SSTRESS against Dimensionality (1 to 4)
SSTRESS
0
0,1
0,2
0,3
0,4
0,5
0,6
1 2 3 4
Figure 4Universities and Ideal Point Vector (PREFMAP)
Figure 4 Universities and Ideal Point Vector (PREFMAP)
-1,10 -0,10 0,90 1,90
dimension1
-1,50
-0,60
0,30
1,20
dim
ensi
on2
hct
ist
odtitu
gz
bou
bilkoc
gs
sab
ideal
Figure 5 SSTRESS against Dimensionality (1 to 4)
SSTRESS
0
0,1
0,2
0,3
0,4
0,5
0,6
1 2 3 4
Figure 5SSTRESS against Dimensionality (1 to 4)

136
Asseenintheseplotsamajorincrease(ordecrease)isfollowedbysmallerincreases(ordecreases)inthemeasuresoffit.Amajorchangehappenswhenweincreasedimensionalityfromonetotwo,butrelativelysmallerchangeshappenaswemovefromtwotothreeandthreetofourdimensions.ThisisgenerallythecaseinMDSsolutionsasdimensionalityisincreased.Thechoicemustbemadesuchthattheincreasedcomplexityinthesolutionisjustifiedbytheadditionalgaininfit.Inourcasethethree-dimensionalsolutionmayalsobeworthvisualizing.SPSSdoesgiveathree-dimensionalplot,whichisprovidedinFigure7.However,theseparatetwo-dimensionalplotsaremoreuseful.Weneedthreeplotsheretoaccountforallpairsofdimensions.Figures8to10depictthepairwiseplotsforthethree-dimensionalsolution.Uponinspectionofthefirstplot(Figure8–Dimension1andDimension
Figure 6 R2 against Dimensionality (1 to 4)
RSQ
00,10,20,30,40,50,60,70,80,9
1 2 3 4
Figure 7 SPSS Generated 3-Dimensional Plot
Dimension 31,5
1,0
0,5
0,0
-0,5
-1,0
Dimension 1210
hct
gzDim
ensi
on 2
2,0
1,5
1,0
0,5
0,0
-0,5
odt
bil
itu
ist
koc
sab
bou
gs
-1,5
-1,0
-1
Figure 6R2 against Dimensionality (1 to 4)
Figure 6 R2 against Dimensionality (1 to 4)
RSQ
00,10,20,30,40,50,60,70,80,9
1 2 3 4
Figure 7 SPSS Generated 3-Dimensional Plot
Dimension 31,5
1,0
0,5
0,0
-0,5
-1,0
Dimension 1210
hct
gzDim
ensi
on 2
2,0
1,5
1,0
0,5
0,0
-0,5
odt
bil
itu
ist
koc
sab
bou
gs
-1,5
-1,0
-1
Figure 7SPSS Generated 3-Dimensional Plot

137
2), it is readilyevident that this isverysimilar to the two-dimensionalsolutiongiven inFigure1.However,thereseemstobeareflectiononthey-axis.Therelativepositionsoftheuniversitiesremainunchangedandthegroupingsarealsosimilar.Theoriginalinterpretationsoftheaxesstillholdherewiththefirstdimensionrepresentingthepublic-privateandthesecondrepresentingperhapsthesocialscience–engineeringorientations.Thethirddimensionwheninspectedcloselyseemstobeoneoflocation.ThisadditionaldimensionseemstoseparateAnkaraandİstanbul.
Figure 8 3-Dimensional Plot D1 against D2
-1,00 0,00 1,00 2,00
D1
-1,00
0,00
1,00
D2
hct
ist
odt
itu
gz
bou
bil
kocgs
sab
Figure 9 3-Dimensional Plot D1 against D3
-1,00 0,00 1,00 2,00
D1
-1,00
-0,50
0,00
0,50
1,00
D3
hct
ist
odt
itu
gz
bou
bil
koc
gs
sab
Figure 83-Dimensional Plot D1 against D2
Figure 8 3-Dimensional Plot D1 against D2
-1,00 0,00 1,00 2,00
D1
-1,00
0,00
1,00
D2
hct
ist
odt
itu
gz
bou
bil
kocgs
sab
Figure 9 3-Dimensional Plot D1 against D3
-1,00 0,00 1,00 2,00
D1
-1,00
-0,50
0,00
0,50
1,00
D3
hct
ist
odt
itu
gz
bou
bil
koc
gs
sab
Figure 93-Dimensional Plot D1 against D3

138
CONCLUSIONSANDDIRECTIONSFORFUTURERESEARCH
AstheÖSSselectionsystemnowinvolvesmakingaselectionafterone’sscorehasbeendetermined,andasthenumberofpublicandprivateuniversitiesisincreasing,itseemsevidentthatuniversitieswillneedtousemoresophisticatedmarketingtoolsthanever.MDSisatoolthatwillallowhighereducationinstitutionstoseehowthegeneralpublicseestheiruniversitieswithrespecttootherschoolsofferingsimilarprogramsofstudy.
Our study (although it has its limitations) shows a number of important properties of BoğaziçiUniversity.Firstofall,theperceptualmapoftheaverageperceptions(Figure1)showsthatBoğaziçi,togetherwithODTÜandİTÜ,occupiesauniquesegment.Uponcloseexaminationwecanalsoseethat Boğaziçi is somewhere in between prestigious public (İTÜ, ODTÜ) and private universities(Sabancı,Koç,Bilkent).Onemayevenstatethatitisa“public”universitythatisofferingmanyoftheadvantagesofa“private”university.Ifwedividetheperceptualmapintofourquadrants,thelowerleftquadrantisoccupiedbyBoğaziçiUniversity,ODTÜandİTÜ.Thisisalsothequadranttowhichalloftheattributevectorspoint.ItisworthwhiletonoteBoğaziçiUniversityhasgottenthehighestscorefromtherespondentsintermsofallfiveattributes.AlsotheidealpointisdirectedatthelocationofBoğaziçiUniversity,ODTÜandİTÜ.
Onemaysaythatsincetheactualuniversityselectiondecisionismadeat thehighschool level, itmaybemore important to study thehigh schoolgraduating class’ opinions inorder toobtain themostaccurateperceptualmap.Afuturestudycanincludehighschoolseniors’perceptions.Anotherrestrictionofthestudyisthelimitednumberofuniversities.Asimilarstudycanbeextendedtoincludemoreuniversities,maybetheentiresetof83universities.However,thelengthofthetimerequiredtofillthesurveysmaybeprohibitivelylarge.Soperhapsasimilarity/dissimilaritymeasurederivedfromattributescanbeused.Todeterminetheattributes,apretestcanbeconducted.
Figure 10 3-Dimensional Plot D2 against D3
-1,00 0,00 1,00
D2
-1,00
-0,50
0,00
0,50
1,00
D3
hct
ist
odt
itu
gz
bou
bil
koc
gs
sab
Figure 103-Dimensional Plot D2 against D3

139
Another improvement to the study can be obtained by the use of Individual Differences Scaling(INDSCAL) (Carroll andChang,1970).Thismethod takes inall theproximitymatricesprovidedbytheindividualsandalsofindsouthowindividualsdifferfromoneanotherintermsofhowtheyperceivethedimensions.Thiscanbecomparedtosomeindividualcharacteristicstogainmarketinginsightsintothevariousgroupsofstudents’perceptions.
NOTES
ALSCALcanbefoundintheSPSScomputerpackageunderAnalyze>Scale>Multidimensional1.Scaling(ALSCAL)
These programs areMSDOS executables andwere run underMicrosoftXP operating system.2.Ifprospectiveusersareinterested,PREFMAPcanbefoundpackagedwiththetextLattinetal.(2003).ForPROFITrefertoSmith(1989).
REFERENCES
Bucklin,R.E.andLattin.J.M.(1992).“AModelofProductCategoryCompetitionamongGroceryRetailers,”Journal of Retailing,68:271-293.
Carroll,J.D.andChang,J.J.(1970).“AnalysisofIndividualDifferencesinMultidimensionalScalingViaanN-WayGeneralizationof‘Eckart-Young’Decomposition,”Psychometrika,35:283–319.
Chang,J.J.andCarroll,J.D.(1989a).“HowtoUsePREFMAP–AProgramthatRelatesPreferenceDatatoMultidimensionalScalingSolutions,”inP.E.Green,F.J.Carmone,andS.M.Smith(eds.),Multidimensional Scaling: Concepts and Applications:303–317.Newton,MA:AllynandBacon.
------ (1989b). “How toUsePROFIT–AComputerProgramforPropertyFittingbyOptimizingNonlinearorLinearCorrelation,”inP.E.Green,F.J.Carmone,andS.M.Smith(eds.),Multidimensional Scaling: Concepts and Applications:318–331.Newton,MA:AllynandBacon.
Chapman, D.W. (1981). “AModel of Student University Choice,” Journal of Higher Education,52(5):490-505.
Domino,S.,Libraire,T.,Lutwiller,D.,Supercynzski,S., andTian,R. (2006). “HigherEducationMarketingConcerns:FactorsInfluenceStudents’ChoiceofUniversities,”6(2):101-111.
Gorman,W.P. (1976). “AnEvaluation ofStudentAttractingMethods andUniversityFeatures byAttendingStudents,”University and University,(Winter),51:220-5.
Hair,J.F.,Anderson,R.E.,Tatham,R.L.,andBlack,W.C.(1998).Multivariate Data Analysis.PrenticeHall.
Hanson,G.R.,Norman,T.,andWilliam,A.(1998).“TheDecisiontoAttendUT-Austin:WhatMakesa Difference?” Available at: http://www.utexas.edit/student/ research/reports/ccweb/CCweb.html[accessedinJune2007].

140
Jackson, G.A. (1982). “Public Efficiency and Private Choice in Higher Education,”Educational Evaluation and Policy Analysis,4(2):237-47.
Keever,S.(1998),“BuildingYourImageonCampus,”Journal of Career Planning and Employment,58(2):42-46.
Kruskal, J.B. (1964a). “Multidimensional Scaling forOptimizing aGoodness of FitMetric to aNonmetricHypothesis,”Psychometrika,29:1-27.
------(1964b).“NonmetricMultidimensionalScaling:ANumericalMethod,”Psychometrika,29:115-129.
Kruskal,J.B.,andCarroll,J.D.(1969).“GeometricalModelsandBadness-of-FitFunctions,”inP.R.Krishnaiah(ed.),Multivariate Analysis,2:639–671.NewYork:AcademicPress.
Lattin, J.M., Carroll, J.D., and Green, P.E. (2003). Analyzing Multivariate Data. Pacific Grove:Brooks/Cole.
Mazzarol, T. and Soutar, G.N. (2002), “‘Push-Pull’ Factors Influencing International StudentDestinationChoice,”The International Journal of Educational Management,16(2):82-90.
Moogan,Y.J.,Baron,S.,andBainbridge,S.(2001),“TimingsandTrade-Offs in theMarketingofHigherEducationCourses:AConjointApproach,”Marketing Intelligence and Planning,19(3):179. Parasuraman, A., Grewal, D., and Krishnan, R. (2004). Marketing Research. Boston: HoughtonMiflin.
Punj.G.N.andStaelin,R.(1978).“TheChoiceProcessforGraduateBusinessSchools,”Journal of Marketing Research,15(4):588.
Rothkopf, E.Z. (1957). “AMeasure of Stimulus Similarity and Errors in Some Paired-AssociateLearningTasks,”Journal of Experimental Psychology,53:94-101.
Russell, M. (2005). “Marketing Education: A Review of Service Quality Perceptions amongInternationalStudents,”International Journal of Contemporary Hospitality Management,17(1):65.
Smith,S.M.(1989).PC-MDS: A Multidimensional Statistics Package.Provo,Utah:BrighamYoungUniversity.
St.John,E.P.,Paulsen,M.B.,andCarter,D.F.(2005).“Diversity,UniversityCosts,andPostsecondaryOpportunity:AnExaminationoftheFinancialNexusbetweenUniversityChoiceandPersistenceforAfricanAmericansandWhites,”The Journal of Higher Education,76(5):545-569.
Teachman, J.D. and Paasch, K. (1998). “The Family and Educational Aspirations,” Journal of Marriage and the Family,(August),60:704-714.

141
Young, F.W. and Harris, D.F. (1990). “Multidimensional Scaling: Procedure ALSCAL,” in J.J.Norusis (ed.),SPSS Base System User’s Guide:396-461.Chicago, IL:SPSSInc.Reprinted inJ.J.Norusis(ed.),SPSS Professional Statistics,(1994):155-222.Chicago,IL:SPSSInc.
YÖK(2007).http://www.yok.gov.tr/universiteler/uni_web.htm[accessedinMay2007].
Zuker, R.F. (2006) “Factors to Consider in Selecting a University.” Available at: http://www.thehighschoolgraduate.com/editorial/DF/factors[accessedinApril2006].
Wilson, P.M. and Wilson, J.R. (1992). “Environmental Influences on Adolescent EducationalAspirations:ALogisticTransformModel,”Youth and Society,24:52-70.


NOTES FOR CONTRIBUTORS
Bo¤aziçi Journal, Review of Social Economic and Administrative Studies, publishes articles inEnglish. Submissions should be sent to one of the editors at the following address: Bo¤aziçi Journal,Review of Social Economic and Administrative Studies, Bo¤aziçi University, School of Economicsand Administrative Studies, Bebek 80815, Istanbul, Turkey. Papers submitted to the Journal shouldnot exceed 12,000 words and should be accompanied by a 300-400 word summary. Authors are tosubmit three copies of the manuscript and retain one copy for their own files. The entire manuscriptshould be typed double-spaced with wide margins. It is requested that the final version of the manu-script be submitted on a diskette utilizing Microsoft Word. The authors should also submit a briefautobiographical note.
Title Page
To facilitate an anonymous review, a separate title page should be prepared carrying the article’s title,author’s full name, current position, affiliation, mailing address and telephone and fax number(s). Thefirst page of the manuscript should carry only the title and no mention should be made of the author’sname. Any acknowledgments should also be included on the first page with an asterisk.
Headings
The headings in the text should not be numbered or preceded by letters. Main headings should betyped in capitals and centered on the page; secondary headings should start flush at the left marginand be typed in small letters with major words capitalized. Lower level leads should be in the formof paragraph headings with only the inital word capitalized followed by a period and then the text onthe same line. Lower level headings should be underlined. Dividing manuscripts into more than threelevels of subheadings should be avoided.
Notes, Appendices, Tables and Figures
Notes should not be used to cite references (see References below). Any notes to supplement discus-sion in the text should be numbered consecutively and placed at the end of the paper under the head-ing “Notes.” Likewise, appendices, tables and figures should be numbered and placed at the end fol-lowing “Notes” and “References.” The positioning of the tables and figures in the paper should beindicated in the text as follows:
143

References
Reference to a publication should be made in the text by citing the name of the author and the yearof publication, observing the following convention:
1. When the name of the author is used in the text, only indicate the date in parentheses, e.g., “Crozier (1964)...”.
2. When the name of the author does not appear in the text, include in parentheses both the name of the author and the year of publication separated with a comma. If more than one publication is cited, the authors’ names should appear in alphabetical order and be separated by semicolons, e.g., “... (Mintzberg, 1983; Preffer and Salanc›k, 1978)...”.
3. When a publication has more than two authors, cite only the name of the first author, followed by “et al.,” e.g., “...(Christensen et al., 1985)...”.
4. In all cases, if page numbers are to be given, indicate them following the year of publication separated by a colon, e.g., “ ...Thompson (1967:34)...”.
A full alphabetical list of references in the text should be provided under the heading “References”on a separate page at the end of the paper following “Notes.”
The following examples show the conventions to be observed:
Books
Thompson, J.D. (1967). Organizations in Action. New York: Mc Graw-Hill.
Articles
Preffer, J. and Nowak, P. (1976). “Joint Ventures and Inter-organizational Inter-dependence,”Administrative Science Quarterly, 21:398-418.
Chapters in Books
Aldrich, H. and Mandlin, S. (1978). “Uncertainty and Dependence: Two Perspectives onEnvironment,” in L. Karpik (ed.), Organization and Environment: 149-170. London: Sage.
Presentations
Gioia, D.A., Brass, D.J. and Sims, H.P., Jr. (1981). “The creative use of short-cycle video-tape tech-nology: From single student to large lecture learning.” Paper presented at the 8th AnnualOrganizational Behavior Teaching Conference, Boston, Massachusetts, (month).
In the list of references please give all information in the language of the reference.
144


![Fourth Edition MECHANICS OF MATERIALS - …yunus.hacettepe.edu.tr/~boray/1_introduction [Compatibility Mode].pdf · Fourth MECHANICS OF MATERIALS Edition Beer • Johnston • DeWolf](https://static.fdocuments.us/doc/165x107/5b8a30947f8b9ac1328b9eba/fourth-edition-mechanics-of-materials-yunus-boray1introduction-compatibility.jpg)