Board Composition, Corporate Performance, and the Cadbury ... · Board Composition, Corporate...
31
University of Washington School of Business Administration and Cambridge University Press are collaborating with JSTOR to digitize, preserve and extend access to The Journal of Financial and Quantitative Analysis. http://www.jstor.org Board Composition, Corporate Performance, and the Cadbury Committee Recommendation Author(s): Jay Dahya and John J. McConnell Source: The Journal of Financial and Quantitative Analysis, Vol. 42, No. 3 (Sep., 2007), pp. 535- 564 Published by: on behalf of the Cambridge University Press University of Washington School of Business Administration Stable URL: http://www.jstor.org/stable/27647311 Accessed: 10-02-2016 19:50 UTC Your use of the JSTOR archive indicates your acceptance of the Terms & Conditions of Use, available at http://www.jstor.org/page/ info/about/policies/terms.jsp JSTOR is a not-for-profit service that helps scholars, researchers, and students discover, use, and build upon a wide range of content in a trusted digital archive. We use information technology and tools to increase productivity and facilitate new forms of scholarship. For more information about JSTOR, please contact [email protected]. This content downloaded from 128.210.126.199 on Wed, 10 Feb 2016 19:50:17 UTC All use subject to JSTOR Terms and Conditions
-
Upload
truongquynh -
Category
Documents
-
view
227 -
download
0
Transcript of Board Composition, Corporate Performance, and the Cadbury ... · Board Composition, Corporate...

University of Washington School of Business Administration and Cambridge University Press are collaborating with JSTOR to digitize, preserve and extend access to The Journal of Financial and Quantitative Analysis.
http://www.jstor.org
Board Composition, Corporate Performance, and the Cadbury Committee Recommendation Author(s): Jay Dahya and John J. McConnell Source: The Journal of Financial and Quantitative Analysis, Vol. 42, No. 3 (Sep., 2007), pp. 535-
564Published by: on behalf of the Cambridge University Press University of Washington School of
Business AdministrationStable URL: http://www.jstor.org/stable/27647311Accessed: 10-02-2016 19:50 UTC
Your use of the JSTOR archive indicates your acceptance of the Terms & Conditions of Use, available at http://www.jstor.org/page/ info/about/policies/terms.jsp
JSTOR is a not-for-profit service that helps scholars, researchers, and students discover, use, and build upon a wide range of content in a trusted digital archive. We use information technology and tools to increase productivity and facilitate new forms of scholarship. For more information about JSTOR, please contact [email protected].
This content downloaded from 128.210.126.199 on Wed, 10 Feb 2016 19:50:17 UTCAll use subject to JSTOR Terms and Conditions

JOURNAL OF FINANCIAL AND QUANTITATIVE ANALYSIS Vol. 42, No. 3, Sept. 2007, pp. 535-564 COPYRIGHT 2007, SCHOOL OF BUSINESS ADMINISTRATION, UNIVERSITY OF WASHINGTON, SEATTLE, WA 98195
Board Composition, Corporate Performance, and the Cadbury Committee Recommendation
Jay Dahya and John J. McConnell*
Abstract
During the 1990s and beyond, countries around the world witnessed calls and/or mandates for more outside directors on publicly traded companies' boards even though extant studies find no significant correlation between outside directors and corporate performance. We examine the connection between changes in board composition and corporate performance in the U.K. over the interval 1989-1996, a period that surrounds publication of the Cadbury
Report, which calls for at least three outside directors for publicly traded corporations. We
find that companies that add directors to conform with this standard exhibit a significant
improvement in operating performance both in absolute terms and relative to various peer
group benchmarks. We also find a statistically significant increase in stock prices around announcements that outside directors were added in conformance with this recommenda
tion. We do not endorse mandated board structures, but the evidence appears to be that
such a mandate is associated with an improvement in performance in U.K. companies.
I. Introduction
During the 1990s and beyond, the global economy appears to have become
caught up in what might be described as "outside director euphoria"?at least 26
countries witnessed publication of guidelines that stipulate minimum levels for the representation of outside directors on boards of publicly traded companies. At
the time of their publication, in most countries these minimum standards repre
sented a dramatic increase in outside director representation. A presumption that
underlies this movement toward more outside directors is that boards with more
outside directors will lead to better board decisions and, as a consequence, better
* Dahya, [email protected], Baruch College, CUNY, Department of Economics and Fi
nance, 1 Bernard Baruch Way, New York, NY 10010, and McConnell, [email protected], Krannert School of Management, Purdue University, 403 West State Street, West Lafayette, IN 47907. This paper has benefited from the helpful comments and suggestions of Bernard Black, David Denis,
Raghu Rau, Kishore Tandon, Linda Allen, Bill Nixon, Kose John, Colin Mayer, Tim Jenkinson, Erik
Lie, Darius Palia, David Reeb, Jeffrey Coles (associate editor and referee), and seminar participants at Baruch College, Boston College, University of Notre Dame, Oxford University, Cranfield University, and the 2005 European Finance Association meetings. We thank Companies House in Cardiff and the FTSE Group for allowing access to data used in the study and David Damant at UKSA for helpful discussions about proxy proposals. Dahya acknowledges financial support from the Baruch College Fund and the Eugene M. Lang Junior Faculty Fellowship. Financial support from INQUIRE-UK is
also gratefully acknowledged. 535
This content downloaded from 128.210.126.199 on Wed, 10 Feb 2016 19:50:17 UTCAll use subject to JSTOR Terms and Conditions
536 Journal of Financial and Quantitative Analysis
corporate performance. In large measure, this presumption rests on faith rather
than evidence. As Bhagat and Black (1999) and Hermalin and Weisbach (2003) observe, various studies of the relation between board composition and corpo
rate performance appear to show that board composition affects the way in which
boards accomplish certain discrete tasks, such as hiring and firing the Chief Exec utive Officer (CEO), responding to hostile takeovers, setting CEO compensation, and so forth,1 but other studies generally report little or no correlation between
board composition and corporate profitability.2 An exception to this general find
ing is a contemporaneous study by Coles, Daniel, and Naveen (CDN) (2007) who
report that performance is negatively correlated with the fraction of inside direc
tors in firms that report high R&D expenditures and positively correlated with the number of outside directors in large firms and in firms with high leverage.
Three related explanations are offered as to why prior studies might fail to
find a relation between board composition and corporate performance even if one
exists. First, board composition is endogenous. Thus, if board composition does
affect corporate performance, but every board is at its optimal construction, no
relation between board composition and corporate performance will be observed
in a cross section (Demsetz and Lehn (1985), Lehn, Patro, and Zhao (2007)). Second, firms tend to add outside directors during periods of poor performance. Thus, outside directors may become more prevalent in poorly performing firms.
If so, then even if outside directors do lead to improved performance in a cross
section, the relation will be obscured (Hermalin and Weisbach (2003)). Third, prior studies focus primarily on U.S. companies and most U.S. companies have
boards that are and have been dominated by outside directors for many years.
Thus, it is difficult to find boards with few outside directors to serve as a control
group and because boards rarely undergo radical and swift alterations, the effect
of changes in board composition on corporate performance is difficult to discern.
In this study, we investigate further the relation between outside directors
and corporate performance in a setting outside the U.S. In particular, we study the U.K. over the years surrounding the issuance of the Report of the Committee
on the Financial Aspects of Corporate Governance, commonly known as the Cad
bury Report, published in December 1992. This Report established a minimum number of three outside directors for publicly traded U.K. firms. As documented
by Dahya, McConnell, and Travlos (DMT) (2002), the years following publica tion of the Report witnessed widespread increases in the number and fraction of
outside directors on U.K. boards.
By using U.K. firms in our analysis, we hope to circumvent or at least allevi
ate some of the shortcomings attributed to studies conducted with U.S. data. First, it can be argued that the Cadbury Report represented an exogenous shock that per turbed U.K. board structures. Second, to the extent that boards were coerced into
adding outside directors, directors were just as likely to have been added dur
1 As in, for example, Brickley, Coles, and Terry (1994), Brickley and James (1987), Byrd and Hick man (1992), Core, Holthausen, and Larcker (1999), Cotter, Shivdasani, and Zenner (1997), Dahya, McConnell, and Travlos (2002), Kini, Kracaw, and Mian (1995), Shivdasani (1993), and Weisbach (1988).
2Agrawal and Knoeber (1996), Bhagat and Black (2002), Hermalin and Weisbach (1991), and Mehran (1995).
This content downloaded from 128.210.126.199 on Wed, 10 Feb 2016 19:50:17 UTCAll use subject to JSTOR Terms and Conditions

Dahya and McConnell 537
ing a period of good performance as during a period of poor performance. And,
third, the significant changes in board composition that followed publication of the Report were concentrated over a relatively short time interval, thus providing a large sample of boards with altered structures so as to permit a clean before- and
after-event analysis. The primary question that we address is whether U.K. companies that came
into compliance with the Cadbury Report recommendation of having at least three
outside directors experienced an improvement in performance. We measure per formance in two ways. First, we compare the return on assets (ROA) for compa nies that came into compliance with the Cadbury recommendation against various
benchmarks. The benchmarks are composed either of companies already in com
pliance with the recommendation prior to the Cadbury Report or of companies that never complied with the recommendation during the period of our analysis.
Second, we conduct an event study of stock prices around announcements that
companies were appointing a sufficient number of outside directors so as to con
form with the recommendation.
We find that compliance with the Cadbury recommendation is followed by a
statistically and economically significant improvement in operating performance
(i.e., ROA) regardless of the performance benchmark employed. For example, from one year before to two years after adoption of the Cadbury recommenda
tion, the adopting firms experienced a statistically significant increase in average
ROA of 1.95% from 7.76% to 9.71%. Over the same time interval, the adopting companies' industry peers experienced an insignificant increase in average ROA
of 0.12% from 9.52% to 9.64%. To give an indication of the economic magnitude of this improvement, as of the end of the year prior to adoption the average book
value assets of firms that adopted the recommendation was ?221 million. An im
provement of 1.95% in ROA translates into an increase in before-tax profits of
?4.31 million. To identify the source of the improvement in ROA, we decompose the change
in ROA into its components. In comparison with various categories of their peers,
firms that adopted the Cadbury recommendation exhibited a somewhat higher growth rate in revenue, a slower growth in cost of goods sold (COGS), and, most
importantly, a much lower growth rate in operating expenses from before to after
adoption of the recommendation. Thus, most of the improvement in ROA appears
to be due to improved control of overhead expenses.
As regards the event study of stock returns, instances in which a company
with fewer than three outside directors announced additions of outside directors
so as to increase the number of outsiders to three or more are accompanied by an average two-day abnormal return (AR) of 0.44%. In comparison, the average
two-day AR associated with announcements of the addition of inside directors is
0.17%. The difference between the two is statistically significant. Thus, the reac
tion of investors to the announcement that a firm has complied with the Cadbury
recommendation is consistent with an expectation by investors that the decision
will lead to an improvement in operating performance, and our analysis finds such
an improvement. As an extension of our analysis, we also consider a second recommendation
of the Cadbury Report?that the positions of CEO and Chairman of the Board
This content downloaded from 128.210.126.199 on Wed, 10 Feb 2016 19:50:17 UTCAll use subject to JSTOR Terms and Conditions
538 Journal of Financial and Quantitative Analysis
(COB) be held by two different persons. We conduct each of our analyses of
operating and stock price performance for firms that comply with this recommen
dation. We find no effect on operating performance or stock price for firms that
split the positions of CEO and COB to comply with this recommendation. Numerous caveats are in order. Perhaps the most important is that we do not
offer our results as an endorsement of mandated minimum levels for outside di
rectors. The results do show that companies that increased their number of outside
directors to meet the Cadbury standard experienced a significant improvement in
performance, but that experience may be unique to the U.K. or to the time period studied. Other studies of other countries will provide insight regarding the extent to which the outcome in the U.K. can be generalized.
The next section briefly reviews prior studies of board composition and cor
porate performance and provides further details about the Cadbury Report. Sec
tion III describes the sample and data we use in our analysis. Section IV presents our analysis of operating performance. Section V presents our decomposition of operating performance into its various components. Section VI contains the
results of our event study of stock prices. Section VII briefly discusses tests of whether splitting the positions of CEO and COB have any effect on operating or stock price performance. Section VIII presents various sensitivity analyses of our
basic tests. Section IX provides a commentary. Included in this Commentary are
two further analyses that address questions about the extent to which the shift in
board structures is due to exogenous (as opposed to endogenous) factors. Section
X concludes.
II. Background
A. Prior Studies
Bhagat and Black (1999) and Hermalin and Weisbach (2003) provide ex cellent and extensive surveys of prior studies of the connection between board
composition and corporate decisions. Thus, our review of this literature will be
brief.
Prior studies of the relation between board composition and performance fall
into one of two categories. In the first, various measures of corporate performance are regressed against the fraction of the board composed of outside directors. For
example, Hermalin and Weisbach (1991) study a sample of 134 NYSE firms at
three-year intervals over the period 1971 through 1983. They regress operating
earnings and Tobin's Q against the fraction of the board made up of outside direc
tors and various control variables. They experiment with various specifications of
their regressions, but in none do they find performance to be significantly corre
lated with the fraction of outside directors. Agrawal and Knoeber (1996) conduct cross-sectional regressions with a sample of 383 large U.S. firms for which they have board data for 1987. In their regressions, Tobin's Q is the dependent vari
able. Initially, they report a significant negative correlation between the fraction
of outside directors and Q. However, in later work with the same sample and
other control variables, the significance of the relation disappears (Agrawal and
Knoeber (2001)). Bhagat and Black (2002) analyze the relation between board
This content downloaded from 128.210.126.199 on Wed, 10 Feb 2016 19:50:17 UTCAll use subject to JSTOR Terms and Conditions

Dahya and McConnell 539
composition and four different measures of corporate performance?Q, ROA,
sales/assets, and long-term stock returns. They conduct their analysis with a sam
ple of 828 U.S. firms for which they have board data in 1991. They report that firms that experience poor performance tend to appoint more outside directors, but that the maneuver does not lead to an improvement in performance. They also
find no significant relation between board composition and various measures of
long run performance. CDN (2007) analyze a large sample of U.S. firms over the
period 1992-2001. They find that the relation between performance and board
composition depends upon certain firm characteristics. Using Tobin's Q as their
measure of performance, they report that Q is negatively correlated with the frac tion of inside directors in firms that report high R&D expenditures and positively correlated with the number of outside directors in large firms and in firms with
high leverage.3 The second category includes event studies of stock returns around announce
ments of director appointments. Rosenstein and Wyatt (1990), (1997) report that announcements of outside director appointments are associated with a significant AR of 0.20% and that announcements of inside director appointments are associ
ated with an insignificant AR. Both of their samples use U.S. companies. Our analysis falls into a third category in that we use an exogenous change
in the environment to study the relation between changes in board composition and subsequent changes in corporate performance. Prior studies that fall into this
category include Schwert (1981), Szewczyk and Tsetsekos (1992), Kole and Lehn
(1997), (1999), Brook, Hendershott, and Lee (1998), Coles and Hoi (2003), and others who study the effect of regulatory changes on economic behavior.
B. The Cadbury Committee
The Cadbury Committee was appointed by the Conservative Government of the U.K. in May 1991 with a broad mandate to "... address the financial aspects of corporate governance" (Report of the Committee on the Financial Aspects of
Corporate Governance, 1992, Section 1.8). The Committee, chaired by Sir Adrian
Cadbury, CEO of the Cadbury confectionary empire, issued its report, the cor
nerstone of which was The Code of Best Practice, in December 1992. A key recommendation of the Code is that boards of publicly traded companies have
at least three non-executive (i.e., outside) directors.4 Although the Code has not
been enacted into law, it does have the implicit backing of the U.K. government.
Additionally, the London Stock Exchange (LSE) requires that any listed company that does not comply with the Code issue a statement indicating that the company is not in compliance and explaining why it is not.
As reported in DMT (2002), from 1989 through 1992 for a random sample of 460 LSE firms, the average size of the board of directors was 5.7 members with a median of 5.0. Over 1993-1996, the mean board size was 7.3 members
3The main concern of CDN (2007) is the determinants of board composition. They argue that board composition will be a function of the advising and other requirements of the firm's management.
4Among other things, the Code also recommended that the positions of CEO and COB be held
by two different individuals. We briefly report the results of our analyses of the effect of splitting the
positions of COB and CEO in Section VII.
This content downloaded from 128.210.126.199 on Wed, 10 Feb 2016 19:50:17 UTCAll use subject to JSTOR Terms and Conditions
540 Journal of Financial and Quantitative Analysis
with a median of 7.0. Over the same two periods, the proportion of outside di
rectors increased from an average of 35% to an average of 46%. Thus, over the
years immediately preceding issuance of the Cadbury Report, the average board had just under two outside directors. In comparison, over the years immediately after the issuance of the Report, the average board had about 3.3 outside direc
tors. These statistics indicate that publication of the Code is associated with a
significant increase in the presence of outside directors on U.K. boards.
Arguably, publication of the Code of Best Practice in the U.K. touched off an
explosion of similar codes elsewhere. A commonality of such codes is that they
specify a minimum standard for the representation of outside directors on boards
of publicly traded companies. Sometimes these minima are framed as a minimum
number of outside directors (Australia, Belgium, Denmark, India, New Zealand,
Portugal, Russia, Sweden, and Thailand), sometimes they are framed as a min
imum fraction of outside directors (Brazil, China, Czech Republic, Greece, In
donesia, Japan, Kenya, Mexico, Poland, Singapore, and Switzerland), and some
times they specify both a minimum number and a minimum fraction of outside
directors (Cyprus, France, Iceland, Malaysia, South Africa, and South Korea).
III. Sample and Data
The sample we use in our analysis is the universe of industrial companies
(with data on board composition and certain financial information) listed on the LSE over the period 1989 through 1996.5 In the aggregate, the sample includes
1,124 firms that enter the analysis with at least one year of data.6
We split the sample into three mutually exclusive groups: i) the set of firms that had at least three outside directors every year in which they were listed on the LSE over the period 1989-1996 (we call this the always-in-compliance set, 336
firms); ii) the set of firms that never had more than two outside directors any year in which they were listed over the period 1989-1996 (we call this the never-in
compliance set, 279 firms); and iii) the remaining set of firms that comprises those that added a sufficient number of outside directors so as to come into compliance
with the Cadbury recommendation of at least three outside directors any year
during the interval 1989-1996 (we call this the adopted-Cadbury set, 509 firms). To determine into which set to classify a firm, we collected the number of outside
directors and the total number of directors each year for each LSE firm from the Stock Exchange Yearbook. In principle, a firm could fall out of compliance, thus
giving rise to a fourth interesting group. In practice, over the period of our study, we find no firms that fall out of compliance.
We employ accounting earnings and stock prices to measure corporate per formance. We use ROA as our measure of accounting earnings. For each firm in
the sample, for each year for which data are available, we calculate ROA as earn
ings before depreciation, interest, and taxes divided by the beginning-of-the-year
5Thus, we exclude financial firms. 6We identified 1,681 industrial companies listed on the LSE over the period 1989 through 1996.
Of these, 344 were dropped due to insufficient accounting data to calculate ROA; 213 were dropped because neither the Stock Exchange Yearbook nor the Corporate Register identified whether board members were outsiders.
This content downloaded from 128.210.126.199 on Wed, 10 Feb 2016 19:50:17 UTCAll use subject to JSTOR Terms and Conditions
Dahya and McConnell 541
total assets. For each firm, accounting data are taken from Datastream each year
for which such data are available from 1986 through 1999. Stock prices used in our event study are also from Datastream. Each firm is identified according to its Financial Times Industry Classification (FTIC). Because firms enter and exit the
sample for various reasons, the number of firms differs from year to year. For any
year for which a firm has the requisite data, the firm is included in our analysis. Summary statistics on board size, outside directors, total assets, and market
value of equity along with the number of firms in the sample each year are pre sented in Table 1 for the three sets of firms. Panel A is the adopted-Cadbury set; Panel B is the always-in-compliance set; and Panel C is the never-in-compliance set. The average firm in the adopted-Cadbury set shows a marked increase in
board size from 6.8 members in 1989 to 8.2 members in 1996. The always-in
compliance set is relatively constant in terms of board size with about 8.2 mem
bers (which is the ending board size for the adopted-Cadbury set). The never-in
compliance set exhibits a mild increase from 6.5 to 7.1 members. Thus, in terms
of board size, this set is close to the beginning point for the adopted-Cadbury set
throughout the time interval considered.
By definition, the adopted-Cadbury set will end up with a larger number of outside directors than it began with, and also exhibits an increase in the fraction of
outside directors from 26.4% to 44.9%. Thus, the typical board increased by 1.4 members and the number of outsiders by 1.8 members. For the most part then,
firms complied with the Cadbury recommendation by adding outside directors rather than replacing insiders with outsiders. As might be expected, these statis
tics show their largest increase between year-ends 1992 and 1993. The fraction of outsiders also exhibits a relatively large increase from year-end 1991 to year
end 1992 that may reflect anticipation of the Cadbury Report on the part of some
firms.7 In contrast, in terms of board composition, the always-in-compliance set
is relatively stable?it begins with an average of 42.1% outside directors and ends
with 45.7%. The never-in-compliance set shows a mild increase in the fraction
of outside directors, but does not rise to the level of the other two sets?it begins
with 16.7% and ends with 21.5%. Finally, in terms of market value of equity and book value of assets, on average, firms in the adopted-Cadbury set are smaller
than those in the always-in-compliance set and larger than those in the never-in
compliance set.
IV. Analysis and Results
A. Operating Performance: An Overview
The statistic that we employ for presenting our results is the trimmed mean
of the distribution of ROA, where the distribution is trimmed at the 1% and 99% levels. Henceforth, unless we state otherwise, we refer to this statistic as the mean
of the distribution. We also conduct each of our analyses using medians. Suffice
it to say here and as we comment in Section VIII, in all cases results based on
medians support those based on trimmed means.
7 An initial draft of the Code was issued for comments in May 1991. After various revisions, the
final report was published in December 1992.
This content downloaded from 128.210.126.199 on Wed, 10 Feb 2016 19:50:17 UTCAll use subject to JSTOR Terms and Conditions

542 Journal of Financial and Quantitative Analysis
TABLE 1
Financial and Board Characteristics for U.K. Industrial Firms Listed on the LSE (1989-1996)
Descriptive statistics for U.K. industrial firms (with data on board composition and financial information) listed on the LSE over the period 1989 through 1996. In the aggregate, the sample includes 1,124 firms that enter the analysis with at least one year of data. The sample is split into three mutually exclusive groups: the set of firms that had at least 3 outside directors every year in which they were listed on the LSE over the period 1989 through 1996 (the always-in-compliance firms), the set of firms that never had more than 2 outside directors any year in which they were listed over the period 1989 through 1996 (the never-in-compliance firms), and the remaining set of firms which comprise those that added a sufficient number of outside directors so as to come into compliance with the Cadbury Committee recommendation of at least 3 outside directors any year during 1989 through 1996 (the adopted-Cadbury firms). To determine into which set to classify a firm, we identified the number of outside directors each year for each firm from the Stock Exchange Yearbook. Accounting information and share prices are taken from Datastream. Return on assets (ROA) is calculated as earnings before interest, taxes, and depreciation divided by beginning-of-year total book value of assets.
_Year_
_Variable_1989 1990 1991 1992 1993 1994 1995 1996
Panel A. Adopted-Cadbury Firms
Sample size 321 373 395 434 445 463 452 440
Percentage of firms in 3% 9% 15% 25% 54% 75% 89% 100% compliance at year-end
Board size (mean) 6.8 6.8 6.8 7.0 7.9 8.1 8.2 8.2
Percentage of outside directors 26.4% 26.5% 27.1% 29.6% 38.9% 40.3% 42.7% 44.9% (mean)
Book value of assets ?194.2 ?149.4 ?186.4 ?215.8 ?262.5 ?285.6 ?312.6 ?370.6 (mean in millions)
Market value of equity ?219.5 ?226.8 ?247.9 ?277.3 ?299.9 ?293.6 ?322.8 ?342.0 (mean in millions)
Panel B. Always-in-Compliance Firms Sample size 204 240 237 254 245 284 273 286
Board size (mean) 8.1 8.1 8.1 8.1 8.3 8.4 8.4 8.5
Percentage of outside directors 42.1% 44.3% 45.0% 43.4% 42.5% 44.1% 44.1% 45.7% (mean)
Book value of assets ?547.7 ?602.6 ?684.9 ?741.8 ?670.6 ?644.9 ?740.6 ?747.8 (mean in millions)
Market value of equity ?620.2 ?448.7 ?563.7 ?613.6 ?736.4 ?682.3 ?771.5 ?904.4 (mean in millions)
Panel C. Never-in-Compliance Firms
Sample size 175 190 182 193 192 190 182 176 Board size (mean) 6.5 6.3 6.2 6.5 6.8 7.0 7.0 7.1
Percentage of outside directors 16.7% 16.0% 17.7% 18.5% 19.4% 20.1% 21.3% 21.5% (mean)
Book value of assets ?221.2 ?256.0 ?264.5 ?252.7 ?247.0 ?211.4 ?242.2 ?231.6 (mean in millions)
Market value of equity ?97.5 ?86.2 ?92.2 ?91.8 ?100.5 ?107.3 ?139.6 ?134.1 (mean in millions)
Figure 1 provides an overview of the operating performance of the three sets
of firms over the period 1989 through 1996. The figure gives the time-series mean ROA for each set of firms. First, as the figure shows, in each year the average ROA
of the always-in-compliance set (the dotted line) lies above the average ROA of
the never-in-compliance set (the dashed line). The difference between the two
ranges from 0.6% (in 1989) to 2.6% (in 1992), suggesting that firms with three or more outside directors tend to outperform firms with fewer than three outside di
rectors. Second, and more interestingly, the average ROA of the adopted-Cadbury set (the solid line) starts out in 1989 at the same level as the never-in-compliance set and progressively moves toward the mean of the always-in-compliance set. By
This content downloaded from 128.210.126.199 on Wed, 10 Feb 2016 19:50:17 UTCAll use subject to JSTOR Terms and Conditions
Dahya and McConnell 543
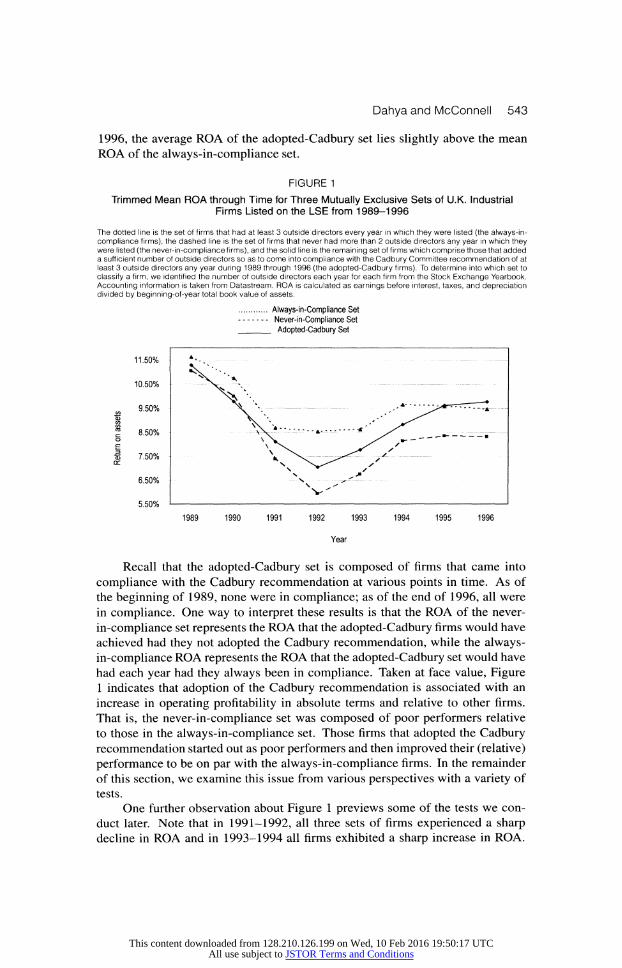
1996, the average ROA of the adopted-Cadbury set lies slightly above the mean ROA of the always-in-compliance set.
FIGURE 1
Trimmed Mean ROA through Time for Three Mutually Exclusive Sets of U.K. Industrial Firms Listed on the LSE from 1989-1996
The dotted line is the set of firms that had at least 3 outside directors every year in which they were listed (the always-in compliance firms), the dashed line is the set of firms that never had more than 2 outside directors any year in which they were listed (the never-in-compliance firms), and the solid line is the remaining set of firms which comprise those that added a sufficient number of outside directors so as to come into compliance with the Cadbury Committee recommendation of at least 3 outside directors any year during 1989 through 1996 (the adopted-Cadbury firms). To determine into which set to classify a firm, we identified the number of outside directors each year for each firm from the Stock Exchange Yearbook. Accounting information is taken from Datastream. ROA is calculated as earnings before interest, taxes, and depreciation divided by beginning-of-year total book value of assets.
Always-in-Compliance Set Never-in-Compliance Set Adopted-Cadbury Set
1989 1990 1991 1992 1993 1994 1995 1996
Year
Recall that the adopted-Cadbury set is composed of firms that came into
compliance with the Cadbury recommendation at various points in time. As of
the beginning of 1989, none were in compliance; as of the end of 1996, all were in compliance. One way to interpret these results is that the ROA of the never
in-compliance set represents the ROA that the adopted-Cadbury firms would have
achieved had they not adopted the Cadbury recommendation, while the always
in-compliance ROA represents the ROA that the adopted-Cadbury set would have
had each year had they always been in compliance. Taken at face value, Figure 1 indicates that adoption of the Cadbury recommendation is associated with an increase in operating profitability in absolute terms and relative to other firms.
That is, the never-in-compliance set was composed of poor performers relative
to those in the always-in-compliance set. Those firms that adopted the Cadbury
recommendation started out as poor performers and then improved their (relative)
performance to be on par with the always-in-compliance firms. In the remainder
of this section, we examine this issue from various perspectives with a variety of
tests.
One further observation about Figure 1 previews some of the tests we con
duct later. Note that in 1991-1992, all three sets of firms experienced a sharp decline in ROA and in 1993-1994 all firms exhibited a sharp increase in ROA.
11.50%
10.50%
9.50% & a>
1 8.50% o H 7.50% on
6.50%
This content downloaded from 128.210.126.199 on Wed, 10 Feb 2016 19:50:17 UTCAll use subject to JSTOR Terms and Conditions
544 Journal of Financial and Quantitative Analysis
This time period happens to coincide with publication of the Cadbury Report and with an increase in outside directors as Table 1 shows. We investigate whether the coincidental occurrence of these two events might explain our results.
B. Changes in ROA from before to after Adoption of the Cadbury Recommendation in Comparison with Industry-Matched Benchmarks
We now examine changes in operating performance from before to after
adoption of the Cadbury recommendation for the adopted-Cadbury firms in com
parison with various benchmarks. In these analyses, we refer to the year in which
a firm adopted the recommendation as event year y, year y + 1 is event year y + 1,
and so forth. (Year y is the calendar year in which a firm that previously had less than three outside directors increases the number of outside directors to three or
more. During event year y + 1, the firm had three or more outside directors for all
12 months.) We present certain of the results in graphical form in Figures 2 and 3. Uni
variate tests of statistical significance are reported in the accompanying Tables 2
and 3.
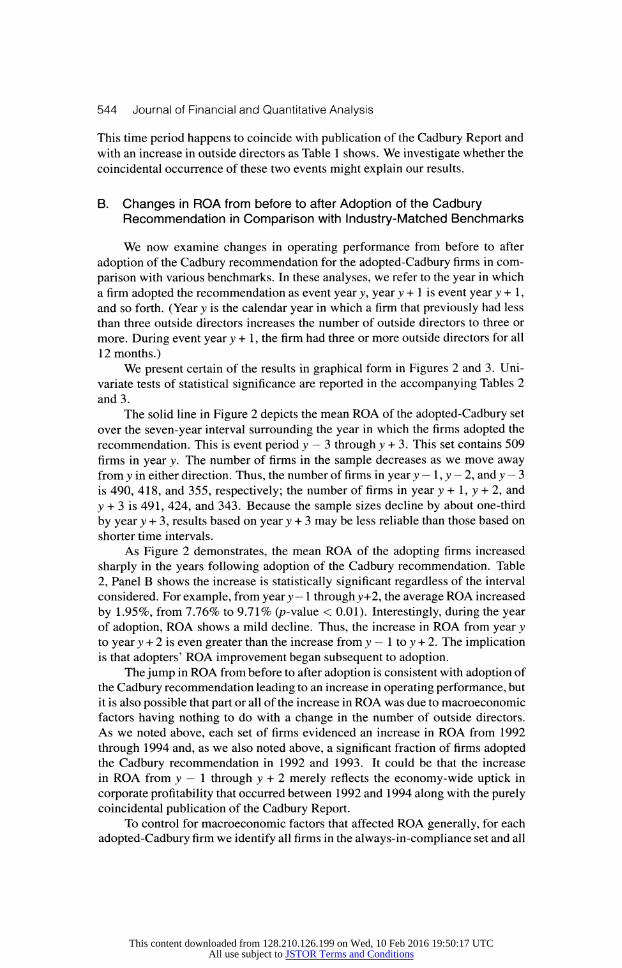
The solid line in Figure 2 depicts the mean ROA of the adopted-Cadbury set over the seven-year interval surrounding the year in which the firms adopted the
recommendation. This is event period y ? 3 through y + 3. This set contains 509
firms in year y. The number of firms in the sample decreases as we move away
from y in either direction. Thus, the number of firms in year y ?
1, y ?
2, and y ? 3
is 490, 418, and 355, respectively; the number of firms in year y + 1, y + 2, and
y + 3 is 491, 424, and 343. Because the sample sizes decline by about one-third
by year y + 3, results based on year y + 3 may be less reliable than those based on shorter time intervals.
As Figure 2 demonstrates, the mean ROA of the adopting firms increased
sharply in the years following adoption of the Cadbury recommendation. Table
2, Panel B shows the increase is statistically significant regardless of the interval considered. For example, from year y
? 1 through y+2, the average ROA increased
by 1.95%, from 7.76% to 9.71% (p-value < 0.01). Interestingly, during the year of adoption, ROA shows a mild decline. Thus, the increase in ROA from year y to year y + 2 is even greater than the increase from y
? 1 to y + 2. The implication is that adopters' ROA improvement began subsequent to adoption.
The jump in ROA from before to after adoption is consistent with adoption of the Cadbury recommendation leading to an increase in operating performance, but
it is also possible that part or all of the increase in ROA was due to macroeconomic
factors having nothing to do with a change in the number of outside directors.
As we noted above, each set of firms evidenced an increase in ROA from 1992
through 1994 and, as we also noted above, a significant fraction of firms adopted the Cadbury recommendation in 1992 and 1993. It could be that the increase in ROA from y
? 1 through y + 2 merely reflects the economy-wide uptick in
corporate profitability that occurred between 1992 and 1994 along with the purely coincidental publication of the Cadbury Report.
To control for macroeconomic factors that affected ROA generally, for each
adopted-Cadbury firm we identify all firms in the always-in-compliance set and all
This content downloaded from 128.210.126.199 on Wed, 10 Feb 2016 19:50:17 UTCAll use subject to JSTOR Terms and Conditions
Dahya and McConnell 545
FIGURE 2 Trimmed Mean ROA in Event Time for Three Mutually Exclusive Sets of U.K. Industrial
Firms Listed on the LSE from 1989-1996
The solid line represents the set of firms that added a sufficient number of outside directors so as to come into compliance with the Cadbury Committee recommendation of at least 3 outside directors any time over the period 1989-1996. Year y is the year in which these firms adopted the Cadbury recommendation. The dotted line represents firms that were always in compliance with the Cadbury recommendation and that match the adopting firms on the basis of FTIC. The dashed line represents the set of firms that were never in compliance and that match the adopting firms on the basis of FTIC.
To determine into which set to classify a firm, we identified the number of outside directors each year for each firm from the Stock Exchange Yearbook. Accounting information is taken from Datastream. ROA is calculated as earnings before interest, taxes and depreciation divided by beginning-of-year total book value of assets.
. Always-in-Compliance Set .
Never-in-Compliance Set _ Adopted-Cadbury Set
11.50%
10.50%
9.50% -?Q a> v>
| 8.50% o E 1 7.50% on
6.50%
5.50%
y-3 y-2 y-1 y y+1 y+2 y+3
Year
firms in the never-in-compliance set with the same FTIC as the adopted-Cadbury firms and which had an available ROA during any year over the adopting firm's
y ? 3 through y + 3 interval. We then calculate the adopting firm's industry
matched (i.e., FTIC-matched) mean ROA for the always-in-compliance set and
for the never-in-compliance set for each year over the interval .y ? 3 through y + 3.
These industry-matched mean ROAs are also presented in Figure 2.
According to Figure 2, from y ? 1 to y + 2 the mean ROA of the industry
matched always-in-compliance set (the dotted line) is essentially unchanged. The
never-in-compliance set (the dashed line) does exhibit an increase in ROA, but this
increase is less pronounced than the increase achieved by the adopted-Cadbury firms.
Panel B of Table 2 provides tests of statistical significance for the changes in ROA from before to after year y for the Cadbury-adopted set and the always-in
compliance set. The changes in ROA from before to after year y for the always
in-compliance set are never statistically significant (all /7-values > 0.10). More
importantly, the changes in mean ROA from before to after year y for the adopted
Cadbury set are always significantly greater than the changes in the ROA of the
always-in-compliance set. For example, the change in ROA from y ? 1 to y + 2
for the adopted-Cadbury firms is 1.95% (column C); the change for the always in-compliance set is 0.12% (column D). The difference between the two (column
E) is statistically significant (p-value < 0.01).
This content downloaded from 128.210.126.199 on Wed, 10 Feb 2016 19:50:17 UTCAll use subject to JSTOR Terms and Conditions

546 Journal of Financial and Quantitative Analysis
TABLE 2
ROA and Change in ROA for Adopted-Cadbury Firms and Always-in-Compliance Firms Listed on the LSE (1989-1996)
The sample includes 1,124 firms that enter the analysis with at least one year of data. We split the sample into three mutually exclusive groups: the set of firms that had at least 3 outside directors every year in which they were listed on the LSE over the period 1989 through 1996 (the always-in-compliance firms), the set of firms that never had more than 2 outside directors any year in which they were listed over the period 1989 through 1996 (the never-in-compliance firms), and the remaining set of firms that comprises those that added a sufficient number of outside directors so as to come into compliance with the Cadbury Committee recommendation of at least 3 outside directors any year during 1989 through 1996 (the adopted-Cadbury firms). To determine into which set to classify a firm, we identified the number of outside directors each year for each firm from the Stock Exchange Yearbook. Accounting information to compute ROA is taken from Datastream. ROA is calculated as earnings before interest, taxes, and depreciation divided by the total book value of assets. Industry matching is based on FTIC Performance matching is based on ROA in year y ? 1. The analysis below includes the adopted-Cadbury firms and the always-in-compliance firms. ** and * indicate significance at the 0.01 and 0.05 levels, respectively.
(A) (B) (C) (D) (E) (F)
Event Year
Adopted Cadbury
Sample Firms Size (%)
Panel A. Return on Assets (mean ROA in %)
y- 1 y y+1 y + 2 y + 3
490 509 491 424 343
7.76% 7.04 9.15 9.71 9.54
Always-in Compliance
Industry Matched
Firms (%)
9.52% 9.45 9.53 9.64 9.51
Difference in Means (col. C minus col. D)
Always-in Compliance Industry- &
Performance Matched
Firms (%)
8.03% 7.39 7.99 8.47 8.87
Panel B. Change in Return on Assets (mean ARO A in %)
y ? 1 to y + 1 y - 1 to y + 2 y - 1 to y + 3
491 424 343
1.39%* 1.95** 1.78**
0.01% 0.12
-0.01
1.38%* 1.83** 1.79**
-0.04% 0.44 0.84
(G)
Difference in Means (col. C minus col. F)
1.43%* 1.51* 0.94*
Panel B of Table 3 presents tests of statistical significance for the changes in ROA from before to after year y for the adopted-Cadbury set and the never-in
compliance set. For the never-in-compliance set, the changes in ROA are typically small and not statistically significant. And the changes in ROA from before to after year y for the adopted-Cadbury set are always significantly greater than the
changes in ROA for the never-in-compliance set. For example, the difference
between the changes in ROA for the two groups over the interval y ? 1 through
y + 2 is 1.69% (p-value < 0.05). Apparently, the increase in profitability for firms that adopted the Cadbury recommendation is not due solely to macroeconomic
factors that influenced all companies' profitability.
C. Changes in ROA from before to after Adoption of the Cadbury Recommendation in Comparison with Industry- and Performance-Matched Benchmarks
Figure 2 also shows that the companies that came into compliance with the
Cadbury recommendation experienced a significant decline in ROA over the two
years up to and through the year of adoption.8 As Barber and Lyon (1996) em
8The phenomenon of firms increasing their number of outside directors following a decline in
performance has been documented for U.S. firms by Denis and Sarin (1999) and Hermalin and Weis bach (1991). As observed by Bhagat and Black (2002), however, this practice does not lead to an
improvement in performance.
This content downloaded from 128.210.126.199 on Wed, 10 Feb 2016 19:50:17 UTCAll use subject to JSTOR Terms and Conditions

Dahya and McConnell 547
TABLE 3
ROA and Change in ROA for Adopted-Cadbury Firms and Never-in-Compliance Firms Listed on the LSE (1989-1996)
The sample includes 1,124 firms that enter the analysis with at least one year of data. We split the sample into three mutually exclusive groups: the set of firms that had at least 3 outside directors every year in which they were listed on the LSE over the period 1989 through 1996 (the always-in-compliance firms), the set of firms that never had more than 2 outside directors any year in which they were listed over the period 1989 through 1996 (the never-in-compliance firms), and the remaining set of firms that comprises those that added a sufficient number of outside directors so as to come into compliance with the Cadbury Committee recommendation of at least 3 outside directors any year during 1989 through 1996 (the adopted-Cadbury firms). To determine into which set to classify a firm, we identified the number of outside directors each year for each firm from the Stock Exchange Yearbook. Accounting information to compute ROA is taken from Datastream. ROA is calculated as earnings before interest, taxes, and depreciation divided by the total book value of assets. Industry matching is based on FTIC. Performance matching is based on ROA in year y ? 1. The analysis below includes the adopted-Cadbury firms and the never-in-compliance firms. ** and * indicate significance at the 0.01 and 0.05 levels, respectively.
(A)
Event Year
(B)
Sample Size Firms (%)
(C) (D) (E) (F)
Adopted Cadbury
Firms (%)
Panel A. Return on Assets (mean ROA in %)
y - 1 y y + 1 y + 2 y + 3
490 509 491 424 343
7.76% 7.04 9.15 9.71 9.54
Never-in Compliance
Industry Matched
Firms (%)
8.04% 7.87 7.77 8.30 8.54
Difference in Means (col. C minus col. D)
Never-in Compliance Industry- &
Performance Matched
Firms (%)
Panel B. Change In Return on Assets (mean A ROA In %) 1 to y + 1 1 to y + 2 1 to y + 3
491 424 343
1.39%* 1.95** 1.78**
-0.27% 0.26 0.50
1.66* 1.69* 1.28*
7.84% 7.17 7.28 7.89 8.37
-0.56% 0.05 0.53
(G)
Difference in Means (col. C minus col. F)
1.95%* 1.90** 1.25*
phasize, if earnings are mean reverting and if the companies being analyzed ex
perience especially poor or especially good performance prior to the event being
examined, comparison with a simple industry benchmark can be misleading. To
account for mean reversion in earnings, they propose that companies be matched
on the basis of industry classification and prior performance. Thus, we gener ate a set of always-in-compliance firms and a set of never-in-compliance firms
that match the adopting firm on the basis of industry (i.e., FTIC) and ROA in
year y ? 1. Specifically, for each adopting company, we identify all firms in the
always-in-compliance set with the same FTIC as of year y ?
1. From among these
firms, we choose the one whose ROA during year y ? 1 is closest to the ROA of
the adopting firm so long as the matching company's ROA lies within 75% and 125% of the adopting firm's ROA. As we noted above, the number of firms in the
adopted-Cadbury set declines as we move away from year y. This phenomenon also occurs in the always-in-compliance matching firms, which further reduces
the sample size as we move away from year v. In years y + I, y + 2, and y + 3,
the sample sizes (and their matching firm sample sizes) are 484, 409, and 304,
respectively. We then replicate the industry and performance matching procedure for the set of never-in-compliance firms. In years y + 1, y + 2, and y + 3, the
sample sizes are 481, 396, and 297, respectively. Because the number of always
in-compliance firms and the number of never-in-compliance firms is less than the
This content downloaded from 128.210.126.199 on Wed, 10 Feb 2016 19:50:17 UTCAll use subject to JSTOR Terms and Conditions

548 Journal of Financial and Quantitative Analysis
number of adopted-Cadbury firms, some of the matching firms enter the analysis more than once, albeit typically in a different calendar year.
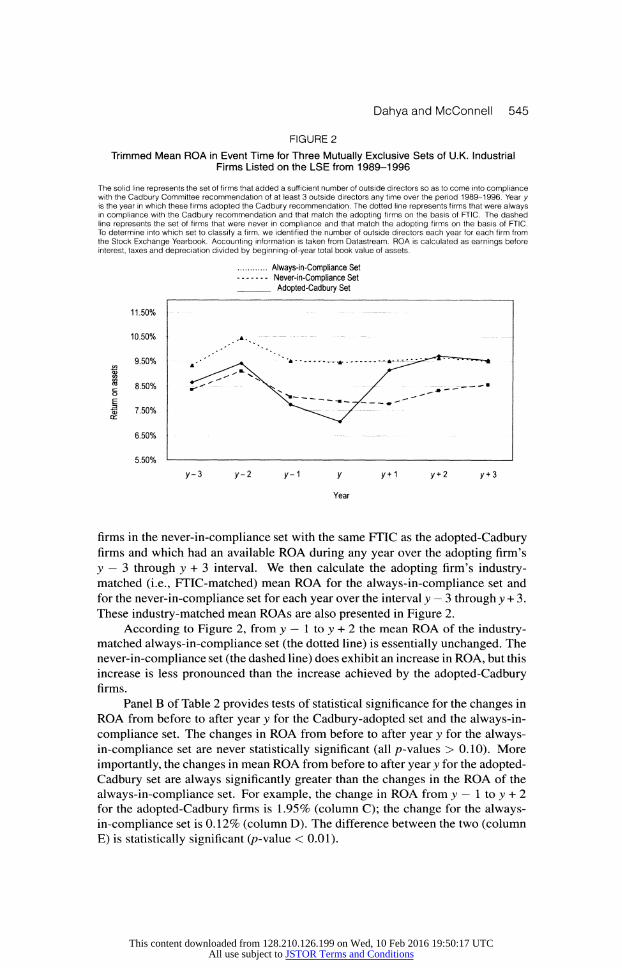
The mean ROA of the adopted-Cadbury firms along with the mean ROA of their industry- and performance-matched firms are displayed in Figure 3. By con
struction, the mean ROA of the three sets of firms are nearly identical in year y? 1.
According to the figure, each set of firms experienced a significant decline in mean
ROA from year y?2 through year y ? 1 and into year y. The always-in-compliance
set and the never-in-compliance set exhibited a mild improvement beginning in
year y +1 and continuing through year y+3. These data capture the potential mean
reversion in ROA after a period in which firms have performed poorly. However,
the improvement in ROA for the adopted-Cadbury set exceeds that of the improve ment in either the industry- and performance-matched always-in-compliance set
or the industry- and performance-matched never-in-compliance set. That is, even
after accounting for "normal" mean reversion, the adopted-Cadbury set of firms
exhibited an above normal improvement in operating performance in the years
following adoption. Statistical tests are presented in Tables 1 and 2.
FIGURE 3
Trimmed Mean ROA in Event Time for Three Mutually Exclusive Sets of U.K. Industrial Firms Listed on the LSE from 1989-1996
The solid line represents the set of firms that added a sufficient number of outside directors so as to come into compliance with the Cadbury Committee recommendation of at least 3 outside directors any time over the period 1989-1996. Year y is the year in which these firms adopted the Cadbury recommendation. The dotted line represents firms that were always in compliance with the Cadbury recommendation and that match the adopting firms on the basis of FTIC and ROA in year
y ? 1. The dashed line represents the set of firms that were never in compliance and that match the adopting firms on the basis of FTIC and ROA in year y ? 1. To determine into which set to classify a firm, we identified the number of outside directors each year for each firm from the Stock Exchange Yearbook. Accounting information is taken from Datastream. ROA is calculated as earnings before interest, taxes, and depreciation divided by beginning-of-year total book value of assets.
. Always-in-Compliance Set .- -
Never-in-Compliance Set _ Adopted-Cadbury Set
As shown in Panel B of Table 2, in comparison with the industry-matched always-in-compliance set and in comparison with the industry- and performance
matched always-in-compliance set, over the intervals y ? 1 through y + 1, y
? 1
through y + 2, and y ? 1 through y + 3, the performance improvement for the
This content downloaded from 128.210.126.199 on Wed, 10 Feb 2016 19:50:17 UTCAll use subject to JSTOR Terms and Conditions
Dahya and McConnell 549
adopted-Cadbury firms is statistically significantly greater than zero at the 0.05 level or better.9 For example, from y
? 1 to y + 2 the difference between the
improvement in the industry-matched always-in-compliance set and the adopted
Cadbury set is 1.83% with a p-value < 0.01, and over the same interval the
difference between the improvement in the industry- and performance-matched
always-in-compliance set and the adopted-Cadbury set is 1.51% with a/7-value of
< 0.05.
Similarly, as shown in Panel B of Table 3, in comparison with the never
in-compliance set over every interval, the improvement in ROA for the adopted
Cadbury set is statistically significantly greater (at the 0.05 level or better) than the improvement in ROA for both the industry-matched and the industry- and
performance-matched never-in-compliance sets. For example, for the industry matched set, from y
? 1 to y + 2, the difference in improvement is 1.69% (p-value < 0.05). For the industry- and performance-matched set, the difference is 1.90%
(p-value < 0.01). Thus, although firms that adopted the Cadbury recommendation
experienced a decline in operating performance prior to adoption, the subsequent
improvement is not due solely to mean reversion. Adoption of the Cadbury rec
ommendation appears to be associated with an absolute and relative improvement in operating performance. The relative improvement occurs following adoption and occurs in comparison with firms that were already in compliance and in com
parison with those that never were in compliance during the period of our analysis.
D. Multivariate Tests of Statistical Significance
By construction, the univariate tests control for industry factors that might affect ROA and for mean reversion in ROA. An additional factor that has some
times been shown to influence ROA is size of the company. To control for the in
fluence that size may have on ROA and changes in ROA, we estimate regressions
using the change in ROA across event time intervals as the dependent variable.
In the first set of regressions, we include the adopted-Cadbury firms and their
matched always-in-compliance firms. The independent variables are an indica
tor for adopted-Cadbury firms (1) or always-in-compliance firms (0), an indicator variable for pre-December 1992 (1) or post-December 1992 (0), and the log of book assets. As control variables, we also include an indicator for whether the
firm was diversified (where a firm is considered diversified if it falls into two or more FTIC industries), stock return volatility (measured as the variance of the
firm's daily stock returns over the prior 12 months), and leverage (measured as
book value of debt divided by book value of total assets as of the end of the prior year).
The regression is estimated separately for the intervals v ? 1 through ;y + 1,
y ? I through y + 2, and y
? 1 through y + 3. And the regressions are estimated
separately with the always-in-compliance industry-matched firms and with the
always-in-compliance industry- and performance-matched firms. Thus, we esti
mate six regressions, the results of which are not given in a table.10 The pre-/post December 1992 indicator variable is never significant and the size variable is sig
9The increases in ROA from y to y + 1 and y + 2 are also statistically significant. l0But are available from the authors.
This content downloaded from 128.210.126.199 on Wed, 10 Feb 2016 19:50:17 UTCAll use subject to JSTOR Terms and Conditions

550 Journal of Financial and Quantitative Analysis
nificant in about half the regressions. None of the other control variables are
significant at the 0.05 level in any of the regressions. We are most interested in the adopted-Cadbury indicator. This variable is
significant at the 0.01 level in five of the six regressions. In the sixth regression, the coefficient is significant at the 0.05 level. Thus, in comparison with firms that had at least three outside directors prior to 1989 (the always-in-compliance
set) and after controlling for firm size, industry, prior performance, stock return
volatility, leverage, and whether the firm was diversified, the improvement in op
erating earnings for companies that altered their boards by increasing the number
of outside directors to three or more is significantly greater than zero.
We also estimate a parallel set of regressions using the adopted-Cadbury firms and the never-in-compliance firms. The coefficient of the adopted-Cadbury indicator variable is significant at the 0.01 or better in four of the six regressions and in the other two it is significant at the 0.05 level.11
The multivariate analysis is consistent with the univariate analysis: after con
trolling for industry, pre-adoption performance, asset size, firm diversification,
stock price volatility, and debt, compliance with the Cadbury recommendation
foreshadowed a significant improvement in corporate earnings.
V. Improvements in Performance: Source of Gains
A. Decomposition of ROA
The analyses indicate that the adopted-Cadbury firms experienced a signifi cant uptick in absolute and relative performance beginning the first full year after
adoption and continuing through year y + 3. A question that occurs is what as
pect of ROA gave rise to the improvement. To address that question, we examine
the four fundamental components of ROA: sales, COGS, operating (i.e., selling,
general, and administrative (SG&A)) expense and assets. We calculate the per
centage change in each component for each firm over the intervals y ? 1 to y + 1,
y ? 1 to y + 2, and y
? 1 to y + 3. We then calculate the mean of the trimmed
distribution (trimmed at the 1% and 99% levels) of the change in each com
ponent for the adopted-Cadbury set, for the industry- and performance-matched
always-in-compliance set, and for the industry- and performance-matched never
in-compliance set. We focus our discussion on the differences in growth rates
between the adopted-Cadbury set and the two benchmark sets. The results are
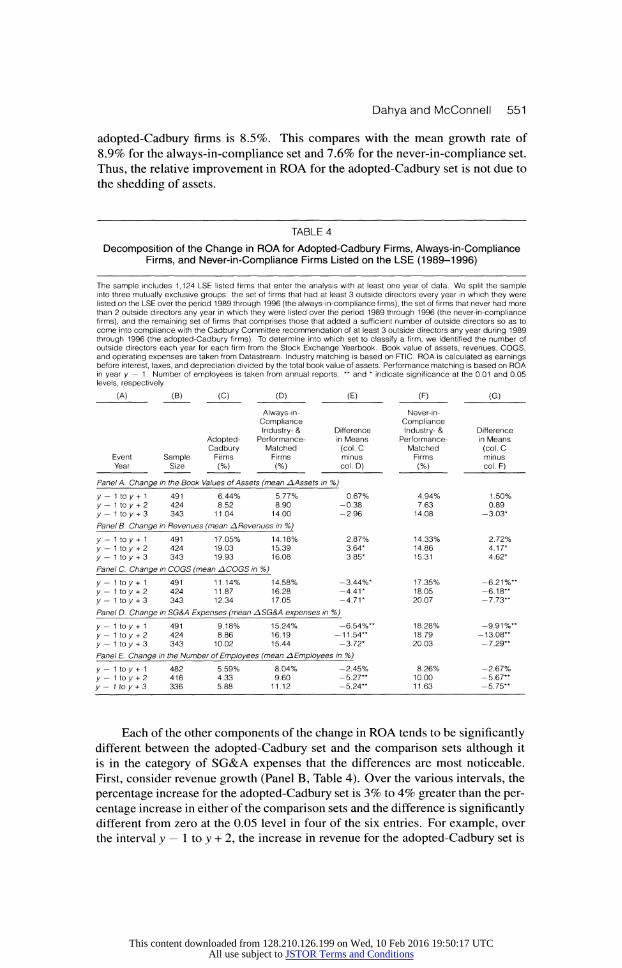
presented in Table 4 along with tests of statistical significance for the differences in growth rates.
As would be expected, over the intervals considered, each set of firms ex
periences an increase, on average, in each component of ROA?sales, COGS,
operating expenses, and assets.
The denominator of ROA is assets and is a reasonable starting point to evalu
ate the changes in ROA. With one exception, over the various intervals considered
the growth in assets for the adopted-Cadbury set is not different from that of the
two comparison sets at the 0.05 level of significance (Panel A of Table 4). For
example, over the interval y ? 1 to y + 2 the average asset growth rate for the
11 These results are also available from the authors.
This content downloaded from 128.210.126.199 on Wed, 10 Feb 2016 19:50:17 UTCAll use subject to JSTOR Terms and Conditions
Dahya and McConnell 551
adopted-Cadbury firms is 8.5%. This compares with the mean growth rate of
8.9% for the always-in-compliance set and 7.6% for the never-in-compliance set.
Thus, the relative improvement in ROA for the adopted-Cadbury set is not due to the shedding of assets.
TABLE 4
Decomposition of the Change in ROA for Adopted-Cadbury Firms, Always-in-Compliance Firms, and Never-in-Compliance Firms Listed on the LSE (1989-1996)
The sample includes 1,124 LSE listed firms that enter the analysis with at least one year of data. We split the sample into three mutually exclusive groups: the set of firms that had at least 3 outside directors every year in which they were listed on the LSE over the period 1989 through 1996 (the always-in-compliance firms), the set of firms that never had more than 2 outside directors any year in which they were listed over the period 1989 through 1996 (the never-in-compliance firms), and the remaining set of firms that comprises those that added a sufficient number of outside directors so as to come into compliance with the Cadbury Committee recommendation of at least 3 outside directors any year during 1989 through 1996 (the adopted-Cadbury firms). To determine into which set to classify a firm, we identified the number of outside directors each year for each firm from the Stock Exchange Yearbook. Book value of assets, revenues, COGS, and operating expenses are taken from Datastream. Industry matching is based on FTIC. ROA is calculated as earnings before interest, taxes, and depreciation divided by the total book value of assets. Performance matching is based on ROA in year y ? 1. Number of employees is taken from annual reports.
** and * indicate significance at the 0.01 and 0.05 levels, respectively.
(A) (B) (C) (D) (E)
Event Year
Adopted Cadbury
Sample Firms Size (%)
Always-in Compliance Industry- &
Performance Matched
Firms (%)
Difference in Means (col. C minus col. D)
Panel A. Change in the Book Values of Assets (mean AAssets in %)
y -
y -
y -
Panel
y y y Panel
y y y Panel
y y y Panei
to y + 1 491 6.44% 5.77% to y + 2 424 8.52 8.90 toy+ 3 343 11.04 14.00
B. Change in Revenues (mean A Revenues in %)
toy+1 491 17.05% 14.18% toy+ 2 424 19.03 15.39 toy+ 3 343 19.93 16.08
C. Change in COGS (mean ACOGS in %)
0.67?A -0.38 -2.96
2.87?/ 3.64* 3.85*
toy + 1 491 11.14% 14.58% -3.44?/ toy+ 2 424 11.87 16.28 -4.41* toy+ 3 343 12.34 17.05 -4.71*
D. Change in SG&A Expenses (mean ASG&A expenses in %)
toy+1 toy + 2 toy + 3
491 424 343
9.18% 8.86 10.02
15.24% 16.19 15.44
-6.54?X -11.54** -3.72*
E. Change in the Number of Employees (mean A Employees in %) to y + 1 482 toy+ 2 416 toy+ 3 336
5.59% 4.33 5.88
8.04% 9.60 11.12
-2A5?/< -5.27*' -5.24"
(F)
Never-in Compliance Industry- &
Performance Matched
Firms (%)
4.94% 7.63 14.08
14.33% 14.86 15.31
17.35% 18.05 20.07
18.28% 18.79 20.03
8.26% 10.00 11.63
(G)
Difference in Means (col. C minus col. F)
1.50% 0.89
-3.03*
2.72% 4.17* 4.62*
-6.21%* -6.18** -7.73**
-9.91%" -13.08** -7.29**
-2.67% -5.67** -5.75**
Each of the other components of the change in ROA tends to be significantly different between the adopted-Cadbury set and the comparison sets although it
is in the category of SG&A expenses that the differences are most noticeable.
First, consider revenue growth (Panel B, Table 4). Over the various intervals, the
percentage increase for the adopted-Cadbury set is 3% to 4% greater than the per
centage increase in either of the comparison sets and the difference is significantly different from zero at the 0.05 level in four of the six entries. For example, over
the interval y ? 1 to y + 2, the increase in revenue for the adopted-Cadbury set is
This content downloaded from 128.210.126.199 on Wed, 10 Feb 2016 19:50:17 UTCAll use subject to JSTOR Terms and Conditions
552 Journal of Financial and Quantitative Analysis
19.0% in comparison with increases of 15.4% for the always-in-compliance set
and 14.9% for the never-in-compliance set.
Second, consider COGS (Panel C, Table 4). Here the percentage increase is on the order of 3% to 8% lower for the adopted-Cadbury set than for either of the two comparison sets over each of the intervals considered and the difference is
significant at the 0.01 level for three of the six entries and significant at the 0.05 level for the other three. For example, over the interval y
? 1 to y + 2 the increase
in COGS for the adopted-Cadbury set is 11.9% in comparison with increases of 16.3% for the always-in-compliance set and 18.0% for the never-in-compliance set.
Finally, consider SG&A expense (Panel D, Table 4). In this category, the
percentage increases for the adopted-Cadbury set range from 4% to 13% lower than for the other two sets of firms and five of the six differences are significant at the 0.01 level with the sixth being significant at the 0.05 level. For example, over the interval y
? 1 to y + 2 the increase in SG&A expense for the adopted-Cadbury set is 8.9% in comparison with increases of 16.2% for the always-in-compliance set and 18.8% for the never-in-compliance set.
In sum, decomposition of ROA into its parts indicates that the improvement in ROA for those firms that complied with the Cadbury recommendation was not due to trimming of excess assets. Rather, the improvement appears to have
derived from increases in operating efficiency. The efficiency gains show up most
dramatically as cost containment in the area of operating expenses.
B. Number of Employees
Given that the source of the relative improvement in ROA appears to be from cost containment and much of that appears to be from the containment of
operating expenses, one place to look for the source of that gain is work force
size. That is, cost cutting, especially in the short term, often involves reductions
in the "overhead" associated with administrative personnel. We collected data on the number of employees for each company in our sam
ple from corporate annual reports. With these data, we calculated the percentage
change in the size of each company's work force over the interval y ? 1 to y + 1,
y ? 1 to y + 2, and y
? 1 to y + 3. The trimmed means of these percentage changes for each of our three sets of firms are given Panel E of Table 4. Over each inter
val, the percentage increase in number of employees is significantly lower for the
adopted-Cadbury firms than for either set of peers and the difference is significant at the 0.01 level for four of the six entries. For example, over the interval y
? 1 to
y + 2 the always-in-compliance firms experienced an increase in the work force of
9.6% and the never-in-compliance firms experienced an increase in the work force
of 10.0%. In comparison, the adopted-Cadbury set had a work force increase of
4.3%. A reasonable interpretation of these data is that a significant fraction of the cost containment experienced by the adopted-Cadbury firms came about through closer management of payroll expenses.
This content downloaded from 128.210.126.199 on Wed, 10 Feb 2016 19:50:17 UTCAll use subject to JSTOR Terms and Conditions

Dahya and McConnell 553
VI. Event Study around Announcements of Director
Appointments
A. Sample and Methodology
Our analyses of changes in board composition and operating performance indicate that the addition of outside directors to corporate boards coincided with an improvement in operating performance as measured by ROA. In this section,
we perform an event study to analyze stock returns around announcements of
appointments of inside and outside directors to determine whether the addition of outside directors showed up as an increase in stock price.12
To conduct our event study, we use the market model procedure with mar
ket model parameters estimated using daily stock returns over the interval of 153
trading days prior to the announcement day through three days prior to that day. We examine market model ARs over the two-day interval that encompasses the
day on which the company issued its press release announcing a director appoint ment and the following day. We conduct two tests of statistical significance: i) a Mest of whether the mean AR is significantly different from zero or whether the means of two samples are different from each other, and ii) a binomial sign test of
whether the fraction of positive ARs is significantly greater than 0.50 or whether the fraction of positive ARs from two samples are different from each other.
To construct our sample of director appointments, we identified all new di
rectors each year over the period 1989-1996 from the annual corporate reports of the 1,124 companies in our sample. Many appointments have no effect on
board composition. For example, suppose that in 1994 a board consisted of four
members, three of which were insiders and one of which was an outsider. And
suppose in 1995 the board still consisted of four members of which three were the same insiders as 1994 and the fourth was a different outsider. In this case,
we observe the appointment of a new outside director, but the appointment has
no impact on either the number or fraction of outside directors. Because we are
interested in the composition of the board, appointments that do not alter the split between insiders and outsiders are dropped from the sample. With this construc
tion, the total number of new directors is 1,988. Of these, 985 are inside director
appointments and 1,003 are outside director appointments. The announcement
date for each appointment of a director is collected from the Extel Weekly News
Summary. If the company announced the appointment of both an inside and out
side director on the same date, this observation is further excluded from the event
study. If the company announced the appointment of multiple outside or multiple inside directors on the same date, this observation remains in the sample. If more
than one inside or outside director is announced on the same day, that observation
12Because of the Cadbury Report, we should note that in this analysis much of the stock price effect of moving to three outside directors may have been incorporated into stock prices prior to the announcements. Thus, whatever stock price effect we find may be attenuated. Consider this proba bilistic exercise: Suppose that adopters will increase firm value, non-adopters will have no change in
value, the market anticipates that proportion 509/788 will comply, and that 0.44% is the market reac tion assuming attenuation for anticipation. In that case, the full market reaction given no anticipation
would be 1.24%.
This content downloaded from 128.210.126.199 on Wed, 10 Feb 2016 19:50:17 UTCAll use subject to JSTOR Terms and Conditions

554 Journal of Financial and Quantitative Analysis
is included only once. This process leaves 952 outside director and 940 inside director appointments.
B. Stock Prices and Appointments of Outside Directors
We are interested in appointments that increase the number of outside di
rectors to three or more in comparison with other types of appointments. Thus, we separate our sample of appointments into three groups: i) appointments that
increase the number of outside directors to two or less (326 observations); ii) ap pointments that increase the number of outside directors to three or more (626
observations); and iii) appointments of inside directors (940 observations). The results of our tests are presented in Table 5. We give the bulk of our
attention to mean ARs, but as the table shows, the results based on the fraction of
positive ARs support the conclusions based on the mean ARs. The mean two-day announcement period ARs for the two groups of outsider appointments are both
positive and statistically significantly greater than zero (0.44%, /?-value < 0.01, and 0.25%, p-value < 0.05). Additionally, the fraction of positive ARs, 72% and 63%, respectively, for the two groups are both significantly greater than 50%
(both p-values < 0.01). In comparison, the announcement period AR for insider
appointments is positive and not quite significant (p-value =
0.06) and the fraction
of positive ARs is just 51%.
TABLE 5 Stock Price Response to the Appointments of Directors of U.K. Firms Listed on the LSE
(1989-1996)
The sample includes director appointments from the board rosters for the 1,124 firms that enter our analysis over the period 1989 through 1996. The total number of new director appointments was 1,988 of which 1,003 were outside directors and the remainder were inside directors. We initially split the sample of director appointments into three groups: appointments that increase the number of outside directors to 2 or less, appointments that increase the number of outside directors to 3 or more, and inside director appointments. To conduct an event study, we use the market model procedure to estimate market model parameters using daily stock returns over the interval 153 trading days prior to the announcement day through 3 days prior to the announcement date. Stock returns are from Datastream. ** and * indicate significance at the 0.01 and 0.05 levels, respectively. Percentage positive versus negative announcement period returns are in parentheses.
Sample Average Announcement Period AR Outside and Inside Director Appointments Size (% positive announcement period AR)
Appointments that increase 626 0.44%** outside directors to > 3 (72:28)**
Appointments that increase 326 0.25%* outside directors to < 2 (63:37)**
Appointments of inside directors 940 0.17% (51:49)
Further, the average AR for appointments that increase the number of outside
directors to three or more is significantly greater than the average AR for either
of the other two subsets (with p-values of 0.01 and 0.05, respectively). How
ever, the average AR surrounding announcements that add outside directors, but
bring the total number of outside directors to less than three (i.e., 0.25%), is not
significantly different from the average AR surrounding announcements that add
inside directors (i.e., 0.17%) (p-value for the difference = 0.27). Thus, investors
appear to view all appointments of outside directors as good news and they ap
pear to view appointments that increase the number of outside directors to three
This content downloaded from 128.210.126.199 on Wed, 10 Feb 2016 19:50:17 UTCAll use subject to JSTOR Terms and Conditions

Dahya and McConnell 555
or more as the best news. These results complement the results from our analysis of operating earnings.
VII. Separating the Positions of CEO and COB
As we noted above, a second component of the Cadbury Report was a rec
ommendation that the positions of COB and CEO not be held by the same in dividual. We conducted each of our ROA tests separating firms into those that
split the positions of CEO and COB, those that always had split CEO and COB
positions, and those that never split the positions over the period of our analy sis. In no instance, could we reject the null hypothesis that splitting the positions had an effect on ROA. We also conducted event studies around announcements
that firms intended to split the positions. Again, in no test could we reject the null hypothesis that the AR was significantly different from zero. Based upon our evidence, splitting the positions of CEO and COB had no effect on corporate operating performance or stock prices in the U.K.
These results are most interesting for their lack of any effect. Journalists,
politicians, corporate activists, and some academics (e.g., Jensen (1993) and Lip ton and Lorsch (1992)) have argued that splitting the positions of CEO and COB is an important step in providing improved corporate governance. These com
mentators typically base their claims on the intuition or "common sense" that an
independent COB is likely to provide closer monitoring of the CEO. The evi dence on this point is at best mixed with Rechner and Dalton (1991) providing supporting evidence and Brickley, Coles, and Jarrell (1997) providing extensive counter evidence. Our evidence from the U.K. strongly suggests that splitting the positions of CEO and COB is unlikely to lead to improved corporate perfor
mance. These results are important because they come from a country outside the
U.S. and because we have used a setting in which splitting the positions can be
viewed as having arisen from an exogenous shock.
VIM. Sensitivity Analysis In this section, we discuss certain sensitivity analyses. None of the results
discussed herein are shown in a table, but all are available from the authors.
A. Tests of Operating Performance
We conducted our univariate and multivariate statistical tests of ROA and its
components using the mean of the distribution trimmed at the 1% and 99% lev els. To determine the robustness of these results, we also conducted the tests with
median changes in ROA. The improvements in ROA were mildly more signifi cant with medians than with mean changes in ROA. That is, with median ROA the improvement in performance for the adopted-Cadbury set in comparison with
various benchmarks generally has lower/?-values. We also calculated means trim
ming the distribution at the 0.5% and 99.5% and the 2.0% and 98% levels. The
significance of none of the results is changed. We further conducted the analysis with no trimming. With no trimming, in some cases the mean change in ROA
This content downloaded from 128.210.126.199 on Wed, 10 Feb 2016 19:50:17 UTCAll use subject to JSTOR Terms and Conditions
556 Journal of Financial and Quantitative Analysis
for the adopted-Cadbury firms is not significantly different from the benchmark. That seems to be due to six benchmark firms with extraordinary changes in ROA over some intervals.
In Section IV, we noted that some of the industry- and performance-matched firms enter the analysis more than once, albeit usually in different years. We reran
all of the tests making sure that each matching firm entered the analysis only once.
The significance of the results is unchanged. Thus, our ROA results appear to be
robust.
B. Event Study of Stock Prices
To determine whether the results of our stock price event study are robust, we
employed announcement periods of various lengths. We also estimated the mar
ket model parameters over various pre-event intervals. Finally, we used simple
market-adjusted returns in which the AR was calculated as the difference between the return of the subject stock and the return of a simple equal-weighted market
index. The event study results are robust to the length of the announcement period
considered, the interval used to estimate market model parameters, and whether
we use the market model or a simple market adjustment to calculate ARs.
IX. Commentary
A. Endogeneity
As we noted at the outset, one concern with studies of board composition and corporate performance is that the two phenomena may be endogenously de
termined outcomes of a simultaneous process (Hermalin and Weisbach (2003)). We have taken various steps to reduce that concern. First, we use publication of
the Cadbury Report as the date for centering our analysis. That report witnessed
substantial changes in board composition across U.K. firms that appear unlikely to have been undertaken completely voluntarily. Testimony to that observation is
given by the bristling response of various corporate executives to the recommen
dations contained in the Report.13 Further, over the period 1991-1994, roughly 40% of all firms that did not have three outside directors prior to that date moved to having three outside directors. As best we can determine, none of these firms
had ever had three outside directors previously. Furthermore, these firms had
long histories of operating with fewer than three outside directors; on average, these Cadbury-adopters had been listed on the LSE for 18 years prior to adoption.
These observations also strongly suggest that Cadbury adoption was not purely
voluntary. Finally, of the 845 firms that became Cadbury-compliant during our
period of analysis or were in compliance as of the beginning of 1993, none re
verted to less than three outside directors following publication of the Cadbury Report. This, too, points to the reasonable presumption that changes in board
composition were not totally endogenous during the period of our study.
13 As in, for example, "Self Regulation as the Way Forward," Financial Times, May 28, 1992 and
"Cadbury Committee Draft Orders Mixed News for Shareholders," Financial Times, June 2, 1992.
This content downloaded from 128.210.126.199 on Wed, 10 Feb 2016 19:50:17 UTCAll use subject to JSTOR Terms and Conditions

Dahya and McConnell 557
Second, in all of our analyses, we use changes in board composition and
changes in ROA and we lag change in ROA as a function of the change in board
composition. These steps should also allay concerns about endogeneity being the
cause of our results.
Nevertheless, we take several further steps to address such concerns. First,
using results from contemporaneous studies of U.S. firms as a guide, we estimate
a logit model of the determinants of whether an LSE firm has three or more out side directors. We then insert an indicator variable into the regression to identify post-December 1992 observations. Significance of this variable implies that pub
lication of the Cadbury Report had an independent effect on board composition after controlling for various factors that have been shown to influence board struc
ture in the U.S. The contemporaneous studies of U.S. firms include Linck, Netter,
and Yang (2007), Boone, Field, Karpoff, and Raheja (2007), CDN (2007), and
Lehn, Patro, and Zhao (2007). The sample used in this regression includes all firm-years for which we have
data over the interval 1989-1996 for all three sets of firms. The dependent variable is a 1/0 indicator set to 1 for all observations for which the firm has three or
more outside directors. The independent variables include a proxy for firm age (the number of years that a firm has been listed on the LSE prior to the year of
observation), a diversification proxy (an indicator set to 1 if identified as being in two or more FTIC business segments), firm risk (measured as the variance of the
firm's daily stock returns over the prior 12 months), firm size (measured as the log of book assets as of the beginning of the year), debt (measured as the log (book debt divided by book assets) as of the beginning of the year), and firm market to-book ratio (measured as log of book debt plus market value of equity divided
by book assets as of the beginning of the year). The regression also includes year and FTIC two-digit industry indicators.
The results of this regression are given in the first column of Table 6. The coefficients of firm age, log (assets), and leverage are positive and significant (p values < 0.05). The coefficient of the diversification indicator is also positive with a p-value of 0.06. These results are broadly consistent with the results from the
U.S.-based studies cited above. Most importantly for the purposes of our study
the coefficient of the post-December 1992 indicator is positive and significant (p-value
= 0.04). Thus, after controlling for fundamental factors that have been
shown to be predictors of board composition elsewhere, LSE firms were more
likely to have at least three outside directors after Cadbury than before. This
result is consistent with the Cadbury Report having had an exogenous effect on
board composition. A second way to address this question is to examine only firms that were
not in compliance with the Cadbury Report as of year-end 1992 and ask whether economic factors that influence board composition can predict whether a firm sub
sequently adopts the Cadbury recommendation. Thus, we estimate a regression
using only those firms that had fewer than three outside directors as of December
1992. (These are the adopted-Cadbury set and the never-in-compliance set.) With
these firms, we estimate a logit regression in which the dependent variable is a
1/0 indicator set to 1 if a firm moves to three or more outside directors over the
period 1993-1996.
This content downloaded from 128.210.126.199 on Wed, 10 Feb 2016 19:50:17 UTCAll use subject to JSTOR Terms and Conditions
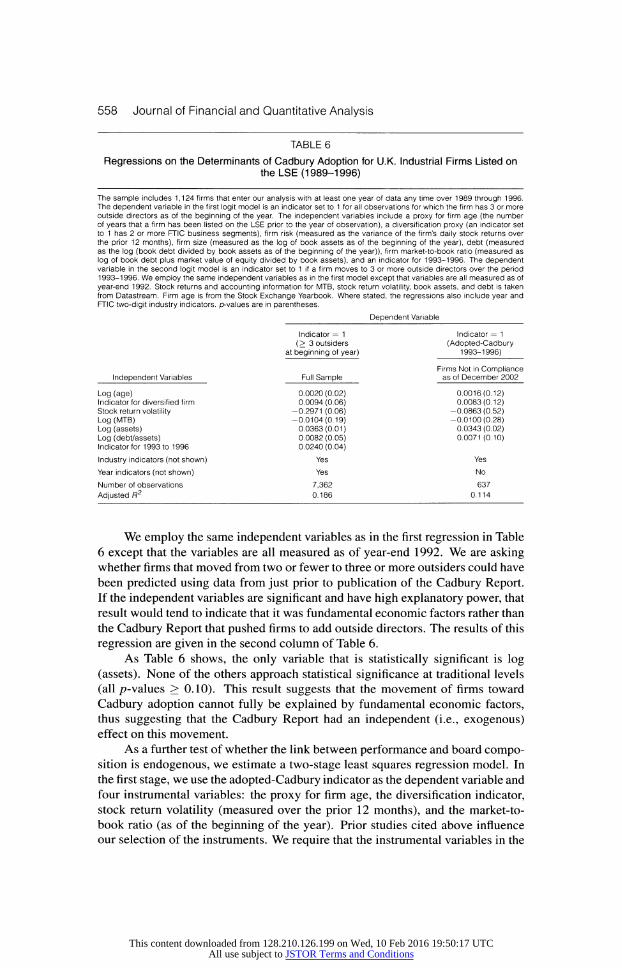
558 Journal of Financial and Quantitative Analysis
TABLE 6
Regressions on the Determinants of Cadbury Adoption for U.K. Industrial Firms Listed on the LSE (1989-1996)
The sample includes 1,124 firms that enter our analysis with at least one year of data any time over 1989 through 1996. The dependent variable in the first logit model is an indicator set to 1 for all observations for which the firm has 3 or more outside directors as of the beginning of the year. The independent variables include a proxy for firm age (the number of years that a firm has been listed on the LSE prior to the year of observation), a diversification proxy (an indicator set to 1 has 2 or more FTIC business segments), firm risk (measured as the variance of the firm's daily stock returns over the prior 12 months), firm size (measured as the log of book assets as of the beginning of the year), debt (measured as the log (book debt divided by book assets as of the beginning of the year)), firm market-to-book ratio (measured as log of book debt plus market value of equity divided by book assets), and an indicator for 1993-1996. The dependent variable in the second logit model is an indicator set to 1 if a firm moves to 3 or more outside directors over the period 1993-1996. We employ the same independent variables as in the first model except that variables are all measured as of year-end 1992. Stock returns and accounting information for MTB, stock return volatility, book assets, and debt is taken from Datastream. Firm age is from the Stock Exchange Yearbook. Where stated, the regressions also include year and FTIC two-digit industry indicators, p-values are in parentheses.
Dependent Variable
Independent Variables
Log (age) Indicator for diversified firm Stock return volatility Log (MTB) Log (assets) Log (debt/assets) Indicator for 1993 to 1996
Industry indicators (not shown) Year indicators (not shown) Number of observations Adjusted R2
Indicator = 1 (> 3 outsiders
at beginning of year)
Full Sample
0.0020 (0.02) 0.0094 (0.06)
-0.2971 (0.06) -0.0104(0.19) 0.0363(0.01) 0.0082 (0.05) 0.0240 (0.04)
Yes
Yes
7,362 0.186
Indicator = 1 (Adopted-Cadbury
1993-1996)
Firms Not in Compliance as of December 2002
0.0016(0.12) 0.0083(0.12)
-0.0863(0.52) -0.0100(0.28)
0.0343 (0.02) 0.0071 (0.10)
Yes No
637 0.114
We employ the same independent variables as in the first regression in Table 6 except that the variables are all measured as of year-end 1992. We are asking whether firms that moved from two or fewer to three or more outsiders could have
been predicted using data from just prior to publication of the Cadbury Report. If the independent variables are significant and have high explanatory power, that result would tend to indicate that it was fundamental economic factors rather than
the Cadbury Report that pushed firms to add outside directors. The results of this
regression are given in the second column of Table 6.
As Table 6 shows, the only variable that is statistically significant is log (assets). None of the others approach statistical significance at traditional levels
(all p-values > 0.10). This result suggests that the movement of firms toward
Cadbury adoption cannot fully be explained by fundamental economic factors, thus suggesting that the Cadbury Report had an independent (i.e., exogenous) effect on this movement.
As a further test of whether the link between performance and board compo sition is endogenous, we estimate a two-stage least squares regression model. In
the first stage, we use the adopted-Cadbury indicator as the dependent variable and
four instrumental variables: the proxy for firm age, the diversification indicator,
stock return volatility (measured over the prior 12 months), and the market-to
book ratio (as of the beginning of the year). Prior studies cited above influence our selection of the instruments. We require that the instrumental variables in the
This content downloaded from 128.210.126.199 on Wed, 10 Feb 2016 19:50:17 UTCAll use subject to JSTOR Terms and Conditions
Dahya and McConnell 559
first-stage regressions be determinants of Cadbury adoption but not predictors on
the change in ROA from y ? 1 to y + 2. Also included as control variables are firm
size and leverage. The last two control variables are included in both stages. In the second-stage regression, the change in the ROA over y
? 1 through
y + 2 is the dependent variable with the independent variables being the adopted Cadbury indicator as predicted from the first-stage regression, and three instru
mental variables: capital expenditures divided by total assets as of the end of
y ?
1, growth in sales over y ? 3 through y
? 1 divided by sales in y ?
3, and
change in ROA over y ? 3 through y
? 1. FTIC two-digit industry indicators and the two control variables noted above are also included in the second-stage.
Table 7 presents the regression results. Panel A shows the results when the
regressions are estimated with the adopted-Cadbury firms and their always-in
compliance matching firms. Of greatest interest to us is the coefficient of the
predicted value of the Cadbury adoption variable in the second stage. This coeffi cient is positive and statistically significant (p-value
= 0.05). Thus, in comparison
with firms that had at least three outside directors prior to 1989 (the always-in compliance set) and after controlling for a variety of other factors, firms that al
tered their boards to comply with Cadbury experienced a significant improvement in operating performance.
The setup of Panel B in Table 7 parallels Panel A except that the regres sion reported in Panel B includes the adopted-Cadbury firms and the never-in
compliance firms. Again, the coefficient of the predicted value of the Cadbury adoption variable in the second stage is positive and statistically significant (p value =
0.04).
The two-stage analysis is consistent with the OLS and univariate analysis: after controlling for industry and pre-adoption performance among other factors,
compliance with the Cadbury recommendation foreshadowed a significant im
provement in corporate earnings.
B. Reverse Causality
A second concern that might be raised about our analysis is one of reverse
causality: in particular, management of companies that were anticipating an im
provement in performance added outside directors, whereas management of com
panies that were anticipating a worsening of performance continued with the sta
tus quo. Logic supporting such an occurrence could run something as follows:
all managers were subject to pressure to add outsiders. Because outside directors
can cause a "fuss" in poorly performing firms, managers who expected poor fu
ture performance opted not to add outsiders, whereas those who were expecting
improved performance added outsiders. To an extent, however, this argument is
self-defeating in that it presumes that outside directors do cause a fuss of the sort
that could cause an improvement in performance. A variation on this argument is that the fuss caused by outsiders is actually
harmful/costly when outsiders are "forced" upon firms. Managers who anticipate
tough times ahead (and who are working in shareholders' interests) may ratio
nally decide not to add outsiders, whereas managers who expect improved perfor mance foresee that additional outsiders will be unlikely to raise a costly fuss and,
This content downloaded from 128.210.126.199 on Wed, 10 Feb 2016 19:50:17 UTCAll use subject to JSTOR Terms and Conditions

560 Journal of Financial and Quantitative Analysis
TABLE 7
Two-Stage Least Squares Regressions of the Change in ROA on Cadbury Adoption for U.K. Industrial Firms Listed on the LSE (1989-1996)
The two-stage model comprises a logit regression in the first stage and an OLS regression in the second stage. The dependent variable in the first stage is an indicator for Cadbury adoption. The independent variables are the change in ROA from y ? 1 through y + 2 as the simultaneously determined variable and four instrumental variables: a proxy for firm age (the number of years that a firm has been listed on the LSE prior to the year of observation), a diversification proxy (an indicator set to 1 has 2 or more FTIC business segments), firm risk (measured as the variance of the firm's daily stock returns over the prior 12 months), and firm market-to-book ratio (measured as log of book debt plus market value of equity divided by book assets). In the second stage, the change in ROA over y ? 1 to y + 2 is the dependent variable. The independent variables are an indicator variable for Cadbury adoption predicted with the first-stage regression, the change in sales from the beginning of y ? 3 to the end of y + 1 divided by sales during y ? 3, the change in capital expenditures over y ? 1 through y divided by assets as of the end of y ? 1, change in ROA over y ? 3 through y ? 1, and industry indicator variables for each FTIC industry group. Firm size (measured as the log of book assets as of the beginning of the year) and debt (measured as the log (book debt divided by book assets as of the beginning of the year)) are also included in both stages. The sample constitutes three mutually exclusive groups: the set of firms that had at least 3 outside directors every year in which they were listed on the LSE over the period 1989 through 1996 (the always-in-compliance firms), the set of firms that never had more than 2 outside directors any year in which they were listed over the period 1989 through 1996 (the never-in-compliance firms), and the remaining set of firms that comprises those that added a sufficient number of outside directors so as to come into compliance with the Cadbury Committee recommendation of at least 3 outside directors any year during 1989 through 1996 (the adopted-Cadbury firms). To determine into which set to classify a firm, we identified the number of outside directors each year for each firm from the Stock Exchange Yearbook. Stock returns and accounting information for MTB, stock return volatility, book assets and debt is taken from Datastream. Firm age is from the Stock Exchange Yearbook. Where stated, the regressions also include year and FTIC two-digit industry indicators. The two-stage regressions are reported with robust standard errors, p-values are in parentheses.
Dependent Variables
First-Stage Regression Second-Stage Regression Independent Variables Adopted-Cadbury Indicator Change in ROA
Panel A. Adopted-Cadbury Firms Matched with Always-in-Compliance Firms
Log (age) -0.0020(0.17) Indicator for diversified firms 0.0038 (0.41 ) Stock return volatility -0.1984 (0.66)
Log (MTB) 0.0114(0.30) Log (assets) -0.0417 (0.01 ) -0.0354 (0.07)
Log (debt/assets) -0.0038 (0.49) -0.0073 (0.23) Log (capital expenditures/assets) ?0.0129 (0.06) Lag change in ROA (y - 3 through y - 1 ) -0.0834 (0.39) Lag sales growth (y - 3 through y - 1 ) 0.1640 (0.10) Cadbury adoption 0.0591(0.05) Industry indicators (not shown) No Yes Number of observations 848 848 R2 (with robust SE) 0.153 0.120 Panel B. Adopted-Cadbury Firms Matched with Never-in-Compliance Firms
Log (age) 0.0022 (0.06) Indicator for diversified firms 0.0074 (0.19) Stock return volatility -0.2137 (0.37)
Log (MTB) -0.0159(0.07) Log (assets) 0.0395(0.01) 0.0261(0.30)
Log (debt/assets) 0.0094 (0.05) -0.0062 (0.35) Log (capital expenditures/assets) -0.0112 (0.08) Lag change in ROA (y - 3 through y - 1) -0.1146(0.16) Lag sales growth (y - 3 through y - 1 ) 0.2143 (0.01 ) Cadbury adoption 0.0507 (0.04) Industry indicators (not shown) No Yes
Number of observations 848 848 R2 (with robust SE) 0.150 0.119
therefore, add outsiders. This scenario is also consistent with our results and is in
ternally consistent. If there is a weakness to this explanation, it is that the addition
of outside directors is presumed to be a costly perturbance and it is this cost that dissuades managers from adding outsiders when the firm encounters tough times.
This presumption is inconsistent with prior studies based on U.S. firms that report that struggling firms are more likely to (voluntarily) add more outside directors (Bhagat and Black (2002) and Weisbach (1988)).
This content downloaded from 128.210.126.199 on Wed, 10 Feb 2016 19:50:17 UTCAll use subject to JSTOR Terms and Conditions

Dahya and McConnell 561
Further, an equally reasonable set of motives could operate in the opposite
direction in that managers of poorly performing firms who expect this poor per formance to continue might reasonably add outside directors as a way of showing
that they are "doing something" to improve performance or as a "shield" when
matters do not improve. The latter argument assumes that outside directors are
harmless mutations to the board and, as such, this argument is also an internally
consistent argument, but that argument is rejected by our results.
In sum, it is possible to devise an internally consistent argument for reverse
causality that is consistent with our results. Thus, we cannot absolutely rule out
such a possibility, but the argument does require an assumption that outside di
rectors are harmful when a firm is suffering poor performance, a presumption that
is inconsistent with studies in the U.S. that report that struggling firms are more
likely to add outside directors (Bhagat and Black (2002) and Weisbach (1988)).
C. Earnings Management
A third concern may be that the improvement in ROA that we observe comes about through "earnings management" rather than a fundamental improvement in
performance. On this point, Peasnell, Pope, and Young (2004) study the relation between earnings management and corporate board composition for U.K. firms
over the period June 1993 through May 1996. They report ".. .that firms with a higher proportion of outside board members are associated with less income
increasing earnings management ..." (p. 20). And conclude that "... outside
directors appear to play an important monitoring role in ... helping to uphold
the integrity and credibility of published financial statements" (p. 25). The im
plication of these findings is that whatever earnings management takes place in
the U.K. is likely to be less than before once a firm has complied with the Cad
bury recommendation. The further implication is that the absolute and relative
improvement that we observe in ROA is unlikely to be due to earnings manage ment given that such management would have to be greater following Cadbury adoption than before to explain the increase. Additionally, to the extent that in vestors can "see through" such earnings management, the event study results are
not consistent with the improvement in performance being attributable to earnings
management.
D. Costs of Non-Compliance
A further question that arises is: if having three or more outside directors
improved performance and enhanced value, why did shareholders and/or other
market forces not compel managers and boards to have three or more outside di
rectors previously? Various possible factors may have been at work. It could
have been that shareholder powers were not sufficiently strong or that institu
tional shareholders had conflicts of interest or that the takeover market was not
well developed or it could simply have been inertia in the system. In any event,
whatever actions could have been taken involved costs on the part of the prime movers. At the margin, the Cadbury Report may have produced enough impetus for change that the benefits of compliance overcame whatever impediments ex
isted for marginal firms. Thus, at the margin, firms for which the benefits were
This content downloaded from 128.210.126.199 on Wed, 10 Feb 2016 19:50:17 UTCAll use subject to JSTOR Terms and Conditions
562 Journal of Financial and Quantitative Analysis
the greatest moved most quickly to comply with the provisions of the Report. Of course, some LSE firms had still not complied as of the end of 2004. Presumably, the costs of compliance for the shareholders of these firms still outweighed the benefits of adoption.
X. Conclusion
During the 1990s and beyond, the global economy has witnessed widespread calls for more outside directors on corporate boards. A presumption that underlies
this movement is that boards with more outside directors will lead to better board decisions and, as a result, better corporate performance. DMT (2002) examine
the relation between CEO turnover and corporate performance before and after
firms adopted the key recommendations of the Cadbury Report. They find that CEO turnover is significantly more sensitive to performance after firms came into
compliance with the report by moving to three outside directors. They go on to note that this result is consistent with the recommendations having improved cor
porate governance, but they remain skeptical as to whether that would inevitably lead to improved corporate performance: "[I]ncreased management turnover and
increased sensitivity of turnover to performance do not necessarily mean an im
provement in performance" (p. 482). In this study, we examine changes in perfor mance directly, but we began with that same level of skepticism.
Somewhat surprisingly, we find that U.K. firms that moved to three outside
directors in conformance with the Cadbury Committee recommendation show an
improvement in operating performance both absolutely and relative to various
peer group benchmarks from before to after moving to three outside directors.
We also find that firms that move to three outside directors have a statistically significant stock price increase at the time of announcement of this decision. The
results strongly suggest that adding outside directors led to improved performance
by U.K. firms and increased value for shareholders. Even, then, however, most
U.K. firms had less than a majority of outside directors?on average, outside di
rectors comprised 44% of U.K. firms' directors. Thus, one question that our study raises is whether there is an optimal number or fraction of outside directors that
may be less than 50% for U.K. firms. If so, U.K. firms are ripe for a detailed study of the determinants of board composition of the type undertaken for U.S. firms by Linck, Netter, and Yang (2007), Boone, Field, Karpoff, and Raheja (2007), CDN
(2007), and Lehn, Patro, and Zhao (2007). A second question is whether the results from U.K. firms can be generalized to other countries that have adopted similar codes of best practice. We do not answer those questions here, but expect that future studies by others will.
References
Agrawal, A., and C. R. Knoeber. "Firm Performance and Mechanisms to Control Agency Problems between Managers and Shareholders." Journal of Financial and Quantitative Analysis, 31 (1996), 377-397.
Agrawal, A., and C. R. Knoeber. "Do Some Outside Directors Play a Political Role?" Journal of Law and Economics, 44 (2001), 179-198.
This content downloaded from 128.210.126.199 on Wed, 10 Feb 2016 19:50:17 UTCAll use subject to JSTOR Terms and Conditions
Dahya and McConnell 563
Barber, B. M., and J. D. Lyon. "Detecting Abnormal Operating Performance: The Empirical Power and Specification of Test-Statistics." Journal of Financial Economics, 41 (1996), 359-399.
Bhagat, S., and B. S. Black. "The Uncertain Relationship between Board Composition and Firm Performance." Business Lawyer, 54 (1999), 921-961.
Bhagat, S., and B. S. Black. "The Non-Correlation between Board Independence and Long-Term Firm Performance." Journal of Corporation Law, 27 (2002), 232-273.
Boone, A. L.; L. C. Field; J. M. Karpoff; and C. G. Raheja. "The Determinants of Corporate Board Size and Composition: An Empirical Analysis." Journal of Financial Economics, forthcoming (2007).
Brickley, J. A.; J. L. Coles; and R. L. Terry. "Outside Directors and the Adoption of Poison Pills." Journal of Financial Economics, 35 (1994), 371-390.
Brickley, J. A.; J. L. Coles; and G. Jarrell. "Leadership Structure: Separating the CEO and Chairman of the Board." Journal of Corporate Finance, 3 (1997), 189-220.
Brickley, J. A., and C. James. "The Takeover Market, Corporate Board Composition, and Ownership Structure: The Case of Banking." Journal of Law and Economics, 30 (1987), 161-180.
Brook, Y.; R. Hendershott; and D. Lee. "The Gains from Takeover Deregulation: Evidence on the End of Interstate Banking Restrictions." Journal of Finance, 53 (1998), 2185-2204.
Byrd, J. W., and K. A. Hickman. "Do Outside Directors Monitor Managers? Evidence for Tender Offer Bids." Journal of Financial Economics, 32 (1992), 195-221.
Coles, J. L.; N. D. Daniel; and L. Naveen. "Board: Does One Size Fit All?" Journal of Financial Economics, forthcoming (2007).
Coles, J. L., and C. K. Hoi. "New Evidence on the Market for Directors: Board Membership and
Pennsylvania Senate Bill 1310." Journal of Finance, 58 (2003), 197-230.
Core, J. E.; R. W. Holthausen; and D. F. Larcker. "Corporate Governance, Chief Executive Officer
Compensation and Firm Performance." Journal of Financial Economics, 51 (1999), 373^406. Cotter, J. F.; A. Shivdasani; and M. Zenner. "Do Independent Directors Enhance Target Shareholder
Wealth during Tender Offers?" Journal of Financial Economics, 43 (1997), 195-218.
Dahya, J.; J. J. McConnell; and N. G. Travlos. "The Cadbury Committee, Corporate Performance, and Top Management Turnover." Journal of Finance, 57 (2002), 461^-83.
Demsetz, H., and K. Lehn. "The Structure of Corporate Ownership: Causes and Consequences." Journal of Political Economy, 93 (1985), 1155-1177.
Denis, D. J., and A. Sarin. "Ownership and Board Structures in Publicly Traded Firms." Journal of Financial Economics, 52 (1999), 187-223.
Hermalin, B. E., and M. S. Weisbach. "The Effects of Board Composition and Direct Incentives on Firm Performance." Financial Management, 20 (1991), 101-112.
Hermalin, B. E., and M. S. Weisbach. "Boards of Directors as an Endogenously Determined Institu tion: A Survey of the Economic Literature." Economic Policy Review, April (2003), 7-26.
Jensen, M. J. "The Modern Industrial Revolution, Exit and the Failure of Internal Control Systems." Journal of Finance, 48 (1993), 831-880.
Kini, O.; W. A. Kracaw; and S. Mian. "Corporate Takeovers, Firm Performance, and Board Compo sition." Journal of Corporate Finance, 1 (1995), 383-412.
Kole, S. R., and K. M. Lehn. "Deregulation, the Evolution of Corporate Governance Structure, and Survival." American Economic Review, 87 (1997), 421^425.
Kole, S. R., and K. M. Lehn. "Deregulation and the Adaptation of Governance Structure: The Case of the U.S. Airline Industry." Journal of Financial Economics, 52 (1999), 79-117.
Lehn, K. M.; S. Patro; and M. Zhao. "Determinants of the Size and Structure of Corporate Boards: 1935-2000." Journal of Corporate Finance, forthcoming (2007).
Linck, J. S.; J. M. Netter; and T. Yang. "The Determinants of Board Structure." Journal of Financial
Economics, forthcoming (2007). Lipton, M., and J. W. Lorsch. "A Modest Proposal for Improved Corporate Governance." Business
Lawyer, 48 (1992), 59-77. Mehran, H. "Executive Compensation Structure, Ownership and Firm Performance." Journal of
Financial Economics, 38 (1995), 163-184.
Peasnell, K.; P. Pope; and S. Young. "Board Monitoring and Earnings Management: Do Outside Directors Influence Abnormal Accruals?" Journal of Business Finance and Accounting, 32 (2005), 1311-1346.
Rechner, I. F, and D. R. Dalton. "CEO Duality and Organizational Performance: A Longitudinal Analysis." Strategic Management Journal, 12 (1991), 155-160.
Rosenstein, S., and J. G. Wyatt. "Outside Directors, Board Independence, and Shareholder Wealth." Journal of Financial Economics, 26 (1990), 175-191.
Rosenstein, S., and J. G. Wyatt. "Inside Directors, Board Effectiveness, and Shareholder Wealth." Journal of Financial Economics, 44 (1997), 229-250.
This content downloaded from 128.210.126.199 on Wed, 10 Feb 2016 19:50:17 UTCAll use subject to JSTOR Terms and Conditions

564 Journal of Financial and Quantitative Analysis
Schwert, W. G. "Using Financial Data to Measure Effects of Regulation." Journal of Law and Eco
nomics, 24 (1981), 121-158. Shivdasani, A. "Board Composition, Ownership Structure, and Hostile Takeovers." Journal of Ac
counting and Economics, 16(1993), 167-198.
Szewczyk, S. H., and G. P. Tsetsekos. "State Intervention in the Market for Corporate Control: The Case of Pennsylvania Senate Bill 1310." Journal of Financial Economics, 31 (1992), 3-23.
Weisbach, M. S. "Outside Directors and CEO Turnover." Journal of Financial Economics, 20 (1988), 431-460.
This content downloaded from 128.210.126.199 on Wed, 10 Feb 2016 19:50:17 UTCAll use subject to JSTOR Terms and Conditions