
Board Assurance Framework (BAF): 2018/19 (October 2018)
15
Board Assurance Framework (BAF): 2018/19 (October 2018) Page 1 of 15 This BAF includes the following Principal Risks (PRs) to the Trust’s core objectives: PR1 Catastrophic failure in standards of safety & care PR2 Demand that overwhelms capacity PR3 Critical shortage of workforce capacity & capability PR4 Failure to maintain financial sustainability PR5 Fundamental loss of stakeholder confidence PR6 Breakdown of strategic partnerships PR7 Major disruptive incident The key elements of the BAF to be considered are: A simplified description of each Principal (strategic) Risk, that forms the basis of the Trust’s risk framework (with corresponding corporate and operational risks defined at a Trust-wide and service level) A simplified way of displaying the risk rating (current residual risk and tolerable level of risk) Clear identification of primary strategic threats and opportunities that are considered likely to increase or reduce the Principal Risk within a 5 year horizon, along with the anticipated proximity within which they are expected to materialise and the degree of certainty that the level of risk will change (High certainty = change in likelihood is expected; Uncertain = unable to predict change; Stable = likelihood not expected to change) A statement of risk appetite for each threat and opportunity, to be defined by the Lead Committee on behalf of the Board ( Averse = aim to avoid the risk entirely; Minimal = insistence on low risk options; Cautious = preference for low risk options; Open = prepared to accept a higher level of residual risk than usual, in pursuit of potential benefits) Key elements of the risk treatment strategy identified for each threat and opportunity, each assigned to an executive lead and individually rated by the lead committee for the level of assurance they can take that the strategy will be effective in treating the risk (see below for key) Sources of assurance incorporate the three lines of defence: (1) Management (those responsible for the area reported on) ; (2) Risk & compliance functions (internal but independent of the area reported on); and (3) Independent assurance (Internal audit and other external assurance providers) Clearly identified gaps in the primary control framework, with details of planned responses each assigned to a member of the Senior Leadership Team (SLT) with agreed timescales Relevant Key Risk Indicators(KRIs) for each strategic risk, taken from the Trust performance management framework to provide evidential data that informs the regular re-assessment of the risk Key to lead committee assurance ratings: Green = Positive assurance: the Committee is satisfied that there is reliable evidence of the appropriateness of the current risk treatment strategy in addressing the threat or opportunity Amber = Inconclusive assurance: the Committee is not satisfied that there is sufficient evidence to be able to make a judgement as to the appropriateness of the current risk treatment strategy Red = Negative assurance: the Committee is satisfied that there is sufficient reliable evidence that the current risk treatment strategy is not appropriate to the nature and / or scale of the threat or opportunity This approach informs the agenda and regular management information received by the relevant lead committees, to enable them to make informed judgements as to the level of assurance that they can take and which can then be provided to the Board in relation to each Principal Risk and also to identify any further action required to improve the management of those risks.
Transcript of Board Assurance Framework (BAF): 2018/19 (October 2018)

Board Assurance Framework (BAF): 2018/19 (October 2018)
Page 1 of 15
This BAF includes the following Principal Risks (PRs) to the Trust’s core objectives:
PR1 Catastrophic failure in standards of safety & care PR2 Demand that overwhelms capacity PR3 Critical shortage of workforce capacity & capability PR4 Failure to maintain financial sustainability PR5 Fundamental loss of stakeholder confidence PR6 Breakdown of strategic partnerships PR7 Major disruptive incident
The key elements of the BAF to be considered are:
A simplified description of each Principal (strategic) Risk, that forms the basis of the Trust’s risk framework (with corresponding corporate and operational risks defined at a Trust-wide and service level)
A simplified way of displaying the risk rating (current residual risk and tolerable level of risk)
Clear identification of primary strategic threats and opportunities that are considered likely to increase or reduce the Principal Risk within a 5 year horizon, along with the anticipated proximity within which they are expected to materialise and the degree of certainty that the level of risk will change (High certainty = change in likelihood is expected; Uncertain = unable to predict change; Stable = likelihood not expected to change)
A statement of risk appetite for each threat and opportunity, to be defined by the Lead Committee on behalf of the Board (Averse = aim to avoid the risk entirely; Minimal = insistence on low risk options; Cautious = preference
for low risk options; Open = prepared to accept a higher level of residual risk than usual, in pursuit of potential benefits)
Key elements of the risk treatment strategy identified for each threat and opportunity, each assigned to an executive lead and individually rated by the lead committee for the level of assurance they can take that the strategy will be effective in treating the risk (see below for key)
Sources of assurance incorporate the three lines of defence: (1) Management (those responsible for the area reported on) ; (2) Risk & compliance functions (internal but independent of the area reported on); and (3)
Independent assurance (Internal audit and other external assurance providers) Clearly identified gaps in the primary control framework, with details of planned responses each assigned to a member of the Senior Leadership Team (SLT) with agreed timescales
Relevant Key Risk Indicators(KRIs) for each strategic risk, taken from the Trust performance management framework to provide evidential data that informs the regular re-assessment of the risk
Key to lead committee assurance ratings:
Green = Positive assurance: the Committee is satisfied that there is reliable evidence of the appropriateness of the current risk treatment strategy in addressing the threat or opportunity
Amber = Inconclusive assurance: the Committee is not satisfied that there is sufficient evidence to be able to make a judgement as to the appropriateness of the current risk treatment strategy
Red = Negative assurance: the Committee is satisfied that there is sufficient reliable evidence that the current risk treatment strategy is not appropriate to the nature and / or scale of the threat or opportunity
This approach informs the agenda and regular management information received by the relevant lead committees, to enable them to make informed judgements as to the level of assurance that they can take and which can then be provided to the Board in relation to each Principal Risk and also to identify any further action required to improve the management of those risks.

Board Assurance Framework (BAF): 2018/19 (October 2018)
Page 2 of 15
Strategic priority 1. TO PROVIDE OUTSTANDING CARE Current risk exposure Tolerable risk
Lead Committee Quality
Principal risk (in the next 5 years)
PR1: Catastrophic failure in standards of safety & care A catastrophic failure in standards of safety and quality of patient care across the Trust resulting in multiple incidents of severe, avoidable harm and poor clinical outcomes for a large number of patients
Likelihood 3. Possible
1. Very unlikely Last reviewed 19/09/2018
Severity 4. High 4. High Last changed 16/10/2018
Risk rating 12. High 4. Low Details of change Updates assurances/ refreshed KRI’s
Strategic threat or opportunity Anticipated change Risk appetite
Risk treatment strategy Executive lead
Source of assurance (& date) Assurance rating
Threat: A widespread loss of organisational focus on patient safety and quality of care leading to increased incidence of avoidable harm, exposure to ‘Never Events’, higher than expected mortality, and significant reduction in patient satisfaction Uncertain
Risk exposure could increase if threat materialises
Minimal Insistence upon low risk options
Patient Safety & Quality Group (PSQG) work programme aligned to CQC registration regulations Quality Committee Work Programme Nursing & Midwifery Strategy Ward Assurance Metrics/ Accreditation Advancing Quality Programme
Medical Director & Chief Nurse
Management: DPRReport to Board (R) Monthly; PSQG assurance report to QC (R) Monthly; NM & AHP Board Update to QC (R) May ‘18; AQP Programme report to QC (R) Monthly; Learning from deaths Report QC (R) Monthly; Learning from deaths Report Board – Qtrly (R) Jul ‘18 & Annual (R) May’18; Quarterly Strategic Priority Report to Board (R) July’18; Annual Organisational Audit & Statement of Compliance (R) Board Aug ’18; Senior leadership walk arounds – 15 steps assurance report (E) Board Dec ‘18
Risk & Compliance: Quality Dashboard to QC (R) Monthly; Quality Account Report to QC (R) Sept ’18; SI & Duty of Candour report to QC (R) Monthly; SOF Performance Report Aug ’18; Independent assurance: CQC Insight tool to PSQG (R) June ‘18; CQC Rating (R) Aug’18; IA (360) Transfer of Handover assurance report (R) QC Sept ’18; Antenatal & newborn screening peer review (E) QC Nov ‘18
Positive Proximity
18/19 19/20 20/21 21/22 22/23
Threat: An outbreak of infectious disease (such as pandemic influenza; norovirus; infections resistant to antibiotics) that forces closure of one or more areas of the hospital
Uncertain Risk exposure could increase if threat materialises
Minimal Insistence upon low risk options
Infection prevention & control (IPC) programme Policies/ Procedures; Staff training; Environmental cleaning audits
Medical Director
Risk & Compliance: IPC Committee report (Quarterly); SOF Performance Report (R) Sept ’18; Independent assurance: Internal audit plan (ref 3); IA Decontamination of Mattresses Review AAC/ Risk (R) May ’18; Authorised Engineer report (R) Risk June’18 CQC Rating Good with Outstanding for Care (R) Aug’18; PLACE Assessment and Scores (R) Estates Governance September 2018
Positive Proximity
18/19 19/20 20/21 21/22 22/23
Opportunity: Availability and implementation of new technologies as a clinical or diagnostic aid (such as: electronic patient records, e-prescribing and patient tracking; artificial intelligence; telemedicine; genomic medicine)
Uncertain Risk exposure could reduce if opportunities are exploited
Open Prepared to accept some risk in pursuit of benefits
Digital Strategy & investment programme IT Strategy (system wide) NEWS2 Implementation programme
Director of SPCD
Management: Digital Strategy Implementation Group Report to Board (R) April ‘18/ TMT Quarterly (E) Oct ‘18 Independent assurance: Internal audit plan (ref 4)
Inconclusive
Proximity
18/19 18/19 18/19 18/19 18/19
Primary risk controls Gaps in control or assurance framework Plans to improve control or assurance SLT lead Timescales
Patient Safety & Quality Group (PSQG) monthly meetings AQP oversight group Accountability structure of divisions & sub-groups Clinical service structures, resources & quality governance arrangements at Trust, division & service levels Clinical policies, procedures, guidelines, pathways, supporting documentation & IT systems Clinical audit programme & monitoring arrangements Clinical staff recruitment, induction, mandatory training, registration & re-validation Defined safe medical & nurse staffing levels for all wards & departments (Nursing safeguards monitored by Ch. Nurse) Ward assurance & accreditation programme Nursing and Midwifery and AHP Business meeting
Culture of patient safety at ward level is still developing & becoming fully embedded
C Patient Safety Culture (PSC) programme C Assistant Director Service Improvement
End of 2018/19
Website & intranet currently contain some out of date clinical information
C Website & intranet redevelopment project
C Head of Communications
End of 2018/19
No change since 01/04/18

Board Assurance Framework (BAF): 2018/19 (October 2018)
Page 3 of 15
Key risk indicators (KRIs) As supplied 15th October 2018
HSMR (basket of 56 diagnosis groups) Serious Incidents including Never Events (STEIS reportable) Harm-free SFH care
Number of complaints Safe Staffing Levels - overall fill rate Daily bed occupancy percentage
Clostridium difficile Hospital acquired cases MRSA bacteremia - Hospital acquired cases E.Coli bacteraemia blood stream infection - Hospital acquired cases
80.00
85.00
90.00
95.00
100.00
105.00
110.00
115.00
120.00
Jul-
16
Au
g-1
6
Sep
-16
Oct
-16
No
v-1
6
Dec
-16
Jan
-17
Feb
-17
Mar
-17
Ap
r-1
7
May
-17
Jun
-17
Jul-
17
Au
g-1
7
Sep
-17
Oct
-17
No
v-1
7
Dec
-17
Jan
-18
Feb
-18
Mar
-18
Ap
r-1
8
May
-18
Jun
-18
Jul-
18
Actuals Lower limit Upper limit Target National
0.0
2.0
4.0
6.0
8.0
10.0
12.0
Sep
-16
Oct
-16
No
v-1
6
Dec
-16
Jan
-17
Feb
-17
Mar
-17
Ap
r-1
7
May
-17
Jun
-17
Jul-
17
Au
g-1
7
Sep
-17
Oct
-17
No
v-1
7
Dec
-17
Jan
-18
Feb
-18
Mar
-18
Ap
r-1
8
May
-18
Jun
-18
Jul-
18
Au
g-1
8
Sep
-18
Actuals Lower limit Upper limit Target
91.0
92.0
93.0
94.0
95.0
96.0
97.0
98.0
99.0
Sep
-16
Oct
-16
No
v-1
6
Dec
-16
Jan
-17
Feb
-17
Mar
-17
Ap
r-1
7
May
-17
Jun
-17
Jul-
17
Au
g-1
7
Sep
-17
Oct
-17
No
v-1
7
Dec
-17
Jan
-18
Feb
-18
Mar
-18
Ap
r-1
8
May
-18
Jun
-18
Jul-
18
Au
g-1
8
Sep
-18
Actuals Lower limit Upper limit Target
0
10
20
30
40
50
60
70
Sep
-16
Oct
-16
No
v-1
6
Dec
-16
Jan
-17
Feb
-17
Mar
-17
Ap
r-1
7
May
-17
Jun
-17
Jul-
17
Au
g-1
7
Sep
-17
Oct
-17
No
v-1
7
Dec
-17
Jan
-18
Feb
-18
Mar
-18
Ap
r-1
8
May
-18
Jun
-18
Jul-
18
Au
g-1
8
Sep
-18
Actuals Lower limit Upper limit Target
70.0
75.0
80.0
85.0
90.0
95.0
100.0
105.0
110.0
115.0
Sep
-16
Oct
-16
No
v-1
6
Dec
-16
Jan
-17
Feb
-17
Mar
-17
Ap
r-1
7
May
-17
Jun
-17
Jul-
17
Au
g-1
7
Sep
-17
Oct
-17
No
v-1
7
Dec
-17
Jan
-18
Feb
-18
Mar
-18
Ap
r-1
8
May
-18
Jun
-18
Jul-
18
Au
g-1
8
Sep
-18
Actuals Lower limit Upper limit Target
-1
0
1
2
3
4
5
6
7
8
9
Sep
-16
Oct
-16
No
v-1
6
Dec
-16
Jan
-17
Feb
-17
Mar
-17
Ap
r-1
7
May
-17
Jun
-17
Jul-
17
Au
g-1
7
Sep
-17
Oct
-17
No
v-1
7
Dec
-17
Jan
-18
Feb
-18
Mar
-18
Ap
r-1
8
May
-18
Jun
-18
Jul-
18
Au
g-1
8
Sep
-18
Actuals Lower limit Upper limit Target
-0.2
0
0.2
0.4
0.6
0.8
1
1.2
Sep
-16
Oct
-16
No
v-1
6
Dec
-16
Jan
-17
Feb
-17
Mar
-17
Ap
r-1
7
May
-17
Jun
-17
Jul-
17
Au
g-1
7
Sep
-17
Oct
-17
No
v-1
7
Dec
-17
Jan
-18
Feb
-18
Mar
-18
Ap
r-1
8
May
-18
Jun
-18
Jul-
18
Au
g-1
8
Sep
-18
Actuals Lower limit Upper limit
-1
1
3
5
7
9
11
13
Sep
-16
Oct
-16
No
v-1
6
Dec
-16
Jan
-17
Feb
-17
Mar
-17
Ap
r-1
7
May
-17
Jun
-17
Jul-
17
Au
g-1
7
Sep
-17
Oct
-17
No
v-1
7
Dec
-17
Jan
-18
Feb
-18
Mar
-18
Ap
r-1
8
May
-18
Jun
-18
Jul-
18
Au
g-1
8
Sep
-18
Actuals Lower limit Upper limit Target

Board Assurance Framework (BAF): 2018/19 (October 2018)
Page 4 of 15
Strategic priority 1. TO PROVIDE OUTSTANDING CARE Current risk exposure Tolerable risk
Lead Committee Quality
Principal risk (in the next 5 years)
PR 2: Demand that overwhelms capacity A sustained, exceptional level of demand for services that overwhelms capacity resulting in a prolonged, widespread reduction in the quality of patient care and repeated failure to achieve constitutional standards
Likelihood 4. Somewhat likely
2. Unlikely Last reviewed 19/09/2018
Severity 4. High 4. High Last changed 16/10/2018
Risk rating 16. Significant 8. Medium Details of change Updates assurances/ refreshed KRI’s
Strategic threat or opportunity Anticipated change
Risk appetite Risk treatment strategy Executive lead
Source of assurance (& date) Assurance rating
Threat: Exponential growth in demand for care caused by an ageing population (forecast annual increase in emergency demand of 4-5% per annum); reduced social care funding and increased acuity leading to more admissions & longer length of stay
High certainty Increase in risk exposure expected
Cautious Low risk options are preferred
Patient Flow Programme & Better Together Alliance admission reduction initiatives Admission avoidance schemes Length of stay reduction schemes Bed capacity increase schemes in place for winter
Chief Operating Officer
Management: Capacity plan to Board (R) Jul ‘18
Quarterly Strategic Priority Report to Board (R) July’18; Single Oversight
Framework Integrated Monthly Performance Report to Board (R) Sept ’18; Elective Care Expectations – Response to Ian Dalton (NHSI) Letter (R) Board Sept ‘18 ; Better Together Transformation Programme Update (R) Board Sept’18
Independent assurance: IA review of outpatient Demand and capacity modelling (R) July ‘18
Inconclusive
Proximity
18/19 19/20 20/21 21/22 22/23
Threat & Opportunity: Operational failure of General Practice to cope with demand resulting in even higher demand for secondary care as the ‘provider of last resort’
High certainty Increase in risk exposure expected
Open Prepared to accept some risk in pursuit of benefits
Engagement in Integrated Care System (ICS), and assuming a leading role in Integrated Care Provider development
Director of SPCD
Management: Better Together Transformation Programme Update (R)
Board Sept’18 Inconclusive Proximity
18/19 19/20 20/21 21/22 22/23
Threat & Opportunity: Operational failure of neighbouring providers that creates a large-scale shift in the flow of patients and referrals to SFH
Uncertain Risk exposure could increase if threat materialises
Open Prepared to accept some risk in pursuit of benefits
Engagement in Integrated Care System (ICS), and assuming a leading role in Integrated Care Provider development.
Director of SPCD
Management: Better Together Transformation Programme Update (R)
Board Sept’18 Inconclusive
Proximity
18/19 19/20 20/21 21/22 22/23
Primary risk controls Gaps in control or assurance framework Plans to improve control or assurance SLT lead Timescales
Emergency demand & patient flow management arrangements Single streaming process for ED & Primary Care Multi-agency System Resilience Group meeting Trust attendance at A&E Board and regular engagement with the Chair Patient pathway management arrangements Standard operating procedures for diagnostic services Performance management arrangements between Divisions, Service Lines and Executive
Team Exec to exec meetings Joint pathways of care
Planned system-wide actions may not have the desired outcomes of reducing ED attendances and delays in discharging or transferring patients
A
Proactive system leadership engagement from SFH into Better Together Alliance Delivery Board
A Divisional General Manager, E & UC
2018/19
Approaches to demand and capacity modelling are not standardised across Divisions
C All Divisions to implement IST model to ensure standardisation and enable formal review of outputs and identification of any risks
C&A Deputy COO, Elective Care
31/10/18
Not all clinical services are currently performing to the same level; particular concern with 62 day cancer standard
C
Strengthened governance & action plans for recovery of cancer performance; working towards 7 day diagnostic standards for Radiology & Endoscopy; reduction of 62 day backlog
C Divisional General Manager, Surgery
2018/19
Sustainability of Urology, Neurology and ENT services; strength of clinical services delivered in partnership (Vascular; Oncology; Stroke)
A
Revised clinical models for Urology and Neurology; development of joint SFH / NUH model for ENT; strengthening of Service Level Agreements (SLAs) via Strategic Partnership Board for joint services
C&A Divisional General Manager, Surgery
2018/19
No change since 01/04/18

Board Assurance Framework (BAF): 2018/19 (October 2018)
Page 5 of 15
Key risk indicators (KRIs) As supplied 15th October 2018
Emergency access within 4 hours (total Trust) Weekly admission & discharge surplus/deficit 18 weeks - number of incomplete pathways
18 weeks Referral to Treatment (RTT) time – incomplete pathways 62 days urgent Referral to Treatment (RTT) for suspected cancer Size of the Cancer backlog
80.0
82.0
84.0
86.0
88.0
90.0
92.0
94.0
96.0
98.0
100.0
Sep
-16
Oct
-16
No
v-1
6
Dec
-16
Jan
-17
Feb
-17
Mar
-17
Ap
r-1
7
May
-17
Jun
-17
Jul-
17
Au
g-1
7
Sep
-17
Oct
-17
No
v-1
7
Dec
-17
Jan
-18
Feb
-18
Mar
-18
Ap
r-1
8
May
-18
Jun
-18
Jul-
18
Au
g-1
8
Sep
-18
Actuals Lower limit Upper limit Target Peer Group-50
0
50
100
150
200
250
300
350
400
Kings Mill Medical Services activity ( Admitted, Discharges & Net flow)
12 weeks to 14th October 2018
Admitted
Dischargd
Net Flow15000
17000
19000
21000
23000
25000
27000
Sep
-16
Oct
-16
No
v-1
6
Dec
-16
Jan
-17
Feb
-17
Mar
-17
Ap
r-1
7
May
-17
Jun
-17
Jul-
17
Au
g-1
7
Sep
-17
Oct
-17
No
v-1
7
Dec
-17
Jan
-18
Feb
-18
Mar
-18
Ap
r-1
8
May
-18
Jun
-18
Jul-
18
Au
g-1
8
Sep
-18
Actuals Lower limit Upper limit
addition of overdue reviews
86.0
87.0
88.0
89.0
90.0
91.0
92.0
93.0
94.0
95.0
96.0
Sep
-16
Oct
-16
No
v-1
6
Dec
-16
Jan
-17
Feb
-17
Mar
-17
Ap
r-1
7
May
-17
Jun
-17
Jul-
17
Au
g-1
7
Sep
-17
Oct
-17
No
v-1
7
Dec
-17
Jan
-18
Feb
-18
Mar
-18
Ap
r-1
8
May
-18
Jun
-18
Jul-
18
Au
g-1
8
Sep
-18
Actuals Lower limit Upper limit Target Peers
65.0
70.0
75.0
80.0
85.0
90.0
95.0
100.0
Au
g-1
6
Sep
-16
Oct
-16
No
v-1
6
Dec
-16
Jan
-17
Feb
-17
Mar
-17
Ap
r-1
7
May
-17
Jun
-17
Jul-
17
Au
g-1
7
Sep
-17
Oct
-17
No
v-1
7
Dec
-17
Jan
-18
Feb
-18
Mar
-18
Ap
r-1
8
May
-18
Jun
-18
Jul-
18
Au
g-1
8
Actuals Lower limit Upper limit Target National
Board Assurance Framework (BAF): 2018/19 (October 2018)
Page 6 of 15
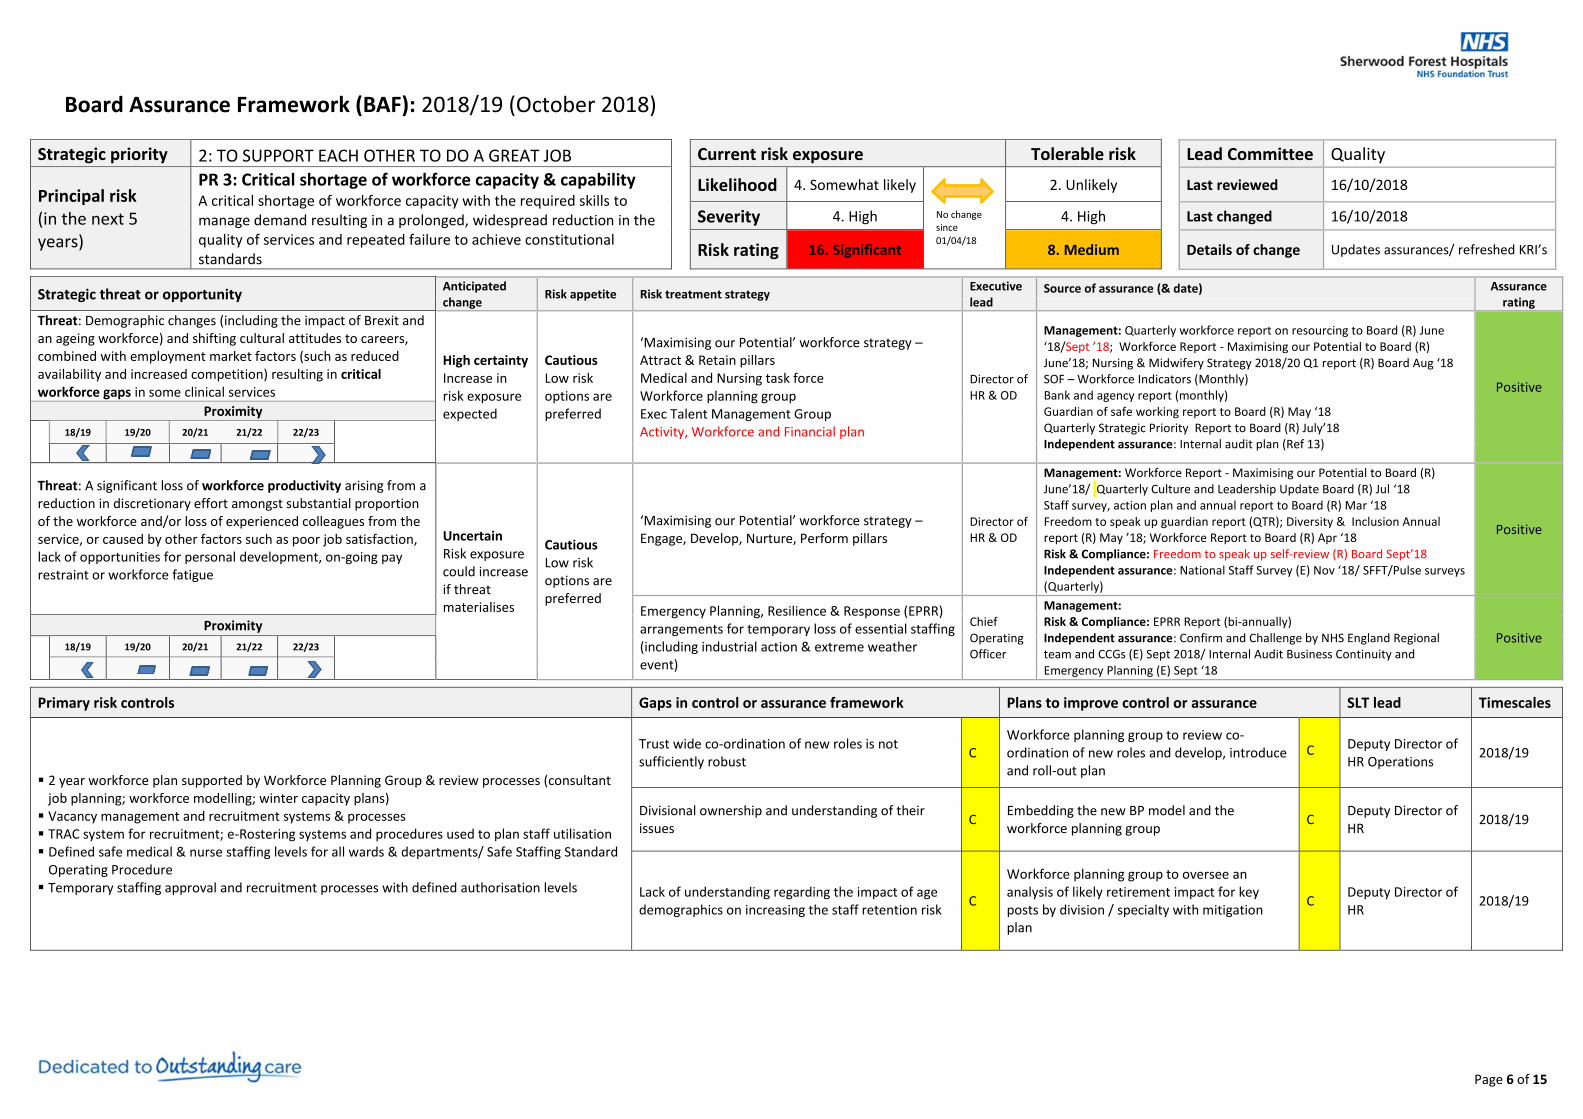
Strategic priority 2: TO SUPPORT EACH OTHER TO DO A GREAT JOB Current risk exposure Tolerable risk
Lead Committee Quality
Principal risk (in the next 5 years)
PR 3: Critical shortage of workforce capacity & capability A critical shortage of workforce capacity with the required skills to manage demand resulting in a prolonged, widespread reduction in the quality of services and repeated failure to achieve constitutional standards
Likelihood 4. Somewhat likely
2. Unlikely Last reviewed 16/10/2018
Severity 4. High 4. High Last changed 16/10/2018
Risk rating 16. Significant 8. Medium Details of change Updates assurances/ refreshed KRI’s
Strategic threat or opportunity Anticipated change
Risk appetite Risk treatment strategy Executive lead
Source of assurance (& date) Assurance rating
Threat: Demographic changes (including the impact of Brexit and an ageing workforce) and shifting cultural attitudes to careers, combined with employment market factors (such as reduced availability and increased competition) resulting in critical workforce gaps in some clinical services
High certainty Increase in risk exposure expected
Cautious Low risk options are preferred
‘Maximising our Potential’ workforce strategy – Attract & Retain pillars Medical and Nursing task force Workforce planning group Exec Talent Management Group Activity, Workforce and Financial plan
Director of HR & OD
Management: Quarterly workforce report on resourcing to Board (R) June ‘18/Sept ’18; Workforce Report - Maximising our Potential to Board (R) June’18; Nursing & Midwifery Strategy 2018/20 Q1 report (R) Board Aug ‘18 SOF – Workforce Indicators (Monthly) Bank and agency report (monthly) Guardian of safe working report to Board (R) May ‘18 Quarterly Strategic Priority Report to Board (R) July’18
Independent assurance: Internal audit plan (Ref 13)
Positive
Proximity
18/19 19/20 20/21 21/22 22/23
Threat: A significant loss of workforce productivity arising from a reduction in discretionary effort amongst substantial proportion of the workforce and/or loss of experienced colleagues from the service, or caused by other factors such as poor job satisfaction, lack of opportunities for personal development, on-going pay restraint or workforce fatigue
Uncertain Risk exposure could increase if threat materialises
Cautious Low risk options are preferred
‘Maximising our Potential’ workforce strategy – Engage, Develop, Nurture, Perform pillars
Director of HR & OD
Management: Workforce Report - Maximising our Potential to Board (R) June’18/ Quarterly Culture and Leadership Update Board (R) Jul ‘18 Staff survey, action plan and annual report to Board (R) Mar ‘18 Freedom to speak up guardian report (QTR); Diversity & Inclusion Annual report (R) May ’18; Workforce Report to Board (R) Apr ‘18 Risk & Compliance: Freedom to speak up self-review (R) Board Sept’18 Independent assurance: National Staff Survey (E) Nov ‘18/ SFFT/Pulse surveys (Quarterly)
Positive
Emergency Planning, Resilience & Response (EPRR) arrangements for temporary loss of essential staffing (including industrial action & extreme weather event)
Chief Operating Officer
Management: Risk & Compliance: EPRR Report (bi-annually) Independent assurance: Confirm and Challenge by NHS England Regional team and CCGs (E) Sept 2018/ Internal Audit Business Continuity and Emergency Planning (E) Sept ‘18
Positive Proximity
18/19 19/20 20/21 21/22 22/23
Primary risk controls Gaps in control or assurance framework Plans to improve control or assurance SLT lead Timescales
2 year workforce plan supported by Workforce Planning Group & review processes (consultant job planning; workforce modelling; winter capacity plans)
Vacancy management and recruitment systems & processes TRAC system for recruitment; e-Rostering systems and procedures used to plan staff utilisation Defined safe medical & nurse staffing levels for all wards & departments/ Safe Staffing Standard
Operating Procedure Temporary staffing approval and recruitment processes with defined authorisation levels
Trust wide co-ordination of new roles is not sufficiently robust
C Workforce planning group to review co-ordination of new roles and develop, introduce and roll-out plan
C Deputy Director of HR Operations
2018/19
Divisional ownership and understanding of their issues
C Embedding the new BP model and the workforce planning group
C Deputy Director of HR
2018/19
Lack of understanding regarding the impact of age demographics on increasing the staff retention risk
C
Workforce planning group to oversee an analysis of likely retirement impact for key posts by division / specialty with mitigation plan
C Deputy Director of HR
2018/19
No change since 01/04/18

Board Assurance Framework (BAF): 2018/19 (October 2018)
Page 7 of 15
Key risk indicators (KRIs) As supplied 14th September 2018
Staff turnover Proportion of temporary staff WTE lost as a % of contracted WTE due to sickness absence
'% of eligible staff appraised within last 12 months '% eligible staff attending core mandatory training within the last 12 months
Nurse Trajectory
0.0
0.5
1.0
1.5
2.0
2.5
3.0
3.5
4.0
4.5
5.0
Sep
-16
Oct
-16
No
v-1
6
Dec
-16
Jan
-17
Feb
-17
Mar
-17
Ap
r-1
7
May
-17
Jun
-17
Jul-
17
Au
g-1
7
Sep
-17
Oct
-17
No
v-1
7
Dec
-17
Jan
-18
Feb
-18
Mar
-18
Ap
r-1
8
May
-18
Jun
-18
Jul-
18
Au
g-1
8
Sep
-18
Actuals Lower limit Upper limit Target
6.0
6.5
7.0
7.5
8.0
8.5
Sep
-16
Oct
-16
No
v-1
6
Dec
-16
Jan
-17
Feb
-17
Mar
-17
Ap
r-1
7
May
-17
Jun
-17
Jul-
17
Au
g-1
7
Sep
-17
Oct
-17
No
v-1
7
Dec
-17
Jan
-18
Feb
-18
Mar
-18
Ap
r-1
8
May
-18
Jun
-18
Jul-
18
Au
g-1
8
Sep
-18
Actuals Lower limit Upper limit
2.0
2.5
3.0
3.5
4.0
4.5
5.0
5.5
Sep
-16
Oct
-16
No
v-1
6
Dec
-16
Jan
-17
Feb
-17
Mar
-17
Ap
r-1
7
May
-17
Jun
-17
Jul-
17
Au
g-1
7
Sep
-17
Oct
-17
No
v-1
7
Dec
-17
Jan
-18
Feb
-18
Mar
-18
Ap
r-1
8
May
-18
Jun
-18
Jul-
18
Au
g-1
8
Sep
-18
Actuals Lower limit Upper limit Target
80.0
82.0
84.0
86.0
88.0
90.0
92.0
94.0
96.0
98.0
Sep
-16
Oct
-16
No
v-1
6
Dec
-16
Jan
-17
Feb
-17
Mar
-17
Ap
r-1
7
May
-17
Jun
-17
Jul-
17
Au
g-1
7
Sep
-17
Oct
-17
No
v-1
7
Dec
-17
Jan
-18
Feb
-18
Mar
-18
Ap
r-1
8
May
-18
Jun
-18
Jul-
18
Au
g-1
8
Sep
-18
Actuals Lower limit Upper limit Target
80.0
82.0
84.0
86.0
88.0
90.0
92.0
94.0
96.0
Sep
-16
Oct
-16
No
v-1
6
Dec
-16
Jan
-17
Feb
-17
Mar
-17
Ap
r-1
7
May
-17
Jun
-17
Jul-
17
Au
g-1
7
Sep
-17
Oct
-17
No
v-1
7
Dec
-17
Jan
-18
Feb
-18
Mar
-18
Ap
r-1
8
May
-18
Jun
-18
Jul-
18
Au
g-1
8
Sep
-18
Actuals Lower limit Upper limit Target
565
590
615
640
665
690
715
740
Establishment
SIP
Board Assurance Framework (BAF): 2018/19 (October 2018)
Page 8 of 15
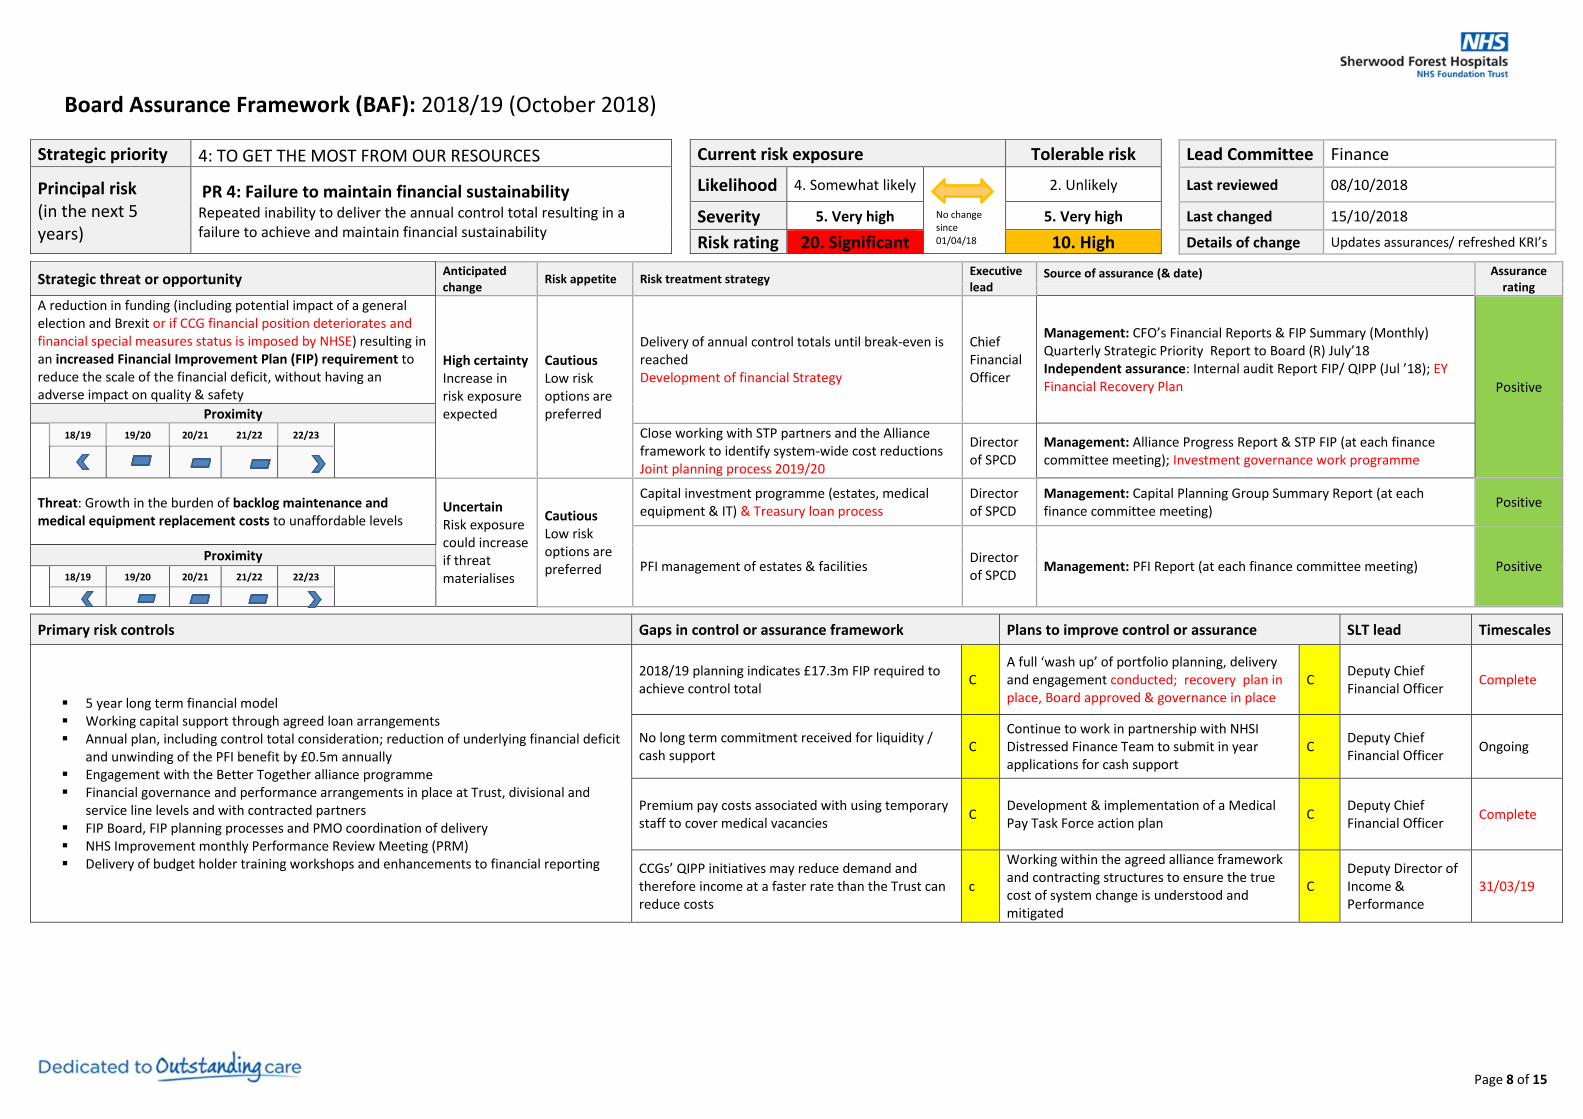
Strategic priority 4: TO GET THE MOST FROM OUR RESOURCES Current risk exposure Tolerable risk
Lead Committee Finance
Principal risk (in the next 5 years)
PR 4: Failure to maintain financial sustainability Repeated inability to deliver the annual control total resulting in a failure to achieve and maintain financial sustainability
Likelihood 4. Somewhat likely
2. Unlikely Last reviewed 08/10/2018
Severity 5. Very high 5. Very high Last changed 15/10/2018
Risk rating 20. Significant 10. High Details of change Updates assurances/ refreshed KRI’s
Strategic threat or opportunity Anticipated change
Risk appetite Risk treatment strategy Executive lead
Source of assurance (& date) Assurance rating
A reduction in funding (including potential impact of a general election and Brexit or if CCG financial position deteriorates and financial special measures status is imposed by NHSE) resulting in an increased Financial Improvement Plan (FIP) requirement to reduce the scale of the financial deficit, without having an adverse impact on quality & safety
High certainty Increase in risk exposure expected
Cautious Low risk options are preferred
Delivery of annual control totals until break-even is reached Development of financial Strategy
Chief Financial Officer
Management: CFO’s Financial Reports & FIP Summary (Monthly) Quarterly Strategic Priority Report to Board (R) July’18 Independent assurance: Internal audit Report FIP/ QIPP (Jul ’18); EY Financial Recovery Plan Positive
Proximity
18/19 19/20 20/21 21/22 22/23 Close working with STP partners and the Alliance framework to identify system-wide cost reductions Joint planning process 2019/20
Director of SPCD
Management: Alliance Progress Report & STP FIP (at each finance committee meeting); Investment governance work programme
Threat: Growth in the burden of backlog maintenance and medical equipment replacement costs to unaffordable levels
Uncertain Risk exposure could increase if threat materialises
Cautious Low risk options are preferred
Capital investment programme (estates, medical equipment & IT) & Treasury loan process
Director of SPCD
Management: Capital Planning Group Summary Report (at each finance committee meeting)
Positive
PFI management of estates & facilities Director of SPCD
Management: PFI Report (at each finance committee meeting) Positive Proximity
18/19 19/20 20/21 21/22 22/23
Primary risk controls Gaps in control or assurance framework Plans to improve control or assurance SLT lead Timescales
5 year long term financial model Working capital support through agreed loan arrangements Annual plan, including control total consideration; reduction of underlying financial deficit
and unwinding of the PFI benefit by £0.5m annually Engagement with the Better Together alliance programme Financial governance and performance arrangements in place at Trust, divisional and
service line levels and with contracted partners FIP Board, FIP planning processes and PMO coordination of delivery NHS Improvement monthly Performance Review Meeting (PRM) Delivery of budget holder training workshops and enhancements to financial reporting
2018/19 planning indicates £17.3m FIP required to achieve control total
C A full ‘wash up’ of portfolio planning, delivery and engagement conducted; recovery plan in place, Board approved & governance in place
C Deputy Chief Financial Officer
Complete
No long term commitment received for liquidity / cash support
C Continue to work in partnership with NHSI Distressed Finance Team to submit in year applications for cash support
C Deputy Chief Financial Officer
Ongoing
Premium pay costs associated with using temporary staff to cover medical vacancies
C Development & implementation of a Medical Pay Task Force action plan
C Deputy Chief Financial Officer
Complete
CCGs’ QIPP initiatives may reduce demand and therefore income at a faster rate than the Trust can reduce costs
c
Working within the agreed alliance framework and contracting structures to ensure the true cost of system change is understood and mitigated
C Deputy Director of Income & Performance
31/03/19
No change since 01/04/18

Board Assurance Framework (BAF): 2018/19 (October 2018)
Page 9 of 15
Key risk indicators (KRIs) As supplied 15th October 2018
Financial position against annual control total Income against plan Financial Improvement Plan (FIP) delivery against plan
Against control total excluding Provider Sustainability Funding (PSF) the Trust deficit in M6 of £3.8m was £0.11m better than plan.
Total operating income is £1.2m better than plan in M06 at £25.4m.
Cumulative FIP delivery of £4.5m was £1.7m below plan at M06.
CAPEX expenditure against plan Agency spend against NHSI ceiling Closing cash against plan
YTD Capex expenditure position at M06 was £2.6m, £1.0m below the capital plan of £3.6m. (Including Donated Assets)
Agency spend in M06 was £0.1m below the NHSI ceiling of £1.3m. The current forecast for 18/19 is £1.5m above the NHSI ceiling.
Closing cash at 30th September 2018 was £3.2m, £1.1m above planned level.

Board Assurance Framework (BAF): 2018/19 (October 2018)
Page 10 of 15
Strategic priority 3: TO INSPIRE EXCELLENCE Current risk exposure Tolerable risk
Lead Committee Quality
Principal risk (in the next 5 years)
PR 5: Fundamental loss of stakeholder confidence Prolonged adverse publicity or regulatory attention resulting in a fundamental loss of confidence in the Trust amongst regulators, partner organisations, patients, staff and the general public
Likelihood 2. Unlikely
1. Very unlikely Last reviewed 19/09/2018
Severity 5. Very high 5. Very high Last changed 15/10/2018
Risk rating 10. High 5. Low Details of change Updates assurances/ refreshed KRI’s
Strategic threat or opportunity Anticipated change
Risk appetite Risk treatment strategy Executive lead
Source of assurance (& date) Assurance rating
Threat: Failure to make sufficient progress on agreed quality improvement actions which support the Trust’s journey to outstanding
Stable Risk exposure not likely to increase
Cautious Low risk options are preferred
Advancing Quality Programme (AQP) Quality Strategy implementation
Medical Director
Management: AQP Programme report to QC (R) Monthly
Quarterly Strategic Priority Report to Board (R) July’18
Independent assurance: IA plan (Ref 9); Annual Inpatient Survey to QC (R) Sept ‘18
Positive Proximity
18/19 19/20 20/21 21/22 22/23
Threat: Failure to take account of shifts in public & stakeholder expectations resulting in unpopular decisions and widespread dissatisfaction with services with potential for sustained publicity in local, national or social media that has a long-term influence on public opinion of the Trust
Uncertain Risk exposure could increase if threat materialises
Cautious Low risk options are preferred
Continued public & stakeholder engagement utilising a wide range of consultation & communication channels; increasing social capital by taking advantage of good news stories to strengthen reputation Involvement & Engagement Strategy Trust Board.
Chief Executive / Head of Communications
Management: Quarterly Comms report to Board; bi-annual Forum for Public Involvement report to PQSG; Annual Patient Experience Report to QC (R) May’18; Involvement and Engagement Strategy (E) Board Oct ‘18 Independent assurance: IA plan (Ref 11); External Stakeholder Audit (Board workshop May’18 ; PI Forum June 18)
Positive
Proximity
18/19 19/20 20/21 21/22 22/23
Threat: Changing regulatory demands (including potential impact of Brexit) or reduced effectiveness of internal controls resulting in widespread instances of non-compliance with regulations and standards leading to breach of CQC Registration, Licence Conditions or other statutory obligations
Uncertain May increase risk exposure if gaps in control emerge
Minimal Insistence upon low risk options
Routine oversight of quality governance arrangements & maintenance of positive relationships with regulators
Medical Director/ Chief Nurse
Management: SOF Quality Indicators (Monthly); National Clinical audit programme/ Clinical Effectiveness Report to QC (R) May ‘18 Independent assurance: IA plan (Ref 16); CQC/ Well led assessment Good rating (R) Aug ’18; Quality Account (R) Board Sept ’18; CCG Quality Committee minutes (E) PSQG Jan ‘19
Positive
Proximity
18/19 19/20 20/21 21/22 22/23
Primary risk controls Gaps in control or assurance framework Plans to improve control or assurance SLT lead Timescales
Trust website & social media presence Internal communications channels Communications department to handle media relations: Forum for Public Involvement meeting Regular stakeholder engagement meetings Quality & corporate governance & internal control arrangements Established relationships with regulators Internal audit (360 Assurance)/External audit (PWC) Counter fraud arrangements / Local Counter Fraud Specialist (LCFS) Conflicts of interest & whistleblowing management arrangements Monthly Stakeholder newsletter launched August 2018
There is currently insufficient understanding of stakeholder confidence in the Trust and engagement needs strengthening
A
Stakeholder audit completed March 2018 (possibly to repeat every 12-18 months) - Development of action plan from audit (Apr/May) and implementation commenced. Monthly stakeholder updates commencing in Q2 18/19.
Key stakeholders to be engaged around the Trust’s Strategy which will be taking place Q2-Q3 18/19. Regular meetings with key stakeholders.
A Head of Communications
.
No change since 01/04/18

Board Assurance Framework (BAF): 2018/19 (October 2018)
Page 11 of 15
Key risk indicators (KRIs) As supplied 15th October 2018
CQC Rating Recommended Rate: Friends and Family Accident and Emergency Recommended Rate: Friends and Family Outpatients
Last Inspection: April 2018
Recommended Rate: Friends and Family Inpatients Recommended Rate: Friends and Family Maternity Recommended Rate: Friends and Family Staff
0.0
2.0
4.0
6.0
8.0
10.0
12.0
14.0
16.0
18.0
Sep
-16
Oct
-16
No
v-1
6
Dec
-16
Jan
-17
Feb
-17
Mar
-17
Ap
r-1
7
May
-17
Jun
-17
Jul-
17
Au
g-1
7
Sep
-17
Oct
-17
No
v-1
7
Dec
-17
Jan
-18
Feb
-18
Mar
-18
Ap
r-1
8
May
-18
Jun
-18
Jul-
18
Au
g-1
8
Sep
-18
Actuals Lower limit Upper limit Target National
80.0
85.0
90.0
95.0
100.0
105.0
Sep
-16
Oct
-16
No
v-1
6
Dec
-16
Jan
-17
Feb
-17
Mar
-17
Ap
r-1
7
May
-17
Jun
-17
Jul-
17
Au
g-1
7
Sep
-17
Oct
-17
No
v-1
7
Dec
-17
Jan
-18
Feb
-18
Mar
-18
Ap
r-1
8
May
-18
Jun
-18
Jul-
18
Au
g-1
8
Sep
-18
Actuals Lower limit Upper limit Target National
90.0
92.0
94.0
96.0
98.0
100.0
102.0
Sep
-16
Oct
-16
No
v-1
6
Dec
-16
Jan
-17
Feb
-17
Mar
-17
Ap
r-1
7
May
-17
Jun
-17
Jul-
17
Au
g-1
7
Sep
-17
Oct
-17
No
v-1
7
Dec
-17
Jan
-18
Feb
-18
Mar
-18
Ap
r-1
8
May
-18
Jun
-18
Jul-
18
Au
g-1
8
Sep
-18
Actuals Lower limit Upper limit Target National
80.0
85.0
90.0
95.0
100.0
105.0
Sep
-16
Oct
-16
No
v-1
6
Dec
-16
Jan
-17
Feb
-17
Mar
-17
Ap
r-1
7
May
-17
Jun
-17
Jul-
17
Au
g-1
7
Sep
-17
Oct
-17
No
v-1
7
Dec
-17
Jan
-18
Feb
-18
Mar
-18
Ap
r-1
8
May
-18
Jun
-18
Jul-
18
Au
g-1
8
Sep
-18
Actuals Lower limit Upper limit Target
40.0
45.0
50.0
55.0
60.0
65.0
70.0
75.0
80.0
85.0
90.0
Qtr
1 1
51
6
Qtr
2 1
51
6
Qtr
4 1
51
6
Qtr
1 1
61
7
Qtr
2 1
61
7
Qtr
4 1
61
7
Qtr
1 1
71
8
Qtr
2 1
71
8
Qtr
4 1
71
8
Qtr
1 1
81
9
Actuals Lower limit Upper limit Target
Board Assurance Framework (BAF): 2018/19 (October 2018)
Page 12 of 15
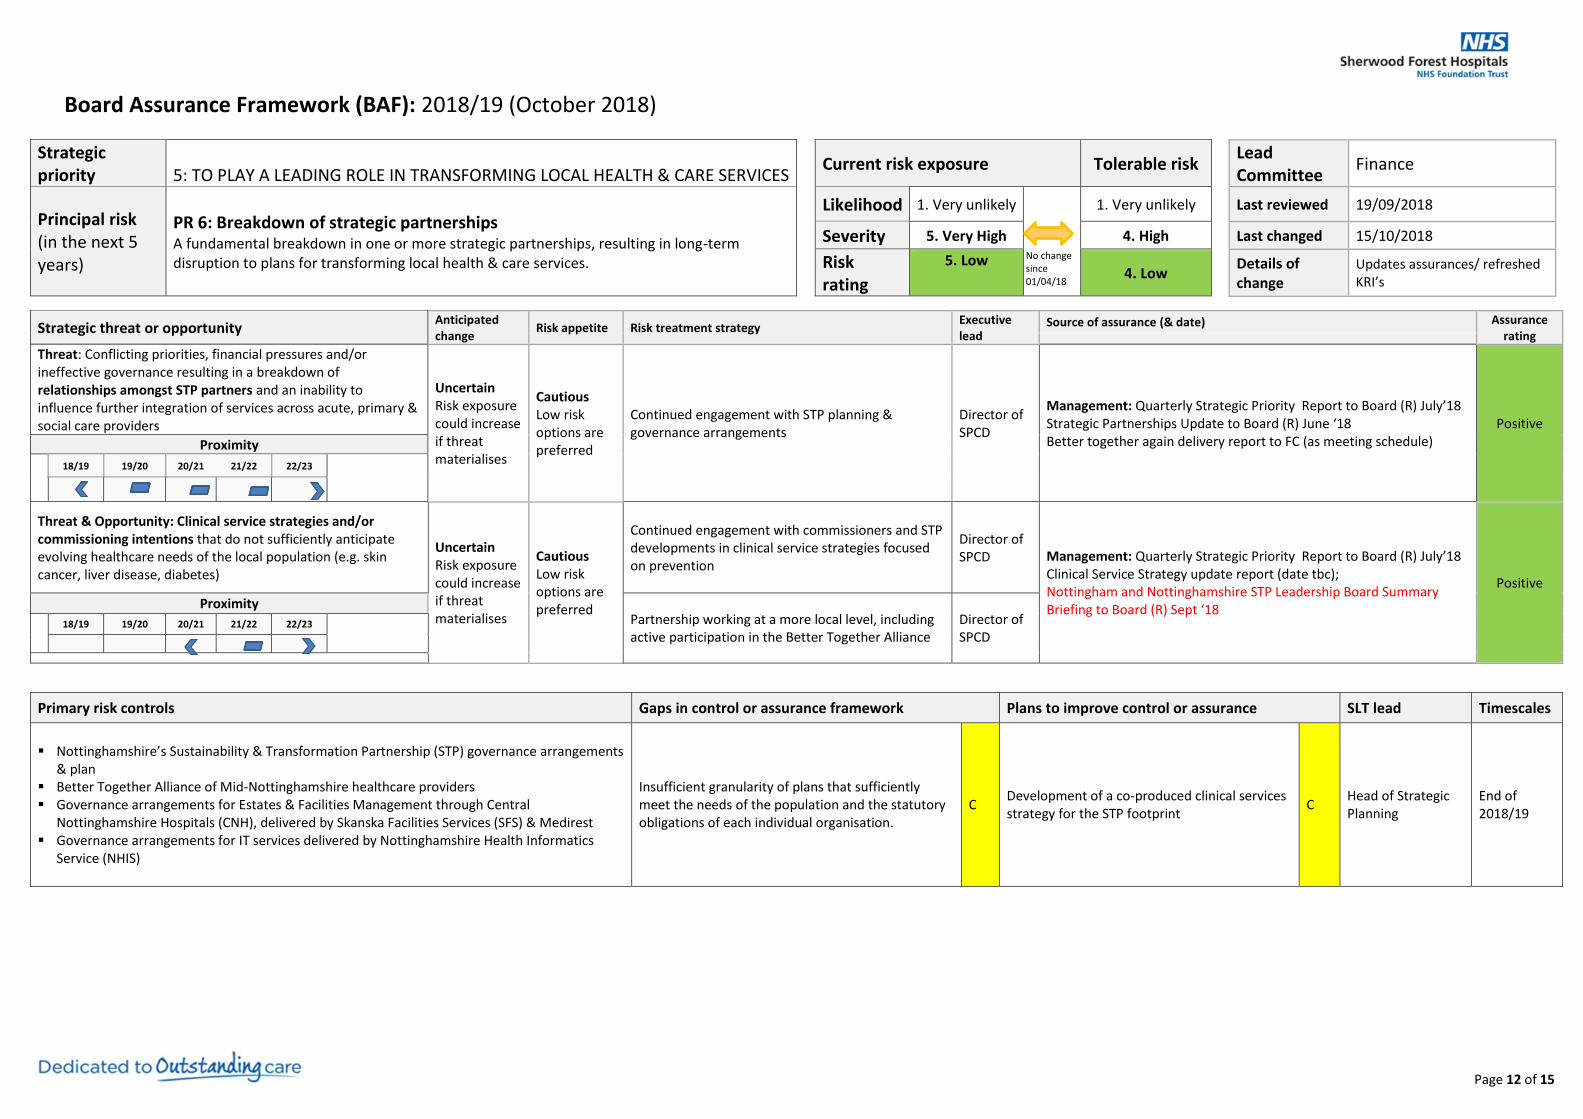
Strategic priority 5: TO PLAY A LEADING ROLE IN TRANSFORMING LOCAL HEALTH & CARE SERVICES
Current risk exposure Tolerable risk
Lead Committee
Finance
Principal risk (in the next 5 years)
PR 6: Breakdown of strategic partnerships A fundamental breakdown in one or more strategic partnerships, resulting in long-term disruption to plans for transforming local health & care services.
Likelihood 1. Very unlikely
1. Very unlikely Last reviewed 19/09/2018
Severity 5. Very High 4. High Last changed 15/10/2018
Risk rating
5. Low 4. Low
Details of change
Updates assurances/ refreshed KRI’s
Strategic threat or opportunity Anticipated change
Risk appetite Risk treatment strategy Executive lead
Source of assurance (& date) Assurance rating
Threat: Conflicting priorities, financial pressures and/or ineffective governance resulting in a breakdown of relationships amongst STP partners and an inability to influence further integration of services across acute, primary & social care providers
Uncertain Risk exposure could increase if threat materialises
Cautious Low risk options are preferred
Continued engagement with STP planning & governance arrangements
Director of SPCD
Management: Quarterly Strategic Priority Report to Board (R) July’18 Strategic Partnerships Update to Board (R) June ‘18 Better together again delivery report to FC (as meeting schedule)
Positive
Proximity
18/19 19/20 20/21 21/22 22/23
Threat & Opportunity: Clinical service strategies and/or commissioning intentions that do not sufficiently anticipate evolving healthcare needs of the local population (e.g. skin cancer, liver disease, diabetes)
Uncertain Risk exposure could increase if threat materialises
Cautious Low risk options are preferred
Continued engagement with commissioners and STP developments in clinical service strategies focused on prevention
Director of SPCD Management: Quarterly Strategic Priority Report to Board (R) July’18
Clinical Service Strategy update report (date tbc); Nottingham and Nottinghamshire STP Leadership Board Summary Briefing to Board (R) Sept ‘18
Positive
Proximity Partnership working at a more local level, including active participation in the Better Together Alliance
Director of SPCD
18/19 19/20 20/21 21/22 22/23
Primary risk controls Gaps in control or assurance framework Plans to improve control or assurance SLT lead Timescales
Nottinghamshire’s Sustainability & Transformation Partnership (STP) governance arrangements & plan
Better Together Alliance of Mid-Nottinghamshire healthcare providers Governance arrangements for Estates & Facilities Management through Central
Nottinghamshire Hospitals (CNH), delivered by Skanska Facilities Services (SFS) & Medirest Governance arrangements for IT services delivered by Nottinghamshire Health Informatics
Service (NHIS)
Insufficient granularity of plans that sufficiently meet the needs of the population and the statutory obligations of each individual organisation.
C Development of a co-produced clinical services strategy for the STP footprint
C Head of Strategic Planning
End of 2018/19
No change since 01/04/18

Board Assurance Framework (BAF): 2018/19 (October 2018)
Page 13 of 15
Key risk indicators (KRIs) As of 15th October 2018
STP Partners current CQC Rating – Nottingham University Hospitals STP Partners current CQC Rating – Nottinghamshire Healthcare STP Partners current CQC Rating – Nottingham CityCare Partnership
March 2016:
February 2018:
March 2017:

Board Assurance Framework (BAF): 2018/19 (October 2018)
Page 14 of 15
Strategic priority 5: TO PLAY A LEADING ROLE IN TRANSFORMING LOCAL HEALTH & CARE SERVICES
Current risk exposure Tolerable risk
Lead Committee
Risk
Principal risk (in the next 5 years)
PR 7: Major disruptive incident A major incident resulting in temporary hospital closure or a prolonged disruption to the continuity of core services across the Trust, which also impacts significantly on the local health service community
Likelihood 2. Unlikely
1. Very unlikely Last reviewed 05/10/2018
Severity 5. Very high 5. Very high Last changed 16/10/2018
Risk rating
10. High 5. Low Details of change
Updates assurances/ refreshed KRI’s – Addition of built environment as threat
Strategic threat or opportunity Anticipated change
Risk appetite Risk treatment strategy Executive lead
Source of assurance (& date) Assurance rating
Threat: A large-scale cyber-attack that shuts down the IT network and severely limits the availability of essential information for a prolonged period
High certainty Increased risk exposure if gaps in control are not addressed
Cautious Low risk options are preferred
Information Governance Assurance Framework (IGAF) & NHIS Cyber Security Strategy Cyber Security Programme Board & Cyber Security Project Group and work plan
Medical Director
Management: AQP Programme report to QC (R) Monthly
Quarterly Strategic Priority Report to Board (R) July’18; Cyber Security Board Responsibilities Paper ® Board Sept ‘18
Independent assurance: IA plan (Ref 9); Annual Inpatient Survey to QC (R) Sept’18
Positive Proximity
18/19 19/20 20/21 21/22 22/23
Threat: A critical infrastructure failure caused by an interruption to the supply of one or more utilities (electricity, gas, water), an uncontrolled fire or security incident or failure of the built environment of services that renders a significant proportion of the estate inaccessible or unserviceable, disrupting services for a prolonged period
Stable Risk exposure not likely to increase
Minimal Desire to reduce risk to as low as possible
Premises Assurance Model Action Plan Estates Strategy 2015-2025 PFI Contract
Director of SPCD
Management: Central Nottinghamshire Hospitals plc monthly performance report (R) Estates Governance Group Sept ’18; Estates Governance work programme to RC (R) June ‘18 Risk & Compliance: Independent Assurance: Premises Assurance Model to RC (E) Dec ‘18
Fire Safety Strategy Director of SPCD
Risk & Compliance: Fire Safety Annual Report to RC (R) Sept ‘18 Independent assurance: Plan (Ref 3)
Positive
Proximity Emergency Planning, Resilience & Response (EPRR) arrangements & Compliance with EPRR Core Standards
Director of SPCD
Risk & Compliance: EPRR Report ;EPRR Core standards compliance rating (Sept ‘18) Independent assurance: Plan (Ref 3)
Positive 18/19 19/20 20/21 21/22 22/23
Threat: A critical supply chain failure (including the potential impact of Brexit on suppliers) that severely restricts the availability of essential goods, medicines or services for a prolonged period
Uncertain May increase risk exposure if gaps in control are not addressed
Cautious Low risk options are preferred
NHS Supply Chain resilience planning Business Continuity Management System & Core standards
Director of SPCD
Management: Procurement Report to RC (E) Aug ‘18 Independent assurance: Plan (Ref 3)
Positive Proximity
18/19 19/20 20/21 21/22 22/23
Primary risk controls Gaps in control or assurance framework Plans to improve control or assurance SLT lead Timescales
Emergency Preparedness, Resilience & Response (EPRR) arrangements at regional, Trust, division and service levels
Operational strategies & plans for specific types of major incident (e.g. industrial action; fuel shortage; pandemic disease; power failure; severe winter weather; evacuation; CBRNe)
Gold, Silver, Bronze command structure for major incidents Business Continuity, Emergency Planning & security policies Resilience Assurance Committee (RAC) oversight of EPRR Estates Governance arrangements with PFI Partners Cyber news – circulated to all NHIS partners
Operational resilience of the Central Sterile Services Department (CSSD)
C CSSD options appraisal being carried out through the Strategic Partnership Board
C Divisional General Manager - Surgery
End of 2018/19
Lack of port control presenting risk to network security
C Development of white list and restriction imposed on unauthorised devices
C Head of Corporate Affairs
31 Dec 2018

Board Assurance Framework (BAF): 2018/19 (October 2018)
Page 15 of 15
Key risk indicators (KRIs) As supplied 16th July 2018
EPRR Core Standards Nottingham & Nottinghamshire local resilience forum Community Risk Register (risk rating for local hazards) – Risks rated high/ very high
Confirm and Challenge by NHS England Regional team and CCGs September 2017:
Full Compliance
Substantial Compliance
Partial Compliance Not Compliant
Version 6.9 May 2018
Rel
ati
ve im
pa
ct
Catastrophic (5)
High Very High Very High Very High Very High
Significant (4)
Medium High Very High Local/urban flooding
Technical failure of national electricity network
Very High Influenza type disease
Very High
Moderate (3)
High Railway accident
Low temperature and heavy snow
Outbreak of exotic notifiable disease in animals
Constraint on fuel supply – Industrial action
Failure of water infrastructure
Heat wave
High Major contamination incident
with widespread implications
High
Low (1)
Medium Low (2)
Medium (3)
Medium High (4)
High (5)
Relative Likelihood
Cyber security measures – NHIS Hygiene report (all clients) Cyber security measures - NHIS Hygiene report (all clients) Cumulative fire alarm calls per year