BNSF Railway Overview
35
BNSF Railway Overview 2013 National Highway-Rail Grade Crossing Safety Training Conference November 4, 2013
Transcript of BNSF Railway Overview

BNSF Railway Overview 2013 National Highway-Rail Grade Crossing Safety Training Conference
November 4, 2013

BNSF Railway Overview
2
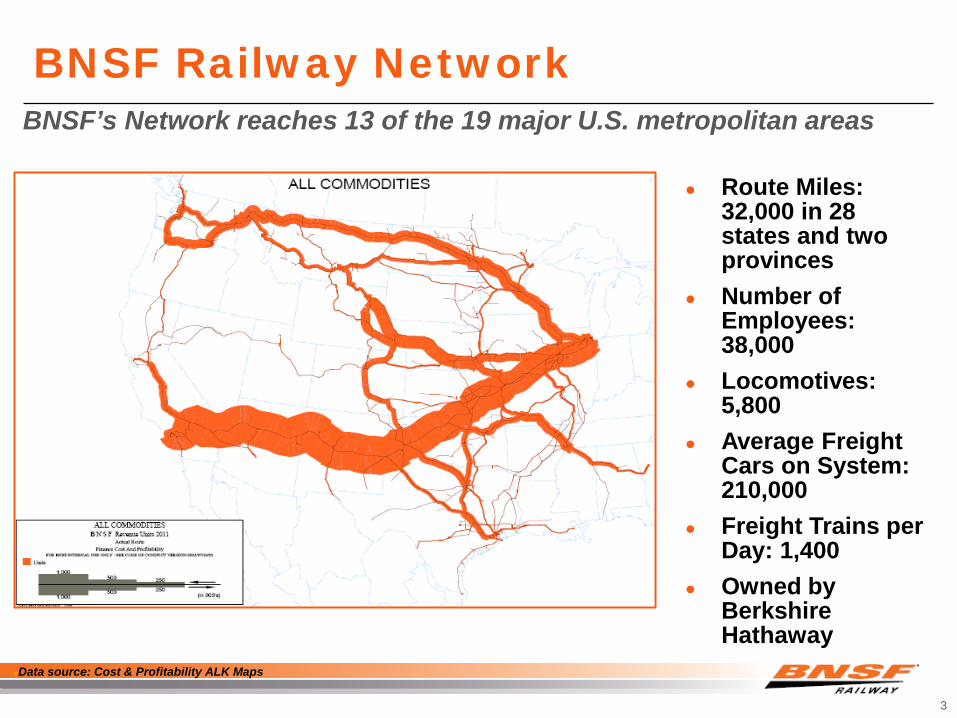
BNSF Railway Network
Data source: Cost & Profitability ALK Maps
3
Route Miles: 32,000 in 28 states and two provinces
Number of Employees: 38,000
Locomotives: 5,800
Average Freight Cars on System: 210,000
Freight Trains per Day: 1,400
Owned by Berkshire Hathaway
BNSF’s Network reaches 13 of the 19 major U.S. metropolitan areas

BNSF Yearly Volumes
9,661
2006 2007 2008 2009 2010 2011 2012F*
Actual Peak 2006:
10,637 Thousands
BNSF volumes have slowly climbed back after the decline that began in 2006
10,318 9,994
8,418
9,157 9,458
4

5
BNSF’s Passenger Service
Empire Builder Minneapolis/Seattle/Portland
2 Daily Trains
California Zephyr Chicago/Denver
2 Daily Trains
Glendive
Winnipeg
Duluth
Vancouver BC
Brownsville
San Diego
Eagle Pass
Iowa Jct
Birmingham
East St.Louis
Chicago
Galesburg
Paducah
Galveston Avondale (New Orleans)
Mobile
Laredo
Houston
Kansas City
Billings
El Paso
Denver Omaha
Sioux City
Lincoln
Oklahoma City
Gillette
Fargo Minneapolis/St.Paul
Tulsa Los Angeles San Bernardino
Port Chicago
Bieber
Keddie
Portland Helena
Spokane Tacoma
Seattle Havre
Phoenix
Albuquerque
Stockton
Bakersfield
Dallas/Ft.Worth
Memphis
Springfield
BNSF Amtrak
Temple
Richmond San Joaquins
Port Chicago/Stockton /Bakersfield
12 Daily Trains
Vancouver WA
Pacific Surfliners Fullerton/Soto
22 Daily Trains Mon-Thu 24 Daily Trains Fri-Sun
Illinois Zephyr Chicago/Quincy 4 Daily Trains
Quincy
Canadians Seattle/Vancouver
4 Daily Trains
Texas Eagle Ft Worth/Opal Junction
2 Daily Trains
Opal Jct
Iowa Jct/Avondale
2 trains Tri Weekly
PNW Seattle – Portland
10 Daily Trains
Heartland Flyer Oklahoma City/Ft Worth
2 Daily Trains
Southwest Chief Chicago/Los Angeles
2 Daily Trains
BNSF also provides extensive passenger and commuter service

BNSF Safety Overview
6

7.3
6.1
5.2
4.9
3.5
3.0
1.7
1.1
Air transportation
Primary metal manufacturing
Transportation equipment manufacturing
Truck transportation
Heavy and civil engineering construction
Mining (except oil and gas)*
Rail Transportation
BNSF
Injury Rates for Selected Industries
Injury Rate per 200,000 Employee Hours
2012 BNSF & Rail Transportation Reportable Rates/ 2011 Industry Results . Sources: US Bureau of Labor Statistics, Federal Railroad Administration, *Mine Safety and Health Administration
Overall, the rail industry is a safe industry…..

Safety Vision
8
BNSF will achieve this vision through:
A culture that makes safety our highest priority and provides continuous self-examination as to the effectiveness of our safety process and performance.
A work environment, including the resources and tools, that is safe and accident free where all known hazards will be eliminated or safe-guarded.
Work practices and training for all employees that make safety essential to the tasks we perform.
An empowered work force, including all employees, that takes responsibility for personal safety, the safety of fellow employees, and the communities in which we serve.
We believe every accident or injury is preventable. Our vision is that BNSF will operate free of accidents and injuries.

2013 data through Oct 20 as of 10/28/13
Reportable injuries only – Type “A” person
Safety Results
2.02
1.77
1.30 1.11 1.05
2009 2010 2011 2012 2013 YTD
Frequency Ratio
0
5
10
15
20
25
2009 2010 2011 2012 2013 YTD
Employee Fatalities & Life Altering Serious Injuries
Fatalities Most Serious Injuries
72.33 61.64
42.81 32.34
24.06
2009 2010 2011 2012 2013 YTD
Combined Severity Ratio
0.77 0.73 0.88 0.73 0.64
0.70 0.72 0.70 0.58 0.50
0.32 0.34 0.34 0.19
0.17
0.40 0.39 0.40
0.38 0.42
2.18 2.18 2.32 1.88 1.73
2009 2010 2011 2012 2013 YTD
Transportation Engineering Mechanical MiscReportable Rail Equipment Incidents

10
Reducing Exposure in our Work Environment There are multiple ways to change behaviors to reduce exposure…
Changing Behaviors to
Reduce Exposure / Risk
Employee-to-Employee Relationships
Employees taking accountability for their own personal safety & the safety of their
co-workers
Supervisor / Employee Relationship
Identification of Exposure & Accountability Feedback & Recognition
Significant Events Serious Personal / Co-Worker Injury

11

12
Approaching Others About Safety is…
• The willingness to speak up about safety and exposure,
• Giving acknowledgement to people who are working safely,
• Expressing concerns when they put themselves at risk
©2012 BST. All rights reserved. Confidential information

13
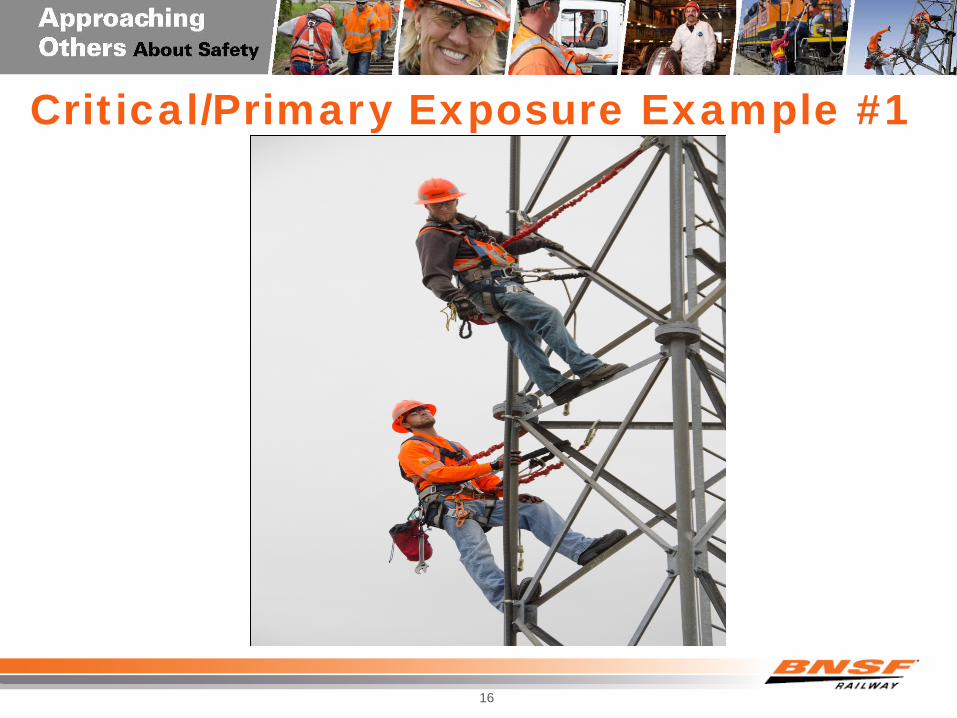
Approaching Others About Safety

14
Exposure Exposure is the state of being at risk to an
undesired outcome.
Being exposed or at risk doesn’t mean an
incident will happen; it means there is a
possibility it could happen.
©2012 BST. All rights reserved. Confidential information

15 ©2012 BST. All rights reserved. Confidential information
16
Critical/Primary Exposure Example #1

17
Critical/Primary Exposure Example #2

18
3 Most Crucial Times to Speak Up
1. When you recognize that someone is working safely.
2. When you recognize someone is at risk, even if they are not in imminent danger.
3. When you perceive that risk has gone up and you are concerned it has been unnoticed or not considered.
©2012 BST. All rights reserved. Confidential information

19
“ACT” Model
A – Approach the person respectfully
C – Consider the Critical or Primary exposure: discuss the specific behavior and related exposure
T – Thank them for listening
©2012 BST. All rights reserved. Confidential information

20
Example - ACT

21
Words That Can Trigger a Negative Response
But Wrong Rule Violation Bad Failure Unsafe Discipline
©2012 BST. All rights reserved. Confidential information
Words or Phrases That Are Helpful
May I? Concern At risk Exposure Thank you
©2012 BST. All rights reserved. Confidential information

22
Example - ACT

23
Things to Consider When Receiving Feedback If a person takes the time to point out an exposure, it means
he/she wants you to work safely and return home at the end of the day. It is about you, not them.
The person pointing out the exposure is not going to be perfect in how he/she approaches you or with the words he/she uses. Be forgiving.
If someone you care about deeply is at risk and someone notices the behavior, should this person say something? Why doesn’t this same rule apply to you? Someone cares about you the same way.
©2012 BST. All rights reserved. Confidential information

24
Closing Video

BNSF Public Safety Overview
25

In 2012, 95% of rail-related fatalities were grade crossing users or trespassers.
26
Trespassers: 442 (61.8%)
Grade Crossing Users: 238 (33.3%)
Employees: 17 (2.4%) Passengers: 5 Others: 13
Source: FRA website (2012 data): http://safetydata.fra.dot.gov/OfficeofSafety/publicsite/summary.aspx

Grade crossing collision rates have declined 82% since 1980 and 46% since 2000.
27 11/22/2013
0
4
8
12
16
1980 1985 1990 1995 2000 2005 2010
Sources: http://safetydata.fra.dot.gov/officeofsafety/publicsite/summary.aspx (2012 data). FRA, Railroad Safety Statistics Annual Report, 1997-2010, Table 1-1. FRA Highway/Rail Crossing Accident/Incident & Inventory Bulletin, 1980-1996, Table S. Note: Includes accidents involving pedestrians and collisions at private crossings. Data for 2012 are preliminary.
14.79
9.39
2.64
Grade Crossing Collisions per Million Train-Miles
4.84

Since 1980, the total number of public crossings has declined 39%, while the
number with gates has increased 174%.
28 11/22/2013
0
50,000
100,000
150,000
200,000
250,000
1980 2011
Sources: AAR Analysis of March 2012 FRA Grade Crossing Inventory Database. FRA, Railroad Safety Statistics Annual Report 2009, Table 9-3. FRA Highway/Rail Crossing Accident/Incident & Inventory Bulletin, 1980, Table 46.
39% Decrease
Passive 75% Passive 49%
Lights 17% Lights 17%
Gates 8% Gates 34%

In 2011, 48% of all grade crossing collisions and 65% of all fatal grade crossing
collisions occurred at gated crossings.
29 11/22/2013
0200400600800
1,0001,2001,4001,6001,800
All Collisions 2011 Fatal Collisions 2011
Sources: AAR Analysis of March 2012 FRA Highway-Rail Crossing Incident Database. FRA, Railroad Safety Statistics Annual Report 2010, Table 7-9 for 2010 statistics. Note: All U.S. Railroads. All Collisions at Public Highway-Rail Crossings.
Passive 34%
Passive 22%
Lights 18%
Lights 14% Gates 48%
Gates 65%

Trespasser fatalities continue to be a significant safety problem.
30 11/22/2013
0
300
600
900
1,200
1980 1985 1990 1995 2000 2005 2010
Sources: http://safetydata.fra.dot.gov/officeofsafety/publicsite/summary.aspx (2012 data). FRA, Railroad Safety Statistics Annual Report, 1997-2010, Tables 1-2, 10-3. FRA Accident/Incident Bulletin, 1980-1996, Table 13. Note: Excludes "trespasser" fatalities at grade crossings. Data for 2012 are preliminary.
457
543
442 463
Total Trespasser Casualties
Trespasser Fatalities
847

BNSF Public Safety Overview
1.371.571.63
1.751.61
0.50
0.810.95
0.800.81
2009 2010 2011 2012 2013 YTD
Grade Crossing Collisions Trespasser Casualties
Incidents Per Million Train Miles • Grade crossing: • Compliance • Technology • Education • Elimination
• Trespasser:
• Education • Enforcement

BNSF Public Safety Leadership
32
Director Steven Neubauer
Director, Grade Crossing Safety
2600 Lou Menk Drive OOB-1 Fort Worth, TX 76131
O-(817) 352-1204 C-(303) 570-3092 F-(817) 352-7599
System Gene Biddle
System Coordinator
2600 Lou Menk Drive OOB-1 Fort Worth, TX 76131
O-(817) 352-1211 C-(817) 851-9952 F-(817) 352-7898
Tim Stipp System Coordinator
8183 Hwy E, Box 260 Granby, MO 64844
O-(417) 472-6911 C-(417) 437-2189 F-(417) 472-7005
Regional Managers 1
Ronnie Garcia Regional Manager 1, Field Safety
1975 Essex Ct. Redlands, CA 92373
O-(909) 386-4015 C-(909) 213-9363 F-(909) 386-4843
2
Thomas Micek Regional Manager 2, Field Safety
1021 Brentwood Hastings, NE 68901
O-(402) 460-2317 C-(402) 469-0759
3
Denise Gauthier Regional Manager 3, Field Safety
1625 N. Lexington Springfield, MO 65802
O-(417) 829-3982 C-(909) 560-4004
4
Phil Foster Regional Manager 4, Field Safety
4901 Sugarlake Road Fort Worth, TX 76103
O-(817) 352-2795 C-(817) 313-8204 F-(817) 457-5716

BNSF Progress Tracking
Visible tracking across a variety of inputs and outputs:
- Grade Crossing Incidents - Trespasser Incidents - Training
- Operation Lifesaver - Law Enforcement
- Crossing Closure
33

BNSF Communication and Outreach
Community Information: - BNSF’s Approach - Federal Grade Crossing
Safety Program - Community Education - Law Enforcement - Awareness - Grade Crossing
Consolidation - Track and Signal
Inspection and Maintenance
- Vegetation Control
34

Vision: • We believe every accident or injury is preventable. Our
vision is that BNSF Railway will operate free of accidents and injuries.
Focus: • Approaching others about safety • Continued focus on identifying and eliminating at-risk
behaviors • Leadership development • Targeted technology implementation • Improved training and education • Improved relationship, outreach and communication efforts
BNSF Safety BNSF will aggressively continue implementation of these programs in order to make further progress in this critical area