BNM Annual Report 2010 & Financial Stability and Payment Systems Report 2010 · 2014-12-10 · BNM...
42
1 by Dato' Muhammad bin Ibrahim Deputy Governor 23 March 2011 BNM Annual Report 2010 & Financial Stability and Payment Systems Report 2010 Briefing to Analysts & Fund Managers
Transcript of BNM Annual Report 2010 & Financial Stability and Payment Systems Report 2010 · 2014-12-10 · BNM...

1
byDato' Muhammad bin Ibrahim
Deputy Governor
23 March 2011
BNM Annual Report 2010 & Financial Stability and Payment
Systems Report 2010
Briefing to Analysts & Fund Managers

2
Briefing to cover:
• Economic and financial developments in 2010
• Prospects for 2011
• Policy Direction

3
Malaysian economy expanded strongly by 7.2% in 2010
• Growth driven mainly by robust domestic demand and primarily by private sector activity
• Public sector continued to play a crucial role in supporting the domestic economy in 2010
• External demand, which rebounded strongly in the first half of the year, moderated in the second half-year in tandem with the moderation in global trade
Annual change (%) 2009 2010p
Domestic demand -0.5 6.3
Private consumption 0.7 6.6
Public consumption 3.1 0.1
Gross fixed capital formationPrivate investmentPublic investment
-5.6-17.28.0
9.413.85.5
Net exports 5.0 -24.2
Exports of G&S -10.4 9.8
Imports of G&S -12.3 14.7
Real GDP -1.7 7.2
Source: Department of Statistics, Malaysia
p preliminary

4
Strong growth in all sectors, in line with the robust
domestic demand and rebound in exports
Annual change (%) 2009 2010p
Agriculture 0.4 1.7
Mining -3.8 0.2
Manufacturing -9.4 11.4
Construction 5.8 5.2
Services 2.6 6.8
Real GDP -1.7 7.2
Source: Department of Statistics, Malaysia
p preliminary

5
2009 2010p
RM billionCurrent Account 112.1 90.5
% of GNI 17.5 12.2Goods 141.7 136.6Services 4.7 0.9Income -14.6 -25.2Capital Account -0.2 -0.2Financial Account -80.2 -21.9
Direct Investment -22.9 -15.0In Malaysia 5.0 27.6Abroad -27.9 -42.6
Portfolio Investment -1.7 44.9Financial Derivatives 2.5 -0.8Other Investment -58.1 -51.1
E & O -17.9 -71.1Rev. Gain (+)/Loss (-) 10.7 -32.6
Overall Balance 13.8 -2.6Reserves (USD billion equivalent)
331.396.7
328.6106.5
… negligible e/ estimate
Overall balance of payments remained strong in 2010
• Current account surplus narrowed to 12.2% of GNI
• Financial account recorded smaller net outflow due to higher portfolio and FDI inflows
• Reserves remained high at USD110.4 billion at 15 March 2011
p preliminary Source: Department of Statistics, Malaysia

6
Higher foreign direct investment and direct investment abroad in 2010
• Higher FDI inflows
- Improved global and domestic economic conditions
- Better corporate earnings
-5
5
15
25
35
45
55
2008 2009 2010p
RM billion
• Direct investment abroad (DIA) was also higher
- Malaysian companies continued to tap profitable opportunities in other regions
- Outflows into services, oil and gas and manufacturing
… negligible e/ estimate
Source: Department of Statistics, Malaysia
p preliminary
Net FDI
Net DIA
7
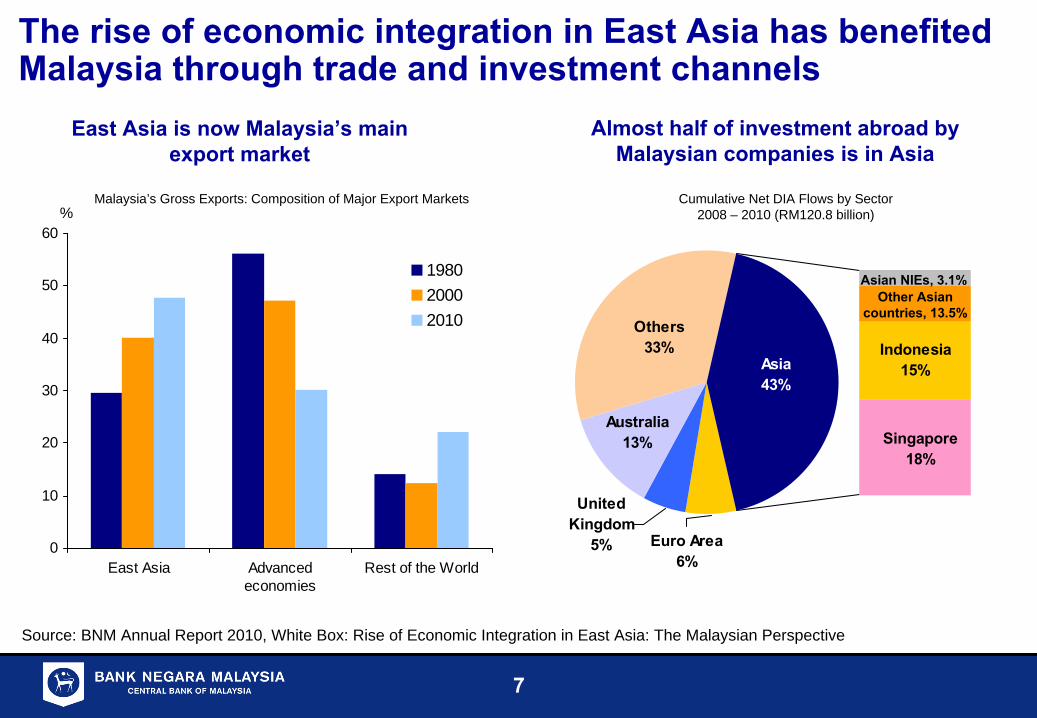
The rise of economic integration in East Asia has benefited Malaysia through trade and investment channels
Others33% Indonesia
15%
Singapore18%
Euro Area6%
United Kingdom
5%
Australia13%
Asia43%
0
10
20
30
40
50
60
East Asia Advancedeconomies
Rest of the World
%
198020002010
Almost half of investment abroad by Malaysian companies is in Asia
East Asia is now Malaysia’s main export market
Malaysia’s Gross Exports: Composition of Major Export Markets
Source: BNM Annual Report 2010, White Box: Rise of Economic Integration in East Asia: The Malaysian Perspective
Other Asian countries, 13.5%
Asian NIEs, 3.1%
Cumulative Net DIA Flows by Sector 2008 – 2010 (RM120.8 billion)

8
External debt remained low
• External debt declined to RM226.3 billion (equivalent to 30.2% of GNI)
• Lower medium- and long- term debt due to:
- revaluation gains following appreciation of ringgit and;
- net repayment position of the private sector
• Short-term debt increased but remains manageable
end-Dec 2009
end-Dec 2010
RM billionTotal External Debt 233.1 226.3
(USD bn equiv.) 67.4 72.6
Medium- and long-term 155.4 146.9
Short-term 77.8 79.4
%
External Debt/GNI 35.1 30.2
Short-Term Debt /Reserves 23.5 24.2
… negligible e/ estimate
Source: Ministry of Finance, Malaysia and Bank Negara Malaysia

9
Labour market conditions improved in 2010 following
strong gains in employment
239179
44
153
3.2
3.73.33.2
0
50
100
150
200
250
300
2007 2008 2009 2010e0
1
2
3
4
Net job creation Unemployment rate (RHS)
No. of jobs ('000) % of labour force
Source: Economic Planning Unit and Ministry of Human Resources
Higher net job creation & lower unemployment rate in 2010
While retrenchments declined significantly
0
5
10
15
20
25
30
2007 2008 2009 2010
Total retrenchments Mfg Non-mfg
Person (‘000)

10
Inflation was modest in 2010
Contribution to Inflation
-2 -1 0 1 2
All Items
Food & non-alco bev
Transport
Housing, water, elec, gas
Misc. goods & services
Alco bev & tobacco
Recreation serv & culture
Restaurants & hotels
Education
Furnishings & household eq.
Health
Communication
Clothing & footwear
percentage points
2009
2010
• Inflation edged to 1.7% in 2010 (2009: 0.6%), reflecting increases in the food and transport
Malaysia CPI, %
-15
-10
-5
0
5
10
15
20
Jul-0
7
Oct
-07
Jan-
08
Apr-
08
Jul-0
8
Oct
-08
Jan-
09
Apr-
09
Jul-0
9
Oct
-09
Jan-
10
Apr-
10
Jul-1
0
Oct
-10
Annual growth, %
Headline inflation
Core inflation
Supply-related inflation

11
Financing conditions expected to remain favourable
Net financing growth sustained…
3
6
9
12
15
Jan-
09
Mar
-09
May
-09
Jul-0
9
Sep
-09
Nov
-09
Jan-
10
Mar
-10
May
-10
Jul-1
0
Sep
-10
Nov
-10
Annual change (%)
Loan growth: 12.7%
Net financing growth: 11.3%
Total Financing
30
40
50
60
70
80
90
100
Q1 Q2 Q3 Q4 Q1 Q2 Q3 Q4
BusinessesHouseholds
Loans Applications by Businesses and Households
RM billion
20102009
…supported by robust demand for loans from businesses and households

12
Domestic equity market had sustained growth in line with regional trends
KLCI and Bursa Malaysia sectoral indices
80
100
120
140
160
180
200
220
Jan-
09M
ar-0
9
May
-09
Jul-0
9
Sep
-09
Nov
-09
Jan-
10M
ar-1
0M
ay-1
0
Jul-1
0
Sep
-10
Nov
-10
Jan-
11M
ar-1
1
Index (Jan 2009=100)
Finance
Industrial
KLCI
Plantation
Construction
Performance of Major Indices (% growth)
87.0
63.2
63.0
49.7
45.2
23.5
64.5
78.3
22.1
52.0
19.0
46.1
40.6
37.6
21.9
19.3
12.8
10.1
9.6
9.0
5.3
-3.0
-20 0 20 40 60 80 100
Indonesia
Thailand
Philippines
Korea
Msia
US
Singapore
Taiwan
UK
HK
Japan
%
2010
2009
13
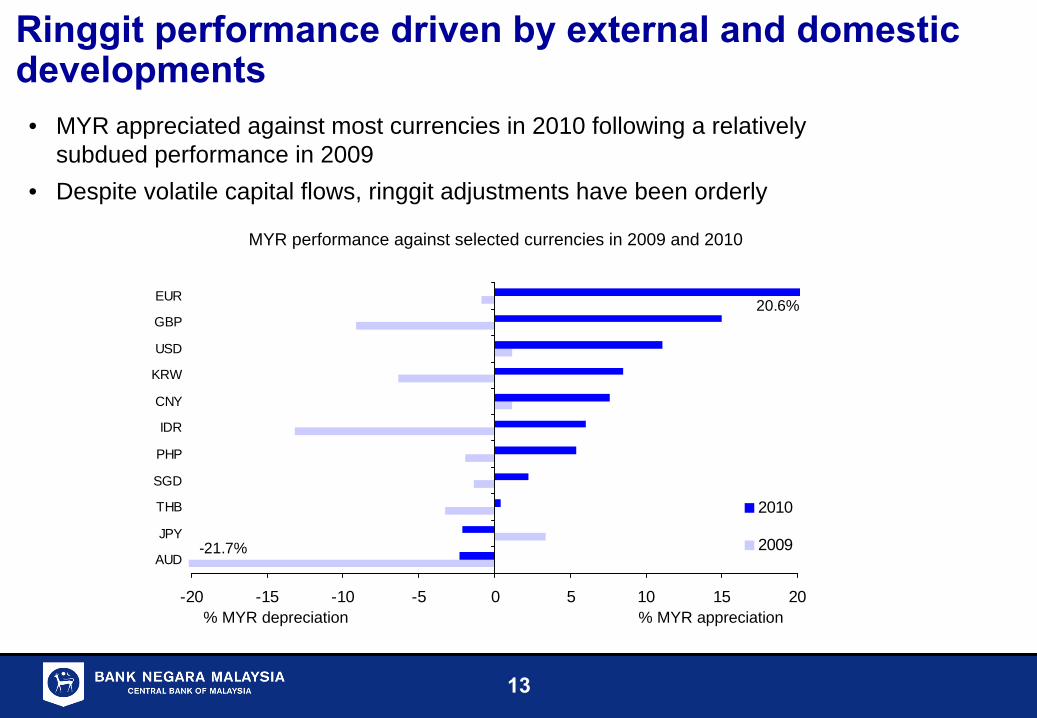
-20 -15 -10 -5 0 5 10 15 20
AUD
JPY
THB
SGD
PHP
IDR
CNY
KRW
USD
GBP
EUR
2010
2009-21.7%
20.6%
Ringgit performance driven by external and domestic developments• MYR appreciated against most currencies in 2010 following a relatively
subdued performance in 2009• Despite volatile capital flows, ringgit adjustments have been orderly
MYR performance against selected currencies in 2009 and 2010
% MYR appreciation% MYR depreciation

14
The impact of ringgit appreciation on the economy has been manageable
0%
5%
10%
15%
20%
25%
30%
35%
40%
Favourable Neutral Unfavourable0%
5%
10%
15%
20%
25%
30%
35%
40%
Favourable Neutral Unfavourable
Quarterly sectoral
survey* 4Q 2010Impact of ringgit appreciation on profit margins
Impact on profit margin thus far Impact on profit margin if ringgit appreciates further
* Based on a survey of 177 companies, of which 109 are manufacturing, 43 non-financial services and 25 Constructions

15
Measures undertaken to allow more efficient management of foreign financial transactions
To allow more efficient management of foreign transactions, several measures have been undertaken, including:
• Allow settlements in local currencies
• Facilitate hedging activities by residents
• Allow unlimited holding of foreign currency accounts
• Allow settlement of transactions in foreign currency by exporters and importers

16
Prospects for 2011

17
Global growth projection for 2011
Challenge for global economy going into 2011 is sustaining growth with job creation
Source: National authorities, IMF World Economic Outlook, January 2011 Update
2009 2010 2011f
Annual change (%)
World GDP -0.6 5.0 4.4World Trade -10.7 12.0 7.1
US -2.6 2.8 3.0
Euro area -4.1 1.7 1.5
Japan -6.3 3.9 1.6
Developing Asia 1/ 7.0 9.3 8.4
China 9.2 10.3 9.6
ASEAN-5 2/ 1.7 6.7 5.5
Note: Forecasts for 2011 are IMF’s projections1/ IMF: Asia ex-NIEs2/ IMF: Indonesia, Malaysia, Philippines, Thailand and Vietnam
• Significant improvement in 2010
• Continued recovery in advanced economies although growth remains slow
• Strong growth in emerging economies, particularly in Asia underpinned by domestic demand and recovery in world trade
• More recently, rising commodity and energy prices are leading to higher global inflation

18
Global growth mainly from EMEs in 2011
-4-3-2-1012345678
1980
1981
1982
1983
1984
1985
1986
1987
1988
1989
1990
1991
1992
1993
1994
1995
1996
1997
1998
1999
2000
2001
2002
2003
2004
2005
2006
2007
2008
2009
2010
2011
f
-80-60-40-20020406080100120140160Advanced economies EM: Africa
EM: Asia EM: Eastern EuropeEM: Middle East EM: Latin AmericaEM: CIS EME contribution to global growth (RHS)
Contribution to world growth, p.p. share of world growth. %
Source: IMF World Economic Outlook Note: CIS is the Commonwealth of Independent States, formerly Soviet republics
While accounting for 47% of global economy, emerging economies expected to contribute more than 70% of global growth

19
3
5
7
9
11
Dec
-07
Mar
-08
Jun-
08S
ep-0
8D
ec-0
8M
ar-0
9Ju
n-09
Sep
-09
Dec
-09
Mar
-10
Jun-
10S
ep-1
0D
ec-1
0
0
1
2
3
4
5
6
US Euro area UK Japan (RHS)
%%-14
-12
-10
-8
-6
-4
-2
0
22001 2003 2005 2007 2009
-12
-10
-8
-6
-4
-2
0
% of GDP % of GDP
Advanced economies still need to address structural problems
-10
-5
0
5
10
15
Dec
-07
Mar
-08
Jun-
08S
ep-0
8D
ec-0
8M
ar-0
9Ju
n-09
Sep
-09
Dec
-09
Mar
-10
Jun-
10S
ep-1
0D
ec-1
0
-4
-3
-2
-1
0
1
2
3
4
5
6%%
Restrained credit conditionsHigh unemployment rate High fiscal deficit1 32
Source: National authorities, Haver, IMF
Unemployment rate (%) Fiscal deficit, % of GDP Credit to private sector, growth

20
0
1
2
3
4
5
6
Dec
-07
Mar
-08
Jun-
08S
ep-0
8D
ec-0
8M
ar-0
9Ju
n-09
Sep
-09
Dec
-09
Mar
-10
Jun-
10S
ep-1
0D
ec-1
0
Index
0
1
2
3
4
5
6
7Index
Korea Singapore Hong KongChina C. Taipei (RHS) Thailand (RHS)
-30
-20
-10
0
10
20
30
40
50
Dec
-07
Apr
-08
Aug
-08
Dec
-08
Apr
-09
Aug
-09
Dec
-09
Apr
-10
Aug
-10
Dec
-10
-15
-10
-5
0
5
10
15
20
25
Regional economies supported by resilient domestic demand
-10
0
10
20
30
40
Dec
-07
Mar
-08
Jun-
08S
ep-0
8D
ec-0
8M
ar-0
9Ju
n-09
Sep
-09
Dec
-09
Mar
-10
Jun-
10S
ep-1
0D
ec-1
0
-8
-4
0
4
8
12
16yoy,%
Continued access to creditRising retail salesUnemployment trending down1 32
Source: National authorities, Haver
Unemployment rate Lending growth *
Note: * Refers to loans as reported in banks’ balance sheet, except for Indonesia which refers to loans outstanding
Indonesia
yoy,%Retail salesyoy,% yoy,%

21
-3
-2
-1
0
1
2
3
4
5
6
7
8
2003
2004
2005
2006
2007
2008
2009
2010
2011
Rising commodity prices have increased the risk to higher global inflation
0
50
100
150
200
250
300
350
400
450
500
2003
2004
2005
2006
2007
2008
2009
2010
2011
Metals
Crude oil
Food
US
Euro
UK
East Asia-9
…driving up inflation in most economies
Index (Jan ’03 = 100) Yoy (%)
Rising commodity prices amid supply disruptions and geopolitical tensions…

22
Different degrees of monetary policy response
0
2
4
6
8
10
2008 2009 2010 2011
PR China
Thailand
Indonesia
Korea
%
Malaysia
Ch Taipei
0
1
2
3
4
5
6
2008 2009 2010 2011
%
US
Euro area
UKJapan
…while most regional economies have started to normalise
or tighten since 2010Some advanced economies are expected
to begin to normalise
rates this year…
Key interest rates, % Key interest rates, %

23
Global shifts in liquidity: Volatile capital flows…Large capital inflows driven by growth differentials and the search for yield…
0 4 8 12 16 20
C. Taipei
Thailand
India
Malaysia
Singapore
Philippines
Korea
Indonesia
PR China
20092010
Total flows into equity and bond markets
USD billionSource: EFPR
0 50 100 150 200
Hong Kong
P.R China
Malaysia
Singapore
Korea
C. Taipei
Philippines
Thailand
Indonesia
Stock market
Property prices
% change from end-2008 till end-2010
Stock market and property price performance
…driving stock and property prices higher
1
1/ till 3Q 10 for property pricesSource: Haver and Bloomberg

24
…prompting measures to manage these flows
Measures introduced in the region to manage capital flows
Hong Kong SAR & Singapore
Philippines
Indonesia
Thailand
Chinese Taipei
Korea
PR China
Limit capital inflows – capital account measures
Prudential & liquidity measures (macroprudential)
Greater flexibility for capital outflows (liberalisation)
Administrative measures (real estate)

25
The Malaysian economy is projected to grow by 5% −
6% in 2011
-2
-1
0
1
2
3
4
5
6
7
8
2005
2006
2007
2008
2009
2010
p
2011
f
Annual change (%)
Source: Department of Statistics, Malaysia and Bank Negara Malaysia
5.0%
6.0%7.2%
p preliminary f forecast
• Slower growth in 1H 2011 – High base in 1H 2010, particularly
for exports and investment– Lower demand for electronic
exports
• Growth is expected to improve in 2H– Stronger expansion of domestic
demand, particularly, private consumption and investment
– Higher exports

26
Strong growth in domestic demand to be driven by private sector activity
2010p 2011f 2010p 2011f
Annual change (%)
Contribution to growth (p.p)
Domestic demand 6.3 6.7 5.6 6.0Private sector 7.8 7.4 4.9 4.7
Consumption 6.6 6.9 3.6 3.7Investment 13.8 9.7 1.4 1.0
Public sector 2.5 5.1 0.6 1.3Consumption 0.1 7.2 0.0 1.0
Investment 5.5 2.7 0.6 0.3Net exports -24.2 2.3 -3.3 0.2
Exports of G&S 9.8 2.7 10.5 3.0Imports of G&S 14.7 2.8 13.8 2.8
Real GDP 7.2 5.0~6.0 7.2 5.0~6.0
Source: Department of Statistics, Malaysia and Bank Negara Malaysia
p preliminary f forecast
• Private domestic demand to be the main growth driver
- Strong private consumption
- Rising investment activity
• Public sector to remain supportive of growth

27
Strong expansion in private consumption
Stronger expansion in consumer spending supported by:
– Favourable labour market conditions
– Rising disposable incomes
– Sustained consumer confidence
– Continued access to credit
p preliminary f forecast
Source: Department of Statistics, Malaysia and Bank Negara Malaysia
Real private consumption
9.1
6.8
8.5
0.7
6.9
10.5
6.6
0
2
4
6
8
10
12
2005 2006 2007 2008 2009 2010p 2011f
Annual change (%)

28
Household expenditure on discretionary items has increased in recent years
0 2 4 6 8 10 12 14
Miscellaneousgoods &services
Restaurants &hotels
Communication
Recreation &culture
% of total household consumption
2005-092000-04
• The changing patterns of household spending reflected mainly growing affluence, supported by
- Steady rise in disposable income
- Accumulation of wealth
• Other key factors- Favourable demographic (i.e.
young and large working-age population)
- Increased financial deepening and inclusion
- Technological developments
Source: Department of Statistics, Malaysia

29
Labour market conditions expected to remain
favourable in 2011
3.23.5
3.3
3.2 3.3
3.7
3.2
0
1
2
3
4
2005 2006 2007 2008 2009 2010e 2011f0
1
2
3
4
5
Annual change (%)
Unemployment rate (% of labour force)
Source: Economic Planning Unit
• Unemployment rate to remain stable at 3.2% in 2011
- supported mainly by growth in domestic-oriented sectors
e Estimate f Forecast
Employment (RHS)
Labour
force (RHS)
Unemployment rate

30
Strong performance in private investment
Annual change (%) 2009 2010p 2011f
Real private investment -17.2 13.8 9.7• Increased capital spending in all
economic sectors- Key sectors: services,
manufacturing and mining
• Factors supporting private investment:
- Expansion of new growth areas- Strengthening domestic demand- Implementation of Government
initiatives- Sustained business confidence
Nominal Private Investment
0
10
2030
40
50
6070
80
90
2006 2007 2008 2009 2010p 2011f
RM billion
Agriculture Mining ManufacturingConstruction Services
Source: Department of Statistics, Malaysia and Bank Negara Malaysia
62.1
76.6 79.8
65.2
76.9
86.9
p
preliminary f forecast

31
FDI to increase further in 2011
• Higher net inflows of FDI in 2011
- Better corporate earnings
- Rising business confidence
- Further improvement in global FDI flows
- Liberalisation
- Implementation of Government ETP projects
• Inflows channeled mainly into the manufacturing, services, and oil and gas sectors
Net FDI inflows into Malaysia
29.5
24.1
5.0
27.632.4
0
10
20
30
40
50
2007 2008 2009 2010p 2011f
RM billion
p preliminary f forecast
Source: Department of Statistics, Malaysia and Bank Negara Malaysia

32
Positive trends in private investment are expected to continue moving forward
Source: Department of Statistics, Malaysia, Bank Negara Malaysia
Two distinct changes can be observed in the recent decade
• Increasing diversity in the investment spending across the various economic sectors
• More capital expenditure channelled into higher value-added, technologically-intensive projects across the different sectors of the economy
- Manufacturing: Renewable energy, high- end electronic products, machinery and equipment, medical devices industry
- Services: Shared services and outsourcing, communication and transport & storage infrastructure
Nominal Private Investment
0%
20%
40%
60%
80%
100%
2000 2010p/Agriculture Mining ManufacturingConstruction Services
25.5
1.1
64
3.26.1
30.7
% share
3.6
54.7
6.64.4
Sectoral
distribution of private investment has become more diversified
33
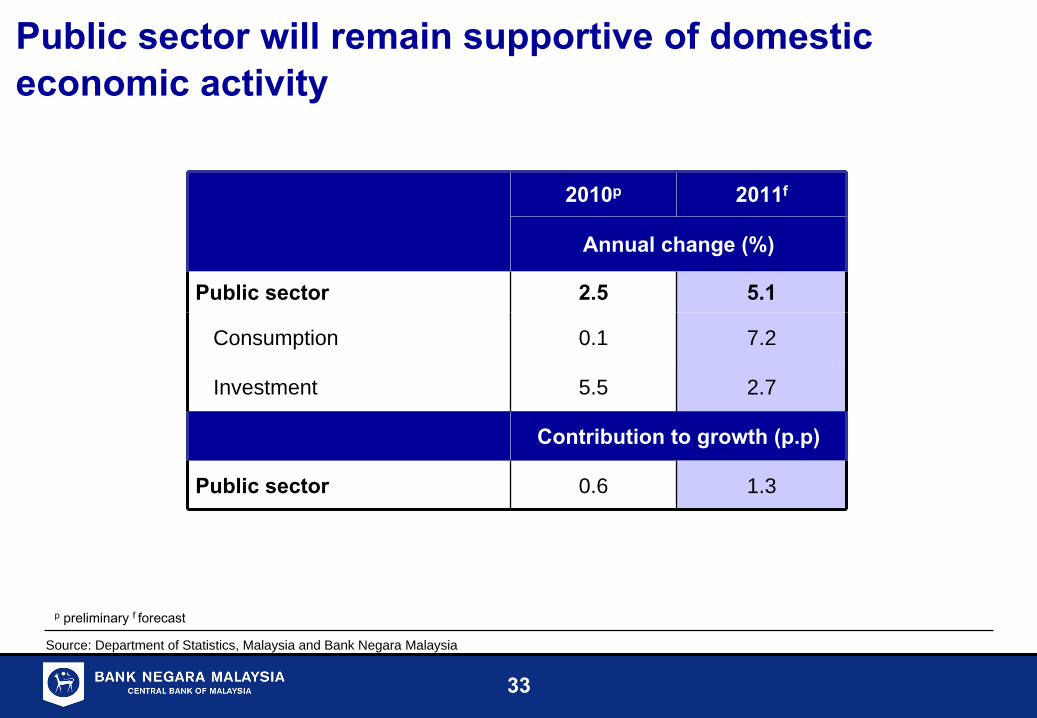
Public sector will remain supportive of domestic economic activity
2010p 2011f
Annual change (%)
Public sector 2.5 5.1
Consumption 0.1 7.2
Investment 5.5 2.7
Contribution to growth (p.p)
Public sector 0.6 1.3
Source: Department of Statistics, Malaysia and Bank Negara Malaysia
p
preliminary f forecast

34
External trade to expand in 2011
• Exports– Moderation from the high base
of 2010, particularly in manufactured exports
– But, strong support from commodity exports due to higher prices and sustained regional demand
• Imports– Modest growth in intermediate
imports– Growth in capital and
consumption imports reflects strong domestic demand
Annual change (%) 2010p 2011f
Gross exports 15.6 5.4Manufactured 13.0 4.4
E&E 9.9 3.7
Non-E&E 17.3 5.2
Commodities 26.9 10.1Agriculture 30.8 12.4
Minerals 23.4 8.0
Gross Imports 21.7 5.7Capital 16.2 10.3
Intermediate 22.1 5.3Consumption 10.1 8.4
Trade balance (RM bn) 110.2 114.6
Source: Department of Statistics, Malaysia and Bank Negara Malaysia
p
preliminary f forecast

35
Current account to remain in surplus
• Larger trade surplus supported by higher commodity exports
• Services surplus, benefiting from higher tourism receipts
• Lower income deficit
- Higher earnings by Malaysian companies investing abroad
- Lower repatriation of profits and dividends by MNCs
Widening current account surplus
-50
-20
10
40
70
100
130
160
190
220
2007 2008 2009 2010p 2011f
RMb
-5
0
5
10
15
20% GNI
Goods ServicesIncome Current transfersCurrent Account, % GNI (RHS)
12.5%12.2%RM90.5b RM100.7b
Source: Department of Statistics, Malaysia and Bank Negara Malaysia
p
preliminary f forecast

36
Annual change (%) 2010p 2011f
Agriculture 1.7 3.4
Mining 0.2 2.0
Manufacturing 11.4 5.7
Construction 5.2 5.4
Services 6.8 5.9
Real GDP 7.2 5.0 ~ 6.0
Broad-based growth across all sectors
• Supported mainly by the continued growth of domestic economic activity
• Trade-related services and export-oriented manufacturing industries to record slower growth in line with the expected moderation in external demand
Source: Department of Statistics, Malaysia and Bank Negara Malaysia
p preliminary f forecast

37
Headline inflation to range between 2.5 – 3.5% in 2011
Inflation Forecast 2011
0
1
2
3
4
5
6
2005 2006 2007 2008 2009 2010 2011/f
Annual growth (%)
2.5 –
3.5%
• Driven mainly by higher global commodity and energy prices, inflation is expected to increase in 2011.
• This trend is similar to other regional economies
Regional Countries Headline Inflation Forecast
3.8%
3.3%
1.7%
2.8%
3.0-5.0%3.0-5.0%
2.5-3.5%
3.0-4.0%
0.0
0.5
1.0
1.5
2.0
2.5
3.0
3.5
4.0
4.5
5.0
Singapore Malaysia Thailand Phillippines
Annual growth (%)
2010 2011 forecast
Note: Inflation forecast refer to the central bank official forecast

38
Malaysia has adopted a comprehensive approach to manage inflationary pressures from commodity prices
In addition to macroeconomic policies, other measures taken are
• Increasing food production and its distributional efficiency
• Promoting greater energy efficiency by households and industry
• A more gradual subsidy rationalisation programme
• Providing income support to targeted groups

39
Monetary policy in 2011 will remain supportive of growth, while managing risks to inflation
2.75%
2.50%
2.0%
3.5%
2.25%
1.5
2.0
2.5
3.0
3.5
4.0
Jun-
08A
ug-0
8O
ct-0
8D
ec-0
8Fe
b-09
Apr
-09
Jun-
09A
ug-0
9O
ct-0
9D
ec-0
9Fe
b-10
Apr
-10
Jun-
10A
ug-1
0O
ct-1
0D
ec-1
0
% Overnight Policy Rate (OPR)
• Given improved economic outlook, the OPR was adjusted in 2010 to
– Normalise monetary conditions
– Prevent the risk of financial imbalances
• For 2011, focus of monetary policy is to manage the risk of a more modest growth and higher inflation
– Monetary policy has the flexibility to remain accommodative
– The degree of accommodation may however, need to be reviewed to ensure sustainable economic growth

40
Two-way capital flows expected to continue
• In 2010, the capital inflows to Malaysia went into both the bond and equity markets• Strong economic fundamentals and positive prospects will continue to attract portfolio inflows• But this is likely to be interrupted by intermittent reversals driven by external events
-15
-10
-5
0
5
10
15
20
25
Q1 Q2 Q32009
Q4 Q1 Q2 Q32010
Q4
Net Portfolio Investment into MalaysiaRM billion
Source: Department of Statistics Malaysia
Cumulative net equity fund flows (since Jan 07)
-40
0
40
80
120
160
200
Dec
-06
Apr
-07
Aug
-07
Dec
-07
Apr
-08
Aug
-08
Dec
-08
Apr
-09
Aug
-09
Dec
-09
Apr
-10
Aug
-10
Dec
-10
USD billion
-0.5
0.0
0.5
1.0
1.5
2.0
2.5USD billion
All Emerging Markets (LHS)Malaysia (RHS)
07
Source: Emerging Portfolio Fund Research Global

41
Large inflows have also led to increases in international reserves
Net International Reserves(Jan’08 - Mar’11)
110.4
130.5
80
90
100
110
120
130
140
Jan-
08
Apr
-08
Jul-0
8
Oct
-08
Jan-
09
Apr
-09
Jul-0
9
Oct
-09
Jan-
10
Apr
-10
Jul-1
0
Oct
-10
Jan-
11
USD bn
Deleveraging activities by international investors
Resumption of capital inflows
Source: BNM
• Large inflows have led to increases in international reserves
– Since the resurgence of capital inflows in 2H 2009, net international reserves at USD110.4 bn in 15 March-11.
– During previous episode in Aug- 08: USD130.5 bn

42
Capital flows currently well intermediated
• More diversified and developed financial system has helped to intermediate the capital flows
• Managed float regime has the necessary flexibility for the exchange rate to adjust to changing conditions
• Wider range of instruments for effective monetary operations
• Rigorous surveillance and information systems
• Stronger fundamentals and a healthy level of international reserves
• Closer cooperation and communication among central banks
Large inflows have increased liquidity in the domestic financial
system but, this has been well managed