BMW GROUP · STRATEGY NUMBER ONE NEXT. Page 3 We are Number ONE. We inspire people on the move: We...
51
December 2017 BMW GROUP INVESTOR PRESENTATION
Transcript of BMW GROUP · STRATEGY NUMBER ONE NEXT. Page 3 We are Number ONE. We inspire people on the move: We...

December 2017
BMW GROUPINVESTOR PRESENTATION

CORPORATE
CULTURE
STRATEGIC
APPROACH
COMPETITIVE
ADVANTAGE
VISION
BMW Group Investor Presentation, December 2017 Page 2

STRATEGY NUMBER ONE NEXT.
Page 3
We are Number ONE. We inspire people on the move: We shape
tomorrow’s individual premium mobility.
BMW Group Investor Presentation, December 2017

AUTONOMOUS CONNECTED
ELECTRIFIED CUSTOMER FOCUS
ACES ARE A CORE ELEMENT OF STRATEGY NUMBER ONE > NEXT.
SHARED / SERVICES
BMW Group Investor Presentation, December 2017 Page 4

BMW GROUP’S ELECTRIFICATION PATHWAY.
Building-up expertise
Technology innovation
Project i
Roll-out BMW i Performance
Upgrade BMW i3
LCI BMW i3, new BMW i3s
MINI Electric (PHEV) MINI BEV
BMW X3 BEV
BMW iNext
BMW Group Investor Presentation, December 2017 Page 5
I. PIONEERING II. ELECTRIFICATION OF CORE PORTFOLIO III. SCALABILITY AND FLEXIBILITY
Battery Electric Vehicles (BEV)Plug-in Hybrid Vehicles (PHEV)Life Cycle Impulse (LCI)
BMW i Vision Dynamics
BMW i. FROM “BORN ELECTRIC” TO “ONE PLATFORM SERVES ALL”.
BMW Group Investor Presentation, December 2017 Page 6
2013 FROM2021 ON“Born electric”
One platform fits all powertrain
derivatives…
Plug-In-Hybrid Pure electricCombustion engine

OUR CLEAR ROADMAP:25 ELECTRIFIED MODELS BY 2025, INCLUDING 12 FULLY ELECTRIC CARS.
2013 2014 2015 2016 2017 2018 2019 2020 2021 2022 2023 2024 2025
BMW X3 BEV
BMW i8
BMW 530e iPerformance
BMW 330eiPerformance
Fully electric
BMW i8 RoadsterBMW 530Le China* BMW 225xe
iPerformanceBMW X1 xDrive25LeiPerformance (China)
BMW i360 Ah / 22 kWh
BMW i3s94 Ah / 33.2 kWh
BMW iNextMINI BEV**BMW i3
94 Ah / 33 kWh
MINI Cooper S ECountryman ALL4
BMW 740eiPerformance
Schematic illustration of future launch dates* Not in series production any more** MINI Battery Electric Vehicle Concept Car
BMW X5 xDrive40e
iPerformance
Plug-in hybridBMW Group Investor Presentation, December 2017 Page 7
BMW 530Le iPerformance(China)
BMW i Vision Dynamics

0
50,000
100,000
150,000
200,000
250,000i3 accumulated i8 accumulated BMW & MINI PHEV accumulated
MORE THAN 200,000 ELECTRIFIED BMW GROUP VEHICLES SOLD BY NOVEMBER 2017. WELL ON TRACK FOR 100,000 ELECTRIFIED VEHICLES IN 2017.
BMW Group Investor Presentation, December 2017 Page 8
i3 60 Ah
i8
X5 xDrive40e
iPerformance
530Le (China)*
330e
iPerformance
225xe
iPerformance 740e / 740Le
iPerformance
i3 94 Ah
* Not in series production any moreFigures represent cumulative sales of Battery Electric Vehicles (BEV) and Plug-in Hybrid Vehicles (PHEV)iPerformance = Plug-in Hybrid Vehicles (PHEV)
530e iPerformance
MINI Cooper S
E Countryman
BMW X1
xDrive25Le
iPerformance
(China)
YTD 11/2017
89,806 electrified
vehicles sold

THE NEW BMW 5 SERIES DRIVER ASSISTANCE PROVIDES COMFORT AND SAFETY AT THE HIGHEST LEVEL.
BMW Group Investor Presentation, December 2017 Page 9
Crossing traffic warning rear / front
Active cruise control with Stop&Go function
Lane keeping assistant with active side collision protection
Steering and lane control assistant
Speed Limit Assist
Panorama View
Active Park Distance Control
Parking assistant
Top View
3D View
Lateral parking aidNight Vision
BMW Selective Beam
Remote Control Parking
Distance information
Rear collision prevention
Lane change warning
Lane departure warning
Speed limit and No Pass information
Approach control warning with braking function
Speed Limit Device
Wrong Way Assist
Crossroad Assist
Top View Remote

THE NEXT STEPS ARE HIGHLY AND FULLY AUTONOMOUS DRIVING.
Driver
No assistance
Feet off
Assisted
Hands off
Partially
automated
Eyes off
Highly
automated
Mind off
Fully
automated
Transfer of responsibilityHuman Machine
Passenger
Autonomous
0 1 2 3 4 5
BMW Group Investor Presentation, December 2017 Page 10
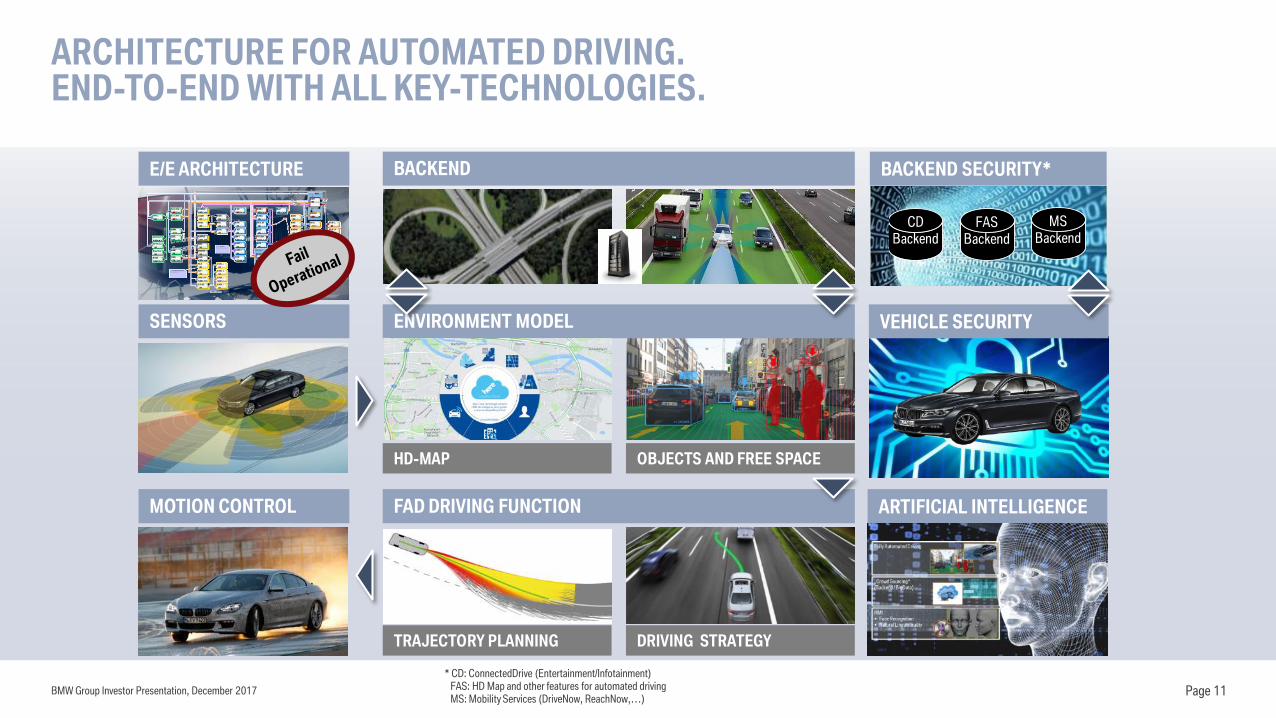
ARCHITECTURE FOR AUTOMATED DRIVING. END-TO-END WITH ALL KEY-TECHNOLOGIES.
BMW Group Investor Presentation, December 2017 Page 11
VEHICLE SECURITY
BACKEND
FAD DRIVING FUNCTION
ENVIRONMENT MODEL
MOTION CONTROL
SENSORS
TRAJECTORY PLANNING DRIVING STRATEGY
HD-MAP OBJECTS AND FREE SPACE
E/E ARCHITECTURE
CDBackend
FASBackend
MSBackend
BACKEND SECURITY*
ARTIFICIAL INTELLIGENCE
* CD: ConnectedDrive (Entertainment/Infotainment)FAS: HD Map and other features for automated drivingMS: Mobility Services (DriveNow, ReachNow,…)
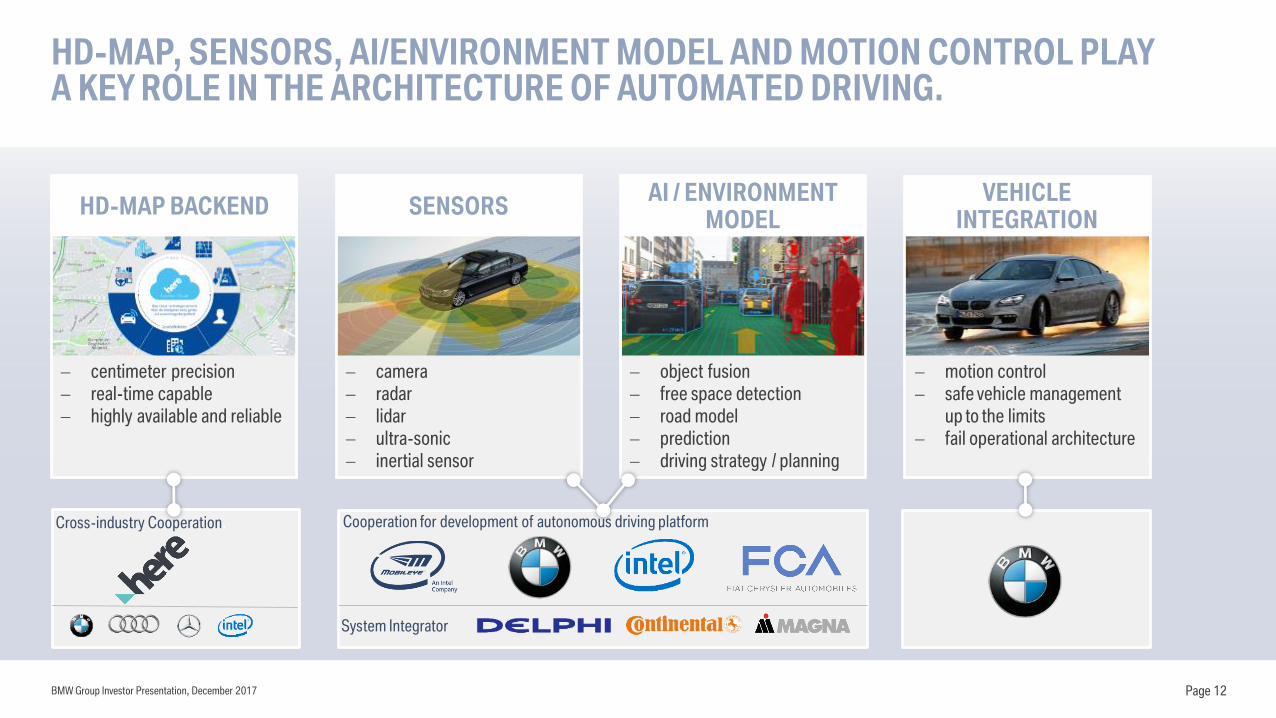
HD-MAP, SENSORS, AI/ENVIRONMENT MODEL AND MOTION CONTROL PLAYA KEY ROLE IN THE ARCHITECTURE OF AUTOMATED DRIVING.
BMW Group Investor Presentation, December 2017 Page 12
motion control
safe vehicle management
up to the limits
fail operational architecture
object fusion
free space detection
road model
prediction
driving strategy / planning
camera
radar
lidar
ultra-sonic
inertial sensor
centimeter precision
real-time capable
highly available and reliable
Cross-industry Cooperation. Cooperation for development of autonomous driving platform
VEHICLE INTEGRATION
AI / ENVIRONMENT MODEL
SENSORSHD-MAP BACKEND
System Integrator

EXPANDING OUR MOBILITY SERVICES.
BMW Group Investor Presentation, December 2017 Page 13

0
2,000
4,000
6,000
8,000
10,000
12,000
2017 2018 2019 2020 2021 2022
*BRIKT refers to Brazil, Russia, India, South Korea and Turkey Source: Global Insight 09/2017
GLOBAL ANNUAL PREMIUM SEGMENT SALES ARE EXPECTED TO GROW AT A CAGR OF 2.1% TO 9.97 MN UNITS BY 2022.
BMW Group Investor Presentation, December 2017 Page 14
China, CAGR +3.2%
Japan, CAGR +2.2%
North America, CAGR +1.9%
Western Europe, CAGR +0.1%
Rest of World, CAGR +4.2%
BRIKT*, CAGR +7.1%
Region (‘000 units) 2017 2022 Change
World 8,781 9,972 14%
Rest of World 668 853 28%
BRIKT* 438 660 51%
China (Mainland) 2,387 2,885 21%
Japan 225 256 14%
North America 1,954 2,189 12%
Western Europe 3,109 3,128 1%

THE LARGEST MODEL OFFENSIVE IN THE COMPANY’S HISTORY. 40 AUTOMOBILE LAUNCHES IN 2017 AND 2018 & ATTRACTIVE MOTORCYCLE LAUNCHES.
MINI
Countryman
BMW 5 Series BMW 4 Series BMW 2 SeriesBMW 1 SeriesBMW M760Li
BMW 6 Series
Gran Turismo
BMW X3 BMW M5 BMW X2 BMW i3s Rolls-Royce
Phantom
BMW Group Investor Presentation, December 2017 Page 15

… AND WE WILL KEEP THE MOMENTUM ROLLING IN 2018.
BMW i8
Roadster
BMW
8 Series
BMW X7 BMW Z4 BMW K1600
Grand America
…BMW M8
BMW Group Investor Presentation, December 2017 Page 16

BMW i Vision Dynamics
Pure Electric
600 km (WLTP cycle)
4.0 sec (0-100 km/h)
200 km/h
The BMW i Vision Dynamics exudes modernity,progressiveness and an appealing technicalaesthetic from every angle. As a trailblazer forthe BMW brand, it showcases clearly the BMWGroup’s future vision of emotionally engagingelectrified mobility.
Drive
Range
Acceleration
Top speed
THE BMW i VISION DYNAMICS.A NEW FORM OF ELECTRIFYING DRIVING PLEASURE.
BMW Group Investor Presentation, December 2017 Page 17

MINI ELECTRIC CONCEPT. ICONIC DESIGN AND URBAN DRIVING FUN WITH ZERO EMISSIONS.
BMW Group Investor Presentation, December 2017 Page 18
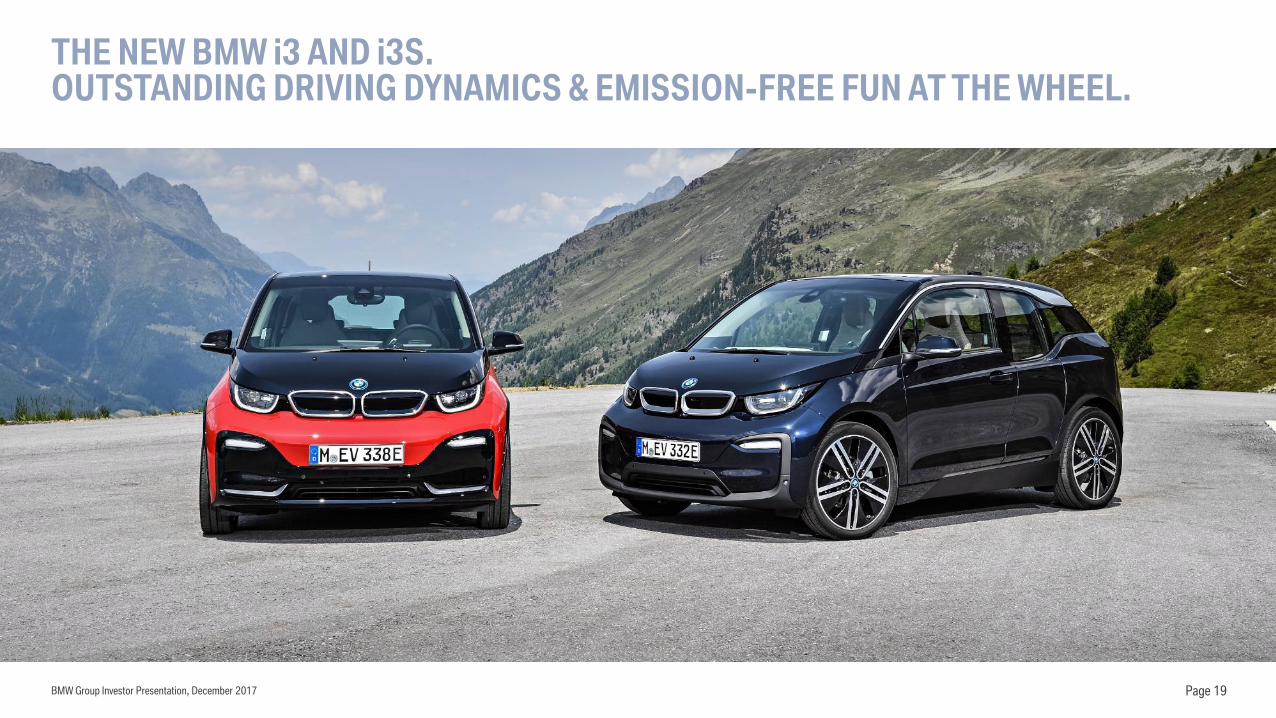
THE NEW BMW i3 AND i3S. OUTSTANDING DRIVING DYNAMICS & EMISSION-FREE FUN AT THE WHEEL.
BMW Group Investor Presentation, December 2017 Page 19

SEVENTH GENERATION OF BMW 5 SERIES.SPORTINESS AND EVERYDAY USABILITY.
BMW Group Investor Presentation, December 2017 Page 20

BMW CONCEPT 8 SERIES.THE PINNACLE OF SPORTS PERFORMANCE AND EXCLUSIVITY.
BMW Group Investor Presentation, December 2017 Page 21

THE BMW CONCEPT Z4. FREEDOM ON FOUR WHEELS.
BMW Group Investor Presentation, December 2017 Page 22

THE NEW ROLLS-ROYCE PHANTOM.PURSUIT OF PERFECTION, VISIONARY ENGINEERING & AESTHETIC ACUITY.
BMW Group Investor Presentation, December 2017 Page 23

BMW Group Investor Presentation, December 2017 Page 24
KEEPING THE LEAD.FURTHER EXPANSION OF THE X-PORTFOLIO PLANNED UNTIL 2020.
BMW X1
BMW X5
BMW X3
BMW X6
BMW X4
BMW X7*
BMW X2
*Concept Car
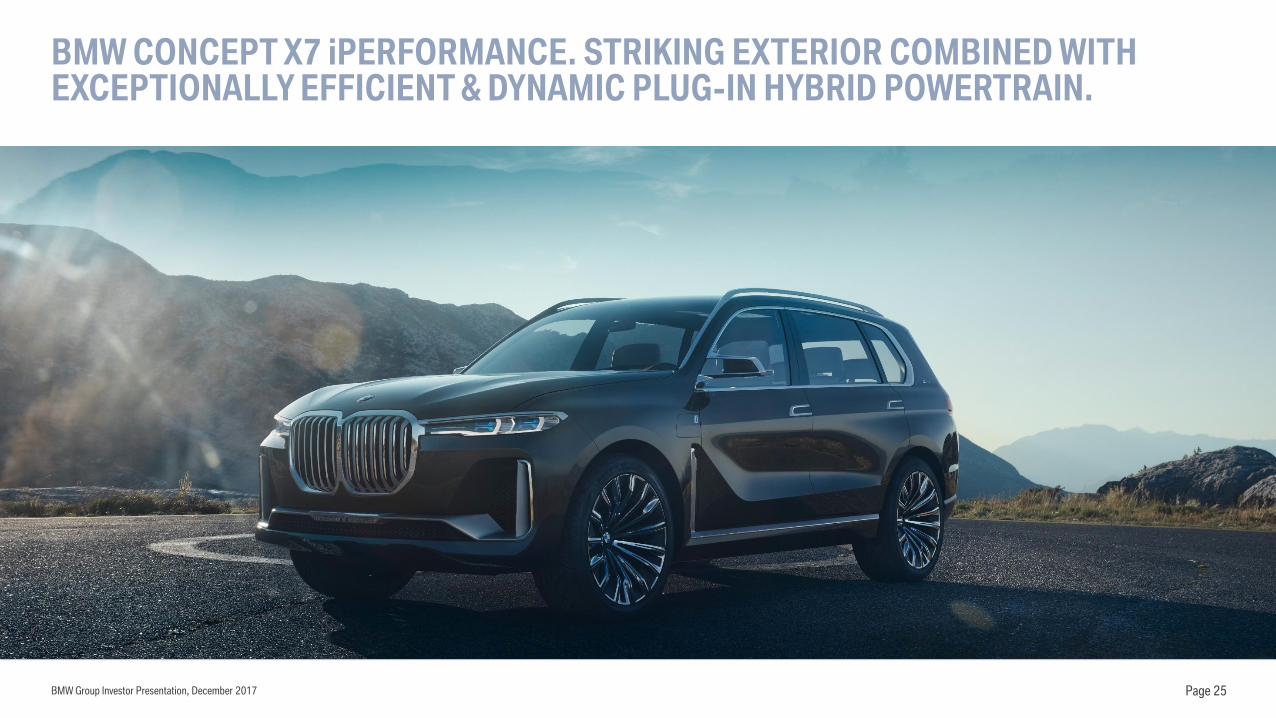
BMW CONCEPT X7 iPERFORMANCE. STRIKING EXTERIOR COMBINED WITH EXCEPTIONALLY EFFICIENT & DYNAMIC PLUG-IN HYBRID POWERTRAIN.
BMW Group Investor Presentation, December 2017 Page 25

BMW GROUP SALES CONTINUE TO GROW THROUGH NOVEMBER 2017.
2,229,497 +3.6%
1,892,365 +3.7%
334,205 +3.0%
2,927 -16.0%
152,322 +11.7%
BMW Group Investor Presentation, December 2017 Page 26Sales figures November 2017

BMW Group Investor Presentation, December 2017
Americas
402,033 units
Europe
998,005 units
+0.5%
Mainland China
542,362 units
Asia (w/o China)
& Rest of World
287,097 units
-2.6%
18% 45%
+14.7%
24% 13%
+4.7%
BMW GROUP AUTOMOTIVE: BALANCED SALES DISTRIBUTION AND SOLID YTD 11/2017 GROWTH OF +3.6% TO A NEW RECORD OF 2,229,497 VEHICLES.
Page 27Rolls Royce is included in “Rest of World”, YTD November 2017 (figures may not add to 100% due to rounding)

BMW GROUP AUTOMOTIVE MAJOR MARKETS. DELIVERIES TO CUSTOMERS YTD NOVEMBER 2017.
BMW Group Investor Presentation, December 2017 Page 28
Deliveries of automobiles YTD 11/2017 YTD 11/2016 Change in %
Europe 998,005 992,602 0.5
thereof Germany 1) 281,713 281,886 -0.1
Great Britain 220,126 228,720 -3.8
Americas 402,033 412,873 -2.6
thereof USA 313,926 327,711 -4.2
Asia 769,643 680,540 13.1
thereof China Mainland 542,362 472,705 14.7
thereof BBA retail sales 350,356 290,031 20.8
Rest of the World (incl. RR) 2) 59,816 66,400 -9.9
Total 2,229,497 2,152,415 3.6
1) Registrations 2) Rolls-Royce sales are included in “Rest of the World”

BMW AND MINI RETAIL DEVELOPMENT IN MAINLAND CHINA YTD NOV. 2017.
BMW Group Investor Presentation, December 2017 Page 29
59% 53% 48% 32% 61%41% 43%
Share of JV Sales
51% 61%
13.8 21.0 30.7 46.8
115.3138.2
185.3 192.2 180.1 181.7200.2 182.7 192.0
22.630.6
35.243.7
53.7
94.4
141.2
198.5
275.9 282.0
316.2
290.0
350.4
2006 2007 2008 2009 2010 2011 2012 2013 2014 2015 2016 YTD 2016 YTD 2017
Import JV Sales
51.665.8
90.5
169.0
232.6
326.4
in ‘000 units
390.7
456.0
+27.5 %
+37.5 %
+86.7 %
+37.6 %
+40.3 %
+19.7 %
+16.7 %
+1.7% 516.4
61% 61%
463.7
+11.3% +14.7%
65%
542.4
472.7
62%
36.4
+41.9%

5 MODELS IN LOCAL PRODUCTION & MORE TO COME
ROBUST GROWTH IN CHINA DESPITE MARKET NORMALIZATION.GROWTH OF DEALER NETWORK AND FURTHER LOCALIZATION.
BMW Group Investor Presentation, December 2017 Page 30
BMW and MINI outlets in China
(as of 30 September 2017)
Outlet BMW MININorth 103 31East 113 26Southeast 94 19West 134 30South 137 28Total 581 134
3 SERIES 5 SERIES
X1 (SINCE 2012 )
CHINA SPECIFIC X3 (2018)
2 SERIES ACTIVE TOURER (SINCE 2016)
1 SERIES SEDAN (SINCE 2017)
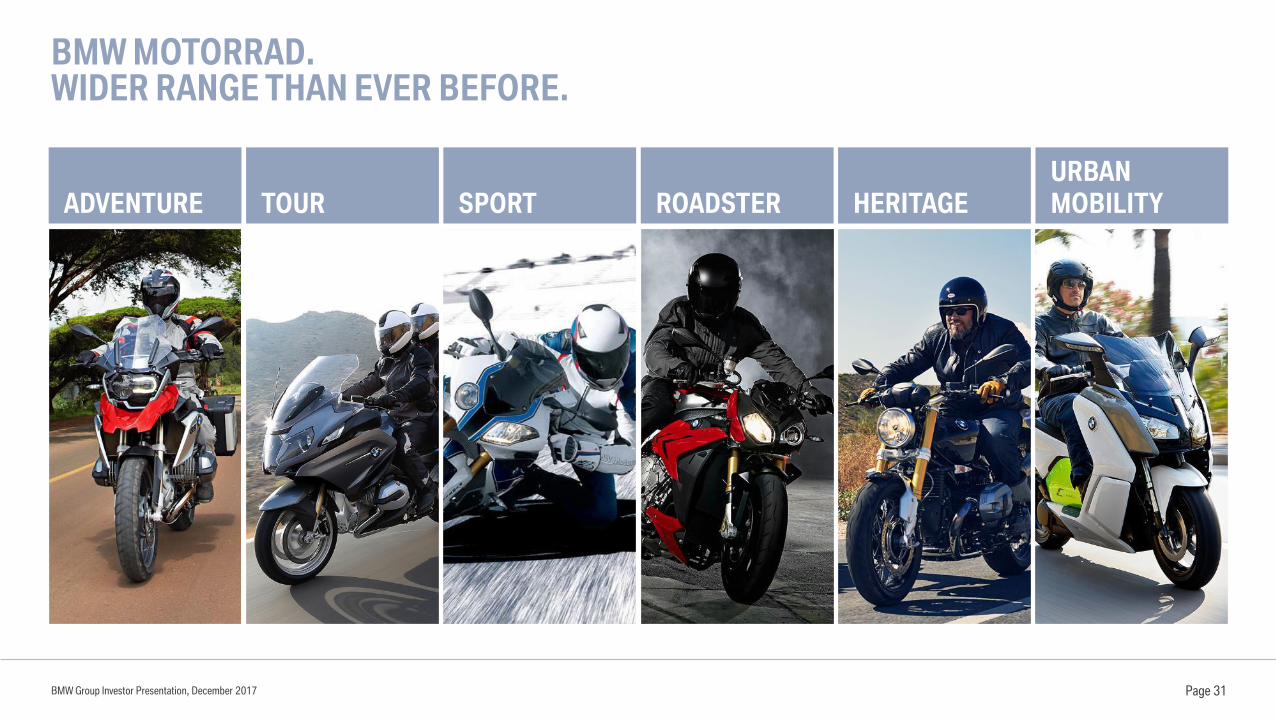
BMW MOTORRAD.WIDER RANGE THAN EVER BEFORE.
BMW Group Investor Presentation, December 2017
ADVENTURE TOUR SPORT ROADSTER HERITAGE
URBAN
MOBILITY
Page 31

27%
26%18%
29%
BMW GROUP FINANCIAL SERVICES AT A GLANCE.
Business Lines as of 09/2017Global Presence as of 09/2017
Global Operations in 58 Countries
€ 7.9 bn
Multi Make Financing
€ 12.1 bn
Fleet Business
BMW Group Investor Presentation, December 2017 Page 32
EU Bank
EMEA
Americas
Asia, Pacific
~ 4.9 Million Serviced Retail Contracts
3.6 mn contracts
Insurance
€10.1 bn
Banking
€ 87.9 bn
Retail Finance
€ 17.8 bn
Dealer Finance
SF
19%
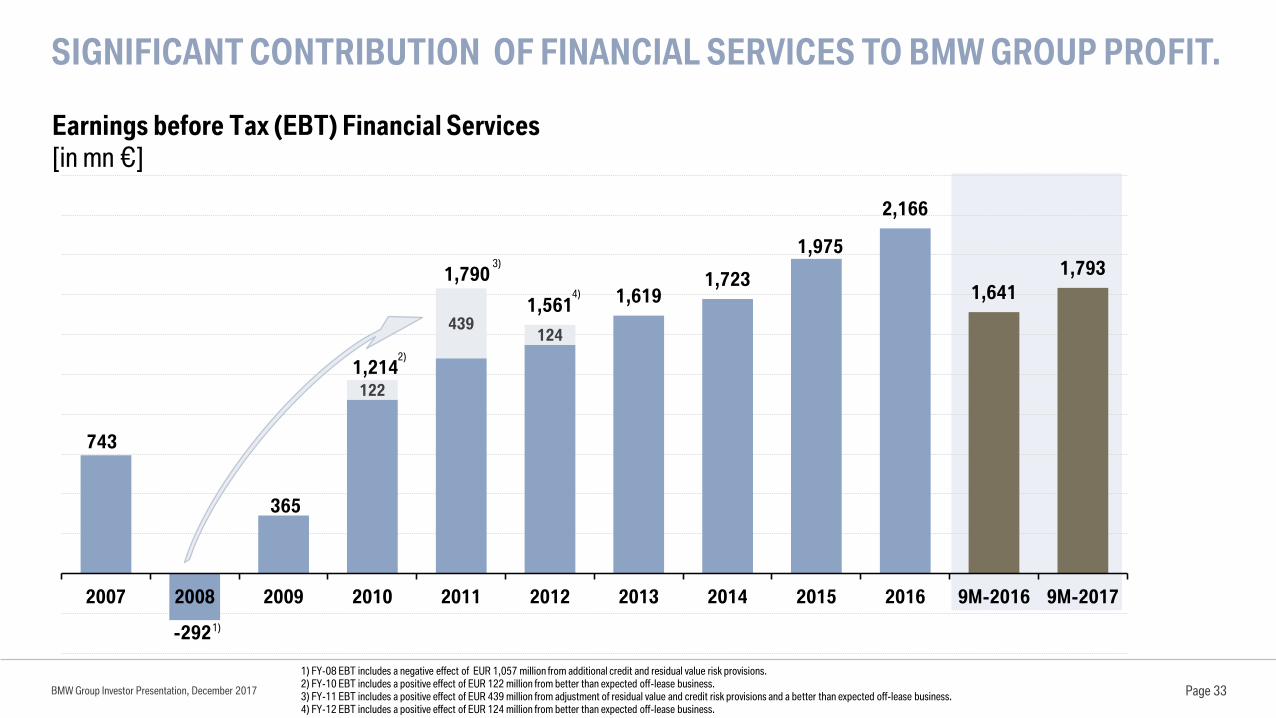
SIGNIFICANT CONTRIBUTION OF FINANCIAL SERVICES TO BMW GROUP PROFIT.
BMW Group Investor Presentation, December 2017 Page 33
743
122
439124
-292
365
1,214
1,790
1,5611,619
1,723
1,975
2,166
1,641
1,793
2007 2008 2009 2010 2011 2012 2013 2014 2015 2016 9M-2016 9M-2017
1) FY-08 EBT includes a negative effect of EUR 1,057 million from additional credit and residual value risk provisions.2) FY-10 EBT includes a positive effect of EUR 122 million from better than expected off-lease business.3) FY-11 EBT includes a positive effect of EUR 439 million from adjustment of residual value and credit risk provisions and a better than expected off-lease business.4) FY-12 EBT includes a positive effect of EUR 124 million from better than expected off-lease business.
2)
3)
4)
1)
Earnings before Tax (EBT) Financial Services
[in mn €]

BMW GROUP FINANCIAL SERVICES. SOLID DEVELOPMENT OF CREDIT LOSS RATIO.
BMW Group Investor Presentation, December 2017
Credit loss ratio*
[in %]
Page 34* Definition Credit Loss Ratio : credit losses in relation to the average serviced portfolio. Credit losses: all write offs, meaning the lost receivable including accumulated interest and other costs less utilized collateral. Income related to the recovery process after write off is also taken into consideration.
0.41
0.46
0.59
0.84
0.67
0.49 0.480.46
0.50
0.37
0.320.30 0.30
2006 2007 2008 2009 2010 2011 2012 2013 2014 2015 2016 9M-2016 9M-2017
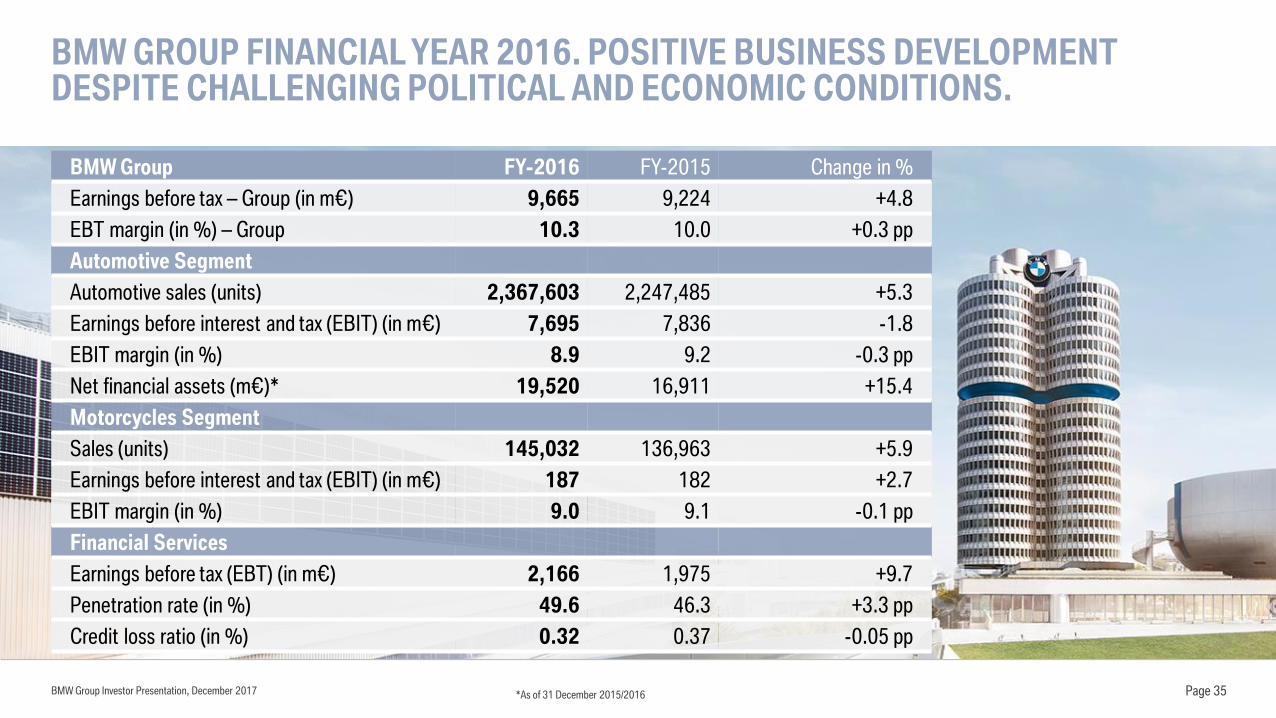
BMW GROUP FINANCIAL YEAR 2016. POSITIVE BUSINESS DEVELOPMENT DESPITE CHALLENGING POLITICAL AND ECONOMIC CONDITIONS.
BMW Group Investor Presentation, December 2017 Page 35
BMW Group FY-2016 FY-2015 Change in %
Earnings before tax – Group (in m€) 9,665 9,224 +4.8
EBT margin (in %) – Group 10.3 10.0 +0.3 pp
Automotive Segment
Automotive sales (units) 2,367,603 2,247,485 +5.3
Earnings before interest and tax (EBIT) (in m€) 7,695 7,836 -1.8
EBIT margin (in %) 8.9 9.2 -0.3 pp
Net financial assets (m€)* 19,520 16,911 +15.4
Motorcycles Segment
Sales (units) 145,032 136,963 +5.9
Earnings before interest and tax (EBIT) (in m€) 187 182 +2.7
EBIT margin (in %) 9.0 9.1 -0.1 pp
Financial Services
Earnings before tax (EBT) (in m€) 2,166 1,975 +9.7
Penetration rate (in %) 49.6 46.3 +3.3 pp
Credit loss ratio (in %) 0.32 0.37 -0.05 pp
*As of 31 December 2015/2016
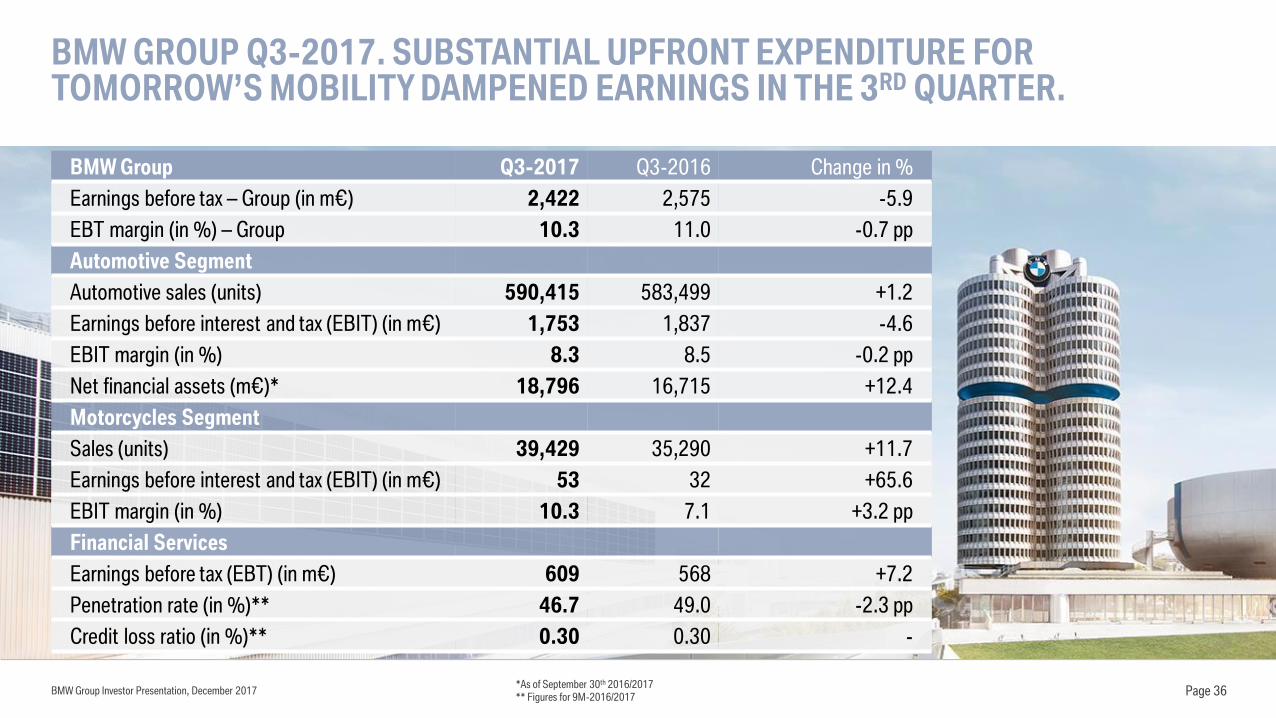
BMW GROUP Q3-2017. SUBSTANTIAL UPFRONT EXPENDITURE FOR TOMORROW’S MOBILITY DAMPENED EARNINGS IN THE 3RD QUARTER.
BMW Group Investor Presentation, December 2017 Page 36
BMW Group Q3-2017 Q3-2016 Change in %
Earnings before tax – Group (in m€) 2,422 2,575 -5.9
EBT margin (in %) – Group 10.3 11.0 -0.7 pp
Automotive Segment
Automotive sales (units) 590,415 583,499 +1.2
Earnings before interest and tax (EBIT) (in m€) 1,753 1,837 -4.6
EBIT margin (in %) 8.3 8.5 -0.2 pp
Net financial assets (m€)* 18,796 16,715 +12.4
Motorcycles Segment
Sales (units) 39,429 35,290 +11.7
Earnings before interest and tax (EBIT) (in m€) 53 32 +65.6
EBIT margin (in %) 10.3 7.1 +3.2 pp
Financial Services
Earnings before tax (EBT) (in m€) 609 568 +7.2
Penetration rate (in %)** 46.7 49.0 -2.3 pp
Credit loss ratio (in %)** 0.30 0.30 -
*As of September 30th 2016/2017** Figures for 9M-2016/2017

BMW Group Investor Presentation, December 2017 Page 37
BMW Group 9M-2017 9M-2016 Change in %
Earnings before tax – Group (in m€) 8,482 7,741 +9.6
EBT margin (in %) – Group 11.7 11.2 +0.5 pp
Automotive Segment
Automotive sales (units) 1,811,234 1,746,638 +3.7
Earnings before interest and tax (EBIT) (in m€) 5,862 5,778 +1.5
EBIT margin (in %) 9.1 9.1 -
Net financial assets (m€)* 18,796 16,715 +12.4
Motorcycles Segment
Sales (units) 127,818 116,044 +10.1
Earnings before interest and tax (EBIT) (in m€) 282 224 +25.9
EBIT margin (in %) 15.4 13.6 +1.8 pp
Financial Services
Earnings before tax (EBT) (in m€) 1.793 1.641 +9.3
Penetration rate (in %) 46.7 49.0 -2.3 pp
Credit loss ratio (in %) 0.30 0.30 -
*As of September 30th 2016/2017
BMW GROUP 9M-2017. STRONG RESULTS IN THE FIRST 9 MONTHS OF 2017.BMW GROUP ON COURSE FOR SUCCESSFUL FINANCIAL YEAR.

EBIT MARGIN IN THE AUTOMOTIVE SEGMENT WITHIN OR ABOVE TARGET RANGE OF 8-10% SINCE 2010.
BMW Group Investor Presentation, December 2017
EBIT margin development automotive segment
[in %]
Page 38
Target corridor:
8-10 %
9.6
8.1
10.2
11.9
14.4
11.9
9.2
11.6 11.6
9.6
10.5
9.99.6
9.0 9.1 9.5
11.7
9.4
8.2
9.5
8.4
9.19.6 9.4 9.5
8.5 8.3
9.0
9.7
8.3
7.0
8.0
9.0
10.0
11.0
12.0
13.0
14.0
15.0
Q1/10 Q3/10 Q1/11 Q3/11 Q1/12 Q3/12 Q1/13 Q3/13 Q1/14 Q3/14 Q1/15 Q3/15 Q1/16 Q3/16 Q1/17 Q3/17

AUTOMOTIVE SEGMENT.2015 TO 2016 EBIT DEVELOPMENT.
In m€
EBIT
2015
EBIT
2016
7,836
7,695
+200 -70 +89 -143
-217
EBIT margin
9.2%
EBIT margin
8.9%
Net effect from
exchange rates/
commodities
Other
operating
income and
expenses
Volume/
Mix/
Market
Depreciation Other changes
BMW Group Investor Presentation, December 2017 Page 39

SOLID FREE CASH FLOW DEVELOPMENT IN THE AUTOMOTIVE SEGMENT.
BMW Group Investor Presentation, December 2017 Page 40* Definition: Free cash flow corresponds to the cash inflow from operating activities of the Automobiles segment less the cash outflow for investing activities of the Automobiles segment adjusted for net investment in marketable securities and term deposits. 2009 – 2015 as reported, 2007 & 2008 calculated according to above definition from reported figures. No cash flow reporting on segment level in 2006.** 2009, 2011, 2013 figures have been adjusted in accordance with IAS 8.
1,156
2,277
197
1,456
4,471
3,166
3,809
3,003
3,481
5,4045,792
3,415
2,703 Target:
> 3 billion
Free Cash Flow (Automotive)*
[in m€]

THE BMW GROUP IS COMMITTED TO PLAYING A KEY ROLE IN TOMORROW’S MOBILITY AND IS INVESTING SUBSTANTIAL AMOUNTS IN NEW TECHNOLOGIES.
BMW Group Investor Presentation, December 2017
R&D Expenditure*
[in m€, HGB]
R&D Ratio**
[in %, HGB]
Page 41
HGB: German Commercial Code* R&D Expenditure: Research and development expenses plus capitalized research and development cost minus amortization of capitalized development costs.** R&D Ratio: R&D expenditure divided by Group revenues.*** 2013 figures have been adjusted in accordance with IAS 8.
3,208
3,1442,864
2,448
2,773
3,373
3,952
4,7924,566
5,169 5,164
3,332
4,0586.5
5.6 5.44.8
4.6
4.9 5.1
6.35.7 5.6 5.5
4.8
5.6
0
1
2
3
4
5
6
7
8
9
10
0
1,000
2,000
3,000
4,000
5,000
6,000
2006 2007 2008 2009 2010 2011 2012 2013*** 2014 2015 2016 9M-20169M-2017
Target ratio:
5-5.5 %

TIGHT MANAGEMENT OF CAPITAL EXPENDITURE TO ACHIEVE TARGET RATIO.
BMW Group Investor Presentation, December 2017
BMW Group Capital Expenditure*
[in m€]
Capex Ratio**
[in %]
* Capital Expenditure: additions to property, plant and equipment and other intangible assets (definition has been changed in 2016).** Capital expenditure ratio: Capital expenditure divided by Group revenues.
*** 2013 figures have been adjusted in accordance with IAS 8.Page 42
Target ratio:
<5%2,777
2,9332,980
2,383
2,312
2,720
4,151
4,967
4,601
3,826 3,731
1,970
2,817
5.7 5.2 5.6
4.7 3.8 4.0
5.4
6.5
5.7
4.2 4.0
2.8
3.9
0
1
2
3
4
5
6
7
8
9
10
0
1,000
2,000
3,000
4,000
5,000
6,000
2006 2007 2008 2009 2010 2011 2012 2013*** 2014 2015 2016 9M-20169M-2017
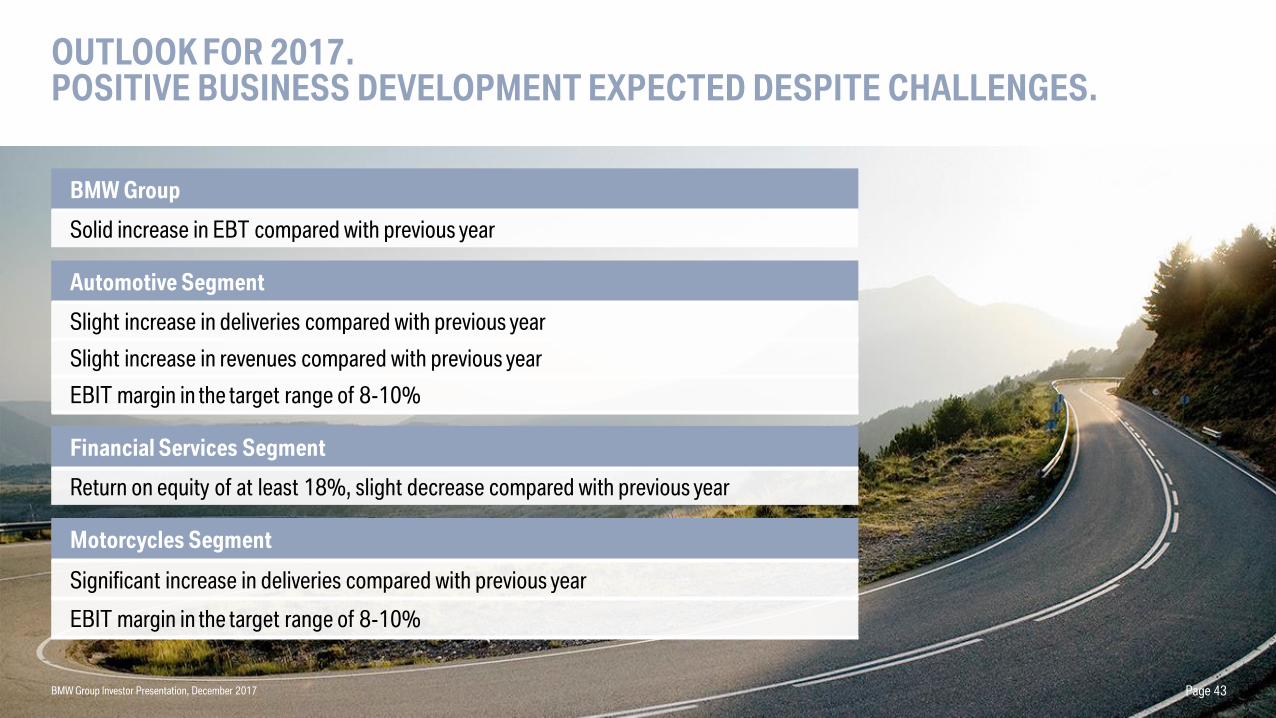
OUTLOOK FOR 2017.POSITIVE BUSINESS DEVELOPMENT EXPECTED DESPITE CHALLENGES.
BMW Group Investor Presentation, December 2017 Page 43
BMW Group
Solid increase in EBT compared with previous year
Automotive Segment
Slight increase in deliveries compared with previous year
Slight increase in revenues compared with previous year
EBIT margin in the target range of 8-10%
Financial Services Segment
Return on equity of at least 18%, slight decrease compared with previous year
Motorcycles Segment
Significant increase in deliveries compared with previous year
EBIT margin in the target range of 8-10%

FINANCIAL TARGETS 2020: SUSTAINABLE GROWTH AND SOLID PROFITABILITY DESPITE CHALLENGES.
BMW Group Investor Presentation, December 2017
BMW Group
EBT margin
Investment ratio*
Research and development ratio
Payout ratio
Automotive Segment
EBIT margin
Free Cashflow
Motorcycles Segment
Sales volume
EBIT margin
Financial Services Segment
Return on Equity
* Investments in property, plant and equipment and other intangible assets (without capitalized development costs).
Page 44
2016
10.3%
4.0%
5.5%
33.3%
8.9%
5.8 bn €
145,032 units
9.0%
21.2%
2020
>10%
<5.0%
5.0 - 5.5%
30 - 40%
8 -10%
>3 bn €
> 200,000 units
8 -10%
>18%

MAINTAINING THE AUTOMOTIVE EBIT MARGIN IN THE CORRIDOR OF 8-10% DESPITE ONGOING CHALLENGES.
8 %
10 %
Ongoing efficiency
measures to compensate
the cost burden
Future costs Volatility
Market and
competitive
environment
Regulatory
requirements
Expansion & optimization
product portfolio
Reduction of
material costs
Reduction of
complexity
Retail sales growth
Autos and Motorcycles
Benefits from
digitalization
Efficiency
measuresBMW Group Investor Presentation, December 2017 Page 45
FOCUS &
PERFORMANCE

BMW GROUP’S FINANCE STRATEGY COVERS THE ENTIRE AUTOMOTIVE VALUE CHAIN.
Page 46BMW Group Investor Presentation, December 2017
Research & Development Production Financial ServicesSales & Marketing
BMW GROUP CORPORATE FINANCE STRATEGY REFLECTS THE INDUSTRIAL NATURE OF THE BUSINESS
AND IS FOCUSED ON THE ENTIRE AUTOMOTIVE VALUE CHAIN.
Automotive value chain

DIVERSIFIED FUNDING MIX WITH A COMBINATION OF INDUSTRY AND BANK TYPICAL FINANCING INSTRUMENTS.
BMW Group Investor Presentation, December 2017 Page 47
CP
<1yr 1yr 2yrs 3yrs 4yrs 5yrs 7yrs 10yrs+
(EMTN) PPs Bonds
Customers deposits
Banks loans
FedFunds
BCD’s
Bank-typical
instruments
Industry-typical
instruments
ABS ABCP
Funding Instruments Financial Debt as of 30.09.2017
Bonds50%
ABS16%
Liabilities to banks14%
Liabilities from customer deposits
15%
Commercial paper
3%
Derivative instruments
1%
Other1%
92.8 bn €

BMW GROUP INVESTOR RELATIONS. CONTACTS.
BMW Group Investor Presentation, December 2017
Torsten Schüssler
Head of Investor Relations
Andreas Stöffler
Equity IR
Bernd Daser
Debt & Equity IR
Mariam Kremer
Debt & Equity IR
Tanja Seiler
Equity & SRI IR
http://www.bmwgroup.com/ir
IR Contact
BMW Group Investor Relations
Petuelring 130
80788 Munich
Page 48
Patrick Neumayer
Debt & Equity IR
Americas
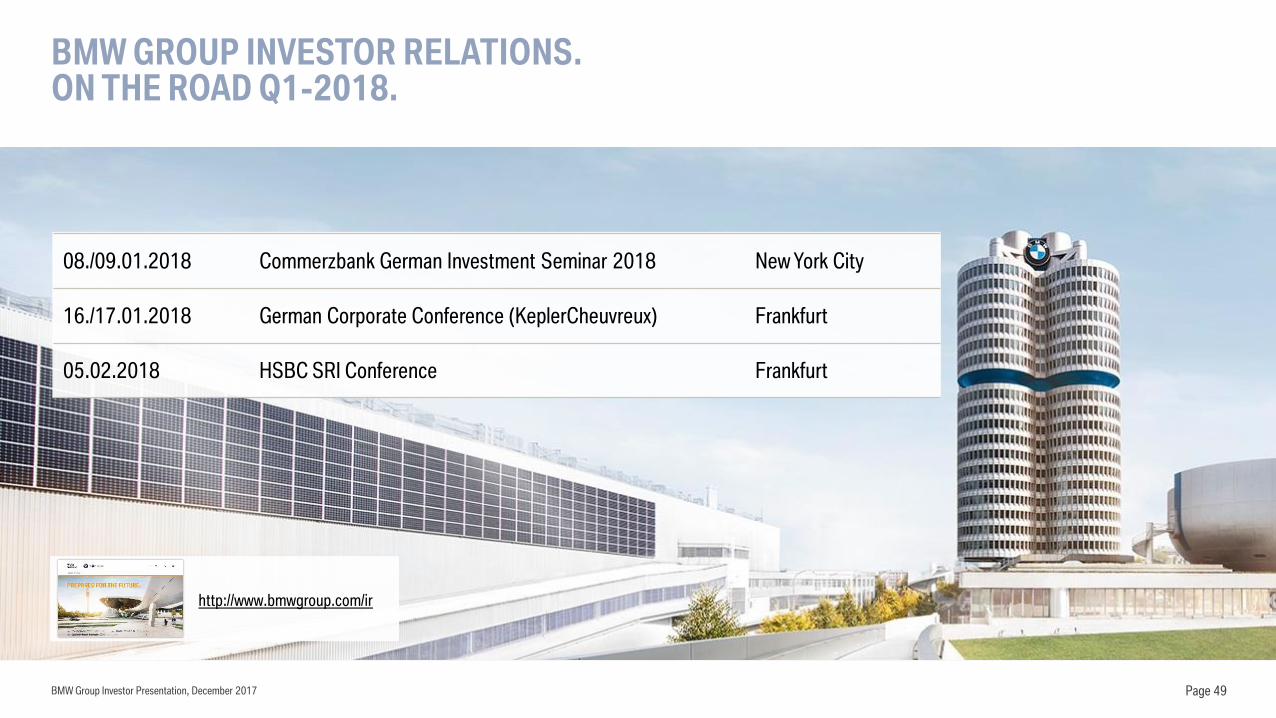
BMW GROUP INVESTOR RELATIONS.ON THE ROAD Q1-2018.
BMW Group Investor Presentation, December 2017
http://www.bmwgroup.com/ir
Page 49
08./09.01.2018 Commerzbank German Investment Seminar 2018 New York City
16./17.01.2018 German Corporate Conference (KeplerCheuvreux) Frankfurt
05.02.2018 HSBC SRI Conference Frankfurt

BMW GROUP INVESTOR RELATIONS.FINANCIAL CALENDAR 2017 & 2018.
BMW Group Investor Presentation, December 2017
http://www.bmwgroup.com/ir
Page 50
21.03.2018 Annual Accounts Press Conference
22.03.2018 Analyst and Investor Conference
04.05.2018 Quarterly Report to 31 March 2018
17.05.2018 Annual General Meeting 2018
02.08.2018 Quarterly Report to 30 June 2018
07.11.2018 Quarterly Report to 30 September 2018

DISCLAIMER.
BMW Group Investor Presentation, December 2017 Page 51
This document contains forward-looking statements that reflect BMW Group’s current views about future events. The words
“anticipate,” “assume,” “believe,” “estimate,” “expect,” “intend,” “may,” ”can,” “could,” “plan,” “project,” “should” and
similar expressions are used to identify forward-looking statements.
These statements are subject to many risks and uncertainties or may be affected by factors outside BMW Group’s control,
including adverse developments in global economic conditions resulting in a decline in demand in BMW Group’s key
markets, including China, North America and Europe; a deterioration in credit and financial markets; a shift in consumer
preferences affecting demand for BMW Group’s products; changes in the prices of fuel or raw materials; disruption of
production due to shortages of materials, labor strikes or supplier insolvencies; the effective implementation of BMW
Group’s strategic goals and targets; changes in laws, regulations and government policies, particularly those relating to
vehicle emissions, fuel economy and safety; and other risks and uncertainties, including those described under the heading
“Report on Risks and Opportunities” in BMW Group’s most recent Annual Report.
If any of these risks and uncertainties materializes or if the assumptions underlying any of BMW Group’s forward-looking
statements prove to be incorrect, actual results may be materially different from those BMW Group expresses or implies by
such statements. BMW Group does not intend or assume any obligation to update these forward-looking statements.