Bmo presentation 20 feb2015 final
36
Gary Goldberg, President and CEO BMO Global Metals & Mining Conference February 23, 2015
-
Upload
newmont-mining-corporation -
Category
Economy & Finance
-
view
107 -
download
0
Transcript of Bmo presentation 20 feb2015 final

Gary Goldberg, President and CEO
BMO Global Metals & Mining Conference
February 23, 2015
February 23, 2015
Cautionary statement
Newmont Mining Corporation I BMO Capital Markets 24th Global Metals & Mining Conference I 2
Cautionary statement regarding forward looking statements, including outlook:
This presentation contains “forward-looking statements” within the meaning of Section 27A of the Securities Act of 1933, as amended, and
Section 21E of the Securities Exchange Act of 1934, as amended, which are intended to be covered by the safe harbor created by such sections
and other applicable laws. Such forward-looking statements may include, without limitation: (i) estimates of future consolidated and attributable
production and sales; (ii) estimates of future costs applicable to sales and All-in sustaining costs; (iii) estimates of future consolidated and
attributable capital expenditures; (iv) our efforts to continue delivering reduced costs and efficiency; and (v) expectations regarding the
development, growth and exploration potential of the Company’s projects, including the Turf Vent Shaft, Merian, Long Canyon Phase 1, the
Tanami Expansion, the Ahafo Mill Expansion and Correnso; (vi) expectations regarding the repayment of debt from cash flows and existing cash;
(vii) expectations regarding future dividend payments; Estimates or expectations of future events or results are based upon certain assumptions,
which may prove to be incorrect. Such assumptions, include, but are not limited to: (i) there being no significant change to current geotechnical,
metallurgical, hydrological and other physical conditions; (ii) permitting, development, operations and expansion of the Company’s operations and
projects being consistent with current expectations and mine plans, including without limitation receipt of export approvals; (iii) political
developments in any jurisdiction in which the Company operates being consistent with its current expectations; (iv) certain exchange rate
assumptions for the Australian dollar to the U.S. dollar, as well as other the exchange rates being approximately consistent with current levels; (v)
certain price assumptions for gold, copper and oil; (vi) prices for key supplies being approximately consistent with current levels; (vii) the
accuracy of our current mineral reserve and mineralized material estimates; (viii) the acceptable outcome of negotiation of the amendment to the
Contract of Work and/or resolution of export issues in Indonesia other assumptions noted herein. Where the Company expresses or implies an
expectation or belief as to future events or results, such expectation or belief is expressed in good faith and believed to have a reasonable
basis. However, such statements are subject to risks, uncertainties and other factors, which could cause actual results to differ materially from
future results expressed, projected or implied by the “forward-looking statements”. Such risks include, but are not limited to, gold and other metals
price volatility, currency fluctuations, increased production costs and variances in ore grade or recovery rates from those assumed in mining
plans, political and operational risks, community relations, conflict resolution and outcome of projects or oppositions and governmental regulation
and judicial outcomes. For a more detailed discussion of such risks and other factors, see the Company’s 2014 Annual Report on Form 10-K,
filed on February 19, 2015, with the Securities and Exchange Commission, as well as the Company’s other SEC filings. The Company does not
undertake any obligation to release publicly revisions to any “forward-looking statement,” including, without limitation, outlook, to reflect events or
circumstances after the date of this presentation, or to reflect the occurrence of unanticipated events, except as may be required under applicable
securities laws. Investors should not assume that any lack of update to a previously issued “forward-looking statement” constitutes a reaffirmation
of that statement. Continued reliance on “forward-looking statements” is at investors' own risk.
Investors are reminded that this presentation should be read in conjunction with Newmont’s Form 10-K filed with the Securities and Exchange
Commission on or about February 20, 2015 (available at www.newmont.com).

February 23, 2015 Newmont Mining Corporation I BMO Capital Markets 24th Global Metals & Mining Conference I 3
Industry leading safety performance
0.00
0.10
0.20
0.30
0.40
0.50
0.60
0.70
0.80
Q1 Q2 Q3 Q4 Q1 Q2 Q3 Q4 Q1 Q2 Q3 Q4
Total Recordable Incident Frequency Rate (TRIFR)
(per 200,000 hours worked)
2012 2013 2014

Delivering on our strategy
Achieved $524M in savings1 and lowered AISC2 10% to $1,002/oz
Delivered over 4.8 Moz of attributable gold production offsetting divestments
Reduced total injury rate by 17% to one of the lowest in the industry
Began construction on Merian and advanced Turf Vent Shaft on time and budget
Improved project pipeline value and viability, focusing on most promising options
Generated ~$1.4B in non-core asset sales over the last two years
Generated $2.1B in adjusted EBITDA3, improved free cash flow by $680M
Maintained an investment grade balance sheet and prepaid $100M in debt
Paid $114M in dividends, continuing gold price linked dividend policy
Yanacocha
Improve the
underlying
business
Strengthen
the portfolio
Create
shareholder
value
Newmont Mining Corporation I BMO Capital Markets 24th Global Metals & Mining Conference I 4February 23, 2015

February 23, 2015 Newmont Mining Corporation I BMO Capital Markets 24th Global Metals & Mining Conference I 5
Maintaining steady production
APAC – higher grades at Batu Hijau, and higher
productivity at Tanami
North America – Turf Vent Shaft and lower stripping
at Carlin
4.6 – 4.9 Moz4.7 – 5.1 Moz
2015 2017
South America – Merian offsets Yanacocha declines
Africa – lower grades at Ahafo
510 – 560 Koz
740 – 800 Koz
1.8 – 2.0 Moz
1.5 – 1.6 Moz
Attributable gold production
2015 – 2017 outlook5

February 23, 2015 Newmont Mining Corporation I BMO Capital Markets 24th Global Metals & Mining Conference I 6
Targeting AISC of $1,000 or less at all operations
2015 2017
North America – Turf Vent Shaft, lower stripping at
Carlin, lower marginal production at Twin Creeks
Gold All-in sustaining cost per ounce outlook ($/oz)
$960 –
$1,020/oz
South America – lower cost production from Merian
Africa – increased stripping and lower grades
APAC – higher grades at Batu Hijau, higher grades
and productivity at Tanami and Waihi
$925 –
$1,025/oz
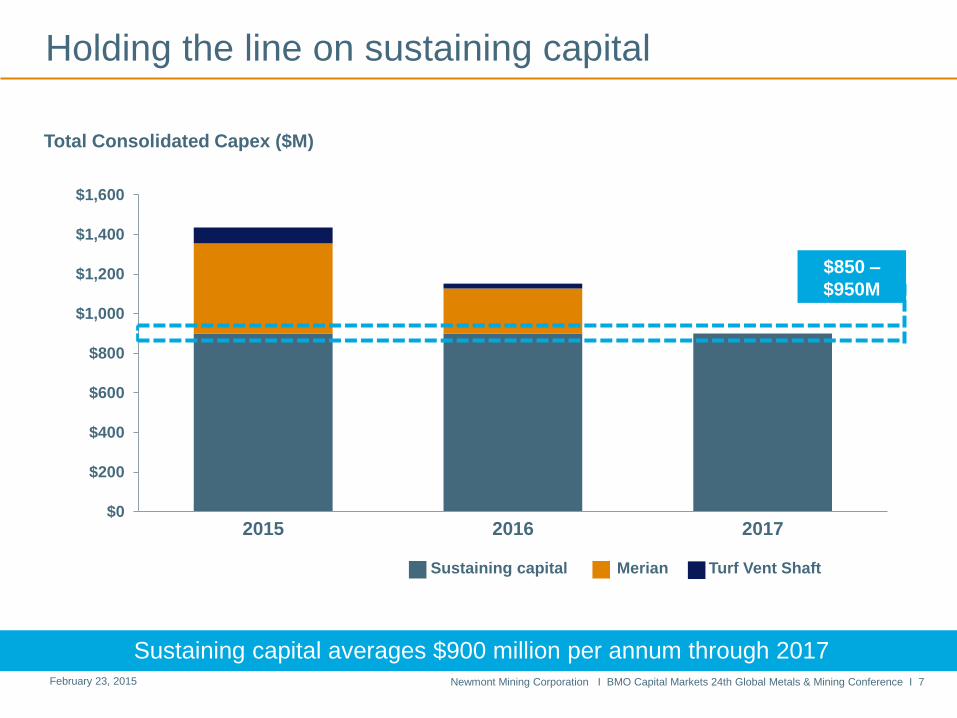
Holding the line on sustaining capital
February 23, 2015 Newmont Mining Corporation I BMO Capital Markets 24th Global Metals & Mining Conference I 7
$0
$200
$400
$600
$800
$1,000
$1,200
$1,400
$1,600
2015 2016 2017
$850 –
$950M
Total Consolidated Capex ($M)
Sustaining capital Merian Turf Vent Shaft
Sustaining capital averages $900 million per annum through 2017
February 23, 2015
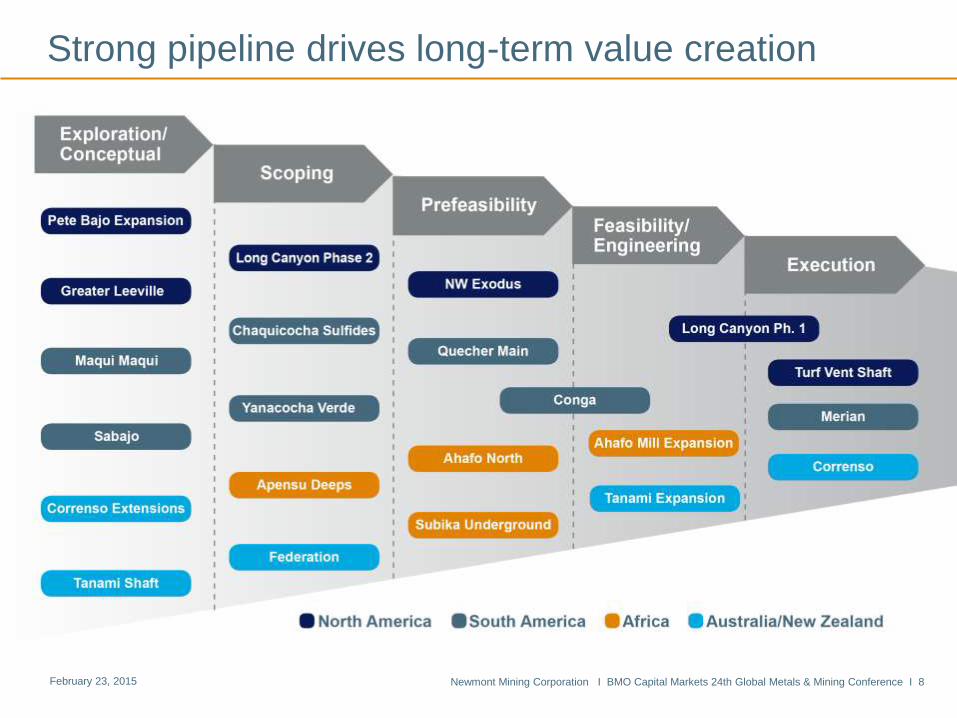
Strong pipeline drives long-term value creation
Newmont Mining Corporation I BMO Capital Markets 24th Global Metals & Mining Conference I 8

Investing in profitable growth
February 23, 2015 Newmont Mining Corporation I BMO Capital Markets 24th Global Metals & Mining Conference I 9
Correnso
• Extends Waihi’s life by 3
years at first quartile AISC
• Construction on schedule
and on budget
• Commercial production in
Q1 2015
Turf Vent Shaft
• Adds 100 – 150 Koz and
higher grade feed to Mill 6
• Reached full depth of 2,052
feet in December 2014
• First production in late 2015
Merian
• 400 – 500 Koz/year at AISC
of $650 – $750/oz (first five
years; 100% basis)
• Construction on schedule
and on budget
• First production in late 2016

Next wave of optimized projects in 2015
February 23, 2015 Newmont Mining Corporation I BMO Capital Markets 24th Global Metals & Mining Conference I 10
Long Canyon Phase 1
• Adds 100 – 150Koz*
• $250 – $300M investment
• First production in 2017
Ahafo Mill Expansion
• Adds 100 – 125 Koz*
• $140 - $160M investment
• First production in 2017
Tanami Expansion
• Adds 50 – 60Koz*
• $100 - $120M investment
• First production in 2017
*Expected first five year average

Exploration focused on near-mine expansions
February 23, 2015 Newmont Mining Corporation I BMO Capital Markets 24th Global Metals & Mining Conference I 11
Long Canyon
Yanacocha
Ahafo
Tanami
Carlin
Merian
Wahai

38%
59%
47%
29%
16% 12%
0%
20%
40%
60%
80%
100%
2014 Assessment 2015 Assessment
Moderate confidence
February 23, 2015
Step-change in resource model reliability
Lower confidence
Higher
confidence
improved by 21%
Newmont Mining Corporation I BMO Capital Markets 24th Global Metals & Mining Conference I 12
2015 Mine Plan
Higher confidence

$0.25BMarketable
Securities
Clear capital allocation priorities
Improving financial flexibility
• Nearly $6B in cash, marketable securities and revolver capacity*
• $1,451M in 2014 cash from continuing operations
• $341M in 2014 free cash flow
De-levering the balance sheet
• Potential to pre-pay up to $750M of debt in 20155
Enhancing the portfolio
• Generated almost $1.4B in asset sales over the last two years
• Progressing Turf Vent Shaft and Merian
Returning cash to shareholders
• Maintaining gold price linked dividend policy
• Dividend based on LBMA P.M. Gold Price starting in March 2015
$3.0BRevolver
Capacity
$2.4BCash and
Cash
Equivalents
February 23, 2015 Newmont Mining Corporation I BMO Capital Markets 24th Global Metals & Mining Conference I 13
*As of December 31, 2014

February 23, 2015
Capturing gold sector leadership
Newmont Mining Corporation I BMO Capital Markets 24th Global Metals & Mining Conference I 14
Where Newmont is Today Where Newmont is Heading
Safety Industry-leading safety performance Zero injuries and illnesses
AISC $1,002/oz, down 15% from 2012 At or below $1,000/oz
Portfolio $1.4B in non-core asset sales Developing most promising projects
Growth Near-mine expansions New districts (Merian, Long Canyon)
Free Cash Flow $341M generated in 2014 Fund projects through cash flows
Returns Meet or beat expectations First quartile TSR
Balance sheet Investment grade balance sheet Investment grade balance sheet
Where Newmont is today? Where Newmont is heading?

Appendix

February 23, 2015 Newmont Mining Corporation I BMO Capital Markets 24th Global Metals & Mining Conference I 16
Conservative plan with upside leverage
Materials
30%
Conservative plan with upside leverage
• $10/bbl reduction in oil price adds ~$40M in
consolidated free cash flow
• $100/oz change in the gold price adds
~$350M in consolidated free cash flow
• +$0.25/lb change in the copper price, adds
~$100M in consolidated free cash flow
*All other variables held constant (i.e. FCF for flexed gold price does not include changes to copper price, AUD or WTI). Economics assume a 35% portfolio tax rate. Excludes
hedges. Cost applicable to sales pie chart excludes inventory changes.
2015 Oulook Price Change Increment FCF (US$M) Attributable FCF (US$M)
Gold ($/oz) $1,200 +$100 +$350 +$300
Copper ($/lb) $2.75 +$0.25 +$100 +$50
Australian Dollar $0.85 -0.05 +$60 +$60
Oil ($/bbl) $75 -$10 +$40 +$30
2015 sensitivities*
2015E CAS breakdown
Energy
12%Diesel
9%
Labor and
services
43%
Royalty
and other
6%

Strengthening the balance sheet
February 23, 2015 Newmont Mining Corporation I BMO Capital Markets 24th Global Metals & Mining Conference I 17
2015 2017 2019 2022 2035 2042
• Revolver has one financial covenant: maximum net debt to book capital of 62.5%; compared to
24.7% as of 31 December 2014
• Potential to repay $750M of debt in 2015
• Prepayment of debt analyzed in the context of the Company’s cash position, operating performance
and business environment
Scheduled debt maturities ($M) and potential prepayments5
2015 potential regional debt prepayment
2015 potential term loan prepayment
$166 $223
$800
$44
$1,304
$1,500
$600
$1,100$1,000
Term loan and other corporate debt

Gold price linked dividend
February 23, 2015 Newmont Mining Corporation I BMO Capital Markets 24th Global Metals & Mining Conference I 18
• Highly leveraged to gold prices
• Targeting 20-25% of free cash flow for dividends, reserving the remainder for projects
and paying down debt
$0.10 $0.20
$0.40$0.60
$0.80
$1.00$1.20
$1.40$1.60
$1.80$2.00
$0.00
$0.50
$1.00
$1.50
$2.00
$2.50
<$
1,2
00
$1,2
00
- $
1,2
99
$1,3
00
- $
1,3
99
$1,4
00
- $
1,4
99
$1,5
00
- $
1,5
99
$1,6
00
-$
1,6
99
$1,7
00
-$1,7
99
$1,8
00
-$
1,8
99
$1,9
00
-$
1,9
99
$2,0
00
-$
2,0
99
$2,1
00
-$
2,1
99
$2,2
00
- $
2,2
99
Annualized dividend per share (US$)*
*For illustrative purposes, declaration of dividend remains subject to Board of Directors approval

February 23, 2015
Positive cash flow across price fluctuations
Newmont Mining Corporation I BMO Capital Markets 24th Global Metals & Mining Conference I 19
2015 contingency planning
Downside $1,200 gold Upside
Develop Merian; slow
other projects
Develop Merian, progress
highest value options
Develop Merian, progress
highest value options
Further reduce sustaining
capital Optimize capital expenditure Optimize capital expenditure
Delay laybacks and reduce
support costsCost savings to offset inflation
Continue to optimize costs and
cash flow
Reduce generative explorationExploration focused on highest
value targets
Exploration focused on highest
value targets
No dividend payments $0.10 dividends paid Per dividend policy
Repay $166M regional debt Potentially pre-pay $750M debt Potentially pre-pay further debt

February 23, 2015
Disciplined portfolio optimization
High
Low
LowHigh
Risk
Va
lue
De-risk
Improve valueClose or divest
Maintain
Newmont Mining Corporation I BMO Capital Markets 24th Global Metals & Mining Conference I 20

Merian progressing on time and on budget*
February 23, 2015 Newmont Mining Corporation I BMO Capital Markets 24th Global Metals & Mining Conference I 21
*Capital costs reported on a 100% basis with approximately $140 million sunk to date. Metrics are reported as first five year average unless otherwise noted. CAS and AISC do not
include the impact of inflation. For all graphical representations, please refer to endnote 6.
Strong feasibility and
economics
• Low strip ratio of 3:1 LOM
• Capital Costs: $0.9B – $1.0B
• Production: 400 – 500 koz/yr
• Gold CAS: $575– $675/oz
• Gold AISC2: $650 – $750/oz
• Reserves: 4.8Moz at 1.2 g/t4
Exploration upside
• Agreement covers 500,000
hectares with promising
exploration results
Funding
• Government of Suriname
acquired 25% fully-funded
equity stake in early
November for $108M and
continues to participate pro
rata

February 23, 2015
Long Canyon Phase 1 opens new district
Strong economics
• Phased approach to development
• Capital costs: $250M – $300M
• Production: 100 – 150Koz LOM
• Gold reserves: 1.23 Moz @ 2.29 g/t
Newmont Mining Corporation I BMO Capital Markets 24th Global Metals & Mining Conference I 22
Leverages regional synergies
• Process ore via heap leach versus new mill
• Equipment and expertise from existing operations
• Self-perform approach to construction
Additional upside potential
• 210,000 feet drilled in 2014
• Mineralization over three mile strike length

Strong performance and future growth at Tanami
February 23, 2015
Tanami Expansion
• Extends mine life and lowers unit costs
• Approximate capital costs: $100M - $120M
• Potential production: 50 – 60Koz first five year
average in 2017
• Decision to proceed in 2015
Newmont Mining Corporation I BMO Capital Markets 24th Global Metals & Mining Conference I 23
Leverages existing infrastructure
• Utilizes second underground decline to improve mining rates and gain
access to explore existing and new deposits
• Builds incremental capacity at the plant
Additional upside potential
• Creates a platform to advance the Federation ore body

Platform for future growth in Ghana
February 23, 2015
Ahafo Mill Expansion
• Adds 3.2 million tonnes per annum of milling
capacity
• Offset the impacts of harder ore at lower
grades at Ahafo
• Capital costs: $140M – $160M
• Production: 100 – 125Koz first five year
average
• Decision to proceed in 2H 2015
Leverages existing infrastructure
• Debottleneck and expand mill capacity
• Additional crusher and SAG mill will feed
into existing ball mill and plant
Additional upside potential
• Designed to support new ore feed from
Subika Underground project if approved
Newmont Mining Corporation I BMO Capital Markets 24th Global Metals & Mining Conference I 24

Strong gold fundamentals support long term pricing
February 23, 2015 Newmont Mining Corporation I BMO Capital Markets 24th Global Metals & Mining Conference I 25
Central Bank Net Additions (Moz)
-30
-20
-10
0
10
20
20
04
20
05
20
06
20
07
20
08
20
09
20
10
20
11
20
12
20
13
20
14
46
48
50
52
54
56
58
60
Ja
n-
14
Ap
r-14
Ju
l-14
Oct-
14
Ja
n-
15
Global Gold ETF Holdings (Moz)
• Longer-term investment demand expected to strengthen due to robust central bank demand,
consumer demand growth in China and low interest rates
• Gold ETF additions in 2015 offset liquidations in Q4 2014
*GFMS Base Case projections (February 2015)

Strong gold fundamentals support long term pricing
February 23, 2015 Newmont Mining Corporation I BMO Capital Markets 24th Global Metals & Mining Conference I 26
Gold Mine Supply (Moz) Gold Scrap Supply (Moz)
• Mine supply growth challenged with fewer new discoveries, capital cost inflation, aging mines
and declining grades
0
20
40
60
80
100
120
201
1
201
2
201
3
201
4
201
5E
201
6E
201
7E
201
8E
201
9E
202
0E
0
10
20
30
40
50
60
201
1
201
2
201
3
201
4
201
5E
201
6E
201
7E
201
8E
201
9E
202
0E
*GFMS Base Case projections (February 2015)

Gold supply and demand overview - future
February 23, 2015 Newmont Mining Corporation I BMO Capital Markets 24th Global Metals & Mining Conference I 27
• Jewelry demand expected to increase over 2 percent annually through 2017
• Central banks acquisitions expected to offset further ETF liquidations
− ETF additions anticipated in 2018 onward, increasing to ~13M ounces by 2021
• Mine supply expected to decrease by ~15 percent by 2017 after slightly increasing in 2014
0
20
40
60
80
100
120
140
160
180
200
9
201
0
201
1
201
2
201
3
201
4
201
5E
201
6E
201
7E
201
8E
201
9E
202
0E
202
1E
202
2E
202
3E
Su
pp
ly &
De
ma
nd
(M
oz)
Total Supply Total Demand
Near-term balance leads to supply deficit in 2017 onward*
*GFMS Base Case projections (February 2015)

2015 Outlooka
February 23, 2015 Newmont Mining Corporation I BMO Capital Markets 24th Global Metals & Mining Conference I 28
Consolidated
Production
Attributable
Production Consolidated CAS
All-in Sustaining
Costsb
Consolidated
Capital
(kozs, kt) (kozs, kt) ($/oz, $/lb) ($/oz, $/lb) Expenditures ($M)
North America
Carlin 850 - 910 850 - 910 $840 - $900 $1,090 - $1,170 $270 - $290
Phoenixc 200 - 220 200 - 220 $760 - $820 $900 - $960 $20 - $30
Twin Creeksd 410 - 440 410 - 440 $530 - $570 $700 - $750 $60 - $70
Other North America $10 - $20
Total 1,460 - 1,570 1,460 - 1,570 $750 - $800 $990 - $1,060 $360 - $410
South America
Yanacochaf 880 - 940 450 - 490 $550 - $590 $870 - $930 $150 - $170
Merian $440 - $470
La Zanjag 60 - 70
Total 880 - 940 510 - 560 $550 - $590 $950 - $1,020 $590 - $640
APAC
Boddington 700 - 750 700 - 750 $830 - $890 $940 - $1,010 $80 - $90
Tanami 390 - 420 390 - 420 $640 - $690 $880 - $950 $80 - $90
Waihi 130 - 150 130 - 150 $570 - $610 $760 - $820 $10 - $20
KCGMe 310 - 340 310 - 340 $810 - $870 $930 - $1,000 $20 - $30
Duketong 40 - 60
Other Australia/NZ $5 - $10
Batu Hijau, Indonesia 590 - 640 270 - 290 $440 - $480 $600 - $640 $120 - $130
Total 2,120 – 2,300 1,840 - 2,010 $670 - $720 $840 - $900 $315 - $370
Africa
Ahafo 300 - 330 300 - 330 $770 - $830 $1,040 - $1,120 $70 - $90
Akyem 440 - 470 440 - 470 $510 - $550 $630 - $680 $30 - $40
Total 740 - 800 740 - 800 $620 - $670 $820 - $880 $100 - $130
Corporate/Other $10 - $20
Total Gold 5,200 - 5,610 4,550 - 4,940 $660 - $710 $960 - $1,020 $1,375 - $1,570
Phoenix 15 - 25 15 - 25 $2.10 - $2.30 $2.50 - $2.70
Boddington 25 - 35 25 - 35 $2.20 - $2.50 $2.80 - $3.10
Batu Hijauh 200 - 220 90 - 100 $1.00 - $1.20 $1.50 - $1.70
Total Copper 240 - 280 130 - 160 $1.20 - $1.40 $1.70 - $1.90
a2015 Outlook projections used in this presentation
(“Outlook”) are considered “forward-looking statements”
and represent management’s good faith estimates or
expectations of future production results as of the date
hereof. Outlook is based upon certain assumptions,
including, but not limited to, metal prices, oil prices,
certain exchange rates and other assumptions. For
example, 2015 Outlook assumes $1,200/oz Au, $2.75/lb
Cu, $0.85 USD/AUD exchange rate and $75/barrel WTI.
AISC and CAS cost estimates do not include inflation.
Such assumptions may prove to be incorrect and actual
results may differ materially from those anticipated.
Consequently, Outlook cannot be guaranteed. As such,
investors are cautioned not to place undue reliance upon
Outlook and forward-looking statements as there can be
no assurance that the plans, assumptions or
expectations upon which they are placed will occur. bNon-GAAP measure. All-in sustaining costs as used in
the Company’s Outlook is a non-GAAP metric defined
as the sum of cost applicable to sales (including all
direct and indirect costs related to current gold
production incurred to execute on the current mine plan),
remediation costs (including operating accretion and
amortization of asset retirement costs), G&A, exploration
expense, advanced projects and R&D, treatment and
refining costs, other expense, net of one-time
adjustments and sustaining capital.cIncludes Lone Tree operations.dIncludes GTRJV operations. eBoth consolidated and attributable production are
shown on a pro-rata basis with a 50% ownership for
KCGM.fConsolidated production for Yanacocha is presented on
a total production basis for the mine site; attributable
production represents a 51.35% interest.gLa Zanja and Duketon are not included in the
consolidated figures above; attributable production
figures are presented based upon a 46.94% ownership
interest at La Zanja and a 19.45% ownership interest in
Duketon. hConsolidated production for Batu Hijau is presented on
a total production basis for the mine site; whereas
attributable production represents an expected
44.5625% ownership interest in 2015 outlook (which
assumes completion of the remaining share divestiture
in the first half of 2015). Outlook for Batu Hijau remains
subject to various factors, including, without limitation,
renegotiation of the CoW, issuance of future export
approvals following the expiration of the six-month
permit, negotiations with the labor union, future in-
country smelting availability and regulations relating to
export quotas, and certain other factors.
.

Adjusted EBITDA
We also present adjusted earnings before interest, taxes, depreciation, and amortization ("adjusted EBITDA") as a non-GAAP
measure. Our management uses adjusted net income, adjusted net income per diluted share and adjusted EBITDA as measures
of operating performance to assist in comparing performance from period to period on a consistent basis; as a measure for
planning and forecasting overall expectations and for evaluating actual results against such expectations; in communications with
the board of directors, stockholders, analysts and investors concerning our financial performance; as useful comparisons to the
performance of our competitors; and as metrics of certain management incentive compensation calculations. We believe that
adjusted net income, adjusted net income per diluted share and adjusted EBITDA are used by and are useful to investors and
other users of our financial statements in evaluating our operating performance because they provide an additional tool to
evaluate our performance without regard to special and non-core items, which can vary substantially from company to company
depending upon accounting methods and book value of assets and capital structure. We have provided reconciliations of all non-
GAAP measures to their nearest U.S. GAAP measures and have consistently applied the adjustments within our reconciliations
in arriving at each non-GAAP measure. These adjustments consist of special items from our U.S. GAAP financial statements as
well as other non-core items, such as property, plant and mine development impairments, restructuring costs, gains and losses
on sales of asset sales, abnormal production costs and transaction/acquisition costs included in our U.S. GAAP results that
warrant adjustment to arrive at non-GAAP results. We consider these items to be necessary adjustments for purposes of
evaluating our ongoing business performance and are often considered non-recurring. Such adjustments are subjective and
involve significant management judgment.
February 23, 2015 Newmont Mining Corporation I BMO Capital Markets 24th Global Metals & Mining Conference I 29
Three Months Ended December 31, Twelve Months Ended December 31,
2014 2013 2014 2013
Income (loss) before income and mining tax and other items $ 246 $ (2,090)
$ 506
$ (3,606)
Adjustments:
Depreciation and Amortization 307
381
1,229
1,362
Interest expense , net 85
92
361
303
EBITDA $ 638 $ (1,617) $ 2,096 $ (1,941)
Impairments and loss provision 25
2,140
47
4,457
Restructuring and other 8
17
40
67
Asset sales (34)
(5)
(126)
(286)
Reclamation site settlement 15
-
15
-
Boddington contingent consideration -
(18)
-
(18)
Abnormal production costs at Batu Hijau -
-
53
-
TMAC transition costs -
-
-
45
Adjusted EBITDA $ 652 $ 517 $ 2,125 $ 2,324

All-in sustaining costs
February 23, 2015 Newmont Mining Corporation I BMO Capital Markets 24th Global Metals & Mining Conference I 30
Newmont has worked to develop a metric that expands on GAAP measures such as cost of goods sold and non-GAAP measures to provide visibility into the economics of our gold mining operations related to
expenditures, operating performance and the ability to generate cash flow from operations.
Current GAAP-measures used in the gold industry, such as cost of goods sold, do not capture all of the expenditures incurred to discover, develop, and sustain gold production. Therefore, we believe that All-in
sustaining costs are non-GAAP measures that provide additional information to management, investors, and analysts that aid in the understanding of the economics of our operations and performance compared to
other gold producers and in the investor’s visibility by better defining the total costs associated with producing gold.
All-in sustaining cost (“AISC”) amounts are intended to provide additional information only and do not have any standardized meaning prescribed by GAAP and should not be considered in isolation or as a substitute
for measures of performance prepared in accordance with GAAP. The measures are not necessarily indicative of operating profit or cash flow from operations as determined under GAAP. Other companies may
calculate these measures differently as a result of differences in the underlying accounting principles, policies applied and in accounting frameworks such as in International Financial Reporting Standards (“IFRS”), or
by reflecting the benefit from selling non-gold metals as a reduction to AISC. Differences may also arise related to definitional differences of sustaining versus development capital activities based upon each
company’s internal policies.
The following disclosure provides information regarding the adjustments made in determining the All-in sustaining costs measure:
Cost Applicable to Sales—Includes all direct and indirect costs related to current gold production incurred to execute the current mine plan. Costs Applicable to Sales (“CAS”) includes by-product credits from certain
metals obtained during the process of extracting and processing the primary ore-body. CAS is accounted for on an accrual basis and excludes Amortization and Reclamation and remediation, which is consistent with
our presentation of CAS on the Statement of Consolidated Income. In determining AISC, only the CAS associated with producing and selling an ounce of gold is included in the measure. Therefore, the amount of
gold CAS included in AISC is derived from the CAS presented in the Company’s Statement of Consolidated Income less the amount of CAS attributable to the production of copper at our Phoenix, Boddington and
Batu Hijau mines. The copper CAS at those mine sites is disclosed in Note 3 – Segments that accompanies the Consolidated Financial Statements. The allocation of CAS between gold and copper at the Phoenix,
Boddington and Batu Hijau mines is based upon the relative sales percentage of copper and gold sold during the period.
Remediation Costs—Includes accretion expense related to asset retirement obligations (“ARO”) and the amortization of the related Asset Retirement Cost (“ARC”) for the Company’s operating properties recorded as
an ARC asset. Accretion related to ARO and the amortization of the ARC assets for reclamation and remediation do not reflect annual cash outflows but are calculated in accordance with GAAP. The accretion and
amortization reflect the periodic costs of reclamation and remediation associated with current gold production and are therefore included in the measure. The allocation of these costs to gold and copper is determined
using the same allocation used in the allocation of CAS between gold and copper at the Phoenix, Boddington and Batu Hijau mines.
Advanced Projects and Exploration—Includes incurred expenses related to projects that are designed to increase or enhance current gold production and gold exploration. We note that as current resources are
depleted, exploration and advance projects are necessary for us to replace the depleting reserves or enhance the recovery and processing of the current reserves. As this relates to sustaining our gold production,
and is considered a continuing cost of a mining company, these costs are included in the AISC measure. These costs are derived from the Advanced projects, research and development and Exploration amounts
presented in the Company’s Statement of Consolidated Income less the amount attributable to the production of copper at our Phoenix, Boddington and Batu Hijau mines. The allocation of these costs to gold and
copper is determined using the same allocation used in the allocation of CAS between gold and copper at the Batu Hijau, Boddington and Phoenix mines.
General and Administrative—Includes cost related to administrative tasks not directly related to current gold production, but rather related to support our corporate structure and fulfilling our obligations to operate as a
public company. Including these expenses in the AISC metric provides visibility of the impact that general and administrative activities have on current operations and profitability on a per ounce basis.
Other Expense, net—Includes costs related to regional administration and community development to support current gold production. We exclude certain exceptional or unusual expenses from Other expense, net,
such as restructuring, as these are not indicative to sustaining our current gold operations. Furthermore, this adjustment to Other expense, net is also consistent with the nature of the adjustments made to Net
income (loss) as disclosed in the Company’s non-GAAP financial measure Adjusted net income (loss). The allocation of these costs to gold and copper is determined using the same allocation used in the allocation of
CAS between gold and copper at the Phoenix, Boddington and Batu Hijau mines.
Treatment and Refining Costs—Includes costs paid to smelters for treatment and refining of our concentrates to produce the salable precious metal. These costs are presented net as a reduction of Sales.
Sustaining Capital—We determined sustaining capital as those capital expenditures that are necessary to maintain current gold production and execute the current mine plan. Capital expenditures to develop new
operations, or related to projects at existing operations where these projects will enhance gold production or reserves, are considered development. We determined the breakout of sustaining and development capital
costs based on a systematic review of our project portfolio in light of the nature of each project. Sustaining capital costs are relevant to the AISC metric as these are needed to maintain the Company’s current gold
operations and provide improved transparency related to our ability to finance these expenditures from current operations. The allocation of these costs to gold and copper is determined using the same allocation
used in the allocation of CAS between gold and copper at the Batu Hijau, Boddington and Phoenix mines.

All-in sustaining costs
February 23, 2015 Newmont Mining Corporation I BMO Capital Markets 24th Global Metals & Mining Conference I 31
(1) Excludes Depreciation and
amortization and Reclamation and
remediation.(2) Includes by-product credits of $19.(3) Includes stockpile and leach pad
inventory adjustments of $32 at Carlin,
$9 at Phoenix, $8 at Twin Creeks and
$11 at Yanacocha.(4) Remediation costs include operating
accretion of $17 and amortization of
asset retirement costs of $22.(5) Other expense, net is adjusted for
restructuring costs of $8.(6) Excludes $112 of development
capital expenditures, capitalized
interest, and the increase in accrued
capital. The following are major
development projects: Turf Vent Shaft,
Merian, and Correnso for 2014.
Three Months Ended December 31, 2014
Costs Applicable to Sales
(1)
(2)(3)
Remediation Costs
(4)
Advanced Projects
and Exploration
General and Administrative
Other Expense,
Net (5)
Treatment and
Refining Costs
Sustaining Capital
(6)
All-In Sustaining
Costs
Ounces (000)/
Pounds (millions)
Sold
All-In Sustaining Costs per
oz/lb
GOLD
Carlin $ 188 $ 1 $ 6 $ - $ 2 $ - $ 45 $ 242 232 $ 1,043
Phoenix 44 1 1 - 1 2 5 54 45 1,200
Twin Creeks 60 - 1 - 1 - 25 87 111 784
La Herradura 3 - 2 - - - 2 7 3 2,333
Other North America - - 5 - (3 ) - 3 5 - -
North America 295 2 15 - 1 2 80 395 391 1,010
Yanacocha 133 21 8 - 11 - 24 197 326 604
Other South America - - 15 - - - - 15 - -
South America 133 21 23 - 11 - 24 212 326 650
Boddington 160 3 - - - 1 19 183 214 855
Tanami 66 - 1 - 1 - 35 103 94 1,096
Jundee - - - - 1 - (1 ) - - -
Waihi 18 2 4 - - - - 24 29 828
Kalgoorlie 71 1 1 - - 2 16 91 79 1,152
Other Australia/New Zealand - - 2 3 1 - - 6 - -
Australia/New Zealand 315 6 8 3 3 3 69 407 416 978
Batu Hijau 38 2 - - 1 5 1 47 48 979
Other Indonesia - - - - (1 ) - - (1 ) - -
Indonesia 38 2 - - - 5 1 46 48 958
Ahafo 67 2 9 - 1 - 27 106 111 955
Akyem 52 1 - - 2 - 12 67 134 500
Other Africa - - 2 - 2 - - 4 - -
Africa 119 3 11 - 5 - 39 177 245 722
Corporate and Other - - 28 44 12 - 1 85 - -
Total Gold $ 900 $ 34 $ 85 $ 47 $ 32 $ 10 $ 214 $ 1,322 1,426 $ 927
COPPER
Phoenix $ 27 $ - $ - $ - $ - $ 1 $ 3 $ 31 11 $ 2.82
Boddington 46 - - - 1 8 6 61 21 2.90
Batu Hijau 156 5 1 1 3 26 10 202 91 2.22
Total Copper $ 229 $ 5 $ 1 $ 1 $ 4 $ 35 $ 19 $ 294 123 $ 2.39
Consolidated $ 1,129 $ 39 $ 86 $ 48 $ 36 $ 45 $ 233 $ 1,616

All-in sustaining costs
February 23, 2015 Newmont Mining Corporation I BMO Capital Markets 24th Global Metals & Mining Conference I 32
(1) Excludes Depreciation and
amortization and Reclamation and
remediation. (2) Includes by-product credits of $85. (3) Includes stockpile and leach pad
inventory adjustment of $127 at Carlin,
$13 at Phoenix, $15 at Twin Creeks, $75
at Yanacocha, $69 at Boddington, and
$191 at Batu Hijau.(4) Remediation costs include operating
accretion of $71 and amortization of
asset retirement costs of $100. (5) Other expense, net is adjusted for
restructuring costs of $40. (6) Excludes $300 of development capital
expenditures, capitalized interest, and the
increase in accrued capital. The following
are major development projects; Turf
Vent Shaft, Merian, Correnso and Conga
for 2014.
Year Ended December 31, 2014
Costs Applicable to Sales
(1)
(2)(3)
Remediation Costs
(4)
Advanced Projects
and Exploration
General and Administrative
Other Expense,
Net (5)
Treatment and
Refining Costs
Sustaining Capital
(6)
All-In Sustaining
Costs
Ounces (000)/
Pounds (millions)
Sold
All-In Sustaining Costs per
oz/lb
GOLD Carlin $ 795 $ 4 $ 22 $ - $ 8 $ - $ 141 $ 970 905 $ 1,072
Phoenix 160 3 4 - 3 9 17 196 222 883
Twin Creeks 207 2 5 - 3 - 111 328 400 820
La Herradura 89 2 12 - - - 21 124 119 1,042
Other North America - - 25 - 6 - 9 40 - -
North America 1,251 11 68 - 20 9 299 1,658 1,646 1,007
Yanacocha 663 101 32 - 35 - 80 911 966 943
Other South America - - 41 - 2 - - 43 - -
South America 663 101 73 - 37 - 80 954 966 988
Boddington 585 11 - - 2 4 69 671 690 972
Tanami 251 4 10 - 2 - 91 358 345 1,038
Jundee 85 5 1 - 2 - 15 108 140 771
Waihi 76 3 7 - 2 - 2 90 131 687
Kalgoorlie 284 4 5 - 1 4 32 330 327 1,009
Other Australia/New Zealand - - 5 3 21 - 6 35 - -
Australia/New Zealand 1,281 27 28 3 30 8 215 1,592 1,633 975
Batu Hijau 81 3 - - 4 9 8 105 72 1,458
Other Indonesia - - - - - - - - - -
Indonesia 81 3 - - 4 9 8 105 72 1,458
Ahafo 249 8 27 - 6 - 92 382 450 849
Akyem 172 3 - - 8 - 17 200 473 423
Other Africa - - 8 - 7 - - 15 - -
Africa 421 11 35 - 21 - 109 597 923 647
Corporate and Other - - 116 182 31 - 17 346 - -
Total Gold $ 3,697 $ 153 $ 320 $ 185 $ 143 $ 26 $ 728 $ 5,252 5,240 $ 1,002
COPPER
Phoenix $ 108 $ 1 $ 2 $ - $ 1 $ 5 $ 13 $ 130 46 $ 2.83
Boddington 158 2 - - 1 25 18 204 66 3.09
Batu Hijau 494 15 3 1 20 45 51 629 152 4.14
Total Copper $ 760 $ 18 $ 5 $ 1 $ 22 $ 75 $ 82 $ 963 264 $ 3.65
Consolidated $ 4,457 $ 171 $ 325 $ 186 $ 165 $ 101 $ 810 $ 6,215

All-in sustaining costs
February 23, 2015 Newmont Mining Corporation I BMO Capital Markets 24th Global Metals & Mining Conference I 33
(1) Excludes Depreciation and
amortization and Reclamation and
remediation.(2) Includes by-product credits of $27.(3) Includes stockpile and leach pad
inventory adjustments of $66 at Carlin,
$24 at La Herradura, $44 at Yanacocha,
$74 at Boddington, and $138 at Batu
Hijau.(4) Remediation costs include operating
accretion of $16 and amortization of
asset retirement costs of $21.(5) Other expense, net is adjusted for
Boddington contingent consideration of
$18, partially offset by $17 for
restructuring costs.(6) Excludes $139 of development capital
expenditures, capitalized interest, and the
increase in accrued capital. The following
are major development projects: Phoenix
Copper Leach, Turf Vent Shaft,
Yanacocha Bio Leach, Conga, Merian,
Ahafo Mill Expansion and Akyem for
2013.
Three Months Ended December 31, 2013
Costs Applicable to Sales
(1)
(2)(3)
Remediation Costs
(4)
Advanced Projects
and Exploration
General and Administrative
Other Expense,
Net (5)
Treatment and
Refining Costs
Sustaining Capital
(6)
All-In Sustaining
Costs
Ounces (000)/
Pounds (millions)
Sold
All-In Sustaining Costs per
oz/lb
GOLD
Carlin $ 254 $ 1 $ 3 $ - $ 3 $ 2 $ 34 $ 297 308 $ 964
Phoenix 39 1 1 - - 1 5 47 44 1,068
Twin Creeks 80 2 - - 1 - 14 97 174 557
La Herradura 55 - 11 - - - 12 78 22 3,545
Other North America - - 10 - (4 ) - 6 12 - -
North America 428 4 25 - - 3 71 531 548 969
Yanacocha 164 22 9 - 3 - 41 239 186 1,285
Other South America - - 11 - 3 - - 14 - -
South America 164 22 20 - 6 - 41 253 186 1,360
Boddington 227 1 - - 1 - 25 254 204 1,245
Tanami 67 1 4 - 1 - 25 98 107 916
Jundee 52 3 - - - - 12 67 63 1,063
Waihi 29 1 1 - 2 - - 33 34 971
Kalgoorlie 76 2 1 - - - 9 88 98 898
Other Australia/New Zealand - - 2 - 9 - 4 15 - -
Australia/New Zealand 451 8 8 - 13 - 75 555 506 1,097
Batu Hijau 26 - - - (1 ) 1 2 28 13 2,154
Other Indonesia - - - - (2 ) - - (2 ) - -
Indonesia 26 - - - (3 ) 1 2 26 13 2,000
Ahafo 81 1 15 - 11 - 12 120 159 755
Akyem 32 - 1 - 3 - - 36 129 279
Other Africa - - 1 - (7 ) - - (6 ) - -
Africa 113 1 17 - 7 - 12 150 288 521
Corporate and Other - - 36 45 8 - 4 93 - -
Total Gold $ 1,182 $ 35 $ 106 $ 45 $ 31 $ 4 $ 205 $ 1,608 1,541 $ 1,043
COPPER
Phoenix $ 11 $ - $ 1 $ - $ 1 $ 1 $ 1 $ 15 5 $ 3.00
Boddington 56 - - - 1 5 6 68 18 3.78
Batu Hijau 233 2 2 - 8 16 21 282 54 5.22
Total Copper $ 300 $ 2 $ 3 $ - $ 10 $ 22 $ 28 $ 365 77 $ 4.74
Consolidated $ 1,482 $ 37 $ 109 $ 45 $ 41 $ 26 $ 233 $ 1,973
All-in sustaining costs
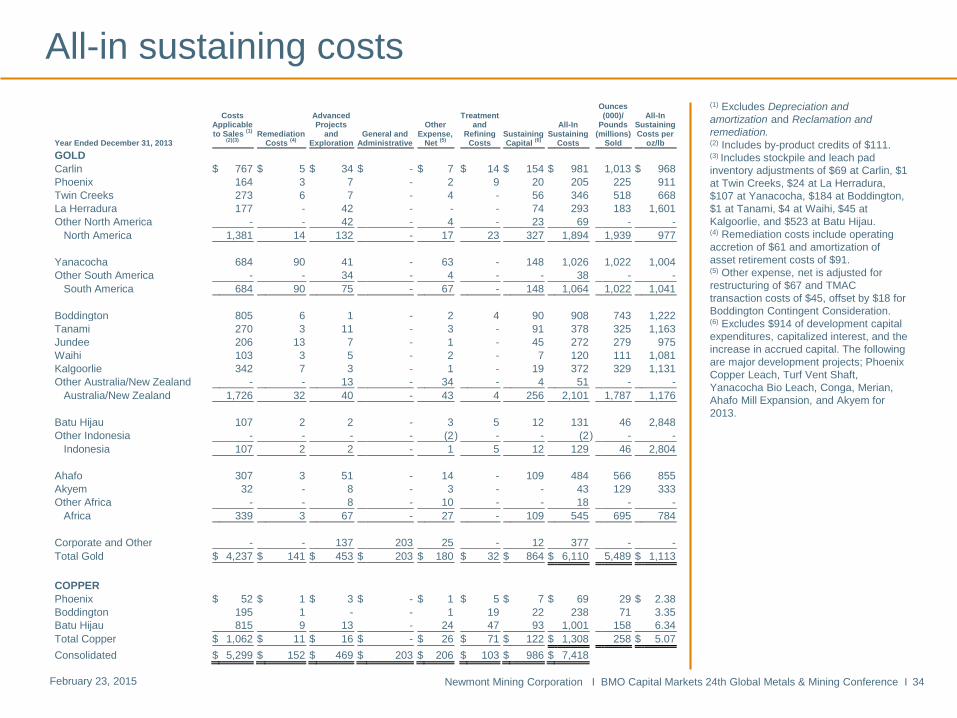
February 23, 2015 Newmont Mining Corporation I BMO Capital Markets 24th Global Metals & Mining Conference I 34
(1) Excludes Depreciation and
amortization and Reclamation and
remediation.(2) Includes by-product credits of $111. (3) Includes stockpile and leach pad
inventory adjustments of $69 at Carlin, $1
at Twin Creeks, $24 at La Herradura,
$107 at Yanacocha, $184 at Boddington,
$1 at Tanami, $4 at Waihi, $45 at
Kalgoorlie, and $523 at Batu Hijau.(4) Remediation costs include operating
accretion of $61 and amortization of
asset retirement costs of $91. (5) Other expense, net is adjusted for
restructuring of $67 and TMAC
transaction costs of $45, offset by $18 for
Boddington Contingent Consideration. (6) Excludes $914 of development capital
expenditures, capitalized interest, and the
increase in accrued capital. The following
are major development projects; Phoenix
Copper Leach, Turf Vent Shaft,
Yanacocha Bio Leach, Conga, Merian,
Ahafo Mill Expansion, and Akyem for
2013.
Year Ended December 31, 2013
Costs Applicable to Sales
(1)
(2)(3)
Remediation Costs
(4)
Advanced Projects
and Exploration
General and Administrative
Other Expense,
Net (5)
Treatment and
Refining Costs
Sustaining Capital
(6)
All-In Sustaining
Costs
Ounces (000)/
Pounds (millions)
Sold
All-In Sustaining Costs per
oz/lb
GOLD
Carlin $ 767 $ 5 $ 34 $ - $ 7 $ 14 $ 154 $ 981 1,013 $ 968
Phoenix 164 3 7 - 2 9 20 205 225 911
Twin Creeks 273 6 7 - 4 - 56 346 518 668
La Herradura 177 - 42 - - - 74 293 183 1,601
Other North America - - 42 - 4 - 23 69 - -
North America 1,381 14 132 - 17 23 327 1,894 1,939 977
Yanacocha 684 90 41 - 63 - 148 1,026 1,022 1,004
Other South America - - 34 - 4 - - 38 - -
South America 684 90 75 - 67 - 148 1,064 1,022 1,041
Boddington 805 6 1 - 2 4 90 908 743 1,222
Tanami 270 3 11 - 3 - 91 378 325 1,163
Jundee 206 13 7 - 1 - 45 272 279 975
Waihi 103 3 5 - 2 - 7 120 111 1,081
Kalgoorlie 342 7 3 - 1 - 19 372 329 1,131
Other Australia/New Zealand - - 13 - 34 - 4 51 - -
Australia/New Zealand 1,726 32 40 - 43 4 256 2,101 1,787 1,176
Batu Hijau 107 2 2 - 3 5 12 131 46 2,848
Other Indonesia - - - - (2 ) - - (2 ) - -
Indonesia 107 2 2 - 1 5 12 129 46 2,804
Ahafo 307 3 51 - 14 - 109 484 566 855
Akyem 32 - 8 - 3 - - 43 129 333
Other Africa - - 8 - 10 - - 18 - -
Africa 339 3 67 - 27 - 109 545 695 784
Corporate and Other - - 137 203 25 - 12 377 - -
Total Gold $ 4,237 $ 141 $ 453 $ 203 $ 180 $ 32 $ 864 $ 6,110 5,489 $ 1,113
COPPER
Phoenix $ 52 $ 1 $ 3 $ - $ 1 $ 5 $ 7 $ 69 29 $ 2.38
Boddington 195 1 - - 1 19 22 238 71 3.35
Batu Hijau 815 9 13 - 24 47 93 1,001 158 6.34
Total Copper $ 1,062 $ 11 $ 16 $ - $ 26 $ 71 $ 122 $ 1,308 258 $ 5.07
Consolidated $ 5,299 $ 152 $ 469 $ 203 $ 206 $ 103 $ 986 $ 7,418

Adjusted Consolidated All-in Sustaining Cost Savings
(1) Portfolio changes include impacts from Jundee (sold on July 1, 2014), Midas as a component of Twin Creeks segment (sold on February 11, 2014), La Herradura (sold on October 6, 2014);
Akyem start-up (reached commercial production in October 2013), and the impact of the Batu Hijau interruption (Q2 and Q3 2014) as a result of export permit issues.(2) FX/Oil represents A$ impacts and Diesel Price impacts, net of hedging activities.(3) NRV's are related to write-downs recorded at Q2 2013 due to a change in long-term price assumptions, and Q3 14 at Batu Hijau related to the change in the export agreement(4) Used by management to illustrate savings from 2013 to 2014 based upon the adjusted consolidated AISC reflected in the tables above.
February 23, 2015 Newmont Mining Corporation I BMO Capital Markets 24th Global Metals & Mining Conference I 35

Endnotes
February 23, 2015 Newmont Mining Corporation I BMO Capital Markets 24th Global Metals & Mining Conference I 36
Investors are encouraged to read the information contained in this presentation in conjunction with the following notes, the Cautionary Statement on slide 2 and the factors described
under the “Risk Factors” section of the Company’s most recent Form 10-K, filed with the SEC on February 20, 2015, and disclosure in the Company’s recent SEC filings.
1. Savings figure represents adjusted consolidated AISC savings for 2014 as compared to 2013. This measure is a non-GAAP metric. See slide 35for more information and a
reconciliation to the nearest GAAP measure.
2. Historical AISC or All-in sustaining cost is a non-GAAP metric. See pages 30 to 34 for more information and a reconciliation to the nearest GAAP metric. All-in sustaining cost
(“AISC”) as used in the Company’s Outlook is a non-GAAP metric defined as the sum of cost applicable to sales (including all direct and indirect costs related to current gold
production incurred to execute on the current mine plan), remediation costs (including operating accretion and amortization of asset retirement costs), G&A, exploration expense,
advanced projects and R&D, treatment and refining costs, other expense, net of one-time adjustments and sustaining capital. See also note 6 below.
3. Adjusted EBITDA is a non-GAAP metric. See page 29 for more information and reconciliation to the nearest GAAP metric.
4. Reserves at Merian (as of December 31, 2014 on a 100% consolidated basis) were estimated at 126,700 ktonnes of Probable Reserves, grading 1.18 gpt for 4.8Moz, using a
$1,300/oz gold price assumption. Resources at Merian (as of December 31, 2014 on a 100% consolidated basis and using a $1,400/oz gold price assumption) were 730
kounces of Measured and Indicated resources, comprised of Measured resources of approximately 60 kounces (2,900 ktonnes, at 0.60 grams per tonne) and Indicated
resources of approximately 670 kounces (22,600 ktonnes, at 0.93 grams per tonne). Inferred resources totaled approximately 1,160kounces (35,900 ktonnes, at 1.00 grams per
tonne. See endnote 6 below.
5. 2015 and 2015 - 2017 Outlook projections used in this presentation (“Outlook”) are considered “forward-looking statements” and represent management’s good faith estimates
or expectations as December 31, 2014. However, Outlook is based upon certain assumptions, including, but not limited to, metal prices, oil prices, certain exchange rates and
other assumptions (including, without limitation, those set forth on slide 2). For example, 2015 - 2017 Outlook assumes $1,200/oz Au, $2.75/lb Cu, $0.85 USD/AUD exchange
rate and $75/barrel WTI and other assumptions. AISC and CAS cost estimates do not include the impact of inflation. Scheduled debt prepayments includes capital leases.
Such assumptions may prove to be incorrect and actual results may differ materially from those anticipated. Consequently, Outlook cannot be guaranteed. As such, investors
are cautioned not to place undue reliance upon Outlook and forward-looking statements as there can be no assurance that the plans, assumptions or expectations upon which
they are placed will occur.
6. Drill results are not necessarily indicative of future results and no assurances can be provided that such ounces will be converted to reserves or production. Whereas, the terms
“Resources,” “Measured and Indicated resources” , “Inferred resources” and “Inventory” are not SEC recognized terms. Newmont has determined that such “resources” would
be substantively the same as those prepared using the Guidelines established by the Society of Mining, Metallurgy and Exploration and defined as “Mineral Resource”.
Estimates of resources are subject to further exploration and development, are subject to additional risks, and no assurance can be given that they will eventually convert to
future reserves. Inferred Resources, in particular, have a great amount of uncertainty as to their existence and their economic and legal feasibility. Investors are cautioned not to
assume that any part or all of the Inferred Resource exists, or is economically or legally mineable. Investors are reminded that even if significant mineralization is discovered and
converted to reserves, during the time necessary to ultimately move such mineralization to production the economic feasibility of production may change. See the Company’s
Annual Report filed with the SEC on February 20, 2015 for the “Proven and Probable Reserve” tables prepared in compliance with the SEC’s Industry Guide 7. Investors are
reminded that the tables presented in the Annual Report are estimates as of December 31, 2014 and were presented on an attributable basis reflecting the Company’s
ownership interest at such time. The Company presently holds a 75% equity interest in the Merian project as a result of the government of Suriname recent opt-in.