BMO Mutual Funds 2015 · PDF fileBMO Mutual Funds 2015 ... Net investment income (3,211) (146)...
22
BMO Mutual Funds 2015 SEMI-ANNUAL FINANCIAL STATEMENTS June 30, 2015 BMO Asian Growth and Income Fund NOTICE OF NO AUDITOR REVIEW OF THE SEMI-ANNUAL FINANCIAL STATEMENTS BMO Investments Inc., the Manager of the Fund, appoints independent auditors to audit the Fund’s Annual Financial Statements. Under Canadian securities laws (National Instrument 81-106), if an auditor has not reviewed the Semi-Annual Financial Statements, this must be disclosed in an accompanying notice. The Fund’s independent auditors have not performed a review of these Semi-Annual Financial Statements in accordance with standards established by the Chartered Professional Accountants of Canada.
-
Upload
nguyenhanh -
Category
Documents
-
view
219 -
download
4
Transcript of BMO Mutual Funds 2015 · PDF fileBMO Mutual Funds 2015 ... Net investment income (3,211) (146)...
BMO Mutual Funds 2015SEMI-ANNUAL FINANCIAL STATEMENTS
June 30, 2015
BMO Asian Growth and Income Fund
NOTICE OF NO AUDITOR REVIEW OF THE SEMI-ANNUAL FINANCIAL STATEMENTS
BMO Investments Inc., the Manager of the Fund, appoints independent auditors to audit the Fund’s Annual Financial Statements. Under Canadian securities laws (National Instrument 81-106), if an auditor has not reviewed the Semi-Annual Financial Statements, this must be disclosed in an accompanying notice.
The Fund’s independent auditors have not performed a review of these Semi-Annual Financial Statements in accordance with standards established by the Chartered Professional Accountants of Canada.

STATEMENT OF FINANCIAL POSITION(All amounts in thousands of Canadian dollars, except per unit data)
STATEMENT OF COMPREHENSIVE INCOME(All amounts in thousands of Canadian dollars, except per unit data)
The accompanying notes are an integral part of these financial statements.
BMO Asian Growth and Income Fund (unaudited)
June 30 December 31 As at 2015 2014
ASSETS
CURRENT ASSETSCash 112,657 43,907Investments
Non-derivative financial assets 1,656,937 1,281,711Derivative assets 20 0
Receivable for investments sold 753 141Subscriptions receivable 8,262 5,947Interest receivable 214 191Dividends receivable 3,419 360Total assets 1,782,262 1,332,257
LIABILITIES
CURRENT LIABILITIESPayable for investments purchased 3,768 —Redemptions payable 2,247 516Derivative liabilities 5 0Distributions payable 4 1Accrued expenses 1,529 1,322Total liabilities 7,553 1,839
Net assets attributable to holders of redeemable units 1,774,709 1,330,418
Net assets attributable to holders of redeemable unitsSeries A Units 28,029 22,093Advisor Series Units 470,316 442,654Series F Units 167,628 132,410Premium Series Units 1 —Series D Units 662 255Series I Units 1,108,073 733,006
Net assets attributable to holders of redeemable units per unit Series A Units $ 14.33 $ 13.12Advisor Series Units $ 20.83 $ 19.07Series F Units $ 19.38 $ 17.74Premium Series Units $ 10.21 $ —Series D Units $ 11.23 $ 10.29Series I Units $ 16.42 $ 15.03
June 30 June 30 For the periods ended 2015 2014
INCOMEInterest income 320 (2,048)Dividend income 45,108 19,041Other changes in fair value of investments and
derivativesNet realized gain 66,774 14,804Change in unrealized appreciation 46,442 39,380
Net gain in fair value of investments and derivatives 158,644 71,177
Securities lending revenue 83 50Foreign exchange gain 50 710
Total other income 133 760
Total income 158,777 71,937
EXPENSESManagement fees (note 6) 6,954 6,561Variable administration fees (note 6) 325 438Audit fees 3 5Independent review committee fees 1 1Withholding taxes 2,661 1,562Custodian fees, interest and bank charges 151 191Legal and filing fees 14 10Fund Facts fees 0 —Unitholder reporting costs 16 24Commissions and other portfolio transaction costs (note 6) 1,311 651Operating expenses absorbed by the Manager (2) 0Total expenses 11,434 9,443
Increase in net assets attributable to holders of redeemable units 147,343 62,494
Increase (decrease) in net assets attributable to holders of redeemable unitsSeries A Units 2,117 918Advisor Series Units 43,636 21,495Series F Units 14,012 6,009Premium Series Units 0 —Series D Units 26 (1)Series I Units 87,552 34,073
Increase (decrease) in net assets attributable to holders of redeemable units per unit (note 3)Series A Units 1.20 0.58Advisor Series Units 1.93 0.87Series F Units 1.78 0.90Premium Series Units 0.21 —Series D Units 0.59 (0.04)Series I Units 1.44 0.85
The accompanying notes are an integral part of these financial statements.
BMO Asian Growth and Income Fund (unaudited)
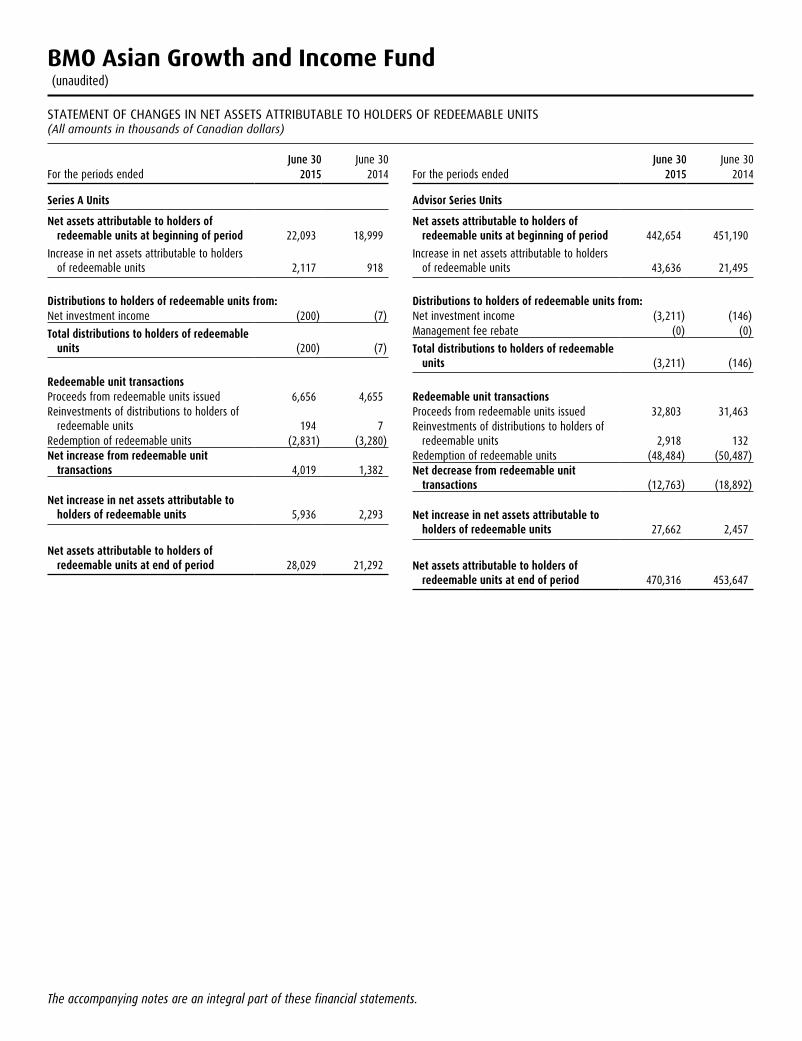
STATEMENT OF CHANGES IN NET ASSETS ATTRIBUTABLE TO HOLDERS OF REDEEMABLE UNITS(All amounts in thousands of Canadian dollars)
June 30 June 30 For the periods ended 2015 2014
Series A Units
Net assets attributable to holders of redeemable units at beginning of period 22,093 18,999
Increase in net assets attributable to holders of redeemable units 2,117 918
Distributions to holders of redeemable units from:Net investment income (200) (7)
Total distributions to holders of redeemable units (200) (7)
Redeemable unit transactionsProceeds from redeemable units issued 6,656 4,655Reinvestments of distributions to holders of
redeemable units 194 7Redemption of redeemable units (2,831) (3,280)Net increase from redeemable unit
transactions 4,019 1,382
Net increase in net assets attributable to holders of redeemable units 5,936 2,293
Net assets attributable to holders of redeemable units at end of period 28,029 21,292
June 30 June 30 For the periods ended 2015 2014
Advisor Series Units
Net assets attributable to holders of redeemable units at beginning of period 442,654 451,190
Increase in net assets attributable to holders of redeemable units 43,636 21,495
Distributions to holders of redeemable units from:Net investment income (3,211) (146)Management fee rebate (0) (0)
Total distributions to holders of redeemable units (3,211) (146)
Redeemable unit transactionsProceeds from redeemable units issued 32,803 31,463Reinvestments of distributions to holders of
redeemable units 2,918 132Redemption of redeemable units (48,484) (50,487)Net decrease from redeemable unit
transactions (12,763) (18,892)
Net increase in net assets attributable to holders of redeemable units 27,662 2,457
Net assets attributable to holders of redeemable units at end of period 470,316 453,647

The accompanying notes are an integral part of these financial statements.
BMO Asian Growth and Income Fund (unaudited)
STATEMENT OF CHANGES IN NET ASSETS ATTRIBUTABLE TO HOLDERS OF REDEEMABLE UNITS (cont’d)(All amounts in thousands of Canadian dollars)
June 30 June 30 For the periods ended 2015 2014
Series F Units
Net assets attributable to holders of redeemable units at beginning of period 132,410 105,565
Increase in net assets attributable to holders of redeemable units 14,012 6,009
Distributions to holders of redeemable units from:Net investment income (2,190) (747)
Total distributions to holders of redeemable units (2,190) (747)
Redeemable unit transactionsProceeds from redeemable units issued 35,522 19,625Reinvestments of distributions to holders of
redeemable units 1,777 601Redemption of redeemable units (13,903) (11,414)Net increase from redeemable unit
transactions 23,396 8,812
Net increase in net assets attributable to holders of redeemable units 35,218 14,074
Net assets attributable to holders of redeemable units at end of period 167,628 119,639
Premium Series Units
Net assets attributable to holders of redeemable units at beginning of period — —
Increase in net assets attributable to holders of redeemable units 0 —
Redeemable unit transactionsProceeds from redeemable units issued 1 —Net increase from redeemable unit
transactions 1 —
Net increase in net assets attributable to holders of redeemable units 1 —
Net assets attributable to holders of redeemable units at end of period 1 —
June 30 June 30 For the periods ended 2015 2014
Series D Units
Net assets attributable to holders of redeemable units at beginning of period 255 —
Increase (decrease) in net assets attributable to holders of redeemable units 26 (1)
Distributions to holders of redeemable units from:Net investment income (7) (0)
Total distributions to holders of redeemable units (7) (0)
Redeemable unit transactionsProceeds from redeemable units issued 449 162Reinvestments of distributions to holders of
redeemable units 6 0Redemption of redeemable units (67) —Net increase from redeemable unit
transactions 388 162
Net increase in net assets attributable to holders of redeemable units 407 161
Net assets attributable to holders of redeemable units at end of period 662 161

The accompanying notes are an integral part of these financial statements.
BMO Asian Growth and Income Fund (unaudited)
STATEMENT OF CHANGES IN NET ASSETS ATTRIBUTABLE TO HOLDERS OF REDEEMABLE UNITS (cont’d)(All amounts in thousands of Canadian dollars)
June 30 June 30 For the periods ended 2015 2014
Series I Units
Net assets attributable to holders of redeemable units at beginning of period 733,006 492,676
Increase in net assets attributable to holders of redeemable units 87,552 34,073
Distributions to holders of redeemable units from:Net investment income (20,930) (7,879)
Total distributions to holders of redeemable units (20,930) (7,879)
Redeemable unit transactionsProceeds from redeemable units issued 341,772 156,845Reinvestments of distributions to holders of
redeemable units 13,778 5,526Redemption of redeemable units (47,105) (17,769)Net increase from redeemable unit
transactions 308,445 144,602
Net increase in net assets attributable to holders of redeemable units 375,067 170,796
Net assets attributable to holders of redeemable units at end of period 1,108,073 663,472
Total FundNet assets attributable to holders of
redeemable units at beginning of period 1,330,418 1,068,430Increase in net assets attributable to holders
of redeemable units 147,343 62,494
Distributions to holders of redeemable units from:Net investment income (26,538) (8,779)Management fee rebate (0) (0)
Total distributions paid to holders of redeemable units (26,538) (8,779)
Redeemable unit transactionsProceeds from redeemable units issued 417,203 212,750Reinvestments of distributions to holders of
redeemable units 18,673 6,266Redemption of redeemable units (112,390) (82,950)
Net increase from redeemable unit transactions 323,486 136,066
Net increase in net assets attributable to holders of redeemable units 444,291 189,781
Net assets attributable to holders of redeemable units at end of period 1,774,709 1,258,211

The accompanying notes are an integral part of these financial statements.
BMO Asian Growth and Income Fund (unaudited)
STATEMENT OF CASH FLOWS(All amounts in thousands of Canadian dollars)
June 30 June 30 For the periods ended 2015 2014
Cash flows from operating activitiesIncrease in net assets attributable to holders of redeemable units 147,343 62,494Adjustments for:
Foreign exchange (gain) loss on cash (31) 23Net realized gain on sale of investments
and derivatives (66,774) (14,804)Change in unrealized appreciation of
investments and derivatives (46,442) (39,380)Increase in interest receivable (23) (30)Increase in dividends receivable (3,059) (1,333)Increase in accrued expenses 207 1Amortization of premium and discounts 288 2,772Dividend reinvestments (17,033) —Purchases of investments (561,289) (240,965)Proceeds from sale and maturity of
investments 319,271 97,751Cash outflows on derivatives (106) (449)
Net cash from operating activities (227,648) (133,920)
Cash flows used in financing activitiesDistributions paid to holders of redeemable
units, net of reinvested distributions (7,862) (2,512)Proceeds from issuances of redeemable
units 414,888 214,501Amounts paid on redemption of redeemable
units (110,659) (82,395)
Net cash used in financing activities 296,367 129,594
Foreign exchange gain (loss) on cash 31 (23)Net increase (decrease) in cash 68,719 (4,326)Cash at beginning of period 43,907 55,206
Cash at end of period 112,657 50,857
Supplementary InformationInterest received, net of withholding taxes* 585 694Dividends received, net of withholding taxes* 22,363 16,148*These items are from operating activities

BMO Asian Growth and Income Fund (unaudited)
SCHEDULE OF INVESTMENT PORTFOLIO June 30, 2015 (All amounts in thousands of Canadian dollars, unless otherwise noted)
The accompanying notes are an integral part of these financial statements.
Par Value
(in thousands)Cost ($)
Fair Value
($)
BONDS & DEBENTURES
Hong Kong — 4.2%Hengan International Group Company Limited,
Senior, Unsecured, Notes, Convertible, Putable, Zero Coupon, Jun 27, 2018 . . . . . . . . . . . . . . . . . . . . . . . .HK$ 113,000. . . . 16,559. . . . . . 19,353
Johnson Electric Holdings Ltd., Senior, Unsecured, Notes, Convertible, Putable, 1.000% Apr 2, 2021 . . . . . . . . . . . . . . . . . . . . . . . . . . . . . . . . . . . . . . . . . . . . . . . . . US$ 16,750. . . . 19,817. . . . . . 21,773
PB Issuer (No. 2) Limited, Senior, Unsecured, Notes, Convertible, Putable, 1.750% Apr 12, 2016 . . . . . . . . . . . . . . . . . . . . . . . . . . . . . . . . . . . . . . . . . . . . . . . . . . .US$ 7,510. . . . . . 8,015. . . . . . . 9,204
Shine Power International Ltd., Senior, Unsecured, Notes, Convertible, Putable, Zero Coupon, Jul 28, 2019 . . . . . . . . . . . . . . . . . . . . . . . . . . . . . . . . . . . . . . . . . . . .HK$ 150,000. . . . 22,033. . . . . . 23,589
. . . . . . . . . . . . . . . . . . . . . . . . . . . . . . . . . . . . . . . . . . . . . . . . . . . . . . . . . . . . . . . . . . . . . . . . . . . . . 66,424. . . . . . 73,919
Singapore — 1.9%CapitaLand Limited, Senior, Unsecured, Notes,
Convertible, Putable, 1.950% Oct 17, 2023 . . . . . . . SGD 34,750. . . . 29,795. . . . . . 33,333Total Bonds & Debentures — 6.1% . . . . . . . . . . . . . . . . . . . . . . . . . . . . . . . . . . . . 96,219. . . . 107,252
Number of Shares or Units
Cost+
($)
Fair Value
($)
EQUITIES
FOREIGN EQUITIES
Australia — 4.4%CSL Limited . . . . . . . . . . . . . . . . . . . . . . . . . . . . . . . . . . . . . . . . . . . . . . . . . . 352,740. . . . 18,368. . . . . . 29,244Insurance Australia Group Limited . . . . . . . . . . . . . . . . . . . . . . 4,764,863. . . . 26,042. . . . . . 25,583Woolworths Limited . . . . . . . . . . . . . . . . . . . . . . . . . . . . . . . . . . . . . . . . 888,499. . . . 29,056. . . . . . 22,965. . . . . . . . . . . . . . . . . . . . . . . . . . . . . . . . . . . . . . . . . . . . . . . . . . . . . . . . . . . . . . . . . . . . . . . . . . . . . 73,466. . . . . . 77,792
Hong Kong — 23.0%AIA Group Limited . . . . . . . . . . . . . . . . . . . . . . . . . . . . . . . . . . . . . . . . 5,987,800. . . . 27,664. . . . . . 48,881Cafe De Coral Holdings Limited . . . . . . . . . . . . . . . . . . . . . . . . . 6,336,000. . . . 20,781. . . . . . 28,579Cheung Kong Property Holdings Ltd. . . . . . . . . . . . . . . . . . . . . 1,515,060. . . . 17,033. . . . . . 15,697China Mobile Limited, ADR . . . . . . . . . . . . . . . . . . . . . . . . . . . . . . . . 430,500. . . . 23,727. . . . . . 34,461CK Hutchison Holdings Limited . . . . . . . . . . . . . . . . . . . . . . . . . . 1,515,060. . . . 29,930. . . . . . 27,748CLP Holdings Limited . . . . . . . . . . . . . . . . . . . . . . . . . . . . . . . . . . . . . 3,294,500. . . . 27,993. . . . . . 35,085Guangdong Investment Limited . . . . . . . . . . . . . . . . . . . . . . . 10,694,000. . . . 18,389. . . . . . 18,628Hang Lung Properties Limited . . . . . . . . . . . . . . . . . . . . . . . . . 10,490,020. . . . 37,757. . . . . . 38,775Jardine Matheson Holdings Limited . . . . . . . . . . . . . . . . . . . . . . . 821,000. . . . 52,649. . . . . . 58,026Techtronic Industries Company Limited . . . . . . . . . . . . . . . . . 7,166,500. . . . 30,791. . . . . . 29,473Television Broadcasts Limited . . . . . . . . . . . . . . . . . . . . . . . . . . . . . 571,900. . . . . . 3,775. . . . . . . 4,246Vitasoy International Holdings Limited . . . . . . . . . . . . . . . 16,382,000. . . . 16,395. . . . . . 34,861VTech Holdings Limited . . . . . . . . . . . . . . . . . . . . . . . . . . . . . . . . . . 2,031,400. . . . 24,781. . . . . . 33,678. . . . . . . . . . . . . . . . . . . . . . . . . . . . . . . . . . . . . . . . . . . . . . . . . . . . . . . . . . . . . . . . . . . . . . . . . . . . 331,665. . . . 408,138
Indonesia — 2.9%PT Perusahaan Gas Negara (Persero) Tbk . . . . . . . . . . . . 53,958,800. . . . 25,105. . . . . . 21,777PT Telekomunikasi Indonesia (Persero) TBK, ADR . . . . . . . 548,980. . . . 23,759. . . . . . 29,751. . . . . . . . . . . . . . . . . . . . . . . . . . . . . . . . . . . . . . . . . . . . . . . . . . . . . . . . . . . . . . . . . . . . . . . . . . . . . 48,864. . . . . . 51,528
Japan — 5.5%Japan Tobacco Inc. . . . . . . . . . . . . . . . . . . . . . . . . . . . . . . . . . . . . . . . . . . 797,600. . . . 26,697. . . . . . 35,453KDDI Corp. . . . . . . . . . . . . . . . . . . . . . . . . . . . . . . . . . . . . . . . . . . . . . . . . . 1,005,700. . . . 29,253. . . . . . 30,209Lawson, Inc.. . . . . . . . . . . . . . . . . . . . . . . . . . . . . . . . . . . . . . . . . . . . . . . . . 382,400. . . . 28,673. . . . . . 32,672. . . . . . . . . . . . . . . . . . . . . . . . . . . . . . . . . . . . . . . . . . . . . . . . . . . . . . . . . . . . . . . . . . . . . . . . . . . . . 84,623. . . . . . 98,334
Number of Shares or Units
Cost+
($)
Fair Value
($)
Malaysia — 7.7%AMMB Holdings Berhad . . . . . . . . . . . . . . . . . . . . . . . . . . . . . . . . 14,619,400. . . . 32,076. . . . . . 29,182Axiata Group Berhad . . . . . . . . . . . . . . . . . . . . . . . . . . . . . . . . . . . 12,413,375. . . . 23,326. . . . . . 26,301British American Tobacco (Malaysia) Berhad . . . . . . . . . . . 1,433,200. . . . 30,461. . . . . . 29,449Genting Malaysia Berhad . . . . . . . . . . . . . . . . . . . . . . . . . . . . . . 25,885,100. . . . 33,684. . . . . . 35,841Telekom Malaysia Berhad . . . . . . . . . . . . . . . . . . . . . . . . . . . . . . . 6,969,075. . . . 10,431. . . . . . 15,077. . . . . . . . . . . . . . . . . . . . . . . . . . . . . . . . . . . . . . . . . . . . . . . . . . . . . . . . . . . . . . . . . . . . . . . . . . . . 129,978. . . . 135,850
New Zealand — 2.9%SKY Network Television Limited . . . . . . . . . . . . . . . . . . . . . . . . . 5,125,656. . . . 28,171. . . . . . 26,065SKYCITY Entertainment Group Limited . . . . . . . . . . . . . . . . . . 7,183,493. . . . 26,759. . . . . . 25,599. . . . . . . . . . . . . . . . . . . . . . . . . . . . . . . . . . . . . . . . . . . . . . . . . . . . . . . . . . . . . . . . . . . . . . . . . . . . . 54,930. . . . . . 51,664
Philippines — 2.5%Globe Telecom, Inc. . . . . . . . . . . . . . . . . . . . . . . . . . . . . . . . . . . . . . . . . 644,970. . . . 21,736. . . . . . 44,784
Singapore — 14.2%ARA Asset Management Limited, REIT . . . . . . . . . . . . . . . . 10,274,350. . . . 10,728. . . . . . 16,624Ascendas REIT . . . . . . . . . . . . . . . . . . . . . . . . . . . . . . . . . . . . . . . . . . . 18,046,804. . . . 32,295. . . . . . 41,123Keppel Corporation Limited . . . . . . . . . . . . . . . . . . . . . . . . . . . . . . 3,910,300. . . . 27,249. . . . . . 29,765SIA Engineering Company Limited . . . . . . . . . . . . . . . . . . . . . . 7,038,300. . . . 26,152. . . . . . 25,049Singapore Post Limited . . . . . . . . . . . . . . . . . . . . . . . . . . . . . . . . 13,674,900. . . . 15,660. . . . . . 24,031Singapore Technologies Engineering Ltd. . . . . . . . . . . . . . 14,384,855. . . . 38,587. . . . . . 43,980Singapore Telecommunications Limited . . . . . . . . . . . . . . . . 7,233,500. . . . 27,204. . . . . . 28,090United Overseas Bank Limited . . . . . . . . . . . . . . . . . . . . . . . . . . 2,019,900. . . . 33,882. . . . . . 43,167. . . . . . . . . . . . . . . . . . . . . . . . . . . . . . . . . . . . . . . . . . . . . . . . . . . . . . . . . . . . . . . . . . . . . . . . . . . . 211,757. . . . 251,829
South Korea — 9.0%GS Home Shopping Inc. . . . . . . . . . . . . . . . . . . . . . . . . . . . . . . . . . . . . . 81,555. . . . 10,296. . . . . . 19,155Hyundai Motor Company, Preference . . . . . . . . . . . . . . . . . . . . . 122,455. . . . . . 8,970. . . . . . 14,048Hyundai Motor Company, Second Preference . . . . . . . . . . . . . 86,773. . . . . . 5,944. . . . . . 10,189Kangwon Land Inc. . . . . . . . . . . . . . . . . . . . . . . . . . . . . . . . . . . . . . . . . . 717,716. . . . 30,332. . . . . . 29,714KEPCO Plant Service & Engineering Co., Ltd. . . . . . . . . . . . . . 128,851. . . . 10,938. . . . . . 17,022KT&G Corporation . . . . . . . . . . . . . . . . . . . . . . . . . . . . . . . . . . . . . . . . . . . 254,823. . . . 20,466. . . . . . 26,975LG Household & Health Care Ltd., Preference . . . . . . . . . . . . . 43,634. . . . . . 6,085. . . . . . 16,549Samsung Electronics Co., Ltd. . . . . . . . . . . . . . . . . . . . . . . . . . . . . . . . 18,556. . . . 25,320. . . . . . 26,328. . . . . . . . . . . . . . . . . . . . . . . . . . . . . . . . . . . . . . . . . . . . . . . . . . . . . . . . . . . . . . . . . . . . . . . . . . . . 118,351. . . . 159,980
Taiwan — 4.7%Chunghwa Telecom Co., Ltd., ADR . . . . . . . . . . . . . . . . . . . . . . . . 609,579. . . . 19,376. . . . . . 24,303Taiwan Semiconductor Manufacturing Company
Limited, ADR . . . . . . . . . . . . . . . . . . . . . . . . . . . . . . . . . . . . . . . . . . . . 962,277. . . . 14,138. . . . . . 27,295Taiwan Semiconductor Manufacturing Company
Ltd. . . . . . . . . . . . . . . . . . . . . . . . . . . . . . . . . . . . . . . . . . . . . . . . . . . . . . 5,750,414. . . . 15,999. . . . . . 32,362. . . . . . . . . . . . . . . . . . . . . . . . . . . . . . . . . . . . . . . . . . . . . . . . . . . . . . . . . . . . . . . . . . . . . . . . . . . . . 49,513. . . . . . 83,960
Thailand — 3.9%Advanced Info Service Public Company Limited,
Foreign Market . . . . . . . . . . . . . . . . . . . . . . . . . . . . . . . . . . . . . . . . 3,305,300. . . . 26,487. . . . . . 29,252BEC World Public Company Limited, Foreign
Market . . . . . . . . . . . . . . . . . . . . . . . . . . . . . . . . . . . . . . . . . . . . . . . 13,832,600. . . . 18,580. . . . . . 19,119Glow Energy Public Company Limited, Foreign
Market . . . . . . . . . . . . . . . . . . . . . . . . . . . . . . . . . . . . . . . . . . . . . . . . . 6,910,200. . . . 12,968. . . . . . 21,702. . . . . . . . . . . . . . . . . . . . . . . . . . . . . . . . . . . . . . . . . . . . . . . . . . . . . . . . . . . . . . . . . . . . . . . . . . . . . 58,035. . . . . . 70,073
United Kingdom — 3.6%BHP Billiton Plc . . . . . . . . . . . . . . . . . . . . . . . . . . . . . . . . . . . . . . . . . . . 1,028,596. . . . 28,555. . . . . . 25,235HSBC Holdings plc, ADR . . . . . . . . . . . . . . . . . . . . . . . . . . . . . . . . . . . . 675,904. . . . 37,551. . . . . . 37,829. . . . . . . . . . . . . . . . . . . . . . . . . . . . . . . . . . . . . . . . . . . . . . . . . . . . . . . . . . . . . . . . . . . . . . . . . . . . . 66,106. . . . . . 63,064
United States — 3.0%Yum! Brands, Inc. . . . . . . . . . . . . . . . . . . . . . . . . . . . . . . . . . . . . . . . . . . . 465,800. . . . 40,485. . . . . . 52,407
BMO Asian Growth and Income Fund (unaudited)
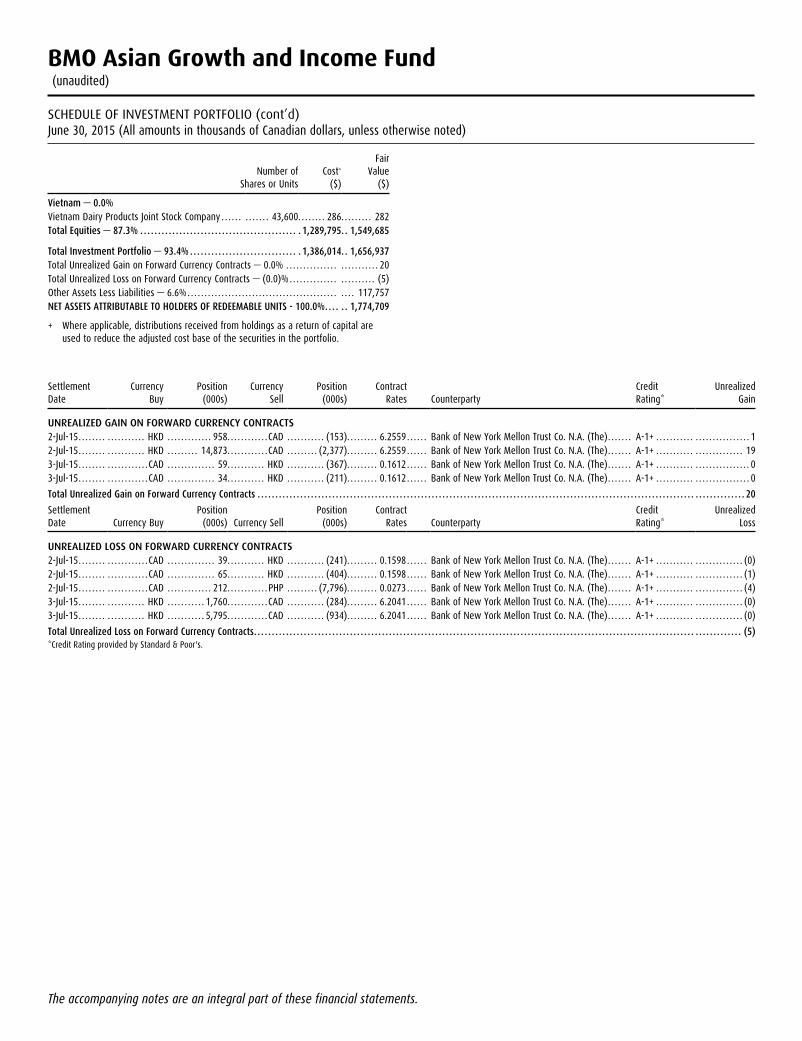
SCHEDULE OF INVESTMENT PORTFOLIO (cont’d)June 30, 2015 (All amounts in thousands of Canadian dollars, unless otherwise noted)
The accompanying notes are an integral part of these financial statements.
Number of Shares or Units
Cost+
($)
Fair Value
($)
Vietnam — 0.0%Vietnam Dairy Products Joint Stock Company . . . . . . . . . . . . . 43,600. . . . . . . . 286. . . . . . . . . 282Total Equities — 87.3% . . . . . . . . . . . . . . . . . . . . . . . . . . . . . . . . . . . . . . . . . . . . . 1,289,795. . 1,549,685
Total Investment Portfolio — 93.4% . . . . . . . . . . . . . . . . . . . . . . . . . . . . . . . 1,386,014. . 1,656,937Total Unrealized Gain on Forward Currency Contracts — 0.0% . . . . . . . . . . . . . . . . . . . . . . . . . . 20Total Unrealized Loss on Forward Currency Contracts — (0.0)% . . . . . . . . . . . . . . . . . . . . . . . . (5)Other Assets Less Liabilities — 6.6% . . . . . . . . . . . . . . . . . . . . . . . . . . . . . . . . . . . . . . . . . . . . . . . . 117,757NET ASSETS ATTRIBUTABLE TO HOLDERS OF REDEEMABLE UNITS - 100.0% . . . . . . 1,774,709
+ Where applicable, distributions received from holdings as a return of capital are used to reduce the adjusted cost base of the securities in the portfolio.
Settlement Date
Currency Buy
Position (000s)
Currency Sell
Position (000s)
Contract Rates Counterparty
Credit Rating*
Unrealized Gain
UNREALIZED GAIN ON FORWARD CURRENCY CONTRACTS2-Jul-15 . . . . . . . . . . . . . . . . . . . HKD . . . . . . . . . . . . . 958. . . . . . . . . . . .CAD . . . . . . . . . . . (153). . . . . . . . . 6.2559. . . . . . Bank of New York Mellon Trust Co. N.A. (The) . . . . . . . A-1+ . . . . . . . . . . . . . . . . . . . . . . . . . . . 12-Jul-15 . . . . . . . . . . . . . . . . . . . HKD . . . . . . . . . 14,873. . . . . . . . . . . .CAD . . . . . . . . . (2,377). . . . . . . . . 6.2559. . . . . . Bank of New York Mellon Trust Co. N.A. (The) . . . . . . . A-1+ . . . . . . . . . . . . . . . . . . . . . . . . . 193-Jul-15 . . . . . . . . . . . . . . . . . . . .CAD . . . . . . . . . . . . . . 59. . . . . . . . . . . HKD . . . . . . . . . . . (367). . . . . . . . . 0.1612. . . . . . Bank of New York Mellon Trust Co. N.A. (The) . . . . . . . A-1+ . . . . . . . . . . . . . . . . . . . . . . . . . . . 03-Jul-15 . . . . . . . . . . . . . . . . . . . .CAD . . . . . . . . . . . . . . 34. . . . . . . . . . . HKD . . . . . . . . . . . (211). . . . . . . . . 0.1612. . . . . . Bank of New York Mellon Trust Co. N.A. (The) . . . . . . . A-1+ . . . . . . . . . . . . . . . . . . . . . . . . . . . 0
Total Unrealized Gain on Forward Currency Contracts . . . . . . . . . . . . . . . . . . . . . . . . . . . . . . . . . . . . . . . . . . . . . . . . . . . . . . . . . . . . . . . . . . . . . . . . . . . . . . . . . . . . . . . . . . . . . . . . . . . . . . . . . . . . . . . . . . . . . . . . . . . . . . . . . . . . . . . . . 20
Settlement Date Currency Buy
Position (000s) Currency Sell
Position (000s)
Contract Rates Counterparty
Credit Rating*
Unrealized Loss
UNREALIZED LOSS ON FORWARD CURRENCY CONTRACTS2-Jul-15 . . . . . . . . . . . . . . . . . . . .CAD . . . . . . . . . . . . . . 39. . . . . . . . . . . HKD . . . . . . . . . . . (241). . . . . . . . . 0.1598. . . . . . Bank of New York Mellon Trust Co. N.A. (The) . . . . . . . A-1+ . . . . . . . . . . . . . . . . . . . . . . . . . (0)2-Jul-15 . . . . . . . . . . . . . . . . . . . .CAD . . . . . . . . . . . . . . 65. . . . . . . . . . . HKD . . . . . . . . . . . (404). . . . . . . . . 0.1598. . . . . . Bank of New York Mellon Trust Co. N.A. (The) . . . . . . . A-1+ . . . . . . . . . . . . . . . . . . . . . . . . . (1)2-Jul-15 . . . . . . . . . . . . . . . . . . . .CAD . . . . . . . . . . . . . 212. . . . . . . . . . . . PHP . . . . . . . . . (7,796). . . . . . . . . 0.0273. . . . . . Bank of New York Mellon Trust Co. N.A. (The) . . . . . . . A-1+ . . . . . . . . . . . . . . . . . . . . . . . . . (4)3-Jul-15 . . . . . . . . . . . . . . . . . . . HKD . . . . . . . . . . . 1,760. . . . . . . . . . . .CAD . . . . . . . . . . . (284). . . . . . . . . 6.2041. . . . . . Bank of New York Mellon Trust Co. N.A. (The) . . . . . . . A-1+ . . . . . . . . . . . . . . . . . . . . . . . . . (0)3-Jul-15 . . . . . . . . . . . . . . . . . . . HKD . . . . . . . . . . . 5,795. . . . . . . . . . . .CAD . . . . . . . . . . . (934). . . . . . . . . 6.2041. . . . . . Bank of New York Mellon Trust Co. N.A. (The) . . . . . . . A-1+ . . . . . . . . . . . . . . . . . . . . . . . . . (0)
Total Unrealized Loss on Forward Currency Contracts . . . . . . . . . . . . . . . . . . . . . . . . . . . . . . . . . . . . . . . . . . . . . . . . . . . . . . . . . . . . . . . . . . . . . . . . . . . . . . . . . . . . . . . . . . . . . . . . . . . . . . . . . . . . . . . . . . . . . . . . . . . . . . . . . . . . . . . . . (5)*Credit Rating provided by Standard & Poor's.

BMO Asian Growth and Income Fund (unaudited)
NOTES TO THE FINANCIAL STATEMENTS(All amounts in thousands of Canadian dollars, except per unit data)June 30, 2015
1. The Mutual FundBMO Asian Growth and Income Fund [“the Fund”] is an open-ended mutual fund trust established under the laws of the province of Ontario by Declaration of Trust. BMO Investments Inc. (“the Manager”) is the Manager and Trustee of the Fund. The Manager is a wholly owned subsidiary of Bank of Montreal. The address of the Fund’s registered office is 100 King Street West, Toronto, Ontario.
The information provided in these unaudited interim financial statements is for the periods ended June 30, 2015 and June 30, 2014, except for the comparative information in the Statement of Financial Position and the related notes which are as at December 31, 2014. Financial information for a Fund established during the period(s) is presented from the date of inception as noted in Note 8. Financial information provided for a series established during the period(s) is presented from the launch date as noted in Note 8.
These financial statements were authorized for issue by the Manager on August 11, 2015.
2. Basis of preparation and presentationThese unaudited interim financial statements have been prepared in accordance with International Financial Reporting Standards (“IFRS”) as issued by the International Accounting Standards Board (“IASB”). The Fund adopted this basis of accounting effective January 1, 2014, as required by Canadian securities legislation and the Canadian Accounting Standards Board. Certain prior period balances have been reclassified to conform with the current period presentation.
3. Summary of significant accounting policiesFinancial instrumentsThe Fund records financial instruments at fair value. Investment transactions are accounted for on the trade date. The Fund’s investments are either designated at fair value through profit or loss (“FVTPL”) at inception or classified as held for trading. The changes in the investment fair values and related transaction costs are recorded in the Fund’s Statement of Comprehensive Income.
Financial assets or financial liabilities held for trading are those acquired or incurred principally for the purpose of selling or repurchasing in the near future, or on initial recognition, are part of a portfolio of
identified financial instruments that the Fund manages together and that have a recent actual pattern of short-term profit taking. The Fund classifies all derivatives and short positions as held for trading. The Fund does not designate any derivatives as hedges in a hedging relationship.
The Fund designates all other investments at FVTPL, as they have reliably measurable fair values, are part of a group of financial assets or financial liabilities that are managed and have their performance evaluated on a fair value basis in accordance with the Fund’s investment strategy.
The Fund has issued multiple series of redeemable units which are equally subordinated but are not identical and consequently, do not meet the conditions to be classified as equity. As a result, the Fund’s obligations for net assets attributable to holders of redeemable units are presented at the redemption amounts.
All other financial assets and financial liabilities are measured at amortized cost. Under this method, financial assets and financial liabilities reflect the amount required to be received or paid or discounted, when appropriate, at the contract’s effective interest rate.
The Fund has determined that it meets the definition of “investment entity” and as a result, it measures subsidiaries other than those which provide services to the Fund, at FVTPL.
Cost of investmentsThe cost of investments represents the amount paid for each security and is determined on an average cost basis.
Fair value measurementInvestments are recorded at their fair value with the change between this amount and their average cost being recorded as change in unrealized appreciation (depreciation) in the Statement of Comprehensive Income.
For exchange traded securities close prices are considered to be fair value if they fall within the bid-ask spread. In circumstances where the close price is not within the bid-ask spread, the Manager determines the point within the bid-ask spread that is most representative of fair value based on the specific facts and circumstances.

BMO Asian Growth and Income Fund (unaudited)
NOTES TO THE FINANCIAL STATEMENTS (cont’d)(All amounts in thousands of Canadian dollars, except per unit data)June 30, 2015
Procedures are in place to fair value securities traded in countries outside of North America daily, to avoid stale prices and to take into account among other things, any significant events occurring after the close of a foreign market.
For bonds, debentures, asset-backed securities and other debt securities fair value is represented by bid prices provided by independent security pricing services. Short-term investments, if any, are carried at amortized cost which approximates fair value. Unlisted warrants, if any, are valued based on a pricing model which considers factors such as the market value of the underlying security, strike price and terms of the warrant.
Mutual fund units held as investments are valued at their respective Net Asset Value (“NAV”) on each Valuation Date (the “Valuation Date” is each day on which the Toronto Stock Exchange is open for trading), as these values are the most readily and regularly available.
For securities where market quotes are not available, unreliable or not considered to reflect the current value, the Fund may determine another value which it considers to be fair and reasonable, or using a valuation technique that, to the extent possible, makes maximum use of inputs and assumptions based on observable market data including volatility, comparable companies and other applicable rates or prices. These estimation techniques include discounted cash flows, internal models that utilize observable data or comparisons with other securities that are substantially similar. In limited circumstances, the Fund uses internal models where the inputs are not based on observable market data.
Derivative instrumentsDerivative instruments are financial contracts that derive their value from underlying changes in interest rates, foreign exchange rates or other financial or commodity prices or indices.
Derivative instruments are either regulated exchange-traded contracts or negotiated over-the-counter contracts. The Fund may use these instruments for trading purposes, as well as to manage the Fund’s risk exposures.
Derivatives are marked to fair value. Discussion of the fair value measurement of derivatives is included in
Note 3. Realized and unrealized gains and losses are recorded in the Statement of Comprehensive Income.
Forward currency contractsA forward currency contract is an agreement between two parties (the Fund and the counterparty) to purchase or sell a currency against another currency at a set price on a future date. The Fund may enter into forward currency contracts for hedging purposes which can include the economic hedging of all or a portion of the currency exposure of an investment or group of investments, either directly or indirectly. The Fund may also enter into these contracts for non-hedging purposes which can include increasing the exposure to a foreign currency or the shifting exposure to foreign currency fluctuations from one country to another. The value of forward currency contracts entered into by the Fund is recorded as the difference between the value of the contract on the Valuation Date and the value on the date the contract originated.
Income recognitionDividend income and distributions from investment trust units are recognized on the ex-dividend and ex-distribution date, respectively.
Interest income from interest bearing investments is recognized in the Statement of Comprehensive Income using the effective interest rate. Interest receivable shown in the Statement of Financial Position is accrued based on the interest bearing investments’ stated rates of interest.
Interest on inflation-indexed bonds is paid based on a principal value, which is adjusted for inflation. The inflation adjustment of the principal value is recognized as part of interest income in the Statement of Comprehensive Income. If held to maturity, the Fund will receive, in addition to a coupon interest payment, a final payment equal to the sum of the par value and the inflation compensation accrued from the original issue date. Interest is accrued on each Valuation Date based on the inflation adjusted par value at that time and is included in “Interest income” in the Statement of Comprehensive Income.
Foreign currency translationThe fair value of investments and other assets and liabilities in foreign currencies are translated into the Fund’s functional currency at the rates of exchange prevailing at the period-end date. Purchases and sales of investments, and income and expenses are

BMO Asian Growth and Income Fund (unaudited)
NOTES TO THE FINANCIAL STATEMENTS (cont’d)(All amounts in thousands of Canadian dollars, except per unit data)June 30, 2015
translated at the rates of exchange prevailing on the respective dates of such transactions. Foreign exchange gains (losses) on completed transactions are included in “Realized gains (losses)” and unrealized foreign exchange gains (losses) are included in “Change in unrealized appreciation (depreciation)” in the Statement of Comprehensive Income. Foreign exchange gains and losses relating to cash, receivables and payables are included as "Foreign exchange gain (loss)".
Securities lendingA Fund may engage in securities lending pursuant to the terms of an agreement which includes restrictions as set out in Canadian securities legislation. Collateral held is government Treasury Bills and qualified Notes.
Income from securities lending, where applicable, is included in the Statement of Comprehensive Income and is recognized when earned. The market value of the securities loaned and collateral held is determined daily. Aggregate values of securities held in trust as at June 30, 2015 and December 31, 2014, where applicable, are disclosed in Note 8.
Short-term trading penaltyTo discourage excessive trading, the Fund may, at the Manager’s sole discretion, charge a short-term trading penalty. This penalty is paid directly to the Fund and is included in “Short-term penalty fees” in the Statement of Comprehensive Income.
CashCash is comprised of cash and deposits with banks which include bankers’ acceptances and overnight demand deposits. Cash is recorded at amortized cost.
Other assets and other liabilitiesDividends receivable, interest receivable, distributions form investment trust units receivable, due from broker and subscriptions receivable are measured at fair value and subsequently measured at amortized cost. Similarly, due to broker, redemptions payable and accrued expenses are measured at amortized cost. Other assets and liabilities are short-term in nature, and are carried at cost or amortized cost.
Increase or decrease in net assets attributable to holders of redeemable units“Increase (decrease) in net assets attributable to holders of redeemable units per unit” of a series in the Statement of Comprehensive Income represents the increase (decrease) in net assets attributable to holders of redeemable units (“Net Assets”) of the series divided by the weighted average number of units of the series outstanding during the period.
TaxationThe Fund qualifies as a unit trust under the provisions of the Income Tax Act (Canada). Distributions of all net taxable income and sufficient amounts of net realized capital gains for each taxation year will be paid to unitholders so that the Fund will not be subject to income tax. As a result, the Fund has determined that it is in substance not taxable and therefore does not record income taxes in the Statement of Comprehensive Income nor does it recognize any deferred tax assets in the Statement of Financial Position.
The Fund incurs withholding taxes imposed by certain countries on investment income and capital gains. Such income and gains are recorded on a gross basis with the related withholding taxes shown as a separate expense in the Statement of Comprehensive Income.
Investments in associates, joint ventures and subsidiariesSubsidiaries are entities over which the Fund has control through its exposure or rights to variable returns from its investment and has the ability to affect those returns through its power over the entity. The Fund has determined that it is an investment entity and as such, it accounts for subsidiaries at fair value. Joint ventures are those where the Fund exercises joint control through an agreement with other shareholders, and associates are investments in which the Fund exerts significant influence over operating, investing, and financing decisions (such as entities in which the Fund owns 20% - 50% of voting shares), all of which have been designated at FVTPL.
Unconsolidated structured entitiesThe Fund has determined that the underlying funds in which the Fund invests are unconsolidated structured entities. This determination is based on the fact that decision making about the underlying funds is not governed by the voting right or other similar right held by the Fund. Similarly, investments in securitizations,

BMO Asian Growth and Income Fund (unaudited)
NOTES TO THE FINANCIAL STATEMENTS (cont’d)(All amounts in thousands of Canadian dollars, except per unit data)June 30, 2015
asset-backed securities and mortgage-backed securities are also disclosed as interest in unconsolidated structured entities.
The Fund invests in underlying funds whose investment objectives range from achieving short-term to long-term income and capital growth potential. Underlying funds may use leverage in a manner consistent with their respective investment objectives and as permitted by Canadian securities regulatory authorities. Underlying funds finance their operations by issuing redeemable units which are puttable at the holders’ option and entitles the holder to a proportionate stake in the respective Fund’s Net Assets. The change in fair value of each of the underlying funds during the periods is included in “Change in unrealized appreciation (depreciation) of investments” in the Statements of Comprehensive Income.
Mortgage-related securities are created from pools of residential or commercial mortgage loans, including mortgage loans made by savings and loan institutions, mortgage bankers, commercial banks and others. Asset-backed securities are created from many types of assets, including auto loans, credit card receivables, home equity loans and student loans.
The Fund does not provide and has not committed to providing any additional significant financial information or other support to the unconsolidated structured entities other than its investment in the unconsolidated structured entities. During the periods, the Fund had no sponsored unconsolidated structured entities.
Additional information on the Fund’s interest in unconsolidated structured entities, where applicable, is provided in Note 8.
Offsetting of financial assets and financial liabilitiesFinancial instruments are presented at net or gross amounts on the Statement of Financial Position depending on the existence of intention and legal right to offset opposite positions of such instruments held with the same counterparties. Amounts offset in the Statement of Financial Position are transactions for which the Fund has legally enforceable rights to offset and intends to settle the positions on a net basis. Amounts not offset in the Statement of Financial Position relate to transactions where a master netting arrangement or similar agreement is in place with a right to offset only in the event of default, insolvency
or bankruptcy, or where the Fund has no intention of settling on a net basis.
Accounting standards issued but not yet adoptedBelow are accounting standards issued or amended but not yet effective and not yet adopted. The Manager does not expect the adoption of these standards or amendments to have significant impact to the Fund’s financial statements.
In July 2014, the IASB issued the final version of IFRS 9 Financial Instruments, which addresses classification and measurement, impairment and hedge accounting.
The new standard requires assets to be carried at amortized cost, FVTPL or fair value through other comprehensive income based on the entity’s business model for managing financial assets and the contractual cash flow characteristics of the financial asset. The classification and measurement of liabilities remains generally unchanged with the exception of liabilities recorded at FVTPL. For these liabilities, fair value changes attributable to changes in the entity’s own credit risk are to be presented in other comprehensive income unless they affect amounts recorded in income.
The new standard also addresses impairment of financial assets. It also introduced a new hedge accounting model that expands the scope of eligible hedged items and risks eligible for hedge accounting, and aligns hedge accounting more closely with risk management.
The new standard is effective for the Fund for its fiscal year beginning January 1, 2018. The Fund is evaluating the impact of this standard on its financial statements.
4. Critical accounting estimates and judgementsThe preparation of financial statements requires the use of judgement in applying the Fund’s accounting policies and to make estimates and assumptions about the future. The following discusses the most significant accounting judgements and estimates that the Fund has made in preparing its financial statements:
Accounting judgements:Functional and presentation currencyThe Fund’s unitholders are mainly Canadian residents, with the subscriptions and redemptions of the redeemable units denominated in Canadian dollars. The Fund invests in Canadian and U.S. dollars and
BMO Asian Growth and Income Fund (unaudited)
NOTES TO THE FINANCIAL STATEMENTS (cont’d)(All amounts in thousands of Canadian dollars, except per unit data)June 30, 2015
other foreign denominated securities, as applicable. The performance of the Fund is measured and reported to the investors in Canadian dollars. The Manager considers the Canadian dollar as the currency that most faithfully represents the economic effects of the underlying transactions, events and conditions. The financial statements are presented in Canadian dollars, which is the Fund's functional and presentation currency.
Classification of measurement of financial instruments and application of fair value optionIn classifying and measuring financial instruments held by the Fund, the Manager is required to make significant judgements about whether or not the business of the Fund is to invest on a total return basis for the purpose of applying the fair value options for financial assets.
Accounting estimates:Fair value measurement of securities not quoted in an active marketThe Fund has established policies and control procedures that are intended to ensure these judgements are well controlled, independently reviewed, and consistently applied from period to period. The estimates of the value of the Fund’s assets and liabilities are believed to be appropriate as at the reporting date.
The Fund may hold financial instruments that are not quoted in active markets. Note 3 discusses the policies used by the Fund for the estimates used in determining fair value.
5. Units and unit transactionsThe redeemable units of the Fund are classified as liabilities.
The units have no par value and are entitled to distributions, if any. Upon redemption, a unit is entitled to a proportionate share of the Fund’s NAV. The Fund is required to pay distributions in an amount not less than the amount necessary to ensure the Fund will not be liable for income taxes. The Fund has no restrictions or specific capital requirements on the subscriptions and redemptions of units except as disclosed in Note 8. The relevant movements in redeemable units are shown on the Statement of Changes in Net Assets Attributable to Holders of Redeemable Units. In accordance with its investment objectives and strategies, and the risk management
practices outlined in Note 7, the Fund endeavours to invest the subscriptions received in appropriate investments, while maintaining sufficient liquidity to meet redemptions, with such liquidity being augmented by short-term borrowings or disposal of investments where necessary.
Redeemable units of the Fund are offered for sale on a continuous basis and may be purchased or redeemed on any Valuation Date at the NAV per unit of a particular series. The NAV per unit of a series for the purposes of subscription or redemption is computed by dividing the NAV of the Fund attributable to the series (that is, the total fair value of the assets attributable to the series less the liabilities attributable to the series) by the total number of units of the series of the Fund outstanding at such time.
Expenses directly attributable to a series are charged to that series. Other expenses, income, realized and unrealized gains and losses from investment transactions are allocated proportionately to each series based upon the relative NAV of each series.
6. Related party transactions(a) Management FeesThe Manager is responsible for the day-to-day management of the Fund and its investment portfolio in compliance with the Fund’s constating documents. The Manager monitors and evaluates the performance of the Fund, pays for the investment management services of the investment advisors and provides all related administrative services required by the Fund. As compensation for its services the Manager is entitled to receive a fee payable monthly, calculated at the maximum annual rates included in Note 8.
(b) Fixed administration feesThe Manager pays certain operating expenses of the series A, Advisor, Premium and T6 including audit and legal fees and expenses; custodian and transfer agency fees; costs attributable to the issue, redemption and change of securities, including the cost of the securityholder record keeping system; expenses incurred in respect of preparing and distributing prospectuses, financial reports and other types of reports, statements and communications to securityholders; fund accounting and valuation costs; filing fees, including those incurred by the manager (collectively the “Administration Expenses”). In return, the Fund pays a fixed administration fee to the
BMO Asian Growth and Income Fund (unaudited)
NOTES TO THE FINANCIAL STATEMENTS (cont’d)(All amounts in thousands of Canadian dollars, except per unit data)June 30, 2015
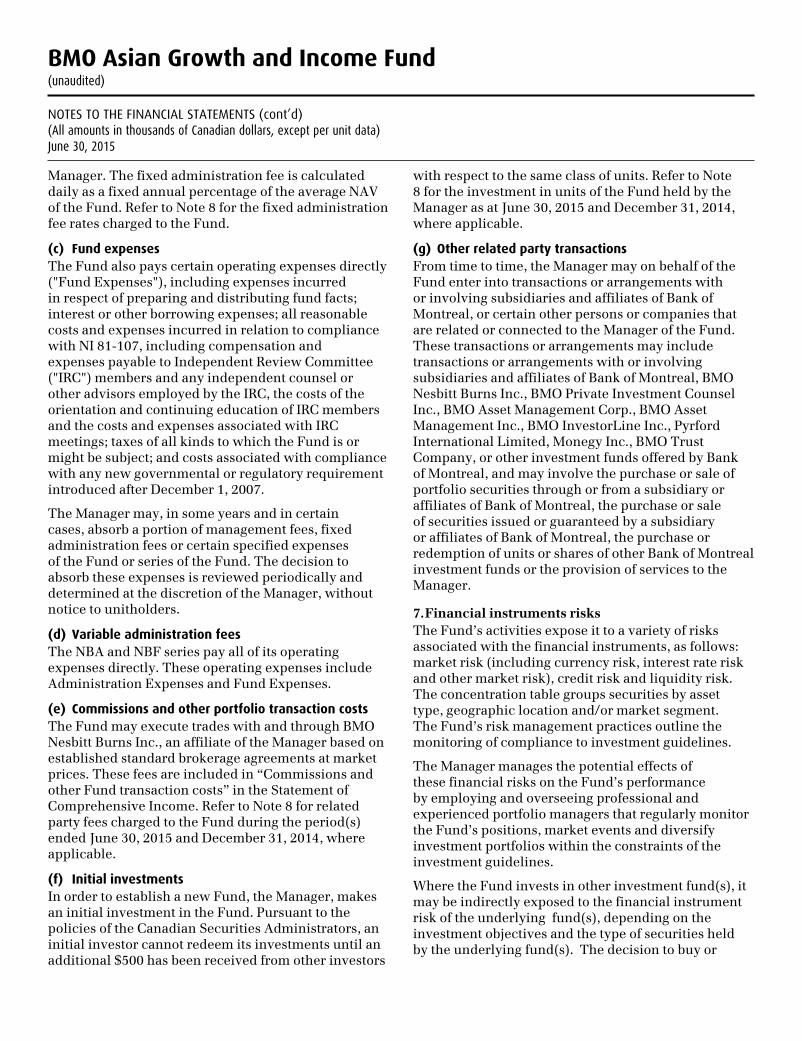
Manager. The fixed administration fee is calculated daily as a fixed annual percentage of the average NAV of the Fund. Refer to Note 8 for the fixed administration fee rates charged to the Fund.
(c) Fund expensesThe Fund also pays certain operating expenses directly ("Fund Expenses"), including expenses incurred in respect of preparing and distributing fund facts; interest or other borrowing expenses; all reasonable costs and expenses incurred in relation to compliance with NI 81-107, including compensation and expenses payable to Independent Review Committee ("IRC") members and any independent counsel or other advisors employed by the IRC, the costs of the orientation and continuing education of IRC members and the costs and expenses associated with IRC meetings; taxes of all kinds to which the Fund is or might be subject; and costs associated with compliance with any new governmental or regulatory requirement introduced after December 1, 2007.
The Manager may, in some years and in certain cases, absorb a portion of management fees, fixed administration fees or certain specified expenses of the Fund or series of the Fund. The decision to absorb these expenses is reviewed periodically and determined at the discretion of the Manager, without notice to unitholders.
(d) Variable administration feesThe NBA and NBF series pay all of its operating expenses directly. These operating expenses include Administration Expenses and Fund Expenses.
(e) Commissions and other portfolio transaction costsThe Fund may execute trades with and through BMO Nesbitt Burns Inc., an affiliate of the Manager based on established standard brokerage agreements at market prices. These fees are included in “Commissions and other Fund transaction costs” in the Statement of Comprehensive Income. Refer to Note 8 for related party fees charged to the Fund during the period(s) ended June 30, 2015 and December 31, 2014, where applicable.
(f) Initial investmentsIn order to establish a new Fund, the Manager, makes an initial investment in the Fund. Pursuant to the policies of the Canadian Securities Administrators, an initial investor cannot redeem its investments until an additional $500 has been received from other investors
with respect to the same class of units. Refer to Note 8 for the investment in units of the Fund held by the Manager as at June 30, 2015 and December 31, 2014, where applicable.
(g) Other related party transactionsFrom time to time, the Manager may on behalf of the Fund enter into transactions or arrangements with or involving subsidiaries and affiliates of Bank of Montreal, or certain other persons or companies that are related or connected to the Manager of the Fund. These transactions or arrangements may include transactions or arrangements with or involving subsidiaries and affiliates of Bank of Montreal, BMO Nesbitt Burns Inc., BMO Private Investment Counsel Inc., BMO Asset Management Corp., BMO Asset Management Inc., BMO InvestorLine Inc., Pyrford International Limited, Monegy Inc., BMO Trust Company, or other investment funds offered by Bank of Montreal, and may involve the purchase or sale of portfolio securities through or from a subsidiary or affiliates of Bank of Montreal, the purchase or sale of securities issued or guaranteed by a subsidiary or affiliates of Bank of Montreal, the purchase or redemption of units or shares of other Bank of Montreal investment funds or the provision of services to the Manager.
7. Financial instruments risksThe Fund’s activities expose it to a variety of risks associated with the financial instruments, as follows: market risk (including currency risk, interest rate risk and other market risk), credit risk and liquidity risk. The concentration table groups securities by asset type, geographic location and/or market segment. The Fund’s risk management practices outline the monitoring of compliance to investment guidelines.
The Manager manages the potential effects of these financial risks on the Fund’s performance by employing and overseeing professional and experienced portfolio managers that regularly monitor the Fund’s positions, market events and diversify investment portfolios within the constraints of the investment guidelines.
Where the Fund invests in other investment fund(s), it may be indirectly exposed to the financial instrument risk of the underlying fund(s), depending on the investment objectives and the type of securities held by the underlying fund(s). The decision to buy or

BMO Asian Growth and Income Fund (unaudited)
NOTES TO THE FINANCIAL STATEMENTS (cont’d)(All amounts in thousands of Canadian dollars, except per unit data)June 30, 2015
sell an underlying fund is based on the investment guidelines and positions, rather than the exposure of the underlying fund(s).
(a) Currency riskCurrency risk is the risk that the value of financial instruments denominated in currencies, other than the functional currency of the Fund, will fluctuate due to changes in foreign exchange rates. Investments in foreign markets are exposed to currency risk as the prices denominated in foreign currencies are converted to the Fund’s functional currency in determining fair value. The Fund may enter into forward currency contracts for hedging purposes to reduce foreign currency exposure or to establish exposure to foreign currencies. The Fund’s exposure to currency risk, if any, is further disclosed in Note 8.
(b) Interest rate riskInterest rate risk is the risk that the fair value of the Fund's interest bearing investments will fluctuate due to changes in market interest rates. The Fund's exposure to interest rate risk is concentrated in its investment in debt securities (such as bonds, money market investments, short-term investments and debentures) and interest rate derivative instruments, if any. Other assets and liabilities are short-term in nature and/or non-interest bearing. The Fund's exposure to interest rate risk, if any, is further discussed in Note 8.
(c) Other market riskOther market risk is the risk that the fair value of a financial instrument will fluctuate as a result of changes in market prices (other than those arising from interest rate risk or currency risk), whether those changes are caused by factors specific to the individual financial instrument or its issuer, or factors affecting all similar financial instruments traded in a market. Other assets and liabilities are monetary items that are short-term in nature, as such they are not subject to other market risk. The Fund's exposure to other market risk, if any, is further discussed in Note 8.
(d) Credit riskCredit risk is the risk that a loss could arise from a security issuer or counterparty to a financial instrument not being able to meet its financial obligations. The fair value of debt securities includes consideration of the credit worthiness of the debt issuer. Credit risk exposure for over-the-counter
derivative instruments is based on the Fund's unrealized gain of the contractual obligations with the counterparty as at the reporting date. The credit exposure of other assets is represented by its carrying amount. The Fund's exposure to credit risk, if any, is further discussed in Note 8.
The Fund may enter into securities lending transactions with approved counterparties. Credit risk associated with these transactions is considered minimal as all counterparties have a sufficient approved credit rating and the market value of collateral held by the Fund must be at least 102% of the fair value of securities loaned, as disclosed in Note 8.
(e) Liquidity riskThe Fund's exposure to liquidity risk is concentrated in the daily cash redemptions of units. The Fund primarily invests in securities that are traded in active markets and can be readily disposed. In addition, the Fund retains sufficient cash and cash equivalent positions to maintain liquidity. The Fund may, from time to time, enter into over-the-counter derivative contracts or invest in unlisted securities, which are not traded in an organized market and may be illiquid. Securities for which a market quotation could not be obtained and may be illiquid are identified on the Schedule of Investment Portfolio. The proportion of illiquid securities to the NAV of the Fund is monitored by the Manager to ensure it does not exceed the regulatory limit and does not significantly affect the liquidity required to meet the Fund's financial obligations.
BMO Asian Growth and Income Fund (unaudited)
NOTES TO THE FINANCIAL STATEMENTS (cont’d)(All amounts in thousands of Canadian dollars, except per unit data)June 30, 2015
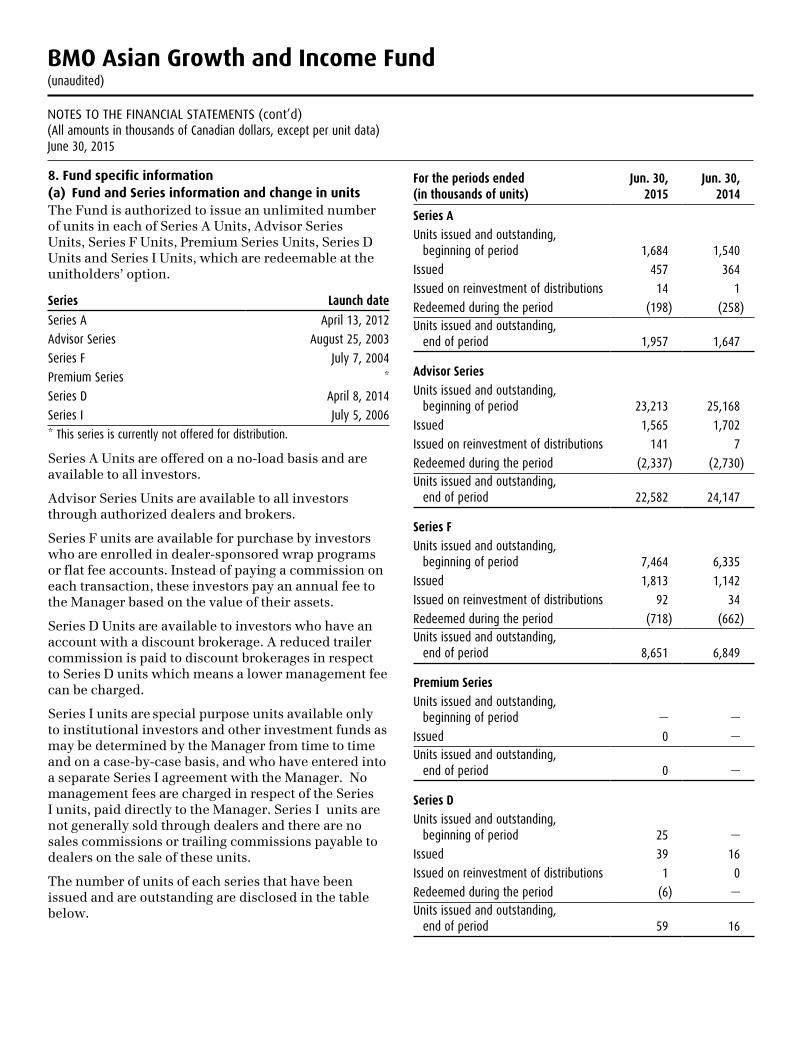
8. Fund specific information(a) Fund and Series information and change in unitsThe Fund is authorized to issue an unlimited number of units in each of Series A Units, Advisor Series Units, Series F Units, Premium Series Units, Series D Units and Series I Units, which are redeemable at the unitholders’ option.
Series Launch date
Series A April 13, 2012
Advisor Series August 25, 2003
Series F July 7, 2004
Premium Series *
Series D April 8, 2014
Series I July 5, 2006
* This series is currently not offered for distribution.
Series A Units are offered on a no-load basis and are available to all investors.
Advisor Series Units are available to all investors through authorized dealers and brokers.
Series F units are available for purchase by investors who are enrolled in dealer-sponsored wrap programs or flat fee accounts. Instead of paying a commission on each transaction, these investors pay an annual fee to the Manager based on the value of their assets.
Series D Units are available to investors who have an account with a discount brokerage. A reduced trailer commission is paid to discount brokerages in respect to Series D units which means a lower management fee can be charged.
Series I units are special purpose units available only to institutional investors and other investment funds as may be determined by the Manager from time to time and on a case-by-case basis, and who have entered into a separate Series I agreement with the Manager. No management fees are charged in respect of the Series I units, paid directly to the Manager. Series I units are not generally sold through dealers and there are no sales commissions or trailing commissions payable to dealers on the sale of these units.
The number of units of each series that have been issued and are outstanding are disclosed in the table below.
For the periods ended (in thousands of units)
Jun. 30, 2015
Jun. 30, 2014
Series A
Units issued and outstanding, beginning of period 1,684 1,540
Issued 457 364
Issued on reinvestment of distributions 14 1
Redeemed during the period (198) (258)Units issued and outstanding,
end of period 1,957 1,647
Advisor Series
Units issued and outstanding, beginning of period 23,213 25,168
Issued 1,565 1,702
Issued on reinvestment of distributions 141 7
Redeemed during the period (2,337) (2,730)Units issued and outstanding,
end of period 22,582 24,147
Series F
Units issued and outstanding, beginning of period 7,464 6,335
Issued 1,813 1,142
Issued on reinvestment of distributions 92 34
Redeemed during the period (718) (662)Units issued and outstanding,
end of period 8,651 6,849
Premium Series
Units issued and outstanding, beginning of period — —
Issued 0 —Units issued and outstanding,
end of period 0 —
Series D
Units issued and outstanding, beginning of period 25 —
Issued 39 16
Issued on reinvestment of distributions 1 0
Redeemed during the period (6) —Units issued and outstanding,
end of period 59 16
BMO Asian Growth and Income Fund (unaudited)
NOTES TO THE FINANCIAL STATEMENTS (cont’d)(All amounts in thousands of Canadian dollars, except per unit data)June 30, 2015
For the periods ended (in thousands of units)
Jun. 30, 2015
Jun. 30, 2014
Series I
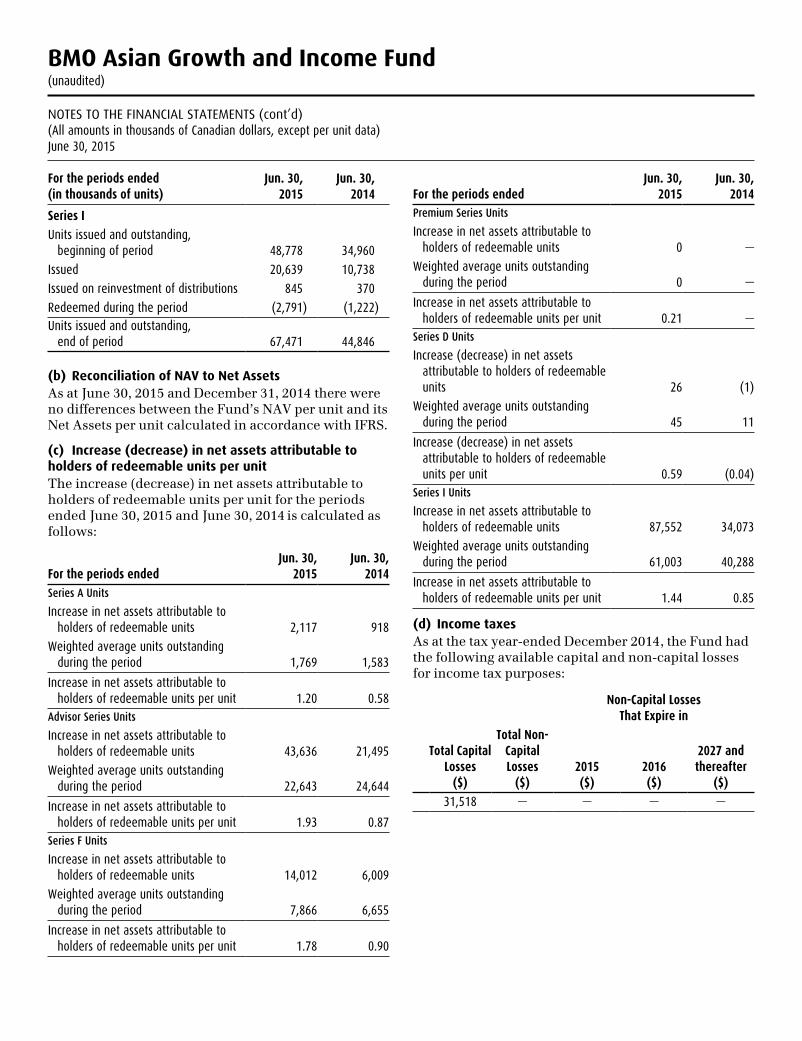
Units issued and outstanding, beginning of period 48,778 34,960
Issued 20,639 10,738
Issued on reinvestment of distributions 845 370
Redeemed during the period (2,791) (1,222)Units issued and outstanding,
end of period 67,471 44,846
(b) Reconciliation of NAV to Net AssetsAs at June 30, 2015 and December 31, 2014 there were no differences between the Fund’s NAV per unit and its Net Assets per unit calculated in accordance with IFRS.
(c) Increase (decrease) in net assets attributable to holders of redeemable units per unitThe increase (decrease) in net assets attributable to holders of redeemable units per unit for the periods ended June 30, 2015 and June 30, 2014 is calculated as follows:
Jun. 30, Jun. 30,For the periods ended 2015 2014Series A Units
Increase in net assets attributable to holders of redeemable units 2,117 918
Weighted average units outstanding during the period 1,769 1,583
Increase in net assets attributable to holders of redeemable units per unit 1.20 0.58
Advisor Series Units
Increase in net assets attributable to holders of redeemable units 43,636 21,495
Weighted average units outstanding during the period 22,643 24,644
Increase in net assets attributable to holders of redeemable units per unit 1.93 0.87
Series F Units
Increase in net assets attributable to holders of redeemable units 14,012 6,009
Weighted average units outstanding during the period 7,866 6,655
Increase in net assets attributable to holders of redeemable units per unit 1.78 0.90
Jun. 30, Jun. 30,For the periods ended 2015 2014Premium Series Units
Increase in net assets attributable to holders of redeemable units 0 —
Weighted average units outstanding during the period 0 —
Increase in net assets attributable to holders of redeemable units per unit 0.21 —
Series D Units
Increase (decrease) in net assets attributable to holders of redeemable units 26 (1)
Weighted average units outstanding during the period 45 11
Increase (decrease) in net assets attributable to holders of redeemable units per unit 0.59 (0.04)
Series I Units
Increase in net assets attributable to holders of redeemable units 87,552 34,073
Weighted average units outstanding during the period 61,003 40,288
Increase in net assets attributable to holders of redeemable units per unit 1.44 0.85
(d) Income taxesAs at the tax year-ended December 2014, the Fund had the following available capital and non-capital losses for income tax purposes:
Non-Capital Losses That Expire in
Total Capital Losses
($)
Total Non-Capital Losses
($)2015 ($)
2016 ($)
2027 and thereafter
($)
31,518 — — — —
BMO Asian Growth and Income Fund (unaudited)
NOTES TO THE FINANCIAL STATEMENTS (cont’d)(All amounts in thousands of Canadian dollars, except per unit data)June 30, 2015
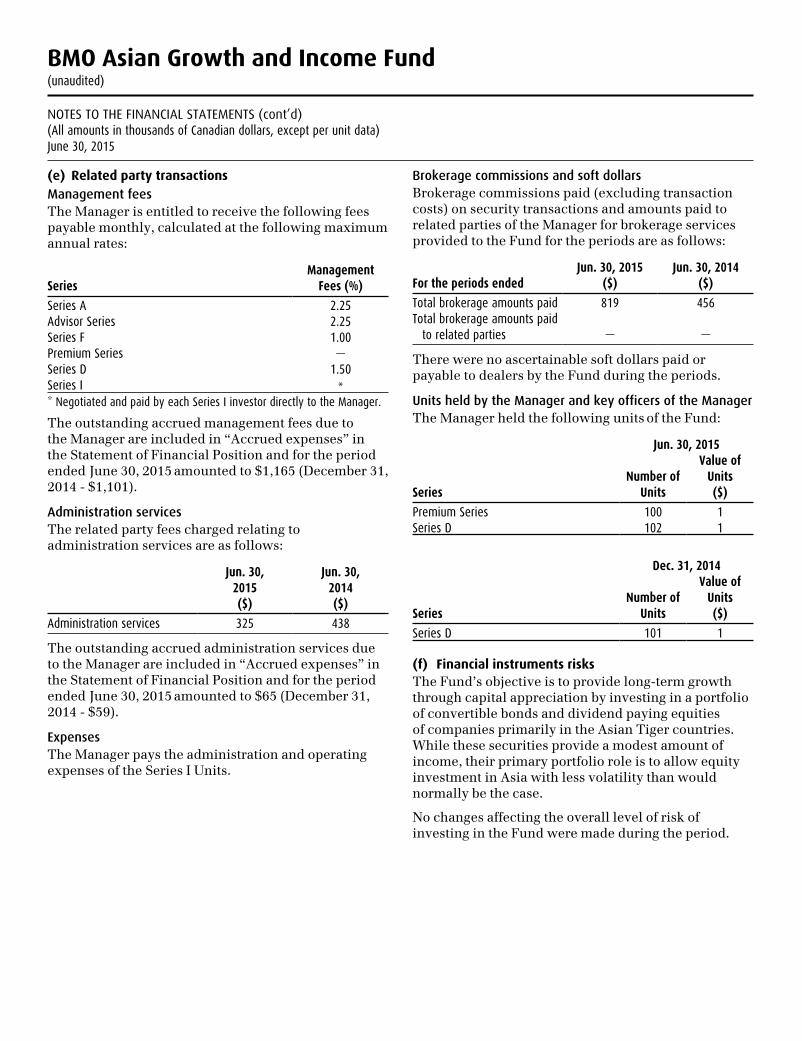
(e) Related party transactionsManagement feesThe Manager is entitled to receive the following fees payable monthly, calculated at the following maximum annual rates:
SeriesManagement
Fees (%)
Series A 2.25Advisor Series 2.25Series F 1.00Premium Series —Series D 1.50Series I *
* Negotiated and paid by each Series I investor directly to the Manager.
The outstanding accrued management fees due to the Manager are included in “Accrued expenses” in the Statement of Financial Position and for the period ended June 30, 2015 amounted to $1,165 (December 31, 2014 - $1,101).
Administration servicesThe related party fees charged relating to administration services are as follows:
Jun. 30, 2015
Jun. 30, 2014
($) ($)
Administration services 325 438
The outstanding accrued administration services due to the Manager are included in “Accrued expenses” in the Statement of Financial Position and for the period ended June 30, 2015 amounted to $65 (December 31, 2014 - $59).
ExpensesThe Manager pays the administration and operating expenses of the Series I Units.
Brokerage commissions and soft dollarsBrokerage commissions paid (excluding transaction costs) on security transactions and amounts paid to related parties of the Manager for brokerage services provided to the Fund for the periods are as follows:
Jun. 30, 2015 Jun. 30, 2014For the periods ended ($) ($)
Total brokerage amounts paid 819 456Total brokerage amounts paid
to related parties — —
There were no ascertainable soft dollars paid or payable to dealers by the Fund during the periods.
Units held by the Manager and key officers of the ManagerThe Manager held the following units of the Fund:
Jun. 30, 2015
SeriesNumber of
Units
Value of Units ($)
Premium Series 100 1Series D 102 1
Dec. 31, 2014
SeriesNumber of
Units
Value of Units ($)
Series D 101 1
(f) Financial instruments risksThe Fund’s objective is to provide long-term growth through capital appreciation by investing in a portfolio of convertible bonds and dividend paying equities of companies primarily in the Asian Tiger countries. While these securities provide a modest amount of income, their primary portfolio role is to allow equity investment in Asia with less volatility than would normally be the case.
No changes affecting the overall level of risk of investing in the Fund were made during the period.
BMO Asian Growth and Income Fund (unaudited)
NOTES TO THE FINANCIAL STATEMENTS (cont’d)(All amounts in thousands of Canadian dollars, except per unit data)June 30, 2015
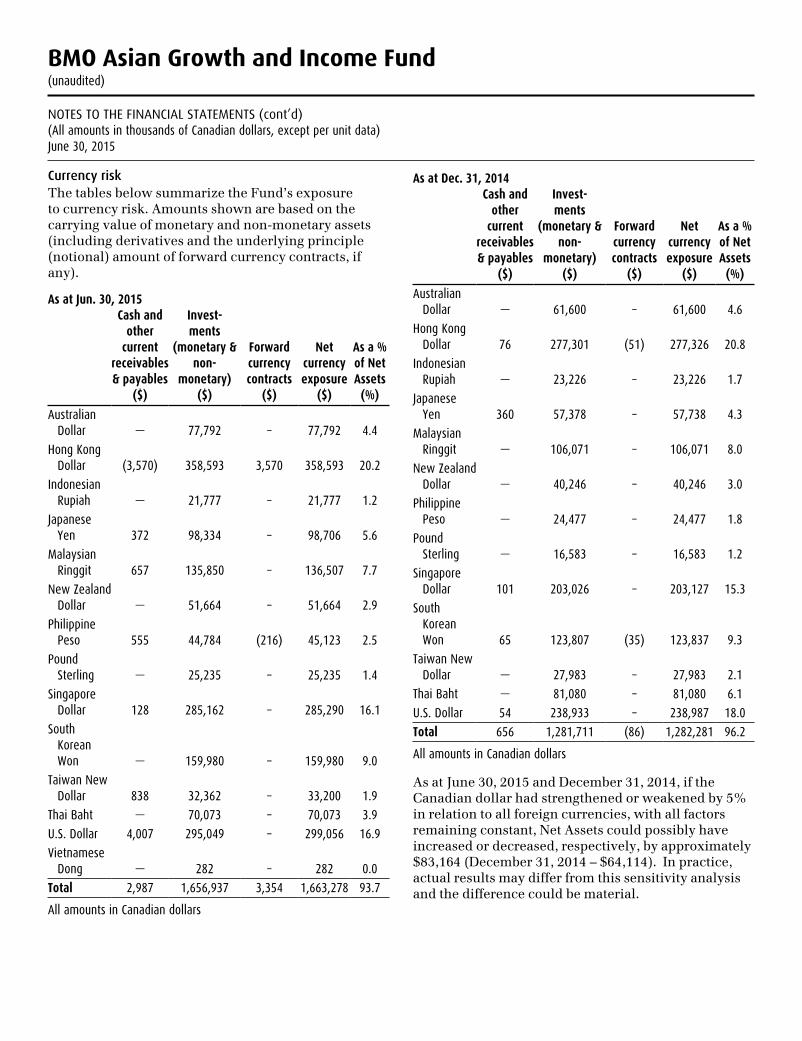
Currency riskThe tables below summarize the Fund’s exposure to currency risk. Amounts shown are based on the carrying value of monetary and non-monetary assets (including derivatives and the underlying principle (notional) amount of forward currency contracts, if any).
As at Jun. 30, 2015Cash and
other current
receivables & payables
($)
Invest- ments
(monetary & non-
monetary) ($)
Forward currency contracts
($)
Net currency exposure
($)
As a % of Net Assets
(%)
Australian Dollar — 77,792 – 77,792 4.4
Hong Kong Dollar (3,570) 358,593 3,570 358,593 20.2
Indonesian Rupiah — 21,777 – 21,777 1.2
Japanese Yen 372 98,334 – 98,706 5.6
Malaysian Ringgit 657 135,850 – 136,507 7.7
New Zealand Dollar — 51,664 – 51,664 2.9
Philippine Peso 555 44,784 (216) 45,123 2.5
Pound Sterling — 25,235 – 25,235 1.4
Singapore Dollar 128 285,162 – 285,290 16.1
South Korean Won — 159,980 – 159,980 9.0
Taiwan New Dollar 838 32,362 – 33,200 1.9
Thai Baht — 70,073 – 70,073 3.9
U.S. Dollar 4,007 295,049 – 299,056 16.9
Vietnamese Dong — 282 – 282 0.0
Total 2,987 1,656,937 3,354 1,663,278 93.7
All amounts in Canadian dollars
As at Dec. 31, 2014Cash and
other current
receivables & payables
($)
Invest- ments
(monetary & non-
monetary) ($)
Forward currency contracts
($)
Net currency exposure
($)
As a % of Net Assets
(%)
Australian Dollar — 61,600 – 61,600 4.6
Hong Kong Dollar 76 277,301 (51) 277,326 20.8
Indonesian Rupiah — 23,226 – 23,226 1.7
Japanese Yen 360 57,378 – 57,738 4.3
Malaysian Ringgit — 106,071 – 106,071 8.0
New Zealand Dollar — 40,246 – 40,246 3.0
Philippine Peso — 24,477 – 24,477 1.8
Pound Sterling — 16,583 – 16,583 1.2
Singapore Dollar 101 203,026 – 203,127 15.3
South Korean Won 65 123,807 (35) 123,837 9.3
Taiwan New Dollar — 27,983 – 27,983 2.1
Thai Baht — 81,080 – 81,080 6.1
U.S. Dollar 54 238,933 – 238,987 18.0
Total 656 1,281,711 (86) 1,282,281 96.2
All amounts in Canadian dollars
As at June 30, 2015 and December 31, 2014, if the Canadian dollar had strengthened or weakened by 5% in relation to all foreign currencies, with all factors remaining constant, Net Assets could possibly have increased or decreased, respectively, by approximately $83,164 (December 31, 2014 – $64,114). In practice, actual results may differ from this sensitivity analysis and the difference could be material.

BMO Asian Growth and Income Fund (unaudited)
NOTES TO THE FINANCIAL STATEMENTS (cont’d)(All amounts in thousands of Canadian dollars, except per unit data)June 30, 2015
Interest rate riskThe following table summarizes the Fund’s exposure to interest rate risk by remaining term to maturity:
Interest Rate Exposure as atJun. 30, Dec. 31,
Number of years 2015 2014
Less than one year 9,204 —
One to three years 19,352 40,336
Three to five years 23,590 29,419
Five to ten years 55,106 41,598
Greater than ten years — —
Total 107,252 111,353
All amounts in Canadian dollars
As at June 30, 2015 and December 31, 2014, if the prevailing interest rates had been raised or lowered by 1%, assuming a parallel shift in the yield curve, with all other factors remaining constant, Net Assets could possibly have increased or decreased, respectively, by approximately $4,931 (December 31, 2014 – $4,869). The Fund’s interest rate sensitivity was determined based on portfolio weighted duration. In practice, actual results may differ from this sensitivity analysis and the difference could be material.
Other market riskThe Fund has a significant exposure to other market risk arising from its investment in equity securities. Using historical correlation between the Fund's return and the return of its benchmark, if the benchmark, MSCI AC Asia-Pacific Index (CAD), had increased or decreased by 10%, with all other variables held constant, the net assets of the Fund would have increased or decreased, respectively, by $89,386 (December 31, 2014 — $61,529). Historical correlation may not be representative of future correlation, and accordingly, actual results may differ and the difference could be material.
Credit riskThe Fund’s credit risk exposure grouped by credit ratings is listed in the following table:
As a % of Net Assets as atJun. 30, Dec. 31,
Credit Rating 2015 2014
AA 0.0 —
BBB 1.2 1.2
As a % of Net Assets as atJun. 30, Dec. 31,
Credit Rating 2015 2014
Unrated 4.9 7.2
Total 6.1 8.4
Securities lendingThe Fund had assets involved in securities lending transactions outstanding as at June 30, 2015 and December 31, 2014 as follows:
Aggregate value of securities on loan
($)
Aggregate value of collateral received for
the loan ($)
Jun. 30, 2015 14,159 15,073Dec. 31, 2014 46,739 50,901
Concentration riskThe following is a summary of the Fund's concentration risk:
As atJun. 30,
2015Dec. 31,
2014
Foreign Bonds & DebenturesHong Kong .. . . . . . . . . . . . . . . . . . . . . . . . . . . . . . . . . . . . . . . . . . . .4.2%... . . . . . . . . . .6.5%Singapore .. . . . . . . . . . . . . . . . . . . . . . . . . . . . . . . . . . . . . . . . . . . . . .1.9%... . . . . . . . . . .1.9%
Foreign EquitiesAustralia . . . . . . . . . . . . . . . . . . . . . . . . . . . . . . . . . . . . . . . . . . . . . . . .4.4%... . . . . . . . . . .4.6%China .. . . . . . . . . . . . . . . . . . . . . . . . . . . . . . . . . . . . . . . . . . . . . . . . . . . . —%... . . . . . . . . . .1.2%Hong Kong .. . . . . . . . . . . . . . . . . . . . . . . . . . . . . . . . . . . . . . . . . . 23.0%... . . . . . . . . 22.9%Indonesia . . . . . . . . . . . . . . . . . . . . . . . . . . . . . . . . . . . . . . . . . . . . . . .2.9%... . . . . . . . . . .3.4%Japan .. . . . . . . . . . . . . . . . . . . . . . . . . . . . . . . . . . . . . . . . . . . . . . . . . . .5.5%... . . . . . . . . . .4.3%Malaysia . . . . . . . . . . . . . . . . . . . . . . . . . . . . . . . . . . . . . . . . . . . . . . . .7.7%... . . . . . . . . . .8.0%New Zealand .. . . . . . . . . . . . . . . . . . . . . . . . . . . . . . . . . . . . . . . . . .2.9%... . . . . . . . . . .3.0%Philippines .. . . . . . . . . . . . . . . . . . . . . . . . . . . . . . . . . . . . . . . . . . . .2.5%... . . . . . . . . . .1.8%Singapore .. . . . . . . . . . . . . . . . . . . . . . . . . . . . . . . . . . . . . . . . . . . . 14.2%... . . . . . . . . 13.3%South Korea .. . . . . . . . . . . . . . . . . . . . . . . . . . . . . . . . . . . . . . . . . . .9.0%... . . . . . . . . . .9.3%Taiwan .. . . . . . . . . . . . . . . . . . . . . . . . . . . . . . . . . . . . . . . . . . . . . . . . .4.7%... . . . . . . . . . .4.9%Thailand .. . . . . . . . . . . . . . . . . . . . . . . . . . . . . . . . . . . . . . . . . . . . . . .3.9%... . . . . . . . . . .6.1%United Kingdom ... . . . . . . . . . . . . . . . . . . . . . . . . . . . . . . . . . . . .3.6%... . . . . . . . . . .3.0%United States . . . . . . . . . . . . . . . . . . . . . . . . . . . . . . . . . . . . . . . . . .3.0%... . . . . . . . . . .2.1%Vietnam .. . . . . . . . . . . . . . . . . . . . . . . . . . . . . . . . . . . . . . . . . . . . . . . .0.0%... . . . . . . . . . . . —%
Other Assets Less Liabilities . . . . . . . . . . . . . . . . . . . . . . . . .6.6%... . . . . . . . . . .3.7%....................................... . . . . . . . . . 100.0%.... . . . . . 100.0%

BMO Asian Growth and Income Fund (unaudited)
NOTES TO THE FINANCIAL STATEMENTS (cont’d)(All amounts in thousands of Canadian dollars, except per unit data)June 30, 2015
(g) Financial assets and financial liabilitiesCategories of financial assets and financial liabilities
The table below shows the categories of financial assets and financial liabilities:
Jun. 30, Dec. 31,As at 2015 2014
Financial assets designated at FVTPL 1,656,937 1,281,711Financial assets held for trading 20 0Loans and receivables 12,648 6,639Financial liabilities held for trading 5 0Financial liabilities measured at amortized
cost 7,548 1,839
Net gains and losses on financial assets and financial liabilities at fair value
Jun. 30, Jun. 30,For the periods ended 2015 2014
Net realized gains (losses) on financial assets
Held for trading — —
Designated at FVTPL 112,308 32,247
112,308 32,247
Net realized gains (losses) on financial liabilities
Held for trading (106) (450)
Total net realized gains (losses) on financial assets and financial liabilities 112,202 31,797
Change in unrealized gains (losses) on financial assets
Held for trading 15 —
Designated at FVTPL 46,427 39,380
46,442 39,380
Change in unrealized gains (losses) on financial liabilities
Held for trading — —
Total change in unrealized gains (losses) on financial assets and financial liabilities 46,442 39,380
(h) Fair value hierarchyThe Fund classifies its financial instruments into three levels based on the inputs used to value the financial instruments. Level 1 securities are valued based on quoted prices in active markets for identical securities. Level 2 securities are valued based on significant observable market inputs, such as quoted prices from similar securities and quoted prices in inactive markets or based on observable inputs to models. Level 3
securities are valued based on significant unobservable inputs that reflect the Manager's determination of assumptions that market participants might reasonably use in valuing the securities. The tables below show the relevant disclosure.
As at Jun. 30, 2015Financial assets Level 1 Level 2 Level 3 Total
Equity Securities 68,104 1,481,581 — 1,549,685Debt Securities 107,252 — — 107,252Derivatives — 20 — 20Total 175,356 1,481,601 — 1,656,957
Financial liabilities
Derivatives — (5) — (5)
As at Dec. 31, 2014Financial assets Level 1 Level 2 Level 3 Total
Equity Securities 27,211 1,143,147 — 1,170,358Debt Securities 111,353 — — 111,353Total 138,564 1,143,147 — 1,281,711
Financial liabilities
Derivatives — (0) — (0)
Transfers between levelsThere were no transfers between levels during the periods.

BMO Mutual Funds are offered by BMO Investments Inc., a financial services firm and separate legal entity from Bank of Montreal.
® Registered trade-marks of Bank of Montreal, used under licence.™ Trade-mark of Bank of Montreal, used under licence.
Independent AuditorPricewaterhouseCoopers LLPPwC Tower 18 York Street, Suite 2600Toronto, Ontario M5J 0B2
www.bmo.com/mutualfunds and www.bmo.com/gam/ca
BMO Investments Inc.First Canadian Place, 43rd Floor, 100 King Street WestToronto, ON M5X 1A1
For more information please call BMO Investment Centre at 1-800-665-7700 (investors who purchased BMO Mutual Funds through a BMO Bank of Montreal branch or BMO Online Banking) or call Client Services toll-free at 1-800-668-7327 (investors who purchased BMO Mutual Funds through a full-service or discount broker) or at 1-800-361-1392 (investors who purchased Series NBA and NBF through a full-service or discount broker).