BMEI 2017 Full Report English 19APR - pressroom home sheet/BM… · MISCELLANEOUS CHEMICAL PRODUCTS...
39
2017
Transcript of BMEI 2017 Full Report English 19APR - pressroom home sheet/BM… · MISCELLANEOUS CHEMICAL PRODUCTS...

2017
Index
P.01 1. General Overview
P.01 2. Objectives
P.01 3. Sample: sectors, selection criteria and composition
P.01 3.1 Sectors evaluated for survey and regional trade flows
P.03 3.2 Geographic breakdown
P.03 3.3 Profile of importers selected for the survey
P.05 3.4 Type of executive interviewed
P.05 4. Methodology
P.06 5. Main FindingsP.06 5.1 Main highlights
P.07 5.2 Searching for new international suppliers
P.08 5.3 Contacting new international suppliers
P.13 5.4 Making purchasing decisions
P.18 5.5 Finalizing the purchase
P.22 5.6 Import process: supply chain
P.31 6. Sector specific highlights
P.31 6.1 Propensity to import by sector
P.32 6.2 Apparel
P.33 6.3 Automotive
P.34 6.4 High-tech
P.35 6.5 Industrial Manufacturing
P.36 7. Conclusions: highlights and insights
AnnexesAnnex 1: Apparel sector report
Annex 2: Automotive sector report
Annex 3: High-tech sector report
Annex 4: Industrial manufacturing sector report

1. General Overview
UPS Business MonitorTM Export Index Latin America 2017 is the result of interviews with 2,170
small and medium-sized importers throughout the Americas conducted to study their
online/offline purchasing behavior. The study’s focus on importers (buyers) reveals strategically
useful information that will help exporters to sell and supply goods in international markets.
2. Objectives
The BMEI 2017’s assessment of the purchasing behavior of small and medium-sized importers
in the Americas addresses several objectives:
• Identify importer’s preferred online and offline means of contact when evaluating new
suppliers and the criteria used to assess product, to enable exporters to adjust their international
promotion.
• Assess and estimate the magnitude of import transactions conducted over the Internet, broken
down by the four selected industries.
• Detect the critical factors in the supply chain that influence an importer’s purchasing
decisions.
• Track importer behavior from the closing of the transaction to handling of damaged products,
identifying critical issues in order to identify opportunities for improvement in the process.
3. Sample: sectors, selection criteria and composition
3.1 Sectors evaluated for the BMEI 2017
Four industries were chosen for the BMEI 2017: industrial manufacturing, automotive, apparel
and high-tech.
These four export sectors were identified based on a cross section of the following four
variables:
1. High participation in US trade
2. High participation in intra-regional Latin American trade
3. Demand/use of express courier services
4. Estimated density of exporters
In order to determine the levels of participation in intra-regional Latin American and US trade
flows, the main imports into the United States from Latin America and the main Latin American
imports from other Latin American countries were analyzed. Table 1 and Table 2 on the
following page highlight trade flows for the 15 main products in each market.
01

SectorsUS Imports: Latin
American origin in USD
billions
ALL PRODUCTS 452.88
FUELS 92.37
AUTO PARTS AND VEHICLES 69.02
MACHINERY, ELECTRICAL EQUIPMENT AND PARTS 66.56
MACHINERY AND MECHANICAL DEVICES 47.78
FOOD 35.82
APPAREL AND FOOTWEAR 17.50
INSTRUMENTS, OPTICAL INSTRUMENTS, MEASUREMENT, PHOTOGRAPHY
AND CINEMATOGRAPHY13.87
JEWELRY 13.79
MATERIALS ELSEWHERE NOT SPECIFIED 13.52
FURNITURE AND FIXTURES 10.06
BEVERAGES 9.99
IRON AND STEEL 7.22
PLASTICS AND ARTICLES MADE OF PLASTICS 5.70
ARTICLES OF CAST IRON OR STEEL 5.10
Source: International Trade Center (Trade Map) based on the latest official data available, 2014 for the US.
SectorsLATAM Imports: Latin American
origin in USD billions
ALL PRODUCTS 213.92
FUELS 43.39
FOOD 36.90
AUTO PARTS AND VEHICLES 29.49
MACHINERY, ELECTRICAL EQUIPMENT AND PARTS 12.50
MACHINERY AND MECHANICAL DEVICES 11.73
PLASTICS AND ARTICLES MADE OF PLASTICS 8.79
APPAREL AND FOOTWEAR 6.99
PHARMACEUTICAL PRODUCTS 5.18
IRON AND STEEL 4,95
ESSENTIAL OILS AND RESINOIDS; PREPARATION OF PERFUMERY,
SOAPS4.04
PAPER, CARDBOARD, PRODUCTS MADE FROM PULP, PAPER,
CARDBOARD3.70
COPPER AND COPPER MANUFACTURED PRODUCTS 3.50
MISCELLANEOUS CHEMICAL PRODUCTS 3.36
ORGANIC CHEMICAL PRODUCTS 3.34
Table 2: Latin American imports 2013 (Latin American origin) by sector
Table 1: US imports 2014 (Latin American origin) by sector
Source: International Trade Center (Trade Map) based on the latest official data available, 2013 for Latin America.
02
The following table presents Latin American importers’ annual US dollar (USD)
purchases of 15 Latin American products broken down by sector.
The following table presents US importers’ annual US dollar (USD) purchases of
15 Latin American products broken down by sector.

COUNTRIESINDUSTRIAL
MANUFACTURINGAUTOMOTIVE APPAREL HIGH TECH TOTAL
UNITED STATES 250 84 50 50 434
MEXICO 146 50 50 50 296
BRAZIL 90 50 50 50 240
COLOMBIA 50 50 50 50 200
CHILE 50 50 50 50 200
PERU 50 50 50 50 200
COSTA RICA 50 50 50 50 200
DOMINICAN REP. 50 50 50 50 200
PANAMA 50 50 50 50 200
3.2 Geographic breakdown:
With the main industries of interest
defined based on trade flows and other
critical factors, UPS chose to focus on
nine specific markets: Brazil, Chile,
Colombia, Costa Rica, Dominican
Republic, Mexico, Panama, Peru and the
United States.
To analyze the import/export behavior in
each one of the countries selected for this
study, a sample per country was defined
based on the size ratio between each
market with a margin of error between
+/- 4.7% and +/- 9.1%.
3.3 Profile of importers selected for the survey
Furthermore, as part of the selection criteria, the study interviewed small and medium-
sized enterprises (SME) because this segment represents the lion’s share of foreign trade
transactions in the Americas. An additional criterion applied to the sample was that all
selected importers had to have performed at least five import transactions in the 12
months prior to the interview.
As a result, 2,170 importers were identified and interviewed, for an overall margin of
error +/- 2.3 %, according to the Calculation of the Probability of a Sample used in this
type of research.
Table 3: Sample broken down by country and sector
03
-
Dominican
Republic
US

TYPES OF COMPANIES %
DISTRIBUTOR 38%
MANUFACTURER 24%
WHOLESALER 12%
STORE/RETAILER 7%
OTHER 16%
TOTAL 97%*
TYPES OF PRODUCTS IMPORTED %
FINISHED GOODS FOR RESALE 61%
FINISHED GOODS FOR IN-HOUSE USE 15%
RAW MATERIALS FOR PRODUCTION 15%
SEMI-MANUFACTURED FOR PRODUCTION 6%
OTHER 3%
TOTAL 100%
2,170interviews
INDUSTRIAL
MANUFACTURING
36%
AUTOMOTIVE
22%
APPAREL
21%
HIGH-TECH
21%
Table 4: Sample summary(Percentages may not total 100 due to rounding.)
DISTRIBUTOR 38%FINISHED GOODS 61%
04
* 3% of surveyed participants did not respond to this question.

COUNTRIES US MX BR CO CHI PE CR DR PA TOTAL
MANUFACTURER 36% 39% 33% 25% 10% 11% 10% 13% 20% 24%
DISTRIBUTOR 39% 39% 25% 34% 39% 41% 50% 35% 36% 38%
WHOLESALER 8% 8% 12% 15% 16% 11% 15% 14% 12% 12%
RETAILER 3% 1% 14% 2% 7% 6% 9% 19% 7% 7%
OTHER 5% 12% 16% 22% 26% 27% 14% 18% 20% 16%
NO RESPONSE 9% 1% 0% 2% 2% 4% 2% 1% 5% 3%
3.4 Type of executive interviewed
Finally, in order to achieve the study’s objectives, the individuals responsible for
international purchases were interviewed. The import decision makers were asked a series
of questions based on a semi-structured questionnaire for a quantitative and qualitative
result.
4. Methodology
The semi-structured questionnaire broke down the typical import process into five distinct
stages—search for new international suppliers; contacting new international suppliers;
making purchasing decisions; finalizing the purchase; import process: supply chain.
The participating importers were contacted and asked the questions over the telephone
using a CATI system (computer-assisted telephone interviewing).
Table 5: Sample broken down by country and type of importer
05
Note: Percentages may not total 100 due to rounding.

5. Main Findings
5.1 Highlights
UPS Business MonitorTM Export Index Latin America 2017 identifies clear trends among the
region’s importers that extend across four industries in nine countries.
The main trends identified were:
ü Propensity (i.e., willingness) to import by country and by sector;
ü Digital versus traditional behavior when searching for new suppliers;
ü Value assigned to an exporter’s website;
ü Online purchasing behavior;
ü Main attributes other than price and quality that importers value the most when assessing
potential vendors;
ü Use of promotional tools supplied by the exporter;
ü Main importing barriers.
Among the greatest similarities found were the attributes that importers value the most when
assessing potential vendors; their preferred online and offline channels used to search for
suppliers; and the main importing barriers faced.
The findings also reveal industry-specific and country-specific insights in addition to the
general trends identified. For example, in the case of online purchases, the BMEI 2017
revealed that 57% of importers (from the total sample) do not purchase their imported
products online from start to finish. However, when the results were analyzed by industry,
considerable differences were found. For example in the automotive sector, 74% of
respondents indicated that they do not purchase imported products online. In analyzing
responses for a particular sector in specific countries, additional insight was revealed, e.g.,
80% of apparel importers in Brazil and Costa Rica do not purchase imported products online.
This report presents the main findings for the entire sample of SMEs interviewed, highlighting
the most relevant insights for each sector and individual countries.
In addition to the general findings in this report, there is an index of the propensity to import
for each of the four industries analyzed –see pages 31-35.
06
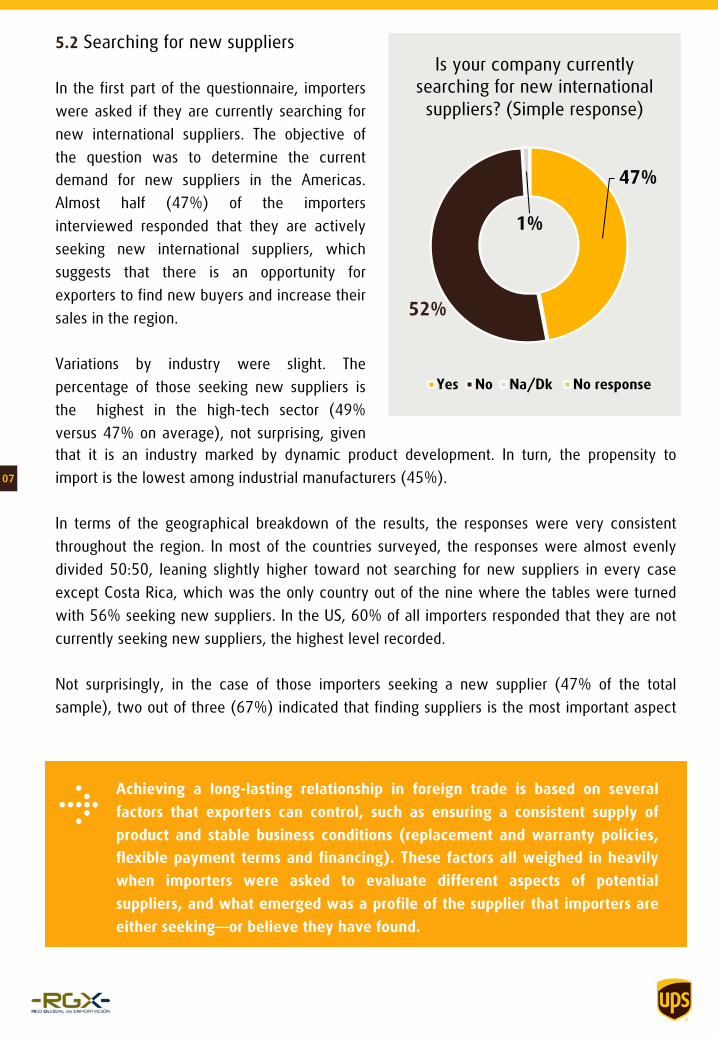
5.2 Searching for new suppliers
In the first part of the questionnaire, importers
were asked if they are currently searching for
new international suppliers. The objective of
the question was to determine the current
demand for new suppliers in the Americas.
Almost half (47%) of the importers
interviewed responded that they are actively
seeking new international suppliers, which
suggests that there is an opportunity for
exporters to find new buyers and increase their
sales in the region.
Variations by industry were slight. The
percentage of those seeking new suppliers is
the highest in the high-tech sector (49%
versus 47% on average), not surprising, given
Is your company currently
searching for new international
suppliers? (Simple response)
47%
52%
1%
Yes No Na/Dk No response
that it is an industry marked by dynamic product development. In turn, the propensity to
import is the lowest among industrial manufacturers (45%).
In terms of the geographical breakdown of the results, the responses were very consistent
throughout the region. In most of the countries surveyed, the responses were almost evenly
divided 50:50, leaning slightly higher toward not searching for new suppliers in every case
except Costa Rica, which was the only country out of the nine where the tables were turned
with 56% seeking new suppliers. In the US, 60% of all importers responded that they are not
currently seeking new suppliers, the highest level recorded.
Not surprisingly, in the case of those importers seeking a new supplier (47% of the total
sample), two out of three (67%) indicated that finding suppliers is the most important aspect
07
Achieving a long-lasting relationship in foreign trade is based on several
factors that exporters can control, such as ensuring a consistent supply of
product and stable business conditions (replacement and warranty policies,
flexible payment terms and financing). These factors all weighed in heavily
when importers were asked to evaluate different aspects of potential
suppliers, and what emerged was a profile of the supplier that importers are
either seeking—or believe they have found.

of the supply chain, whereas less than half (49%) of those not seeking new suppliers (52%
of the total sample), indicated it as such.
In turn, two out of every three (66%) importers not looking for new suppliers do not purchase
their imported products online, which is slightly higher than the average of the total sample
(57%).
5.3 Contacting new international suppliers
After determining that one out of every two (47%) importers are looking for new
international suppliers, they were asked to indicate their preferred offline and online channels
for conducting their search.
Industry fairs and trade shows were named as the most widely used offline channel for
finding new suppliers (28%). Trade missions were named as the second most frequently used
channel.
What offline channels does your company use to contact new
international suppliers? (Multiple responses)
28%
21%
17%
10% 9% 7% 6%
2% 0%
5%
10%
15%
20%
25%
30%
Industry fairs and
trade shows
I don’t contact
them; they contact me.
Trade mission to country of
origin
Traditional advertising
(print, radio,
television)
Telephone directories
Other Dk/Na No response
08

There was a high percentage of importers who indicated that they do not actively search for
suppliers via offline channels, but rather they expect potential suppliers to contact them
(21%).
A breakdown by country revealed two exceptions to the average throughout the region:
Brazilians were the most proactive, with only 5% indicating that they do not contact new
suppliers but rather wait to be contacted. Whereas, importers in the US were the least
proactive, with one out of three (31%) indicating that they do not contact suppliers.
The passive and permissive attitude of the 21% of respondents who indicated that they
expect suppliers to contact them (combined with the 52% who indicated that they are not
seeking new suppliers) reflects the importance of focused and well-researched business
proposals. The same indicator highlights the opportunity for proactive exporters who reach
out to buyers directly via email or over the telephone.
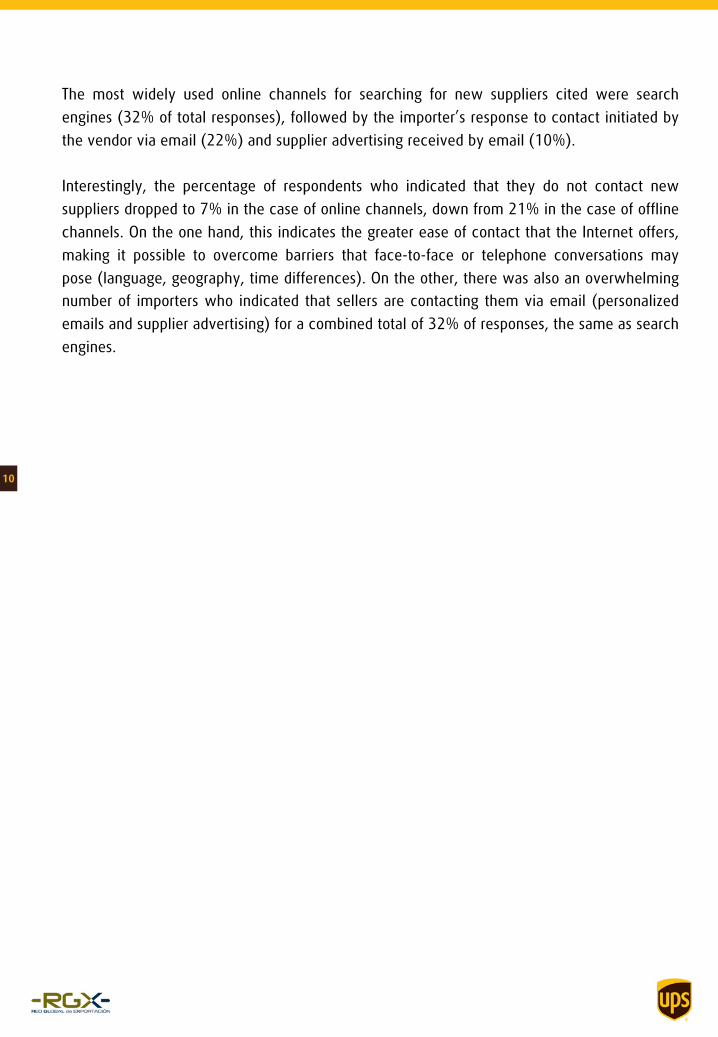
The analysis of the means by which importers find suppliers included their use of online
channels.
What online channels does your company use to contact new
international suppliers? (Multiple responses)
Top three responses.
09
32%22%
10%
Search engines
(Google, Yahoo, etc.)
Suppliers
contact me
via email
B2B portals and
e-commerce
marketplaces
10
Note: Anti-spam regulations vary by country and an exporter should review them in the market of interest.
The most widely used online channels for searching for new suppliers cited were search
engines (32% of total responses), followed by the importer’s response to contact initiated by
the vendor via email (22%) and supplier advertising received by email (10%).
Interestingly, the percentage of respondents who indicated that they do not contact new
suppliers dropped to 7% in the case of online channels, down from 21% in the case of offline
channels. On the one hand, this indicates the greater ease of contact that the Internet offers,
making it possible to overcome barriers that face-to-face or telephone conversations may
pose (language, geography, time differences). On the other, there was also an overwhelming
number of importers who indicated that sellers are contacting them via email (personalized
emails and supplier advertising) for a combined total of 32% of responses, the same as search
engines.
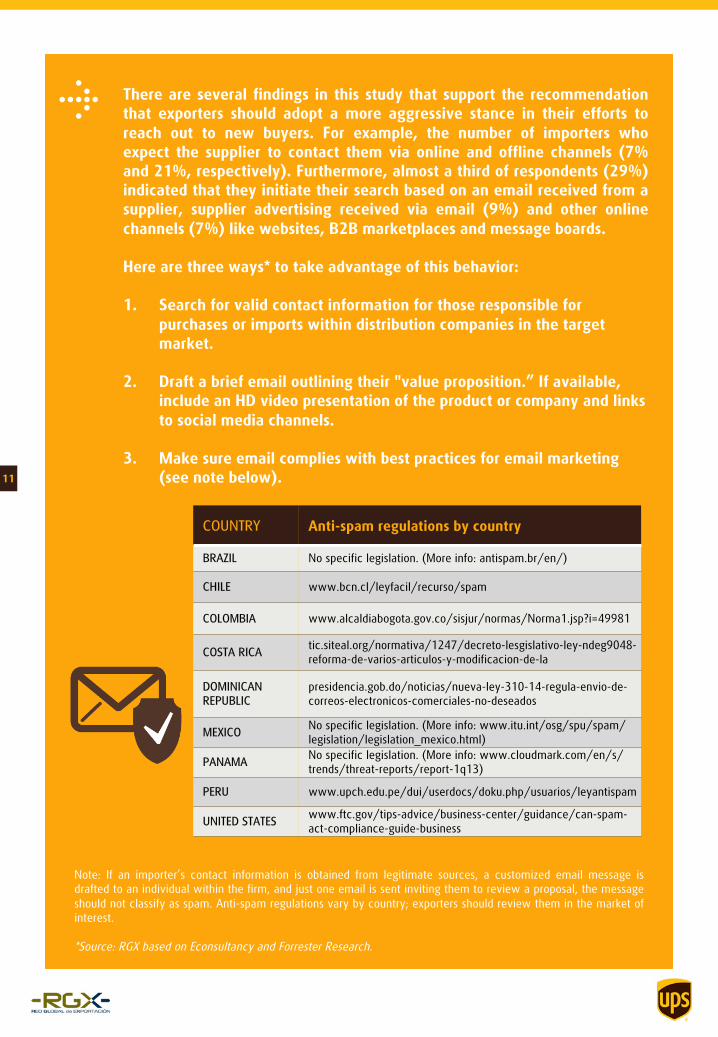
There are several findings in this study that support the recommendation
that exporters should adopt a more aggressive stance in their efforts to
reach out to new buyers. For example, the number of importers who
expect the supplier to contact them via online and offline channels (7%
and 21%, respectively). Furthermore, almost a third of respondents (29%)
indicated that they initiate their search based on an email received from a
supplier, supplier advertising received via email (9%) and other online
channels (7%) like websites, B2B marketplaces and message boards.
Here are three ways* to take advantage of this behavior:
1. Search for valid contact information for those responsible for
purchases or imports within distribution companies in the target
market.
2. Draft a brief email outlining their "value proposition.” If available,
include an HD video presentation of the product or company and links
to social media channels.
3. Make sure email complies with best practices for email marketing
(see note below).
COUNTRY Anti-spam regulations by country
BRAZIL No specific legislation. (More info: antispam.br/en/)
CHILE www.bcn.cl/leyfacil/recurso/spam
COLOMBIA www.alcaldiabogota.gov.co/sisjur/normas/Norma1.jsp?i=49981
COSTA RICAtic.siteal.org/normativa/1247/decreto-lesgislativo-ley-ndeg9048-
reforma-de-varios-articulos-y-modificacion-de-la
DOMINICAN
REPUBLIC
presidencia.gob.do/noticias/nueva-ley-310-14-regula-envio-de-
correos-electronicos-comerciales-no-deseados
MEXICONo specific legislation. (More info: www.itu.int/osg/spu/spam/
legislation/legislation_mexico.html)
PANAMANo specific legislation. (More info: www.cloudmark.com/en/s/
trends/threat-reports/report-1q13)
PERU www.upch.edu.pe/dui/userdocs/doku.php/usuarios/leyantispam
UNITED STATESwww.ftc.gov/tips-advice/business-center/guidance/can-spam-
act-compliance-guide-business
Note: If an importer’s contact information is obtained from legitimate sources, a customized email message is
drafted to an individual within the firm, and just one email is sent inviting them to review a proposal, the message
should not classify as spam. Anti-spam regulations vary by country; exporters should review them in the market of
interest.
*Source: RGX based on Econsultancy and Forrester Research.
11

Today, search engines are a way for exporting SMEs to gain greater
visibility at a relatively low cost. They can increase the possibility
of potential buyers finding them. Based on the findings, it is
important that exporters maximize the number of visitors to their
websites by ensuring that their site appears high on the list of
search engine results, also known as search engine optimization
(SEO).
Table 6: Online channels used by importers to contact new suppliers. Results broken down by
country (multiple response)
A breakdown by country reveals that in Mexico, Panama, Peru, Dominican Republic and the US,
there is a high incidence of suppliers contacting importers via email.
In the case of Panama, the response tied with search engines as the main means of
communication when initially establishing contact with a new supplier (28%).
Brazil and Dominican Republic were the two markets where the highest percentage of importers
(15% in both cases) indicated B2B portals and e-commerce marketplaces as a preferred online
channel for contacting importers.
12
B2B ande-commercesites
Searchengines
Sector-specific directories
Social media
Supplier advertising(via email)
I don’t contact them; they contact me
Suppliers contact me via email
Other
DK
Unanswered
Brazil Chile Colombia Costa Rica Mexico Panama Peru Dominican Rep. US
Source: Stella Tomasi and Xiaolin Li. 2015. Influences of Search Engine Optimization on Performance of SMEs: A Qualitative Perceptive.
J. Electron. Commer. Organ. 13, 1 (January 2015), 27-49. DOI=http://dx.doi.org/10.4018/jeco.2015010103
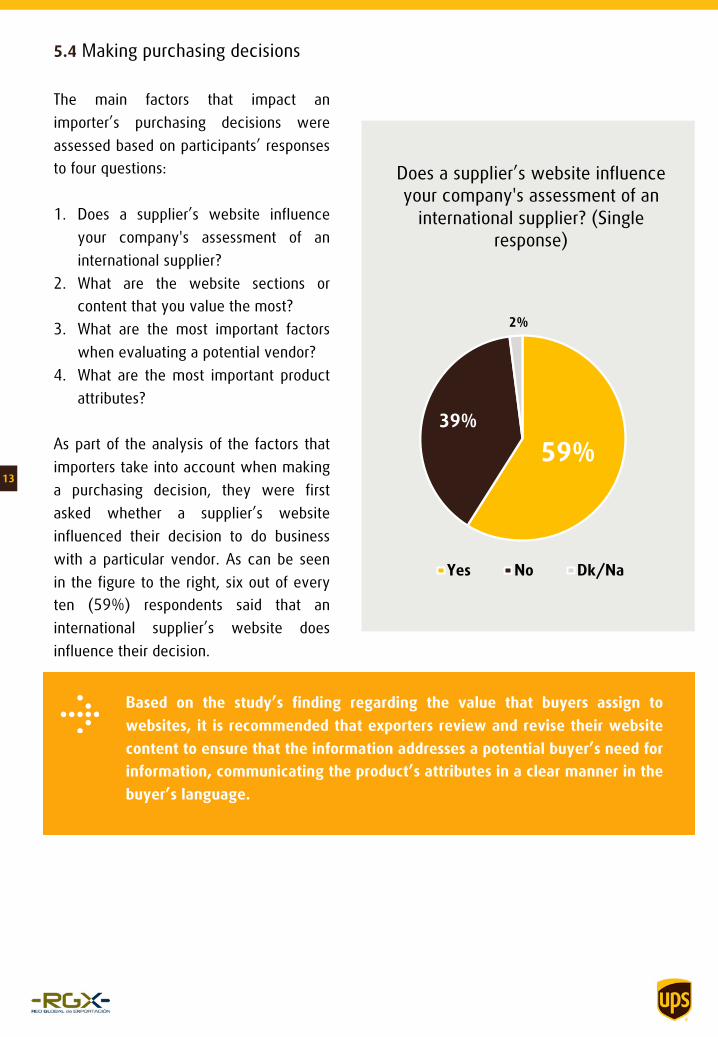
5.4 Making purchasing decisions
The main factors that impact an
importer’s purchasing decisions were
assessed based on participants’ responses
to four questions:
1. Does a supplier’s website influence
your company's assessment of an
international supplier?
2. What are the website sections or
content that you value the most?
3. What are the most important factors
when evaluating a potential vendor?
4. What are the most important product
attributes?
As part of the analysis of the factors that
importers take into account when making
a purchasing decision, they were first
asked whether a supplier’s website
influenced their decision to do business
with a particular vendor. As can be seen
in the figure to the right, six out of every
ten (59%) respondents said that an
international supplier’s website does
influence their decision.
Does a supplier’s website influence
your company's assessment of an
international supplier? (Single
response)
59%
39%
2%
Yes No Dk/Na
Based on the study’s finding regarding the value that buyers assign to
websites, it is recommended that exporters review and revise their website
content to ensure that the information addresses a potential buyer’s need for
information, communicating the product’s attributes in a clear manner in the
buyer’s language.
13
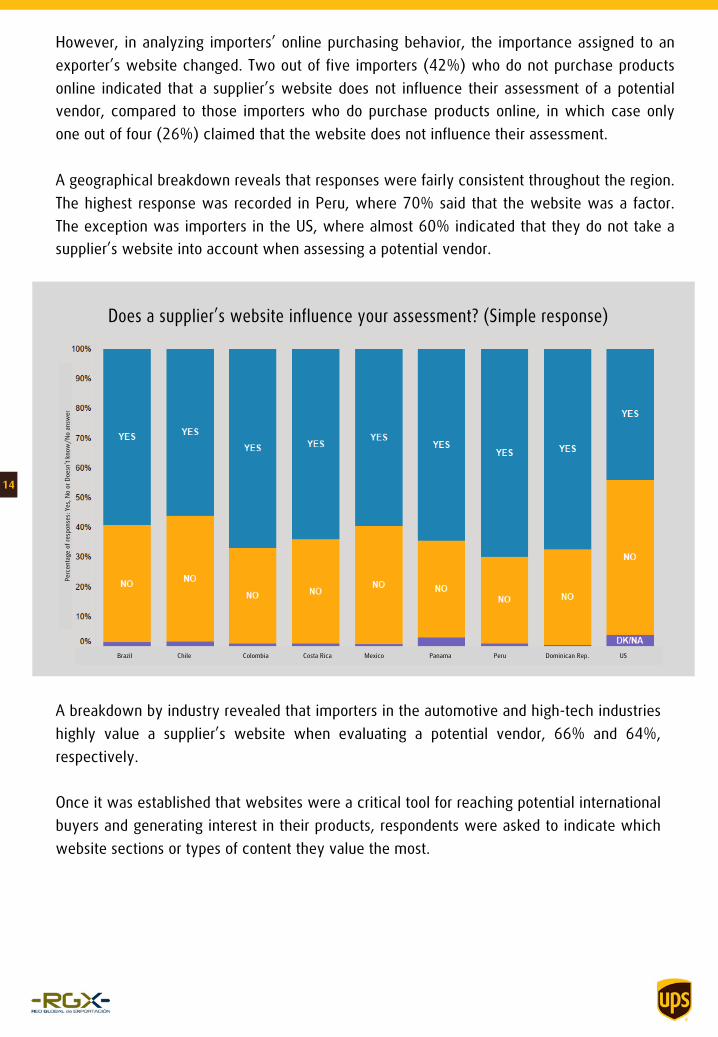
However, in analyzing importers’ online purchasing behavior, the importance assigned to an
exporter’s website changed. Two out of five importers (42%) who do not purchase products
online indicated that a supplier’s website does not influence their assessment of a potential
vendor, compared to those importers who do purchase products online, in which case only
one out of four (26%) claimed that the website does not influence their assessment.
A geographical breakdown reveals that responses were fairly consistent throughout the region.
The highest response was recorded in Peru, where 70% said that the website was a factor.
The exception was importers in the US, where almost 60% indicated that they do not take a
supplier’s website into account when assessing a potential vendor.
A breakdown by industry revealed that importers in the automotive and high-tech industries
highly value a supplier’s website when evaluating a potential vendor, 66% and 64%,
respectively.
Once it was established that websites were a critical tool for reaching potential international
buyers and generating interest in their products, respondents were asked to indicate which
website sections or types of content they value the most.
14
Perc
enta
ge o
f re
sponse
s: Y
es,
No o
r D
oesn
’t k
now
/N
o a
nsw
er
Does a supplier’s website influence your assessment? (Simple response)
Brazil Chile Colombia Costa Rica Mexico Panama Peru Dominican Rep. US

Three out of four respondents (73%) across all four industries in all nine countries surveyed
named at least four types of website content as highly important:
• Technical specifications of products
• Product certifications/Product warranty
• “Who we are/About Us” section (company experience, history, etc.)
• Product-specific export information (trade terms, freight information, etc.)
Of the different types of website content, technical specifications and product
warranty/certifications were consistently cited as the most important in all nine countries.
15%
8%
6%
2%
2%
18%
10%
52%
73%
76%
87%
88%
0% 20% 40% 60% 80% 100%
Client opinions, testimonials
Product-specific export information (Trade Terms, freight information, etc.)
“Who we are/About Us” section (company experience, history, etc.)
Product certifications/product warranty
Technical specifications of products
Highly important
Fairly important
Not important
11%
19%
How important are the following website sections/content to your assessment
of an international supplier? (Multiple responses)
Furthermore, the two types of website content most highly valued by importers are closely
linked to the perception of product quality, which was consistently named as the main factor
that the respondents took into consideration when deciding to make a purchase (see the
graph on page 16).
15
33%

When asked about the main factors taken into account when evaluating a potential supplier,
importers indicated that they look at several aspects, from the product itself to the services a
seller may offer to facilitate purchases. Product quality and price were the two top responses,
followed by seller services, such as, more flexibility in payment terms and after-sales services.
Interestingly, the majority of respondents cited several factors as highly important.
Three out of every four respondents (74%) cited five factors as highly important: price, quality,
logistics services, flexible payment terms and after-sales services, with no single one heavily
outweighing the others. Logistics tracking tools and promotional tools were still rated as highly
important by over half of all respondents.
How important are each of the following factors to your company when deciding to
purchase from an international supplier? (Multiple responses)
97% 88%
78% 78% 74%
61% 58%
3% 10%
18% 18% 20%
30% 29%
0% 2% 4% 4% 5% 9%
13%
0%
20%
40%
60%
80%
100%
120%
Product quality Price Shipping and logistics services
offered
Flexible payment terms
After-sales service Logistics tracking tools
Promotional support/tools
Highly important
Fairly important
Not at all important16
*Percentages may not total 100 due to rounding.

Given that the product itself is the main
component assessed by importers when
deciding whether to make a purchase
from a particular vendor, importers were
asked which product attributes influence
their purchasing decision the most.
Not surprisingly, the top two results were
quality and price (see table below),
which is in line with the overwhelming
response regarding product quality and
price in the previous question. In regard
to product attributes, suitability in terms
of local demand and certified
manufacturing processes tied as the most
influential factors after price and quality.
Interestingly, one out of every two
importers (48%) named at least six
factors that influence the company’s
decision to purchase a particular product.
With respect to the materials that you import, which of the following product
attributes influence your company’s purchasing decision? (Multiple responses)
According to ISO, an
independent, non-governmental global
organization with a membership of 162
national standards bodies, international
standards “are instrumental in facilitating
international trade.”
ISOhaspublishedmorethan21,000standards, coveringalmosteveryindustry.Industry-specificstandardsinclude:
Automotive: ISO/TS16949
Apparel and footwear: ISO9001/WRAP
High-tech and industrial manufacturing:
ISO 9001
For more information, visit: www.iso.org17

What type of products (other than office supplies) does your company typically import
and what online or offline instruments do you use to formalize/complete the purchasing
process in the majority of cases? (Multiple responses)
5.5 Finalizing the purchase
The following block of questions examines the means by which importers realize or formalize
their purchases, with the objective of identifying the preferred type of instrument used (from
less formal options, i.e., a telephone call, email or a supplier’s website to more traditional
options, such as the physical exchange of documents via fax or mail).
The first question in this block identifies the types of goods imported by the companies and the
means by which they formalize their sales agreements. The study’s insights revealed that the
vast majority of importers buy finished goods for resale and the preferred instrument for
formalizing their purchases is email.
The offline instrument most frequently used to formalize a sale agreement is a written contract:
27% on average in all nine countries.
18Finished goods Finished goods for Others Raw materials Semi-manufactures
for resale in-house use for production for production

In analyzing importers’
purchases, the objective was
to find out how many are
buying imported products
over the Internet and on what
types of sites they are making
those purchases. The results
indicate that four out of ten
importers (42%) are currently
buying products online. Of
those importers that said they
purchase imported products
online, 67% do so directly,
going through the website of
their international suppliers.
Do you purchase any of the products that you
import over the Internet?
(Simple response)
The predominant preference for email as the preferred means for formalizing a sale exposes
parties to a possible legal vacuum. An alternative is to sign contracts sent via email using an
internationally recognized digital signature system (e.g., VeriSign). In the event of a dispute,
the authenticity of the parties and the international sales contract can be verified.
Nearly one-quarter of respondents (23%) cited the use of B2B platforms as Alibaba, Amazon
and eBay, among others.
19
On what types of websites do you make your online purchases from?
(Multiple response)
*Percentages may not total 100 due to rounding.
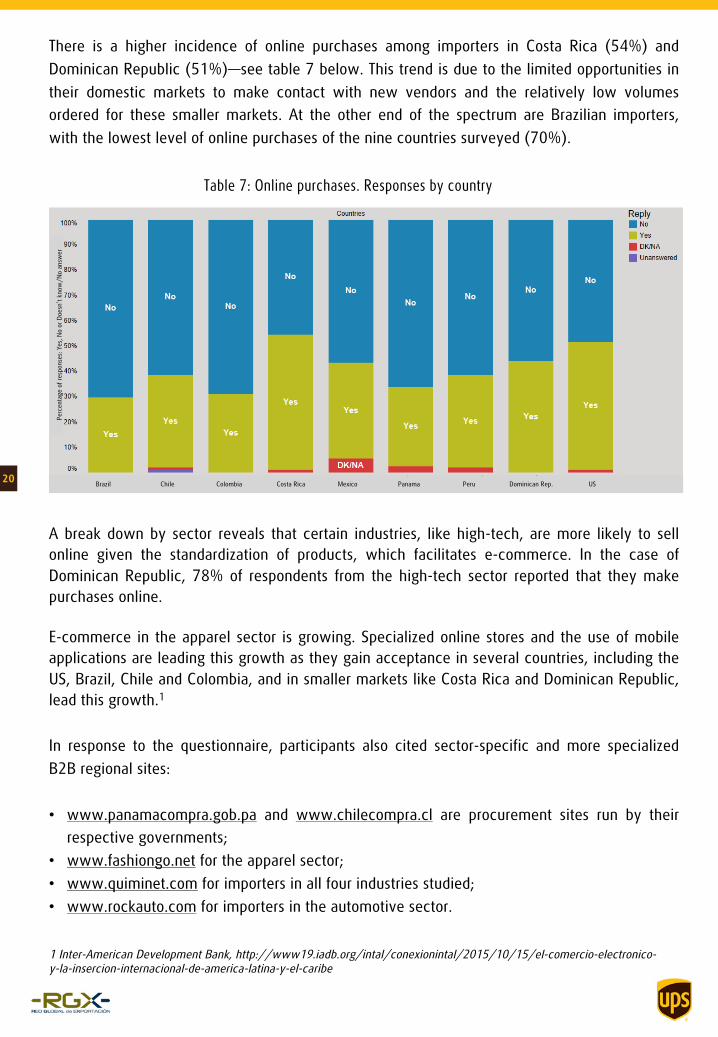
There is a higher incidence of online purchases among importers in Costa Rica (54%) and
Dominican Republic (51%)—see table 7 below. This trend is due to the limited opportunities in
their domestic markets to make contact with new vendors and the relatively low volumes
ordered for these smaller markets. At the other end of the spectrum are Brazilian importers,
with the lowest level of online purchases of the nine countries surveyed (70%).
Table 7: Online purchases. Responses by country
20Brazil Chile Colombia Costa Rica Mexico Panama Peru Dominican Rep. US
Perc
enta
ge o
f re
sponse
s: Y
es,
No o
r D
oesn
’t k
now
/N
o a
nsw
er
A break down by sector reveals that certain industries, like high-tech, are more likely to sell
online given the standardization of products, which facilitates e-commerce. In the case of
Dominican Republic, 78% of respondents from the high-tech sector reported that they make
purchases online.
E-commerce in the apparel sector is growing. Specialized online stores and the use of mobile
applications are leading this growth as they gain acceptance in several countries, including the
US, Brazil, Chile and Colombia, and in smaller markets like Costa Rica and Dominican Republic,
lead this growth.1
In response to the questionnaire, participants also cited sector-specific and more specialized
B2B regional sites:
• www.panamacompra.gob.pa and www.chilecompra.cl are procurement sites run by their
respective governments;
• www.fashiongo.net for the apparel sector;
• www.quiminet.com for importers in all four industries studied;
• www.rockauto.com for importers in the automotive sector.
1 Inter-American Development Bank, http://www19.iadb.org/intal/conexionintal/2015/10/15/el-comercio-electronico-y-la-insercion-internacional-de-america-latina-y-el-caribe

The study also includes response from importers about the promotional support they receive from
their suppliers. As shown below, nearly half (44%) of importers indicated that they do not use any
promotional tools provided by suppliers, a response that is mainly attributable to an overall lack of
awareness about the availability of these tools.
Meanwhile, earlier in the survey, when asked about whether they value promotional tools (see
page 16), 58% of all respondents rated them as highly important and 23% as fairly important.
What promotional tools provided by your international supplier(s) does your
company use to promote and sell the products you import? What are they?
(Multiple responses)
Table 8: Types of websites used for online purchases by country
21
Brazil Chile Colombia Costa Rica Mexico Panama Peru Dominican Rep. US

5.6 Import process: supply chain
The closing section of the questionnaire
assesses importers’ perceptions in terms of
critical factors along the supply chain. The
line of questioning explores the main
obstacles that they face when importing,
pinpointing the type of assistance exporters
can offer their buyers throughout the import
process.
Participants were asked who makes the
decision regarding the hiring of an
international shipper or courier once they
have purchased the product. Almost one-
third (31%) of the buyers interviewed
said that they leave the decision to their
supplier (i.e., the exporter) and two-thirds
(66%) said that they decide and hire their
international shipper.
Once your company makes a
purchase, who is in charge of
hiring the international
shipper/courier?
(Single response)31%
66%
3% Supplier/Exporter
Our company (buyer)
DK/NA
Table 9: Decision to hire a courier by country
22
Brazil Chile Colombia Costa Rica Mexico Panama Peru Dominican Rep. US
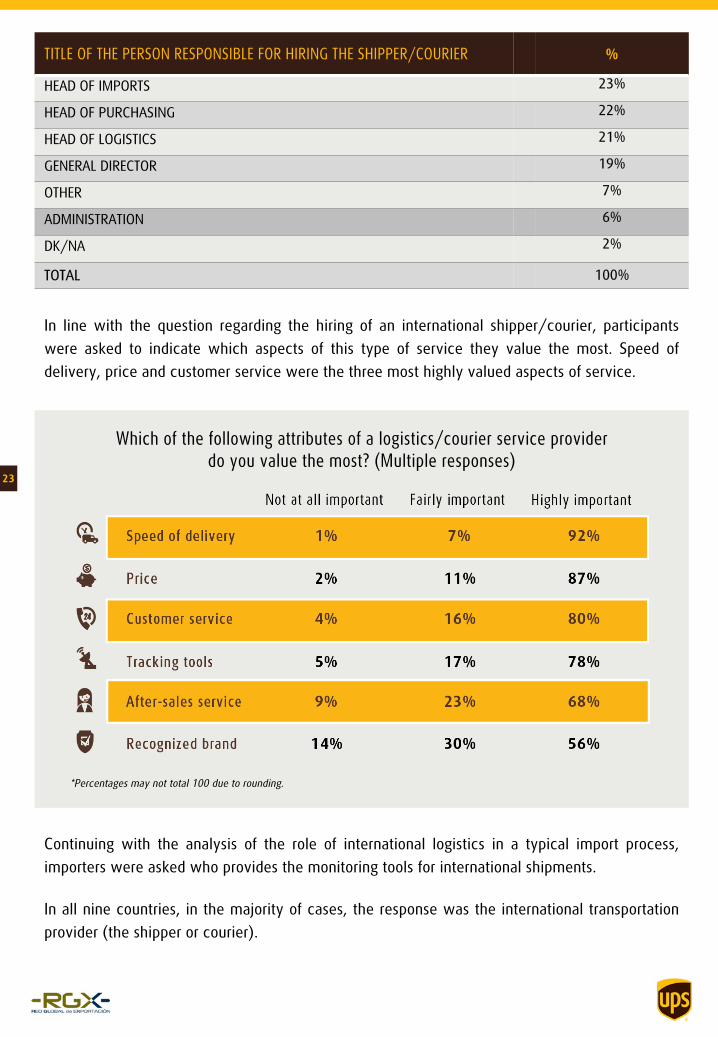
In line with the question regarding the hiring of an international shipper/courier, participants
were asked to indicate which aspects of this type of service they value the most. Speed of
delivery, price and customer service were the three most highly valued aspects of service.
TITLE OF THE PERSON RESPONSIBLE FOR HIRING THE SHIPPER/COURIER %
HEAD OF IMPORTS 23%
HEAD OF PURCHASING 22%
HEAD OF LOGISTICS 21%
GENERAL DIRECTOR 19%
OTHER 7%
ADMINISTRATION 6%
DK/NA 2%
TOTAL 100%
Which of the following attributes of a logistics/courier service provider
do you value the most? (Multiple responses)
Continuing with the analysis of the role of international logistics in a typical import process,
importers were asked who provides the monitoring tools for international shipments.
In all nine countries, in the majority of cases, the response was the international transportation
provider (the shipper or courier).
23
*Percentages may not total 100 due to rounding.

In international transactions, monitoring tools add value for three main
reasons:
1. According to the International Chamber of Commerce (ICC), one of the
most frequently used sales clauses is the Incoterm free on board (FOB)—
meaning the seller's liability for ensuring safe shipment and payment of
shipping fees terminates upon delivery of the goods to the chosen carrier.
From the importer’s perspective, having an eye on their shipment at all
times is highly valued (78% of all respondents in this study indicated as
much). For this reason, offering customers access to monitoring tools to
track shipments forms part of the recommended action to build loyalty
among importers.
2. In the BMEI 2017, delivery delays were cited as the greatest obstacle
faced by importers. Monitoring systems or tracking tools keep importers
abreast of shipping status, contributing to a better organization of the
reception of international purchases. It also allows them to prepare and
submit supporting documentation in a timely manner to avoid delays.
3. Since most of the importers interviewed in the study indicated that they
import finished goods for resale (61%), monitoring tools can also give retail
customers or end consumers access to shipping information, thereby
allowing importers to provide a better service to their customers.
Who provides the monitoring tool for shipments? (Multiple responses)
24
Brazil Chile Colombia Costa Rica Mexico Panama Peru Dominican Rep. US

Participants indicated the attributes that they value the most when selecting a logistics service
provider. The highest ranking attribute cited was speed of clearance. In second place,
compliance and the level of trust/relationship established tied. Quality of information provided
and price were also cited as highly important.
How important are each of the following attributes to your company
when choosing a customs broker? (Multiple responses)
In anticipation of the next steps involved in a typical import transaction, participants were
asked about their logistics needs once their products are released from customs at the
destination.
The findings revealed that four out of every five importers (83%) send the imported goods to
their own warehouse. Of those respondents, 64% use third-party transportation services, while
22% use their own services. These findings are in line with the profile of the importer
interviewed for this study as seen on page 6, which illustrates that two out of every five (38%)
are distributors and over half (61%) are importing finished goods for resale.
25
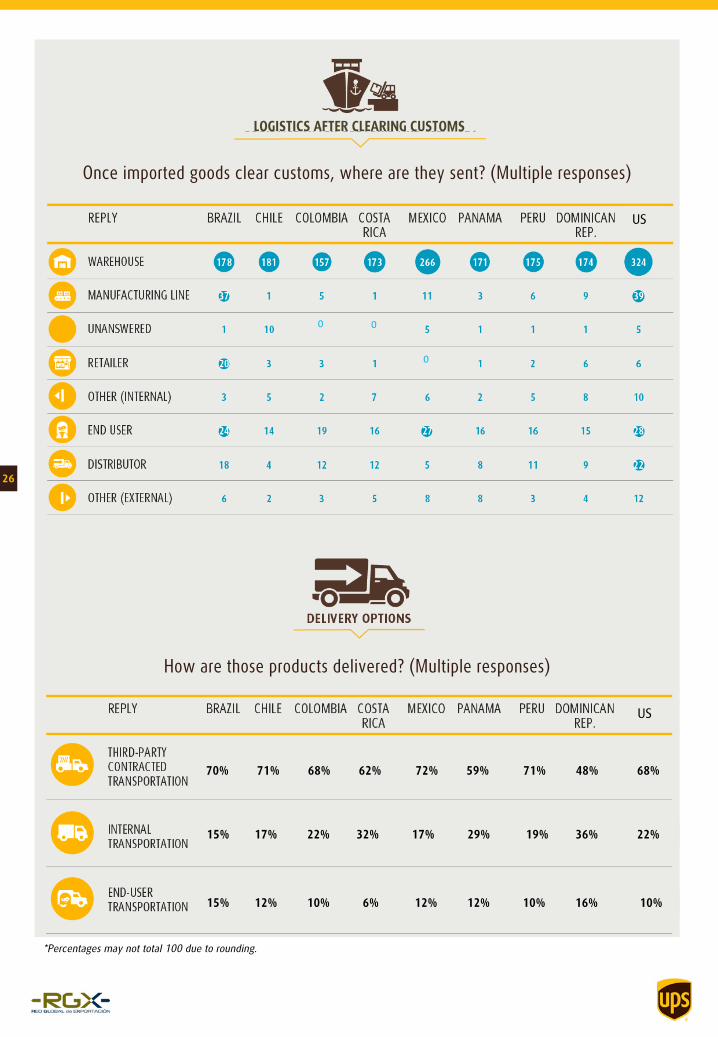
Once imported goods clear customs, where are they sent? (Multiple responses)
How are those products delivered? (Multiple responses)
26
70% 71% 68% 62% 72% 59% 71% 48% 68%
15% 17% 22% 32% 17% 29% 19% 36% 22%
15% 12% 10% 6% 12% 12% 10% 16% 10%
US
US
LOGISTICS AFTER CLEARING CUSTOMS
*Percentages may not total 100 due to rounding.
0 0
0
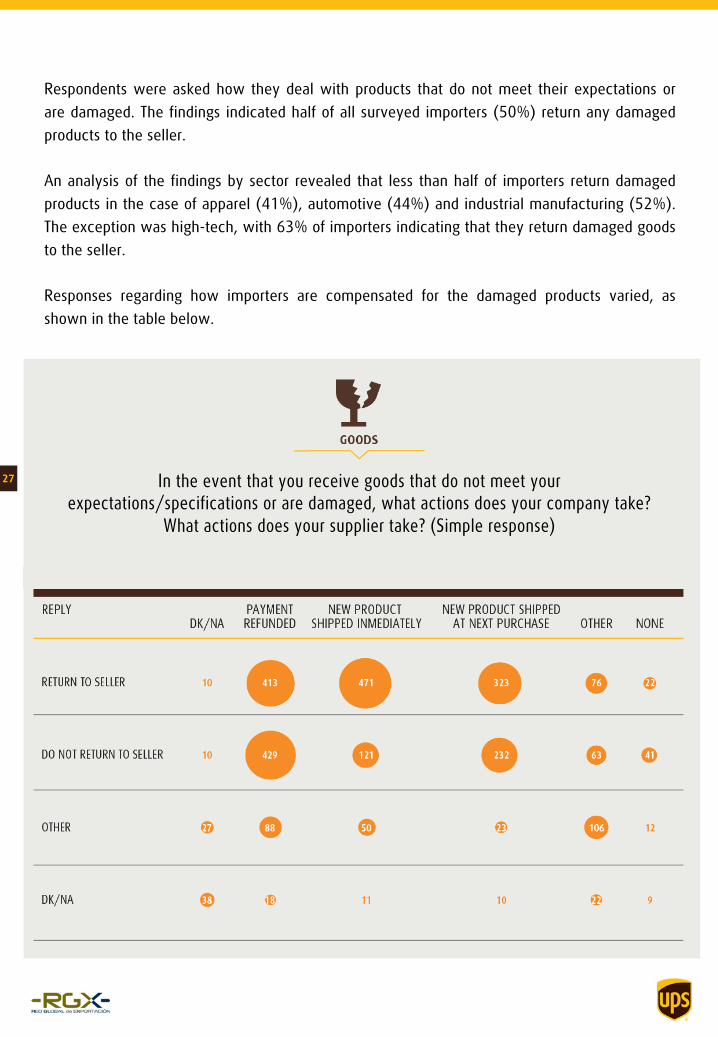
Respondents were asked how they deal with products that do not meet their expectations or
are damaged. The findings indicated half of all surveyed importers (50%) return any damaged
products to the seller.
An analysis of the findings by sector revealed that less than half of importers return damaged
products in the case of apparel (41%), automotive (44%) and industrial manufacturing (52%).
The exception was high-tech, with 63% of importers indicating that they return damaged goods
to the seller.
Responses regarding how importers are compensated for the damaged products varied, as
shown in the table below.
In the event that you receive goods that do not meet your
expectations/specifications or are damaged, what actions does your company take?
What actions does your supplier take? (Simple response)
27
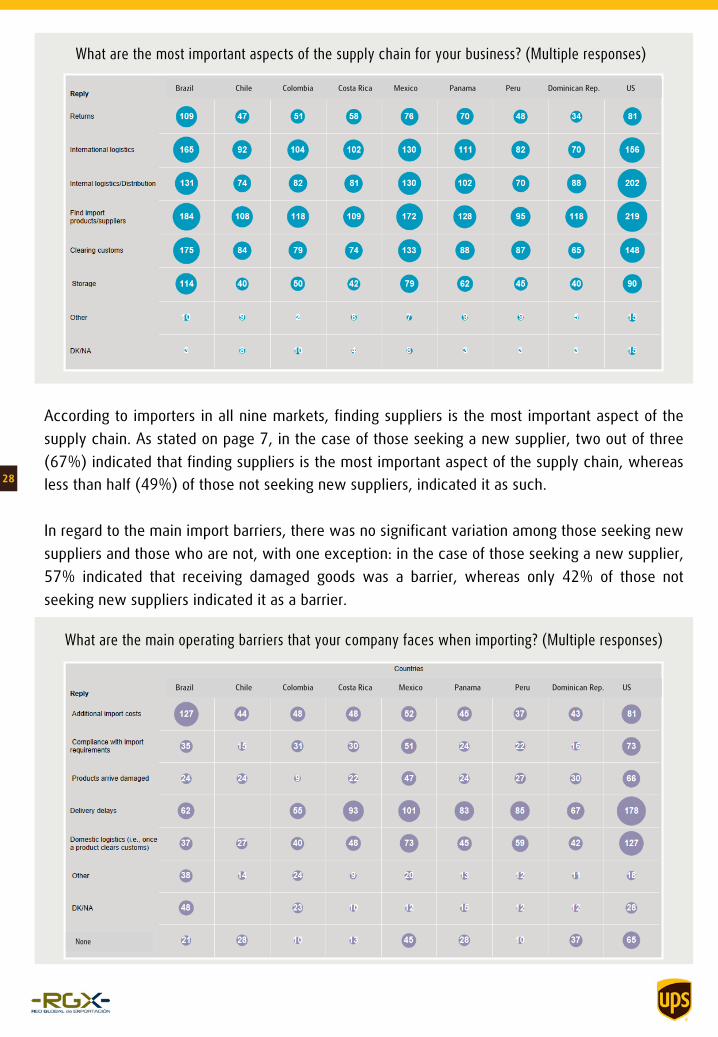
What are the most important aspects of the supply chain for your business? (Multiple responses)
What are the main operating barriers that your company faces when importing? (Multiple responses)
According to importers in all nine markets, finding suppliers is the most important aspect of the
supply chain. As stated on page 7, in the case of those seeking a new supplier, two out of three
(67%) indicated that finding suppliers is the most important aspect of the supply chain, whereas
less than half (49%) of those not seeking new suppliers, indicated it as such.
In regard to the main import barriers, there was no significant variation among those seeking new
suppliers and those who are not, with one exception: in the case of those seeking a new supplier,
57% indicated that receiving damaged goods was a barrier, whereas only 42% of those not
seeking new suppliers indicated it as a barrier.
28
Brazil Chile Colombia Costa Rica Mexico Panama Peru Dominican Rep. US
Brazil Chile Colombia Costa Rica Mexico Panama Peru Dominican Rep. US
None
As seen in section 5.2, in response to the first question, 971
importers said that they are looking for new suppliers, whereas
1,158 indicated that they are not. (Furthermore, there were 41
respondents who either responded that they didn’t know if the
company was looking or refrained from answering (DK/NA), so
they may or may not be looking.) In this section of the
questionnaire, 1,251 respondents (58%) indicated that finding
new suppliers is the most important aspect of their supply chain,
which appears incongruous with the results for the first question.
However, the fact that they are not actively looking does not make
it any less of a critical point along the supply chain.
In turn, with the exception of Brazil and Chile, delivery delays were indicated as the main
obstacle that importers face during the import process. In Brazil, the main obstacle cited was
additional import costs, followed by delivery delays in second place. Chilean importers also
named additional import costs as the top obstacle faced, followed by domestic logistics. In the
case of the US, Peru and Mexico, domestic logistics was the second most commonly cited
barrier.
Both of the above questions regarding the most important aspects of the supply chain and the
main import barriers reveal the challenges inherent in each market, highlighting countries’
different degrees of permeability regarding imports crossing their borders.
If an exporter can meet demanding commercial and non-tariff requirements, it is advisable that
they focus on markets with low tariff barriers and greater potential demand, such as the US,
Mexico and Brazil.
For those companies that are not prepared to respond to requests from countries with strict
commercial and non-tariff requirements, there are more suitable destinations with lower non-
tariff requirements and trade agreements or reduced-tariff agreements in effect to facilitate the
entry of their products.
29

Level of difficulty of entry to the countries surveyed
Importers face two types of trade barriers: tariff barriers and non-tariff barriers.
The first table shows the degree of permeability in each market in relation to
the exporter’s country of origin, based on the levels of import taxes in each
destination (tariff barriers).
The second table reflects the level of commercial and non-tariff requirements in
each of the countries analyzed.
Based on both tables, an exporter must analyze the convenience of choosing
one market over another.
Table A: Level of difficulties of entry in nine countries based on tariff barriers
Table B: Level of difficulty of entry based on commercial and non-tariff requirements: i.e., required
quantities, quality standards, certifications, flexible payment terms and after-sales services.
Low: Existing trade agreements.
Average: Tariff reduction agreements in effect.
High: No trade agreements in effect.
30

6. Sector specific highlights
6.1 Propensity to importIn an effort to understand the different countries’ propensity to import, an analysis was
conducted to determine if there is a positive correlation between an importer’s response to
whether it is currently searching for new suppliers (i.e., the percentage of importers seeking a
new provider vs. those who are not) and the evolution in recent years of imports of the more
representative tariff items in each of the four industries analyzed.
Import statistics in each industry over the past five years were examined to see if they had
increased, decreased or remained stable, and how this behavior related to the propensity to
import found in the study.
As a result, an index was created of the nine countries’ propensity to import in the four industries
studied. On the next four pages, there is a table for each industry that reflects the percentage of
importers seeking new suppliers and the findings related to their online activity and overall
digital behavior.
For the purposes of this study, an importer’s digital behavior or “e-focus” is defined by a
respondent’s positive responses to three questions: Do you search online for new suppliers? Do
you make online purchases? Do you highly value exporters’ websites?
31 -

6.2 Apparel
• The three countries with the highest percentage of respondents looking for new suppliers in
the apparel sector are the US (54%), Costa Rica (58%) and Chile (52%), which are markets
that exporters looking for new markets to develop should consider.
• In the case of the US, the most widely used means to seek new suppliers were international
fairs (49% of total responses) and Internet search engines (47% of total responses). In Chile
and Costa Rica, responses were similar, although trade missions are growing in importance.
• International fairs and trade missions are consolidated as the two preferred offline channels
used to contact new potential suppliers in all nine countries.
• In all nine countries, of those respondents who said they make purchases online, the
percentage of apparel importers who buy directly through their international supplier’s
website (73%) was higher than the average of the study (67%).
32 Apparel importers’ digital attributes and propensity to import by country

6.3 Automotive
• Colombia (54%) and Costa Rica (52%) were the two countries with the highest percentage
of importers looking for new suppliers, which is in line with the positive trend in imports seen
in the table on page 31.
• The majority of Colombian importers interviewed use search engines to find new suppliers.
• In turn, in Dominican Republic, there is a similar proportion of importers buying online
directly through the supplier’s site (44%) and those buying on B2B platforms (37%).
Furthermore, it is the country where importers use and prefer online means of contact, as
well as online purchasing methods, so it is important that exporters evaluate an online
strategy when targeting Dominican importers in this sector.
• Domestic logistics was cited as the second largest importing obstacle for this sector (19%)
following delivery delays with 28% of total responses.
33
Automotive importers’ digital attributes and propensity to import by country

6.4 High-tech
• The study’s findings indicate that the highest level of online activity in import processes is
found in the high-tech sector. This is explained by importers’ preference for online searches
for new suppliers, the high number of respondents carrying out purchases completely online
(50% of respondents), as well as the more frequent and varied use of online promotional
tools.
• In Dominican Republic, nearly eight out of ten respondents (78%) said that they purchase
products online.
• Warranty policies and product certifications were named as the most valued content on a
potential supplier’s website.
34
-
High-tech importers’ digital attributes and propensity to import by country
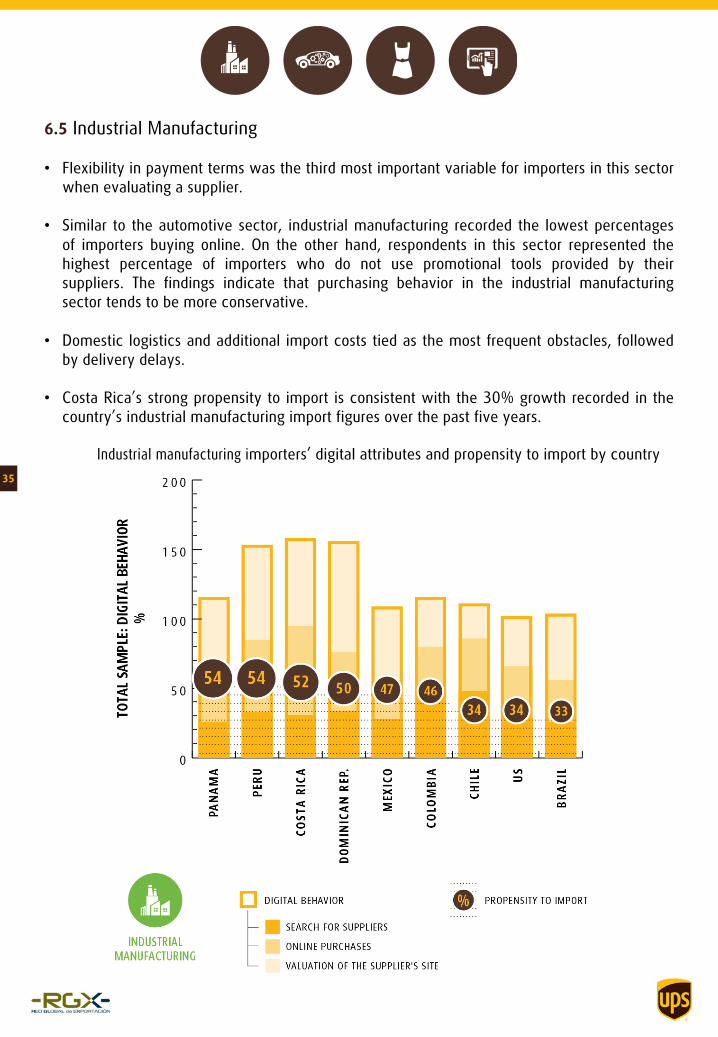
6.5 Industrial Manufacturing
• Flexibility in payment terms was the third most important variable for importers in this sector
when evaluating a supplier.
• Similar to the automotive sector, industrial manufacturing recorded the lowest percentages
of importers buying online. On the other hand, respondents in this sector represented the
highest percentage of importers who do not use promotional tools provided by their
suppliers. The findings indicate that purchasing behavior in the industrial manufacturing
sector tends to be more conservative.
• Domestic logistics and additional import costs tied as the most frequent obstacles, followed
by delivery delays.
• Costa Rica’s strong propensity to import is consistent with the 30% growth recorded in the
country’s industrial manufacturing import figures over the past five years.
35
Industrial manufacturing importers’ digital attributes and propensity to import by country
36
7. Conclusions: highlights and insights
This study takes an in-depth look at the purchasing behavior of small and medium-sized
importers in the Americas and, in particular, at their preferences and actions throughout the
import process. As a result of the responses received, several opportunities have been
identified for Latin American small and medium-sized exporters.
Four out of ten companies (42%) surveyed said that they purchase imported products over
the Internet. This trend represents an opportunity to increase sales for those exporters with
the capability to sell products online. Small and medium-sized exporters can also exploit the
advantages of organic positioning in search engines, online marketing tools and a presence
in online B2B platforms to reach more customers.
The study also highlights the importance that importers place on the quality of the products
that they buy. Exporting SMEs in the region must invest in their production processes and
work to ensure that the product they deliver meets or exceeds industry standards.
Furthermore, exporters must clearly communicate their business attributes, services,
qualifications and certifications on their companies’ websites. According to the findings,
these attributes influence importers’ purchasing decisions.
Although the results were consistent throughout the nine countries surveyed in all four
sectors—reflecting the fairly homogenous foreign trade conditions in the region—a closer
look at the behavior of importers makes it possible to make several recommendations. These
recommendations are based on:
• the percentage of importers seeking new suppliers (page 7)
• their propensity to use online channels in their import processes (pages 19 – 20)
• the permeability of the import country (page 30)
Two windows of opportunity were identified for exporting SMEs to win over and retain
international customers. The first is associated with the lack of online promotional support
that importers receive from their current suppliers.
37
Exporting SMEs can build customer loyalty by assisting buyers with their promotional efforts
through the use of tools like search engine advertising and “buy now” buttons on social
media platforms.
The second opportunity for exporters is to offer customers solutions that address one of the
main obstacles cited by importers: delays in clearing customs. Exporters can ensure that
their customers have all of the proper documentation to present in customs. They can also
provide solutions based on new technologies, such as e-commerce, online customer support
and shipment tracking tools. These solutions will be key differentiators from existing
competitors.