
BMC ProactiveNet Performance Management - HP EVA … · BMC ProactiveNet Performance Management -...
58
BMC ProactiveNet Performance Management - HP EVA Storage Monitoring STORAGE MONITORING USER DOCUMENTATION Version 1.3.00 February 2015
Transcript of BMC ProactiveNet Performance Management - HP EVA … · BMC ProactiveNet Performance Management -...

BMC ProactiveNet PerformanceManagement - HP EVA StorageMonitoring
STORAGE MONITORING
USER DOCUMENTATION
Version 1.3.00
February 2015
Contacting BMC Software
You can access the BMC Software Web site at http://www.bmc.com. From this Web site, you canobtain information about the company, its products, corporate offices, special events, and careeropportunities.
United States and Canada
Address BMC Software, Inc.2101 CityWest Blvd. Houston TX77042-2827
Telephone 1 (713) 918 8800 or 1 (800) 841 2031 (Toll Free)
Copyright 2006 BMC Software, Inc. or licensors, as an unpublished work. All rights reserved.
BMC Software, the BMC Software logos, and all other BMC Software product or service names areregistered trademarks or trademarks of BMC Software, Inc.
All other trademarks belong to their respective companies.
BMC Software considers information included in this documentation to be proprietary andconfidential. Your use of this information is subject to the terms and conditions of the applicableEnd User License Agreement for the product and the proprietary and restricted rights noticesincluded in this documentation.
Restricted Rights Legend
U.S. Government Restricted Rights to Computer Software. UNPUBLISHED -- RIGHTS RESERVEDUNDER THE COPYRIGHT LAWS OF THE UNITED STATES. Use, duplication, or disclosure of any dataand computer software by the U.S. Government is subject to restrictions, as applicable, set forthin FAR Section 52.227-14, DFARS 252.227-7013, DFARS 252.227-7014, DFARS 252.227-7015, andDFARS 252.227-7025, as amended from time to time. Contractor/Manufacturer is BMC Software,Inc., 2101 CityWest Blvd., Houston, TX 77042-2827, USA. Any contract notices should be sent to thisaddress.
2
BM
C P
roac
tive
Net
Per
form
ance
Man
age
men
t -
HP
EV
A S
tora
ge M
onit
orin
g V
ersi
on 1
.3.0
0
Customer Support
You can obtain technical support by using the Support page on the BMC Software Web site or bycontacting Customer Support by telephone or e-mail. To expedite your inquiry, please see"Before Contacting BMC Software."
Support Web Site
You can obtain technical support from BMC Software 24 hours a day, 7 days a week at http://www.bmc.com/support_home. From this Web site, you can
Read overviews about support services and programs that BMC Software offers:
Find the most current information about BMC Software products
Search a database for problems similar to yours and possible solutions
Order or download product documentation
Report a problem or ask a question
Subscribe to receive e-mail notices when new product versions are released
Find worldwide BMC Software support center locations and contact information, including e-mail addresses, fax numbers, and telephone numbers
You can also access product documents and search the Knowledge Base for help with an issue athttp://www.sentrysoftware.com
Support by Telephone or E-mail
In the United States and Canada, if you need technical support and do not have access to the Web,call 800 537 1813. Outside the United States and Canada, please contact your local support centerfor assistance. To find telephone and email contact information for the BMC Software supportcenter that services your location, refer to the Contact Customer Support section of the Supportpage on the BMC Software Web site at http://www.bmc.com/support_home.
Before Contacting BMC Software
Before you contact BMC Software, have the following information available so that CustomerSupport can begin working on your problem immediately:
3
BM
C P
roac
tive
Net
Per
form
ance
Man
age
men
t -
HP
EV
A S
tora
ge M
onit
orin
g V
ersi
on 1
.3.0
0

4
BM
C P
roac
tive
Net
Per
form
ance
Man
age
men
t -
HP
EV
A S
tora
ge M
onit
orin
g V
ersi
on 1
.3.0
0
Table of Contents.....................................................................................................................................................................................9User Goals and Features
.....................................................................................................................................................................................10Business Value
.....................................................................................................................................................................................10Supported Platforms
.....................................................................................................................................................................................12HP Command View EVA
.....................................................................................................................................................................................14Importing the Monitoring Solution into Central Administration
.....................................................................................................................................................................................15Creating the Installation Package
.....................................................................................................................................................................................16Downloading the Installation Package
.....................................................................................................................................................................................16Installing the Package
.....................................................................................................................................................................................20Configuring General Settings
.......................................................................................................................................................................................21Managing Policies
.....................................................................................................................................................................................22Configuring Monitor Settings
.......................................................................................................................................................................................26Enabling the Debug Mode
.......................................................................................................................................................................................27Managing Unknown Status
.....................................................................................................................................................................................28Adding Tags to PATROL Agents
.....................................................................................................................................................................................31Configuring Monitor Thresholds
.....................................................................................................................................................................................32Editing a Threshold Configuration
.....................................................................................................................................................................................32Deleting a Threshold Configuration
.....................................................................................................................................................................................34Detecting High Processor Utilization
.....................................................................................................................................................................................36Detecting Unbalanced Workload Distribution on Controllers
.....................................................................................................................................................................................38Diagnosing Fiber Performance Issues
.....................................................................................................................................................................................39Diagnosing a Bad Disk Layout
.....................................................................................................................................................................................45HP EVA Controllers
.....................................................................................................................................................................................45HP EVA Data Replication Tunnel
.....................................................................................................................................................................................46HP EVA Host Connection
.....................................................................................................................................................................................47HP EVA Host Port
.....................................................................................................................................................................................48HP EVA KM
.....................................................................................................................................................................................48HP EVA Node
.....................................................................................................................................................................................49HP EVA Physical Disk Group
.....................................................................................................................................................................................50HP EVA Physical Disk
.....................................................................................................................................................................................51HP EVA Port Status
.....................................................................................................................................................................................52HP EVA Virtual Disk Group
.....................................................................................................................................................................................54HP EVA Virtual Disk

Support Information

7
BM
C P
roac
tive
Net
Per
form
ance
Man
age
men
t -
HP
EV
A S
tora
ge M
onit
orin
g V
ersi
on 1
.3.0
0
This section contains information about how to contact Customer Support and the levels ofsupport offered for this and other releases.
If you have problems with or questions about a BMC product, or for the latest support policies,see the Customer Support website at http://www.bmc.com/support. You can also access productdocuments and search the Knowledge Base for help with an issue at http://www.sentrySoftware.com. If you do not have access to the web and you are in the United Statesor Canada, contact Customer Support at 800 537 1813. Outside the United States or Canada,contact your local BMC office or agent.

Key Concepts

9
BM
C P
roac
tive
Net
Per
form
ance
Man
age
men
t -
HP
EV
A S
tora
ge M
onit
orin
g V
ersi
on 1
.3.0
0
The pages in this section provide a high-level overview of the product.
User Goals and Features
Business Value
Supported Platforms
Note that for convenience and brevity, reference to BMC ProactiveNet Performance Management - HP EVAStorage Monitoring, may also be made as BPPM HP EVA Storage Monitoring.
User Goals and FeaturesBMC ProactiveNet Performance Management - HP EVA Storage Monitoring product allows you toview, monitor, and manage your entire HP EVA storage environment by viewing the current andhistorical information through a centralized console. You can view detailed system metrics on allparts of your environment.
BMC ProactiveNet Performance Management - HP EVA Storage Monitoring enables you tomanage the following in your environment:
Nodes: available capacity, byte rate, port count...
Controllers: processor utilization, transfer processor utilization, status...
Host Ports: read byte rate, read request rate, read response time...
Data Replication Tunnel: copy in/out byte rate, free command resources, Round Trip Delay
Physical Disks: read byte rate, read request rate, request queue...
Virtual Disks: cache hit ratio, cache read byte rate, cache read request...
Virtual Disk Groups: cache hit ratio, cache read byte rate, cache read response time...
Host Connections: busy responses, request queue...
10User Goals and Features
BM
C P
roac
tive
Net
Per
form
ance
Man
age
men
t -
HP
EV
A S
tora
ge M
onit
orin
g V
ersi
on 1
.3.0
0
Business ValueBMC ProactiveNet Performance Management - HP EVA Storage Monitoring provides current andhistorical information through a centralized console so you can easily view and manage yourentire HP EVA environment. The product collects and brings critical performance data and usefulmetrics into the BMC ProactiveNet Performance Management environment and enables SANAdministrators to be warned whenever a problem occurs in their HP EVA environment.
BMC ProactiveNet Performance Management - HP EVA Storage Monitoring:
collects storage performance and metrics to keep total control of your SAN/NASenvironment
identifies performance bottlenecks (physical disks, controllers, fiber links, etc.)
manages and helps rationalize disk space consumption
pinpoints unused disk capacity
analyzes overall traffic and in-depth I/Os, etc
Supported PlatformsBMC ProactiveNet Performance Management - HP EVA Storage Monitoring supports the entireHP StorageWorks Enterprise Virtual Array Family (EVA).

Prerequisites
12
BM
C P
roac
tive
Net
Per
form
ance
Man
age
men
t -
HP
EV
A S
tora
ge M
onit
orin
g V
ersi
on 1
.3.0
0
Integrated as a native module for PATROL, BMC ProactiveNet Performance Management - HP EVAStorage Monitoring is designed to monitor the health and performance of your HP EVA storageenvironment. Prior to install BMC ProactiveNet Performance Management - HP EVA StorageMonitoring on the HP Storage Server running Windows, make sure that the following elementsare installed and properly configured:
PATROL Agent, version 3.8 or higher (see BMC PATROL documentation)
PATROL Console (see BMC PATROL documentation)
HP StorageWorks v9.1,or higher
Java 1.6 or higher.
The PATROL Agent must be installed on the HP Storage Server provided with the HP EVA diskarray. The HP Storage Server usually comes bundled with the HP EVA disk array and is fully pre-installed by HP.
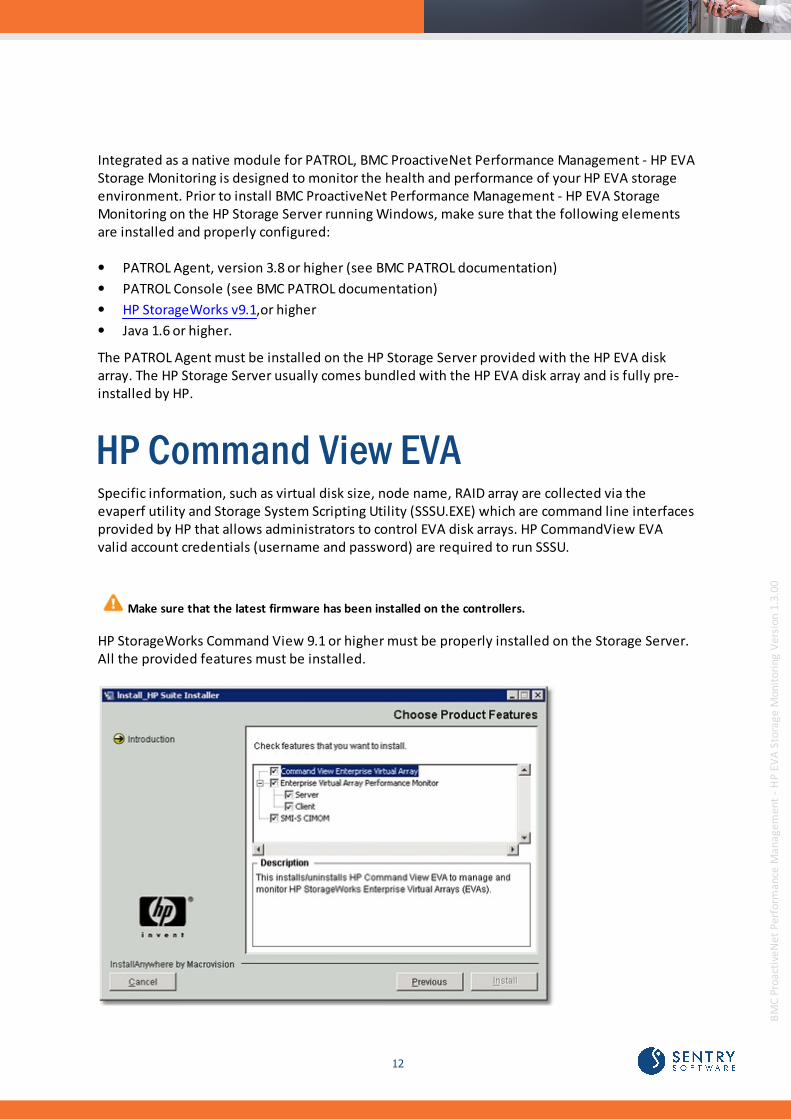
HP Command View EVASpecific information, such as virtual disk size, node name, RAID array are collected via theevaperf utility and Storage System Scripting Utility (SSSU.EXE) which are command line interfacesprovided by HP that allows administrators to control EVA disk arrays. HP CommandView EVAvalid account credentials (username and password) are required to run SSSU.
Make sure that the latest firmware has been installed on the controllers.
HP StorageWorks Command View 9.1 or higher must be properly installed on the Storage Server.All the provided features must be installed.

Installing the Monitoring Solution

14
BM
C P
roac
tive
Net
Per
form
ance
Man
age
men
t -
HP
EV
A S
tora
ge M
onit
orin
g V
ersi
on 1
.3.0
0
The installation can be handled from A to Z from BMC ProactiveNet Central MonitoringAdministration. Once the latest version of the solution has been loaded into BMC ProactiveNetCentral Monitoring Administration, administrators can create all the installation packagesrequired for their different operating systems and platforms and save them for later use in theMonitoring Installation Packages list. These packages can then be deployed to multiplecomputers. Administrators just have to connect to BMC ProactiveNet Central MonitoringAdministration from the server where they want to install the package, download it and launchthe installation.
This section describes the different steps to follow to install BPPM HP EVA Storage Monitoring:
Importing BPPM HP EVA Storage Monitoring into Central Administration
Creating the Installation Package
Downloading the Installation Package
Installing the Package
Importing the Monitoring Solutioninto Central AdministrationThe BMC ProactiveNet Central Monitoring Repository includes the current versions of the BMCPATROL Agent and BMC PATROL Monitoring Solutions that you can use with BMC ProactiveNet. Ifthe version available in the Repository does not correspond to the latest one, you will have tomanually import it:
1. Log on to BMC ProactiveNet Central Monitoring Administration.
2. Click the Repository drawer and select Manage Repository.
3. Check that the version of the BMC component available is actually the latest one. If not,download the latest version corresponding to your operating system (Windows or UNIX/Linux) available on the Sentry Software Website and save it on the local computer fromwhich you are running the Central Monitoring Administration web-based console.
4. From the BMC ProactiveNet Central Monitoring Administration, click Import .
5. Select Single solution.
6. Browse to the .zip source file.
7. Click Import.
The selected archive file is imported to the repository.

15 Importing the Monitoring Solution into CentralAdministration
BM
C P
roac
tive
Net
Per
form
ance
Man
age
men
t -
HP
EV
A S
tora
ge M
onit
orin
g V
ersi
on 1
.3.0
0
Creating the Installation PackageThe installation package to deploy to managed systems can be created directly from BMCProactiveNet Central Monitoring Administration:
1. Log on to BMC ProactiveNet Central Monitoring Administration
2. Click the Repository drawer and select Monitoring Repository.
3. Click Add .
4. Select the operating system and platform for which you want to create a package. Thecomponents available in the repository for the selected operating system and platform aredisplayed.
5. Select the Installation Package Component:
From the Available components list, select the relevant component.
From the Version list, select the latest version.
Click the right arrow button to move the component into the Selected Components list
By default, the appropriate BMC PATROL Agent for the operating system and platform that you
chose is included in the Selected components list.
Click Next. The Add Component Installation Package wizard is displayed.
6. Go through the wizard and specify the required PATROL information. The InstallationPackage Details is displayed:
7. Verify that:
the operating system and platform are correct
the components that you want to include are listed in the Included Components list.
8. Provide the following information:
Name: Enter a unique name for the package.
(Optional) Description: Enter a description of the package. The description is displayed inthe Monitoring Installation Packages list on the Monitoring Repository window.
Format: Select a file compression format for the package.
9. Click Save Installation Package.
10. Click Close. The package is now available in the Monitoring Installation Packages list.
16Creating the Installation Package
BM
C P
roac
tive
Net
Per
form
ance
Man
age
men
t -
HP
EV
A S
tora
ge M
onit
orin
g V
ersi
on 1
.3.0
0
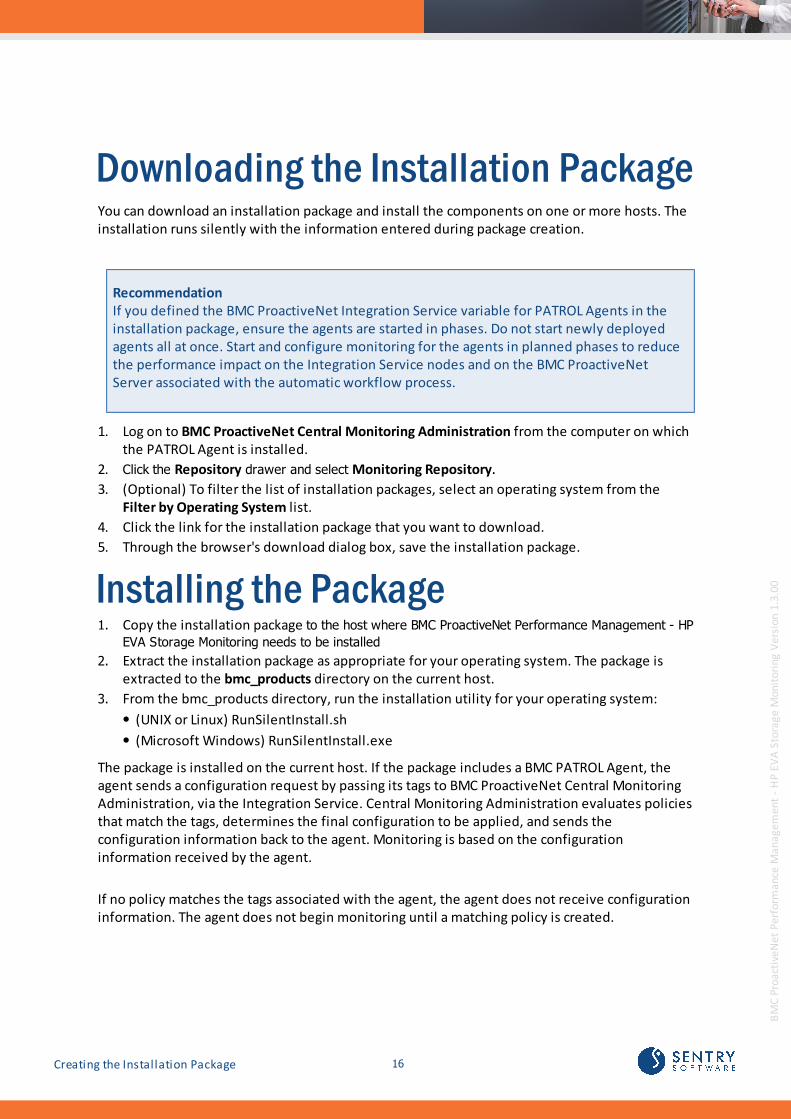
Downloading the Installation PackageYou can download an installation package and install the components on one or more hosts. Theinstallation runs silently with the information entered during package creation.
RecommendationIf you defined the BMC ProactiveNet Integration Service variable for PATROL Agents in theinstallation package, ensure the agents are started in phases. Do not start newly deployedagents all at once. Start and configure monitoring for the agents in planned phases to reducethe performance impact on the Integration Service nodes and on the BMC ProactiveNetServer associated with the automatic workflow process.
1. Log on to BMC ProactiveNet Central Monitoring Administration from the computer on whichthe PATROL Agent is installed.
2. Click the Repository drawer and select Monitoring Repository.
3. (Optional) To filter the list of installation packages, select an operating system from the Filter by Operating System list.
4. Click the link for the installation package that you want to download.
5. Through the browser's download dialog box, save the installation package.
Installing the Package1. Copy the installation package to the host where BMC ProactiveNet Performance Management - HP
EVA Storage Monitoring needs to be installed
2. Extract the installation package as appropriate for your operating system. The package isextracted to the bmc_products directory on the current host.
3. From the bmc_products directory, run the installation utility for your operating system:
(UNIX or Linux) RunSilentInstall.sh
(Microsoft Windows) RunSilentInstall.exe
The package is installed on the current host. If the package includes a BMC PATROL Agent, theagent sends a configuration request by passing its tags to BMC ProactiveNet Central MonitoringAdministration, via the Integration Service. Central Monitoring Administration evaluates policiesthat match the tags, determines the final configuration to be applied, and sends theconfiguration information back to the agent. Monitoring is based on the configurationinformation received by the agent.
If no policy matches the tags associated with the agent, the agent does not receive configurationinformation. The agent does not begin monitoring until a matching policy is created.

Integrating the MonitoringSolution
18
BM
C P
roac
tive
Net
Per
form
ance
Man
age
men
t -
HP
EV
A S
tora
ge M
onit
orin
g V
ersi
on 1
.3.0
0
Depending on the version of BMC ProactiveNet Performance Management used, integrationsteps may need to be performed.
BMC ProactiveNet Performance Management 8.5, 8.6 or 9.0To integrate BMC ProactiveNet Performance Management - HP EVA Storage Monitoring into BMCProactiveNet Performance Management 8.5, 8.6 or 9.0, you need to create a specific adapter. Formore information, please refer to Integrating the Sentry Software's KMs into BMC ProactiveNetPerformance Management (BPPM).
BMC ProactiveNet Performance Management 9.5
No specific integration steps need to be performed.

Configuring After Installation
20
BM
C P
roac
tive
Net
Per
form
ance
Man
age
men
t -
HP
EV
A S
tora
ge M
onit
orin
g V
ersi
on 1
.3.0
0
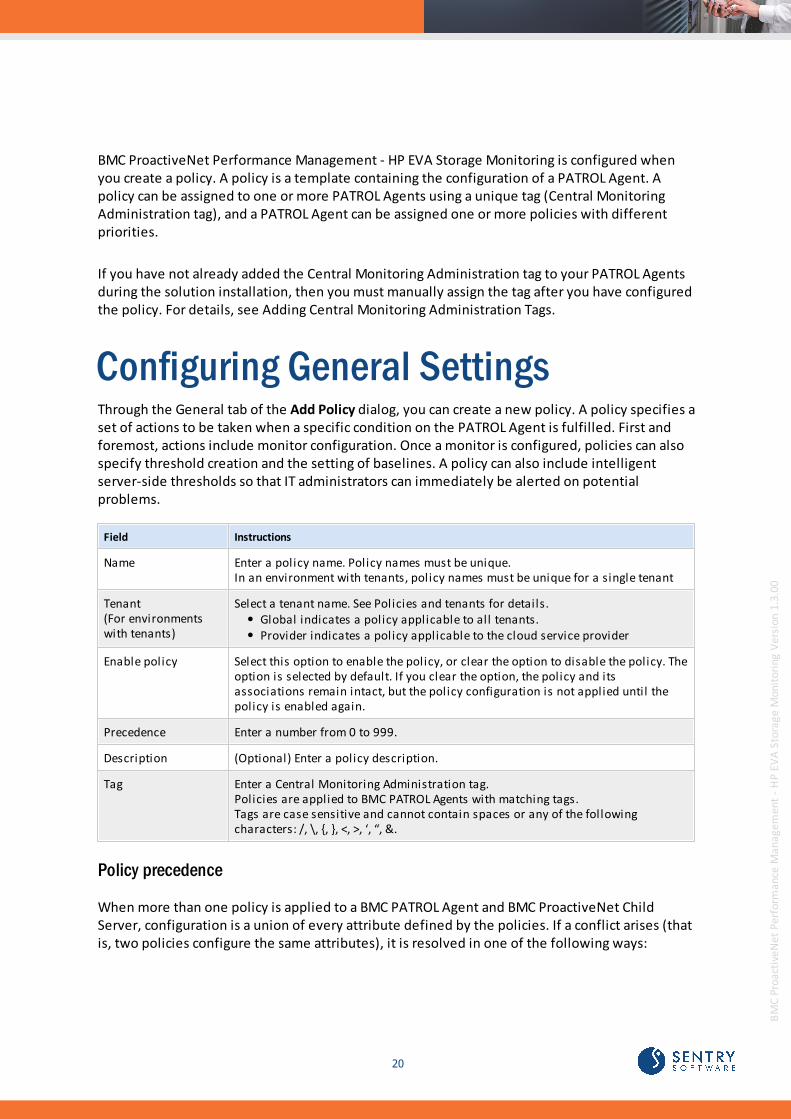
BMC ProactiveNet Performance Management - HP EVA Storage Monitoring is configured whenyou create a policy. A policy is a template containing the configuration of a PATROL Agent. Apolicy can be assigned to one or more PATROL Agents using a unique tag (Central MonitoringAdministration tag), and a PATROL Agent can be assigned one or more policies with differentpriorities.
If you have not already added the Central Monitoring Administration tag to your PATROL Agentsduring the solution installation, then you must manually assign the tag after you have configuredthe policy. For details, see Adding Central Monitoring Administration Tags.
Configuring General SettingsThrough the General tab of the Add Policy dialog, you can create a new policy. A policy specifies aset of actions to be taken when a specific condition on the PATROL Agent is fulfilled. First andforemost, actions include monitor configuration. Once a monitor is configured, policies can alsospecify threshold creation and the setting of baselines. A policy can also include intelligentserver-side thresholds so that IT administrators can immediately be alerted on potentialproblems.
Field Instructions
Name Enter a policy name. Policy names must be unique. In an environment with tenants, policy names must be unique for a single tenant
Tenant(For environmentswith tenants)
Select a tenant name. See Policies and tenants for details. Global indicates a policy applicable to all tenants.Provider indicates a policy applicable to the cloud service provider
Enable policy Select this option to enable the policy, or clear the option to disable the policy. Theoption is selected by default. If you clear the option, the policy and itsassociations remain intact, but the policy configuration is not applied until thepolicy is enabled again.
Precedence Enter a number from 0 to 999.
Description (Optional) Enter a policy description.
Tag Enter a Central Monitoring Administration tag.Policies are applied to BMC PATROL Agents with matching tags.Tags are case sensitive and cannot contain spaces or any of the followingcharacters: /, \, {, }, <, >, ‘, “, &.
Policy precedence
When more than one policy is applied to a BMC PATROL Agent and BMC ProactiveNet ChildServer, configuration is a union of every attribute defined by the policies. If a conflict arises (thatis, two policies configure the same attributes), it is resolved in one of the following ways:

21 Configuring General Settings
BM
C P
roac
tive
Net
Per
form
ance
Man
age
men
t -
HP
EV
A S
tora
ge M
onit
orin
g V
ersi
on 1
.3.0
0
Policies with the same tag: If conflicting policies have the same tag, the precedence valuedetermines the order the policies are applied. The policy with the lower number value forprecedence is the policy from which the final configuration is applied.
Policies with different tags: If conflicting policies have different tags, then the policies areapplied according to the order they are listed on the BMC PATROL Agent. The policy listedlast on the agent is the policy from which the final configuration is applied.
Managing PoliciesThis topic provides general instructions for the following policy management tasks: editing,deleting, enabling and disabling.
Before you begin
Enable Central Monitoring Administration and log on to Central Monitoring Administration. Referto the BMC documentation and more especially to the section Enabling and configuring CentralMonitoring Administration for details.
Policies with only threshold conf iguration or server side conf iguration are applicable only after a policy withmonitor conf iguration is applied.
To edit a monitoring policy1. In the navigation pane of Central Monitoring Administration, click the Policies drawer and
select a policy view.
2. Select a policy and click Edit .
3. Edit the Configuring general settings of the policy.
4. Edit information on one or more of the following tabs:
Configuring monitor settings.
Configuring threshold settings.
5. Click Update.
To delete a monitoring policy
Deleting a policy deletes all monitor instances and most settings configured through the policy. Devicesremain in the User Groups to which they have been added.

22Configuring General Settings
BM
C P
roac
tive
Net
Per
form
ance
Man
age
men
t -
HP
EV
A S
tora
ge M
onit
orin
g V
ersi
on 1
.3.0
0
1. In the navigation pane of Central Monitoring Administration, click the Policies drawer andselect a policy view.
2. Select one or more policies and click Delete .
3. Click Yes to confirm deletion.
To enable or disable a monitoring policy
Enable or disable policies for maintenance and troubleshooting. When a policy is disabled, thepolicy and its associations remain intact, but the policy configuration is not applied until thepolicy is enabled again.
1. In the navigation pane of Central Monitoring Administration, click the Policies drawer andselect a policy view.
2. Select one or more policies and click Enable or Disable.
Configuring Monitor SettingsWhen you create or edit a policy, you can add and configure monitor types. The Add MonitorTypes dialog box presents configuration fields for compatible BMC PATROL monitoring solutionsthat are located in the Central Monitoring Repository. For a list of monitoring solutions that youcan configure through Central Monitoring Administration, see the Monitoring solutionsconf igurable through Central Monitoring Administration chapter in the BPPM onlinedocumentation.
For configuration details for a specific monitor type, see the monitor documentation. Toconfigure custom monitoring solutions through Central Monitoring Administration, ensure thesolution is structured correctly; for details, see the Building a PATROL Knowledge ModuleDevelopers Guide on BMC Support website.

23 Configuring Monitor Settings
BM
C P
roac
tive
Net
Per
form
ance
Man
age
men
t -
HP
EV
A S
tora
ge M
onit
orin
g V
ersi
on 1
.3.0
0
To configure the Monitor Type settings using the Add Monitor Typesdialog box1. In the navigation pane of Central Monitoring Administration, click the Policies drawer and
select a policy view.
2. Click Add to display the Add Policy dialog box.
3. Click the Monitor Configuration tab.
4. Click Add.
5. From the Solution menu, select HP EVA Storage.
6. From the Version menu, select the required version.
7. Enter the Connection Settings to the HP StorageWorks :

24Configuring Monitor Settings
BM
C P
roac
tive
Net
Per
form
ance
Man
age
men
t -
HP
EV
A S
tora
ge M
onit
orin
g V
ersi
on 1
.3.0
0
Username: Username to use for establishing a connection with HP StorageWorks.
Password: Username to use for establishing a connection with HP StorageWorks.
9. Configure the monitoring settings:
Use the spin button of the Discovery Interval field to enter the frequency in minutes of thediscovery process. By default, the solution runs a discovery every 60 minutes
Use the spin button of the Polling Interval field to indicate how often new data iscollected. By default, the polling interval is set to every 2 minutes.
Check the Disable Virtual Disks Monitoring box if you want to limit the number ofinstances created and therefore reduce the system resource consumption. Discovery andcollect requests and operations will no longer be performed.

25 Configuring Monitor Settings
BM
C P
roac
tive
Net
Per
form
ance
Man
age
men
t -
HP
EV
A S
tora
ge M
onit
orin
g V
ersi
on 1
.3.0
0
Specify the volumes to be excluded (Exclude Volumes field) or included (Keep OnlyVolumes field). If you specify a regular expression based on the volume PATROL ID, allvolumes that match with the specified regular expression will respectively be excluded orincluded.
10. Click Add to List to save the new connection to the HP StorageWorks.
11. Click Add. If the monitor configuration has been successfully added, click Close.
12. Click Save to save your policy.
26Configuring Monitor Settings
BM
C P
roac
tive
Net
Per
form
ance
Man
age
men
t -
HP
EV
A S
tora
ge M
onit
orin
g V
ersi
on 1
.3.0
0
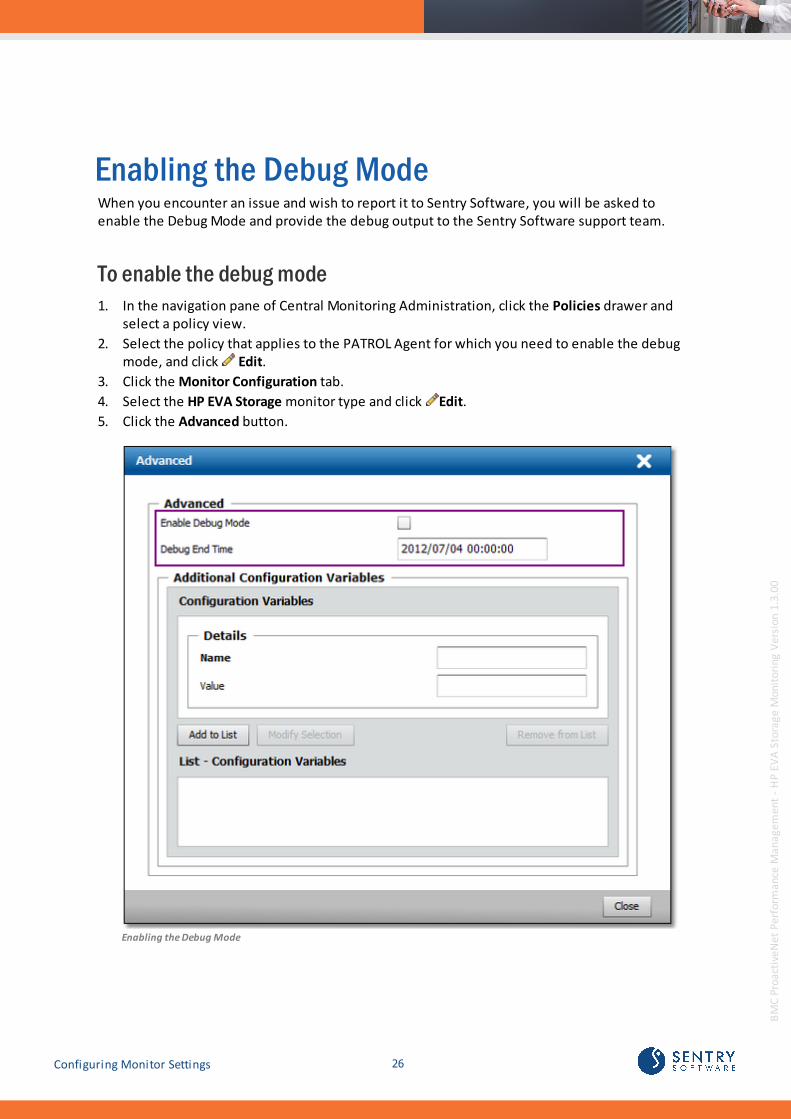
Enabling the Debug ModeWhen you encounter an issue and wish to report it to Sentry Software, you will be asked toenable the Debug Mode and provide the debug output to the Sentry Software support team.
To enable the debug mode1. In the navigation pane of Central Monitoring Administration, click the Policies drawer and
select a policy view.
2. Select the policy that applies to the PATROL Agent for which you need to enable the debugmode, and click Edit.
3. Click the Monitor Configuration tab.
4. Select the HP EVA Storage monitor type and click Edit.
5. Click the Advanced button.
Enabling the Debug Mode
27 Configuring Monitor Settings
BM
C P
roac
tive
Net
Per
form
ance
Man
age
men
t -
HP
EV
A S
tora
ge M
onit
orin
g V
ersi
on 1
.3.0
0
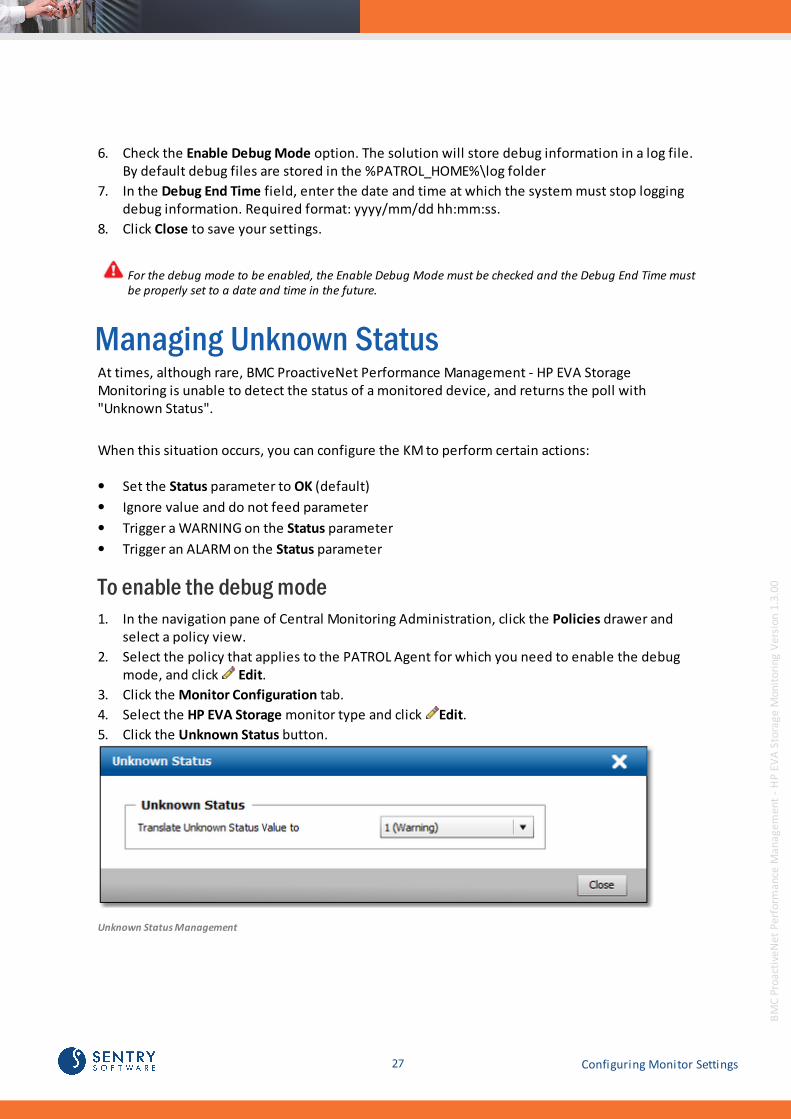
6. Check the Enable Debug Mode option. The solution will store debug information in a log file.By default debug files are stored in the %PATROL_HOME%\log folder
7. In the Debug End Time field, enter the date and time at which the system must stop loggingdebug information. Required format: yyyy/mm/dd hh:mm:ss.
8. Click Close to save your settings.
For the debug mode to be enabled, the Enable Debug Mode must be checked and the Debug End Time mustbe properly set to a date and time in the future.
Managing Unknown StatusAt times, although rare, BMC ProactiveNet Performance Management - HP EVA StorageMonitoring is unable to detect the status of a monitored device, and returns the poll with"Unknown Status".
When this situation occurs, you can configure the KM to perform certain actions:
Set the Status parameter to OK (default)
Ignore value and do not feed parameter
Trigger a WARNING on the Status parameter
Trigger an ALARM on the Status parameter
To enable the debug mode1. In the navigation pane of Central Monitoring Administration, click the Policies drawer and
select a policy view.
2. Select the policy that applies to the PATROL Agent for which you need to enable the debugmode, and click Edit.
3. Click the Monitor Configuration tab.
4. Select the HP EVA Storage monitor type and click Edit.
5. Click the Unknown Status button.
Unknown Status Management

28Adding Tags to PATROL Agents
BM
C P
roac
tive
Net
Per
form
ance
Man
age
men
t -
HP
EV
A S
tora
ge M
onit
orin
g V
ersi
on 1
.3.0
0
Adding Tags to PATROL AgentsTags must be set for all your PATROL Agents when creating a policy. If you have not alreadyassigned tags in the deployable install packages you created, you can still manually add them toyour policy.
1. In the Navigation pane of Central Monitoring Administration, click Policies and expand theMonitoring policy type.
2. Select a policy view (e.g. All).
3. Click Add to create a new policy or select an existing policy and click Edit to display theMonitoring Policy Configuration dialog box.
4. Check the Agent Configuration box.
5. Click the Agent Configuration link to go straight to the Agent Configuration page.
Under Agent Properties, enter the tags that you want to assign to the BMC PATROL Agent. The format of each tag is tagName:tagDescription where tagName must be replaced by the nameof the tag (e.g. sentryTag). You can also provide multiple tags, separated by commas.
If the tag description contains spaces, enclose the description within double quotes. For example,tag1:"Brief Description",tag2:"Description"

29 Adding Tags to PATROL Agents
BM
C P
roac
tive
Net
Per
form
ance
Man
age
men
t -
HP
EV
A S
tora
ge M
onit
orin
g V
ersi
on 1
.3.0
0
7. Click Finish to validate your changes.
In the Agent Selection page, you will then be able to configure conditions to select BMC PATROLAgents based on the Agent Tag property that you have previously added.

Configuring Thresholds
31
BM
C P
roac
tive
Net
Per
form
ance
Man
age
men
t -
HP
EV
A S
tora
ge M
onit
orin
g V
ersi
on 1
.3.0
0
When you are creating or editing a policy, you can add and configure monitor thresholds. The Add Thresholds dialog box presents threshold configuration fields for BMC ProactiveNetmonitors that are configured through Central Monitoring Administration.
For details about baselines and Key Performance Indicators (KPI), see BMC ProactiveNet CentralMonitoring Administration or BMC ProactiveNet documentation or refer to the ManagingBaselines and Key Perf ormance Indicators section. For details about the monitored attributes,refer to the specific monitor type in the Ref erence Guide section.
Before you begin
Ensure that your monitor configuration is complete before thresholds are applied. Thresholdscannot be applied to monitors that are not configured through Central MonitoringAdministration. If you have not done so already, please refer to the section Configuring MonitorSettings.
Recommended Thresholds
Thresholds define acceptable high and/or low values for the data collected. Thresholds can becreated as part of a policy that can be applied to multiple monitor types on multiple BMC PATROLAgents. The Ref erence Guide provides a list of monitor types with their respective attributes and, whenmeaningful, a recommended threshold.
Configuring Monitor ThresholdsTo configure monitor thresholds:
1. Create a new policy or edit an existing one.
2. Select the Threshold Configuration tab and click Add .
3. In the Add Thresholds dialog box, select the relevant Solution, Version, and Monitor Type.
4. In the Instance Name field, specify the instance to which the threshold configuration will beapplied. You can either use a string or the following regular expression patterns: ?, +, *, ( ), |,[ ], { }, ,̂ $,
5. Select Match Device Name if you want the entire <deviceName>\<instanceName> string tobe considered.
6. From the Attribute list, select a monitor attribute.
7. In the Threshold section:
Select the threshold type.
Set the threshold parameters values.
Click Add.
32Configuring Monitor Thresholds
BM
C P
roac
tive
Net
Per
form
ance
Man
age
men
t -
HP
EV
A S
tora
ge M
onit
orin
g V
ersi
on 1
.3.0
0
8. Resume the procedure to configure all the monitor thresholds required.
9. Click Close. The configuration details are displayed in the table on the ThresholdConfiguration tab.
10. Click Save at the bottom of the Add Policy dialog box, or Update at the bottom of the EditPolicy dialog box.
After you save or update the policy, new threshold configurations are pushed to BMC PATROLAgents with matching Central Monitoring Configuration tags.
Editing a Threshold ConfigurationTo edit a threshold configuration:
1. Edit an existing policy
2. On the Threshold Configuration tab, select a threshold definition, and click Edit.
3. Edit the configuration values and click Update.
4. When you finish editing the threshold configuration, click Close.
5. To save changes to the policy, click Update at the bottom of the Edit Policy dialog box.
After you update the policy, updated threshold configurations are pushed to BMC PATROL Agentswith matching Central Monitoring Configuration tags.
Deleting a Threshold ConfigurationTo delete a threshold configuration:
1. Edit an existing policy
2. On the Threshold Configuration tab, select attributes, monitor types, versions, or solutions.
3. Click Delete.
4. After you delete one or more threshold configurations, click Close.
5. To save changes to the policy, click Update at the bottom of the Edit Policy dialog box.
After you update the policy, deleted threshold configurations are removed from BMC PATROLAgents with matching Central Monitoring Configuration tags.

Monitoring your StorageEnvironment
34Detecting High Processor Utilization
BM
C P
roac
tive
Net
Per
form
ance
Man
age
men
t -
HP
EV
A S
tora
ge M
onit
orin
g V
ersi
on 1
.3.0
0
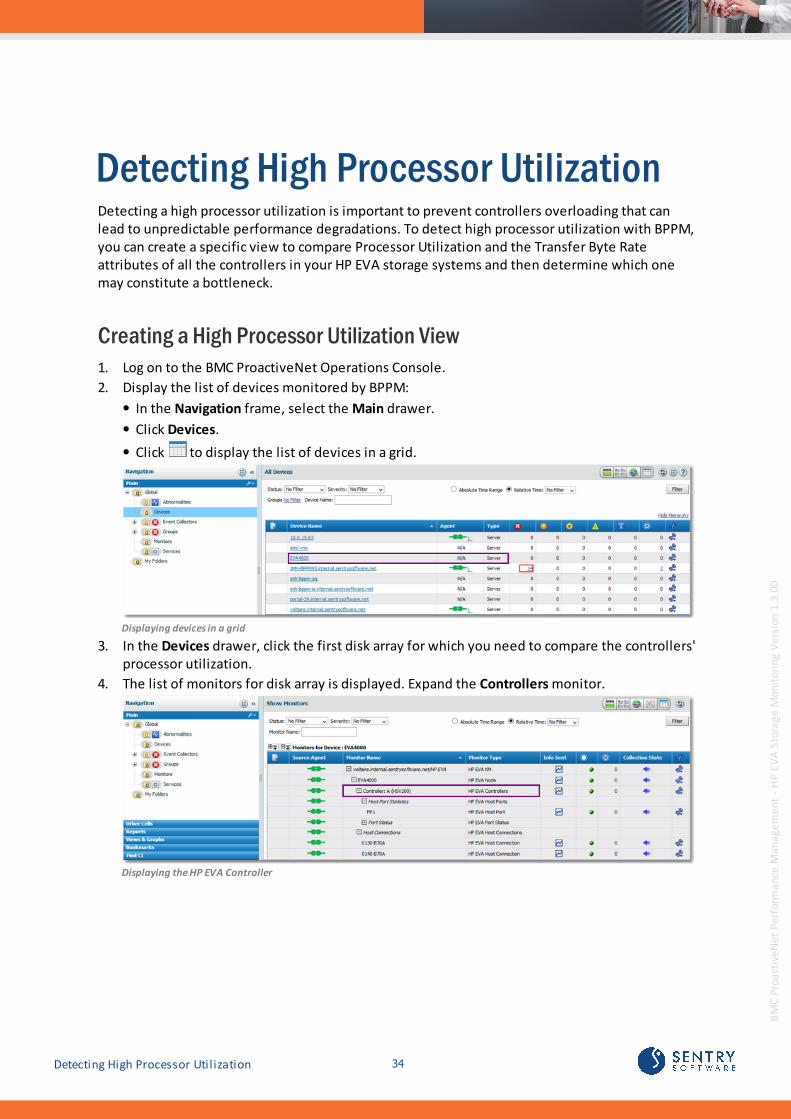
Detecting High Processor UtilizationDetecting a high processor utilization is important to prevent controllers overloading that canlead to unpredictable performance degradations. To detect high processor utilization with BPPM,you can create a specific view to compare Processor Utilization and the Transfer Byte Rateattributes of all the controllers in your HP EVA storage systems and then determine which onemay constitute a bottleneck.
Creating a High Processor Utilization View1. Log on to the BMC ProactiveNet Operations Console.
2. Display the list of devices monitored by BPPM:
In the Navigation frame, select the Main drawer.
Click Devices.
Click to display the list of devices in a grid.
Displaying devices in a grid
3. In the Devices drawer, click the first disk array for which you need to compare the controllers'processor utilization.
4. The list of monitors for disk array is displayed. Expand the Controllers monitor.
Displaying the HP EVA Controller

35 Detecting High Processor Utilization
BM
C P
roac
tive
Net
Per
form
ance
Man
age
men
t -
HP
EV
A S
tora
ge M
onit
orin
g V
ersi
on 1
.3.0
0
5. Click for the first controller.
6. By default, the Processor Utilization attributes is displayed. Keep this selection and clickGenerate Graph(s).
7. Add the graph to the view. Click . The following pop-up is displayed:
Adding a Graph to View
8. Create the view to which you want to add the graph to
Naming a View
9. In the View Title field, type the name of the view (High Processor Utilization) and click AddView. The View created successfully message appears. Click Close.
10. The High Processor Utilization view is now created and available under the Views & Graphsdrawer in the Navigation pane.
11. Repeat the procedure to add to this view the Processor Utilization attributes of all thecontrollers in your HP EVA disk array.
Once all graphs are stored in the view, it becomes easy to compare the controllers' respective Processor Utilization and Transfer Byte Rates. Ensure that the Processor Utilization is lower than80%. A processor utilization over 80% means that this controller is overloaded and that itconstitutes a bottleneck for the storage system.
Verify the Transfer Byte Rate of your controllers. If the value of this attribute stays low – whilethe overall processor utilization is high – it indicates that the node is performing "nonproductive" tasks. It then may become critical to determine the source of activity that generates
36Detecting High Processor Utilization
BM
C P
roac
tive
Net
Per
form
ance
Man
age
men
t -
HP
EV
A S
tora
ge M
onit
orin
g V
ersi
on 1
.3.0
0
the high processor utilization.
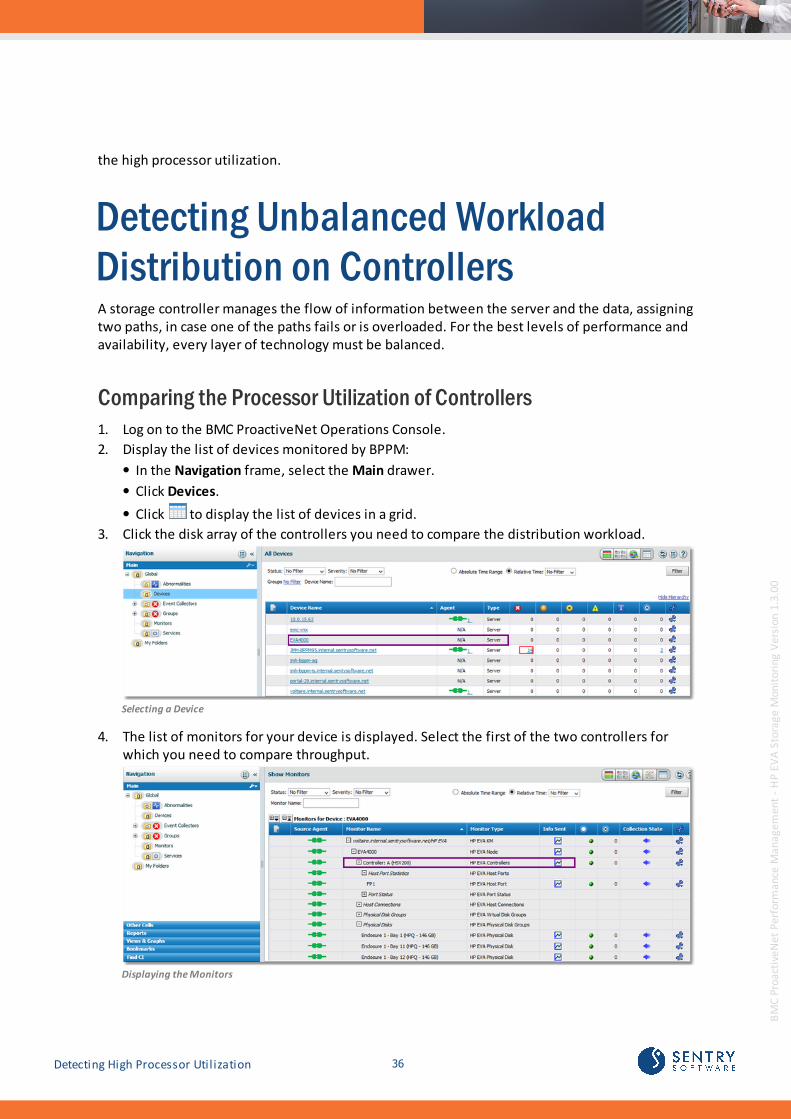
Detecting Unbalanced WorkloadDistribution on ControllersA storage controller manages the flow of information between the server and the data, assigningtwo paths, in case one of the paths fails or is overloaded. For the best levels of performance andavailability, every layer of technology must be balanced.
Comparing the Processor Utilization of Controllers1. Log on to the BMC ProactiveNet Operations Console.
2. Display the list of devices monitored by BPPM:
In the Navigation frame, select the Main drawer.
Click Devices.
Click to display the list of devices in a grid.
3. Click the disk array of the controllers you need to compare the distribution workload.
Selecting a Device
4. The list of monitors for your device is displayed. Select the first of the two controllers forwhich you need to compare throughput.
Displaying the Monitors

37 Detecting Unbalanced Workload Distribution onControllers
BM
C P
roac
tive
Net
Per
form
ance
Man
age
men
t -
HP
EV
A S
tora
ge M
onit
orin
g V
ersi
on 1
.3.0
0
5. Click for the chosen controller.
6. By default, the Processor Utilization attribute is displayed. Keep this selection, and clickGenerate Graph(s)
7. Add the graph to the view:
Click . The following pop-up is displayed:
Adding a Graph to View - Step 1
Click Add to View.
Adding a Graph to View - Step 2
In the View Title field, type the name of the view (Controllers Workload Balance) and clickAdd View. The View created successfully message appears. Click Close.
8. The Controllers Workload Balance view is now created and available under the Views &Graphs drawer in the Navigation pane.
9. Create a graph for the second controller and add it to the Controllers Workload Balance view.You are then able to easily compare the values of both controllers to evaluate the workloaddistribution.
For example, if the throughput on one controller is significantly higher than the other one, itindicates that one on the controllers may constitute a bottleneck for the subsystem that could bealleviated by better sharing the load between the controllers.It is recommended to pay close attention to which logical drive is handled by which controller,depending on the activity of this logical drives to be able to reallocates controller to drive I/O
38Detecting Unbalanced Workload Distribution onControllers
BM
C P
roac
tive
Net
Per
form
ance
Man
age
men
t -
HP
EV
A S
tora
ge M
onit
orin
g V
ersi
on 1
.3.0
0
activity so that neither controller is overloaded.
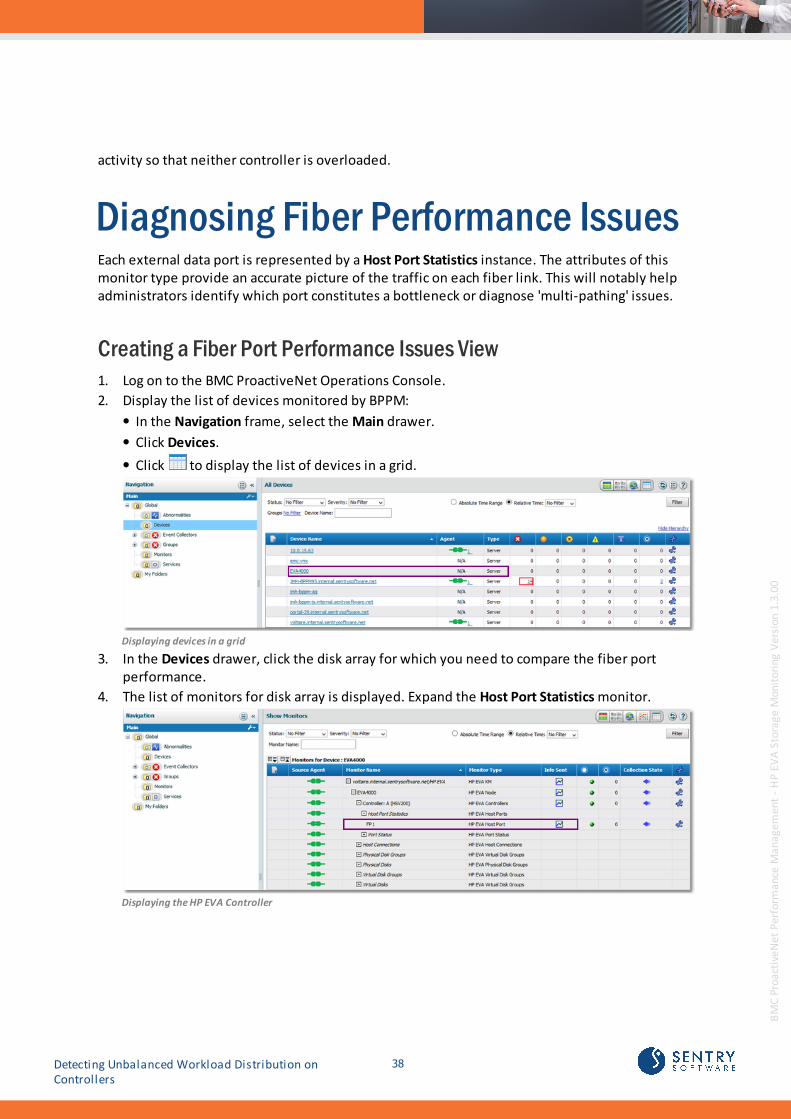
Diagnosing Fiber Performance IssuesEach external data port is represented by a Host Port Statistics instance. The attributes of thismonitor type provide an accurate picture of the traffic on each fiber link. This will notably helpadministrators identify which port constitutes a bottleneck or diagnose 'multi-pathing' issues.
Creating a Fiber Port Performance Issues View1. Log on to the BMC ProactiveNet Operations Console.
2. Display the list of devices monitored by BPPM:
In the Navigation frame, select the Main drawer.
Click Devices.
Click to display the list of devices in a grid.
Displaying devices in a grid
3. In the Devices drawer, click the disk array for which you need to compare the fiber portperformance.
4. The list of monitors for disk array is displayed. Expand the Host Port Statistics monitor.
Displaying the HP EVA Controller

39 Diagnosing Fiber Performance Issues
BM
C P
roac
tive
Net
Per
form
ance
Man
age
men
t -
HP
EV
A S
tora
ge M
onit
orin
g V
ersi
on 1
.3.0
0
5. Click for the chosen fiber port.
6. By default, the Read Byte Rate and Write Byte Rate attributes are displayed. Keep thisselection and click Generate Graph(s).
7. Add the graph to the view. Click . The following pop-up is displayed:
Adding a Graph to View
8. Create the view to which you want to add the graph to
Naming a View
9. In the View Title field, type the name of the view (HP EVA Fiber Port Performance Issue) andclick Add View. The View created successfully message appears. Click Close.
10. The HP EVA Fiber Port Performance Issue view is now created and available under the Views& Graphs drawer in the Navigation pane.
Diagnosing a Bad Disk LayoutA non-optimal physical disk layout can cause one single physical disk to become the bottleneckof a SAN. To verify that the I/Os are well-balanced across all physical disks you can check the Read Byte Rate and Write Byte Rate parameters of each physical disk and make sure they havesimilar average values.
40Diagnosing a Bad Disk Layout
BM
C P
roac
tive
Net
Per
form
ance
Man
age
men
t -
HP
EV
A S
tora
ge M
onit
orin
g V
ersi
on 1
.3.0
0
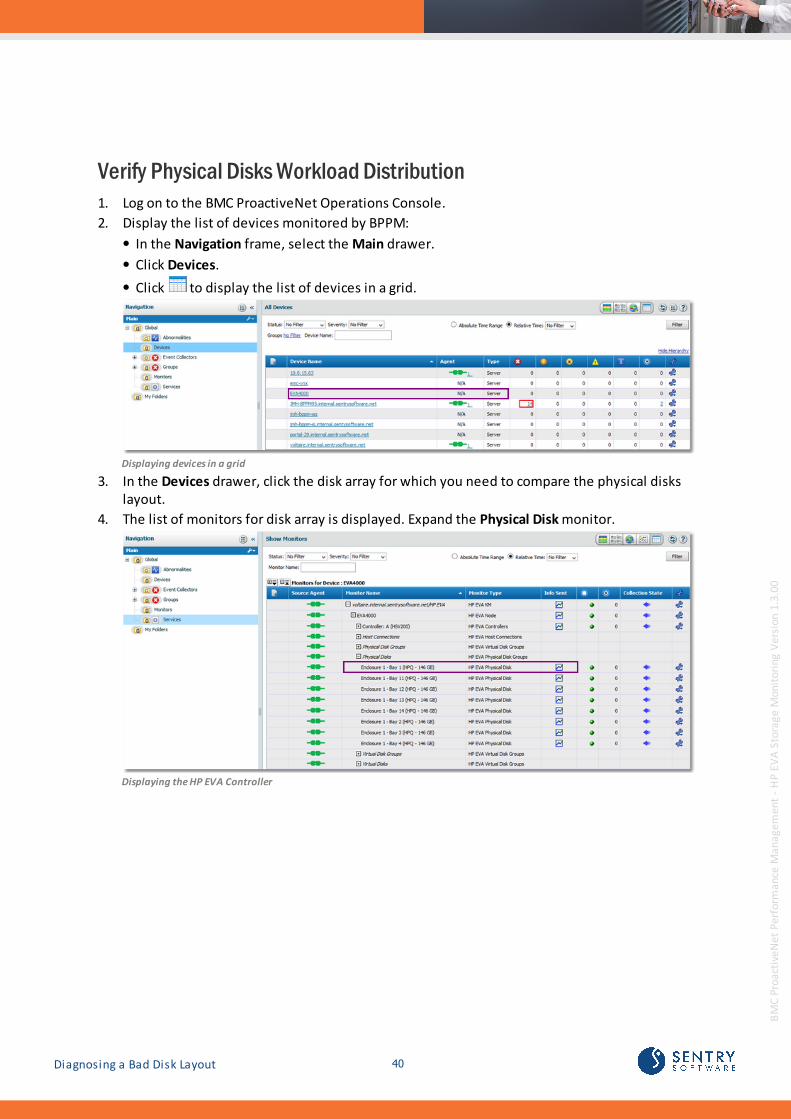
Verify Physical Disks Workload Distribution1. Log on to the BMC ProactiveNet Operations Console.
2. Display the list of devices monitored by BPPM:
In the Navigation frame, select the Main drawer.
Click Devices.
Click to display the list of devices in a grid.
Displaying devices in a grid
3. In the Devices drawer, click the disk array for which you need to compare the physical diskslayout.
4. The list of monitors for disk array is displayed. Expand the Physical Disk monitor.
Displaying the HP EVA Controller

41 Diagnosing a Bad Disk Layout
BM
C P
roac
tive
Net
Per
form
ance
Man
age
men
t -
HP
EV
A S
tora
ge M
onit
orin
g V
ersi
on 1
.3.0
0
5. Click for the first physical disk.
6. By default, the Read Byte Rate and the Write Byte Rate attributes are displayed. Uncheck theRead Byte Rate attribute but make sure that the Write Byte Rate attributes remains selected.
Selecting Attributes
7. Click Generate Graph(s).

42Diagnosing a Bad Disk Layout
BM
C P
roac
tive
Net
Per
form
ance
Man
age
men
t -
HP
EV
A S
tora
ge M
onit
orin
g V
ersi
on 1
.3.0
0
8. Add the graph to the view. Click . The following pop-up is displayed:
Adding a Graph to View
9. Create the view to which you want to add the graph to
Naming a View
10. In the View Title field, type the name of the view (Physical Disks Workload Distribution) andclick Add View. The View created successfully message appears. Click Close.
11. The Physical Disks Workload Distribution view is now created and available under the Views& Graphs drawer in the Navigation pane.
12. Repeat the procedure to add to this view the Write Byte Rate attributes of all the physicaldisks in your HP EVA disk array.

Reference Guide

44
BM
C P
roac
tive
Net
Per
form
ance
Man
age
men
t -
HP
EV
A S
tora
ge M
onit
orin
g V
ersi
on 1
.3.0
0
This chapter provides statistical information about resources, operating status, and performancesmanaged by the BMC ProactiveNet Performance Management - HP EVA Storage Monitoring. Itcontains tables describing the attributes used in the KM, grouped by Monitor Types, and providesa brief description of each attribute and its default settings.
Monitor Types
HP EVA Controllers
HP EVA Data Replication Tunnel
HP EVA Host Connection
HP EVA Host Port
HP EVA KM
HP EVA Node
HP EVA Physical Disk Group
HP EVA Physical Disk
HP EVA Port Status
HP EVA Virtual Disk Group
HP EVA Virtual Disk

45
BM
C P
roac
tive
Net
Per
form
ance
Man
age
men
t -
HP
EV
A S
tora
ge M
onit
orin
g V
ersi
on 1
.3.0
0
HP EVA ControllersAttributes
Name Description Unit Default AlertConditions
BMCProactiveNetAttributeType
Processor Utilization* Utilization of the processor. Percentage(%)
Warning ≥ 50 %Alarm ≥ 90 %(After 5consecutiveoccurrences)
Statistics
Status Status of the controller. {0= OK; 1 =Degraded;2= Failed}
Warning = 1Alarm = 2
Availability
Transfer ProcessorUtilization*
Amount of processor timespecifically spent on actualtransfer operations.
Percentage(%)
None Statistics
For detailed information about KPI, see Managing Baselines and Key Performance Indicators.
* Attributes marked with an asterisk are used by default when visualizing the corresponding monitor instance inBPPM
HP EVA Data Replication TunnelAttributes
Name Description Unit DefaultAlertConditions
BMCProactiveNetAttributeType
Copy In Byte Rate Rate at which data is copied to an array topopulate the members of a DR group withdata when an initial copy or full copy isrequested.
Megabytes perseconds(MB/s)
None Statistics
Copy Out Byte Rate Rate at which data is copied from an array topopulate the members of a DR group withdata when an initial copy or full copy isrequested.
Megabytes perseconds(MB/s)
None Statistics
Copy Retries Byte Rate Copy actions that had to be retransmittedduring the sample interval in response to afailed copy transaction.
Retries/s
None Statistics

46HP EVA Data Replication Tunnel
BM
C P
roac
tive
Net
Per
form
ance
Man
age
men
t -
HP
EV
A S
tora
ge M
onit
orin
g V
ersi
on 1
.3.0
0
Name Description Unit DefaultAlertConditions
BMCProactiveNetAttributeType
Free Command Resources Minimum number of free resources availablefor DR command operations.
Resources
None Statistics
Free Copy Resources Minimum number of free resources availablefor DR copy operations.
Resources
None Statistics
Free Write Resources Minimum number of free resources availablefor DR write operations.
Resources
None Statistics
Round Trip Delay Average time in milliseconds during themeasurement interval for a signal (ping) totravel from source to destination and backagain.
Milliseconds(ms)
None Response Time
Write In Byte Rate* Rate at which data is written to an array. Megabytes perseconds(MB/s)
None Statistics
Write Out Byte Rate* Rate at which data is written from an array. Megabytes perseconds(MB/s)
None Statistics
Write Retries Byte Rate Write actions that had to be retransmittedduring the sample interval in response to afailed write transaction.
Retries/s
None Statistics
* Attributes marked with an asterisk are used by default when visualizing the corresponding monitor instance inBPPM
HP EVA Host ConnectionAttributes
Name Description Unit DefaultAlertConditions
BMCProactiveNetAttributeType
Busy Responses Number of busy responses sent to a specifichost during the sample interval. Busiesrepresent a request from the controller to thehost to cease I/O traffic until some internaljob queue is reduced.
Responses
None Statistics
Request Queue* Average number of outstanding requests fromeach of the corresponding host adapters.
Requests
None Statistics
47 HP EVA Host Connection
BM
C P
roac
tive
Net
Per
form
ance
Man
age
men
t -
HP
EV
A S
tora
ge M
onit
orin
g V
ersi
on 1
.3.0
0
* Attributes marked with an asterisk are used by default when visualizing the corresponding monitor instance inBPPM
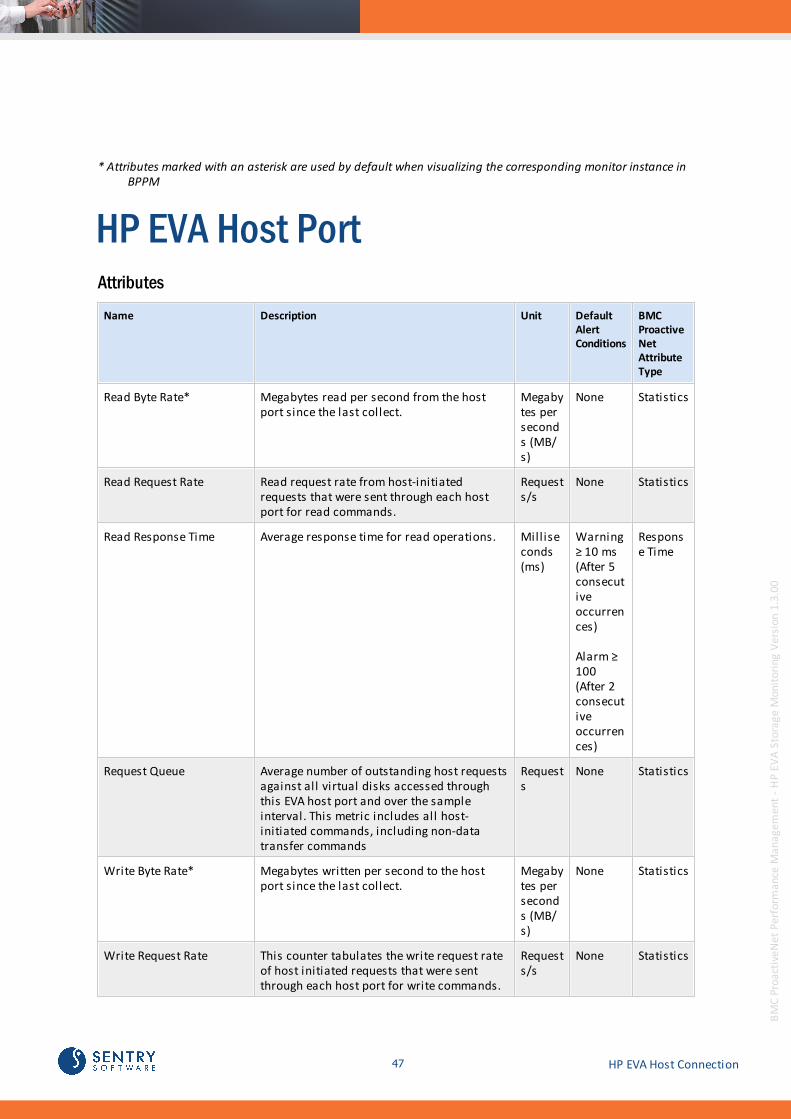
HP EVA Host PortAttributes
Name Description Unit DefaultAlertConditions
BMCProactiveNetAttributeType
Read Byte Rate* Megabytes read per second from the hostport since the last collect.
Megabytes perseconds (MB/s)
None Statistics
Read Request Rate Read request rate from host-initiatedrequests that were sent through each hostport for read commands.
Requests/s
None Statistics
Read Response Time Average response time for read operations. Milliseconds(ms)
Warning≥ 10 ms (After 5consecutiveoccurrences)
Alarm ≥100(After 2consecutiveoccurrences)
Response Time
Request Queue Average number of outstanding host requestsagainst all virtual disks accessed throughthis EVA host port and over the sampleinterval. This metric includes all host-initiated commands, including non-datatransfer commands
Requests
None Statistics
Write Byte Rate* Megabytes written per second to the hostport since the last collect.
Megabytes perseconds (MB/s)
None Statistics
Write Request Rate This counter tabulates the write request rateof host initiated requests that were sentthrough each host port for write commands.
Requests/s
None Statistics
48HP EVA Host Port
BM
C P
roac
tive
Net
Per
form
ance
Man
age
men
t -
HP
EV
A S
tora
ge M
onit
orin
g V
ersi
on 1
.3.0
0
Name Description Unit DefaultAlertConditions
BMCProactiveNetAttributeType
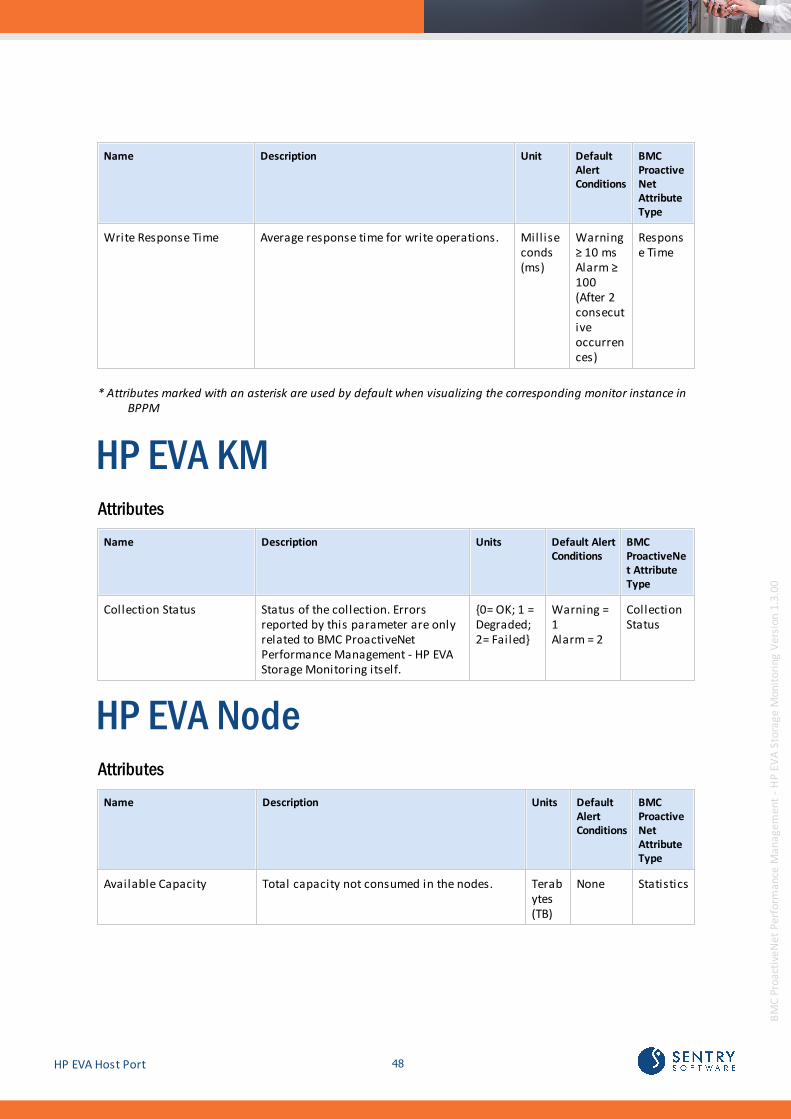
Write Response Time Average response time for write operations. Milliseconds(ms)
Warning≥ 10 ms Alarm ≥100(After 2consecutiveoccurrences)
Response Time
* Attributes marked with an asterisk are used by default when visualizing the corresponding monitor instance inBPPM
HP EVA KMAttributes
Name Description Units Default AlertConditions
BMCProactiveNet AttributeType
Collection Status Status of the collection. Errorsreported by this parameter are onlyrelated to BMC ProactiveNetPerformance Management - HP EVAStorage Monitoring itself.
{0= OK; 1 =Degraded;2= Failed}
Warning =1Alarm = 2
CollectionStatus
HP EVA NodeAttributes
Name Description Units DefaultAlertConditions
BMCProactiveNetAttributeType
Available Capacity Total capacity not consumed in the nodes. Terabytes(TB)
None Statistics
49 HP EVA Node
BM
C P
roac
tive
Net
Per
form
ance
Man
age
men
t -
HP
EV
A S
tora
ge M
onit
orin
g V
ersi
on 1
.3.0
0
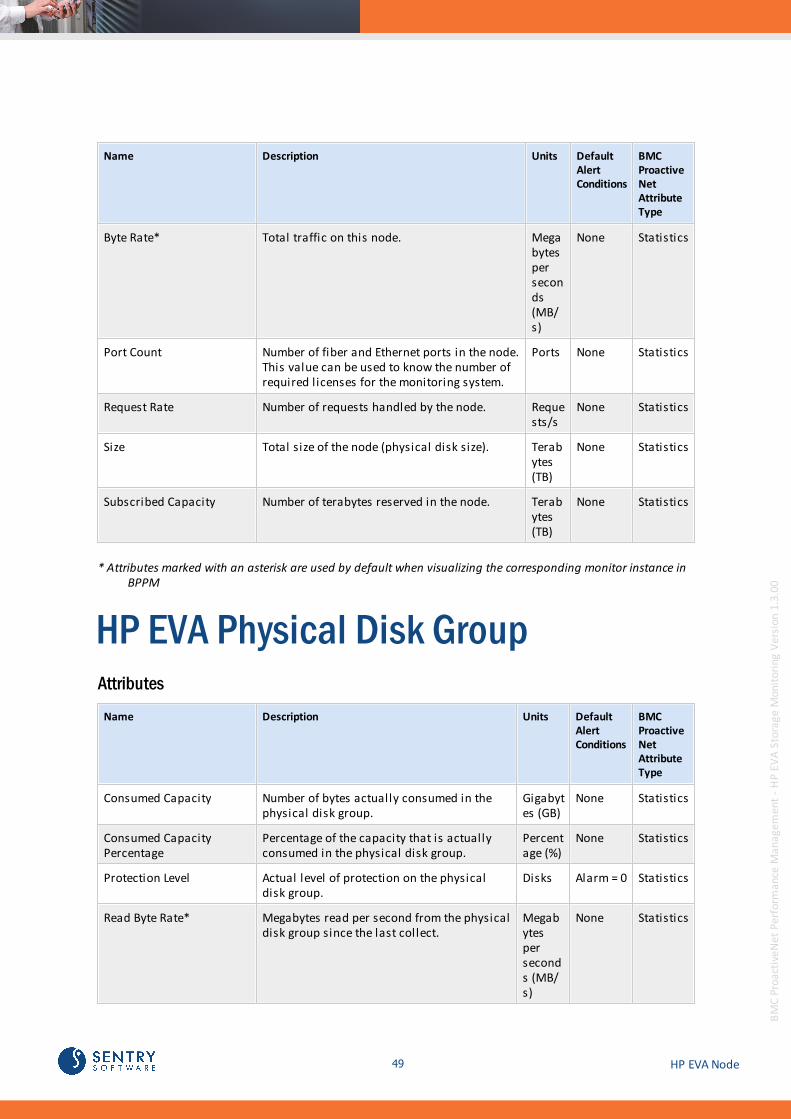
Name Description Units DefaultAlertConditions
BMCProactiveNetAttributeType
Byte Rate* Total traffic on this node. Megabytesperseconds(MB/s)
None Statistics
Port Count Number of fiber and Ethernet ports in the node.This value can be used to know the number ofrequired licenses for the monitoring system.
Ports None Statistics
Request Rate Number of requests handled by the node. Requests/s
None Statistics
Size Total size of the node (physical disk size). Terabytes(TB)
None Statistics
Subscribed Capacity Number of terabytes reserved in the node. Terabytes(TB)
None Statistics
* Attributes marked with an asterisk are used by default when visualizing the corresponding monitor instance inBPPM
HP EVA Physical Disk GroupAttributes
Name Description Units DefaultAlertConditions
BMCProactiveNetAttributeType
Consumed Capacity Number of bytes actually consumed in the physical disk group.
Gigabytes (GB)
None Statistics
Consumed CapacityPercentage
Percentage of the capacity that is actuallyconsumed in the physical disk group.
Percentage (%)
None Statistics
Protection Level Actual level of protection on the physicaldisk group.
Disks Alarm = 0 Statistics
Read Byte Rate* Megabytes read per second from the physicaldisk group since the last collect.
Megabytesperseconds (MB/s)
None Statistics

50HP EVA Physical Disk Group
BM
C P
roac
tive
Net
Per
form
ance
Man
age
men
t -
HP
EV
A S
tora
ge M
onit
orin
g V
ersi
on 1
.3.0
0
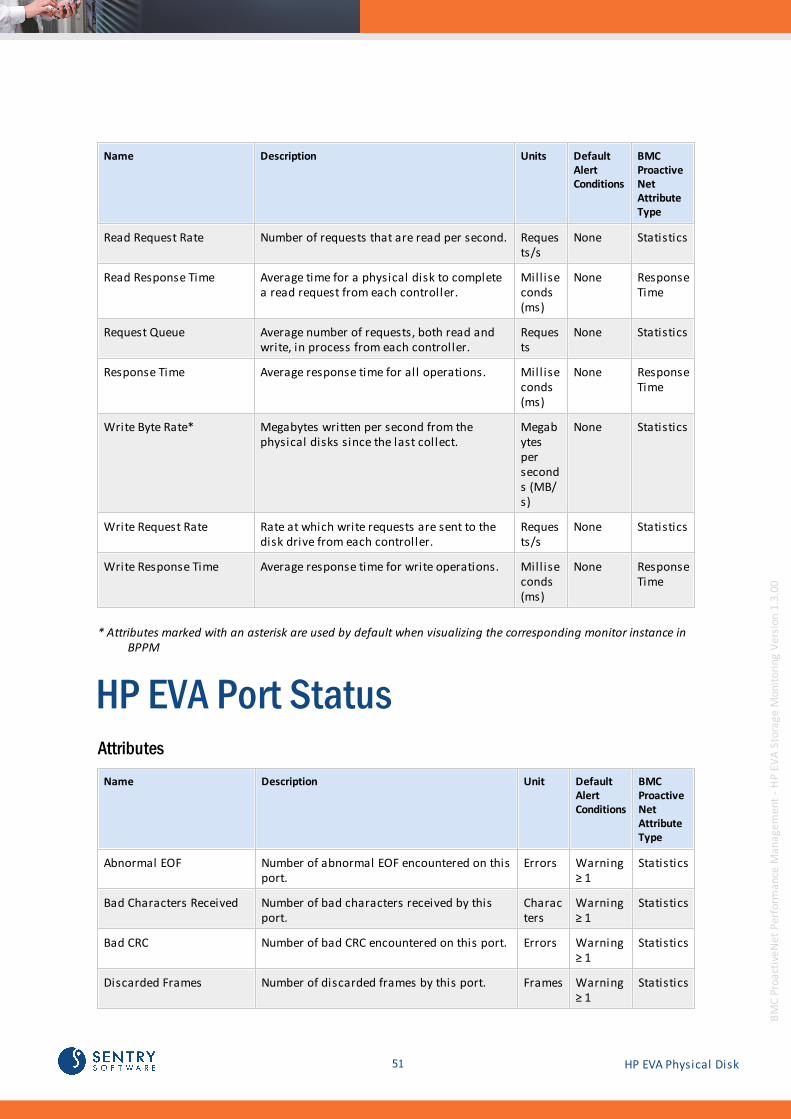
Name Description Units DefaultAlertConditions
BMCProactiveNetAttributeType
Read Request Rate Number of requests that are read perseconds.
Requests/s
None Statistics
Read Response Time Average time to complete the read requests. Milliseconds(ms)
None Response Time
Request Queue Average number of requests, both read andwrite, in process from the physical diskgroup.
Requests
None Statistics
Response Time Average response time for all operations. Milliseconds(ms)
None Response Time
Size Overall physical size of the disk group. Gigabytes (GB)
None Statistics
Write Byte Rate* Megabytes written per second from thephysical disk group since the last collect.
Megabytesperseconds (MB/s)
None Statistics
Write Request Rate Rate at which write requests are sent to thedisk drive from each controller
Requests/s
None Statistics
Write Response Time Average response time for write operations. Milliseconds(ms)
None Response Time
* Attributes marked with an asterisk are used by default when visualizing the corresponding monitor instance inBPPM
HP EVA Physical DiskAttributes
Name Description Units DefaultAlertConditions
BMCProactiveNetAttributeType
Read Byte Rate* Megabytes read per second from the physicaldisks since the last collect.
Megabytesperseconds (MB/s)
None Statistics
51 HP EVA Physical Disk
BM
C P
roac
tive
Net
Per
form
ance
Man
age
men
t -
HP
EV
A S
tora
ge M
onit
orin
g V
ersi
on 1
.3.0
0
Name Description Units DefaultAlertConditions
BMCProactiveNetAttributeType
Read Request Rate Number of requests that are read per second. Requests/s
None Statistics
Read Response Time Average time for a physical disk to completea read request from each controller.
Milliseconds(ms)
None ResponseTime
Request Queue Average number of requests, both read andwrite, in process from each controller.
Requests
None Statistics
Response Time Average response time for all operations. Milliseconds(ms)
None ResponseTime
Write Byte Rate* Megabytes written per second from thephysical disks since the last collect.
Megabytesperseconds (MB/s)
None Statistics
Write Request Rate Rate at which write requests are sent to thedisk drive from each controller.
Requests/s
None Statistics
Write Response Time Average response time for write operations. Milliseconds(ms)
None ResponseTime
* Attributes marked with an asterisk are used by default when visualizing the corresponding monitor instance inBPPM
HP EVA Port StatusAttributes
Name Description Unit DefaultAlertConditions
BMCProactiveNetAttributeType
Abnormal EOF Number of abnormal EOF encountered on thisport.
Errors Warning≥ 1
Statistics
Bad Characters Received Number of bad characters received by thisport.
Characters
Warning≥ 1
Statistics
Bad CRC Number of bad CRC encountered on this port. Errors Warning≥ 1
Statistics
Discarded Frames Number of discarded frames by this port. Frames Warning≥ 1
Statistics

52HP EVA Port Status
BM
C P
roac
tive
Net
Per
form
ance
Man
age
men
t -
HP
EV
A S
tora
ge M
onit
orin
g V
ersi
on 1
.3.0
0
Name Description Unit DefaultAlertConditions
BMCProactiveNetAttributeType
Link Failures Number of link failures encountered by thisport.
Failures
Warning≥ 1
Statistics
Loss Of Signal Number of losses of signal encountered bythis port.
Losses Warning≥ 1
Statistics
Loss Of Synch Number of losses of synchronizationencountered on this port.
Losses Warning≥ 1
Statistics
Protocol Errors Number of protocol errors encountered onthis port.
Errors Warning≥ 1
Statistics
Status* Overall status of this port. {0=Plugged;1=Unplugged}
Warning= 1
Availability
* Attributes marked with an asterisk are used by default when visualizing the corresponding monitor instance inBPPM
HP EVA Virtual Disk GroupAttributes
Name Description Units DefaultAlertConditions
BMCProactiveNetAttributeType
Cache Hit Ratio Percentage of requests that are successfullyserved by a cache.
Percentage (%)
None Statistics
Cache Read Byte Rate Amount of data read off the cache. Megabytesperseconds (MB/s)
None Statistics
Cache Read Request Rate Amount of read requests processed by thevirtual disk group.
Requests/s
None Statistics
Cache Read ResponseTime
Average time taken to complete readoperations that are served by the cache.
Milliseconds(ms)
None ResponseTime

53 HP EVA Virtual Disk Group
BM
C P
roac
tive
Net
Per
form
ance
Man
age
men
t -
HP
EV
A S
tora
ge M
onit
orin
g V
ersi
on 1
.3.0
0
Name Description Units DefaultAlertConditions
BMCProactiveNetAttributeType
Disk Read Byte Rate Amount of data read off the virtual diskgroup.
Megabytesperseconds (MB/s)
None Statistics
Disk Read Request Rate Amount of read requests processed by thevirtual disk group.
Requests/s
None Statistics
Disk Read Response Time Average time taken to complete readoperations that are served by the virtual diskgroup.
Milliseconds(ms)
None ResponseTime
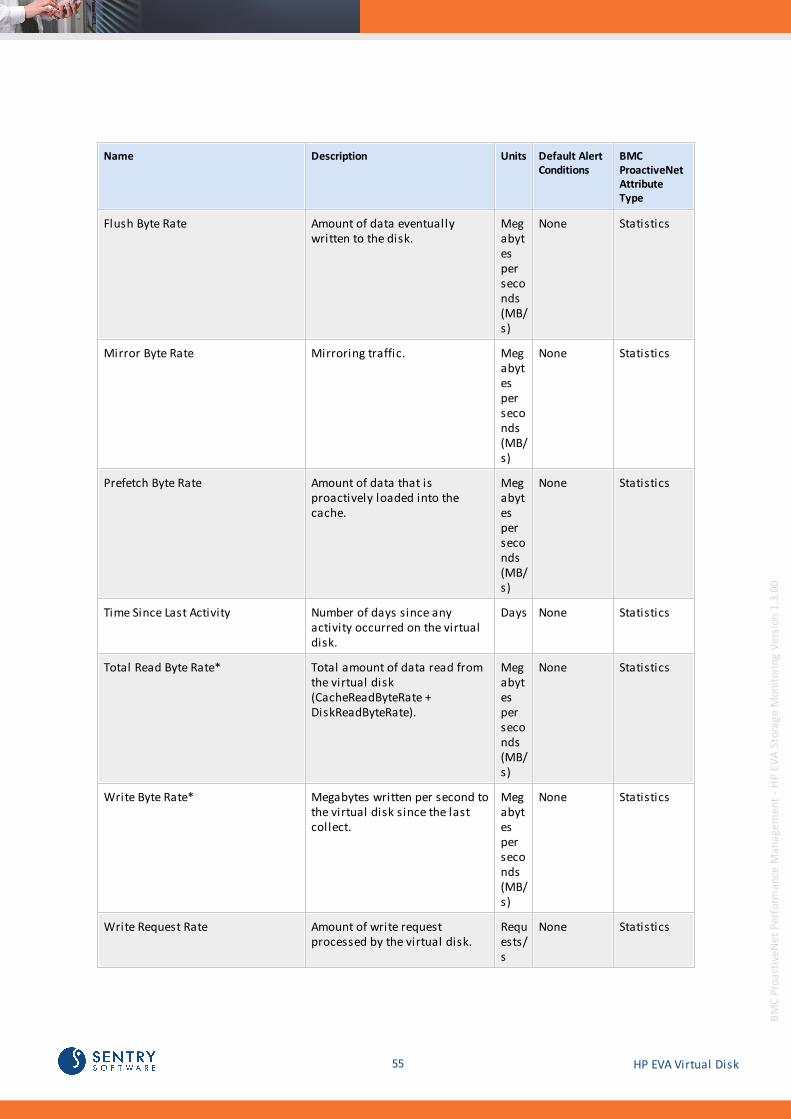
Flush Byte Rate Amount of data eventually written to thevirtual disk group.
Megabytesperseconds (MB/s)
None Statistics
Mirror Byte Rate Mirroring traffic. Megabytesperseconds (MB/s)
None Statistics
Prefetch Byte Rate Amount of data that is proactively loadedinto the cache.
Megabytesperseconds (MB/s)
None Statistics
Total Read Byte Rate* Total amount of data read from the virtualdisk group (CacheReadByteRate +DiskReadByteRate).
Megabytesperseconds (MB/s)
None Statistics
Write Byte Rate*Megabytes written per second to the virtualdisk group since the last collect.
Megabytesperseconds (MB/s)
None Statistics
Write Request Rate Amount of write request processed by thevirtual disk group.
Requests/s
None Statistics
Write Response Time* Average response time for write operations. Milliseconds(ms)
None ResponseTime

54HP EVA Virtual Disk Group
BM
C P
roac
tive
Net
Per
form
ance
Man
age
men
t -
HP
EV
A S
tora
ge M
onit
orin
g V
ersi
on 1
.3.0
0
* Attributes marked with an asterisk are used by default when visualizing the corresponding monitor instance inBPPM
HP EVA Virtual DiskAttributes
Name Description Units Default AlertConditions
BMCProactiveNetAttributeType
Cache Hit Ratio Percentage of requests that aresuccessfully served by a cache.
Percentage(%)
None Statistics
Cache Read Byte Rate Amount of data read off thecache.
Megabytesperseconds(MB/s)
None Statistics
Cache Read Request Rate Amount of read requestsprocessed by the virtual disk.
Requests/s
None Statistics
Cache Read Response Time Average time taken to completeread operations that are servedby the cache.
Milliseconds(ms)
None ResponseTime
Disk Read Byte Rate Amount of data read off the disk. Megabytesperseconds(MB/s)
None Statistics
Disk Read Request Rate Amount of read requestsprocessed by the virtual disks.
Requests/s
None Statistics
Disk Read Response Time Average time taken to completeread operations that are servedby the disk.
Milliseconds(ms)
None ResponseTime
55 HP EVA Virtual Disk
BM
C P
roac
tive
Net
Per
form
ance
Man
age
men
t -
HP
EV
A S
tora
ge M
onit
orin
g V
ersi
on 1
.3.0
0
Name Description Units Default AlertConditions
BMCProactiveNetAttributeType
Flush Byte Rate Amount of data eventuallywritten to the disk.
Megabytesperseconds(MB/s)
None Statistics
Mirror Byte Rate Mirroring traffic. Megabytesperseconds(MB/s)
None Statistics
Prefetch Byte Rate Amount of data that isproactively loaded into thecache.
Megabytesperseconds(MB/s)
None Statistics
Time Since Last Activity Number of days since anyactivity occurred on the virtualdisk.
Days None Statistics
Total Read Byte Rate* Total amount of data read fromthe virtual disk(CacheReadByteRate +DiskReadByteRate).
Megabytesperseconds(MB/s)
None Statistics
Write Byte Rate* Megabytes written per second tothe virtual disk since the lastcollect.
Megabytesperseconds(MB/s)
None Statistics
Write Request Rate Amount of write requestprocessed by the virtual disk.
Requests/s
None Statistics

56HP EVA Virtual Disk
BM
C P
roac
tive
Net
Per
form
ance
Man
age
men
t -
HP
EV
A S
tora
ge M
onit
orin
g V
ersi
on 1
.3.0
0
Name Description Units Default AlertConditions
BMCProactiveNetAttributeType
Write Response Time Average response time for writeoperations.
Milliseconds(ms)
None ResponseTime
* Attributes marked with an asterisk are used by default when visualizing the corresponding monitor instance inBPPM

57
BM
C P
roac
tive
Net
Per
form
ance
Man
age
men
t -
HP
EV
A S
tora
ge M
onit
orin
g V
ersi
on 1
.3.0
0
Index
- A -Attributes
Abnormal EOF 51
Available Capacity 48
Bad Characters Received 51
Bad CRC 51
Busy Responses 46
Byte Rate 48
Cache Hit Ratio 52, 54
Cache Read Byte Rate 52, 54
Cache Read Request Rate 52, 54
Cache Read Response Time 52, 54
Collection Status 48
Consumed Capacity 49
Consumed Capacity Percentage 49
Copy In Byte Rate 45
Copy Out Byte Rate 45
Copy Retries Byte Rate 45
Discarded Frames 51
Disk Read Byte Rate 52, 54
Disk Read Request Rate 52, 54
Disk Read Response Time 52, 54
Flush Byte Rate 52, 54
Free Command Resources 45
Free Copy Resources 45
Free Write Resources 45
Link Failures 51
Loss Of Signal 51
Loss Of Synch 51
Mirror Byte Rate 52, 54
Port Count 48
Prefetch Byte Rate 52, 54
Processor Utilization 45
Protection Level 49
Protocol Errors 51
Read Byte Rate 47, 49, 50
Read Request Rate 47, 49, 50
Read Response Time 47, 49, 50
Reference Guide 44
Request Queue 46, 47, 49, 50
Request Rate 48
Response Time 49, 50
Round Trip Delay 45
Size 48, 49
Status 45, 51
Subscribed Capacity 48
Time Since Last Activity 54
Total Read Byte Rate 52, 54
Transfer Processor Utilization 45
Write Byte Rate 47, 49, 50, 52, 54
Write In Byte Rate 45
Write Out Byte Rate 45
Write Request Rate 47, 49, 50, 52, 54
Write Response Time 47, 49, 50, 52, 54
Write Retries Byte Rate 45
- B -Bad Disk Layout 39
Business Value 10
- C -Component Installation package
creating 15
downloading 16Configuring
monitor settings 22Configuring Monitor Thresholds 31
Configuring thresholds 31
- D -Debug Mode
enabling 26Deleting a Threshold Configuration 32
Disable
Virtual Disks Monitoring 22Discovery Interval 22
Downloading 16
- E -Editing a Threshold Configuration 32
Exclude Volumes 22
- F -Features 9

58
BM
C P
roac
tive
Net
Per
form
ance
Man
age
men
t -
HP
EV
A S
tora
ge M
onit
orin
g V
ersi
on 1
.3.0
0
Fiber Performance Issues 38
- G -Goals 9
- H -High Processor Utilization 34
HP Command View EVA 12
HP StorageWorks 12
- I -Importing the Monitoring Solution 14
Installation
configuring 20Installing 16
Installing the Monitoring Solution 14
- J -Java 12
- K -Keep Only Volumes 22
Key Concepts 9
- M -Managing Unknown Status 27
Monitor Settings
configuring 22Monitor thresholds 31
Monitor Types
HP EVA Controllers 45
HP EVA Data Replication Tunnel 45
HP EVA Host Connection 46
HP EVA Host Port 47
HP EVA KM 48
HP EVA Node 48
HP EVA Physical Disk 50
HP EVA Physical Disk Group 49
HP EVA Port Status 51
HP EVA Virtual Disk 54
HP EVA Virtual Disk Group 52
Reference Guide 44
- P -Package 15, 16
Policies
Manage 21Polling Interval 22
Prerequisites 12
- R -Reference Guide
Attributes 44
Monitor types 44
- S -SSSU.EXE 12
Supported Platforms 10
- T -Thresholds 31
- U -Unbalanced Workload Distribution 36
Unknown Status 27
- V -Volumes
exclude 22
keep only 22

About Sentry Software™Sentry Software, a strategic Technology Alliance Partner of BMC Software, providescomprehensive multi-platform monitoring solutions that enable management of thehardware and software aspects of all servers and SANs and covering up to 100 % ofcustom applications within the BMC ProactiveNet Performance Managementenvironment. Sentry Software also develops adapters for BMC Atrium Orchestrator thatenables IT administrators to automate the execution of common requests and tasks thatoccur in the daily course of IT operations. Combined with BMC’s servers and networkautomation tools, the adapters allow IT administrators to implement provisioning anddecommissioning workflows that cover all layers of their IT infrastructure. Finally, SentrySoftware designs connectors that bring storage capacity metrics into BMC TrueSightCapacity Optimization to ensure IT administrators that their storage infrastructure isproperly sized for their current and future needs.
Like us on Facebook:facebook.com/sentrysoftware
Follow us on Twitter:
twitter.com/sentrysoftware
LEARN MORE
To learn more about our solutions, please visit :www.sentrysoftware.com/solutions
© BMC Software, Inc. All rights reserved.
ABOUT MARKETZONE DIRECT PRODUCTS
The BMC MarketZone Directprogram sells and supportsthird-party products thatcomplement and/or augment BMCsolutions. MarketZone Directproducts are available under BMClicense and support terms.
About BMC Software™BMC Software helps leading companies around the world put technology at the forefrontof business transformation, improving the delivery and consumption of digital services.From mainframe to cloud to mobile, BMC delivers innovative IT management solutionsthat have enabled more than 20,000 customers to leverage complex technology intoextraordinary business performance—increasing their agility and exceeding anythingthey previously thought possible. For more information about BMC Software, visit
www.bmc.com.
Bus ines s thrives when IT runs s marter,fas ter and s tronger. That’s why the mos tdemanding IT organizations in the worldrely on BMC Software acros s dis tributed,mainframe, virtual and cloudenvironments . Recognized as the leader inBus ines s Service Management, BMC offersa comprehens ive approach and unifiedplatform that helps IT organizations cutcos t , reduce ris k and drive bus ines sprofit . For the four fis cal quarters endedSeptember 30,2011, BMC revenue wasapproximately $2.2 billion.
BUSINESS RUNS ON I.T .
I.T . RUNS ON BMC SOFT WARE