BMC Bioinformatics BioMed Central · Human Immunodeficiency Virus HIV-1 plays a critical role in...
14
BioMed Central Page 1 of 14 (page number not for citation purposes) BMC Bioinformatics Open Access Research Pairwise and higher-order correlations among drug-resistance mutations in HIV-1 subtype B protease Omar Haq 1 , Ronald M Levy* 1,2 , Alexandre V Morozov* 1,3 and Michael Andrec 1,2 Address: 1 BioMaPS Institute for Quantitative Biology, Rutgers, the State University of New Jersey, 610 Taylor Road, Piscataway NJ 08854, USA, 2 Department of Chemistry and Chemical Biology, Rutgers, the State University of New Jersey, 610 Taylor Road, Piscataway NJ 08854, USA and 3 Department of Physics and Astronomy, Rutgers, the State University of New Jersey, 136 Frelinghuysen Road, Piscataway NJ 08854, USA Email: Omar Haq - [email protected]; Ronald M Levy* - [email protected]; Alexandre V Morozov* - [email protected]; Michael Andrec - [email protected] * Corresponding authors Abstract Background: The reaction of HIV protease to inhibitor therapy is characterized by the emergence of complex mutational patterns which confer drug resistance. The response of HIV protease to drugs often involves both primary mutations that directly inhibit the action of the drug, and a host of accessory resistance mutations that may occur far from the active site but may contribute to restoring the fitness or stability of the enzyme. Here we develop a probabilistic approach based on connected information that allows us to study residue, pair level and higher- order correlations within the same framework. Results: We apply our methodology to a database of approximately 13,000 sequences which have been annotated by the treatment history of the patients from which the samples were obtained. We show that including pair interactions is essential for agreement with the mutational data, since neglect of these interactions results in order-of-magnitude errors in the probabilities of the simultaneous occurence of many mutations. The magnitude of these pair correlations changes dramatically between sequences obtained from patients that were or were not exposed to drugs. Higher-order effects make a contribution of as much as 10% for residues taken three at a time, but increase to more than twice that for 10 to 15-residue groups. The sequence data is insufficient to determine the higher-order effects for larger groups. We find that higher-order interactions have a significant effect on the predicted frequencies of sequences with large numbers of mutations. While relatively rare, such sequences are more prevalent after multi-drug therapy. The relative importance of these higher-order interactions increases with the number of drugs the patient had been exposed to. Conclusion: Correlations are critical for the understanding of mutation patterns in HIV protease. Pair interactions have substantial qualitative effects, while higher-order interactions are individually smaller but may have a collective effect. Together they lead to correlations which could have an from ECCB 2008 Workshop: Annotations, interpretation and management of mutations (AIMM) Cagliari, Italy. 22 September 2008 Published: 27 August 2009 BMC Bioinformatics 2009, 10(Suppl 8):S10 doi:10.1186/1471-2105-10-S8-S10 <supplement> <title> <p>Proceedings of the European Conference on Computational Biology (ECCB) 2008 Workshop: Annotations, interpretation and management of mutations (AIMM)</p> </title> <editor>Christopher JO Baker and Dietrich Rebholz-Schuhmann</editor> <note>Research</note> <url>http://www.biomedcentral.com/content/pdf/1471-2105-10-S8-info.pdf</url> </supplement> This article is available from: http://www.biomedcentral.com/1471-2105/10/S8/S10 © 2009 Haq et al; licensee BioMed Central Ltd. This is an open access article distributed under the terms of the Creative Commons Attribution License (http://creativecommons.org/licenses/by/2.0 ), which permits unrestricted use, distribution, and reproduction in any medium, provided the original work is properly cited.
Transcript of BMC Bioinformatics BioMed Central · Human Immunodeficiency Virus HIV-1 plays a critical role in...
BioMed CentralBMC Bioinformatics
ss
Open AcceResearchPairwise and higher-order correlations among drug-resistance mutations in HIV-1 subtype B proteaseOmar Haq1, Ronald M Levy*1,2, Alexandre V Morozov*1,3 and Michael Andrec1,2Address: 1BioMaPS Institute for Quantitative Biology, Rutgers, the State University of New Jersey, 610 Taylor Road, Piscataway NJ 08854, USA, 2Department of Chemistry and Chemical Biology, Rutgers, the State University of New Jersey, 610 Taylor Road, Piscataway NJ 08854, USA and 3Department of Physics and Astronomy, Rutgers, the State University of New Jersey, 136 Frelinghuysen Road, Piscataway NJ 08854, USA
Email: Omar Haq - [email protected]; Ronald M Levy* - [email protected]; Alexandre V Morozov* - [email protected]; Michael Andrec - [email protected]
* Corresponding authors
AbstractBackground: The reaction of HIV protease to inhibitor therapy is characterized by theemergence of complex mutational patterns which confer drug resistance. The response of HIVprotease to drugs often involves both primary mutations that directly inhibit the action of the drug,and a host of accessory resistance mutations that may occur far from the active site but maycontribute to restoring the fitness or stability of the enzyme. Here we develop a probabilisticapproach based on connected information that allows us to study residue, pair level and higher-order correlations within the same framework.
Results: We apply our methodology to a database of approximately 13,000 sequences which havebeen annotated by the treatment history of the patients from which the samples were obtained.We show that including pair interactions is essential for agreement with the mutational data, sinceneglect of these interactions results in order-of-magnitude errors in the probabilities of thesimultaneous occurence of many mutations. The magnitude of these pair correlations changesdramatically between sequences obtained from patients that were or were not exposed to drugs.Higher-order effects make a contribution of as much as 10% for residues taken three at a time, butincrease to more than twice that for 10 to 15-residue groups. The sequence data is insufficient todetermine the higher-order effects for larger groups. We find that higher-order interactions havea significant effect on the predicted frequencies of sequences with large numbers of mutations.While relatively rare, such sequences are more prevalent after multi-drug therapy. The relativeimportance of these higher-order interactions increases with the number of drugs the patient hadbeen exposed to.
Conclusion: Correlations are critical for the understanding of mutation patterns in HIV protease.Pair interactions have substantial qualitative effects, while higher-order interactions are individuallysmaller but may have a collective effect. Together they lead to correlations which could have an
from ECCB 2008 Workshop: Annotations, interpretation and management of mutations (AIMM)Cagliari, Italy. 22 September 2008
Published: 27 August 2009
BMC Bioinformatics 2009, 10(Suppl 8):S10 doi:10.1186/1471-2105-10-S8-S10
<supplement> <title> <p>Proceedings of the European Conference on Computational Biology (ECCB) 2008 Workshop: Annotations, interpretation and management of mutations (AIMM)</p> </title> <editor>Christopher JO Baker and Dietrich Rebholz-Schuhmann</editor> <note>Research</note> <url>http://www.biomedcentral.com/content/pdf/1471-2105-10-S8-info.pdf</url> </supplement>
This article is available from: http://www.biomedcentral.com/1471-2105/10/S8/S10
© 2009 Haq et al; licensee BioMed Central Ltd. This is an open access article distributed under the terms of the Creative Commons Attribution License (http://creativecommons.org/licenses/by/2.0), which permits unrestricted use, distribution, and reproduction in any medium, provided the original work is properly cited.
Page 1 of 14(page number not for citation purposes)
BMC Bioinformatics 2009, 10(Suppl 8):S10 http://www.biomedcentral.com/1471-2105/10/S8/S10
important impact on the dynamics of the evolution of cross-resistance, by allowing the virus to passthrough otherwise unlikely mutational states. These findings also indicate that pairwise and possiblyhigher-order effects should be included in the models of protein evolution, instead of assuming thatall residues mutate independently of one another.
BackgroundThe protease enzyme coded for by the pol gene of theHuman Immunodeficiency Virus HIV-1 plays a criticalrole in the reproduction of the virus by cleaving the GAGprecursor protein in a sequence-specific manner into itsfunctional form, and as such, is a key target of several fam-ilies of commonly used drugs used to control HIV infec-tion [1]. Unfortunately, the virus has been able to evolveresistance to many of these drugs, in part due to the highmutation rates in the HIV genome [2]. The patterns ofmutations in protease are complex, involving multiplekey primary mutations that inhibit the action of drugs anda host of accessory mutations that can modulate theenzyme's stability or activity or otherwise enhance the fit-ness of the virus. It is now understood that these muta-tions do not occur independently of each other, butinstead are correlated, resulting in complex patterns of co-evolving mutations [3-7].
Previous studies have mostly focused on correlationsbetween mutations in the HIV protease gene at the pairlevel [3,5-7]. However, recognition that the observedmutations may also be involved in higher-order interac-tions has led to a few studies in which correlated pairs ofmutations are grouped using tools such as multidimen-sional scaling [3,6], Bayesian networks [8], networksdefined by patterns of conditional selection pressure [5],and clustering [9,10]. The underlying assumption is thatunderstanding higher-order interactions is important for acomplete understanding of the evolution of resistance inHIV protease.
In this paper, we investigate correlations among HIV pro-tease mutations at and beyond the pair level, and theimpact of drug treatment on the nature of those correla-tions. We only consider the presence or absence of a non-synonymous mutation relative to a defined wild-typesequence, and not the precise base or amino acid substitu-tion which has occurred. We develop a hierarchy of prob-abilistic log-linear models [11] that can in principledescribe residue interactions of arbitrary order, and usethose to analyze HIV protease sequence data obtainedfrom patient cohorts with varying protease inhibitor (PI)treatment histories.
We use "connected information" [12] to quantify inter-residue interactions at the triplet and higher level. Unlikethe Bayesian network approach [13], the information-the-
oretic methodology allows us to distinguish intrinsicthree-body effects from the cases in which correlationsbetween three random variables can be attributed mostlyto pairwise interactions. The connected information view-point of higher order correlation has not been previouslyused in the analysis of mutational patterns in HIV pro-tease, although it has been employed in a much more lim-ited analysis of the V3 loop of the HIV envelope protein[14], and log-linear models have been used to study pro-tein-protein interactions [15]. We find that pairwise inter-actions are necessary to achieve even qualitativeagreement with the mutational data, while higher orderinteractions play an important role in predicting how fre-quently sequences with several mutations appear in thedatabase. Simultaneous appearance of multiple muta-tions may play an important role in the phenomenon ofmultiple- or cross-resistance of the viral protease.
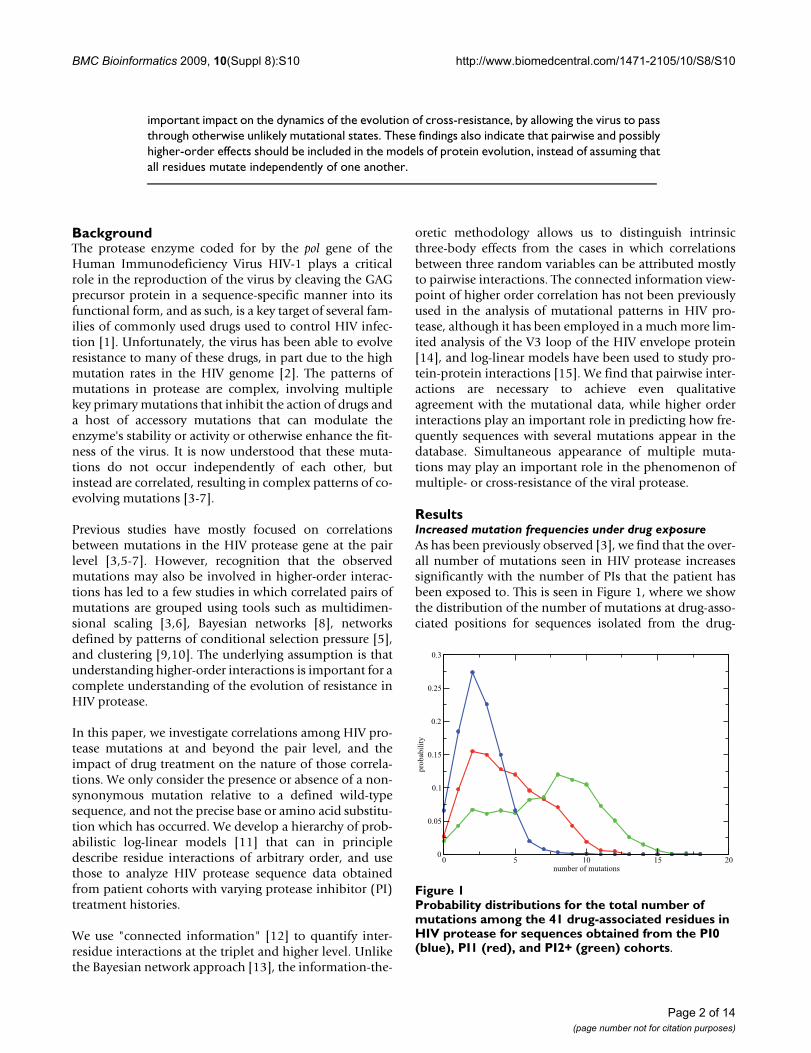
ResultsIncreased mutation frequencies under drug exposureAs has been previously observed [3], we find that the over-all number of mutations seen in HIV protease increasessignificantly with the number of PIs that the patient hasbeen exposed to. This is seen in Figure 1, where we showthe distribution of the number of mutations at drug-asso-ciated positions for sequences isolated from the drug-
Probability distributions for the total number of mutations among the 41 drug-associated residues in HIV protease for sequences obtained from the PI0 (blue), PI1 (red), and PI2+ (green) cohortsFigure 1Probability distributions for the total number of mutations among the 41 drug-associated residues in HIV protease for sequences obtained from the PI0 (blue), PI1 (red), and PI2+ (green) cohorts.
0 5 10 15 20number of mutations
0
0.05
0.1
0.15
0.2
0.25
0.3
prob
abili
ty
Page 2 of 14(page number not for citation purposes)
BMC Bioinformatics 2009, 10(Suppl 8):S10 http://www.biomedcentral.com/1471-2105/10/S8/S10
naive cohort (PI0), from a PI monotherapy cohort (PI1),and from a cohort treated with 2 or more PIs (PI2+), asestimated from the database described in the Methods.For some residue positions, the increase in the mutationfrequency between the PI0 and PI2+ cohorts is nearlyeightfold, while other positions show no discerniblechange (Additional File 1). This observed increase inmutation frequencies at drug-associated sites is largelyresponsible for the shift in the distribution shown in Fig-ure 1.
It is of interest to ask which amino acid positions exhibitelevated mutation frequencies under drug treatment.Mutations at many of these positions are associated withdecreased HIV-1 inhibitor susceptibility, and it is useful toclassify mutations as belonging to "primary" vs "acces-sory" resistance classes. The terms "secondary" and "com-pensatory" have also been used as synonyms for"accessory". The specific criteria for such a classificationare ad hoc in nature, but have generally been defined asfollows.
Primary mutations are usually selected first in the pres-ence of the drug and confer resistance, even when presentas single point mutations [16,17]. They can be structurallyimportant, e.g. situated near the enzymatic active site, inwhich case their effect on inhibitor binding can be ration-alized due to their physical proximity to the inhibitor[18]. In the case of protease, however, there are excep-tions, as some mutations (such as positions 54, 76, 88 and90) are situated far from the active site or have no directcontacts with the substrate, yet still reduce drug suscepti-bility [16]. The mechanism of action of these mutations isnot clearly understood [19].
Accessory mutations confer resistance only when presentwith additional primary or accessory drug-resistancemutations and have little or no effect on inhibitor suscep-tibility on their own. Some of these mutations occur in theabsence of drug treatment, but their frequency of occur-rence is observed to increase in treated patients. Accessorymutations may "rescue" possible losses of activity or sta-bility in the enzyme that may have been caused by a desta-bilizing primary resistance mutation, and therefore mayhave a compensatory function in restoring viral fitness[20].
We make use of a primary and accessory classificationscheme based on the work of Shafer et al. [21-23,17]. Wedefine 17 primary drug resistance positions (residues 23,24, 30, 32, 33, 46, 47, 48, 50, 53, 54, 73, 76, 82, 84, 88,90) and 24 accessory drug resistance positions (residues10, 11, 13, 20, 34, 35, 36, 43, 45, 55, 58, 60, 63, 71, 74,75, 77, 79, 83, 85, 89, 91, 93, 95). The remaining posi-
tions are polymorphic mutations not associated with drugresistance or are conserved sites [24,3,25,21,26,23].
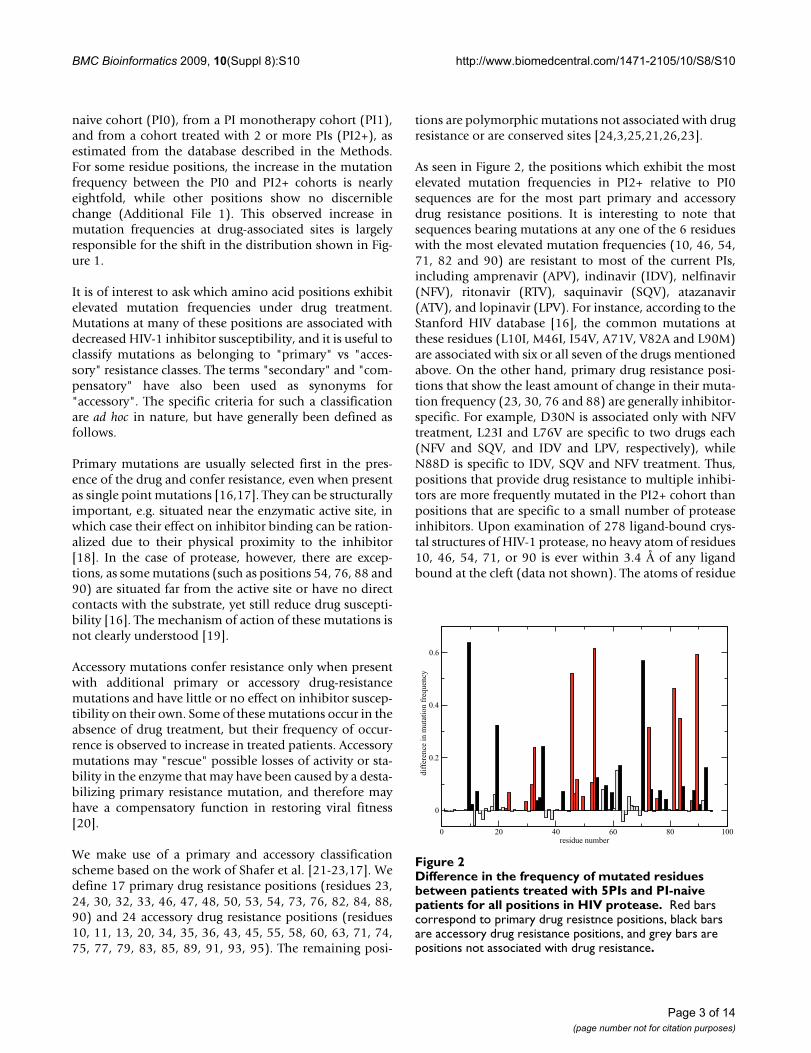
As seen in Figure 2, the positions which exhibit the mostelevated mutation frequencies in PI2+ relative to PI0sequences are for the most part primary and accessorydrug resistance positions. It is interesting to note thatsequences bearing mutations at any one of the 6 residueswith the most elevated mutation frequencies (10, 46, 54,71, 82 and 90) are resistant to most of the current PIs,including amprenavir (APV), indinavir (IDV), nelfinavir(NFV), ritonavir (RTV), saquinavir (SQV), atazanavir(ATV), and lopinavir (LPV). For instance, according to theStanford HIV database [16], the common mutations atthese residues (L10I, M46I, I54V, A71V, V82A and L90M)are associated with six or all seven of the drugs mentionedabove. On the other hand, primary drug resistance posi-tions that show the least amount of change in their muta-tion frequency (23, 30, 76 and 88) are generally inhibitor-specific. For example, D30N is associated only with NFVtreatment, L23I and L76V are specific to two drugs each(NFV and SQV, and IDV and LPV, respectively), whileN88D is specific to IDV, SQV and NFV treatment. Thus,positions that provide drug resistance to multiple inhibi-tors are more frequently mutated in the PI2+ cohort thanpositions that are specific to a small number of proteaseinhibitors. Upon examination of 278 ligand-bound crys-tal structures of HIV-1 protease, no heavy atom of residues10, 46, 54, 71, or 90 is ever within 3.4 Å of any ligandbound at the cleft (data not shown). The atoms of residue
Difference in the frequency of mutated residues between patients treated with 5PIs and PI-naive patients for all posi-tions in HIV proteaseFigure 2Difference in the frequency of mutated residues between patients treated with 5PIs and PI-naive patients for all positions in HIV protease. Red bars correspond to primary drug resistnce positions, black bars are accessory drug resistance positions, and grey bars are positions not associated with drug resistance.
0 20 40 60 80 100residue number
0
0.2
0.4
0.6
diff
eren
ce in
mut
atio
n fr
eque
ncy
Page 3 of 14(page number not for citation purposes)
BMC Bioinformatics 2009, 10(Suppl 8):S10 http://www.biomedcentral.com/1471-2105/10/S8/S10
82, however, do contact ligands in 54% of the crystalstructures examined.
Exhaustive analysis of residue pairs
We begin by investigating pair correlations and their asso-ciation with the structure of HIV protease. Several groupshave studied pair correlations as a means of identifyingfunctionally dependent residues in the HIV protease and
other systems [6,5,4,3,7]. For each of the = 3, 321
pairs of positions, a 2 × 2 contingency table was con-structed for both the drug-naive sequences and thesequences treated by two or more drugs. The binomial or"product moment" [11] correlation coefficient
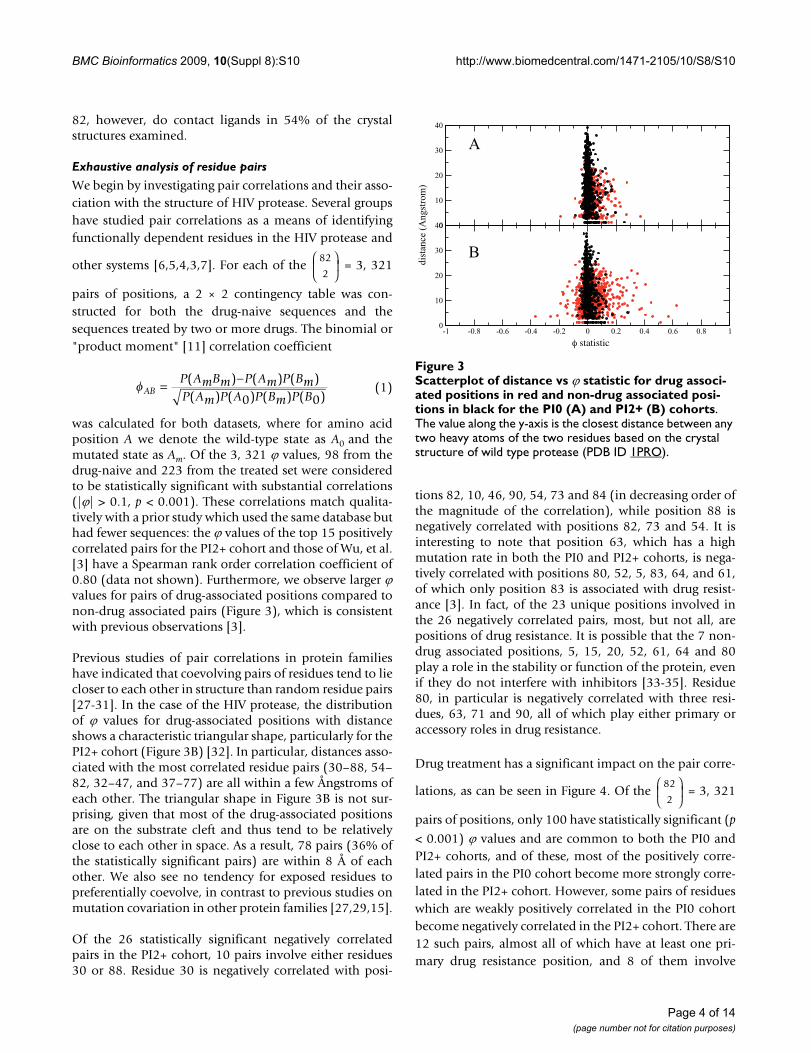
was calculated for both datasets, where for amino acidposition A we denote the wild-type state as A0 and themutated state as Am. Of the 3, 321 ϕ values, 98 from thedrug-naive and 223 from the treated set were consideredto be statistically significant with substantial correlations(|ϕ| > 0.1, p < 0.001). These correlations match qualita-tively with a prior study which used the same database buthad fewer sequences: the ϕ values of the top 15 positivelycorrelated pairs for the PI2+ cohort and those of Wu, et al.[3] have a Spearman rank order correlation coefficient of0.80 (data not shown). Furthermore, we observe larger ϕvalues for pairs of drug-associated positions compared tonon-drug associated pairs (Figure 3), which is consistentwith previous observations [3].
Previous studies of pair correlations in protein familieshave indicated that coevolving pairs of residues tend to liecloser to each other in structure than random residue pairs[27-31]. In the case of the HIV protease, the distributionof ϕ values for drug-associated positions with distanceshows a characteristic triangular shape, particularly for thePI2+ cohort (Figure 3B) [32]. In particular, distances asso-ciated with the most correlated residue pairs (30–88, 54–82, 32–47, and 37–77) are all within a few Ångstroms ofeach other. The triangular shape in Figure 3B is not sur-prising, given that most of the drug-associated positionsare on the substrate cleft and thus tend to be relativelyclose to each other in space. As a result, 78 pairs (36% ofthe statistically significant pairs) are within 8 Å of eachother. We also see no tendency for exposed residues topreferentially coevolve, in contrast to previous studies onmutation covariation in other protein families [27,29,15].
Of the 26 statistically significant negatively correlatedpairs in the PI2+ cohort, 10 pairs involve either residues30 or 88. Residue 30 is negatively correlated with posi-
tions 82, 10, 46, 90, 54, 73 and 84 (in decreasing order ofthe magnitude of the correlation), while position 88 isnegatively correlated with positions 82, 73 and 54. It isinteresting to note that position 63, which has a highmutation rate in both the PI0 and PI2+ cohorts, is nega-tively correlated with positions 80, 52, 5, 83, 64, and 61,of which only position 83 is associated with drug resist-ance [3]. In fact, of the 23 unique positions involved inthe 26 negatively correlated pairs, most, but not all, arepositions of drug resistance. It is possible that the 7 non-drug associated positions, 5, 15, 20, 52, 61, 64 and 80play a role in the stability or function of the protein, evenif they do not interfere with inhibitors [33-35]. Residue80, in particular is negatively correlated with three resi-dues, 63, 71 and 90, all of which play either primary oraccessory roles in drug resistance.
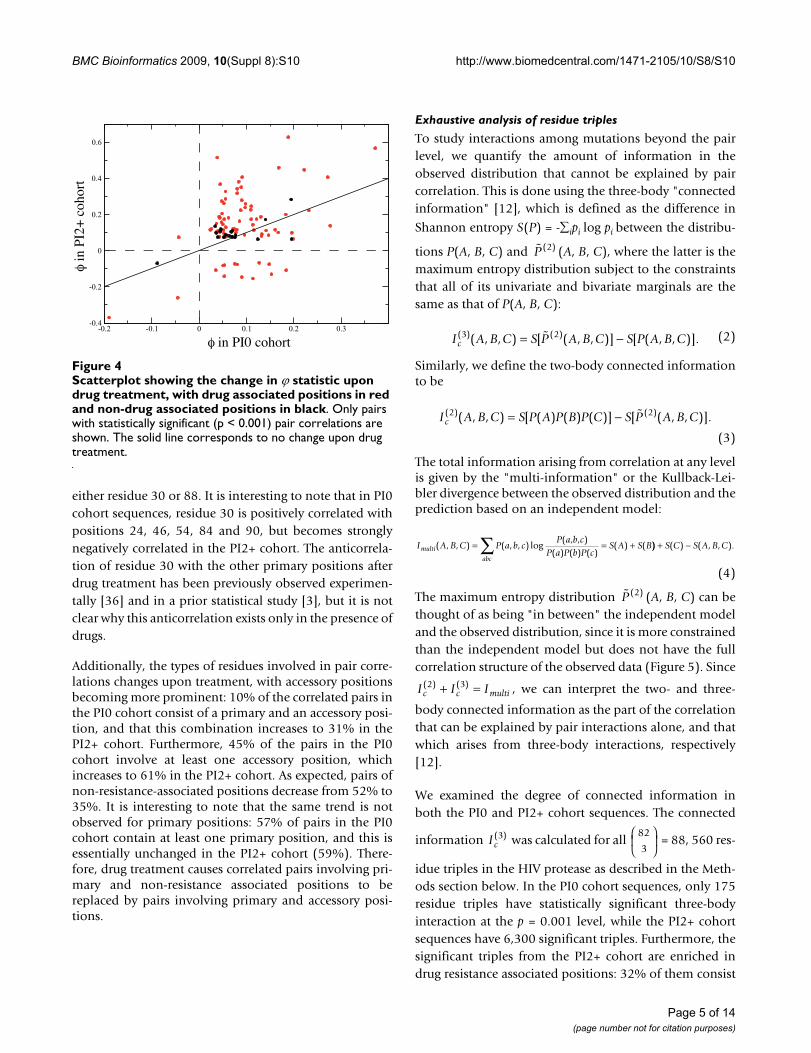
Drug treatment has a significant impact on the pair corre-
lations, as can be seen in Figure 4. Of the = 3, 321
pairs of positions, only 100 have statistically significant (p
< 0.001) ϕ values and are common to both the PI0 andPI2+ cohorts, and of these, most of the positively corre-lated pairs in the PI0 cohort become more strongly corre-lated in the PI2+ cohort. However, some pairs of residueswhich are weakly positively correlated in the PI0 cohortbecome negatively correlated in the PI2+ cohort. There are12 such pairs, almost all of which have at least one pri-mary drug resistance position, and 8 of them involve
82
2
⎛
⎝⎜
⎞
⎠⎟
φABP AmBm P Am P BmP Am P A P Bm P B
= −( ) ( ) ( )( ) ( ) ( ) ( )0 0
(1)
82
2
⎛
⎝⎜
⎞
⎠⎟
Scatterplot of distance vs ϕ statistic for drug associated posi-tions in red and non-drug associated positions in black for the PI0 (A) and PI2+ (B) cohortsFigure 3Scatterplot of distance vs ϕ statistic for drug associ-ated positions in red and non-drug associated posi-tions in black for the PI0 (A) and PI2+ (B) cohorts. The value along the y-axis is the closest distance between any two heavy atoms of the two residues based on the crystal structure of wild type protease (PDB ID 1PRO).
-1 -0.8 -0.6 -0.4 -0.2 0 0.2 0.4 0.6 0.8 10
10
20
30
400
10
20
30
40
dist
ance
(Ang
stro
m)
A
B
Page 4 of 14(page number not for citation purposes)
BMC Bioinformatics 2009, 10(Suppl 8):S10 http://www.biomedcentral.com/1471-2105/10/S8/S10
either residue 30 or 88. It is interesting to note that in PI0cohort sequences, residue 30 is positively correlated withpositions 24, 46, 54, 84 and 90, but becomes stronglynegatively correlated in the PI2+ cohort. The anticorrela-tion of residue 30 with the other primary positions afterdrug treatment has been previously observed experimen-tally [36] and in a prior statistical study [3], but it is notclear why this anticorrelation exists only in the presence ofdrugs.
Additionally, the types of residues involved in pair corre-lations changes upon treatment, with accessory positionsbecoming more prominent: 10% of the correlated pairs inthe PI0 cohort consist of a primary and an accessory posi-tion, and that this combination increases to 31% in thePI2+ cohort. Furthermore, 45% of the pairs in the PI0cohort involve at least one accessory position, whichincreases to 61% in the PI2+ cohort. As expected, pairs ofnon-resistance-associated positions decrease from 52% to35%. It is interesting to note that the same trend is notobserved for primary positions: 57% of pairs in the PI0cohort contain at least one primary position, and this isessentially unchanged in the PI2+ cohort (59%). There-fore, drug treatment causes correlated pairs involving pri-mary and non-resistance associated positions to bereplaced by pairs involving primary and accessory posi-tions.
Exhaustive analysis of residue triples
To study interactions among mutations beyond the pairlevel, we quantify the amount of information in theobserved distribution that cannot be explained by paircorrelation. This is done using the three-body "connectedinformation" [12], which is defined as the difference in
Shannon entropy S(P) = -∑ipi log pi between the distribu-
tions P(A, B, C) and (A, B, C), where the latter is themaximum entropy distribution subject to the constraintsthat all of its univariate and bivariate marginals are thesame as that of P(A, B, C):
Similarly, we define the two-body connected informationto be
The total information arising from correlation at any levelis given by the "multi-information" or the Kullback-Lei-bler divergence between the observed distribution and theprediction based on an independent model:
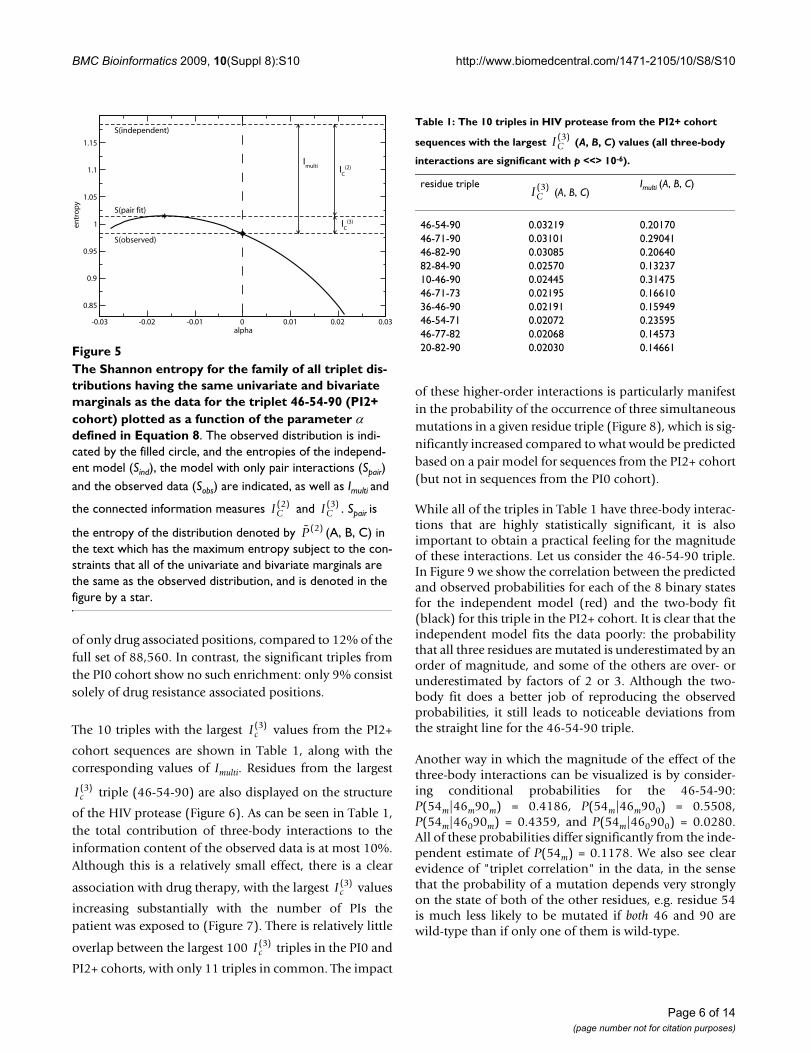
The maximum entropy distribution (A, B, C) can bethought of as being "in between" the independent modeland the observed distribution, since it is more constrainedthan the independent model but does not have the fullcorrelation structure of the observed data (Figure 5). Since
, we can interpret the two- and three-
body connected information as the part of the correlationthat can be explained by pair interactions alone, and thatwhich arises from three-body interactions, respectively[12].
We examined the degree of connected information inboth the PI0 and PI2+ cohort sequences. The connected
information was calculated for all = 88, 560 res-
idue triples in the HIV protease as described in the Meth-ods section below. In the PI0 cohort sequences, only 175residue triples have statistically significant three-bodyinteraction at the p = 0.001 level, while the PI2+ cohortsequences have 6,300 significant triples. Furthermore, thesignificant triples from the PI2+ cohort are enriched indrug resistance associated positions: 32% of them consist
P ( )2
I A B C S P A B C S P A B Cc( ) ( )( , , ) [ ( , , )] [ ( , , )].3 2= − (2)
I A B C S P A P B P C S P A B Cc( ) ( )( , , ) [ ( ) ( ) ( )] [ ( , , )].2 2= −
(3)
I A B C P a b cP a b c
P a P b P cS A S Bmulti
abc
( , , ) ( , , ) log( , , )
( ) ( ) ( )( ) (= = +∑ )) ( ) ( , , ).+ −S C S A B C
(4)
P ( )2
I I Ic c multi( ) ( )2 3+ =
Ic( )3 82
3
⎛
⎝⎜
⎞
⎠⎟
Scatterplot showing the change in ϕ statistic upon drug treat-ment, with drug associated positions in red and non-drug associated positions in blackFigure 4Scatterplot showing the change in ϕ statistic upon drug treatment, with drug associated positions in red and non-drug associated positions in black. Only pairs with statistically significant (p < 0.001) pair correlations are shown. The solid line corresponds to no change upon drug treatment.
-0.2 -0.1 0 0.1 0.2 0.3-0.4
-0.2
0
0.2
0.4
0.6
Page 5 of 14(page number not for citation purposes)
BMC Bioinformatics 2009, 10(Suppl 8):S10 http://www.biomedcentral.com/1471-2105/10/S8/S10
of only drug associated positions, compared to 12% of thefull set of 88,560. In contrast, the significant triples fromthe PI0 cohort show no such enrichment: only 9% consistsolely of drug resistance associated positions.
The 10 triples with the largest values from the PI2+
cohort sequences are shown in Table 1, along with thecorresponding values of Imulti. Residues from the largest
triple (46-54-90) are also displayed on the structure
of the HIV protease (Figure 6). As can be seen in Table 1,the total contribution of three-body interactions to theinformation content of the observed data is at most 10%.Although this is a relatively small effect, there is a clear
association with drug therapy, with the largest values
increasing substantially with the number of PIs thepatient was exposed to (Figure 7). There is relatively little
overlap between the largest 100 triples in the PI0 and
PI2+ cohorts, with only 11 triples in common. The impact
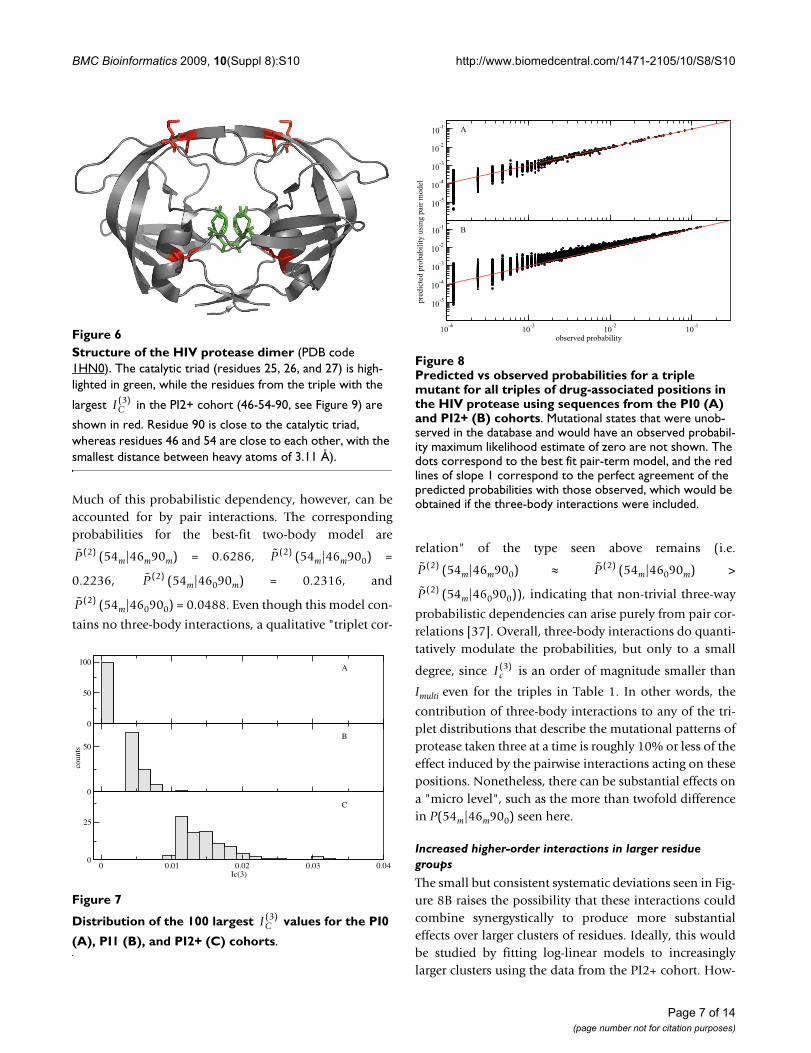
of these higher-order interactions is particularly manifestin the probability of the occurrence of three simultaneousmutations in a given residue triple (Figure 8), which is sig-nificantly increased compared to what would be predictedbased on a pair model for sequences from the PI2+ cohort(but not in sequences from the PI0 cohort).
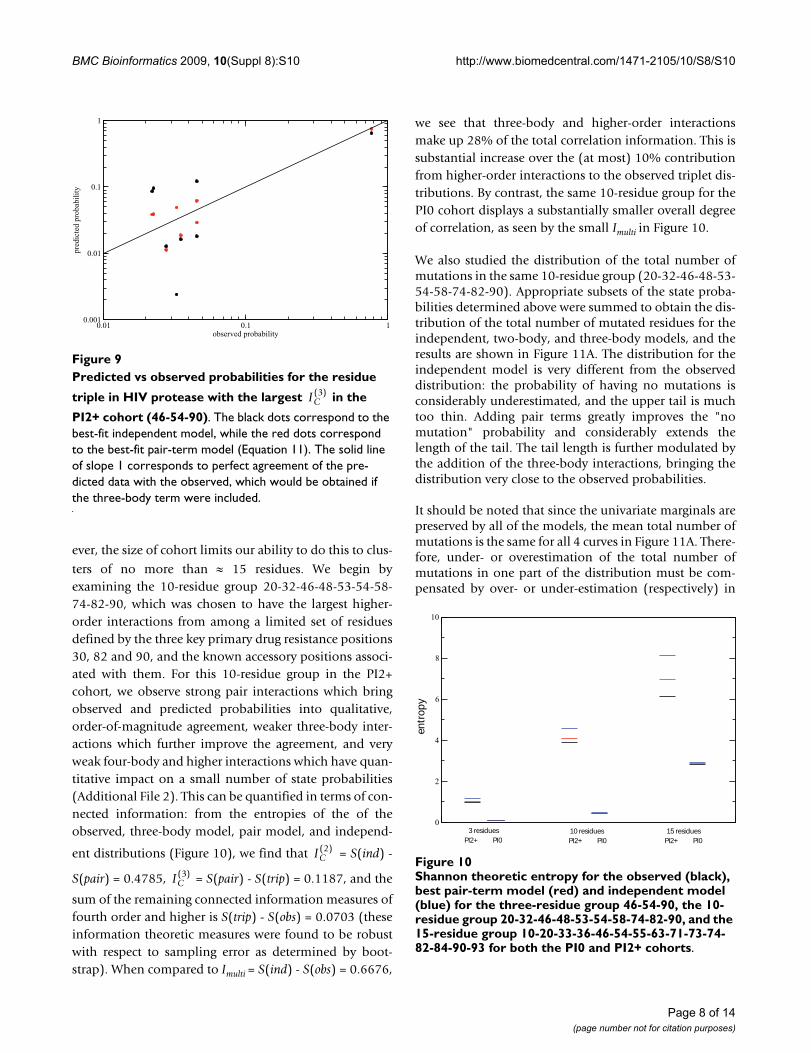
While all of the triples in Table 1 have three-body interac-tions that are highly statistically significant, it is alsoimportant to obtain a practical feeling for the magnitudeof these interactions. Let us consider the 46-54-90 triple.In Figure 9 we show the correlation between the predictedand observed probabilities for each of the 8 binary statesfor the independent model (red) and the two-body fit(black) for this triple in the PI2+ cohort. It is clear that theindependent model fits the data poorly: the probabilitythat all three residues are mutated is underestimated by anorder of magnitude, and some of the others are over- orunderestimated by factors of 2 or 3. Although the two-body fit does a better job of reproducing the observedprobabilities, it still leads to noticeable deviations fromthe straight line for the 46-54-90 triple.
Another way in which the magnitude of the effect of thethree-body interactions can be visualized is by consider-ing conditional probabilities for the 46-54-90:P(54m|46m90m) = 0.4186, P(54m|46m900) = 0.5508,P(54m|46090m) = 0.4359, and P(54m|460900) = 0.0280.All of these probabilities differ significantly from the inde-pendent estimate of P(54m) = 0.1178. We also see clearevidence of "triplet correlation" in the data, in the sensethat the probability of a mutation depends very stronglyon the state of both of the other residues, e.g. residue 54is much less likely to be mutated if both 46 and 90 arewild-type than if only one of them is wild-type.
Ic( )3
Ic( )3
Ic( )3
Ic( )3
Table 1: The 10 triples in HIV protease from the PI2+ cohort
sequences with the largest (A, B, C) values (all three-body
interactions are significant with p <<> 10-6).
residue triple (A, B, C)
Imulti (A, B, C)
46-54-90 0.03219 0.2017046-71-90 0.03101 0.2904146-82-90 0.03085 0.2064082-84-90 0.02570 0.1323710-46-90 0.02445 0.3147546-71-73 0.02195 0.1661036-46-90 0.02191 0.1594946-54-71 0.02072 0.2359546-77-82 0.02068 0.1457320-82-90 0.02030 0.14661
IC( )3
IC( )3
The Shannon entropy for the family of all triplet distributions having the same univariate and bivariate marginals as the data for the triplet 46-54-90 (PI2+ cohort) plotted as a function of the parameter α defined in Equation 8Figure 5The Shannon entropy for the family of all triplet dis-tributions having the same univariate and bivariate marginals as the data for the triplet 46-54-90 (PI2+ cohort) plotted as a function of the parameter α defined in Equation 8. The observed distribution is indi-cated by the filled circle, and the entropies of the independ-ent model (Sind), the model with only pair interactions (Spair) and the observed data (Sobs) are indicated, as well as Imulti and
the connected information measures and . Spair is
the entropy of the distribution denoted by (A, B, C) in the text which has the maximum entropy subject to the con-straints that all of the univariate and bivariate marginals are the same as the observed distribution, and is denoted in the figure by a star.
-0.03 -0.02 -0.01 0 0.01 0.02 0.03alpha
0.85
0.9
0.95
1
1.05
1.1
1.15
entr
op
y
Imulti I
C(2)
IC
(3)
S(independent)
S(pair fit)
S(observed)
IC( )2 IC
( )3
P ( )2
Page 6 of 14(page number not for citation purposes)
BMC Bioinformatics 2009, 10(Suppl 8):S10 http://www.biomedcentral.com/1471-2105/10/S8/S10
Much of this probabilistic dependency, however, can beaccounted for by pair interactions. The correspondingprobabilities for the best-fit two-body model are
(54m|46m90m) = 0.6286, (54m|46m900) =
0.2236, (54m|46090m) = 0.2316, and
(54m|460900) = 0.0488. Even though this model con-
tains no three-body interactions, a qualitative "triplet cor-
relation" of the type seen above remains (i.e.
(54m|46m900) ≈ (54m|46090m) >
(54m|460900)), indicating that non-trivial three-way
probabilistic dependencies can arise purely from pair cor-relations [37]. Overall, three-body interactions do quanti-tatively modulate the probabilities, but only to a small
degree, since is an order of magnitude smaller than
Imulti even for the triples in Table 1. In other words, the
contribution of three-body interactions to any of the tri-plet distributions that describe the mutational patterns ofprotease taken three at a time is roughly 10% or less of theeffect induced by the pairwise interactions acting on thesepositions. Nonetheless, there can be substantial effects ona "micro level", such as the more than twofold differencein P(54m|46m900) seen here.
Increased higher-order interactions in larger residue groups
The small but consistent systematic deviations seen in Fig-ure 8B raises the possibility that these interactions couldcombine synergystically to produce more substantialeffects over larger clusters of residues. Ideally, this wouldbe studied by fitting log-linear models to increasinglylarger clusters using the data from the PI2+ cohort. How-
P ( )2 P ( )2
P ( )2
P ( )2
P ( )2 P ( )2
P ( )2
Ic( )3
Predicted vs observed probabilities for a triple mutant for all triples of drug-associated positions in the HIV protease using sequences from the PI0 (A) and PI2+ (B) cohortsFigure 8Predicted vs observed probabilities for a triple mutant for all triples of drug-associated positions in the HIV protease using sequences from the PI0 (A) and PI2+ (B) cohorts. Mutational states that were unob-served in the database and would have an observed probabil-ity maximum likelihood estimate of zero are not shown. The dots correspond to the best fit pair-term model, and the red lines of slope 1 correspond to the perfect agreement of the predicted probabilities with those observed, which would be obtained if the three-body interactions were included.
10-5
10-4
10-3
10-2
10-1
10-4 10-3 10-2 10-1
observed probability
10-5
10-4
10-3
10-2
10-1
pred
icte
d pr
obab
ility
usi
ng p
air m
odel
A
B
Structure of the HIV protease dimer (PDB code 1HN0)Figure 6Structure of the HIV protease dimer (PDB code 1HN0). The catalytic triad (residues 25, 26, and 27) is high-lighted in green, while the residues from the triple with the
largest in the PI2+ cohort (46-54-90, see Figure 9) are
shown in red. Residue 90 is close to the catalytic triad, whereas residues 46 and 54 are close to each other, with the smallest distance between heavy atoms of 3.11 Å).
IC( )3
Distribution of the 100 largest values for the PI0 (A), PI1 (B), and PI2+ (C) cohortsFigure 7
Distribution of the 100 largest values for the PI0
(A), PI1 (B), and PI2+ (C) cohorts.
0
50
100
0
50
counts
0 0.01 0.02 0.03 0.04Ic(3)
0
25
A
B
C
IC( )3
Page 7 of 14(page number not for citation purposes)
BMC Bioinformatics 2009, 10(Suppl 8):S10 http://www.biomedcentral.com/1471-2105/10/S8/S10
ever, the size of cohort limits our ability to do this to clus-
ters of no more than ≈ 15 residues. We begin byexamining the 10-residue group 20-32-46-48-53-54-58-74-82-90, which was chosen to have the largest higher-order interactions from among a limited set of residuesdefined by the three key primary drug resistance positions30, 82 and 90, and the known accessory positions associ-ated with them. For this 10-residue group in the PI2+cohort, we observe strong pair interactions which bringobserved and predicted probabilities into qualitative,order-of-magnitude agreement, weaker three-body inter-actions which further improve the agreement, and veryweak four-body and higher interactions which have quan-titative impact on a small number of state probabilities(Additional File 2). This can be quantified in terms of con-nected information: from the entropies of the of theobserved, three-body model, pair model, and independ-
ent distributions (Figure 10), we find that = S(ind) -
S(pair) = 0.4785, = S(pair) - S(trip) = 0.1187, and the
sum of the remaining connected information measures offourth order and higher is S(trip) - S(obs) = 0.0703 (theseinformation theoretic measures were found to be robustwith respect to sampling error as determined by boot-strap). When compared to Imulti = S(ind) - S(obs) = 0.6676,
we see that three-body and higher-order interactionsmake up 28% of the total correlation information. This issubstantial increase over the (at most) 10% contributionfrom higher-order interactions to the observed triplet dis-tributions. By contrast, the same 10-residue group for thePI0 cohort displays a substantially smaller overall degreeof correlation, as seen by the small Imulti in Figure 10.
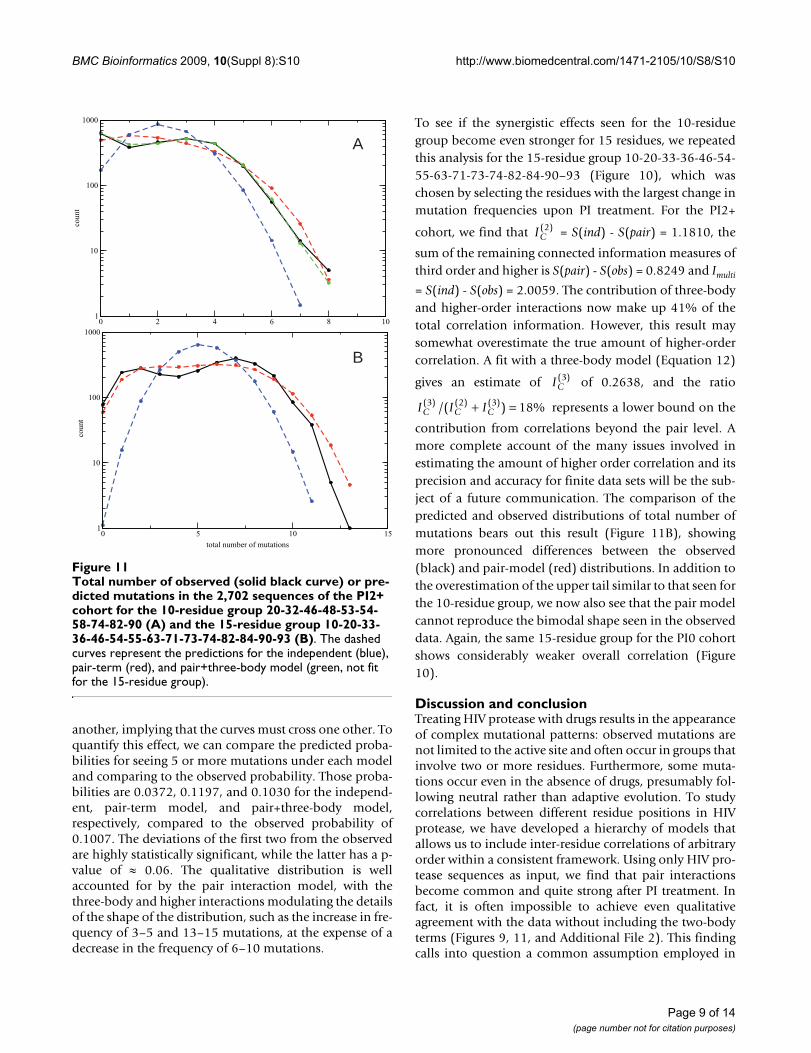
We also studied the distribution of the total number ofmutations in the same 10-residue group (20-32-46-48-53-54-58-74-82-90). Appropriate subsets of the state proba-bilities determined above were summed to obtain the dis-tribution of the total number of mutated residues for theindependent, two-body, and three-body models, and theresults are shown in Figure 11A. The distribution for theindependent model is very different from the observeddistribution: the probability of having no mutations isconsiderably underestimated, and the upper tail is muchtoo thin. Adding pair terms greatly improves the "nomutation" probability and considerably extends thelength of the tail. The tail length is further modulated bythe addition of the three-body interactions, bringing thedistribution very close to the observed probabilities.
It should be noted that since the univariate marginals arepreserved by all of the models, the mean total number ofmutations is the same for all 4 curves in Figure 11A. There-fore, under- or overestimation of the total number ofmutations in one part of the distribution must be com-pensated by over- or under-estimation (respectively) in
IC( )2
IC( )3
Shannon theoretic entropy for the observed (black), best pair-term model (red) and independent model (blue) for the three-residue group 46-54-90, the 10-residue group 20-32-46-48-53-54-58-74-82-90, and the 15-residue group 10-20-33-36-46-54-55-63-71-73-74-82-84-90-93 for both the PI0 and PI2+ cohortsFigure 10Shannon theoretic entropy for the observed (black), best pair-term model (red) and independent model (blue) for the three-residue group 46-54-90, the 10-residue group 20-32-46-48-53-54-58-74-82-90, and the 15-residue group 10-20-33-36-46-54-55-63-71-73-74-82-84-90-93 for both the PI0 and PI2+ cohorts.
0
2
4
6
8
10
10 residues 15 residuesPI2+ PI0 PI2+ PI0
entr
op
y
3 residuesPI2+ PI0
Predicted vs observed probabilities for the residue triple in HIV protease with the largest in the PI2+ cohort (46-54-90)Figure 9Predicted vs observed probabilities for the residue
triple in HIV protease with the largest in the
PI2+ cohort (46-54-90). The black dots correspond to the best-fit independent model, while the red dots correspond to the best-fit pair-term model (Equation 11). The solid line of slope 1 corresponds to perfect agreement of the pre-dicted data with the observed, which would be obtained if the three-body term were included.
11.010.0observed probability
0.001
0.01
0.1
1
pred
icte
d pr
obab
ility
IC( )3
Page 8 of 14(page number not for citation purposes)
BMC Bioinformatics 2009, 10(Suppl 8):S10 http://www.biomedcentral.com/1471-2105/10/S8/S10
another, implying that the curves must cross one other. Toquantify this effect, we can compare the predicted proba-bilities for seeing 5 or more mutations under each modeland comparing to the observed probability. Those proba-bilities are 0.0372, 0.1197, and 0.1030 for the independ-ent, pair-term model, and pair+three-body model,respectively, compared to the observed probability of0.1007. The deviations of the first two from the observedare highly statistically significant, while the latter has a p-value of ≈ 0.06. The qualitative distribution is wellaccounted for by the pair interaction model, with thethree-body and higher interactions modulating the detailsof the shape of the distribution, such as the increase in fre-quency of 3–5 and 13–15 mutations, at the expense of adecrease in the frequency of 6–10 mutations.
To see if the synergistic effects seen for the 10-residuegroup become even stronger for 15 residues, we repeatedthis analysis for the 15-residue group 10-20-33-36-46-54-55-63-71-73-74-82-84-90–93 (Figure 10), which waschosen by selecting the residues with the largest change inmutation frequencies upon PI treatment. For the PI2+
cohort, we find that = S(ind) - S(pair) = 1.1810, the
sum of the remaining connected information measures ofthird order and higher is S(pair) - S(obs) = 0.8249 and Imulti
= S(ind) - S(obs) = 2.0059. The contribution of three-bodyand higher-order interactions now make up 41% of thetotal correlation information. However, this result maysomewhat overestimate the true amount of higher-ordercorrelation. A fit with a three-body model (Equation 12)
gives an estimate of of 0.2638, and the ratio
represents a lower bound on the
contribution from correlations beyond the pair level. Amore complete account of the many issues involved inestimating the amount of higher order correlation and itsprecision and accuracy for finite data sets will be the sub-ject of a future communication. The comparison of thepredicted and observed distributions of total number ofmutations bears out this result (Figure 11B), showingmore pronounced differences between the observed(black) and pair-model (red) distributions. In addition tothe overestimation of the upper tail similar to that seen forthe 10-residue group, we now also see that the pair modelcannot reproduce the bimodal shape seen in the observeddata. Again, the same 15-residue group for the PI0 cohortshows considerably weaker overall correlation (Figure10).
Discussion and conclusionTreating HIV protease with drugs results in the appearanceof complex mutational patterns: observed mutations arenot limited to the active site and often occur in groups thatinvolve two or more residues. Furthermore, some muta-tions occur even in the absence of drugs, presumably fol-lowing neutral rather than adaptive evolution. To studycorrelations between different residue positions in HIVprotease, we have developed a hierarchy of models thatallows us to include inter-residue correlations of arbitraryorder within a consistent framework. Using only HIV pro-tease sequences as input, we find that pair interactionsbecome common and quite strong after PI treatment. Infact, it is often impossible to achieve even qualitativeagreement with the data without including the two-bodyterms (Figures 9, 11, and Additional File 2). This findingcalls into question a common assumption employed in
IC( )2
IC( )3
I I IC C C( ) ( ) ( )/( ) %3 2 3 18+ =
Total number of observed (solid black curve) or predicted mutations in the 2,702 sequences of the PI2+ cohort for the 10-residue group 20-32-46-48-53-54-58-74-82-90 (A) and the 15-residue group 10-20-33-36-46-54-55-63-71-73-74-82-84-90-93 (B)Figure 11Total number of observed (solid black curve) or pre-dicted mutations in the 2,702 sequences of the PI2+ cohort for the 10-residue group 20-32-46-48-53-54-58-74-82-90 (A) and the 15-residue group 10-20-33-36-46-54-55-63-71-73-74-82-84-90-93 (B). The dashed curves represent the predictions for the independent (blue), pair-term (red), and pair+three-body model (green, not fit for the 15-residue group).
0 2 4 6 8 10
total number of mutations
1
10
100
1000
coun
t
0 5 10 151
10
100
1000
coun
t
A
B
Page 9 of 14(page number not for citation purposes)
BMC Bioinformatics 2009, 10(Suppl 8):S10 http://www.biomedcentral.com/1471-2105/10/S8/S10
current probabilistic approaches to phylogeny [38] thatmost residues evolve independently.
We have developed an information-theoretic method tostudy interactions between mutations beyond the pair-wise level. Our approach is based on the notion of the
connected information (Equation 2) [12]. While
there are a variety of quantitatively different measures ofpair correlation [11,39] that may differ in their sensitivityin various regimes, they all measure essentially the samequalitative feature of the observed data. On the otherhand, no single summary statistic can capture all of thevarious characteristics of higher-order behavior, leadingto multiple descriptions that provide complimentaryinformation. Connected information is one intuitive sta-tistic that provides insight into the degree of structure inthe data beyond the pair correlation level.
Connected information provides information which iscomplementary to Bayesian network analyses based onfactorizations of the joint probability. It can readily veri-
fied that = 0 if at least one of the random variables is
independent of the other two, or if the joint distributioninvolves conditional independence (e.g. P(A, B, C) =P(A)P(B|A)P(C|A)). However, a joint distribution withtriplet-level probabilistic dependencies (in the sense thattwo of the variables are independent of each other, but thethird depends jointly on the state of the other two, e.g.P(A, B, C) = P(A)P(B)P(C|A, B), or if P(A, B, C) cannot befactorized into any simpler form) could still be consistentwith no three-body connected information if the observedtriplet distribution is the maximum entropy distributionrelative to its marginals. Thus, even if a Bayesian network-style analysis shows that a given triple cannot be factor-ized into any simpler form, that "triplet correlation" could
still be consistent with a very small or zero , indicating
that the observed behavior is dominated by two-bodyinteractions. In fact, it has been shown that very complexcorrelation patterns among random variables can arisefrom large numbers of weak pairwise interactions [37].
Other information-theoretic measures of "higher-ordercorrelation" have also been proposed, including higher-order mutual information, which measures "frustration"or the degree of synergy vs redundancy among several ran-dom variables [40]. While this measure has been used inthe analysis of HIV envelope protein sequence data [41],its interpretation is considerably less intuitive. Similarly,ad hoc methods for finding putative clusters of mutually
correlated residues [3,9,8,10] cannot reliably uncover setsthat have intrinsic higher order interactions, as defined by
large (data not shown).
Plotting ϕ values for pairs of residues as a function of thedistance between them (Figure 3B) reveals that whilesome large pair correlations arise from direct contactsbetween residues (e.g. ϕ ≈ 0.8, d < 5 Å), there are alsostrong correlations (ϕ ≈ 0.5) between amino acids sepa-rated by 15 Å or more, making physical coupling betweenthem very unlikely. To provide an example of the former,we consider mutations involving residues 30 and 88. Theclosest distance between heavy atoms of residues 30 and88 is just 3.66 Å, making likely some sort of physical inter-action between them. Mutations at residue 30 are stronglyand uniquely associated with resistance to the proteaseinhibitor nelfinavir, and there exists a strong correlationbetween mutations at positions 30 and 88 [42] whichmay be due in part to a compensation of the loss of a sur-face negative charge from the D30N mutation beingrestored by N88D [9].
It is possible that chains of intermediate interactionsresult in long-range coupling between two coevolving yetphysically distant residues [43]. However, because non-zero values of λij indicate a presence of direct interactionsbetween residues i and j in our model [15], we can decom-pose such "energetically connected pathways" into contri-butions from separate pairs. In contrast to a previousstudy [15], we find that non-zero values of λij are onlyweakly correlated with distance (Additional File 3). Thislack of correlation is not entirely surprising, since evendirect interactions between a pair of residues need nothave a purely physical origin. Indeed, if protein fitness isa non-linear function of its stability or enzymatic activity[44], two mutations can be correlated because they com-pensate each other by making independent and oppositecontributions to the overall fitness, even if there is nodirect or indirect physical interaction between them [45].By the same argument, the three-body terms also resultfrom a mixture of physical and epistatic (compensatory)origins.
We have shown that three-body and higher-order correla-tions have the largest effect on the probabilities of thesimultaneous occurrence of multiple mutations in theHIV protease (Figure 11). Since both this and previousstudies have found that the total number of mutated posi-tions is correlated with treatment by multiple proteaseinhibitors (Figure 1) [3], the presence of higher-orderinteractions may influence how protease reacts to multi-ple drugs, and could have an important impact on theevolution of cross-resistance, for example, by providing
Ic( )3
IC( )3
Ic( )3
Ic( )3
Page 10 of 14(page number not for citation purposes)
BMC Bioinformatics 2009, 10(Suppl 8):S10 http://www.biomedcentral.com/1471-2105/10/S8/S10
the virus with an "escape hatch" of large numbers ofmutations. Higher-order interactions could also impactthe time evolution of mutations by allowing the virus topass through otherwise unlikely mutational states. Wehave seen that the impact of higher-order interactions in10 to 15 residue clusters is at least a factor of two larger
than the largest values for residue triples (approxi-
mately 20% or more of the total entropy change). One ofthe outstanding questions raised by this work is whetherthe impact of higher-order interactions for HIV evolvingunder the pressure of multiple drugs continues to becomestronger for larger residue groups (ultimately the set of all41 drug-associated positions). Unfortunately, there is notenough sequence data to perform such an analysis. Shortof obtaining additional data, it may also be possible toexplore this question by constructing synthetic data sets
using λi and λij values consistent with an observed dis-
tribution at the level of residue triples (i.e. Figure 7C).
The sequence-based approach presented here is not lim-ited to the HIV protease and its response to drug treat-ment, and should be equally useful in studies of theevolution of drug resistance in other systems. Moreover, itwill be of interest to extend our techniques to other exam-ples of short-term neutral and adaptive evolution, includ-ing controlled evolution in the lab accompanied byprotein sequencing at different timepoints. Recent workhas suggested that evolutionary pathways of proteins arerelatively restricted and may be predictable in general[46], and specific methods for predicting the mutationaldynamics of HIV protease have been proposed, based onBayesian network models [47] or pairwise conditionalselection pressure [5]. A better understanding of thenature of the probabilistic dependencies underlying thenetwork models should lead to improved prediction strat-egies. However, our model cannot distinguish betweenphysical and epistatic origins of the observed co-evolu-tion. To do this, we need a different approach whichwould explicitly introduce protein fitness as a function ofresidue energies (including interactions across protein-protein and protein-ligand interface). These energieswould be fit against the sequence data, resulting in a pre-diction that decomposes observed inter-residue correla-tions into the physical and epistatic parts. This approachis currently being pursued in our laboratories.
MethodsHIV sequence databaseAligned and annotated HIV-1 protease amino acidsequences were obtained using the web interface of theStanford HIV Drug Resistance Database http://hivdb.stanford.edu/cgi-bin/PI_Form.cgi[16]. The sequences are all
classified under the HIV-1 Main group, subtype B. For thepurposes of this paper, we are considering only thenumber of protease inhibitors and not the specific combi-nations of protease inhibitors used in the treatment. Thereare 13,608 sequences in this curated set, of which 8,229sequences are drug naive, 2,677 sequence are associatedwith PI monotherapy, and the remaining 2,702 sequencesare associated with between 2 through 6 protease inhibi-tors.
Calculation of higher-order interactions
For residue triples, we compute by writing the triplet
probability distribution in log-linear form [11]:
where we assign numerical values to the states of A, B and
C, e.g. 0 and 1. We find (A, B, C) by setting λABC = 0
in Equation 5 and fitting the six parameters λi and λij to
the values that maximize the likelihood of the data undera multinomial model [48]. However, in the triplet case itis possible to avoid direct nonlinear optimization: let usrepresent the 8 observed probabilities by the vector
where, e.g. p0m0 = P(A0, Bm, C0). It is sufficient to consideronly the three marginals P(Am), P(Bm), and P(Cm), andthree suitably chosen bivariate marginals, e.g. P(Am, Bm),P(Am, Cm), and P(Bm, Cm), since the remaining 9 bivariatemarginals can be reconstructed as combinations of these:P(Am, B0) = P(Am) - P(Am, Bm), P(A0, Bm) = P(Bm) - P(Am,Bm), P(A0, B0) = 1 - P(Am) - P(Bm) + P(Am, Bm), etc. The sixmarginals can then be written as a matrix equation involv-ing p0:
Since the matrix multiplying p0 is rectangular with dimen-sions 6 × 8, it has a two-dimensional null space, with basisvectors n1 = (1, 0, 0, 0, 0, 0, 0, 0) and n2 = (0, -1, -1, 1, -1,1, 1, -1). Then, any linear combination α1n1 + α2n2 addedto p0 will not change the marginals. However, α1 and α2cannot be chosen independently without violating thenormalization of p0: we must choose α1 = α2 = α. There-
IC( )3
IC( )3
Ic( )3
P A B C A B C AB BC AC ABCA B C AB BC AC ABC( , , ) exp( ),= + + + + + + +λ λ λ λ λ λ λ λ0
(5)
P ( )2
p0 000 00 0 0 0 00 0 0≡ ( , , , , , , , ),p p p p p p p pm m mm m m m mm mmm
(6)
0 0 0 0 1 1 1 1
0 0 1 1 0 0 1 1
0 1 0 1 0 1 0 1
0 0 0 0 0 0 1 1
0 0 0 0 0 1 0 1
0 0 0 1 0 0 0 1
⎛
⎝
⎜⎜⎜⎜⎜⎜⎜⎜
⎞⎞
⎠
⎟⎟⎟⎟⎟⎟⎟⎟
=
⎛
⎝
⎜⎜
p0T
m
m
m
m m
m m
m m
P A
P B
P C
P A B
P A C
P B C
( )
( )
( )
( , )
( , )
( , )
⎜⎜⎜⎜⎜⎜⎜
⎞
⎠
⎟⎟⎟⎟⎟⎟⎟⎟
.
(7)
Page 11 of 14(page number not for citation purposes)
BMC Bioinformatics 2009, 10(Suppl 8):S10 http://www.biomedcentral.com/1471-2105/10/S8/S10
fore, the family of all possible distributions that have thesame univariate and bivariate marginals are mapped outby the parameter α using the relation
where the feasible values of α are constrained by the non-negativity requirement for probabilities. Furthermore,λABC = 0 in Equation 5 implies that
Therefore, to find (A, B, C) it suffices to find the value
of α which satisfies Equation 9:
leading to a cubic equation in α [11].
To obtain the maximum entropy distributions for morethan three binary random variables, nonlinear optimiza-tion is unavoidable. However, instead of directly maxi-mizing the entropy subject to the marginal probabilityconstraints, we maximize the likelihood subject to theconstraints that the λ's vanish beyond a given order [48].In most cases, the latter will be more computationally effi-cient since the number of λ variables grows polynomiallywith the number of variables, while the dimensionality ofthe null space defined by the marginal probability con-straints (which is one-dimensional for three variables)increases exponentially with the number of variables.
In general, we fit data on mutation and wild-type aminoacid counts to the following hierarchy of probabilisticmodels: the independent model P(A, B, C,...) =P(A)P(B)P(C)�, the "two-body" model:
and the "three-body" model:
where λ is the vector of parameters, the indices (i, j) and(i, j, k) run over all distinct combinations of {A, B, C,...}
with i ≠ j and i ≠ j ≠ k, respectively, and I, J, and K arenumerical values of the corresponding random variable(we use 0 for wild-type and 1 for mutant). For an n-variate
distribution P(A, B, C,...) there are n(n - 1)/2 pair param-
eters λij and n(n - 1)(n - 2)/6 three-body parameters λijk (λ0
is a normalization constant). The independent model wasdetermined by forming products of the observed univari-
ate marginals. The magnitudes of the λi and λij parameters
in the two-body model are related to the mutation fre-quencies at site i and pair correlations between sites i and
j, respectively. In fact, the magnitudes of λij in the context
of a two-body model have been proposed as a measure of"direct information", i.e. the part of pair correlationresulting from direct coupling [15]. It should be noted
that the relative magnitudes of λij is dependent on the
choice of the numerical values assigned to the randomvariables I, J and K in Equations 11 and 12. In this work,we assign values of 0 and 1 for wild-type and mutant,respectively, for computational convenience. It has beenargued, however, that a more appropriate choice ofnumerical values is one which is symmetric about zero,e.g. ± 1, which allows "gauge constraints" to be intro-duced [15]. While this choice will affect the the values of
λij and their interpretation as "direct information", it will
not change the best-fit two-body or three-body probabili-ties and consequently will have no impact on the values
of and related measures of higher-order interactions.
The two-body model for n = 3 was fit by solving Equation10 exactly [49]. If no feasible solution of Equation 10
exists, then was set to zero. For n ≥ 4, the unknown
parameters in Equations 11 and 12 were determined bymaximizing the multinomial log-likelihood
where i is one of the 2n states, Ni is the number of times
that state was observed, and P(i|λ) is the predicted proba-bility for state i to be observed given the vector of param-
eters λ. Maximization was performed numerically usingthe "nlm" function of the R software package [50]. Allentropy and connected information values are given innatural log units. Statistical significance of the three-bodyinteractions was estimated using the likelihood ratio testunder the null hypothesis that the data were generated by
(A, B, C) by Monte Carlo sampling. For all of the res-idue triples in Table 1, the p-values for the observed likeli-hood ratio were too small to be estimated (p <<> 10-6),
p pα α= + − − − −0 1 1 1 1 1 1 1 1( , , , , , , , ), (8)
p pmm p mmpm mp m pm p mpmmm000 0 0 00 0 00 00
1= . (9)
P ( )2
( )( )( )( )( )( )( )(p pmm p mm pm mp m pm p m p000 0 0 00 0 00 00
+ + + +− − −α α α αα α α mmmm −
=α)
,1
(10)
P A B C I IJi
i
ij
ij
( , , , ...) exp( ),= + +∑ ∑λ λ λ0 (11)
P A B C I IJ IJKi
i
ij
ij
ijk
ijk
( , , , ...) exp( ),= + + +∑ ∑ ∑λ λ λ λ0
(12)
Ic( )3
Ic( )3
L N P ii
i
( ) ln ( ),λ = ∑ (13)
P ( )2
Page 12 of 14(page number not for citation purposes)
BMC Bioinformatics 2009, 10(Suppl 8):S10 http://www.biomedcentral.com/1471-2105/10/S8/S10
indicating very strong statistical significance for the three-body interaction.
Competing interestsThe authors declare that they have no competing interests.
Authors' contributionsOH and MA wrote software and performed the analyses,and OH, RML, AVM and MA wrote the paper.
Additional material
AcknowledgementsThis work has been supported by a grant from the National Institutes of Health, GM-30580 (to RML) and by an Alfred P Sloan Research Fellowship (to AVM).
This article has been published as part of BMC Bioinformatics Volume 10 Sup-plement 8, 2009: Proceedings of the European Conference on Computa-tional Biology (ECCB) 2008 Workshop: Annotation, interpretation and management of mutations. The full contents of the supplement are available online at http://www.biomedcentral.com/bmcbioinformatics/10?issue=S8.
References1. Swanstrom R, Erona J: Human immunodeficiency virus type-1
protease inhibitors: Thereputic successes and failures, sup-pression and resistance. Pharmacol Ther 2000, 86:145-170.
2. Rambaut A, Posada D, Crandall KA, Holmes EC: The causes andconsequences of HIV evolution. Nat Rev Genet 2004, 5:52-61.
3. Wu TD, Schiffer CA, Gonzales MJ, Taylor J, Kantor R, Chou S, Israel-ski D, Zolopa AR, Fessel WJ, Shafer RW: Mutation patterns andstructural correlates in human immunodeficiency virus type1 protease following different protease inhibitor treatments.J Virol 2003, 77:4836-4847.
4. Hoffman NG, Schiffer CA, Swanstrom R: Covariation of aminoacid positions in HIV-1 protease. Virology 2003, 314:536-548.
5. Chen L, Lee C: Distinguishing HIV-1 drug resistance, acces-sory, and viral fitness mutations using conditional selectionpressure analysis of treated versus untreated patient sam-ples. Biology Direct 2006, 1:14.
6. Rhee SY, Liu TF, Holms SP, Shafer RW: HIV-1 subtype B proteaseand reverse transcriptase amino acid covariation. PLoS Com-put Biol 2007, 3:e87.
7. Wang Q, Lee C: Distinguishing functional amino acid covaria-tion from background linkage disequilibrium in HIV pro-tease and reverse transcriptase. PLoS ONE 2007, 2:e814.
8. Deforche K, Silander T, Camacho R, Grossman Z, Soares MA, VanLaethem K, Kantor R, Moreau Y, Vandamme A-M: Analysis of theHIV-1 pol sequences using Bayesian Networks: implicationsfor drug resistance. Bioinformatics 2006, 22:2975-2979.
9. Svicher V, Ceccherini-Silberstein F, Erba F, Santoro M, Gori C, Belloc-chi MC, Gianella S, Trotta MP, Monforte A, Antinori A, Perno CF:Novel human immunodeficiency virus type 1 protease muta-tions potentially involved in resistance to protease inhibi-tors. Antimicrob Agents Chemother 2005, 49:2015-2025.
10. Liu Y, Eyal E, Bahar I: Analysis of correlated mutations in HIV-1protease using spectral clustering. Bioinformatics 2008,24:1243-1250.
11. Bishop YM, Fienberg SE, Holland PW: Discrete Multivariate Analysis:Theory and Practice The MIT Press; 1975.
12. Schneidman E, Still S, Berry MJ II, Bialek W: Network informationand connected correlations. Phys Rev Lett 2003, 91:238701.
13. Pearl J: Probabilistic Reasoning in Intelligent Systems: Networks of PlausibleInference Morgan Kaufmann Publishers; 1988.
14. Ahn C, Koch GG, Paynter L, Preisser JS, Seillier-Moiseiwitsch F: Log-linear models for mutations in the HIV genome. J Stat Plan Inf2007, 137:3227-3239.
15. Weigt M, White RA, Szurmant H, Hoch JA, Hwa T: Identificationof direct residue contacts in protein-protein interaction bymessage passing. Proc Natl Acad Sci USA 2009, 106:67-72.
16. Kantor R, Betts BJ, Ravela J, Rhee SY, Gonzales MJ, Shafer RW:Human immunodeficiency virus reverse transcriptase andprotease sequence database. Nucleic Acids Res 2003, 31:298-303.
17. Johnson VA, Brun-Vézinet F, Clotet B, Günthard HF, Kuritzkes DR,Pillay D, Schapiro JM, Richman DD: Update of the drug resistancemutations in HIV-1: December 2008. Topics in HIV Medicine2008, 16:138-145.
18. Clemente JC, Hemrajani R, Blum LE, Goodenow MM, Dunn BM: Sec-ondary mutations M36I and A71V in the human immunode-ficiency virus type 1 protease can provide an advantage ofthe emergence of the primary mutation D30N. Biochemistry2003, 42:15029-15035.
19. Muzammil S, Ross P, Freire E: A major role for a set of non-activesite mutations in the development of HIV-1 protease drugresistance. Biochemistry 2003, 42:631-638.
20. Shafer RW, Dupnik K, Winters MA, Eshleman SH: A guide to HIV-1 reverse transcriptase and protease sequencing for drugresistance studies. In Human retroviruses and AIDS, theoretical biol-ogy and biophysics Los Alamos, NM: Los Alamos National Laboratories;2001:1-51.
21. Rhee SY, Taylor J, Wadhera G, Ben-Hur A, Brutlag DL, Shafer RW:Genotypic predictors of human immunodeficiency virus type1 drug resistance. Proc Natl Acad Sci USA 2006, 103:17355-17360.
22. Shafer RW, Schapiro JM: HIV-1 drug resistance mutations: Anupdated framework for the second decade of HAART. AIDSRev 2008, 10:67-84.
23. Shafer RW, Rhee SY, Pillay D, Miller V, Sandstrom P, Schapiro JM,Kuritzkes DR, Bennett D: HIV-1 protease and reverse tran-
Additional File 1Mutation frequencies for selected positions in the HIV protease as a function of the number of PIs the patient was exposed to. Data is shown for residues 10 (black, solid line), 54 (red, solid line), 90 (green), 71 (blue), 46 (orange), 77 (black, dashed line), and 35 (red, dashed line).Click here for file[http://www.biomedcentral.com/content/supplementary/1471-2105-10-S8-S10-S1.pdf]
Additional File 2Predicted vs observed probabilities for the 210 mutational states of the ten-residue group 20-32-46-48-53-54-58-74-82-90 in HIV protease for the PI2+ cohort. Mutational states that were unobserved in the data-base and would have an observed probability maximum likelihood esti-mate of zero are not shown. The black dots correspond to the best-fit independent model, the red dots correspond to the best-fit pair-term model (Equation 11), and the green dots correspond to the best-fit three-body model (Equation 12). The solid line of slope 1 corresponds to perfect agreement of the predicted data with the observed, which would be obtained if all higher-order terms were included.Click here for file[http://www.biomedcentral.com/content/supplementary/1471-2105-10-S8-S10-S2.pdf]
Additional File 3Scatterplot of distance vs λij parameters estimated using I and J values of ± 1 as described in the Methods for the 15-residue group 10-20-33-36-46-54-55-63-71-73-74-82-84-90-93 in the PI2+ cohort. The value along the y-axis is the closest distance between any two heavy atoms of the two residues based on the crystal structure of wild type protease (PDB ID 1PRO).Click here for file[http://www.biomedcentral.com/content/supplementary/1471-2105-10-S8-S10-S3.pdf]
Page 13 of 14(page number not for citation purposes)
BMC Bioinformatics 2009, 10(Suppl 8):S10 http://www.biomedcentral.com/1471-2105/10/S8/S10
Publish with BioMed Central and every scientist can read your work free of charge
"BioMed Central will be the most significant development for disseminating the results of biomedical research in our lifetime."
Sir Paul Nurse, Cancer Research UK
Your research papers will be:
available free of charge to the entire biomedical community
peer reviewed and published immediately upon acceptance
cited in PubMed and archived on PubMed Central
yours — you keep the copyright
Submit your manuscript here:http://www.biomedcentral.com/info/publishing_adv.asp
BioMedcentral
scriptase mutations for drug resistance surveillance. AIDS2007, 21:215-223.
24. Hertogs K, Bloor S, Kemp SD, Van de Eynde C Van den, Alcorn TM,Pauwels R, Van Houtte M, Staszewski S, Miller V, Larder BA: Pheno-typic and genotypic analysis of clinical HIV-1 isolates revealsextensive protease inhibitor cross-resistance: A survey ofover 6000 samples. AIDS 2000, 14:1203-1210.
25. Ohtaka H, Schon A, Freire E: Multidrug resistance to HIV-1 pro-tease inhibition requires cooperative coupling between dis-tal mutations. Biochemistry 2003, 42:13659-13666.
26. Johnson VA A, Brun-Vézinet F, Clotet B, Günthard HF F, KuritzkesDR R, Pillay D, Schapiro JM M, Richman DD D: Update of the drugresistance mutations in HIV-1 2007. Topics in HIV Medicine 2007,15:119-125.
27. Pollock DD, Taylor WR, Goldman N: Coevolving proteing resi-dues: Maximum likelihood indentification and relationship tostructure. Journal of Molecular Biology 1999, 287:187-198.
28. Tiller ERM, Lui TWH: Using muliple interdependency to sepa-rate functional from phylogenetic correlations in proteinalignments. Bioinformatics 2003, 19:750-755.
29. Gloor GB, Martin LC, Wahl LM, Dunn SM: Mutual information inprotein multiple sequence alignments reveals two classes ofcoevolving positions. Biochemistry 2005, 44:7156-7165.
30. Flares MA, Travers SAA: A novel method for detectingintramolecular co-evolution: Adding a further dimension toselective constraints analyses. Genetics 2006, 173:9-23.
31. Perez-Jimenez R, Godoy-Ruiz R, Parody-Morreale A, Ibarra-MoleroB, Sanchez-Ruiz JM: A simple tool to explore the distance dis-tribution of correlated mutations in proteins. Biophys Chem2006, 119:240-246.
32. Fodor AA, Aldrich RW: Influence of conservation on calcula-tions of amino acid covariance in multiple sequence align-ments. Proteins 2004, 56:211-221.
33. Nijhuis M, Schuurman R, de Jong D, Erickson J, Gustchina E, Albert J,Schipper P, Gulnik S, Boucher CAB: Increased fitness of drugresistant HIV-1 protease as a result of acquisition of compen-satory mutations during suboptimal therapy. AIDS 1999,13:2349-2359.
34. Perno CF, Cozzi-Lepri A, Balotta C, Forbici F, Violin M, Bertoli A, Fac-chi G, Pezzotti P, Cadeo G, Tositti G, Pasquinucci S, Pauluzzi S,Scalzini A, Salassa B, Vincenti A, Phillips A, Dianzani F, Appice A, Anga-rano G, Monno L, Ippolito G, Moroni M, Monforte A, Italian CohortNaive Antiretroviral (I.CO.N.A.) Study Groupa: Secondary muta-tions in the protease region of human immunodeficiencyvirus and virologic failure in drug-naive patients treated withprotease inhibitor-based therapy. The Journal of Infectious Dis-eases 2001, 184:983-991.
35. Piana S, Carloni P, Rothlisberger U: Drug resistance in HIV-1 pro-tease: Flexibility-assisted mechanism of compensatorymutations. Protein Science 2002, 11:2393-2402.
36. Sugiura W, Matsuda Z, Yokomaku Y, Hertogs K, Larder B, Oishi T,Okano A, Shiino T, Tatsumi M, Matsuda M, et al.: Interferencebetween D30N and L90M in selection and development ofprotease inhibitor-resistant human immunodeficiency virustype 1. Antimicrob Agents Chemother 2002, 46(3):708-715.
37. Schneidman E, Berry MJ II, Segev R, Bialek W: Weak pairwise cor-relations imply strongly correlated network states in a neu-ral population. Nature 2006, 440:1007-1012.
38. Durbin R, Eddy S, Krogh A, Mitchison G: Biological Sequence AnalysisCambridge University Press; 1998.
39. Gower JC: Measures of Similarity, Dissimilarity, Distance, Encyclopedia ofStatistical Sciences 1985, 5:397-405.
40. Matsuda H: Physical nature of higher-order mutual informa-tion: Intrinsic correlations and frustration. Phys Rev E 2000,62:3096-3102.
41. Gilbert PB, Novitsky V, Essex M: Covariability of selected aminoacid positions for HIV type 1 subtypes C and B. AIDS Res.Human Retrovir 2005, 21:1016-1030.
42. Patick AK, Duran M, Cao Y, Shugarts D, Keller MR, Mazabel E, Know-les M, Chapman S, Kuritzkes DR, Markowitz M: Genotypic andphenotypic characterization of human immunodeficiencyvirus type 1 variants isolated from patients treated with theprotease inhibitor nelfinavir. Antimicrob Agents Chemother 1998,42:2637-2644.
43. Steve W: Lockless and Rama Ranganathan. Evolutionarilyconserved pathways of energetic connectivity in proteinfamilies. Science 1999, 286:295-299.
44. Mustonen V, Kinney J Jr, Callan CG, Lässig M: Energy-dependentfitness: A quantitative model for the evolution of yeast tran-scription factor binding sites. Proc Natl Acad Sci USA 2008,105:12376-12381.
45. DePristo MA, Weinreich DM, Hartl DL: Missense meanderings insequence space: A biophysical view of protein evolution. NatRev Genet 2005, 6:678-687.
46. Weinreich DM, Delaney NF, DePristo MA, Hartl DL: Darwinianevolution can follow only very few mutational paths to fitterproteins. Science 2006, 312:111-114.
47. Deforche K, Camacho R, Van Laethem K, Lemey P, Rambaut A,Moreau Y, Vandamme A-M: Estimation of an in vivo fitness land-scape experienced by HIV-1 under drug selective pressureuseful for prediction of drug resistance evolution duringtreatment. Bioinformatics 2008, 24:34-41.
48. Good IJ: Maximum entropy for hypothesis formulation, espe-cially for multidimensional contingency tables. Ann Math Stat1963, 34:911-934.
49. Press WH, Teukolsky SA, Vetterling WT, Flannery BP: Numerical Rec-ipes in C: The Art of Scientific Computing Cambridge University Press, Cam-bridge; 1992.
50. R Development Core Team: R: A Language and Environment for Statis-tical Computing R Foundation for Statistical Computing, Vienna, Austria;2005.
Page 14 of 14(page number not for citation purposes)
http://www.ncbi.nlm.nih.gov/entrez/query.fcgi?cmd=Retrieve&db=PubMed&dopt=Abstract&list_uids=9756769
http://www.ncbi.nlm.nih.gov/entrez/query.fcgi?cmd=Retrieve&db=PubMed&dopt=Abstract&list_uids=9756769