BM Manage F/A 19/9 - Department of Education and · PDF fileTeacher sick leave in P–12...
52
Office of Review BENCHMARKS 96
Transcript of BM Manage F/A 19/9 - Department of Education and · PDF fileTeacher sick leave in P–12...

O f f i c e o f R e v i e w
BENC
HMAR
KS 9
6
2
© State of Victoria
Department of Education, Victoria, 1997
ISBN 0 7306 8995 6 (set)
0 7306 8999 9
The Department of Education welcomes any use
of this publication within the constraints of the
Copyright Act. Provided acknowledgment is made
to the source, Victorian government and non
government schools are permitted to copy
material freely for the purpose of teaching
students in schools, or for communication with
parents and others in the community. When a
charge is authorised for supplying material, such
charge shall be limited to direct costs only. When
the material is to be sold for profit, then written
authority must first be obtained.
Detailed requests for uses not specifically permit-
ted by the Copyright Act should be submitted in
writing to the Copyright Officer, Department of
Education, GPO Box 4367, Melbourne Vic 3001,
Australia.
Published by the Community Information Service,
Department of Education, GPO Box 4367,
Melbourne Vic 3001, Australia.
3
ContentsPage
1. Introduction 9
2. School performance benchmarks 1997 10
2.1 Data interpretation 11
3. Management information 12
4. Primary schools 13
4.1 Curriculum 13
4.1.1 Time allocation 13
4.2 Environment 15
4.2.1 Student absence 15
4.2.2 Student accidents 16
4.3 Management 17
4.3.1 Staff survey 17
4.3.2 Teacher sick leave 19
4.3.3 Professional development information 20
5. Secondary schools 21
5.1 Curriculum 21
5.1.1 Time allocation 21
5.1.2 Destination of exit students 22
5.2 Environment 27
5.2.1 Student absence 27
5.2.2 Student accidents 28
5.3 Management 28
5.3.1 Staff survey 28
5.3.2 Teacher sick leave 31
5.3.3 Professional development information 32
4
6. Primary–secondary (P–12) colleges 33
6.1 Curriculum 33
6.1.1 Time allocation 33
6.2 Environment 36
6.2.1 Student absence 36
6.2.2 Student accidents 37
6.3 Management 38
6.3.1 Staff survey 38
6.3.2 Teacher sick leave 39
6.3.3 Professional development information 39
7. Special schools 40
7.1 Curriculum 40
7.1.1 Time allocation 40
7.2 Environment 42
7.2.1 Student absence 42
7.2.2 Student accidents 42
7.3 Management 43
7.3.1 Staff survey 43
7.3.2 Teacher sick leave 44
7.3.3 Professional development information 44
8. Special developmental schools 45
8.1 Curriculum 45
8.1.1 Time allocation 45
8.2 Environment 47
8.2.1 Student absence 47
8.2.2 Student accidents 47
8.3 Management 48
8.3.1 Staff survey 48
8.3.2 Teacher sick leave 49
8.3.3 Professional development information 49
5
List of figures
Figure 1. Average time allocated to KLAs by primary schools, Prep–Year 2 14
Figure 2. Average time allocated to KLAs by primary schools, Years 3 and 4 14
Figure 3. Average time allocated to KLAs by primary schools, Years 5 and 6 15
Figure 4. Total student absence, all year levels 16
Figure 5. Staff survey means 1996: Quality of work life, primary schools 18
Figure 6. Staff survey means 1996: Morale, primary schools 18
Figure 7. Staff survey means 1996: Leadership, primary schools 18
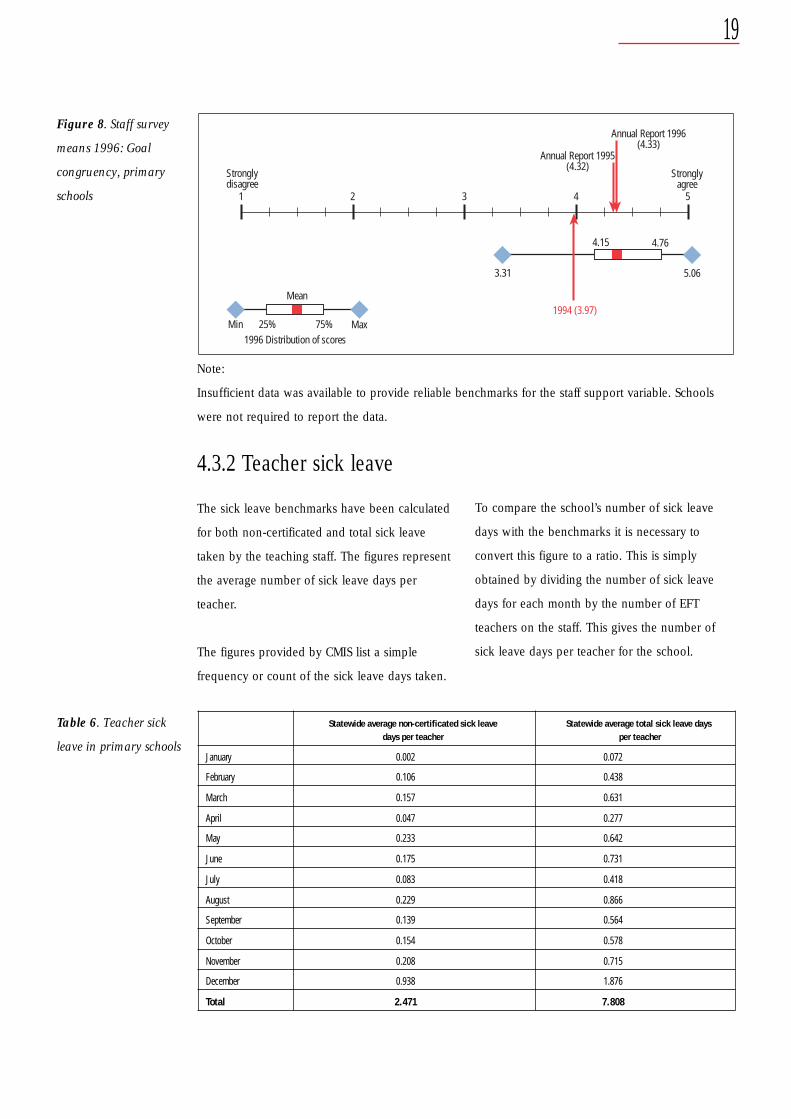
Figure 8. Staff survey means 1996: Goal congruency, primary schools 19
Figure 9. Average time allocated to KLAs by secondary colleges, Years 7 and 8 22
Figure 10. Destination of exit Year 10 students 23
Figure 11. Destinations of exit Year 11 students 23
Figure 12. Destinations of exit Year 12 students 24
Figure 13. Destination of Year 12 students: statewide—all students 24
Figure 14. Destination of Year 12 students: statewide—by region 25
Figure 15. Destination of Year 12 students: statewide—by “like” school group 26
Figure 16. Total student absence, all year levels 27
Figure 17. Staff survey means 1996: Quality of work life, secondary schools 29
Figure 18. Staff survey means 1996: Morale, secondary schools 30
Figure 19. Staff survey means 1996: Leadership, secondary schools 30
Figure 20. Staff survey means 1996: Goal congruency, secondary schools 30
Figure 21. Average time allocated to KLAs by P–12 colleges, Prep–Year 2 34
Figure 22. Average time allocated to KLAs by P–12 colleges, Years 3 and 4 34
Figure 23. Average time allocated to KLAs by P–12 colleges, Years 5 and 6 35
Figure 24. Average time allocated to KLAs by P–12 colleges, Years 7 and 8 35
Figure 25. Total student absence, all year levels 36
Figure 26. Staff opinion survey means 1996: P–12 colleges 38
Figure 27. Average time allocated to KLAs by special schools, Prep–Year 6 41
6
List of tables
Figure 28. Average time allocated to KLAs by special schools, Years 7–10 41
Figure 29. Staff opinion survey means 1996: special schools 43
Figure 30. Average time allocated to KLAs by special developmental schools, Prep–Year 6 46
Figure 31. Average time allocated to KLAs by special developmental schools, Years 7–10 46
Figure 32. Staff opinion survey means 1996: special developmental schools 48
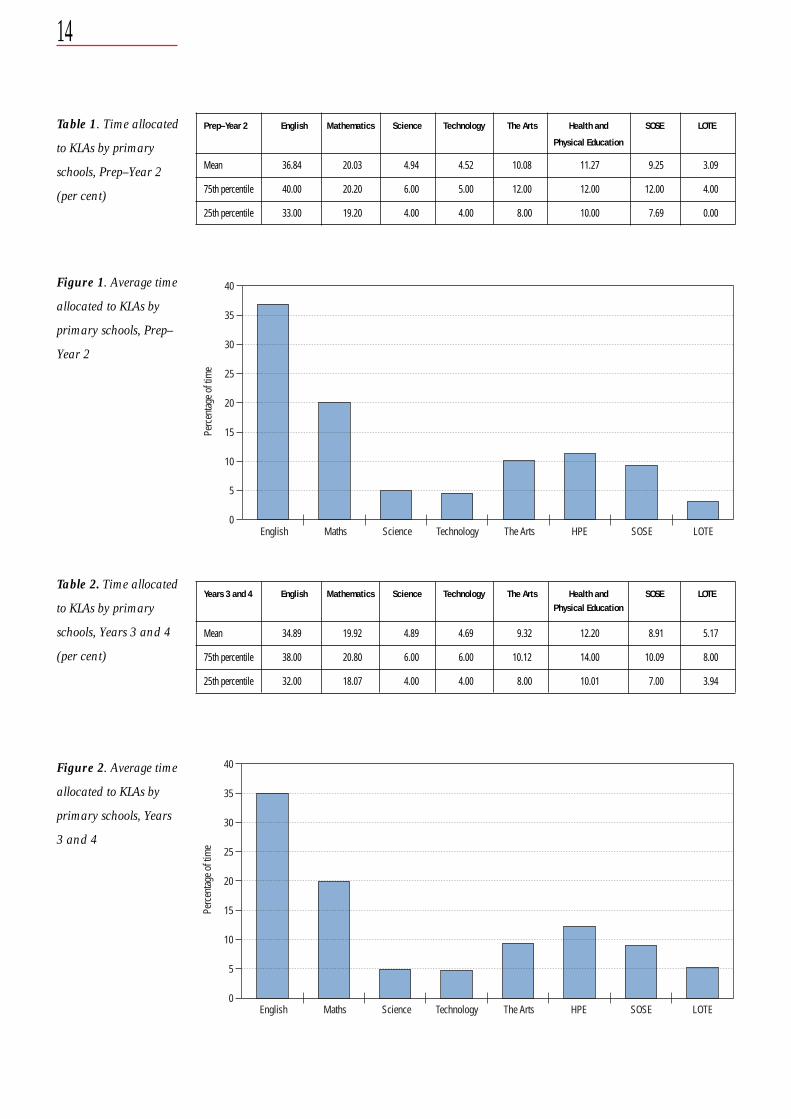
Table 1. Time allocated to KLAs by primary schools, Prep–Year 2 (per cent) 14
Table 2. Time allocated to KLAs by primary schools, Years 3 and 4 (per cent) 14
Table 3. Time allocated to KLAs by primary schools 1996, Years 5 and 6 (per cent) 15
Table 4. Average number of student days absent, all year levels 15
Table 5. Student accidents in primary schools (per 100 students) 16
Table 6. Teacher sick leave in primary schools 19
Table 7. Professional development in primary schools 20
Table 8. Time allocated to KLAs by secondary colleges, Years 7 and 8 (per cent) 22
Table 9. Destination of students—exit Year 10 (per cent) 23
Table 10. Destination of students—exit Year 11 (per cent) 23
Table 11. Destination of students—exit Year 12, prior to completion of the year (per cent) 24
Table 12. Destination of Year 12 students: statewide—all students (per cent) 24
Table 13. Destination of Year 12 students: statewide—by region (per cent) 25
Table 14. Destination of Year 12 students: statewide—by “like” school group (per cent) 26
Table 15. Average number of student days absent, all year levels 27
Table 16. Student accidents in secondary colleges (per 100 students) 28
Table 17. Teacher sick leave in secondary colleges 31
Table 18. Professional development in secondary colleges 32
Table 19. Time allocated to KLAs by P–12 colleges, Prep–Year 2 (per cent) 34
Table 20. Time allocated to KLAs by P–12 colleges, Years 3 and 4 (per cent) 34
Table 21. Time allocated to KLAs by P–12 colleges, Years 5 and 6 (per cent) 35
Table 22. Time allocated to KLAs by P–12 colleges, Years 7 and 8 (per cent) 35
7
Table 23. Average number of student days absent, all year levels 36
Table 24. Student accidents in P–12 colleges (per 100 students) 37
Table 25. Teacher sick leave in P–12 colleges 39
Table 26. Professional development in P–12 colleges 39
Table 27. Parent opinion of student educational progress: special schools (per cent) 40
Table 28. Time allocated to KLAs by special schools, Prep–Year 6 (per cent) 41
Table 29. Time allocated to KLAs by special schools, Years 7–10 (per cent) 41
Table 30. Average number of student days absent, sample specialist schools survey 42
Table 31. Student accidents in special schools (per 100 students) 42
Table 32. Teacher sick leave in special schools 44
Table 33. Professional development in special schools 44
Table 34. Parent opinion of student educational progress: special developmental schools (per cent) 45
Table 35. Time allocated to KLAs by special developmental schools, Prep–Year 6 (per cent) 46
Table 36. Time allocated to KLAs by special developmental schools, Years 7–10 (per cent) 46
Table 37. Average number of student days absent, sample specialist schools survey 47
Table 38. Student accidents in special developmental schools (per 100 students) 47
Table 39. Teacher sick leave in special developmental schools 49
Table 40. Professional development in special developmental schools 49

8
9
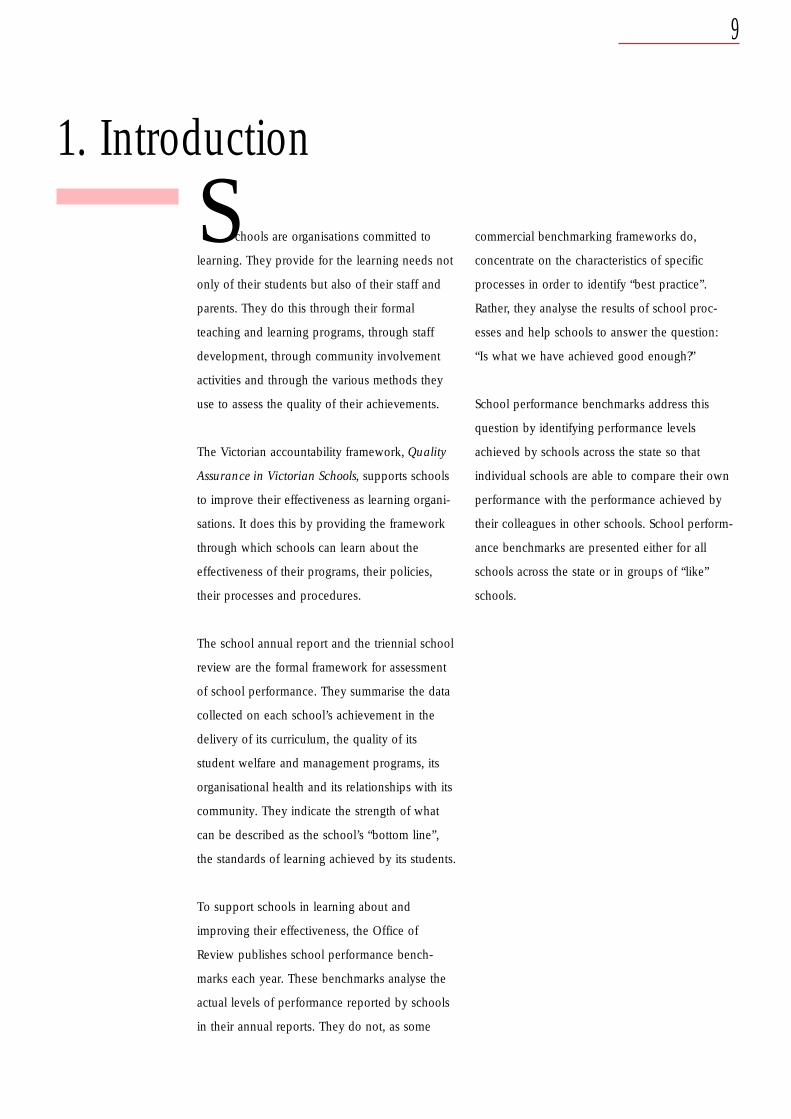
1. Introduction
Schools are organisations committed to
learning. They provide for the learning needs not
only of their students but also of their staff and
parents. They do this through their formal
teaching and learning programs, through staff
development, through community involvement
activities and through the various methods they
use to assess the quality of their achievements.
The Victorian accountability framework, Quality
Assurance in Victorian Schools, supports schools
to improve their effectiveness as learning organi-
sations. It does this by providing the framework
through which schools can learn about the
effectiveness of their programs, their policies,
their processes and procedures.
The school annual report and the triennial school
review are the formal framework for assessment
of school performance. They summarise the data
collected on each school’s achievement in the
delivery of its curriculum, the quality of its
student welfare and management programs, its
organisational health and its relationships with its
community. They indicate the strength of what
can be described as the school’s “bottom line”,
the standards of learning achieved by its students.
To support schools in learning about and
improving their effectiveness, the Office of
Review publishes school performance bench-
marks each year. These benchmarks analyse the
actual levels of performance reported by schools
in their annual reports. They do not, as some
commercial benchmarking frameworks do,
concentrate on the characteristics of specific
processes in order to identify “best practice”.
Rather, they analyse the results of school proc-
esses and help schools to answer the question:
“Is what we have achieved good enough?”
School performance benchmarks address this
question by identifying performance levels
achieved by schools across the state so that
individual schools are able to compare their own
performance with the performance achieved by
their colleagues in other schools. School perform-
ance benchmarks are presented either for all
schools across the state or in groups of “like”
schools.
10
2. School performance benchmarks 1997
I n 1997, the Office of Review is providing
school performance benchmarks in the following
areas:
• student achievement in the Victorian Certifi-
cate of Education (VCE)
• student achievement in the years Prep–10
• time allocated to each KLA by year level
• student absence rates
• student post-school destinations, exit Years 10,
11 and 12
• staff opinion
• staff absence rates
• staff participation in professional development
• student accidents by location and severity
• student apparent retention.
With time, school performance benchmarks will
develop in sophistication. Data will be available
on student achievement by gender and will also
include the achievement levels of Aboriginal and
Torres Strait Islander students, students whose
parents qualify for the Educational Maintenance
Allowance or Austudy and students who speak a
language other than English at home. It is
expected that national and international bench-
marks will also become available.
Schools can also learn about their effectiveness
by comparing their current performance levels
with their own past performance. The school
charter then enables schools to plan for improved
achievements in key areas of their operations and
to set challenging performance expectations for
themselves.
11
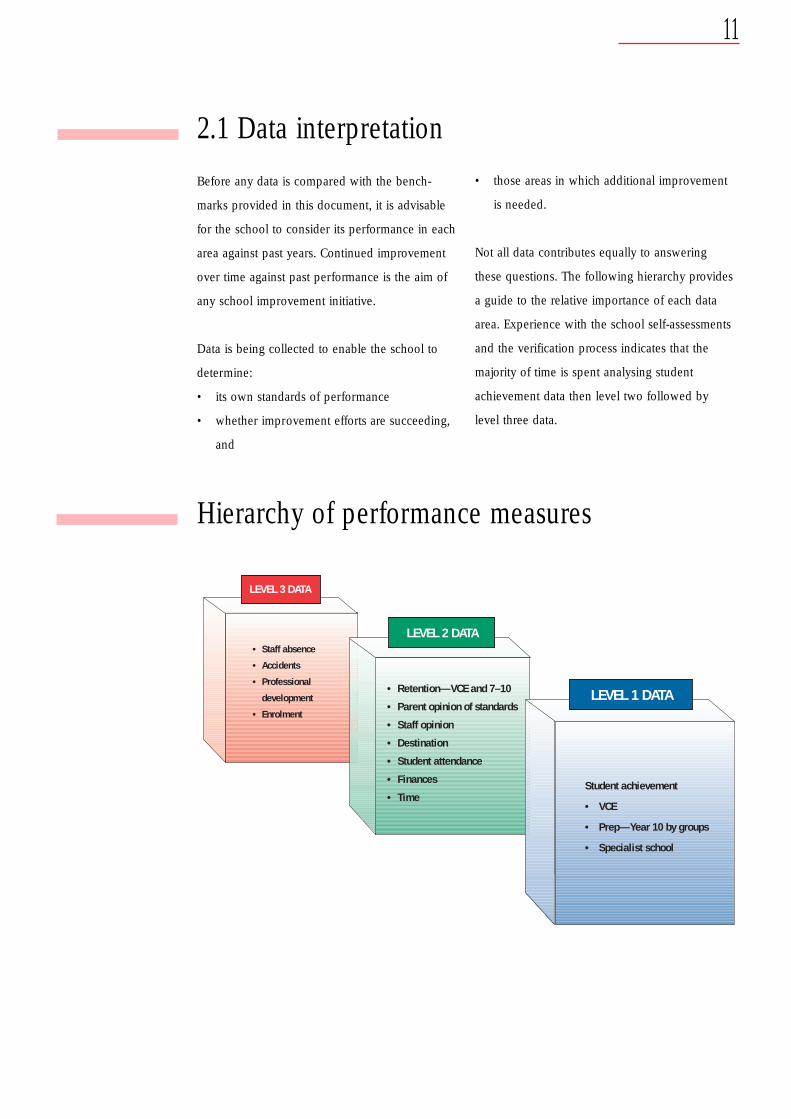
2.1 Data interpretation
Hierarchy of performance measures
Before any data is compared with the bench-
marks provided in this document, it is advisable
for the school to consider its performance in each
area against past years. Continued improvement
over time against past performance is the aim of
any school improvement initiative.
Data is being collected to enable the school to
determine:
• its own standards of performance
• whether improvement efforts are succeeding,
and
• those areas in which additional improvement
is needed.
Not all data contributes equally to answering
these questions. The following hierarchy provides
a guide to the relative importance of each data
area. Experience with the school self-assessments
and the verification process indicates that the
majority of time is spent analysing student
achievement data then level two followed by
level three data.
• Staff absence
• Accidents
• Professional
development
• Enrolment
• Retention—VCE and 7–10
• Parent opinion of standards
• Staff opinion
• Destination
• Student attendance
• Finances
• Time
LEVEL 1 DATA
Student achievement
• VCE
• Prep—Year 10 by groups
• Specialist school
LEVEL 2 DATA
LEVEL 3 DATA
12
3. Management information
Management information refers to
data collected in the following areas:
• the opinion of staff on the organisational
health of the school
• absence rates for students
• staff sick leave
• time allocated to the eight key learning areas
(KLAs)
• destination of exit students in Years 10, 11
and 12
• student accidents
• staff participation in professional development.
These benchmarks should be read in conjunction
with three other publications:
• Victorian Certificate of Education:
Benchmarks 96
• Years Prep to 10, Curriculum and Standards
Framework: Benchmarks 96
• Year 11–12 Retention: Benchmarks 96.
Benchmarks on school management have been
provided for each of the following school types:
• primary schools
• secondary colleges
• P–12 colleges
• special schools
• special developmental schools.
For each school type the information has been
grouped according to the goal areas in the school
charter—curriculum, management, environment
and resources.
13
4. Primary schools
4.1 CurriculumThe curriculum goals are the most important
section of the school charter because the learning
of students is the prime purpose of schooling.
The time that a school allocates to each of the
eight KLAs underpins the ultimate performance of
students in each learning area.
Both staff and student absence rates have been
included.
4.1.1 Time allocation
Time allocation relates to the percentage of time
in the average twenty-five hour school week that
students spend on learning in each of the eight
KLAs. Secondary colleges use the timetable to
estimate the time allocated to each KLA and
primary schools use an estimated time in the
context of the integrated curriculum. This data
was entered into school annual reports and forms
the basis for generating the benchmarks.
The following tables provide benchmark informa-
tion for the mean, or average, percentage time
allocated to each KLA for all primary schools. The
tables also provide the time allocated to each
KLA by the schools at the 25th and 75th percentile.
Fifty per cent of schools fall between the 25th and
75th percentile.
The mean percentage time allocation is illustrated
in the graphs.
Ten per cent of time equals 2.5 hours.
To convert time allocation to a percentage, divide
the time allocated to each KLA by the total
timetabled time in a week and multiply this by
one hundred.
ExampleEnglish (6 hours)
Total week time (25 hours)X 100 = 24%
14
Table 1. Time allocated
to KLAs by primary
schools, Prep–Year 2
(per cent)
Figure 1. Average time
allocated to KLAs by
primary schools, Prep–
Year 2
0
5
10
15
20
25
30
35
40
Perc
entag
e of t
ime
English TechnologyMaths Science The Arts HPE SOSE LOTE
Table 2. Time allocated
to KLAs by primary
schools, Years 3 and 4
(per cent)
Years 3 and 4 English Mathematics Science Technology The Arts Health and SOSE LOTE
Mean 34.89 19.92 4.89 4.69 9.32 12.20 8.91 5.17
75th percentile 38.00 20.80 6.00 6.00 10.12 14.00 10.09 8.00
25th percentile 32.00 18.07 4.00 4.00 8.00 10.01 7.00 3.94
Prep–Year 2 English Mathematics Science Technology The Arts Health and SOSE LOTE
Mean 36.84 20.03 4.94 4.52 10.08 11.27 9.25 3.09
75th percentile 40.00 20.20 6.00 5.00 12.00 12.00 12.00 4.00
25th percentile 33.00 19.20 4.00 4.00 8.00 10.00 7.69 0.00
Figure 2. Average time
allocated to KLAs by
primary schools, Years
3 and 4
0
5
10
15
20
25
30
35
40
Perc
entag
e of t
ime
English TechnologyMaths Science The Arts HPE SOSE LOTE
Physical Education
Physical Education

15
Years 5 and 6 English Mathematics Science Technology The Arts Health and SOSE LOTE
Mean 33.13 19.92 4.79 4.78 8.85 12.76 9.02 6.75
75th percentile 36.00 20.92 6.00 6.00 10.00 14.00 11.94 8.33
25th percentile 30.00 18.00 4.00 4.00 8.00 12.00 6.59 4.00
Table 3. Time allocated
to KLAs by primary
schools, Years 5 and 6
(per cent)
Figure 3. Average time
allocated to KLAs by
primary schools, Years
5 and 6
0
5
10
15
20
25
30
35
40
Perc
entag
e of t
ime
English TechnologyMaths Science The Arts HPE SOSE LOTE
4.2 Environment4.2.1 Student absence
Student absence data for 1996 summarises
absence entered into CASES for the year and
included in the annual report. This is in contrast
to the 1995 data which was provided for two
sample months. The data presented is the
average number of days absent for 1996 for all
students at each year level. The 25th and 75th
percentiles are also presented. Fifty per cent of
students fall into this range.
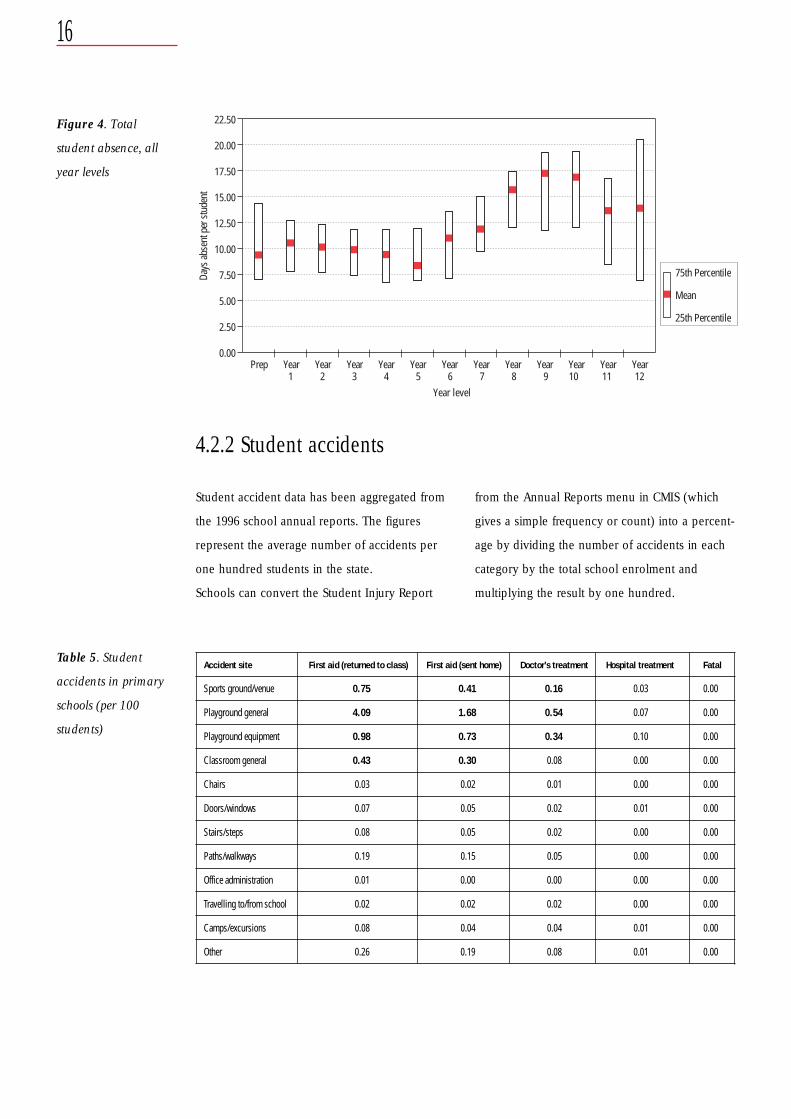
Table 4. Average
number of student days
absent, all year levels
Year level Prep Year 1 Year 2 Year 3 Year 4 Year 5 Year 6 Year 7 Year 8 Year 9 Year 10 Year 11 Year 12
Average 9.4 10.70 10.29 9.98 9.48 8.69 11.16 11.97 15.87 17.17 16.83 13.62 13.86days absent
25th 6.78 8.08 7.85 7.39 6.70 6.84 7.15 9.79 11.72 11.74 11.77 8.72 6.79percentile
75th 14.26 12.82 12.16 11.75 11.66 11.72 13.60 14.88 17.39 19.05 19.24 16.55 20.53percentile
Ten days absence per year is equivalent to 5.1
per cent of the school year.
Physical Education
16
Days
abse
nt p
er st
uden
t
Prep Year Year Year Year Year Year Year Year Year Year Year Year1 2 3 4 5 6 7 8 9 10 11 12
22.50
20.00
17.50
15.00
12.50
10.00
7.50
5.00
2.50
0.00
Year level
75th Percentile
Mean
25th Percentile
Figure 4. Total
student absence, all
year levels
4.2.2 Student accidents
Student accident data has been aggregated from
the 1996 school annual reports. The figures
represent the average number of accidents per
one hundred students in the state.
Schools can convert the Student Injury Report
from the Annual Reports menu in CMIS (which
gives a simple frequency or count) into a percent-
age by dividing the number of accidents in each
category by the total school enrolment and
multiplying the result by one hundred.
Table 5. Student
accidents in primary
schools (per 100
students)
Accident site First aid (returned to class) First aid (sent home) Doctor’s treatment Hospital treatment Fatal
Sports ground/venue 0.75 0.41 0.16 0.03 0.00
Playground general 4.09 1.68 0.54 0.07 0.00
Playground equipment 0.98 0.73 0.34 0.10 0.00
Classroom general 0.43 0.30 0.08 0.00 0.00
Chairs 0.03 0.02 0.01 0.00 0.00
Doors/windows 0.07 0.05 0.02 0.01 0.00
Stairs/steps 0.08 0.05 0.02 0.00 0.00
Paths/walkways 0.19 0.15 0.05 0.00 0.00
Office administration 0.01 0.00 0.00 0.00 0.00
Travelling to/from school 0.02 0.02 0.02 0.00 0.00
Camps/excursions 0.08 0.04 0.04 0.01 0.00
Other 0.26 0.19 0.08 0.01 0.00
17
4.3 Management
4.3.1 Staff survey
The staff opinion survey provides schools with
a succinct summary of their overall organisational
health. It was designed to be administered once
every year to obtain feedback from staff.
Over the past three years schools have used a
Microsoft Works program to collate the staff opinion
survey results. The benchmarks included in the
survey module were derived from work undertaken
by Dr Peter Hill in 1994 for the Victorian Quality
Schools Project.
During 1995 and 1996 schools conducted the staff
survey as a part of the annual reporting require-
ments. Benchmarks compiled from this data are
now available and are also reported in this
document.
There is variation between the average scores on
each of the scales measured in 1994 by the
Victorian Quality Schools Project and those
reported in school annual reports. In all cases the
1994 scores are lower than those from the annual
reports for both 1995 and 1996.
The benchmarks in this section represent the full
distribution of results from the 1996 annual
reports.
Note:
The CASES survey module, due for release to
schools at the end of Term 3, 1997 has a slightly
modified benchmarking system. The system will
scale a school’s past years benchmarks into the
new system. Advice on the new system will
accompany the release of the survey module. The
new benchmarking system will allow schools to
benchmark their performance with schools in
other Australian states and eventually with
schools from other countries.
Interpretation of the staff survey• The first point of comparison is against the
school’s own past performance. Have the
results remained relatively constant or is there
an upward or downward trend?
• Comparison of the school score to the state
range of means. The best point of comparison
at this point would appear to be the 1995 and
1996 annual report means. The consistency of
these scores over the two years would suggest
that they provide a better reference point than
the data from 1994.
• For 1996 the distribution of all schools in the
sample is also provided. Does the school
score fall in the bottom 25 per cent, the
middle 50 per cent or the upper 25 per cent?
• As always professional judgement is required
in the interpretation of the school data.
18
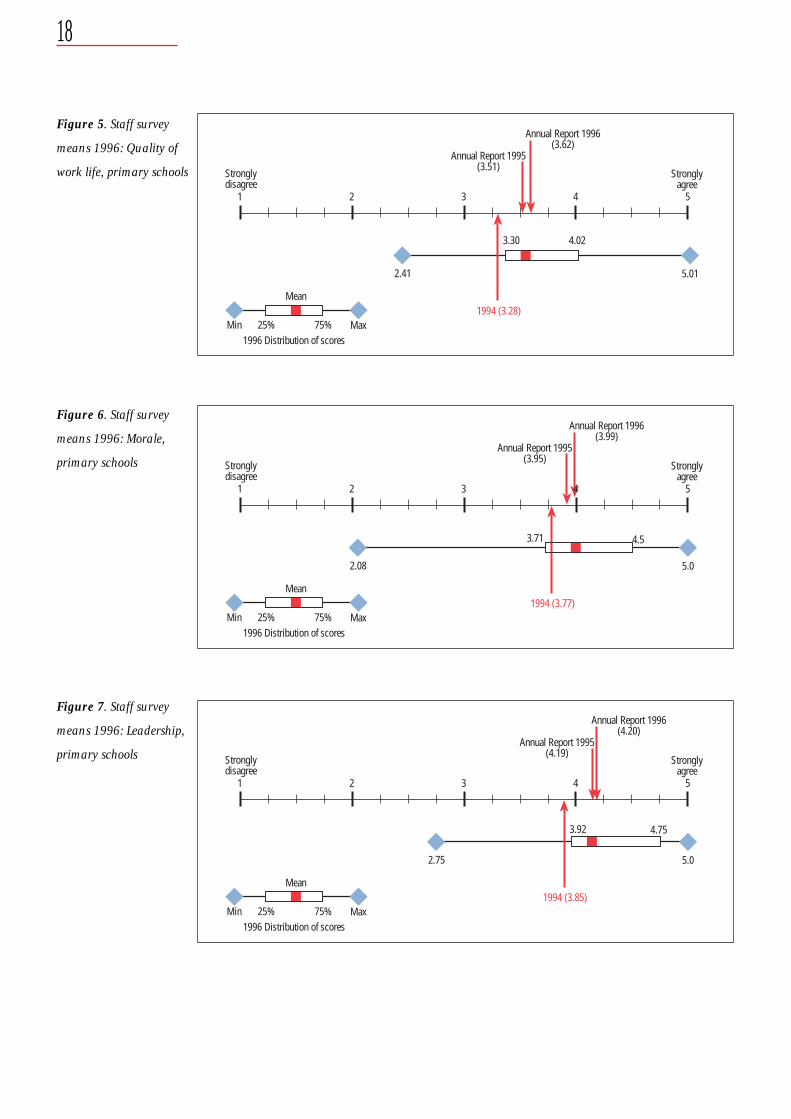
Figure 5. Staff survey
means 1996: Quality of
work life, primary schools
1 2 3 4 5
Stronglydisagree
Stronglyagree
2.41 5.01
3.30 4.02
Annual Report 1995(3.51)
Annual Report 1996(3.62)
1994 (3.28)Min 25% 75% Max
1996 Distribution of scores
Mean
Figure 6. Staff survey
means 1996: Morale,
primary schools
Figure 7. Staff survey
means 1996: Leadership,
primary schools
Min 25% 75% Max1996 Distribution of scores
Stronglydisagree
Stronglyagree
2.08 5.0
3.71 4.5
Annual Report 1995(3.95)
Annual Report 1996(3.99)
1994 (3.77)Mean
1 2 3 4 5
Min 25% 75% Max1996 Distribution of scores
1 2 3 4 5
Stronglydisagree
Stronglyagree
2.75 5.0
3.92 4.75
Annual Report 1995(4.19)
Annual Report 1996(4.20)
1994 (3.85)Mean
19
Figure 8. Staff survey
means 1996: Goal
congruency, primary
schools
Min 25% 75% Max1996 Distribution of scores
1 2 3 4 5
Stronglydisagree
Stronglyagree
3.31 5.06
4.15 4.76
Annual Report 1995(4.32)
Annual Report 1996(4.33)
1994 (3.97)Mean
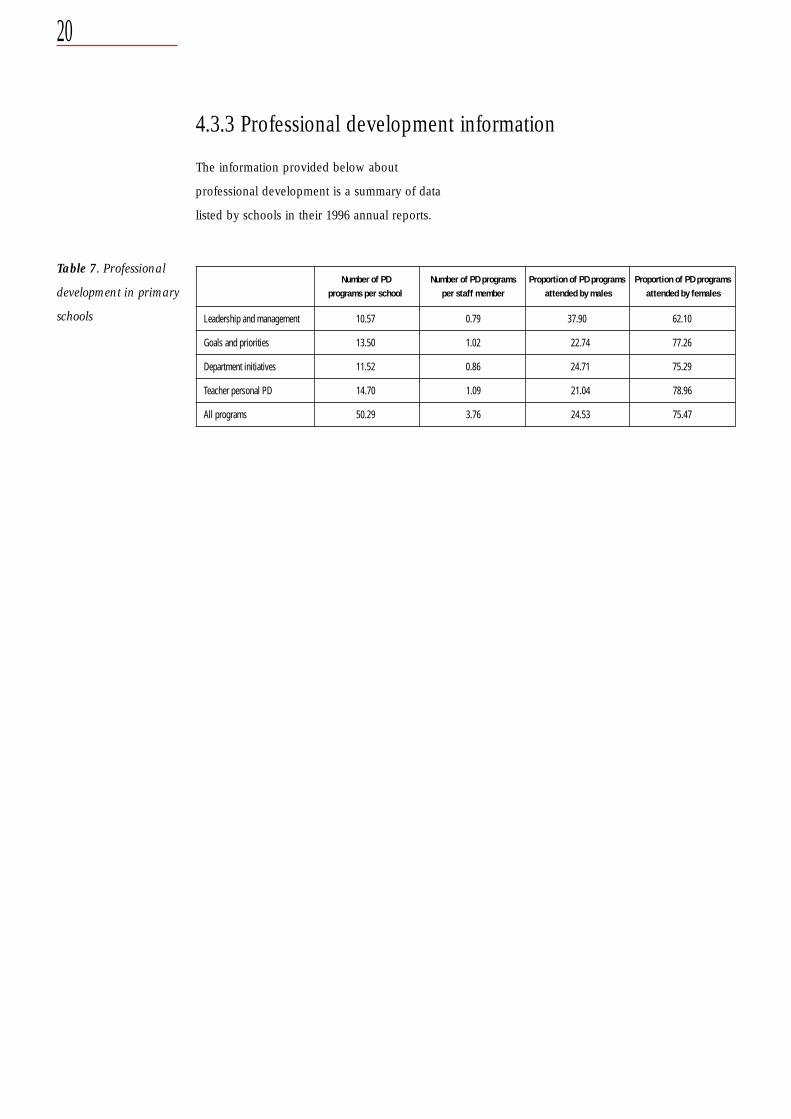
4.3.2 Teacher sick leave
The sick leave benchmarks have been calculated
for both non-certificated and total sick leave
taken by the teaching staff. The figures represent
the average number of sick leave days per
teacher.
The figures provided by CMIS list a simple
frequency or count of the sick leave days taken.
To compare the school’s number of sick leave
days with the benchmarks it is necessary to
convert this figure to a ratio. This is simply
obtained by dividing the number of sick leave
days for each month by the number of EFT
teachers on the staff. This gives the number of
sick leave days per teacher for the school.
Note:
Insufficient data was available to provide reliable benchmarks for the staff support variable. Schools
were not required to report the data.
Table 6. Teacher sick
leave in primary schools
Statewide average non-certificated sick leave Statewide average total sick leave daysdays per teacher per teacher
January 0.002 0.072
February 0.106 0.438
March 0.157 0.631
April 0.047 0.277
May 0.233 0.642
June 0.175 0.731
July 0.083 0.418
August 0.229 0.866
September 0.139 0.564
October 0.154 0.578
November 0.208 0.715
December 0.938 1.876
Total 2.471 7.808
20
4.3.3 Professional development information
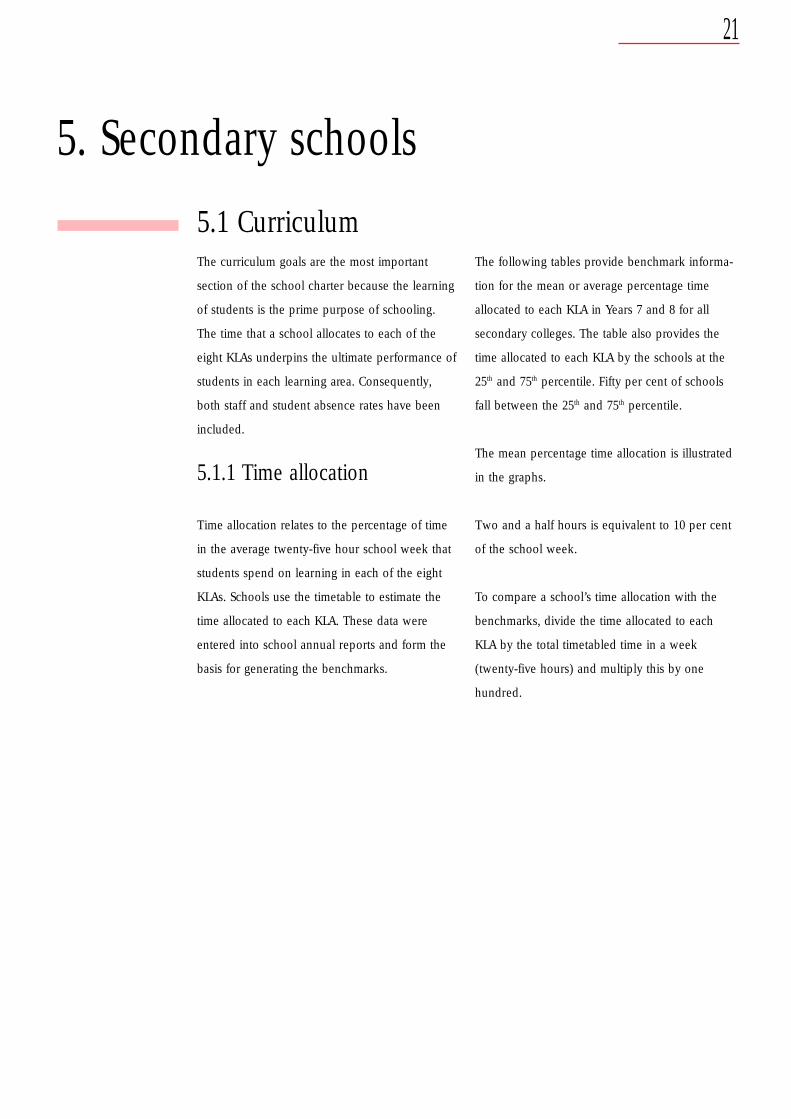
Table 7. Professional
development in primary
schools
Number of PD Number of PD programs Proportion of PD programs Proportion of PD programs
Leadership and management 10.57 0.79 37.90 62.10
Goals and priorities 13.50 1.02 22.74 77.26
Department initiatives 11.52 0.86 24.71 75.29
Teacher personal PD 14.70 1.09 21.04 78.96
All programs 50.29 3.76 24.53 75.47
The information provided below about
professional development is a summary of data
listed by schools in their 1996 annual reports.
programs per school per staff member attended by males attended by females
21
5. Secondary schools
5.1 CurriculumThe curriculum goals are the most important
section of the school charter because the learning
of students is the prime purpose of schooling.
The time that a school allocates to each of the
eight KLAs underpins the ultimate performance of
students in each learning area. Consequently,
both staff and student absence rates have been
included.
5.1.1 Time allocation
Time allocation relates to the percentage of time
in the average twenty-five hour school week that
students spend on learning in each of the eight
KLAs. Schools use the timetable to estimate the
time allocated to each KLA. These data were
entered into school annual reports and form the
basis for generating the benchmarks.
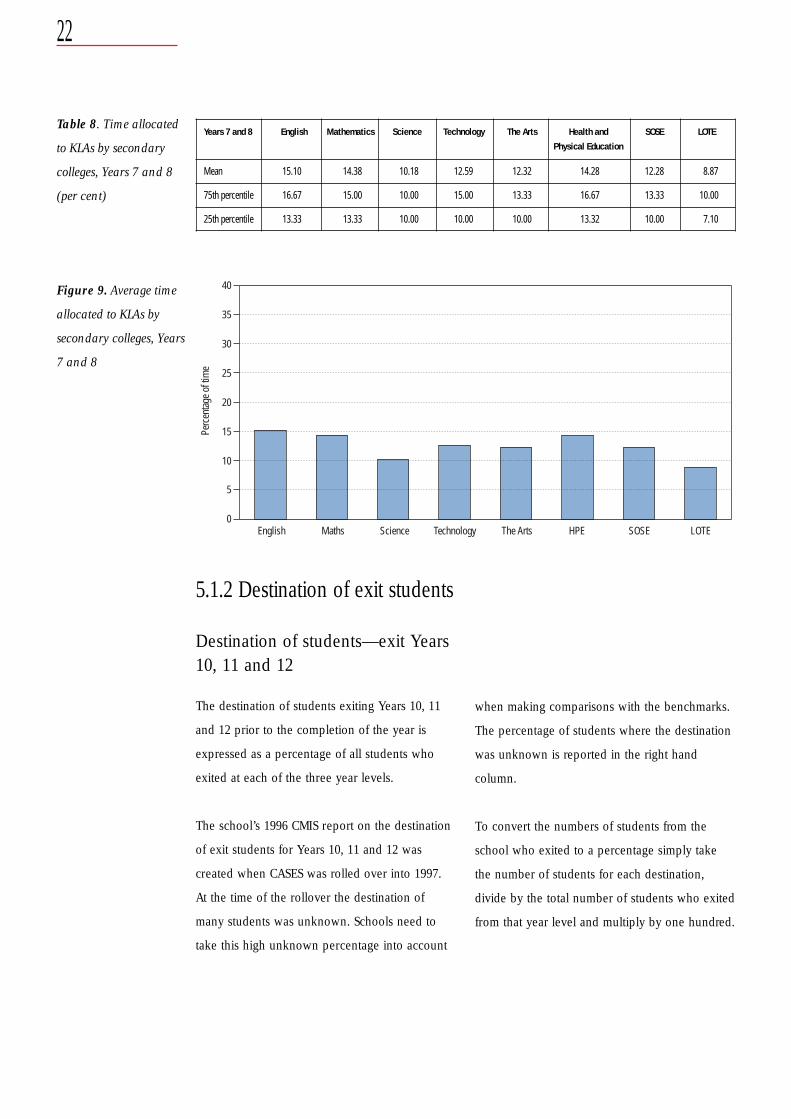
The following tables provide benchmark informa-
tion for the mean or average percentage time
allocated to each KLA in Years 7 and 8 for all
secondary colleges. The table also provides the
time allocated to each KLA by the schools at the
25th and 75th percentile. Fifty per cent of schools
fall between the 25th and 75th percentile.
The mean percentage time allocation is illustrated
in the graphs.
Two and a half hours is equivalent to 10 per cent
of the school week.
To compare a school’s time allocation with the
benchmarks, divide the time allocated to each
KLA by the total timetabled time in a week
(twenty-five hours) and multiply this by one
hundred.
22
Figure 9. Average time
allocated to KLAs by
secondary colleges, Years
7 and 8
0
5
10
15
20
25
30
35
40
Perc
entag
e of t
ime
English TechnologyMaths Science The Arts HPE SOSE LOTE
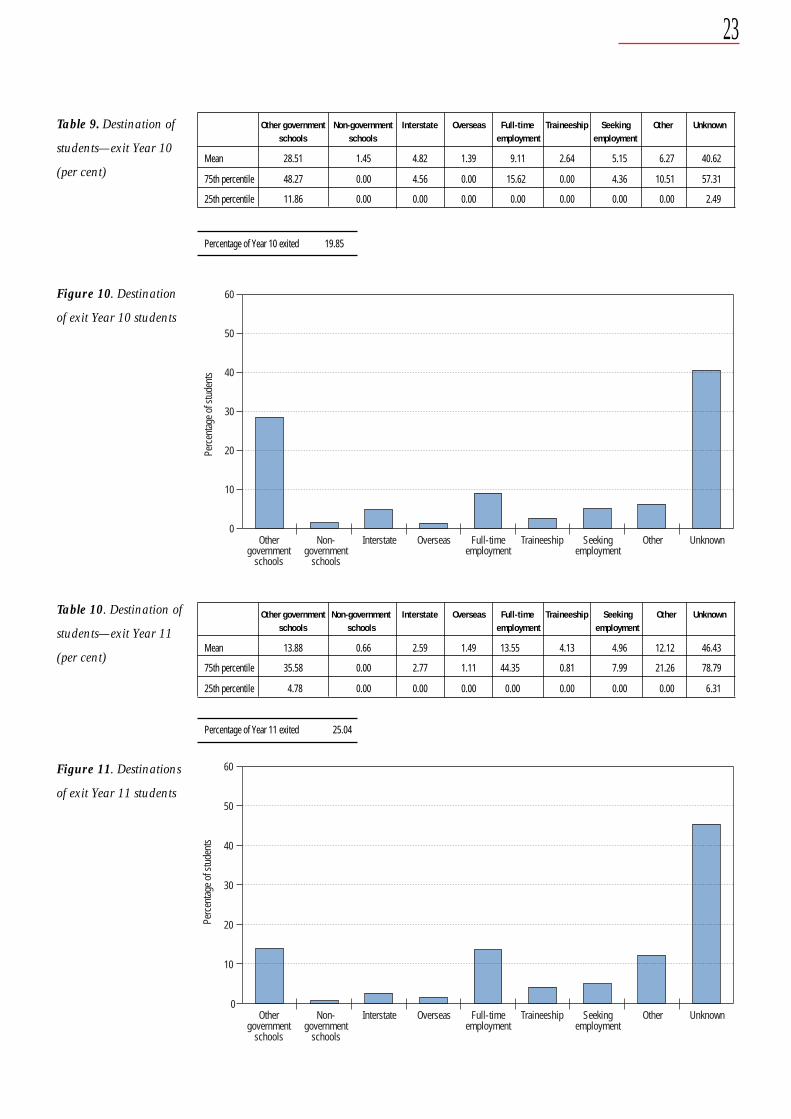
5.1.2 Destination of exit students
Destination of students—exit Years10, 11 and 12
The destination of students exiting Years 10, 11
and 12 prior to the completion of the year is
expressed as a percentage of all students who
exited at each of the three year levels.
The school’s 1996 CMIS report on the destination
of exit students for Years 10, 11 and 12 was
created when CASES was rolled over into 1997.
At the time of the rollover the destination of
many students was unknown. Schools need to
take this high unknown percentage into account
when making comparisons with the benchmarks.
The percentage of students where the destination
was unknown is reported in the right hand
column.
To convert the numbers of students from the
school who exited to a percentage simply take
the number of students for each destination,
divide by the total number of students who exited
from that year level and multiply by one hundred.
Table 8. Time allocated
to KLAs by secondary
colleges, Years 7 and 8
(per cent)
Years 7 and 8 English Mathematics Science Technology The Arts Health and SOSE LOTE
Mean 15.10 14.38 10.18 12.59 12.32 14.28 12.28 8.87
75th percentile 16.67 15.00 10.00 15.00 13.33 16.67 13.33 10.00
25th percentile 13.33 13.33 10.00 10.00 10.00 13.32 10.00 7.10
Physical Education
23
Table 9. Destination of
students—exit Year 10
(per cent)
Figure 10. Destination
of exit Year 10 students
0
10
20
30
40
50
60
Perc
entag
e of s
tude
nts
Othergovernment
schools
OverseasNon-government
schools
Interstate Full-timeemployment
Traineeship Seekingemployment
UnknownOther
Table 10. Destination of
students—exit Year 11
(per cent)
Other government Non-government Interstate Overseas Full-time Traineeship Seeking Other Unknownschools schools employment employment
Mean 28.51 1.45 4.82 1.39 9.11 2.64 5.15 6.27 40.62
75th percentile 48.27 0.00 4.56 0.00 15.62 0.00 4.36 10.51 57.31
25th percentile 11.86 0.00 0.00 0.00 0.00 0.00 0.00 0.00 2.49
Percentage of Year 10 exited 19.85
Other government Non-government Interstate Overseas Full-time Traineeship Seeking Other Unknownschools schools employment employment
Mean 13.88 0.66 2.59 1.49 13.55 4.13 4.96 12.12 46.43
75th percentile 35.58 0.00 2.77 1.11 44.35 0.81 7.99 21.26 78.79
25th percentile 4.78 0.00 0.00 0.00 0.00 0.00 0.00 0.00 6.31
Percentage of Year 11 exited 25.04
Figure 11. Destinations
of exit Year 11 students
0
10
20
30
40
50
60
Perc
enta
ge o
f stu
dent
s
Othergovernment
schools
OverseasNon-government
schools
Interstate Full-timeemployment
Traineeship Seekingemployment
UnknownOther
24
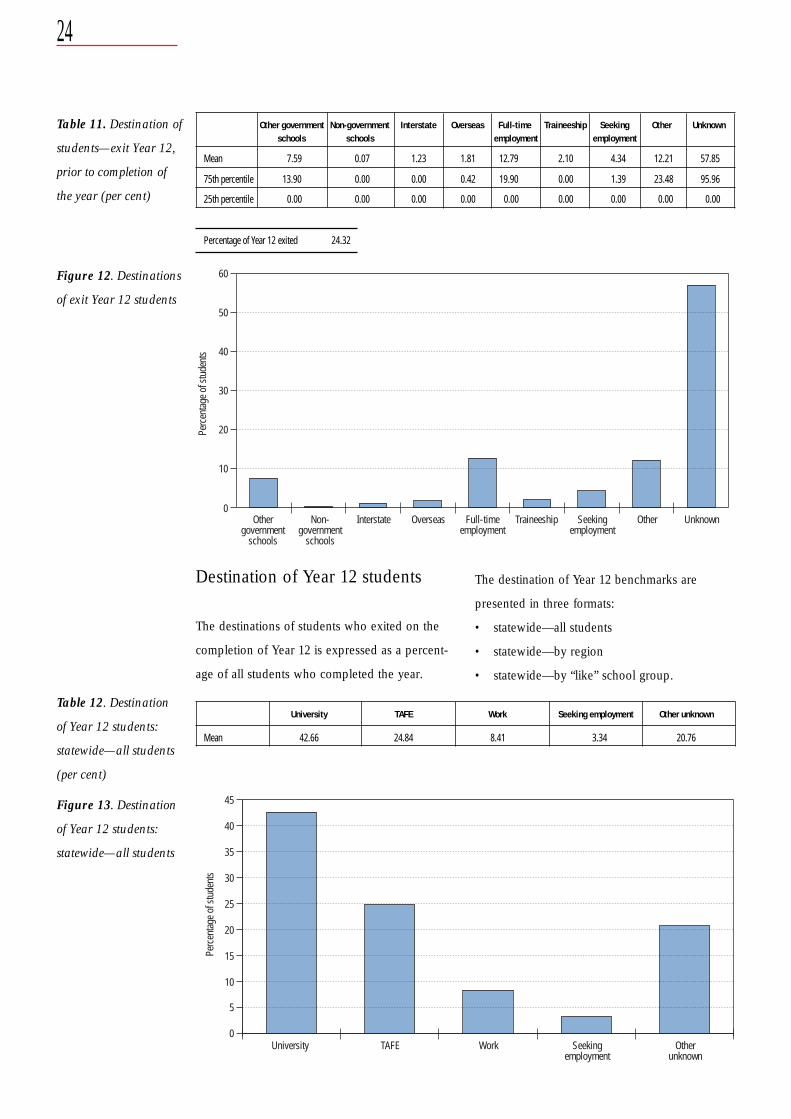
Table 11. Destination of
students—exit Year 12,
prior to completion of
the year (per cent)
Other government Non-government Interstate Overseas Full-time Traineeship Seeking Other Unknownschools schools employment employment
Mean 7.59 0.07 1.23 1.81 12.79 2.10 4.34 12.21 57.85
75th percentile 13.90 0.00 0.00 0.42 19.90 0.00 1.39 23.48 95.96
25th percentile 0.00 0.00 0.00 0.00 0.00 0.00 0.00 0.00 0.00
Percentage of Year 12 exited 24.32
Figure 12. Destinations
of exit Year 12 students
0
10
20
30
40
50
60
Perc
entag
e of s
tude
nts
Othergovernment
schools
OverseasNon-government
schools
Interstate Full-timeemployment
Traineeship Seekingemployment
UnknownOther
Destination of Year 12 students
The destinations of students who exited on the
completion of Year 12 is expressed as a percent-
age of all students who completed the year.
0
5
10
15
20
25
30
35
40
45
Perc
entag
e of s
tude
nts
University WorkTAFE Seekingemployment
Otherunknown
The destination of Year 12 benchmarks are
presented in three formats:
• statewide—all students
• statewide—by region
• statewide—by “like” school group.
Figure 13. Destination
of Year 12 students:
statewide—all students
Table 12. Destination
of Year 12 students:
statewide—all students
(per cent)
University TAFE Work Seeking employment Other unknown
Mean 42.66 24.84 8.41 3.34 20.76
25
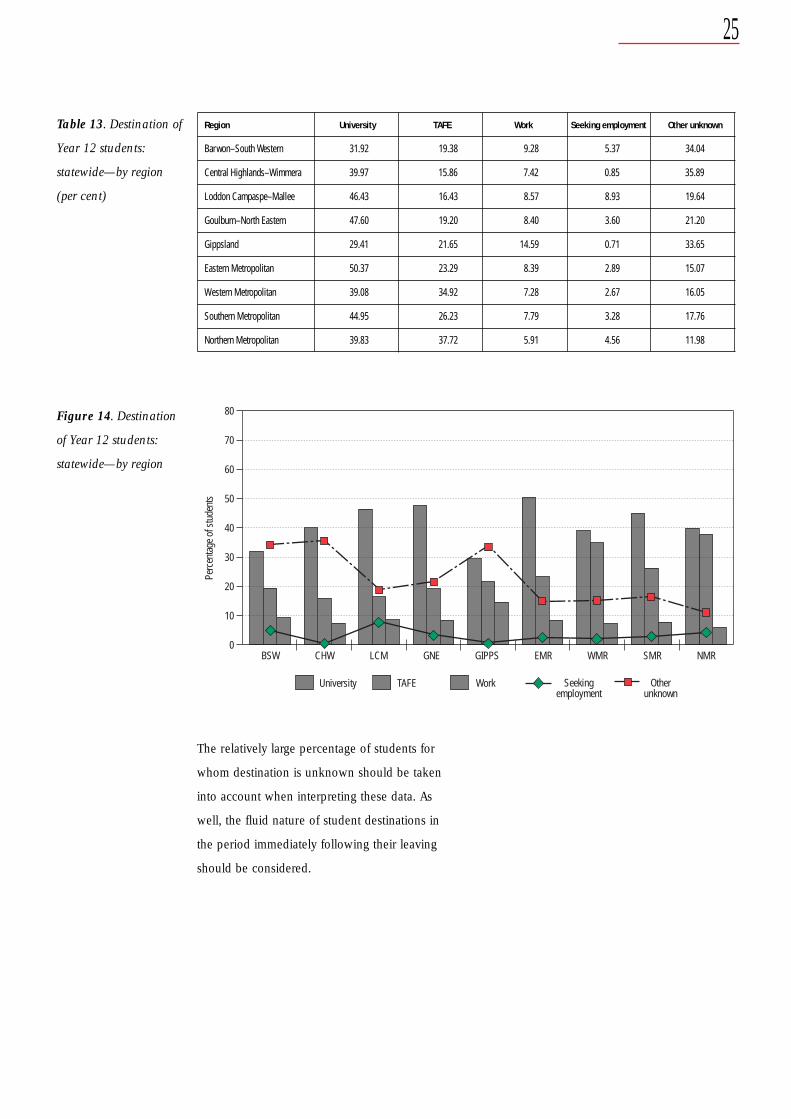
Table 13. Destination of
Year 12 students:
statewide—by region
(per cent)
Region University TAFE Work Seeking employment Other unknown
Barwon–South Western 31.92 19.38 9.28 5.37 34.04
Central Highlands–Wimmera 39.97 15.86 7.42 0.85 35.89
Loddon Campaspe–Mallee 46.43 16.43 8.57 8.93 19.64
Goulburn–North Eastern 47.60 19.20 8.40 3.60 21.20
Gippsland 29.41 21.65 14.59 0.71 33.65
Eastern Metropolitan 50.37 23.29 8.39 2.89 15.07
Western Metropolitan 39.08 34.92 7.28 2.67 16.05
Southern Metropolitan 44.95 26.23 7.79 3.28 17.76
Northern Metropolitan 39.83 37.72 5.91 4.56 11.98
Figure 14. Destination
of Year 12 students:
statewide—by region
0
10
20
30
40
50
60
70
80
Perc
entag
e of s
tude
nts
University Work Seekingemployment
Otherunknown
TAFE
BSW CHW LCM GNE GIPPS EMR WMR SMR NMR
The relatively large percentage of students for
whom destination is unknown should be taken
into account when interpreting these data. As
well, the fluid nature of student destinations in
the period immediately following their leaving
should be considered.
26
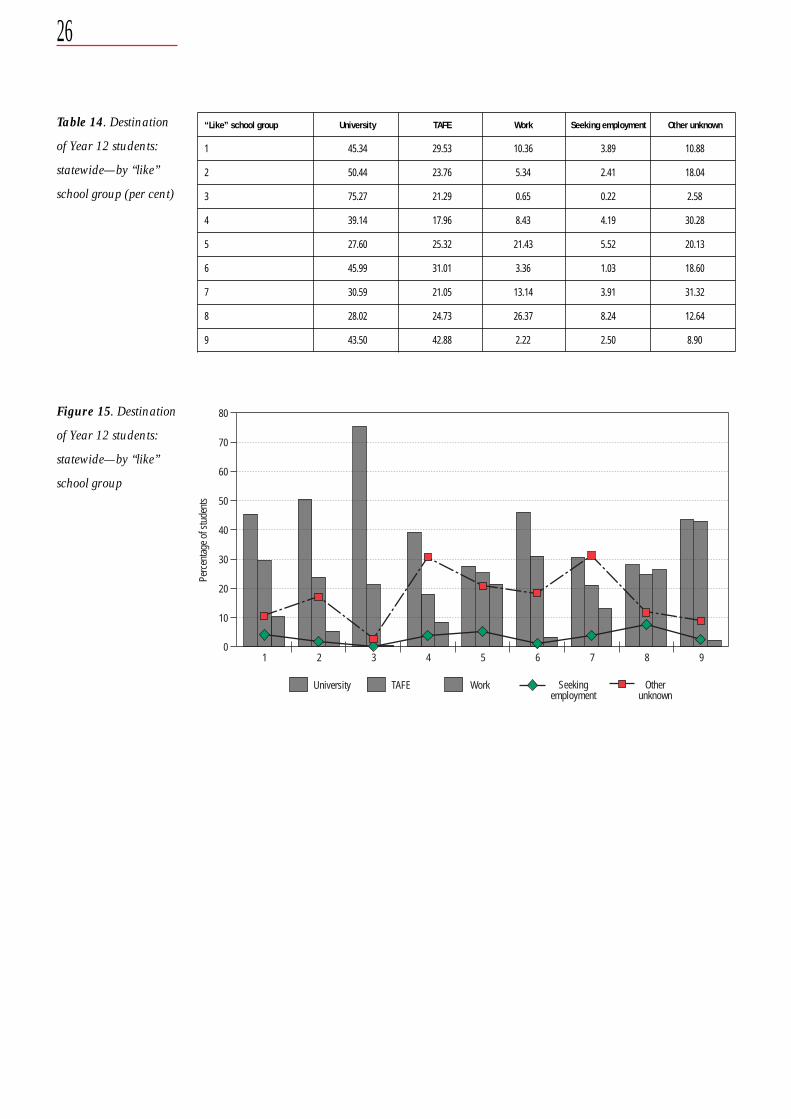
Table 14. Destination
of Year 12 students:
statewide—by “like”
school group (per cent)
“Like” school group University TAFE Work Seeking employment Other unknown
1 45.34 29.53 10.36 3.89 10.88
2 50.44 23.76 5.34 2.41 18.04
3 75.27 21.29 0.65 0.22 2.58
4 39.14 17.96 8.43 4.19 30.28
5 27.60 25.32 21.43 5.52 20.13
6 45.99 31.01 3.36 1.03 18.60
7 30.59 21.05 13.14 3.91 31.32
8 28.02 24.73 26.37 8.24 12.64
9 43.50 42.88 2.22 2.50 8.90
Figure 15. Destination
of Year 12 students:
statewide—by “like”
school group
0
10
20
30
40
50
60
70
80
Perc
entag
e of s
tude
nts
University Work Seekingemployment
Otherunknown
TAFE
1 2 3 4 5 6 7 8 9
27
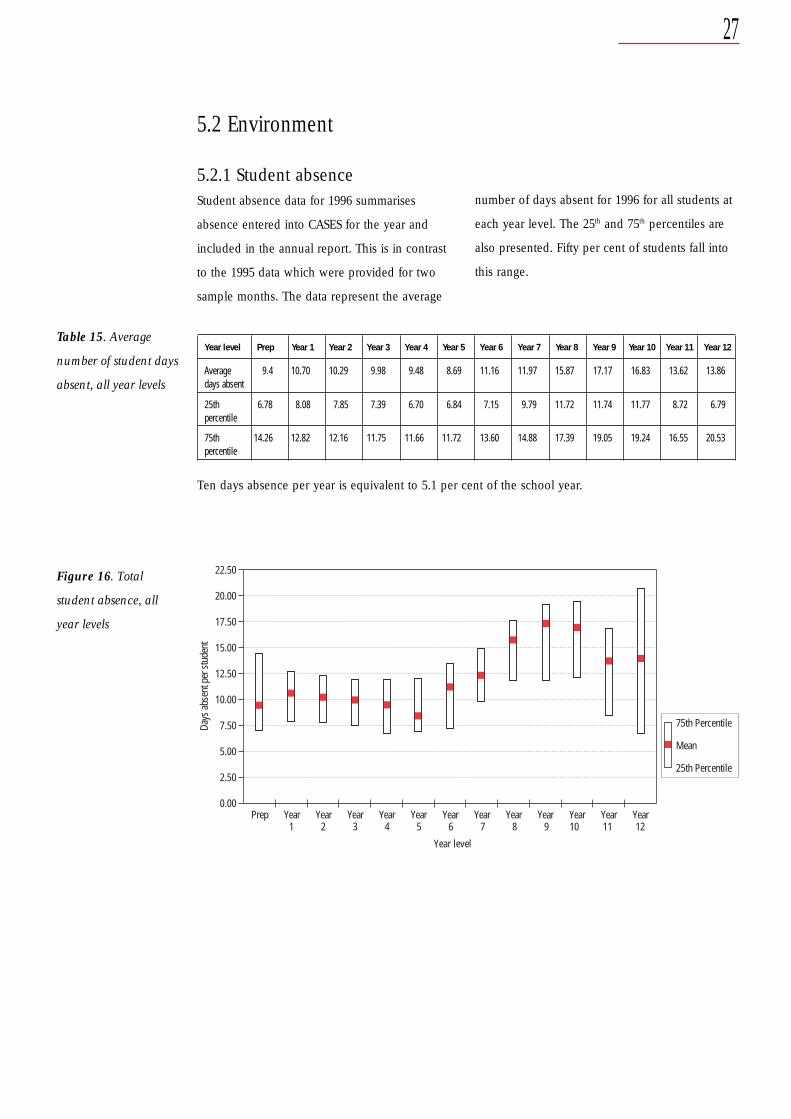
5.2 Environment
5.2.1 Student absenceStudent absence data for 1996 summarises
absence entered into CASES for the year and
included in the annual report. This is in contrast
to the 1995 data which were provided for two
sample months. The data represent the average
number of days absent for 1996 for all students at
each year level. The 25th and 75th percentiles are
also presented. Fifty per cent of students fall into
this range.
Table 15. Average
number of student days
absent, all year levels
Year level Prep Year 1 Year 2 Year 3 Year 4 Year 5 Year 6 Year 7 Year 8 Year 9 Year 10 Year 11 Year 12
Average 9.4 10.70 10.29 9.98 9.48 8.69 11.16 11.97 15.87 17.17 16.83 13.62 13.86days absent
25th 6.78 8.08 7.85 7.39 6.70 6.84 7.15 9.79 11.72 11.74 11.77 8.72 6.79percentile
75th 14.26 12.82 12.16 11.75 11.66 11.72 13.60 14.88 17.39 19.05 19.24 16.55 20.53percentile
Ten days absence per year is equivalent to 5.1 per cent of the school year.
Figure 16. Total
student absence, all
year levels
Days
abse
nt p
er st
uden
t
Prep Year Year Year Year Year Year Year Year Year Year Year Year1 2 3 4 5 6 7 8 9 10 11 12
22.50
20.00
17.50
15.00
12.50
10.00
7.50
5.00
2.50
0.00
Year level
75th Percentile
Mean
25th Percentile
28
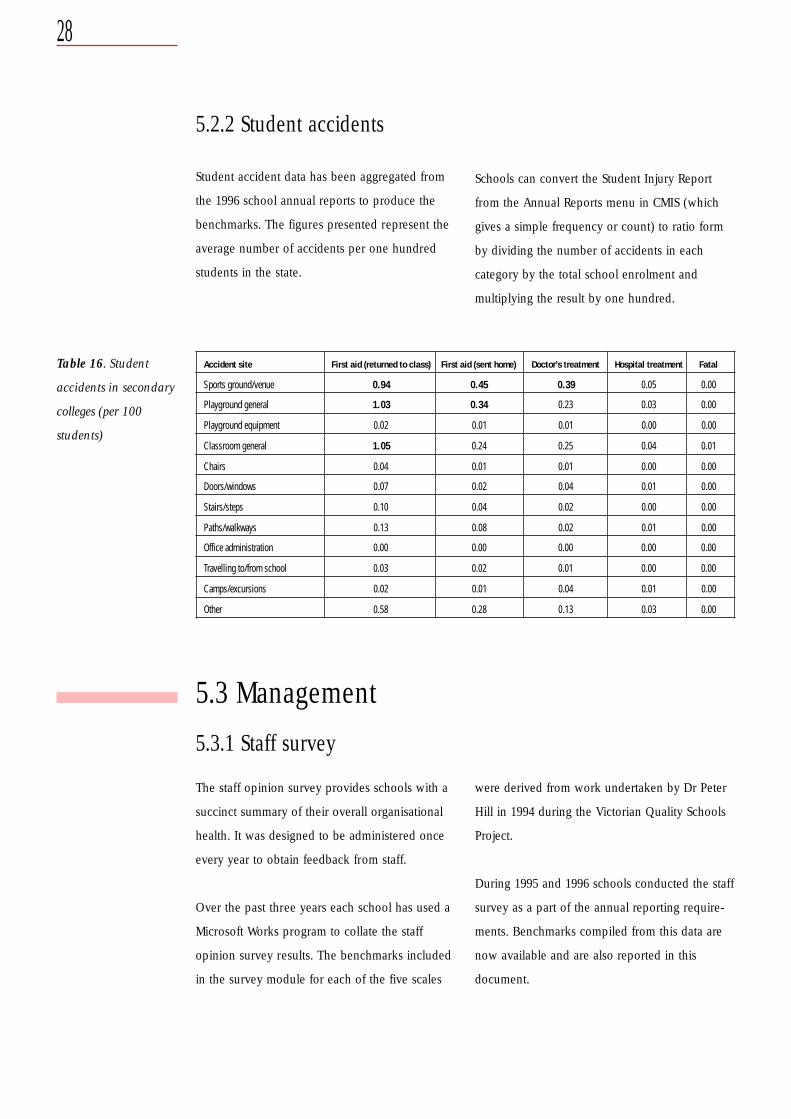
5.2.2 Student accidents
Student accident data has been aggregated from
the 1996 school annual reports to produce the
benchmarks. The figures presented represent the
average number of accidents per one hundred
students in the state.
Schools can convert the Student Injury Report
from the Annual Reports menu in CMIS (which
gives a simple frequency or count) to ratio form
by dividing the number of accidents in each
category by the total school enrolment and
multiplying the result by one hundred.
5.3 Management
5.3.1 Staff survey
The staff opinion survey provides schools with a
succinct summary of their overall organisational
health. It was designed to be administered once
every year to obtain feedback from staff.
Over the past three years each school has used a
Microsoft Works program to collate the staff
opinion survey results. The benchmarks included
in the survey module for each of the five scales
were derived from work undertaken by Dr Peter
Hill in 1994 during the Victorian Quality Schools
Project.
During 1995 and 1996 schools conducted the staff
survey as a part of the annual reporting require-
ments. Benchmarks compiled from this data are
now available and are also reported in this
document.
Table 16. Student
accidents in secondary
colleges (per 100
students)
Accident site First aid (returned to class) First aid (sent home) Doctor’s treatment Hospital treatment Fatal
Sports ground/venue 0.94 0.45 0.39 0.05 0.00
Playground general 1.03 0.34 0.23 0.03 0.00
Playground equipment 0.02 0.01 0.01 0.00 0.00
Classroom general 1.05 0.24 0.25 0.04 0.01
Chairs 0.04 0.01 0.01 0.00 0.00
Doors/windows 0.07 0.02 0.04 0.01 0.00
Stairs/steps 0.10 0.04 0.02 0.00 0.00
Paths/walkways 0.13 0.08 0.02 0.01 0.00
Office administration 0.00 0.00 0.00 0.00 0.00
Travelling to/from school 0.03 0.02 0.01 0.00 0.00
Camps/excursions 0.02 0.01 0.04 0.01 0.00
Other 0.58 0.28 0.13 0.03 0.00
29
There is variation between the average scores on
each of the scales measured in 1994 by the
Victorian Quality Schools Project to those
reported in the annual reports. In all cases the
1994 scores are lower than those from the annual
reports for both 1995 and 1996.
The benchmarks in this section provide data
which represents the full distribution of results
from the 1996 annual reports.
Note:
The CASES survey module, due for release to
schools at the end of Term 3, 1997 has a slightly
modified benchmarking system. The system will
scale a school’s past years benchmarks into the
new system. Advice on the new system will
accompany the release of the survey module. The
new benchmarking system will allow schools to
benchmark their performance with schools in
other Australian states and eventually with
schools from other countries.
Interpretation of the staff survey• The first point of comparison would always
be against the school’s own past performance.
Have the results remained relatively constant
or is there an upward or downward trend?
• Comparison of the school score to the state
range of means. The best point of comparison
at this point would appear to be the 1995 and
1996 annual report means. The consistency of
these scores over the two years would suggest
that they provide a better reference point than
the data from 1994.
• For 1996 the distribution of all schools in the
sample is also provided. Does the school
score fall in the bottom 25 per cent, the
middle 50 per cent, or the upper 25 per cent?
• As always professional judgement is required
in the interpretation of the school data.
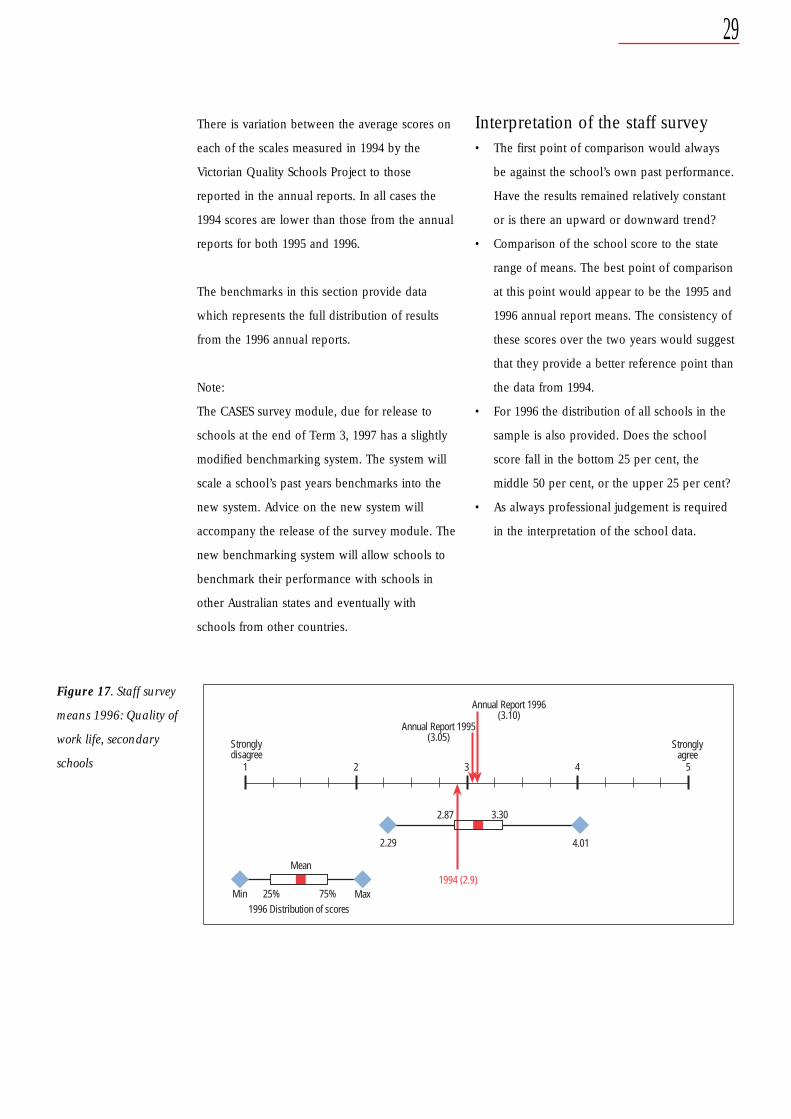
Figure 17. Staff survey
means 1996: Quality of
work life, secondary
schools
Min 25% 75% Max1996 Distribution of scores
1 2 3 4 5
Stronglydisagree
Stronglyagree
2.29 4.01
2.87 3.30
Annual Report 1995(3.05)
Annual Report 1996(3.10)
1994 (2.9)Mean
30
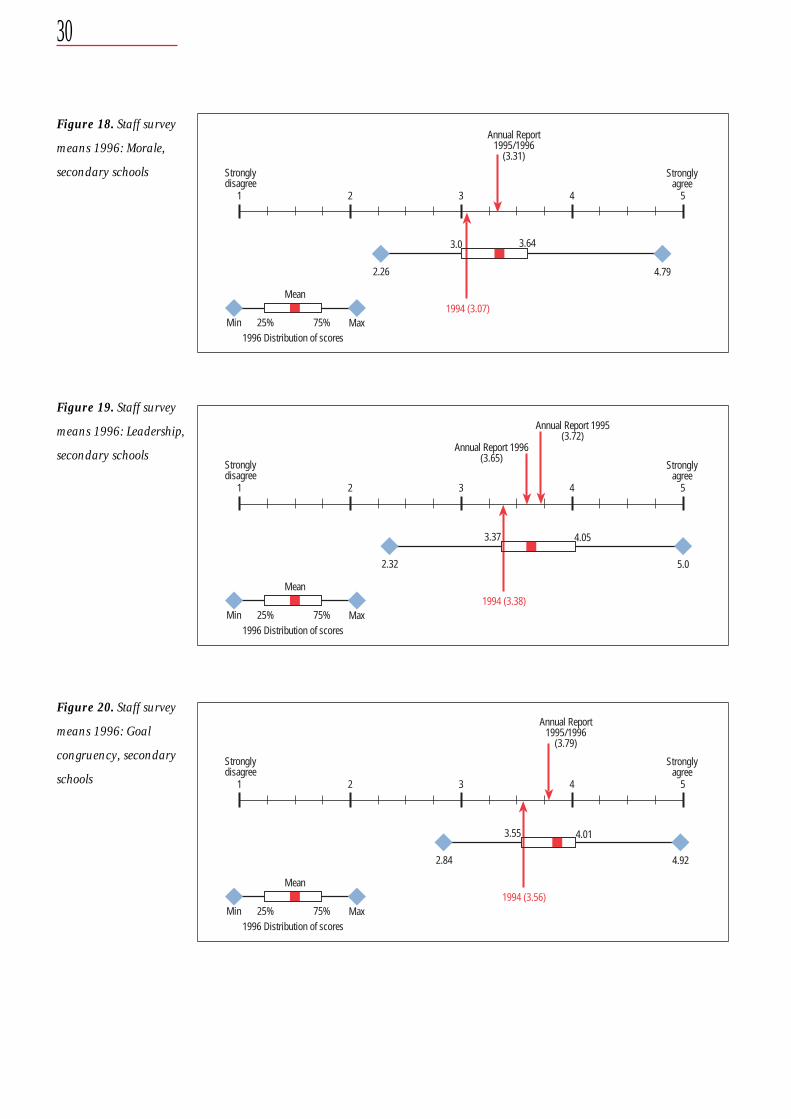
Figure 18. Staff survey
means 1996: Morale,
secondary schools
1996 Distribution of scores
Stronglydisagree
Stronglyagree
2.26 4.79
3.0 3.64
Annual Report1995/1996
(3.31)
1994 (3.07)
1 2 3 4 5
Min 25% 75% Max
Mean
Figure 19. Staff survey
means 1996: Leadership,
secondary schools
Min 25% 75% Max1996 Distribution of scores
1 2 3 4 5
Stronglydisagree
Stronglyagree
2.32 5.0
3.37 4.05
Annual Report 1996(3.65)
Annual Report 1995(3.72)
1994 (3.38)Mean
Figure 20. Staff survey
means 1996: Goal
congruency, secondary
schools
Min 25% 75% Max1996 Distribution of scores
1 2 3 4 5
Stronglydisagree
Stronglyagree
2.84 4.92
3.55 4.01
Annual Report1995/1996
(3.79)
1994 (3.56)Mean
31
Note:
Insufficient data was available to provide reliable
benchmarks for the staff support variable.
Schools were not required to report the data.
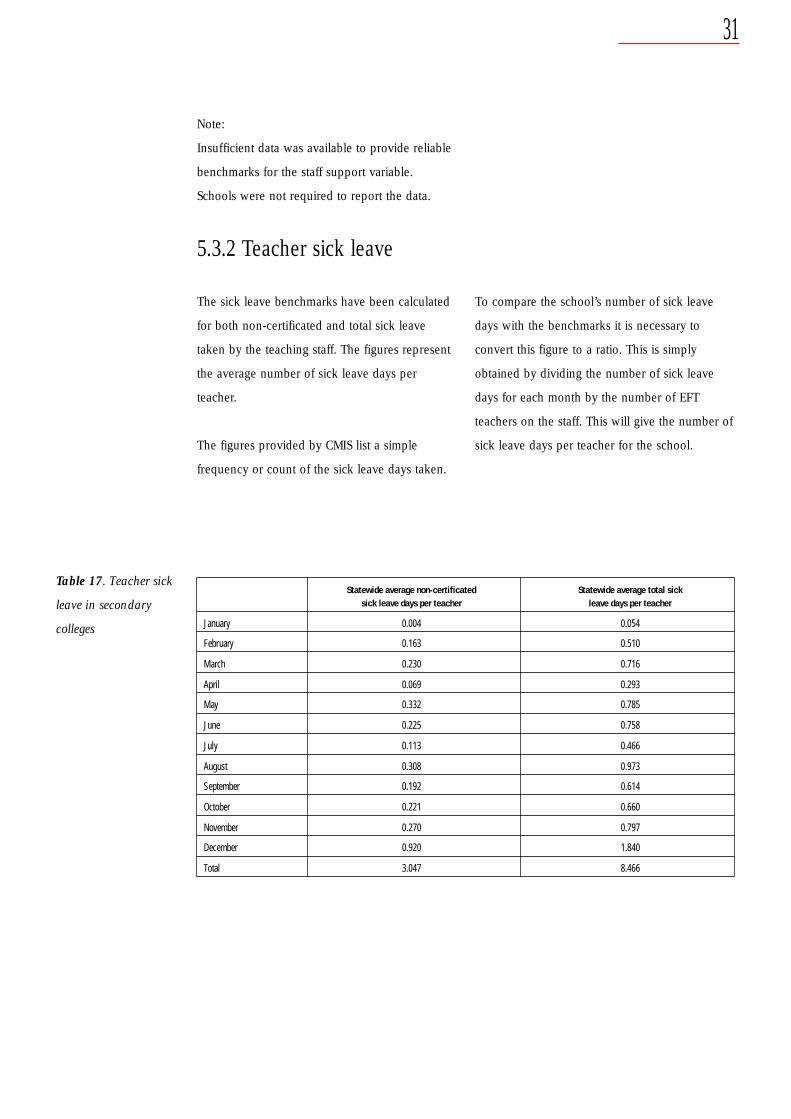
5.3.2 Teacher sick leave
The sick leave benchmarks have been calculated
for both non-certificated and total sick leave
taken by the teaching staff. The figures represent
the average number of sick leave days per
teacher.
The figures provided by CMIS list a simple
frequency or count of the sick leave days taken.
To compare the school’s number of sick leave
days with the benchmarks it is necessary to
convert this figure to a ratio. This is simply
obtained by dividing the number of sick leave
days for each month by the number of EFT
teachers on the staff. This will give the number of
sick leave days per teacher for the school.
Table 17. Teacher sick
leave in secondary
colleges
Statewide average non-certificated Statewide average total sicksick leave days per teacher leave days per teacher
January 0.004 0.054
February 0.163 0.510
March 0.230 0.716
April 0.069 0.293
May 0.332 0.785
June 0.225 0.758
July 0.113 0.466
August 0.308 0.973
September 0.192 0.614
October 0.221 0.660
November 0.270 0.797
December 0.920 1.840
Total 3.047 8.466
32
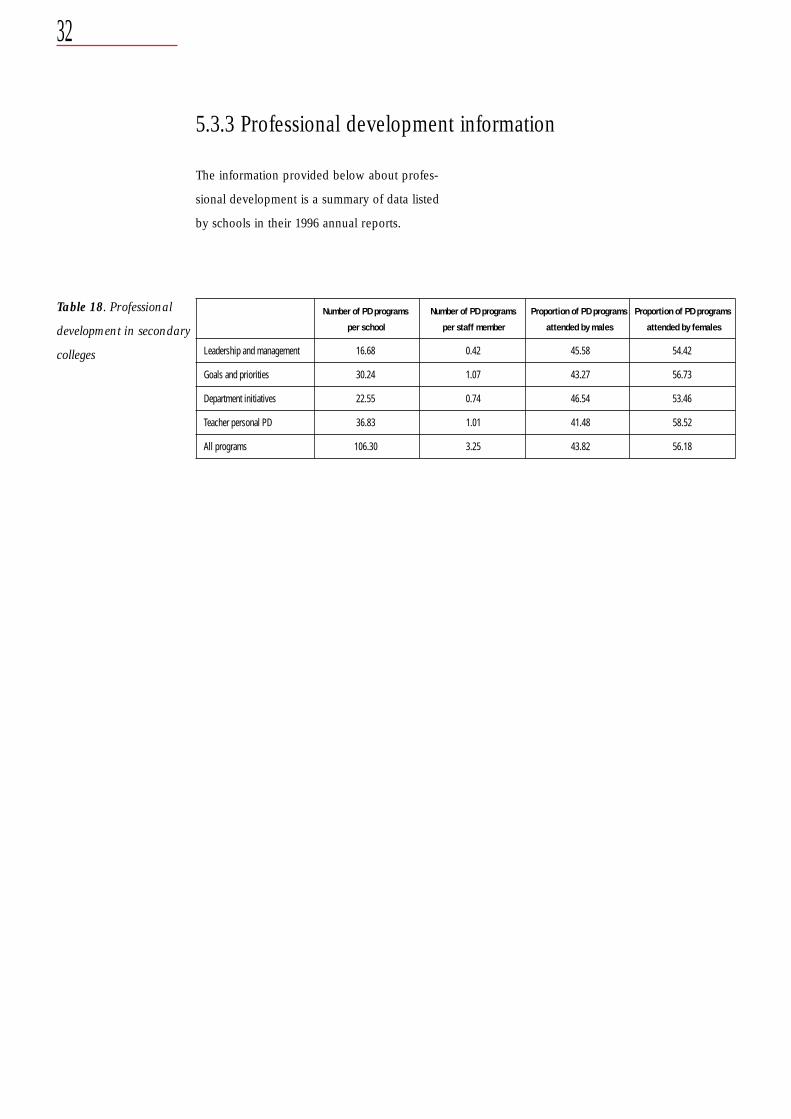
5.3.3 Professional development information
The information provided below about profes-
sional development is a summary of data listed
by schools in their 1996 annual reports.
Table 18. Professional
development in secondary
colleges
Number of PD programs Number of PD programs Proportion of PD programs Proportion of PD programs
Leadership and management 16.68 0.42 45.58 54.42
Goals and priorities 30.24 1.07 43.27 56.73
Department initiatives 22.55 0.74 46.54 53.46
Teacher personal PD 36.83 1.01 41.48 58.52
All programs 106.30 3.25 43.82 56.18
per school per staff member attended by males attended by females
33
6. Primary–secondary (P–12) colleges
6.1 Curriculum
The curriculum goals are the most important
section of the school charter because the learning
of students is the prime purpose of schooling.
The time that a school allocates to each of the
eight KLAs underpins the ultimate performance of
students in each learning area. Consequently,
both staff and student absence rates have been
included.
6.1.1 Time allocation
Time allocation relates to the percentage of time
in the average twenty-five hour school week that
students spend on learning in each of the eight
KLAs. Schools use the timetable to estimate the
time allocated to each KLA. These data were
entered into school annual reports and form the
basis for generating the benchmarks.
The following tables provide benchmark informa-
tion for the mean or average percentage time
allocated to each KLA for all primary and second-
ary schools. The table also provides the time
allocated to each KLA by the schools at the 25th
and 75th percentile. Fifty per cent of schools fall
between the 25th and 75th percentile.
The mean percentage time allocation is illustrated
in the graphs.
Two and a half hours is equivalent to 10 per cent
of the school week.
To compare a school’s time allocation with the
benchmarks, divide the time allocated to each
KLA by the total timetabled time in a week and
multiply this by one hundred.
34
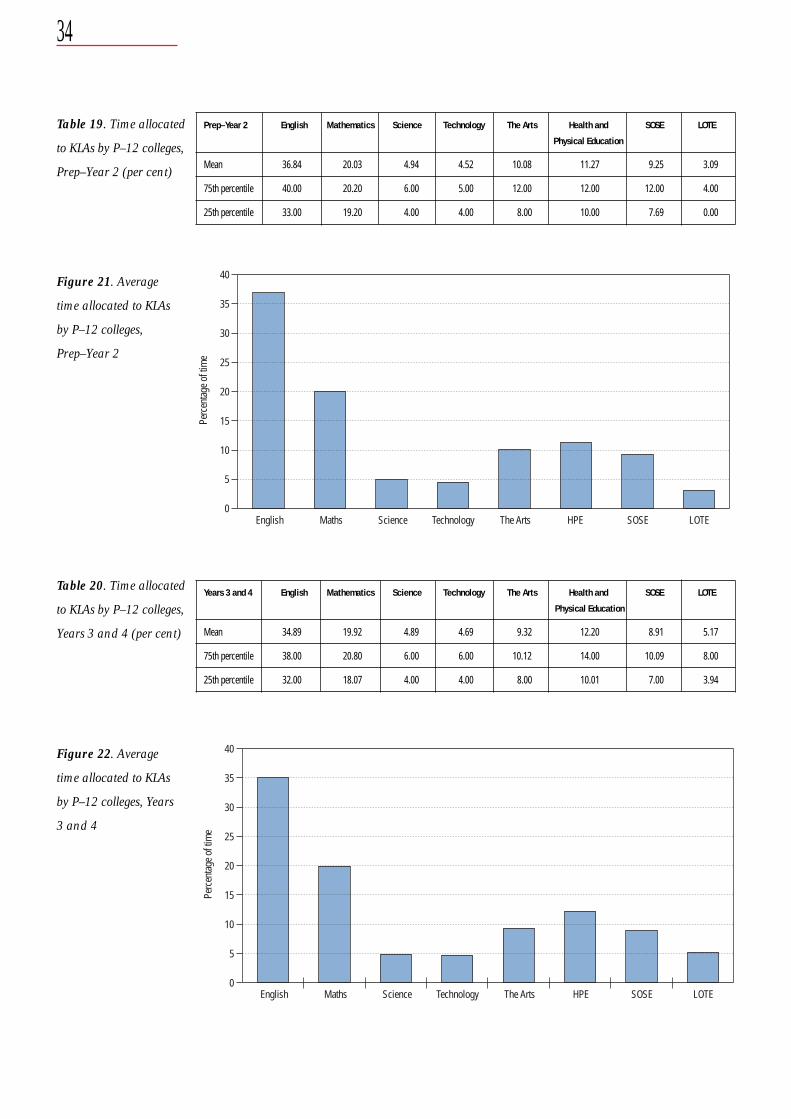
Table 19. Time allocated
to KLAs by P–12 colleges,
Prep–Year 2 (per cent)
Prep–Year 2 English Mathematics Science Technology The Arts Health and SOSE LOTE
Mean 36.84 20.03 4.94 4.52 10.08 11.27 9.25 3.09
75th percentile 40.00 20.20 6.00 5.00 12.00 12.00 12.00 4.00
25th percentile 33.00 19.20 4.00 4.00 8.00 10.00 7.69 0.00
Figure 21. Average
time allocated to KLAs
by P–12 colleges,
Prep–Year 2
0
5
10
15
20
25
30
35
40
Perc
entag
e of t
ime
English TechnologyMaths Science The Arts HPE SOSE LOTE
Table 20. Time allocated
to KLAs by P–12 colleges,
Years 3 and 4 (per cent)
Figure 22. Average
time allocated to KLAs
by P–12 colleges, Years
3 and 4
Years 3 and 4 English Mathematics Science Technology The Arts Health and SOSE LOTE
Mean 34.89 19.92 4.89 4.69 9.32 12.20 8.91 5.17
75th percentile 38.00 20.80 6.00 6.00 10.12 14.00 10.09 8.00
25th percentile 32.00 18.07 4.00 4.00 8.00 10.01 7.00 3.94
0
5
10
15
20
25
30
35
40
Perc
entag
e of t
ime
English TechnologyMaths Science The Arts HPE SOSE LOTE
Physical Education
Physical Education
35
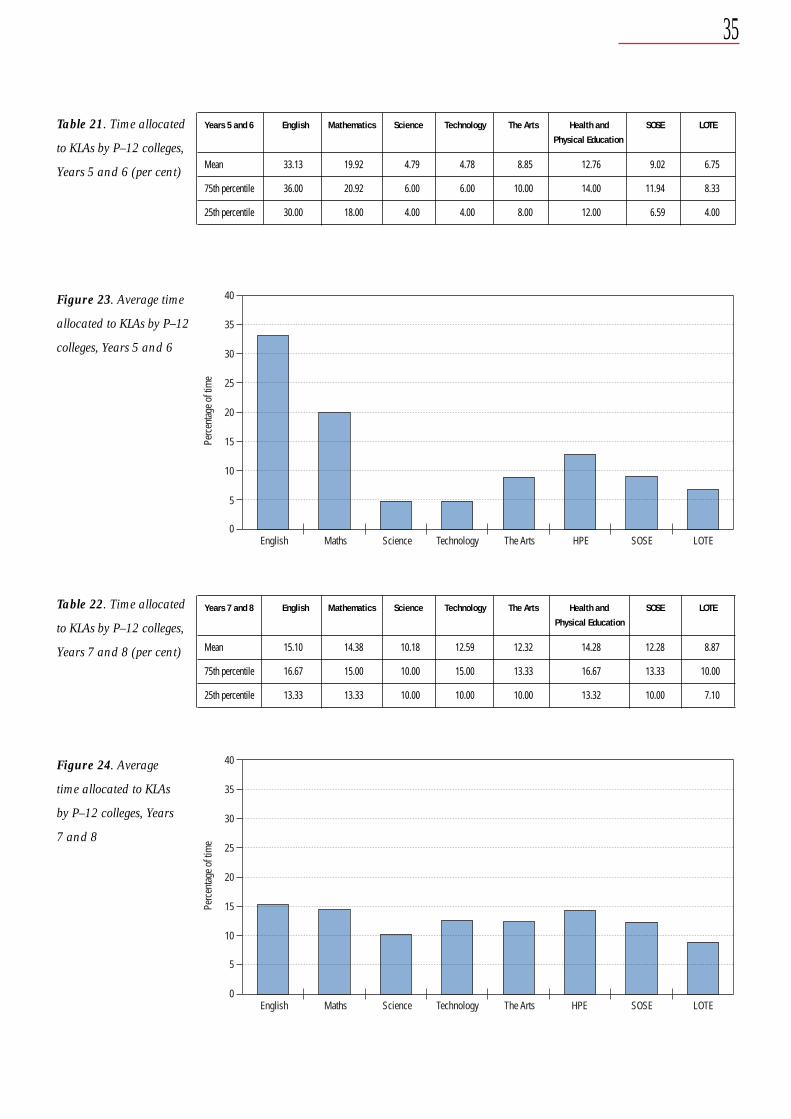
Table 21. Time allocated
to KLAs by P–12 colleges,
Years 5 and 6 (per cent)
Years 5 and 6 English Mathematics Science Technology The Arts Health and SOSE LOTE
Mean 33.13 19.92 4.79 4.78 8.85 12.76 9.02 6.75
75th percentile 36.00 20.92 6.00 6.00 10.00 14.00 11.94 8.33
25th percentile 30.00 18.00 4.00 4.00 8.00 12.00 6.59 4.00
Figure 23. Average time
allocated to KLAs by P–12
colleges, Years 5 and 6
0
5
10
15
20
25
30
35
40
Perc
entag
e of t
ime
English TechnologyMaths Science The Arts HPE SOSE LOTE
Table 22. Time allocated
to KLAs by P–12 colleges,
Years 7 and 8 (per cent)
Years 7 and 8 English Mathematics Science Technology The Arts Health and SOSE LOTE
Mean 15.10 14.38 10.18 12.59 12.32 14.28 12.28 8.87
75th percentile 16.67 15.00 10.00 15.00 13.33 16.67 13.33 10.00
25th percentile 13.33 13.33 10.00 10.00 10.00 13.32 10.00 7.10
Figure 24. Average
time allocated to KLAs
by P–12 colleges, Years
7 and 8
0
5
10
15
20
25
30
35
40
Perc
entag
e of t
ime
English TechnologyMaths Science The Arts HPE SOSE LOTE
Physical Education
Physical Education
36
6.2 Environment
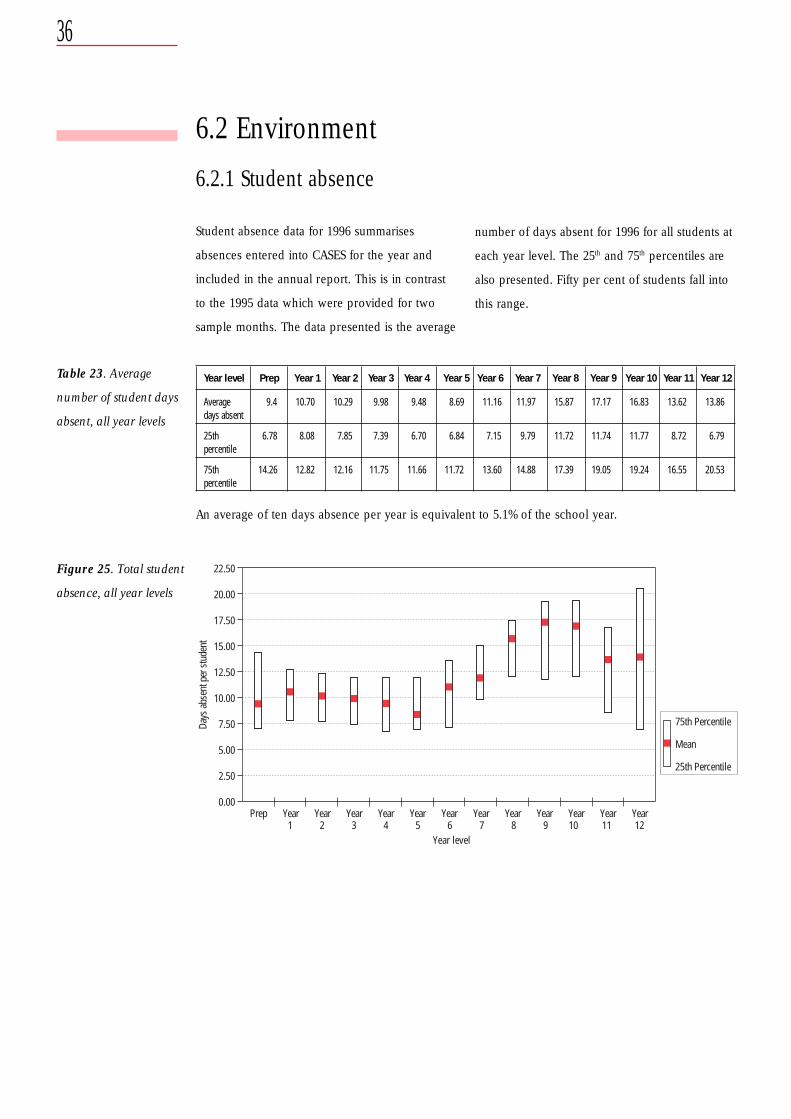
6.2.1 Student absence
Student absence data for 1996 summarises
absences entered into CASES for the year and
included in the annual report. This is in contrast
to the 1995 data which were provided for two
sample months. The data presented is the average
number of days absent for 1996 for all students at
each year level. The 25th and 75th percentiles are
also presented. Fifty per cent of students fall into
this range.
Table 23. Average
number of student days
absent, all year levels
Year level Prep Year 1 Year 2 Year 3 Year 4 Year 5 Year 6 Year 7 Year 8 Year 9 Year 10 Year 11 Year 12
Average 9.4 10.70 10.29 9.98 9.48 8.69 11.16 11.97 15.87 17.17 16.83 13.62 13.86days absent
25th 6.78 8.08 7.85 7.39 6.70 6.84 7.15 9.79 11.72 11.74 11.77 8.72 6.79percentile
75th 14.26 12.82 12.16 11.75 11.66 11.72 13.60 14.88 17.39 19.05 19.24 16.55 20.53percentile
An average of ten days absence per year is equivalent to 5.1% of the school year.
Figure 25. Total student
absence, all year levels
Days
abse
nt p
er st
uden
t
Prep Year Year Year Year Year Year Year Year Year Year Year Year1 2 3 4 5 6 7 8 9 10 11 12
22.50
20.00
17.50
15.00
12.50
10.00
7.50
5.00
2.50
0.00
Year level
75th Percentile
Mean
25th Percentile
37
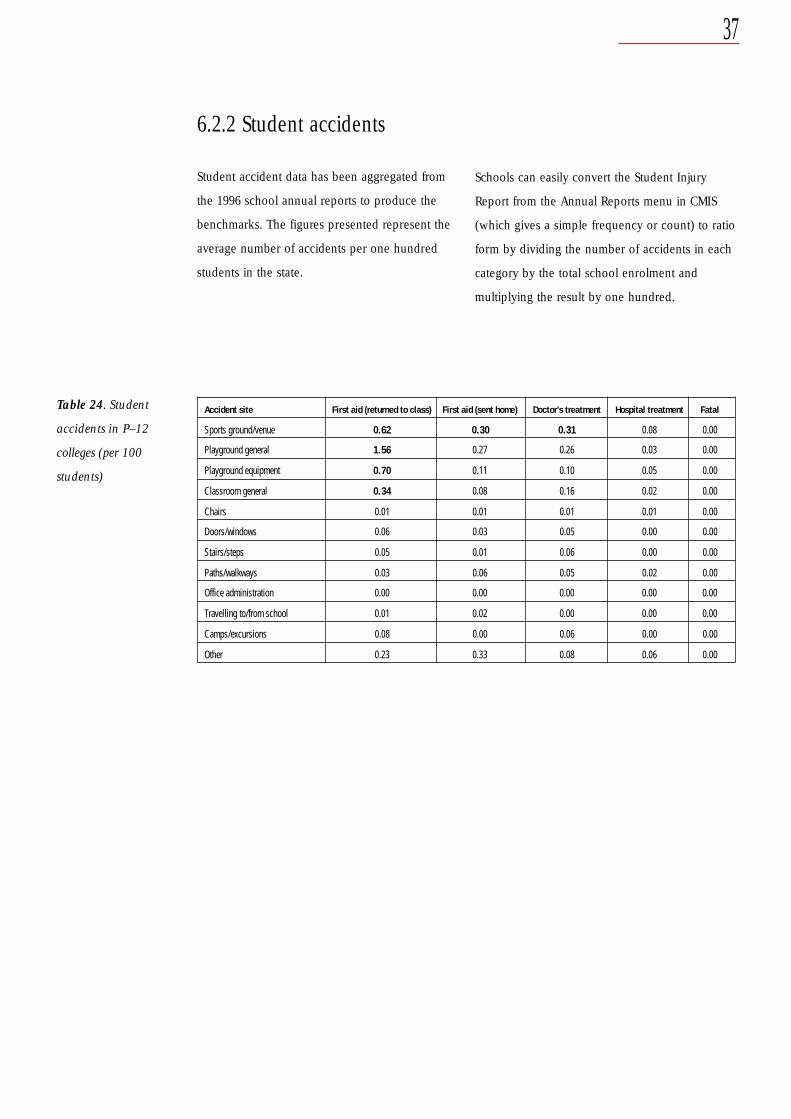
6.2.2 Student accidents
Student accident data has been aggregated from
the 1996 school annual reports to produce the
benchmarks. The figures presented represent the
average number of accidents per one hundred
students in the state.
Schools can easily convert the Student Injury
Report from the Annual Reports menu in CMIS
(which gives a simple frequency or count) to ratio
form by dividing the number of accidents in each
category by the total school enrolment and
multiplying the result by one hundred.
Table 24. Student
accidents in P–12
colleges (per 100
students)
Accident site First aid (returned to class) First aid (sent home) Doctor’s treatment Hospital treatment Fatal
Sports ground/venue 0.62 0.30 0.31 0.08 0.00
Playground general 1.56 0.27 0.26 0.03 0.00
Playground equipment 0.70 0.11 0.10 0.05 0.00
Classroom general 0.34 0.08 0.16 0.02 0.00
Chairs 0.01 0.01 0.01 0.01 0.00
Doors/windows 0.06 0.03 0.05 0.00 0.00
Stairs/steps 0.05 0.01 0.06 0.00 0.00
Paths/walkways 0.03 0.06 0.05 0.02 0.00
Office administration 0.00 0.00 0.00 0.00 0.00
Travelling to/from school 0.01 0.02 0.00 0.00 0.00
Camps/excursions 0.08 0.00 0.06 0.00 0.00
Other 0.23 0.33 0.08 0.06 0.00
38
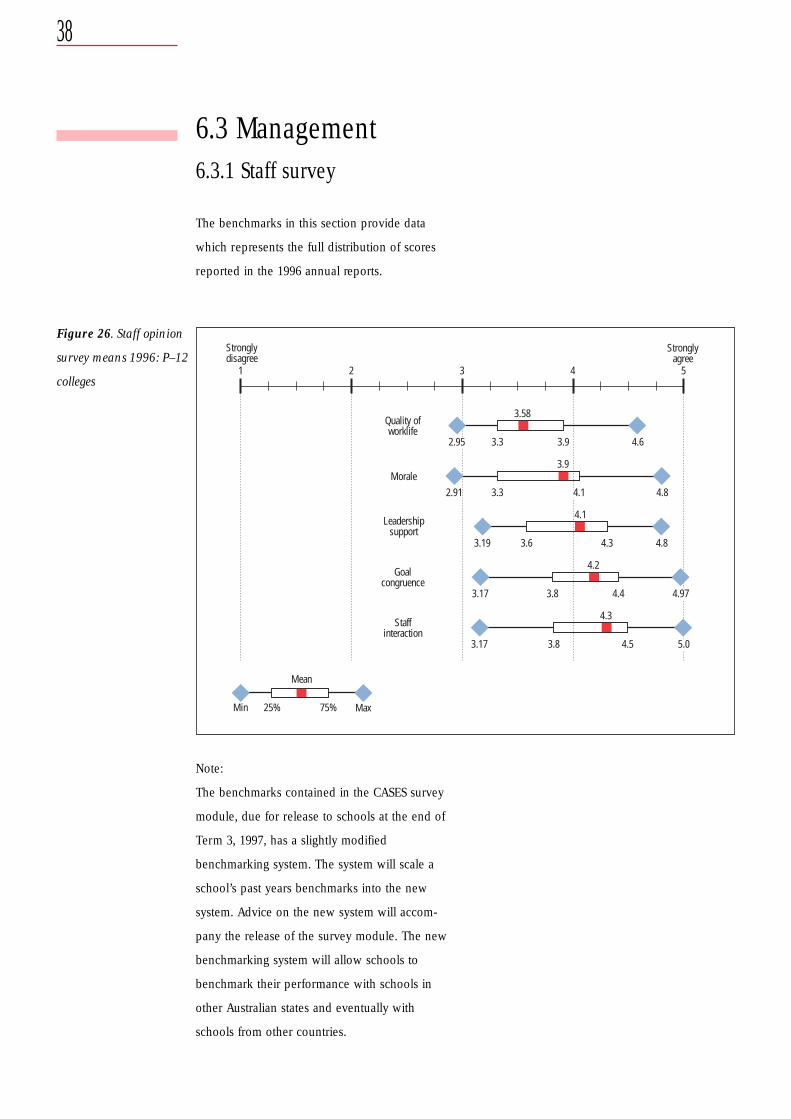
6.3 Management6.3.1 Staff survey
The benchmarks in this section provide data
which represents the full distribution of scores
reported in the 1996 annual reports.
Figure 26. Staff opinion
survey means 1996: P–12
colleges
Stronglydisagree
Stronglyagree
1 2 3 4 5
3.3 3.9 4.6
3.58
2.91 3.3 4.8
3.9
3.19 3.6 4.3 4.8
4.1
3.17 3.8 4.4
4.2
3.17 3.8 4.5
4.3
Morale
Quality ofworklife
Leadershipsupport
Goalcongruence
Staffinteraction
2.95
4.1
4.97
5.0
Min 25% 75% Max
Mean
Note:
The benchmarks contained in the CASES survey
module, due for release to schools at the end of
Term 3, 1997, has a slightly modified
benchmarking system. The system will scale a
school’s past years benchmarks into the new
system. Advice on the new system will accom-
pany the release of the survey module. The new
benchmarking system will allow schools to
benchmark their performance with schools in
other Australian states and eventually with
schools from other countries.
39
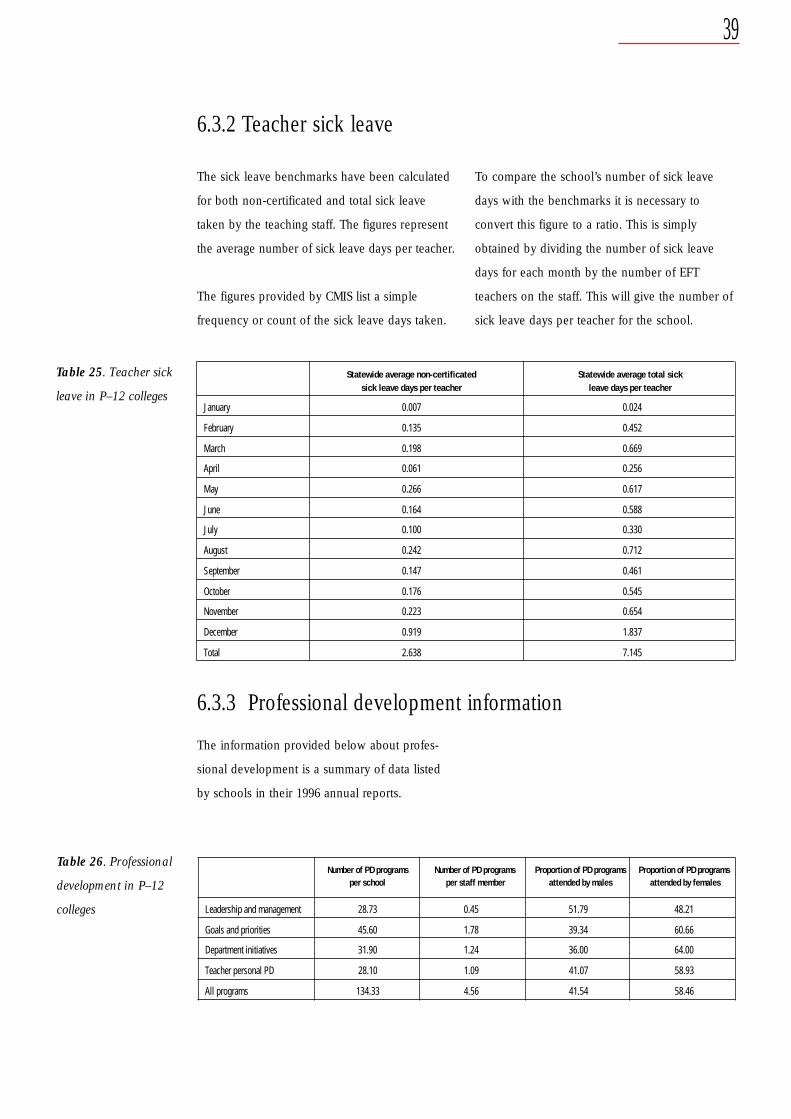
Table 25. Teacher sick
leave in P–12 colleges
Statewide average non-certificated Statewide average total sicksick leave days per teacher leave days per teacher
January 0.007 0.024
February 0.135 0.452
March 0.198 0.669
April 0.061 0.256
May 0.266 0.617
June 0.164 0.588
July 0.100 0.330
August 0.242 0.712
September 0.147 0.461
October 0.176 0.545
November 0.223 0.654
December 0.919 1.837
Total 2.638 7.145
6.3.3 Professional development information
The information provided below about profes-
sional development is a summary of data listed
by schools in their 1996 annual reports.
Table 26. Professional
development in P–12
colleges
Number of PD programs Number of PD programs Proportion of PD programs Proportion of PD programs
Leadership and management 28.73 0.45 51.79 48.21
Goals and priorities 45.60 1.78 39.34 60.66
Department initiatives 31.90 1.24 36.00 64.00
Teacher personal PD 28.10 1.09 41.07 58.93
All programs 134.33 4.56 41.54 58.46
6.3.2 Teacher sick leave
The sick leave benchmarks have been calculated
for both non-certificated and total sick leave
taken by the teaching staff. The figures represent
the average number of sick leave days per teacher.
The figures provided by CMIS list a simple
frequency or count of the sick leave days taken.
To compare the school’s number of sick leave
days with the benchmarks it is necessary to
convert this figure to a ratio. This is simply
obtained by dividing the number of sick leave
days for each month by the number of EFT
teachers on the staff. This will give the number of
sick leave days per teacher for the school.
per school per staff member attended by males attended by females
40
7.1 Curriculum
The curriculum goals are the most important
section of the school charter because the learning
of students is the prime purpose of schooling.
The time that a school allocates to each of the
7. Special schools
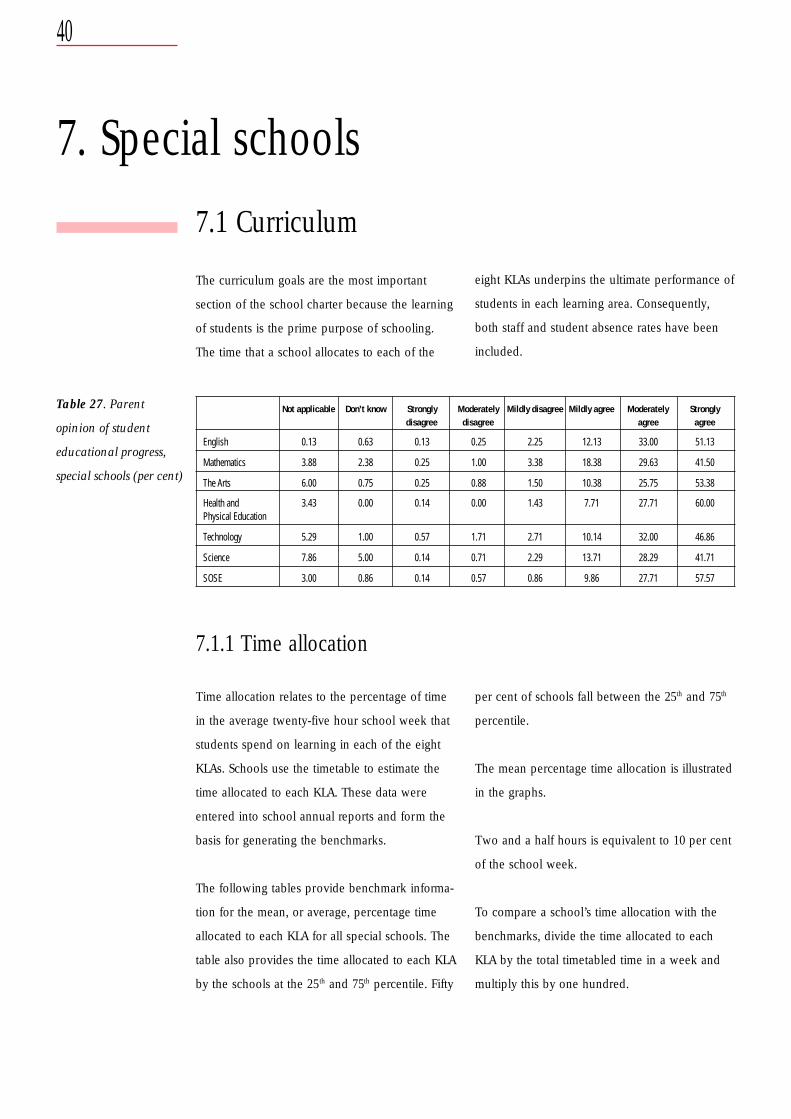
Table 27. Parent
opinion of student
educational progress,
special schools (per cent)
Not applicable Don’t know Strongly Moderately Mildly disagree Mildly agree Moderately Stronglydisagree disagree agree agree
English 0.13 0.63 0.13 0.25 2.25 12.13 33.00 51.13
Mathematics 3.88 2.38 0.25 1.00 3.38 18.38 29.63 41.50
The Arts 6.00 0.75 0.25 0.88 1.50 10.38 25.75 53.38
Health and 3.43 0.00 0.14 0.00 1.43 7.71 27.71 60.00Physical Education
Technology 5.29 1.00 0.57 1.71 2.71 10.14 32.00 46.86
Science 7.86 5.00 0.14 0.71 2.29 13.71 28.29 41.71
SOSE 3.00 0.86 0.14 0.57 0.86 9.86 27.71 57.57
7.1.1 Time allocation
Time allocation relates to the percentage of time
in the average twenty-five hour school week that
students spend on learning in each of the eight
KLAs. Schools use the timetable to estimate the
time allocated to each KLA. These data were
entered into school annual reports and form the
basis for generating the benchmarks.
The following tables provide benchmark informa-
tion for the mean, or average, percentage time
allocated to each KLA for all special schools. The
table also provides the time allocated to each KLA
by the schools at the 25th and 75th percentile. Fifty
eight KLAs underpins the ultimate performance of
students in each learning area. Consequently,
both staff and student absence rates have been
included.
per cent of schools fall between the 25th and 75th
percentile.
The mean percentage time allocation is illustrated
in the graphs.
Two and a half hours is equivalent to 10 per cent
of the school week.
To compare a school’s time allocation with the
benchmarks, divide the time allocated to each
KLA by the total timetabled time in a week and
multiply this by one hundred.
41
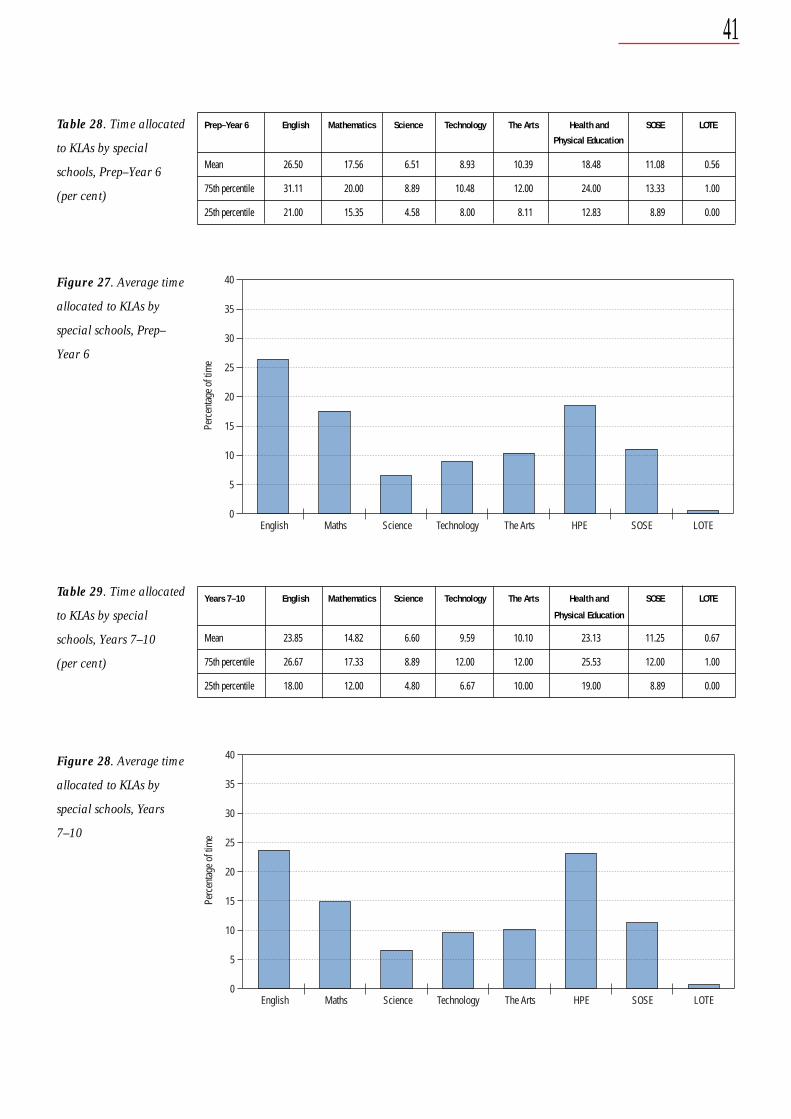
Table 28. Time allocated
to KLAs by special
schools, Prep–Year 6
(per cent)
Prep–Year 6 English Mathematics Science Technology The Arts Health and SOSE LOTE
Mean 26.50 17.56 6.51 8.93 10.39 18.48 11.08 0.56
75th percentile 31.11 20.00 8.89 10.48 12.00 24.00 13.33 1.00
25th percentile 21.00 15.35 4.58 8.00 8.11 12.83 8.89 0.00
Figure 27. Average time
allocated to KLAs by
special schools, Prep–
Year 6
0
5
10
15
20
25
30
35
40
Perc
entag
e of t
ime
English TechnologyMaths Science The Arts HPE SOSE LOTE
Table 29. Time allocated
to KLAs by special
schools, Years 7–10
(per cent)
Years 7–10 English Mathematics Science Technology The Arts Health and SOSE LOTE
Mean 23.85 14.82 6.60 9.59 10.10 23.13 11.25 0.67
75th percentile 26.67 17.33 8.89 12.00 12.00 25.53 12.00 1.00
25th percentile 18.00 12.00 4.80 6.67 10.00 19.00 8.89 0.00
Figure 28. Average time
allocated to KLAs by
special schools, Years
7–10
0
5
10
15
20
25
30
35
40
Perc
entag
e of t
ime
English TechnologyMaths Science The Arts HPE SOSE LOTE
Physical Education
Physical Education
42
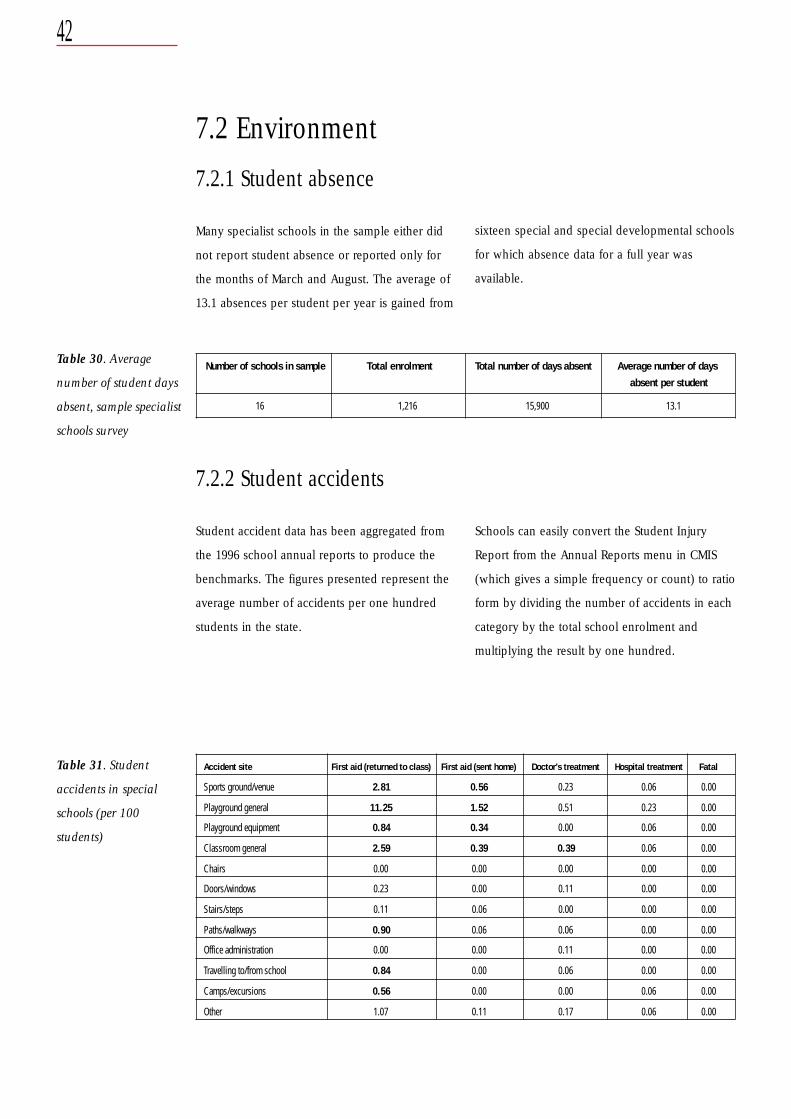
7.2 Environment
7.2.1 Student absence
Many specialist schools in the sample either did
not report student absence or reported only for
the months of March and August. The average of
13.1 absences per student per year is gained from
7.2.2 Student accidents
Student accident data has been aggregated from
the 1996 school annual reports to produce the
benchmarks. The figures presented represent the
average number of accidents per one hundred
students in the state.
Schools can easily convert the Student Injury
Report from the Annual Reports menu in CMIS
(which gives a simple frequency or count) to ratio
form by dividing the number of accidents in each
category by the total school enrolment and
multiplying the result by one hundred.
sixteen special and special developmental schools
for which absence data for a full year was
available.
Table 30. Average
number of student days
absent, sample specialist
schools survey
Number of schools in sample Total enrolment Total number of days absent Average number of days
16 1,216 15,900 13.1
Table 31. Student
accidents in special
schools (per 100
students)
Accident site First aid (returned to class) First aid (sent home) Doctor’s treatment Hospital treatment Fatal
Sports ground/venue 2.81 0.56 0.23 0.06 0.00
Playground general 11.25 1.52 0.51 0.23 0.00
Playground equipment 0.84 0.34 0.00 0.06 0.00
Classroom general 2.59 0.39 0.39 0.06 0.00
Chairs 0.00 0.00 0.00 0.00 0.00
Doors/windows 0.23 0.00 0.11 0.00 0.00
Stairs/steps 0.11 0.06 0.00 0.00 0.00
Paths/walkways 0.90 0.06 0.06 0.00 0.00
Office administration 0.00 0.00 0.11 0.00 0.00
Travelling to/from school 0.84 0.00 0.06 0.00 0.00
Camps/excursions 0.56 0.00 0.00 0.06 0.00
Other 1.07 0.11 0.17 0.06 0.00
absent per student
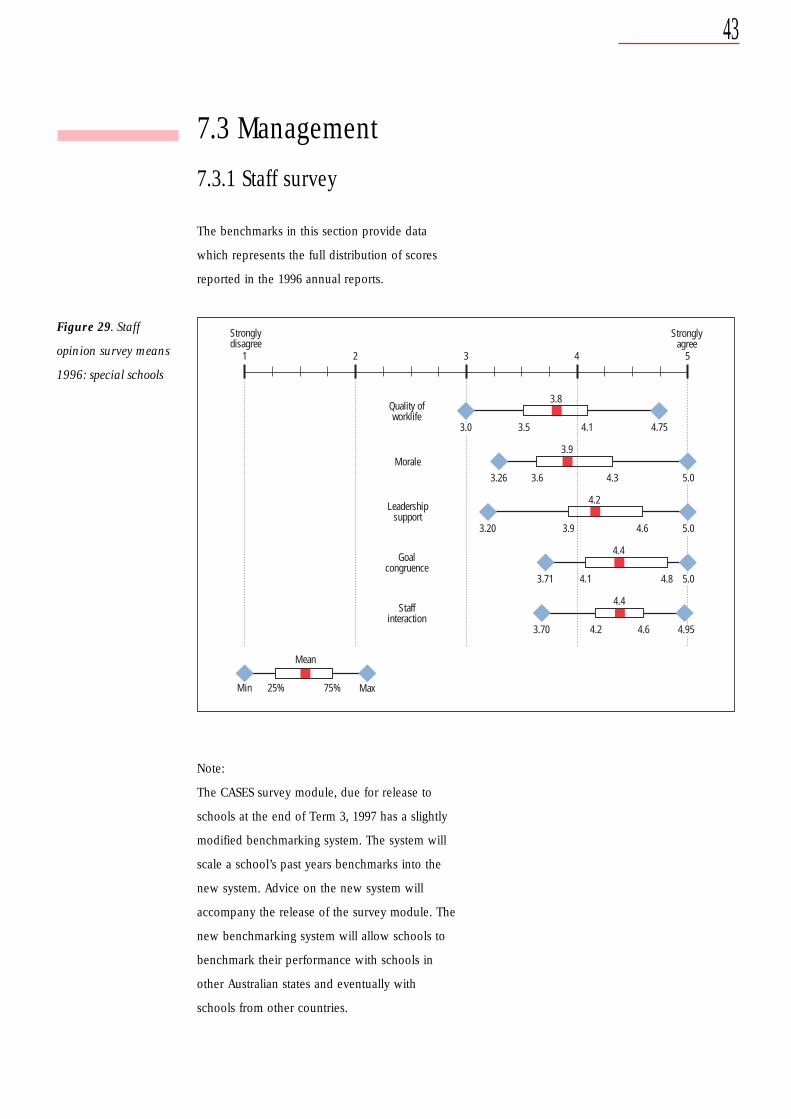
43
7.3 Management
7.3.1 Staff survey
The benchmarks in this section provide data
which represents the full distribution of scores
reported in the 1996 annual reports.
Figure 29. Staff
opinion survey means
1996: special schools
Stronglydisagree
Stronglyagree
1 2 3 4 5
3.5 4.75
3.8
3.26 3.6 4.3
3.9
3.20 3.9 4.6
4.2
3.71 4.1 4.8
4.4
3.70 4.2 4.6
4.4
Morale
Quality ofworklife
Leadershipsupport
Goalcongruence
Staffinteraction
3.0 4.1
5.0
5.0
5.0
4.95
Min 25% 75% Max
Mean
Note:
The CASES survey module, due for release to
schools at the end of Term 3, 1997 has a slightly
modified benchmarking system. The system will
scale a school’s past years benchmarks into the
new system. Advice on the new system will
accompany the release of the survey module. The
new benchmarking system will allow schools to
benchmark their performance with schools in
other Australian states and eventually with
schools from other countries.
44
Table 32. Teacher sick
leave in special schools
Statewide average non-certificated Statewide average total sicksick leave days per teacher leave days per teacher
January 0.005 0.045
February 0.140 0.579
March 0.225 0.904
April 0.058 0.334
May 0.297 0.779
June 0.198 0.875
July 0.113 0.586
August 0.297 1.081
September 0.144 0.625
October 0.168 0.738
November 0.265 0.915
December 0.947 1.894
Total 2.857 9.355
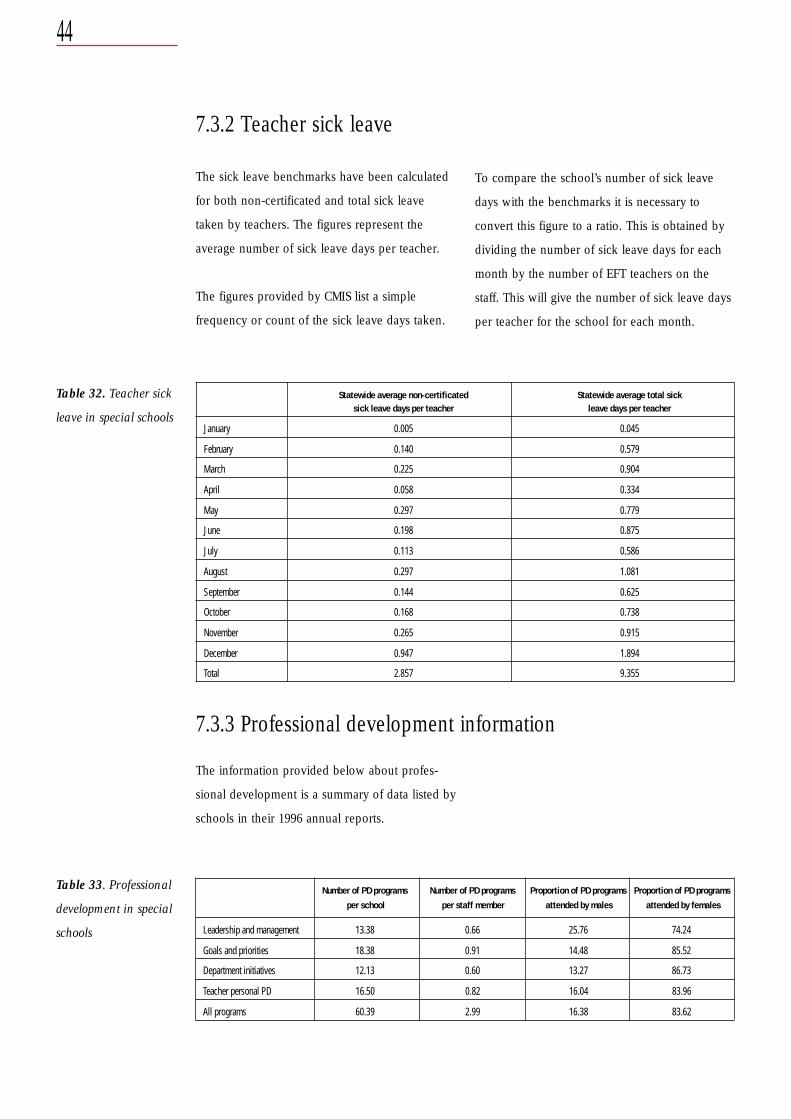
7.3.3 Professional development information
Table 33. Professional
development in special
schools
Number of PD programs Number of PD programs Proportion of PD programs Proportion of PD programs
Leadership and management 13.38 0.66 25.76 74.24
Goals and priorities 18.38 0.91 14.48 85.52
Department initiatives 12.13 0.60 13.27 86.73
Teacher personal PD 16.50 0.82 16.04 83.96
All programs 60.39 2.99 16.38 83.62
7.3.2 Teacher sick leave
The sick leave benchmarks have been calculated
for both non-certificated and total sick leave
taken by teachers. The figures represent the
average number of sick leave days per teacher.
The figures provided by CMIS list a simple
frequency or count of the sick leave days taken.
To compare the school’s number of sick leave
days with the benchmarks it is necessary to
convert this figure to a ratio. This is obtained by
dividing the number of sick leave days for each
month by the number of EFT teachers on the
staff. This will give the number of sick leave days
per teacher for the school for each month.
The information provided below about profes-
sional development is a summary of data listed by
schools in their 1996 annual reports.
per school per staff member attended by males attended by females
45
8. Special developmental schools
8.1 Curriculum
The curriculum goals are the most important
section of the school charter because the learning
of students is the prime purpose of schooling.
The time that a school allocates to each of the
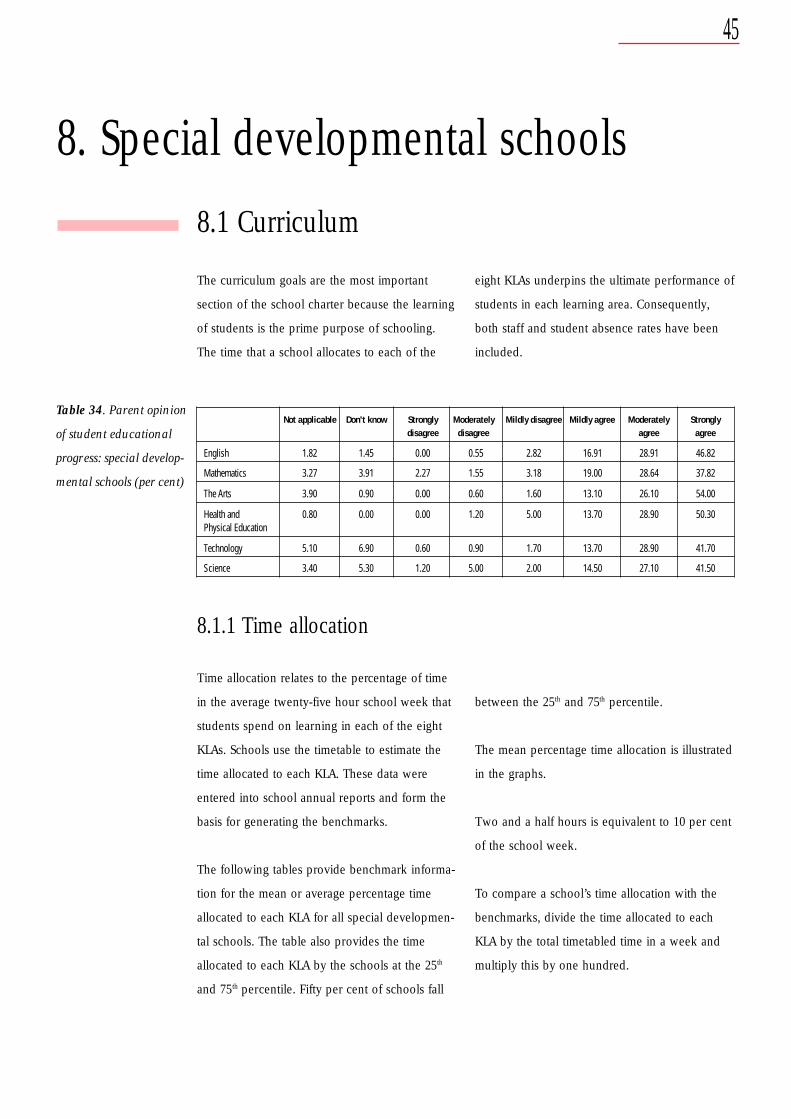
Table 34. Parent opinion
of student educational
progress: special develop-
mental schools (per cent)
eight KLAs underpins the ultimate performance of
students in each learning area. Consequently,
both staff and student absence rates have been
included.
Not applicable Don’t know Strongly Moderately Mildly disagree Mildly agree Moderately Stronglydisagree disagree agree agree
English 1.82 1.45 0.00 0.55 2.82 16.91 28.91 46.82
Mathematics 3.27 3.91 2.27 1.55 3.18 19.00 28.64 37.82
The Arts 3.90 0.90 0.00 0.60 1.60 13.10 26.10 54.00
Health and 0.80 0.00 0.00 1.20 5.00 13.70 28.90 50.30Physical Education
Technology 5.10 6.90 0.60 0.90 1.70 13.70 28.90 41.70
Science 3.40 5.30 1.20 5.00 2.00 14.50 27.10 41.50
8.1.1 Time allocation
Time allocation relates to the percentage of time
in the average twenty-five hour school week that
students spend on learning in each of the eight
KLAs. Schools use the timetable to estimate the
time allocated to each KLA. These data were
entered into school annual reports and form the
basis for generating the benchmarks.
The following tables provide benchmark informa-
tion for the mean or average percentage time
allocated to each KLA for all special developmen-
tal schools. The table also provides the time
allocated to each KLA by the schools at the 25th
and 75th percentile. Fifty per cent of schools fall
between the 25th and 75th percentile.
The mean percentage time allocation is illustrated
in the graphs.
Two and a half hours is equivalent to 10 per cent
of the school week.
To compare a school’s time allocation with the
benchmarks, divide the time allocated to each
KLA by the total timetabled time in a week and
multiply this by one hundred.
46
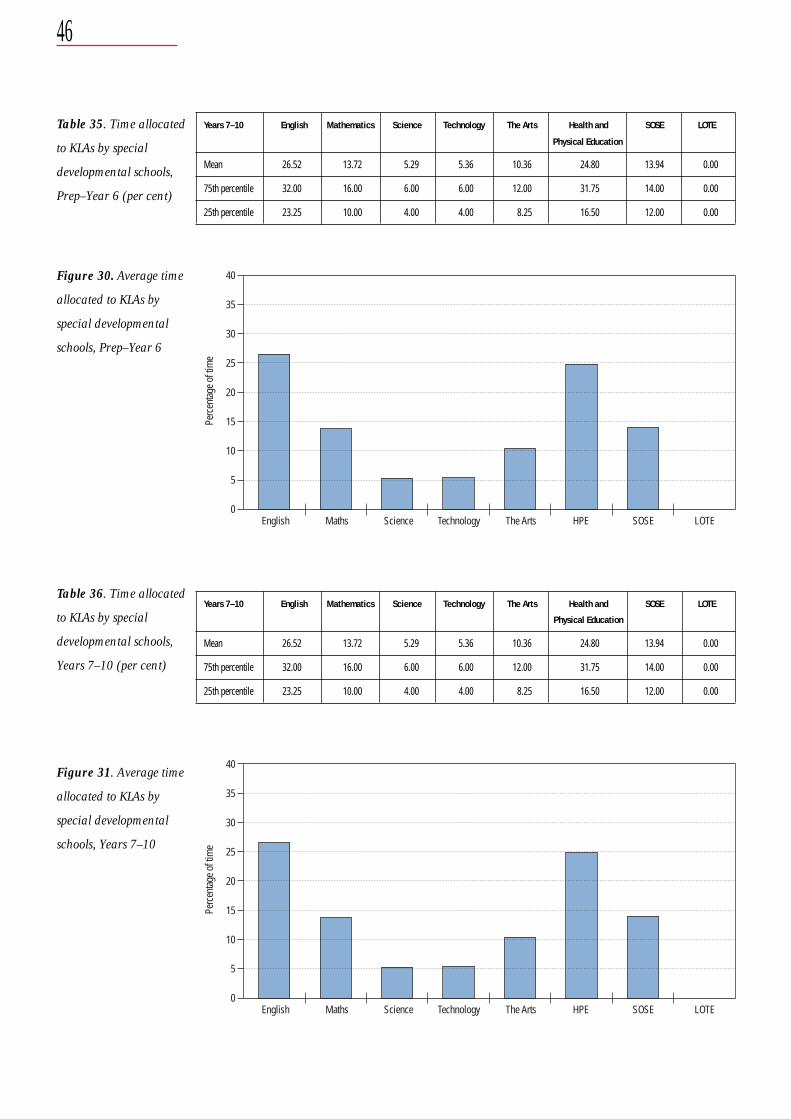
Table 35. Time allocated
to KLAs by special
developmental schools,
Prep–Year 6 (per cent)
Years 7–10 English Mathematics Science Technology The Arts Health and SOSE LOTE
Mean 26.52 13.72 5.29 5.36 10.36 24.80 13.94 0.00
75th percentile 32.00 16.00 6.00 6.00 12.00 31.75 14.00 0.00
25th percentile 23.25 10.00 4.00 4.00 8.25 16.50 12.00 0.00
Figure 30. Average time
allocated to KLAs by
special developmental
schools, Prep–Year 6
Table 36. Time allocated
to KLAs by special
developmental schools,
Years 7–10 (per cent)
Figure 31. Average time
allocated to KLAs by
special developmental
schools, Years 7–10
0
5
10
15
20
25
30
35
40
Perc
entag
e of t
ime
English TechnologyMaths Science The Arts HPE SOSE LOTE
Years 7–10 English Mathematics Science Technology The Arts Health and SOSE LOTE
Mean 26.52 13.72 5.29 5.36 10.36 24.80 13.94 0.00
75th percentile 32.00 16.00 6.00 6.00 12.00 31.75 14.00 0.00
25th percentile 23.25 10.00 4.00 4.00 8.25 16.50 12.00 0.00
0
5
10
15
20
25
30
35
40
Perc
entag
e of t
ime
English TechnologyMaths Science The Arts HPE SOSE LOTE
Physical Education
Physical Education
47
8.2 Environment
8.2.1 Student absence
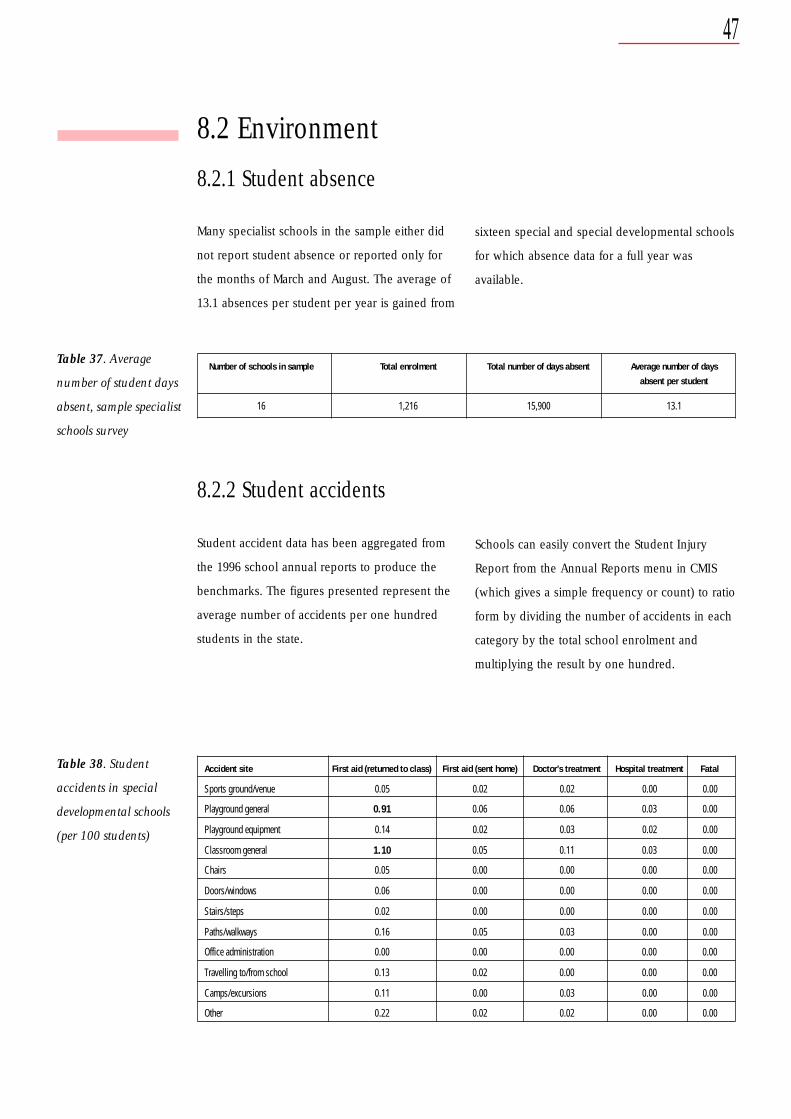
Many specialist schools in the sample either did
not report student absence or reported only for
the months of March and August. The average of
13.1 absences per student per year is gained from
Table 37. Average
number of student days
absent, sample specialist
schools survey
Number of schools in sample Total enrolment Total number of days absent Average number of days
16 1,216 15,900 13.1
8.2.2 Student accidents
Student accident data has been aggregated from
the 1996 school annual reports to produce the
benchmarks. The figures presented represent the
average number of accidents per one hundred
students in the state.
sixteen special and special developmental schools
for which absence data for a full year was
available.
Schools can easily convert the Student Injury
Report from the Annual Reports menu in CMIS
(which gives a simple frequency or count) to ratio
form by dividing the number of accidents in each
category by the total school enrolment and
multiplying the result by one hundred.
Table 38. Student
accidents in special
developmental schools
(per 100 students)
Accident site First aid (returned to class) First aid (sent home) Doctor’s treatment Hospital treatment Fatal
Sports ground/venue 0.05 0.02 0.02 0.00 0.00
Playground general 0.91 0.06 0.06 0.03 0.00
Playground equipment 0.14 0.02 0.03 0.02 0.00
Classroom general 1.10 0.05 0.11 0.03 0.00
Chairs 0.05 0.00 0.00 0.00 0.00
Doors/windows 0.06 0.00 0.00 0.00 0.00
Stairs/steps 0.02 0.00 0.00 0.00 0.00
Paths/walkways 0.16 0.05 0.03 0.00 0.00
Office administration 0.00 0.00 0.00 0.00 0.00
Travelling to/from school 0.13 0.02 0.00 0.00 0.00
Camps/excursions 0.11 0.00 0.03 0.00 0.00
Other 0.22 0.02 0.02 0.00 0.00
absent per student
48
8.3 Management
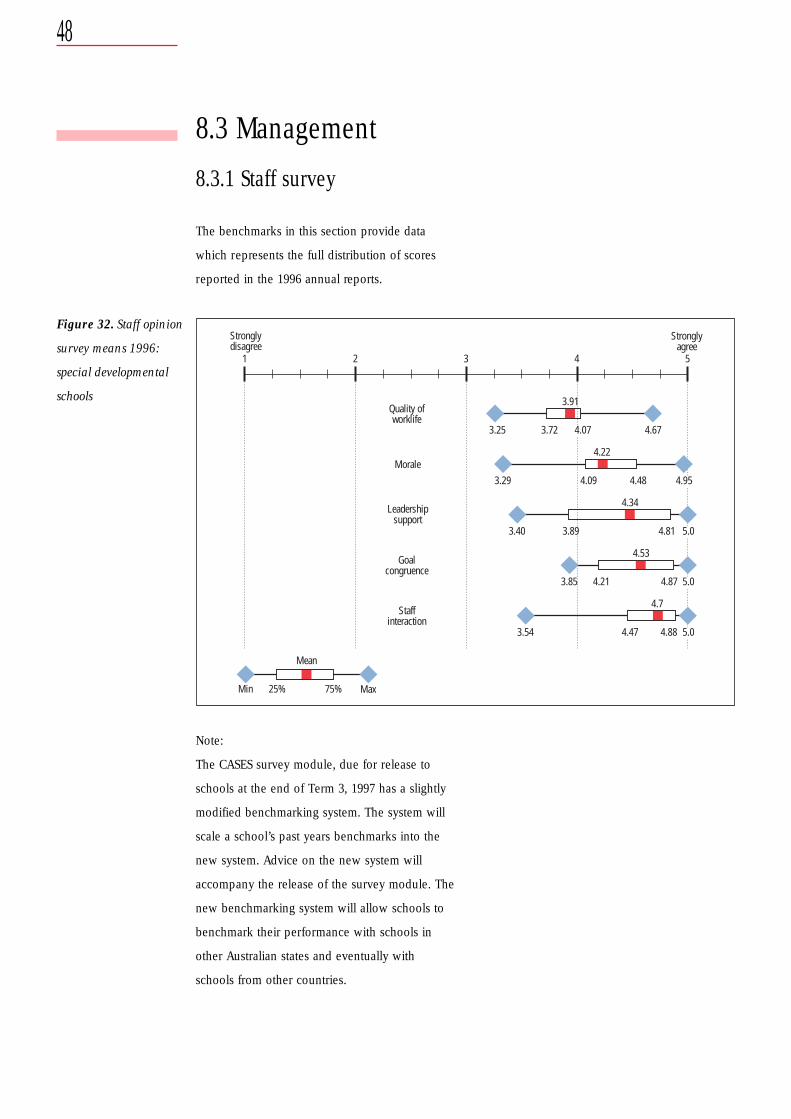
8.3.1 Staff survey
The benchmarks in this section provide data
which represents the full distribution of scores
reported in the 1996 annual reports.
Figure 32. Staff opinion
survey means 1996:
special developmental
schools
Stronglydisagree
Stronglyagree
1 2 3 4 5
3.72 4.67
3.91
3.29 4.09 4.48
4.22
3.40 3.89 4.81
4.34
3.85 4.21 4.87
4.53
3.54 4.47 4.88
4.7
Morale
Quality ofworklife
Leadershipsupport
Goalcongruence
Staffinteraction
3.25 4.07
4.95
5.0
5.0
5.0
Min 25% 75% Max
Mean
Note:
The CASES survey module, due for release to
schools at the end of Term 3, 1997 has a slightly
modified benchmarking system. The system will
scale a school’s past years benchmarks into the
new system. Advice on the new system will
accompany the release of the survey module. The
new benchmarking system will allow schools to
benchmark their performance with schools in
other Australian states and eventually with
schools from other countries.
49
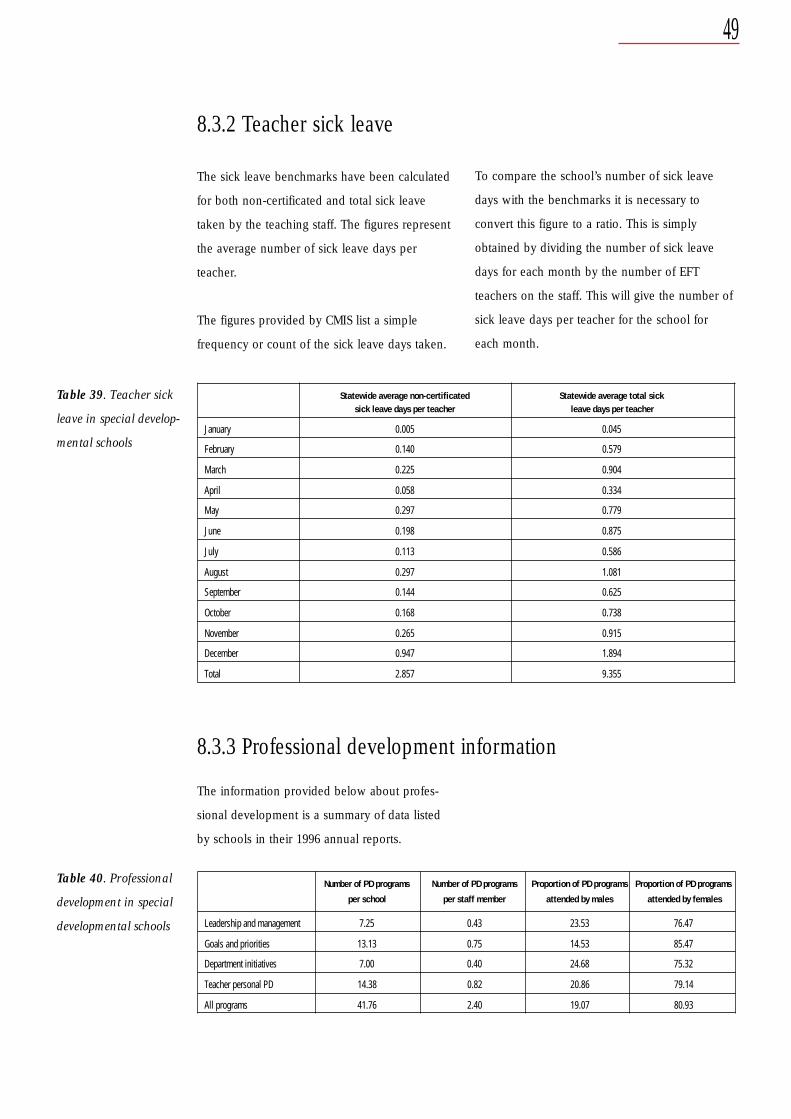
Table 39. Teacher sick
leave in special develop-
mental schools
Statewide average non-certificated Statewide average total sicksick leave days per teacher leave days per teacher
January 0.005 0.045
February 0.140 0.579
March 0.225 0.904
April 0.058 0.334
May 0.297 0.779
June 0.198 0.875
July 0.113 0.586
August 0.297 1.081
September 0.144 0.625
October 0.168 0.738
November 0.265 0.915
December 0.947 1.894
Total 2.857 9.355
The information provided below about profes-
sional development is a summary of data listed
by schools in their 1996 annual reports.
Table 40. Professional
development in special
developmental schools
Number of PD programs Number of PD programs Proportion of PD programs Proportion of PD programs
Leadership and management 7.25 0.43 23.53 76.47
Goals and priorities 13.13 0.75 14.53 85.47
Department initiatives 7.00 0.40 24.68 75.32
Teacher personal PD 14.38 0.82 20.86 79.14
All programs 41.76 2.40 19.07 80.93
8.3.2 Teacher sick leave
The sick leave benchmarks have been calculated
for both non-certificated and total sick leave
taken by the teaching staff. The figures represent
the average number of sick leave days per
teacher.
The figures provided by CMIS list a simple
frequency or count of the sick leave days taken.
To compare the school’s number of sick leave
days with the benchmarks it is necessary to
convert this figure to a ratio. This is simply
obtained by dividing the number of sick leave
days for each month by the number of EFT
teachers on the staff. This will give the number of
sick leave days per teacher for the school for
each month.
8.3.3 Professional development information
per school per staff member attended by males attended by females

50

51

52