Blueprint for Smart Justice Massachusetts · 4 ACLU Smart Justice Executive Summary Over the past...
28
Blueprint for Smart Justice Massachusetts
Transcript of Blueprint for Smart Justice Massachusetts · 4 ACLU Smart Justice Executive Summary Over the past...

Blueprint for Smart Justice
Massachusetts

Blueprint for Smart Justice
Massachusetts© 2018 AMERICAN CIVIL LIBERTIES UNION
COVER PHOTO: SHUTTERSTOCK/MOPICE


Contents
Executive Summary . . . . . . . . . . . . . . . . . . . . . . . . . . . . . . . . . . . . . . . . . . . . . . . . . . . . . . . . . . . . . . . . . . . . . . . . . . . . . . . . . . . . . . . . . . . . . . . . . . . . . . . . . . . . . . . 4
The State of the Massachusetts Prison System . . . . . . . . . . . . . . . . . . . . . . . . . . . . . . . . . . . . . . . . . . . . . . . . . . . . . . . . . . . 6
What Is Driving People Into Prison? . . . . . . . . . . . . . . . . . . . . . . . . . . . . . . . . . . . . . . . . . . . . . . . . . . . . . . . . . . . . . . . . . . . . 6
The Current Prison and Jail Population . . . . . . . . . . . . . . . . . . . . . . . . . . . . . . . . . . . . . . . . . . . . . . . . . . . . . . . . . . . . . . 7
Why Do People Stay in Prison for So Long? . . . . . . . . . . . . . . . . . . . . . . . . . . . . . . . . . . . . . . . . . . . . . . . . . . . . . . . . 7
Who Is Imprisoned . . . . . . . . . . . . . . . . . . . . . . . . . . . . . . . . . . . . . . . . . . . . . . . . . . . . . . . . . . . . . . . . . . . . . . . . . . . . . . . . . . . . . . . . . . . . . . . . . . . . . . 8
People With Mental Health and Substance Use Disorders . . . . . . . . . . . . . . . . . . . . . . . . . . . 9
Budget Strains . . . . . . . . . . . . . . . . . . . . . . . . . . . . . . . . . . . . . . . . . . . . . . . . . . . . . . . . . . . . . . . . . . . . . . . . . . . . . . . . . . . . . . . . . . . . . . . . . . . . . . . . . . . . 10
Ending Mass Incarceration in Massachusetts: A Path Forward . . . . . . . . . . . . . . . . . . . . . . . . . . 11
Reducing Racial Disparities . . . . . . . . . . . . . . . . . . . . . . . . . . . . . . . . . . . . . . . . . . . . . . . . . . . . . . . . . . . . . . . . . . . . . . . . . . . . . . . . . . . . 11
Reducing Admissions . . . . . . . . . . . . . . . . . . . . . . . . . . . . . . . . . . . . . . . . . . . . . . . . . . . . . . . . . . . . . . . . . . . . . . . . . . . . . . . . . . . . . . . . . . . . . . . . 12
Reducing Time Served . . . . . . . . . . . . . . . . . . . . . . . . . . . . . . . . . . . . . . . . . . . . . . . . . . . . . . . . . . . . . . . . . . . . . . . . . . . . . . . . . . . . . . . . . . . . . . 14
Reducing Disability Disparities . . . . . . . . . . . . . . . . . . . . . . . . . . . . . . . . . . . . . . . . . . . . . . . . . . . . . . . . . . . . . . . . . . . . . . . . . . . . . 15
Forecaster Chart . . . . . . . . . . . . . . . . . . . . . . . . . . . . . . . . . . . . . . . . . . . . . . . . . . . . . . . . . . . . . . . . . . . . . . . . . . . . . . . . . . . . . . . . . . . . . . . . . . . . . . . . . 16
Taking the Lead . . . . . . . . . . . . . . . . . . . . . . . . . . . . . . . . . . . . . . . . . . . . . . . . . . . . . . . . . . . . . . . . . . . . . . . . . . . . . . . . . . . . . . . . . . . . . . . . . . . . . . . . . . . 17
Total Fiscal Impact . . . . . . . . . . . . . . . . . . . . . . . . . . . . . . . . . . . . . . . . . . . . . . . . . . . . . . . . . . . . . . . . . . . . . . . . . . . . . . . . . . . . . . . . . . . . . . . . . . . . . 2 1
Methodology Overview . . . . . . . . . . . . . . . . . . . . . . . . . . . . . . . . . . . . . . . . . . . . . . . . . . . . . . . . . . . . . . . . . . . . . . . . . . . . . . . . . . . . . . . . . . . . . . 2 1

4 ACLU Smart Justice
Executive Summary
Over the past five decades, the United States has dramatically increased its reliance on the criminal justice system as a way to respond to drug addiction, mental illness, poverty, and broken schools. As a result, the United States today incarcerates more people, in both absolute numbers and per capita, than any other nation in the world. Millions of lives have been upended and families torn apart. This mass incarceration crisis has transformed American society, has damaged families and communities, created gross racial disparities, and has wasted trillions of taxpayer dollars.
We all want to live in safe and healthy communities, and our criminal justice policies should be focused on the most effective approaches to achieving that goal. But the current system has failed us. It’s time for the United States to dramatically reduce its reliance on incarceration, invest instead in alternatives to prison and approaches better designed to break the cycle of crime and recidivism, and help people rebuild their lives.
The ACLU’s Campaign for Smart Justice is committed to transforming our nation’s criminal justice system and building a new vision of safety and justice. The Campaign is dedicated to cutting the nation’s incarcerated population in half and combatting racial disparities in the criminal justice system.
To advance these goals, the Campaign partnered with the Urban Institute to conduct a two-year research project to analyze the kind of changes needed to cut the number of people in prison in each state by half and reduce racial disparities in incarceration. In every state, Urban Institute researchers identified primary drivers of incarceration and predicted the impact
of reducing prison admissions and length of stay on state prison populations, state budgets, and the racial disparity of those imprisoned.
The analysis was eye-opening.
In every state, we found that reducing the prison population by itself does little to diminish racial disparities in incarceration — and in some cases would worsen them. In Massachusetts — where Black people constitute 27 percent of the prison population1 despite making up only 7 percent of the state’s overall adult population2 — reducing the number of people imprisoned will not on its own reduce racial disparities within the prison system. This finding confirms for the Campaign that urgent work remains for advocates, policymakers, law enforcement officials, district attorneys, and communities in Massachusetts and across the nation to focus on efforts that are specific to combatting these disparities, like reducing incarceration before trial through bail reform, preventing the incarceration of people arrested on misdemeanor and low level felony charges, and parole reform.
In Massachusetts, the prison population nearly tripled between 1980 and 2016, rising to a peak of 11,947 people in 1997 before declining somewhat to 9,496 people as of January 2017.3 As with many states, the War on Drugs has played a key role in Massachusetts’ mass incarceration crisis — in 2015, for example, drug offenses accounted for about one in four prison admissions for criminally sentenced people.4 That same year, robbery and assault accounted for 13 percent and 11 percent of prison admissions for for criminally sentenced people, respectively.5 In 2017, approximately

5Blueprint for Smart Justice: Massachusetts
one in three people with a criminal sentence in Massachusetts prisons had been convicted of an offense not including violence.6 One in seven people (14 percent) were serving time for a drug conviction.7
Mental health and substance use disorders are rampant in the Massachusetts criminal justice system, pointing to an overreliance on incarceration for criminal behavior that may be better addressed by treatment and other alternatives. As of 2016, nearly one in three people imprisoned in Massachusetts had an open mental health case, and more than 20 percent were on psychotropic medicine. Imprisoned women in the state have particularly high rates of mental health disorders. As of 2017, 74 percent of women imprisoned in Massachusetts had a mental health case and 15 percent had been identified as having a serious mental health illness.8
As in most states, mass incarceration in Massachusetts has exacted a particularly heavy toll on communities of color. The state’s prisons have the highest white-Latino disparity in the country, according to most recently available national cross-state comparison data (2014),9 a trend that has continued through 2017, with a Latino imprisonment rate more than four times that of white people in the state.10 The rate is even higher for the state’s Black residents — seven times that of the white imprisonment rate in 2017.11
So, what’s the path forward?
Any meaningful effort to reach a 50 percent reduction in incarceration in Massachusetts will need to, at a minimum, reduce admissions by eliminating cash bail that can push defendants to accept plea deals rather than bear the wide-reaching consequences of attempting to fight their case behind bars for weeks, months, or in some cases, years. In addition, reductions of the rate at which property and motor vehicle offenses are charged by prosecutors will help to reduce prison populations, given that those offenses may have substance abuse as their root cause.
Alternative-to-imprisonment programs have shown great success in reducing criminal activity, as has treatment for addiction and mental health disorders. Massachusetts policymakers have begun to address
the impact such disorders can have, passing a criminal justice reform package in 2018 that makes diversion towards treatment a more accessible option.12 However, political rhetoric must be backed up by the implementation of diversion options listed in the reform bill, as well as other programs that have been on the book for decades. For instance, as recently as 2013, drug offenses resulted in sentences above the recommended guidelines more than half the time they were charged.13 Much remains to be done in the realms of both policy and implementation.
In addition, pushing the age of juvenile jurisdiction up from 18 to 21 will ensure that young adults who are still in a developmental stage are not incarcerated with older adults, which research shows can increase the likelihood that they return to prison in the future.14 This, along with a reevaluation of how often people are placed on probation — which can lead to incarceration — will help reduce Massachusetts’ bloated prison population.
Finally, Massachusetts should stop relying on mandatory minimum sentences for dozens of crimes. These sentences prevent judges from considering individual circumstances in the cases before them and can contribute to high incarceration rates as well as racial disparities. Along with reducing excessively high sentencing ranges and enacting “presumptive parole” — where people eligible for parole would only be denied when there is sound justification — reforming sentencing laws will help to tackle the state’s expensive and ineffective overreliance on incarceration to address criminal behavior.
Were Massachusetts to adopt these and other reforms outlined in this blueprint, our analysis shows that it could save a staggering $833 million by 2025 — money that could be better spent on schools, services, and infrastructure for residents of the state.
The answer is ultimately up to Massachusetts’ voters, policymakers, law enforcement officials, district attorneys, courts, communities, and criminal justice reform advocates as they move forward with the urgent work of ending the state’s obsession with mass incarceration.
6 ACLU Smart Justice
The State of the Massachusetts Prison System
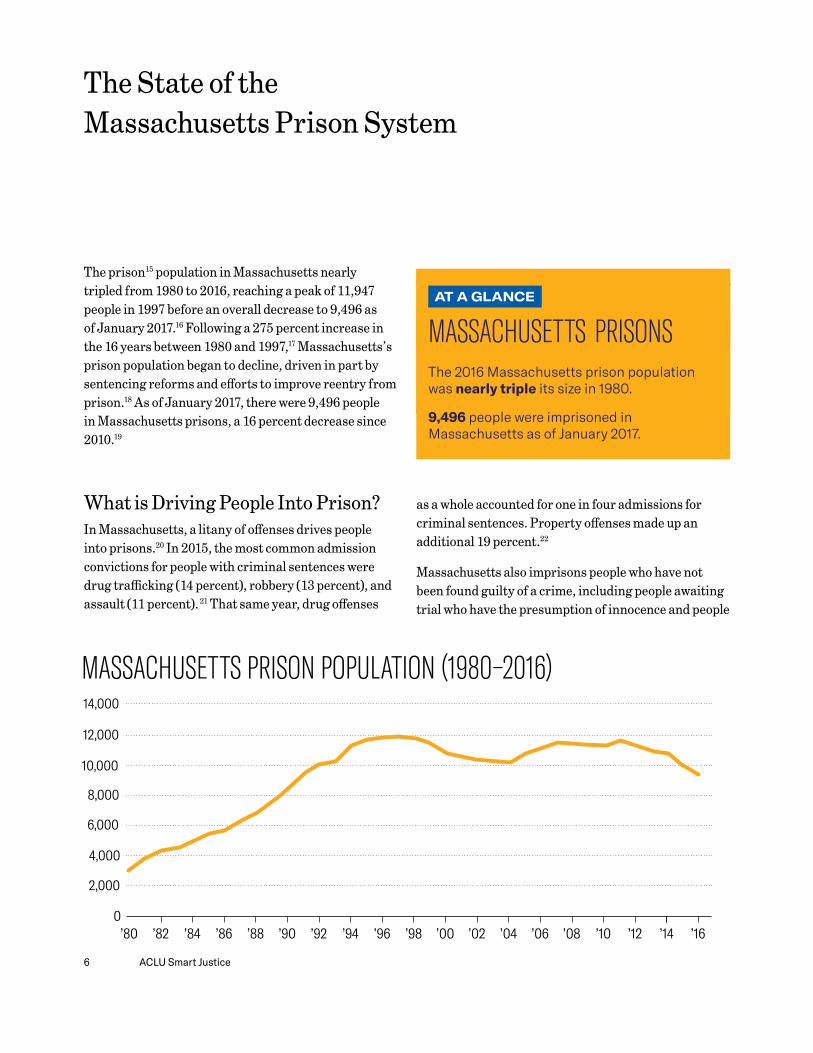
The prison15 population in Massachusetts nearly tripled from 1980 to 2016, reaching a peak of 11,947 people in 1997 before an overall decrease to 9,496 as of January 2017.16 Following a 275 percent increase in the 16 years between 1980 and 1997,17 Massachusetts’s prison population began to decline, driven in part by sentencing reforms and efforts to improve reentry from prison.18 As of January 2017, there were 9,496 people in Massachusetts prisons, a 16 percent decrease since 2010.19
What is Driving People Into Prison?In Massachusetts, a litany of offenses drives people into prisons.20 In 2015, the most common admission convictions for people with criminal sentences were drug trafficking (14 percent), robbery (13 percent), and assault (11 percent). 21 That same year, drug offenses
as a whole accounted for one in four admissions for criminal sentences. Property offenses made up an additional 19 percent.22
Massachusetts also imprisons people who have not been found guilty of a crime, including people awaiting trial who have the presumption of innocence and people
14,000
6,000
8,000
10,000
12,000
4,000
2,000
’80 ’82 ’84 ’86 ’88 ’90 ’92 ’94 ’96 ’98 ’00 ’02 ’04 ’06 ’08 ’10 ’12 ’140
’16
MASSACHUSETTS PRISON POPULATION (1980–2016)MASSACHUSETTS
AT A GLANCE
MASSACHUSETTS PRISONSThe 2016 Massachusetts prison population was nearly triple its size in 1980.
9,496 people were imprisoned in Massachusetts as of January 2017.

7Blueprint for Smart Justice: Massachusetts
who have been civilly committed for mental health or substance abuse problems. In 2017, about one in 10 people imprisoned in Massachusetts23 had not been criminally sentenced to prison.24
The Current Prison and Jail PopulationIn 2017, one in three people (31 percent) with a criminal sentence in Massachusetts prisons was convicted of an offense not involving violence.25 While the number of people sentenced to prison for drug offenses declined by almost 50 percent between 2007 and 2017, one in seven people (14 percent) imprisoned in 2017 was serving time for a drug conviction.26
In 2017, 45 percent of men and 31 percent of women imprisoned in Massachusetts entered prison with less than a ninth-grade reading level. In addition, 44 percent of men and 31 percent of women had less than a sixth-grade math level.27
According to most recently available data (in 2015), Massachusetts incarcerates an estimated 9,940 people at the county level, nearly 60 percent of whom have not been convicted of a crime and are awaiting trial.28
Why Do People Stay in Prison for So Long?While the number of people in Massachusetts prisons has decreased in recent years, sentence length and length of imprisonment have both continued to rise. The number of people serving a life sentence in Massachusetts grew by 30 percent between 2000 and 2017, accounting for nearly one in four people (24 percent) in prison in 2017.29 At the same time,
14%13%
11%
8% 8%
4%
8%
12%
16%
Drug Trafficking
Theft0
Robbery Assault Homicide
MASSACHUSETTS PRISON ADMISSIONS BY TOP OFFENSE TYPE (2015)
AT A GLANCE
MASSACHUSETTS 2017 PRISON POPULATION31 percent of criminally-sentenced people were imprisoned for an offense not involving violence.
One in 7 criminally-sentenced people were serving time for a drug offense.
45 percent of imprisoned men entered with less than a ninth-grade reading level.
31 percent of imprisoned women entered with less than a sixth-grade math level.

8 ACLU Smart Justice
the number of people serving time for shorter sentences has dropped. Consequently, the average length of imprisonment for people serving time in Massachusetts prisons increased by 24 percent between 2011 and 2017.30
Compounding matters, the number of criminally-sentenced people released from prison declined 21 percent between 2009 and 2016. In 2016, more than half (56 percent) of people released from prison had “maxed out,” or reached the end of their prison sentence.31
The criminal code in Massachusetts also includes harsh sentencing laws that trigger mandatory prison sentences in many cases, including habitual offense laws for people with prior criminal convictions. In 2012, for example, Massachusetts passed a law requiring judges to sentence people with two or more felony convictions (for any one of 41 crimes) to the harshest prison term available by law.32
Massachusetts has also adopted mandatory minimum sentences, which require a specific sentence length for a crime, regardless of the circumstances. While the number of people serving time for a mandatory drug offense has declined by more than 50 percent since 2007, in 2017 the majority (70 percent) of people imprisoned for a drug offense were serving a mandatory minimum sentence.33 These mandatory laws impose inflexible prison sentences on people who would otherwise be eligible for shorter sentences or alternatives to incarceration, such as probation.34
Despite these harsh sentencing laws, the total number of annual admissions to Massachusetts prisons dropped by 20 percent between 2009 and 2016.35 This trend was driven in part by a drop in the annual number of people imprisoned before they had a trial, which declined by 38 percent between 2009 and 2016.36 However, urgent reform is still needed to reduce the average length of imprisonment in Massachusetts, which has continued to grow in recent years.
Between 2004 and 2014, the number of people released on parole dropped by 55 percent.37 Massachusetts also limits the amount of time someone can earn against their sentences for participating in smart release
options, like educational or vocational programming and rehabilitative treatment — despite the fact that such programs can improve outcomes for people reentering their communities. Instead, people imprisoned in Massachusetts must serve 100 percent of their minimum sentences before they are eligible to take advantage of smart release options.38
Who Is ImprisonedBlack Massachusetts Residents: As of 2017, the imprisonment rate for Black people in Massachusetts is seven times higher than the white imprisonment rate. While Black people constitute only 7 percent of the state adult population, they make up 27 percent of its prison population. As of 2017, one in 71 Black men in Massachusetts are imprisoned.39
Latino Massachusetts Residents: Massachusetts prisons have the highest white-Latino disparity in the country, as of 2014 (the most recently available cross-state comparison data).40 In 2017, the Latino imprisonment rate in Massachusetts was more than four times that of white people in the state, and one in 118 Latino men in Massachusetts were imprisoned. Overall, as of 2017, Latinos constitute only 12 percent
MASSACHUSETTS PRISON POPULATION BY OFFENSE TYPE (2015)
SexualAssault
Other Offense NotPertaining to Violence Drug Offense
Homicide
Other Offense Pertaining to Violence
Robbery
19% 15%
30%
14%
14%
8%
BJS, National Corrections Reporting Program, 2015; Please note that this chart includes the most recent publicly available detailed prison population by offense type data from 2015, while more recent broad category-level data from 2017 is included above in the narrative.

9Blueprint for Smart Justice: Massachusetts
of the total state adult population, but they make up 25 percent of its prison population.41
Female Massachusetts Residents: While the number of women imprisoned in Massachusetts declined by 19 percent between 2010 and 2017, nearly half (44 percent) of women imprisoned in 2017 were serving time for an offense not involving violence.42
Older Massachusetts Residents: Though generally considered to pose a negligible risk to public safety, the prison population 60 years or older increased by 35 percent between 2010 and 2017, despite a drop in the overall prison population. In 2017, people over the age of 50 accounted for more than one in four people in the Massachusetts prison population.43
People With Mental Health and Substance Use DisordersAs of 2017, nearly one in three people imprisoned in Massachusetts had an open mental health case, and more than 20 percent were on psychotropic medicine.44 That proportion is even higher among women. As of 2017, 74 percent of women imprisoned in Massachusetts had an open mental health case, and 15
percent had been identified as having a serious mental health illness.45
Budget StrainsAs Massachusetts’s prison population has risen, so has the cost burden. In 2016, Massachusetts spent $1.4 billion of its general fund on corrections, accounting for nearly 5 percent of the state’s overall general fund expenditures. These costs have grown more than 350 percent since 1986, while there were cuts in spending
AT A GLANCE
LENGTH OF IMPRISONMENT The number of people serving a life sentence in Massachusetts prisons increased by 30 percent between 2000 and 2017.
1 in 4 people in Massachusetts prisons was serving a life sentence in 2017.
The average length of imprisonment grew by 24 percent between 2011 and 2017.
The number of people granted parole decreased by 55 percent between 2004 and 2014.
AT A GLANCE
DEMOGRAPHICSThe imprisonment rate for Black people in Massachusetts is seven times higher than the white imprisonment rate as of 2017.
Massachusetts’ prisons have the highest racial disparity between Latino and white people in the country according to most recently available national data (2014).
44 percent of women imprisoned in Massachusetts were behind bars for an offense not involving violence as of 2017.
AT A GLANCE
MENTAL HEALTH AND SUBSTANCE USE DISORDERS Nearly 1 in 3 people imprisoned in Massachusetts had an open mental health case in 2017.
74 percent of imprisoned women had a mental health case in 2017.
15 percent of imprisoned women had a serious mental health disorder in 2017.

10 ACLU Smart Justice
on other priorities like higher education during the same period.46
The outcome of all this spending on incarceration has been poor. Despite spending billions on incarceration, one in three criminally-sentenced people released from Massachusetts prisons in 2013 was re-incarcerated within three years.47
AT A GLANCE
SPENDING ON CORRECTIONS Massachusetts spent $1.4 billion of its general fund on corrections in 2016.
General fund spending on corrections has grown by 353 percent between 1986 and 2016.
1 in 3 criminally-sentenced people released in 2013 were re-incarcerated within three years.

11Blueprint for Smart Justice: Massachusetts
There are many potential policy changes that can help Massachusetts end its mass incarceration crisis, but it will be up to the people and policymakers of Massachusetts to decide which changes to pursue. To reach a 50 percent reduction, policy reforms will need to reduce the amount of time people serve in prisons and/or reduce the number of people entering prisons in the first place.
Reducing Racial DisparitiesReducing the number of people who are incarcerated in Massachusetts prisons will not on its own significantly reduce racial disparities in the prison system.
It is important to remember that there are many internal and external factors that impact a state’s prison population. To reduce racial disparities, reforms will need to focus on addressing biases within and outside of the criminal justice system. Due to systemic racism in health care, affordable housing, and public education, it’s difficult to make significant and long-lasting racial justice reforms within the prison system alone. Systematic biases in policing and prosecutorial decision-making further play a contributing role in this cycle of disparity.
People of color (especially Black, Latino, and Native American people) are at a higher risk of becoming involved in the justice system, including living under heightened police surveillance48 and being at higher risk for arrest. This disproportionality cannot be accounted for by disparate involvement in illegal activity, and it grows at each stage in the justice system, beginning with initial law enforcement contact and increasing at subsequent phases such as pretrial
detention, conviction, sentencing, and post-release opportunities.49 Targeting only one of the factors that drives racial disparity would not adequately address discrimination across the system.
Racial disparity is so ingrained in the system that it cannot be mitigated by solely reducing the scale of mass incarceration. Shrinking the prison population across the board will likely result in lowering imprisonment rates for all racial and ethnic populations, but it will not address comparative disproportionality across populations. For example, focusing on reductions to prison admissions and length of stay in prison is critically important, but those reforms do not address the policies and practices among police, prosecutors, and judges that contribute greatly to the racial disparities that plague the prison system.
New Jersey, for example, is often heralded as one of the most successful examples of reversing mass incarceration, passing justice reforms that led to a 26 percent decline in the state prison population between 1999 and 2012.50 However, the state did not target racial disparities in incarceration and, in 2016, Black people in New Jersey were still more than 12 times as likely to be imprisoned as white people — the highest disparity of any state in the nation.51 In Massachusetts, Black people constitute only 7 percent of the state’s adult population, but they make up 27 percent of the prison population as of 2017.52
Ending mass incarceration is critical to eliminating racial disparities, but not sufficient without companion efforts that take aim at other drivers of racial inequities outside of the criminal justice system. Reductions in
Ending Mass Incarceration in Massachusetts: A Path Forward
12 ACLU Smart Justice
disparate imprisonment rates require implementing explicit racial justice strategies.
Some examples include:
• Tackling disparities in policing, bail, prosecution, plea bargaining, sentencing, and release and reentry opportunities, which can all be pursued through regular engagement with data on race and ethnicity as well as an increased focus on anti-racism education and inclusion within law enforcement and judicial agencies
• Requiring racial impact statements before any new criminal law or regulation is passed and requiring legislation proactively rectify any potential disparities that may result with new laws or rules
• Addressing any potential racial bias in risk assessment instruments used to assist decision-making in the criminal justice system
• Reducing reliance on wealth-based pretrial detention, which disproportionately impacts Black and Latino people and significantly increases the likelihood of serving more time in prison
• Ending over-policing in communities of color
• Investing in diversion/alternatives to detention in communities of color
Reducing AdmissionsTo end mass incarceration, Massachusetts must break its overreliance on prisons. In fact, evidence indicates that prisons seldom offer adequate solutions to wrongful behavior. At worst, imprisonment can be counterproductive, failing to end cycles of misbehavior and violence or to provide rehabilitation for incarcerated people or adequate accountability to the survivors of crime.53 Here are some strategies:
• Charging Practices: Massachusetts prosecutors should reduce the rate at which they charge people for property and motor
vehicle offenses. In 2013 — the most recent year Massachusetts courts released data on their dockets — these offenses together accounted for about 57 percent of all district court convictions.54 The court imposes incarceration on a significant portion of those convicted of these offenses — in 2013, 43 percent of people convicted of property offenses and 22 percent of people convicted of motor vehicle offenses were sentenced to incarceration.55 Today, this trend continues. In 2015, 18 percent of new court commitments to prison were people convicted of property crimes56 and 5 percent were convicted of motor vehicle offenses.57 But too often, incarceration cannot address the underlying causes of these offenses. Prosecutors should instead deprioritize these offenses in their charging decisions. Where appropriate, they should instead offer people the opportunity to enter programming that provides services or treatment.
• Alternatives to Incarceration: The good news is that alternatives exist. Several types of alternative-to-imprisonment programs have shown great success in reducing criminal activity. Programs offering support services such as substance use disorder treatment, mental health care, employment, housing, health care, and vocational training —often with some element of a community service requirement — have significantly reduced recidivism rates for participants. For crimes involving violence, restorative justice programs — which are designed to hold responsible people accountable and support those who were harmed — can be particularly promising. When they are rigorous and well-implemented, these processes have not only been demonstrated to reduce recidivism for defendants,58 they have also been shown to decrease symptoms of post-traumatic stress in victims of crime.59 Prosecutors and judges who embrace these solutions can fulfill their responsibilities to public safety and to supporting victims in their healing, while often generating far better results than imprisonment can deliver. Other successful models include
13Blueprint for Smart Justice: Massachusetts
programs that divert people to treatment and support services before arrest and prosecutor-led programs that divert people before they are charged. Some alternatives to incarceration are increasingly focused on keeping the parent-child relationship intact where possible. For example, Massachusetts now allows those convicted of a nonviolent offense who are also the primary caretaker of a dependent child to request an alternative to incarceration.60 This alternative enables such parents to live with their children in their community or else have regular visits with them while receiving treatment. These family- and community-based alternatives to incarceration should be further funded and encouraged.
• Alternatives to Incarceration — Treatment: In recent years, Massachusetts has turned increasing attention to alternatives to incarceration, such as treatment for addiction and mental health disorders. The state’s 2018 criminal justice reform package includes several provisions aimed at making diversion toward treatment for those with addiction or behavioral health disorders a more accessible option.61 For example, the new law requires that district attorneys establish diversion programs within their districts for use by veterans and those with mental illness and addiction issues. The Massachusetts Legislature should continue to invest in and expand these programs, so they can help people reduce the collateral damage of incarceration while addressing the underlying causes of their offenses. Effective diversion programs coordinate with community services that provide a wide range of substantial, quality wraparound treatment and support for people with disabilities so they can access housing, employment, and intensive, individualized supports in the community. After an initial investment in community supports, diversion programs have the potential of saving jurisdictions large amounts of money. Judges, police officers, sheriffs, and state attorneys should be encouraged to make use of such
programs wherever possible. The state should also focus on educating judges in particular on the benefits of these programs for those living with addiction. In 2013 — the most recent year Massachusetts courts published sentencing data — judges sentenced people convicted of mandatory drug offenses to sentence lengths over the recommended guidelines 51 percent of the time.62 With better understanding on how to best treat addiction, judges can help curb mass incarceration.
• Eliminate Cash Bail: Massachusetts can significantly reduce its rates of pretrial detention by eliminating its use of cash bail. Far too often, people who cannot afford their bail will end up in jail for weeks, months, or, in some cases, years as they wait for their day in court. When this happens, the criminal justice system leaves them with a difficult choice: take a plea deal or fight the case from behind bars. While detained pretrial, research shows many people face significant collateral damage, such as job loss or interrupted education.63 After even a short stay in jail, taking a plea deal can sound less burdensome than losing everything, which is likely why evidence shows that pretrial detention significantly increases a defendant’s risk of conviction.64 The current cash bail system particularly harms people of color. Research shows that they are detained at higher rates across the country when unable to meet bail and that courts set significantly higher bail amounts for them.65 In Barnstable County, for example, the median bail amount for Black defendants was four times higher than it was for white defendants.66 Despite these consequences, Massachusetts courts have increased the number of defendants they detain pretrial in recent years.67 In order to significantly reduce pretrial detention and combat racial disparities, the Massachusetts Legislature should eliminate cash bail and limit pretrial detention to the rare case where a person poses a serious, clear threat to another person.

14 ACLU Smart Justice
• Juvenile Justice Reform: The Massachusetts Legislature should amend state law to increase the age of juvenile jurisdiction from 18 to 21. Massachusetts incarcerates its young people in adult prisons at disproportionate rates, and these young adults are significantly more likely to end up back in prison than other age groups.68 But severely punishing young adults does not reflect what we now know about their decision-making and development. Research has shown that human brains do not fully develop until well into one’s 20s.69 Young adulthood is a distinct developmental stage, notable for risk-taking proclivities and difficulty making decisions with the future in mind.70 Notably, sociologists have long observed that most people “age out” of criminality by their mid-20s.71 However, studies have revealed that they are also especially affected by and sensitive to their environments. Thus, when 19- and 20-year-olds are incarcerated in adult prisons, they tend to be more adversely affected by their challenging surroundings. This helps to explain why those who experience adult prison are especially likely to return to the criminal justice system. After Massachusetts increased the juvenile jurisdiction age from 17 to 18 in 2013, the state experienced a drop in juvenile arrests.72 This aptly demonstrates how holding young adults responsible for their actions in more developmentally appropriate ways can produce better individual and societal outcomes. Increasing the age of juvenile jurisdiction to 21 would build on this successful reform and help more of Massachusetts’ young adults and their communities.
• Reduce Overreliance on Probation: Although probation is often viewed as an alternative to incarceration, there are multiple offenses that do not warrant the level of supervision assigned to individuals. Placing too many people on probation, however, leads to more people being incarcerated. According to the Council of State Governments, 19 percent of people admitted to prison and 49 percent of people admitted to houses of corrections in
2015 were on probation — some of whom merely violated their probation conditions.73 Parole revocations for technical violations can be due to the physical or mental disabilities that many parolees have. Parole and probation officers need training on their obligation to provide reasonable accommodations so that parolees with disabilities have an equal opportunity to comply with the requirements of parole. Proper training of parole officers, and greater awareness of, and advocacy for, these requirements could reduce the number of technical violations significantly. Further, incarceration for technical violations should be eliminated entirely. By reducing the number of people assigned to lengthy terms of probation, Massachusetts can also reduce the number of people who ultimately end up incarcerated.
Reducing Time ServedReducing time served, even by just a few months, can lead to hundreds of fewer people in Massachusetts prisons.
• Sentencing Reform — Eliminate Mandatory Minimums: Despite recent reforms to eliminate some mandatory minimum sentences,74 Massachusetts still has mandatory minimum sentences for dozens of crimes.75 Mandatory minimums prevent judges from considering individual circumstances in the cases before them, and ultimately contribute to high incarceration rates and racial disparities. The Massachusetts Legislature should eliminate mandatory minimums altogether. This reform is widely supported. In 2017, the Massachusetts Sentencing Commission recommended the abolition of mandatory minimum sentences for all crimes except murder.76 The same year, the MassINC Polling Group found that only 8 percent of Massachusetts respondents support requiring a judge to use mandatory minimums as opposed to giving them partial to complete discretion in sentencing decisions.77 By eliminating mandatory minimums, the Legislature will

15Blueprint for Smart Justice: Massachusetts
allow judges the ability to fashion proportional sentences on a case-by-case basis, preventing people from receiving excessive prison time.
• Sentencing Reform — Reduce Sentence Lengths: Evidence indicates that long prison sentences have minimal, if any, deterrent effect and do not improve recidivism rates.78 A recent review of studies concludes there is little evidence that length of stay increases deterrence at all, while another recent study found merely limited evidence of deterrence, primarily concentrated in the first few years behind bars.79 Simply put, research does not support theories that have long provided the basis for why our state locks people up for decades. The Massachusetts Legislature should reduce sentence ranges embedded in its criminal code, even for crimes considered more serious or involving violence. If more research is necessary to determine an appropriate sentence, the Massachusetts Legislature should commission this work to inform future sentencing reforms.
• Release Policy Reform: Parole releases in Massachusetts plummeted between 2004 and 2014.80 To better ensure people are afforded a genuine opportunity for release, the Massachusetts Legislature should enact “presumptive parole.” This would require the parole board to justify denying a person’s release when he or she is eligible for parole. Increasing parole opportunities allows more people to reintegrate into society, saving taxpayer dollars every year. Research shows presumptive parole reduces recidivism after release while promoting safety inside of correctional facilities.81
Reducing Disability DisparitiesPeople with disabilities are two to six times more likely to come into contact with the criminal justice system than people without disabilities. In particular, people with psychiatric disabilities are dramatically overrepresented in jails and prisons across the country.
• People showing signs of mental illness are twice as likely to be arrested as people without mental illness for the same behavior.82
• People with mental illness are sentenced to prison terms that are, on average, 12 percent longer than other people in prison.83
• People with mental illness stay in prison longer because they frequently face disciplinary action from conduct that arises due to their illness — such as attempted suicide — and they seldom qualify for early release because they are not able to participate in rehabilitative programming, such as educational or vocational classes.84
Furthermore, sentencing reforms appear to leave prisoners with psychiatric disabilities behind. In recent years in California, the prison population has decreased by more than 25 percent, but the number of people with a serious mental disorder has increased by 150 percent.85
Screening tools to evaluate psychiatric disabilities vary by state and jurisdiction, but the most reliable data indicates that more than half of jail populations and close to half of prison populations have mental health disabilities.86 The fact that people with mental health disabilities are arrested more frequently, stay incarcerated longer, and return to prisons faster is not due to any inherent criminality related to psychiatric disabilities. It arises in part because of the lack of accessible and appropriate mental health treatment in the community; in part because of a perception of dangerousness by police, prosecutors, and judges; and in part because prison staff and probation officers fail to recognize and accommodate disabilities.
A common practice in the criminal justice system involves diversion to “specialty courts” — namely mental health, behavioral, veterans, and drug courts — for certain people. These courts arose from the recognition that for many people, criminal behavior may stem from mental or physical health issues, and they were established as a means of providing treatment as a potential alternative to incarceration. While that goal is laudable, the ACLU has deep concerns about the growing use of specialty courts,

16 ACLU Smart Justice
disabilities who are charged with low level crimes.
• Evaluating prosecutors’ charging and plea-bargaining practices to identify and eliminate disability bias.
• Investing in diversion programs and alternatives to detention designed for people with disabilities, including programs that provide supportive housing, Assertive Community Treatment, wraparound services, and mental health supports.
• Reducing the use of pretrial detention while increasing reminders of court dates and other supports to ensure compliance with pretrial requirements.
• Reducing recidivism due to parole or probation revocations through:
Intensive case management
Disability-competent training for officers on alternatives to incarceration and reasonable modifications to requirements of supervision
No return to incarceration for first and second technical violations.
• Addressing bias against mental disabilities in risk assessment instruments used to assist decision-making in the criminal justice system.
• Shifting funding away from law enforcement and corrections into supportive housing, intensive case management, schools, drug and mental health treatment, community organizations, job creation, and other social service providers.
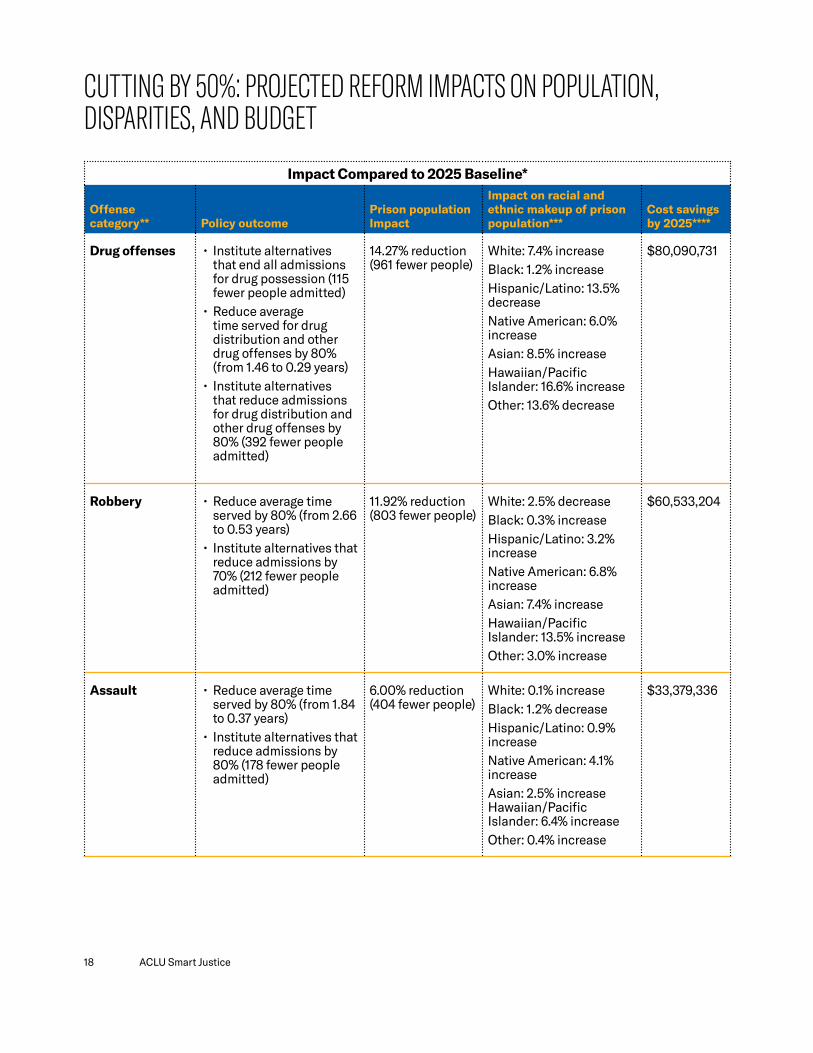
Forecaster Chart There are many pathways to cutting the prison population in Massachusetts by 50 percent. To help end mass incarceration, communities and policymakers will need to determine the optimal strategy to do so. This table presents one potential matrix of
which can trap people in the criminal justice system when they should have been referred to the health care system and lead to sentences that are longer than would have been ordered by a regular court.
These courts must ensure that participation is voluntary and that guilty pleas are not required for entry. In addition, if people are going to interact with a prosecutor or the court as a part of the program, they must have access to counsel. Oversight by the specialty court should not last beyond the length of any sentence that would have been imposed for the underlying charge, and participants should be allowed to quit the program and either take a plea agreement or stand trial at any time. Finally, specialty court programs must be tailored to meet individual needs rather than providing a cookie-cutter approach to all participants and ensure that noncompliance does not trigger an immediate return to incarceration.
Not surprisingly, many of the strategies to reduce disability disparities are similar to approaches that reduce racial disparities. Some examples include:
• Investing in pre-arrest diversion:
Creating behavioral health centers, run by state departments of health, as alternatives to jails, or emergency rooms for people experiencing mental health crises or addiction issues.
Training dispatchers and police to divert people with mental health issues who commit low-level nuisance crimes to these behavioral health centers; Jurisdictions that have followed this approach have significantly reduced their jail populations.87
• Ending arrest and incarceration for low-level public order charges, such as being drunk in public, urinating in public, loitering, trespassing, vandalism, or sleeping on the street; If needed, referring people who commit these crimes to behavioral health centers.
• Requiring prosecutors to offer diversion for people with mental health and substance abuse

17Blueprint for Smart Justice: Massachusetts
reductions that can contribute to cutting the state prison population in half by 2025. The reductions in admissions and length of stay for each offense category were selected based on potential to reduce the prison population, as well as other factors. Note that the chart assumes changes over time to Massachusetts’ statutory sentence lengths for certain crimes, such as drug and motor vehicle offenses, in making its projections.
Taken together, the changes in this table would result in an increase in the share of Massachusetts’s prison population that is Black and a reduction in the share of the population that is Latino. White people would make up a slightly larger percentage of the prison population. However, while Black Massachusetts residents would make up a larger portion of the prison population were these reforms to be implemented, there would still be 910 fewer Black people in prison in Massachusetts, a 49 percent reduction compared to the status quo. This also emphasizes the need to develop policies that specifically combat racial disparities moving forward.
To chart your own path to reducing mass incarceration in Massachusetts, visit the interactive online tool at https://urbn.is/ppf.
TAKING THE LEADProsecutors: They make decisions on when to prosecute an arrest, what charges to bring, how much bail to request (given that pretrial detention increases the likelihood a person will plead guilty), and which plea deals to offer and accept. They can decide to divert people to treatment programs (for example, drug or mental health programs) rather than send people to prison. They can also work to reduce racial disparities by analyzing and reporting their prosecution practices.
State lawmakers: They decide which offenses to criminalize, what penalties to include, how long sentences can be, and when to take away discretion from judges. They can change criminal laws to remove prison as an option when better alternatives exist or allow alternatives where previously the law had required prison. They can create new alternatives, or provide the resources
and direction for the development of new alternatives by others. They also have the power to make informed decisions on ways to reduce racial disparities in light of newly enacted requirements to collect and analyze data.
Judges: They often have discretion over pretrial conditions imposed on defendants, which can make a difference. For example, individuals who are jailed while awaiting trial are more likely to plead guilty and accept longer prison sentences than people who are not held in jail pretrial. Judges can also have discretion in sentencing and should consider alternatives to incarceration when possible. Judges would be wise to monitor and analyze their discretionary decisions to ensure they are not exercising that discretion in a racially disparate way.
18 ACLU Smart Justice
Impact Compared to 2025 Baseline*
Offense category** Policy outcome
Prison population Impact
Impact on racial and ethnic makeup of prison population***
Cost savings by 2025****
Drug offenses • Institute alternatives that end all admissions for drug possession (115 fewer people admitted)
• Reduce average time served for drug distribution and other drug offenses by 80% (from 1.46 to 0.29 years)
• Institute alternatives that reduce admissions for drug distribution and other drug offenses by 80% (392 fewer people admitted)
14.27% reduction (961 fewer people)
White: 7.4% increaseBlack: 1.2% increaseHispanic/Latino: 13.5% decreaseNative American: 6.0% increaseAsian: 8.5% increaseHawaiian/Pacific Islander: 16.6% increaseOther: 13.6% decrease
$80,090,731
Robbery • Reduce average time served by 80% (from 2.66 to 0.53 years)
• Institute alternatives that reduce admissions by 70% (212 fewer people admitted)
11.92% reduction (803 fewer people)
White: 2.5% decreaseBlack: 0.3% increaseHispanic/Latino: 3.2% increaseNative American: 6.8% increaseAsian: 7.4% increaseHawaiian/Pacific Islander: 13.5% increaseOther: 3.0% increase
$60,533,204
Assault • Reduce average time served by 80% (from 1.84 to 0.37 years)
• Institute alternatives that reduce admissions by 80% (178 fewer people admitted)
6.00% reduction (404 fewer people)
White: 0.1% increaseBlack: 1.2% decreaseHispanic/Latino: 0.9% increaseNative American: 4.1% increaseAsian: 2.5% increase Hawaiian/Pacific Islander: 6.4% increaseOther: 0.4% increase
$33,379,336
CUTTING BY 50%: PROJECTED REFORM IMPACTS ON POPULATION, DISPARITIES, AND BUDGET

19Blueprint for Smart Justice: Massachusetts
Impact Compared to 2025 Baseline*
Offense category** Policy outcome
Prison population Impact
Impact on racial and ethnic makeup of prison population***
Cost savings by 2025****
Weapons offenses*****
• Reduce average time served by 80% (from 2.35 to 0.47 years)
• Institute alternatives that reduce admissions by 80% (103 fewer people admitted)
4.58% reduction (309 fewer people)
White: 2.7% increaseBlack: 3.5% decreaseHispanic/Latino: 1.0% decreaseNative American: 4.8% increaseAsian: 1.6% increaseHawaiian/PacificIslander: 4.8% increaseOther: 3.8% increase
$24,356,951
Burglary • Reduce average time served by 80% (from 2.10 to 0.42 years)
• Institute alternatives that reduce admissions by 80% (112 fewer people admitted)
4.40% reduction (297 fewer people)
White: 1.3% decreaseBlack: 1.2% increaseHispanic/Latino: 0.8% increaseNative American: 0.8% increaseAsian: 1.3% decreaseHawaiian/Pacific Islander: 4.6% increaseOther: 4.6% increase
$23,970,471
Public order offenses******
• Reduce average time served by 80% (from 1.37 to 0.27 years)
• Institute alternatives that reduce admissions by 90% (174 fewer people admitted)
3.85% reduction (260 fewer people)
White: 0.4% decreaseBlack: 0.8% increaseHispanic/Latino: 0.2% increaseNative American: 0.9% increaseAsian: 1.4% decreaseHawaiian/PacificIslander: 4.0% increaseOther: 7.5% decrease
$21,111,395
Theft • Reduce average time served by 80% (from 0.83 to 0.17 years)
• Institute alternatives that reduce admissions by 90% (164 fewer people admitted)
2.21% reduction (149 fewer people)
White: 1.3% decreaseBlack: 0.9% increaseHispanic/Latino: 1.4% increaseNative American: 1.2% decreaseAsian: 2.3% increaseHawaiian/PacificIslander: 98.0% decreaseOther: 6.7% decrease
$12,151,315
Impact Compared to 2025 Baseline*
Offense category** Policy outcome
Prison population Impact
Impact on racial and ethnic makeup of prison population***
Cost savings by 2025****
Drug offenses • Institute alternatives that end all admissions for drug possession (115 fewer people admitted)
• Reduce average time served for drug distribution and other drug offenses by 80% (from 1.46 to 0.29 years)
• Institute alternatives that reduce admissions for drug distribution and other drug offenses by 80% (392 fewer people admitted)
14.27% reduction (961 fewer people)
White: 7.4% increaseBlack: 1.2% increaseHispanic/Latino: 13.5% decreaseNative American: 6.0% increaseAsian: 8.5% increaseHawaiian/Pacific Islander: 16.6% increaseOther: 13.6% decrease
$80,090,731
Robbery • Reduce average time served by 80% (from 2.66 to 0.53 years)
• Institute alternatives that reduce admissions by 70% (212 fewer people admitted)
11.92% reduction (803 fewer people)
White: 2.5% decreaseBlack: 0.3% increaseHispanic/Latino: 3.2% increaseNative American: 6.8% increaseAsian: 7.4% increaseHawaiian/Pacific Islander: 13.5% increaseOther: 3.0% increase
$60,533,204
Assault • Reduce average time served by 80% (from 1.84 to 0.37 years)
• Institute alternatives that reduce admissions by 80% (178 fewer people admitted)
6.00% reduction (404 fewer people)
White: 0.1% increaseBlack: 1.2% decreaseHispanic/Latino: 0.9% increaseNative American: 4.1% increaseAsian: 2.5% increase Hawaiian/Pacific Islander: 6.4% increaseOther: 0.4% increase
$33,379,336

20 ACLU Smart Justice
Impact Compared to 2025 Baseline*
Offense category** Policy outcome
Prison population Impact
Impact on racial and ethnic makeup of prison population***
Cost savings by 2025****
DWI • Reduce average time served by 80% (from 0.96 to 0.19 years)
• Institute alternatives that reduce admissions by 90% (72 fewer people admitted)
1.12% reduction (76 fewer people)
White: 1.3% decreaseBlack: 1.0% increaseHispanic/Latino: 0.9% increaseNative American: 1.1% increaseAsian: 1.1% increaseHawaiian/Pacific Islander: 1.1% increaseOther: 1.1% increase
$6,258,744
Motor vehicle theft
• Reduce average time served by 80% (from 2.59 to 0.52 years)
• Institute alternatives that reduce admissions by 90% (18 fewer people admitted)
0.79% reduction (53 fewer people)
White: 0.3% decreaseBlack: 0.3% increaseHispanic/Latino: 0.2% increaseNative American: 0.8% increaseAsian: 0.8% increaseHawaiian/Pacific Islander: 0.8% increaseOther: 0.4% decrease
$4,276,423
Other property offenses*******
• Reduce average time served by 80% (from 0.91 to 0.18 years)
• Institute alternatives that reduce admissions by 90% (48 fewer people admitted)
0.70% reduction (47 fewer people)
White: 0.1% decreaseBlack: 0.4% increaseHispanic/Latino: 0.2% decreaseNative American: 0.7% increaseAsian: 0.7% increaseHawaiian/PacificIslander: 0.7% increaseOther: 1.1% decrease
$3,869,745
Fraud • Reduce average time served by 80% (from 0.73 to 0.15 years)
• Institute alternatives that reduce admissions by 90% (16 fewer people admitted)
0.19% reduction (13 fewer people)
White: No changeBlack: No changeHispanic/Latino: No changeNative American: 0.2% increaseAsian: 0.2% increaseHawaiian/Pacific Islander: 0.2% increaseOther: 0.2% increase
$1,194,483

21Blueprint for Smart Justice: Massachusetts
and spending on prison. The analysis assumes that the changes outlined will occur incrementally and be fully realized by 2025.
All results are measured in terms of how outcomes under the reform scenario differ from the baseline projection for 2025. Prison population size impacts are measured as the difference between the 2025 prison population under the baseline scenario and the forecasted population in that year with the specified changes applied. Impacts on the racial and ethnic makeup of the 2025 prison population are measured by comparing the share of the prison population made up by a certain racial or ethnic group in the 2025 baseline population to that same statistic under the reform scenario, and calculating the percent change between these two proportions. Cost savings are calculated by estimating the funds that would be saved each year based on prison population reductions relative to the baseline estimate, assuming that annual savings grow as less infrastructure is needed to maintain a shrinking prison population. Savings relative to baseline spending are calculated in each year between the last year of available data and 2025, then added up to generate a measure of cumulative dollars saved over that time period.
Total Fiscal Impact If Massachusetts were to implement reforms leading to the changes described above, 3,372 fewer people would be in prison in Massachusetts by 2025, a 50.05 percent decrease. This would lead to a total cost savings of $833,139,279 by 2025.
Methodology OverviewThis analysis uses prison term record data from the National Corrections Reporting Program to estimate the impact of different policy outcomes on the size of Massachusetts’ prison population, racial and ethnic representation in the prison population, and state corrections spending. First, trends in admissions and exit rates for each offense category in recent years are analyzed and projected out to estimate a baseline state prison population projection through 2025, assuming recent trends will continue. Then, a mathematical model was used to estimate how various offense-specific reform scenarios (for example, a 10 percent reduction in admissions for drug possession or a 15 percent reduction in length of stay for robbery) would change the 2025 baseline projected prison population. The model allows for reform scenarios to include changes to the number of people admitted to prison and/or the average length of time served for specific offenses. The model then estimates the effect that these changes would have by 2025 on the number of people in prison, the racial and ethnic makeup of the prison population,
*The baseline refers to the projected prison population based on historical trends, assuming that no significant policy or practice changes are made.
**The projections in this table are based on the offense that carries the longest sentence for any given prison term. People serving prison terms may be convicted of multiple offenses in addition to this primary offense, but this model categorizes the total prison term according to the primary offense only.
***Racial and ethnic disproportionality is traditionally measured by comparing the number of people in prison — of a certain race — to the number of people in the state’s general population of that same race. For example, nationally, Black people comprise 13 percent of the population, while white people comprise 77 percent. Meanwhile, 35 percent of people in state or federal prison are Black, compared to 34 percent who are white. While the proportion of people in prison who are Black or white is equal, Black people are incarcerated at nearly three times their representation in the general population. This is evident in Massachusetts, where Black people make up 27 percent of the prison population but constitute only 7 percent of the state’s adult population.
****Cost impact for each individual policy change represents the effect of implementing that change alone and in 2015 dollars. The combined cost savings from implementing two or more of these changes would be greater than the sum of their combined individual cost savings, since more capital costs would be affected by the population reductions.
*****Some weapons offenses include unlawful possession, sale, or use of a firearm or other type of weapon (e.g., explosive device).
******Some public order offenses include drunk or disorderly conduct, escape from custody, obstruction of law enforcement, court offenses, failure to comply with sex offense registration requirements, prostitution, and stalking, as well as other uncategorized offenses.
*******Some other property offenses include stolen property trafficking, vandalism, property damage, criminal mischief, unauthorized vehicle use, and trespassing.

22 ACLU Smart Justice
Endnotes
1 For the purposes of this blueprint, the “prison population” refers to all people under the jurisdiction of Massachusetts DOC, which includes people in prisons, houses of corrections, and other residential correctional programming.
2 Census Bureau, Annual Estimates of the Resident Population by Sex, Age, Race, and Hispanic Origin for the United States and States, 2016 population estimates; MA DOC, Inmate and Prison Dashboard 2017 totals
3 BJS Correctional Statistical Analysis Tool; MA DOC, Inmate and Prison Dashboard
4 Offense breakdowns in this ACLU Smart Justice 50-State Blueprint are based on the most serious, or “controlling,” offense for which a person in prison is serving time. Some people in prison are serving time for multiple convictions and are categorized here only under the controlling offense types.
5 BJS, National Corrections Reporting Program (2015)
6 MA DOC, Prison Population Trends (2016)
7 MA DOC, Prison Population Trends (2016)
8 MA DOC, Prison Population Trends (2016)
9 The Sentencing Project, The Color of Race and Justice: Racial and Ethnic Disparity in State Prisons, 2016
10 Urban Institute analysis of: Census Bureau, Annual Estimates of the Resident Population by Sex, Age, Race, and Hispanic Origin for the United States and States, 2016 population estimates; MA DOC, Inmate and Prison Dashboard
11 Urban Institute analysis of: Census Bureau, Annual Estimates of the Resident Population by Sex, Age, Race, and Hispanic Origin for the United States and States, 2016 population estimates; MA DOC, Inmate and Prison Dashboard
12 M.G.L. ch.69.
13 ExEc. OfficE Of thE trial ct, SurvEy Of SEntEncing PracticES fy 2013 44 (2014), https://www.mass.gov/files/documents/2016/08/oo/fy2013-survey-sentencing-practices.pdf.
14 Juvenile arrest rates dropped in Massachusetts by 48% for property crime and 33% for violent crime between 2005 and 2015. Compare Fed. Bureau of Investigation, Uniform Crime Report, t.69, (providing Massachusetts’ juvenile arrest numbers for 2005) with Fed. Bureau of Investigation, Uniform Crime Report, t.69 (providing Massachusetts’ juvenile arrest numbers for 2015).
15 For the purposes of this blueprint, the “prison population” refers to all people under the jurisdiction of Massachusetts DOC, which includes people in prisons, houses of corrections, and other residential correctional programming.
16 BJS, Correctional Statistical Analysis Tool.
17 BJS, Correctional Statistical Analysis Tool
18 MA DOC, Prison Population Trends (2014)
19 MA DOC, Inmate and Prison Dashboard
20 Prison admissions reflect the number of people entering Massachusetts prisons in a given year, while the total prison population refers to the total number of people incarcerated at the start of a year (defined in this case as January 1)
21 BJS, National Corrections Reporting Program (2015)
22 BJS, National Corrections Reporting Program (2015)
23 MA DOC, Inmate and Prison Dashboard
24 When we use the term “criminally-sentenced” population or admissions in this blueprint, we are referring only to those imprisoned for a criminal conviction.
25 MA DOC, Prison Population Trends (2016)
26 MA DOC, Prison Population Trends (2016); MA DOC, Prison Population Trends (2007)
27 MA DOC, Prison Population Trends (2016)
28 Vera, Incarceration Trends, 2015, http://trends.vera.org/rates/alabama?incarcerationData=all&incarceration=count; Note: Total jail population and pretrial jail population data are drawn from different sources in the cited source. Total jail population data is reported as average daily population in 2015 and excludes federal jail populations, while pretrial jail population is reported as a single day count (taken on June 30) and includes federal jail populations.
29 MA DOC, Prison Population Trends Report Series (2000-2017)
30 MA DOC, Prison Population Trends Report Series (2000-2017)
31 MA DOC, Prison Population Trends Report Series (2000-2017)
32 Chapter 192, Acts of 2012, Massachusetts Session Laws
33 MA DOC, Prison Population Trends (2016); MA DOC, Prison Population Trends (2007)
34 MA General Law Chapter 279, Sec. 25; HB 3818 (2012)
35 MA DOC, Inmate and Prison Dashboard
36 MA DOC, Inmate and Prison Dashboard
37 MA Parole Board, Annual Reports 2004-2014
38 Massachusetts Executive Office of Public Safety and Security
39 Urban Institute Analysis of: Census Bureau, Annual Estimates of the Resident Population by Sex, Age, Race, and Hispanic Origin for the United States and States, 2016 population estimates; MA DOC, Inmate and Prison Dashboard
40 The Sentencing Project, The Color of Race and Justice: Racial and Ethnic Disparity in State Prisons, 2016
41 Urban Institute Analysis of: Census Bureau, Annual Estimates of the Resident Population by Sex, Age, Race, and Hispanic Origin for the United States and States, 2016 population estimates; MA DOC, Inmate and Prison Dashboard
42 MA DOC, Inmate and Prison Dashboard; MA DOC, Prison Population Trends (2016).
43 Human Rights Watch, Old Behind Bars, 2012; MA DOC, Inmate and Prison Dashboard
44 MA DOC, Prison Population Trends (2016). Statistics are for the Department of Corrections Custody population, meaning people held in state DOC facilities.
45 MA DOC, Prison Population Trends (2016).
46 NASBO, State Expenditure Reports 1985–2016

23Blueprint for Smart Justice: Massachusetts
64 Evidence has shown that pretrial detention puts the defense at a disadvantage and weakens a defendant’s bargaining position during plea negotiations. Evidence has also indicated that a person is more likely to plead guilty to a crime if she is detained pretrial. Will Dobbie, et al, The Effects of Pretrial Detention on Conviction, Future Crime, and Employment: Evidence from Randomly Assigned Judges, 108 am. EcOn. rEv 201-40.
65 Carmen Denavas-Walt & Bernadette D. Proctor, U.S. Census Bureau, Income and Poverty in the United States: 2013 (2014).
66 Alexander Jones & Benjamin Forman, Exploring the Potential for Pretrial Innovation in Massachusetts, t. 2, maSSinc, Sept. 2015, https://massinc.org/wp-content/uploads/2015/09/bail.brief_.3.pdf (citing data provided by Massachusetts County sheriffs).
67 Alexander Jones & Benjamin Forman, Exploring the Potential for Pretrial Innovation in Massachusetts, maSSinc, Sept. 2015, http://massinc.org/wp-content/uploads/2015/09/bail.brief_.3.pdf (pretrial detention data gathered from Massachusetts Sheriffs’ Association, monthly count sheets).
68 While young adults – age 18-24 -- represent only 10 percent of Massachusetts’ population, they constitute around one-fifth of commitments to incarceration, and have substantially higher than average recidivism rates. In 2011, three-quarters of young adults released from houses of correction in Massachusetts returned within three years. Benjamin Forman & Sarah Yee, “Viewing Justice Reinvestment Through a Developmental Lens: New Approaches to Reducing Young Adult Recidivism in Massachusetts.” MassINC (Dec. 2015), http://massinc.org/research/viewing-justice-reinvestment-through-a-developmental-lens.
69 Jay N. Giedd,et al, Brain Development During Childhood and Adolescence: A Longitudinal MRI Study, naturE nEurOSciEncE 2 861-863 (1999).
70 Katherine Monahan, et al., Trajectories of Antisocial Behavior and Psychosocial Maturity from Adolescence to Young Adulthood, 45 DEv. PSych. 1654-1668 (2009).
71 Arnold Barnett & David Farrington, Probabilistic Models of Youthful Criminal Careers, 25 criminOlOgy 83-107 (1987).
72 Juvenile arrest rates dropped in Massachusetts by 48% for property crime and 33% for violent crime between 2005 and 2015. Compare Fed. Bureau of Investigation, Uniform Crime Report, t.69, (providing Massachusetts’ juvenile arrest numbers for 2005) with Fed. Bureau of Investigation, Uniform Crime Report, t.69 (providing Massachusetts’ juvenile arrest numbers for 2015).
73 Council of State Governments, CSJ Justice Center - Massachusetts Criminal Justice Review: Working Group Meeting 5 Interim Report (Nov. 2016) https://csgjusticecenter.org/wp-content/uploads/2016/11/JR-in-Massachusetts_Fifth-Presentation.pdf.
74 Massachusetts’ 2018 criminal justice reform bill eliminates mandatory minimum sentences for a number of low-level drug offenses, leaving in place only one real mandatory minimum for simple retail drug sale offenses: second offenses involving Class A drugs. But the bill also creates and strengthens some other mandatory minimums. For example, it reclassifies all federally scheduled synthetic opioids as Class A substances, which strengthens mandatory minimums around their sale and trafficking. M.G.L. ch.69.
75 See maSS. SEnt. cOmm., aDviSOry SEntEncing guiDElinES, (Nov. 2017), https://www.mass.gov/files/documents/2018/02/01/Advisory%20Sentencing%20Guidelines%2020180119.pdf.
76 Massachusetts Sentencing Commission, Minutes, (Jan. 18, 2017), http://www.mass.gov/offes/docs/sentencing-commission/meeting-minutes/mass-sentencing-commission-meeting-notes-011817.pdf.
77 Steve Koczela & Rich Parr, Public Opinion on Criminal Justice Reform in Massachusetts, maSSinc (June 2017), https://massinc.org/wp-content/uploads/2017/06/Public-Opinion-on-Criminal-Justice-Reform-in-Massachusetts.pdf.
47 MA DOC, Prison Population Trends (2016)
48 ACLU Massachusetts, Black Brown and Targeted, https://aclum.org/wp-content/uploads/2015/06/reports-black-brown-and-targeted.pdf
49 See, for example, Katherine B. Spencer, Amanda K. Charbonneau and Jack Glaser. “Implicit Bias and Policing.” Social and Personality Psychology Compass 10/1 (2016): 50–63, 10.1111/spc3.12210. Accessed from https://gspp.berkeley.edu/assets/uploads/research/pdf/SpencerCharbonneauGlaser.Compass.2016.pdf; Kutateladze, B., Lynn, V., & Liang, E., Do race and ethnicity matter in prosecution? A review of empirical studies (New York: Vera Institute of Justice, June 2012). Accessed from http://archive.vera.org/sites/default/files/resources/downloads/race-and-ethnicity-in-prosecution-first-edition.pdf; Racial Disparity in Sentencing: A Review of the Literature (Washington, D.C.: Sentencing Project, January 2005). Accessed from https://www.opensocietyfoundations.org/sites/default/files/disparity.pdf; See, for example, Michael Pinard, “Collateral Consequences of Criminal Convictions: Confronting Issues of Race and Dignity.” New York University Law Review 85, no. 2 (2010): 457-534; Lisa Stolzenberg, Stewart J D’Alessio, and David Eitle. “Race and Cumulative Discrimination in the Prosecution of Criminal Defendants.” Race and Justice 3, no. 4 (2013), p. 275. Accessed from http://raj.sagepub.com/content/3/4/275.abstract.
50 The Sentencing Project, “Fewer Prisoners, Less Crime: A Tale of Three States,” 2015.
51 The Sentencing Project, “The Color of Justice: Racial and Ethnic Disparity in State Prisons,” 2015.
52 Census Bureau, Annual Estimates of the Resident Population by Sex, Age, Race, and Hispanic Origin for the United States and States, 2016 population estimates; MA DOC, Inmate and Prison Dashboard
53 Vera Institute of Justice ‘Accounting for Violence: How to Increase Safety & Break our Failed Reliance on Mass Incarceration’ 2017.
54 Executive Office of the Trial Court, Survey of Sentencing Practices fy 2013 25 (2014), https://www.mass.gov/files/documents/2016/08/oo/fy2013-survey-sentencing-practices.pdf.
55 Id. at 84.
56 MA DOC, Prison Population Trends (2016)
57 BJS, National Corrections Reporting Program (2015) (defining “motor vehicle offenses” as motor vehicle violations and operating under the influence).
58 Mark S. Umbreit, Robert B. Coates, & Betty Vos, “Victim-Offender Mediation: Three Decades of Practice and Research,” Conflict Resolution Quarterly, 22, nos. 1-2 (2004), 279-303 and National Council on Crime & Delinquency, Scaling Restorative Community Conferencing Through a Pay for Success Model: A Feasibility Assessment Report (Oakland, CA: NCCD, 2015), 9.
59 Research gate, https://www.researchgate.net/publication/271659858_Short-term_effects_of_restorative_justice_conferences_on_post-traumatic_stress_symptoms_among_robbery_and_burglary_victims_a_randomized_controlled_trial.
60 M.G.L. ch.69.
61 Id.
62 Executive Office of the Trial Court, Survey of Sentencing Practices fy 2013 44 (2014), https://www.mass.gov/files/documents/2016/08/oo/fy2013-survey-sentencing-practices.pdf.
63 Meghan Sacks & Alissa R. Ackerman, Pretrial Detention and Guilty Pleas: If They Cannot Afford Bail They Must Be Guilty, 25 Crim. Just. Stud. 265 (2012).
24 ACLU Smart Justice
78 nat’l rESEarch cOuncil, thE grOwth Of incarcEratiOn in thE unitED StatES: ExPlOring cauSES anD cOnSEquEncES, (2014), https://doi.org/10.17226/18613.
79 See Steven N. Durlauf & Daniel S. Nagin, Imprisonment and Crime, 10 Criminology 13-54 (2011); see also Giovanni Mastrobuoni & David Rivers, Criminal Discount Factors and Deterrence, Criminology E-Journal (2016), https://papers.ssrn.com/sol3/papers.cfm?abstract_id=2730969
80 MA Parole Board, Annual Reports 2004-2014.
81 Letter from ACLU MA, et al., to Chief Justice Gants, Gov. Baker, House Speaker DeLeo & Senate President Rosenberg (Jan. 17, 2017), https://aclum.org/wp-content/uploads/2017/01/20170117-CSG-Letter.pdf.
82 Linda A. Teplin, Keeping the Peace: Police Discretion and Mentally Ill Persons, National Inst. of Just. J., July 2000, at 12.
83 Stanford Justice Advocacy Project, The Prevalence and Severity of Mental Illness Among California Prisoners on the Rise, 2017.
84 Ibid.
85 Stanford Justice Advocacy Project, The Prevalence and Severity of Mental Illness Among California Prisoners on the Rise (2017), pages 1 and 3, https://law.stanford.edu/publications/the-prevalence-and-severity-of-mental-illness-among-california-prisoners-on-the-rise/.
86 Doris J. James and Lauren E. Glaze, Special Report: Mental Health Problems of Prison and Jail Inmates (BJS, September 2006), https://www.bjs.gov/content/pub/pdf/mhppji.pdf; Jennifer Bronson and Marcus Berzofsky, Special Report: Indicators of Mental Health Problems Reported by Prisoners and Jail Inmates, 2011-12 (BJS, June 2017), https://www.bjs.gov/content/pub/pdf/imhprpji1112.pdf.
87 John Buntin, “Miami’s Model for Decriminalizing Mental Illness in America,” Governing (August 2015): http://www.governing.com/topics/public-justice-safety/gov-miami-mental-health-jail.html; John Buntin, “Miami’s Model for Decriminalizing Mental Illness in America,” Governing (August 2015): http://www.governing.com/topics/public-justice-safety/gov-miami-mental-health-jail.html; Michael T. Compton et al., “The Police-Based Crisis Intervention Team (CIT) Model: Effects on Level of Force and Resolution, Referral, and Arrest,” Psychiatric Services 65 no. 4 (2014); see also, Michael T. Compton, Masuma Bahora, Amy C. Watson, and Janet R. Oliva, “A Comprehensive Review of Extant Research on Crisis Intervention Team (CIT) Programs,” Journal of American Academy of Psychiatry Law 36 no.1 (2008).
88 Note: As discussed above, not everyone sentenced to the jurisdiction of Massachusetts’ Department of Corrections (ADOC) is in a state prison or correctional facility. Several thousand people in the systemwide population are in community corrections supervision programs across the state, or in local jails, either serving their sentence there or awaiting transfer to an ADOC facility. The following analyses in this document are based on numbers reported by Massachussets authorities to the Department of Justice, and roughly track Massachussets’ larger systemwide population, which includes people serving felony time in local jails and community corrections.