Blue Team - UIC - MJN Final Written Report
23
CFA Institute Research Challenge Hosted by CFA Society of Chicago Blue Team/University of Illinois at Chicago
-
Upload
matthew-lewellen -
Category
Documents
-
view
96 -
download
7
Transcript of Blue Team - UIC - MJN Final Written Report

CFA Institute Research Challenge
Hosted by
CFA Society of Chicago
Blue Team/University of Illinois at Chicago
Blue Team
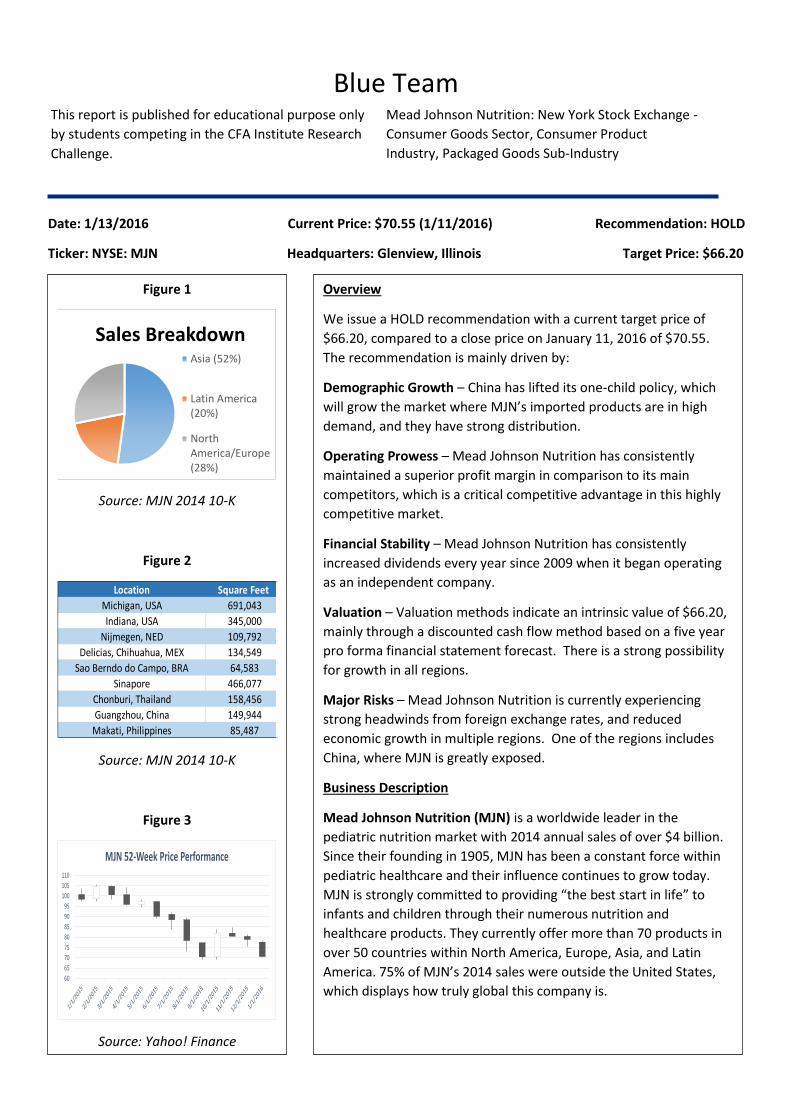
Date: 1/13/2016 Current Price: $70.55 (1/11/2016) Recommendation: HOLD
Ticker: NYSE: MJN Headquarters: Glenview, Illinois Target Price: $66.20
Figure 1
Source: MJN 2014 10-K
Figure 2
Source: MJN 2014 10-K
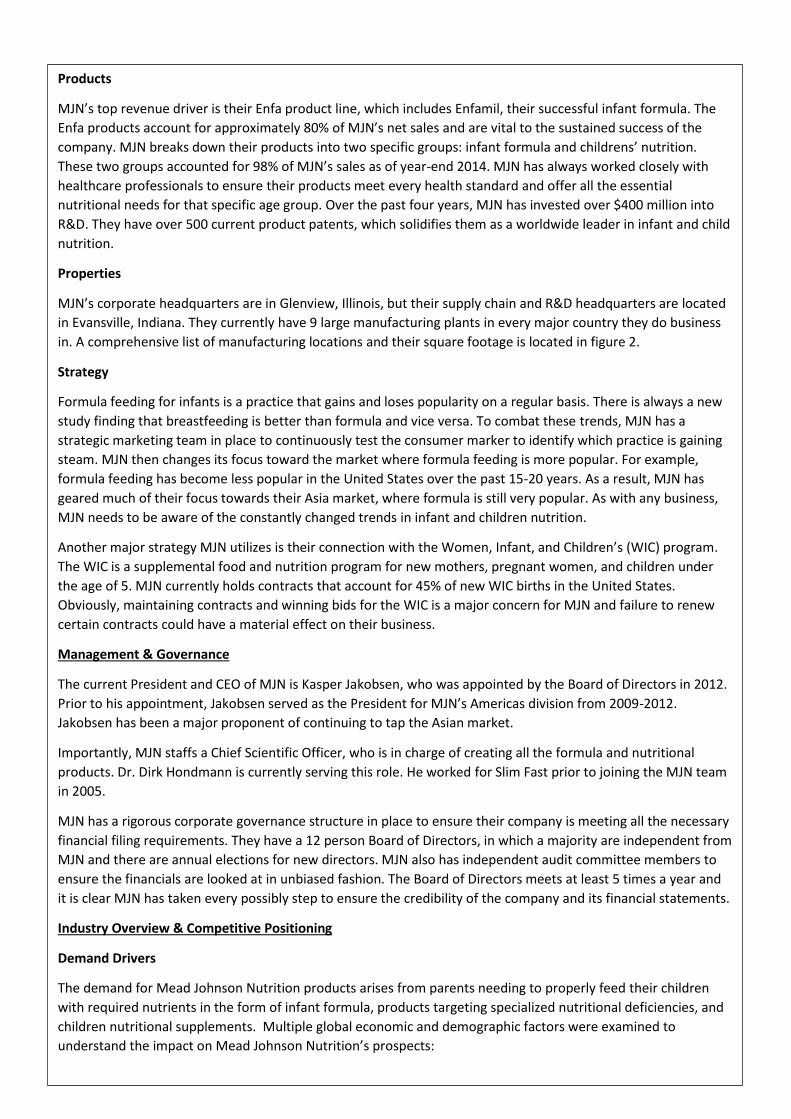
Figure 3
Source: Yahoo! Finance
Sales BreakdownAsia (52%)
Latin America(20%)
NorthAmerica/Europe(28%)
Location Square Feet
Michigan, USA 691,043
Indiana, USA 345,000
Nijmegen, NED 109,792
Delicias, Chihuahua, MEX 134,549
Sao Berndo do Campo, BRA 64,583
Sinapore 466,077
Chonburi, Thailand 158,456
Guangzhou, China 149,944
Makati, Philippines 85,487
60
65
70
75
80
85
90
95
100
105
110
MJN 52-Week Price Performance
Overview
We issue a HOLD recommendation with a current target price of
$66.20, compared to a close price on January 11, 2016 of $70.55.
The recommendation is mainly driven by:
Demographic Growth – China has lifted its one-child policy, which
will grow the market where MJN’s imported products are in high
demand, and they have strong distribution.
Operating Prowess – Mead Johnson Nutrition has consistently
maintained a superior profit margin in comparison to its main
competitors, which is a critical competitive advantage in this highly
competitive market.
Financial Stability – Mead Johnson Nutrition has consistently
increased dividends every year since 2009 when it began operating
as an independent company.
Valuation – Valuation methods indicate an intrinsic value of $66.20,
mainly through a discounted cash flow method based on a five year
pro forma financial statement forecast. There is a strong possibility
for growth in all regions.
Major Risks – Mead Johnson Nutrition is currently experiencing
strong headwinds from foreign exchange rates, and reduced
economic growth in multiple regions. One of the regions includes
China, where MJN is greatly exposed.
Business Description
Mead Johnson Nutrition (MJN) is a worldwide leader in the
pediatric nutrition market with 2014 annual sales of over $4 billion.
Since their founding in 1905, MJN has been a constant force within
pediatric healthcare and their influence continues to grow today.
MJN is strongly committed to providing “the best start in life” to
infants and children through their numerous nutrition and
healthcare products. They currently offer more than 70 products in
over 50 countries within North America, Europe, Asia, and Latin
America. 75% of MJN’s 2014 sales were outside the United States,
which displays how truly global this company is.
This report is published for educational purpose only
by students competing in the CFA Institute Research
Challenge.
Mead Johnson Nutrition: New York Stock Exchange -
Consumer Goods Sector, Consumer Product
Industry, Packaged Goods Sub-Industry
Products
MJN’s top revenue driver is their Enfa product line, which includes Enfamil, their successful infant formula. The
Enfa products account for approximately 80% of MJN’s net sales and are vital to the sustained success of the
company. MJN breaks down their products into two specific groups: infant formula and childrens’ nutrition.
These two groups accounted for 98% of MJN’s sales as of year-end 2014. MJN has always worked closely with
healthcare professionals to ensure their products meet every health standard and offer all the essential
nutritional needs for that specific age group. Over the past four years, MJN has invested over $400 million into
R&D. They have over 500 current product patents, which solidifies them as a worldwide leader in infant and child
nutrition.
Properties
MJN’s corporate headquarters are in Glenview, Illinois, but their supply chain and R&D headquarters are located
in Evansville, Indiana. They currently have 9 large manufacturing plants in every major country they do business
in. A comprehensive list of manufacturing locations and their square footage is located in figure 2.
Strategy
Formula feeding for infants is a practice that gains and loses popularity on a regular basis. There is always a new
study finding that breastfeeding is better than formula and vice versa. To combat these trends, MJN has a
strategic marketing team in place to continuously test the consumer marker to identify which practice is gaining
steam. MJN then changes its focus toward the market where formula feeding is more popular. For example,
formula feeding has become less popular in the United States over the past 15-20 years. As a result, MJN has
geared much of their focus towards their Asia market, where formula is still very popular. As with any business,
MJN needs to be aware of the constantly changed trends in infant and children nutrition.
Another major strategy MJN utilizes is their connection with the Women, Infant, and Children’s (WIC) program.
The WIC is a supplemental food and nutrition program for new mothers, pregnant women, and children under
the age of 5. MJN currently holds contracts that account for 45% of new WIC births in the United States.
Obviously, maintaining contracts and winning bids for the WIC is a major concern for MJN and failure to renew
certain contracts could have a material effect on their business.
Management & Governance
The current President and CEO of MJN is Kasper Jakobsen, who was appointed by the Board of Directors in 2012.
Prior to his appointment, Jakobsen served as the President for MJN’s Americas division from 2009-2012.
Jakobsen has been a major proponent of continuing to tap the Asian market.
Importantly, MJN staffs a Chief Scientific Officer, who is in charge of creating all the formula and nutritional
products. Dr. Dirk Hondmann is currently serving this role. He worked for Slim Fast prior to joining the MJN team
in 2005.
MJN has a rigorous corporate governance structure in place to ensure their company is meeting all the necessary
financial filing requirements. They have a 12 person Board of Directors, in which a majority are independent from
MJN and there are annual elections for new directors. MJN also has independent audit committee members to
ensure the financials are looked at in unbiased fashion. The Board of Directors meets at least 5 times a year and
it is clear MJN has taken every possibly step to ensure the credibility of the company and its financial statements.
Industry Overview & Competitive Positioning
Demand Drivers
The demand for Mead Johnson Nutrition products arises from parents needing to properly feed their children
with required nutrients in the form of infant formula, products targeting specialized nutritional deficiencies, and
children nutritional supplements. Multiple global economic and demographic factors were examined to
understand the impact on Mead Johnson Nutrition’s prospects:
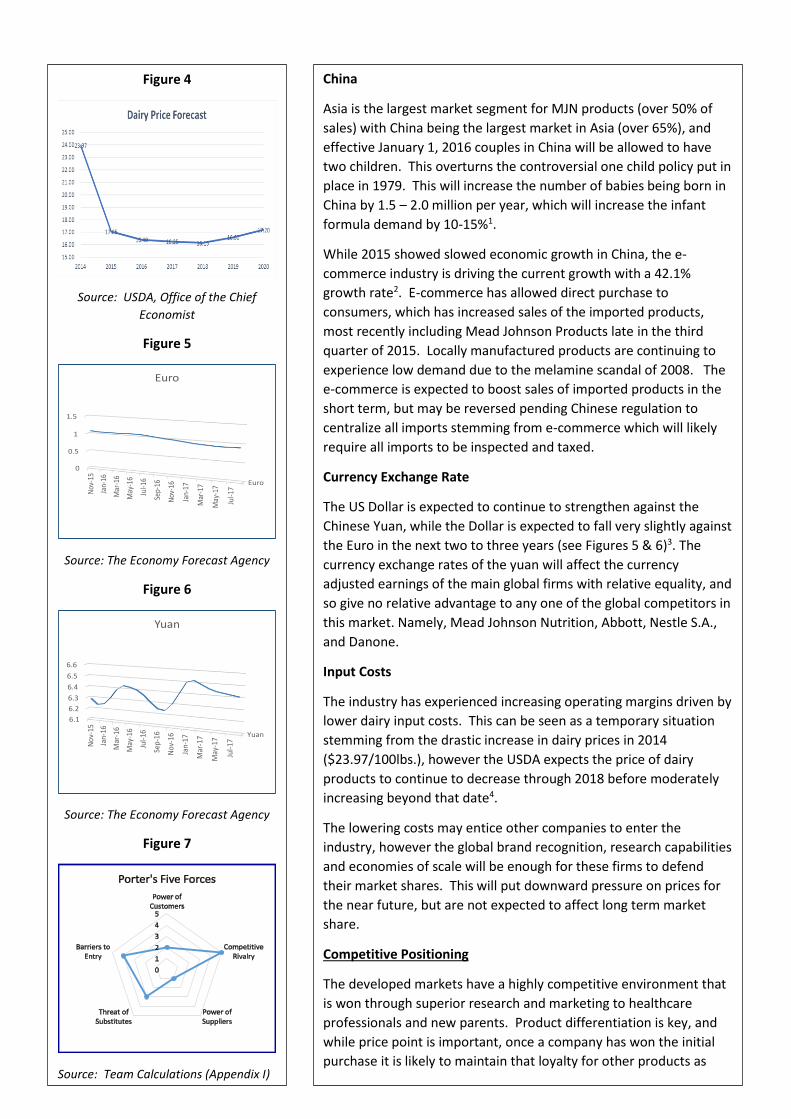
Figure 4
Source: USDA, Office of the Chief
Economist
Figure 5
Source: The Economy Forecast Agency
Figure 6
Source: The Economy Forecast Agency
Figure 7
Source: Team Calculations (Appendix I)
Euro
0
0.5
1
1.5
Nov
-15
Jan-
16
Mar
-16
May
-16
Jul-1
6
Sep-
16
Nov
-16
Jan-
17
Mar
-17
May
-17
Jul-1
7
Euro
Yuan
6.1
6.2
6.3
6.4
6.5
6.6
Nov
-15
Jan-
16
Mar
-16
May
-16
Jul-
16
Sep-
16
Nov
-16
Jan-
17
Mar
-17
May
-17
Jul-1
7
Yuan
China
Asia is the largest market segment for MJN products (over 50% of
sales) with China being the largest market in Asia (over 65%), and
effective January 1, 2016 couples in China will be allowed to have
two children. This overturns the controversial one child policy put in
place in 1979. This will increase the number of babies being born in
China by 1.5 – 2.0 million per year, which will increase the infant
formula demand by 10-15%1.
While 2015 showed slowed economic growth in China, the e-
commerce industry is driving the current growth with a 42.1%
growth rate2. E-commerce has allowed direct purchase to
consumers, which has increased sales of the imported products,
most recently including Mead Johnson Products late in the third
quarter of 2015. Locally manufactured products are continuing to
experience low demand due to the melamine scandal of 2008. The
e-commerce is expected to boost sales of imported products in the
short term, but may be reversed pending Chinese regulation to
centralize all imports stemming from e-commerce which will likely
require all imports to be inspected and taxed.
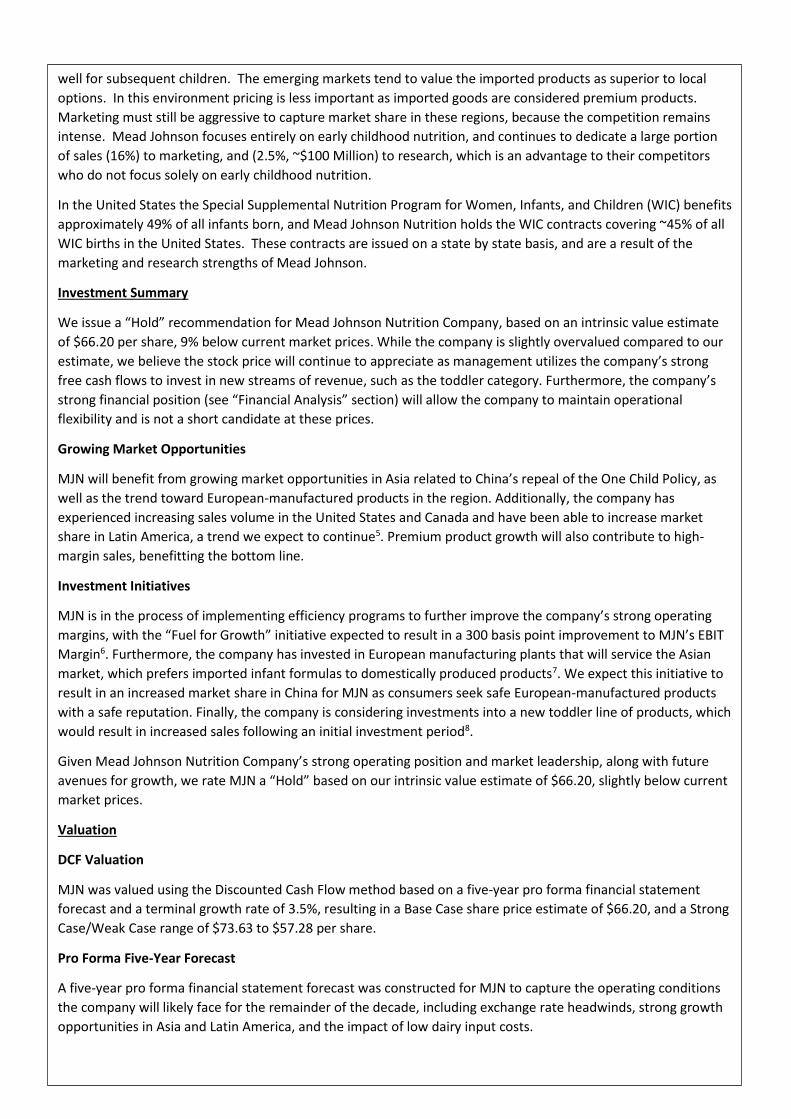
Currency Exchange Rate
The US Dollar is expected to continue to strengthen against the
Chinese Yuan, while the Dollar is expected to fall very slightly against
the Euro in the next two to three years (see Figures 5 & 6)3. The
currency exchange rates of the yuan will affect the currency
adjusted earnings of the main global firms with relative equality, and
so give no relative advantage to any one of the global competitors in
this market. Namely, Mead Johnson Nutrition, Abbott, Nestle S.A.,
and Danone.
Input Costs
The industry has experienced increasing operating margins driven by
lower dairy input costs. This can be seen as a temporary situation
stemming from the drastic increase in dairy prices in 2014
($23.97/100lbs.), however the USDA expects the price of dairy
products to continue to decrease through 2018 before moderately
increasing beyond that date4.
The lowering costs may entice other companies to enter the
industry, however the global brand recognition, research capabilities
and economies of scale will be enough for these firms to defend
their market shares. This will put downward pressure on prices for
the near future, but are not expected to affect long term market
share.
Competitive Positioning
The developed markets have a highly competitive environment that
is won through superior research and marketing to healthcare
professionals and new parents. Product differentiation is key, and
while price point is important, once a company has won the initial
purchase it is likely to maintain that loyalty for other products as
well for subsequent children. The emerging markets tend to value the imported products as superior to local
options. In this environment pricing is less important as imported goods are considered premium products.
Marketing must still be aggressive to capture market share in these regions, because the competition remains
intense. Mead Johnson focuses entirely on early childhood nutrition, and continues to dedicate a large portion
of sales (16%) to marketing, and (2.5%, ~$100 Million) to research, which is an advantage to their competitors
who do not focus solely on early childhood nutrition.
In the United States the Special Supplemental Nutrition Program for Women, Infants, and Children (WIC) benefits
approximately 49% of all infants born, and Mead Johnson Nutrition holds the WIC contracts covering ~45% of all
WIC births in the United States. These contracts are issued on a state by state basis, and are a result of the
marketing and research strengths of Mead Johnson.
Investment Summary
We issue a “Hold” recommendation for Mead Johnson Nutrition Company, based on an intrinsic value estimate
of $66.20 per share, 9% below current market prices. While the company is slightly overvalued compared to our
estimate, we believe the stock price will continue to appreciate as management utilizes the company’s strong
free cash flows to invest in new streams of revenue, such as the toddler category. Furthermore, the company’s
strong financial position (see “Financial Analysis” section) will allow the company to maintain operational
flexibility and is not a short candidate at these prices.
Growing Market Opportunities
MJN will benefit from growing market opportunities in Asia related to China’s repeal of the One Child Policy, as
well as the trend toward European-manufactured products in the region. Additionally, the company has
experienced increasing sales volume in the United States and Canada and have been able to increase market
share in Latin America, a trend we expect to continue5. Premium product growth will also contribute to high-
margin sales, benefitting the bottom line.
Investment Initiatives
MJN is in the process of implementing efficiency programs to further improve the company’s strong operating
margins, with the “Fuel for Growth” initiative expected to result in a 300 basis point improvement to MJN’s EBIT
Margin6. Furthermore, the company has invested in European manufacturing plants that will service the Asian
market, which prefers imported infant formulas to domestically produced products7. We expect this initiative to
result in an increased market share in China for MJN as consumers seek safe European-manufactured products
with a safe reputation. Finally, the company is considering investments into a new toddler line of products, which
would result in increased sales following an initial investment period8.
Given Mead Johnson Nutrition Company’s strong operating position and market leadership, along with future
avenues for growth, we rate MJN a “Hold” based on our intrinsic value estimate of $66.20, slightly below current
market prices.
Valuation
DCF Valuation
MJN was valued using the Discounted Cash Flow method based on a five-year pro forma financial statement
forecast and a terminal growth rate of 3.5%, resulting in a Base Case share price estimate of $66.20, and a Strong
Case/Weak Case range of $73.63 to $57.28 per share.
Pro Forma Five-Year Forecast
A five-year pro forma financial statement forecast was constructed for MJN to capture the operating conditions
the company will likely face for the remainder of the decade, including exchange rate headwinds, strong growth
opportunities in Asia and Latin America, and the impact of low dairy input costs.
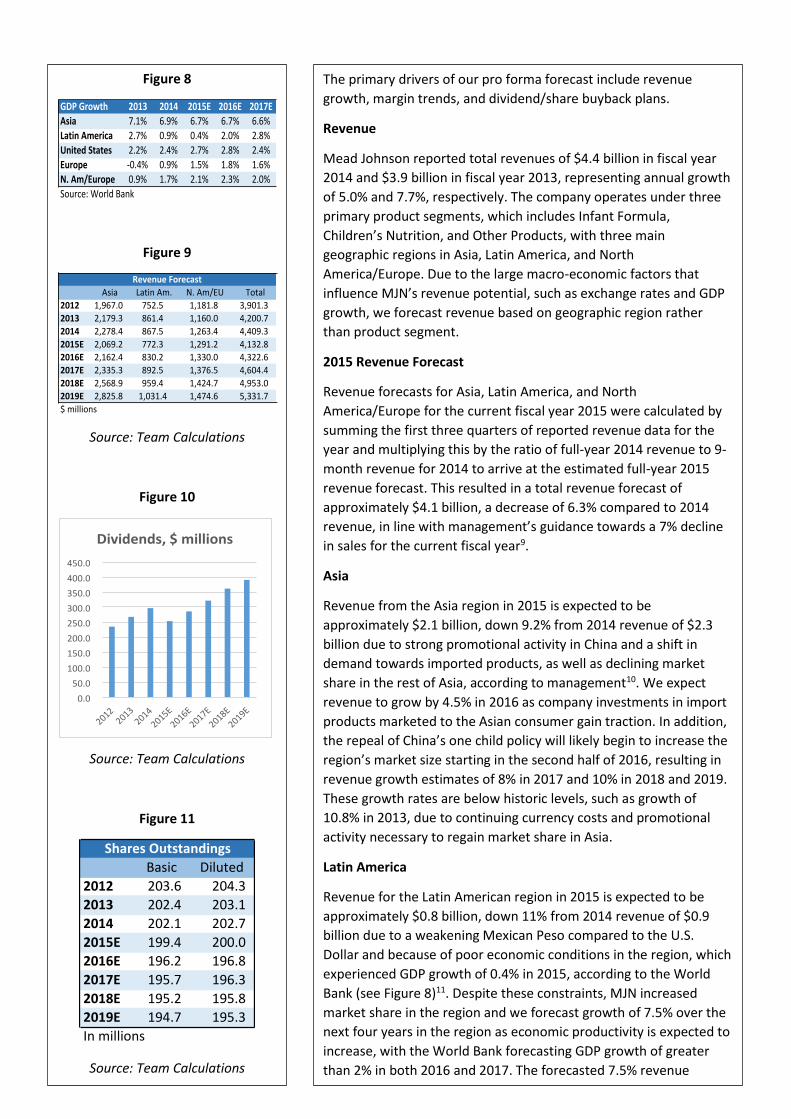
Figure 8
Figure 9
Source: Team Calculations
Figure 10
Source: Team Calculations
Figure 11
Source: Team Calculations
GDPGrowth 2013 2014 2015E 2016E 2017E
Asia 7.1% 6.9% 6.7% 6.7% 6.6%
LatinAmerica 2.7% 0.9% 0.4% 2.0% 2.8%
UnitedStates 2.2% 2.4% 2.7% 2.8% 2.4%
Europe -0.4% 0.9% 1.5% 1.8% 1.6%
N.Am/Europe 0.9% 1.7% 2.1% 2.3% 2.0%
Source:WorldBank
Asia LatinAm. N.Am/EU Total
2012 1,967.0 752.5 1,181.8 3,901.3
2013 2,179.3 861.4 1,160.0 4,200.7
2014 2,278.4 867.5 1,263.4 4,409.3
2015E 2,069.2 772.3 1,291.2 4,132.8
2016E 2,162.4 830.2 1,330.0 4,322.6
2017E 2,335.3 892.5 1,376.5 4,604.4
2018E 2,568.9 959.4 1,424.7 4,953.0
2019E 2,825.8 1,031.4 1,474.6 5,331.7
$millions
RevenueForecast
0.0
50.0
100.0
150.0
200.0
250.0
300.0
350.0
400.0
450.0
2012
2013
2014
2015E
2016E
2017E
2018E
2019E
Dividends,$millions
Basic Diluted
2012 203.6 204.3
2013 202.4 203.1
2014 202.1 202.7
2015E 199.4 200.0
2016E 196.2 196.8
2017E 195.7 196.3
2018E 195.2 195.8
2019E 194.7 195.3
Inmillions
SharesOutstandings
The primary drivers of our pro forma forecast include revenue
growth, margin trends, and dividend/share buyback plans.
Revenue
Mead Johnson reported total revenues of $4.4 billion in fiscal year
2014 and $3.9 billion in fiscal year 2013, representing annual growth
of 5.0% and 7.7%, respectively. The company operates under three
primary product segments, which includes Infant Formula,
Children’s Nutrition, and Other Products, with three main
geographic regions in Asia, Latin America, and North
America/Europe. Due to the large macro-economic factors that
influence MJN’s revenue potential, such as exchange rates and GDP
growth, we forecast revenue based on geographic region rather
than product segment.
2015 Revenue Forecast
Revenue forecasts for Asia, Latin America, and North
America/Europe for the current fiscal year 2015 were calculated by
summing the first three quarters of reported revenue data for the
year and multiplying this by the ratio of full-year 2014 revenue to 9-
month revenue for 2014 to arrive at the estimated full-year 2015
revenue forecast. This resulted in a total revenue forecast of
approximately $4.1 billion, a decrease of 6.3% compared to 2014
revenue, in line with management’s guidance towards a 7% decline
in sales for the current fiscal year9.
Asia
Revenue from the Asia region in 2015 is expected to be
approximately $2.1 billion, down 9.2% from 2014 revenue of $2.3
billion due to strong promotional activity in China and a shift in
demand towards imported products, as well as declining market
share in the rest of Asia, according to management10. We expect
revenue to grow by 4.5% in 2016 as company investments in import
products marketed to the Asian consumer gain traction. In addition,
the repeal of China’s one child policy will likely begin to increase the
region’s market size starting in the second half of 2016, resulting in
revenue growth estimates of 8% in 2017 and 10% in 2018 and 2019.
These growth rates are below historic levels, such as growth of
10.8% in 2013, due to continuing currency costs and promotional
activity necessary to regain market share in Asia.
Latin America
Revenue for the Latin American region in 2015 is expected to be
approximately $0.8 billion, down 11% from 2014 revenue of $0.9
billion due to a weakening Mexican Peso compared to the U.S.
Dollar and because of poor economic conditions in the region, which
experienced GDP growth of 0.4% in 2015, according to the World
Bank (see Figure 8)11. Despite these constraints, MJN increased
market share in the region and we forecast growth of 7.5% over the
next four years in the region as economic productivity is expected to
increase, with the World Bank forecasting GDP growth of greater
than 2% in both 2016 and 2017. The forecasted 7.5% revenue
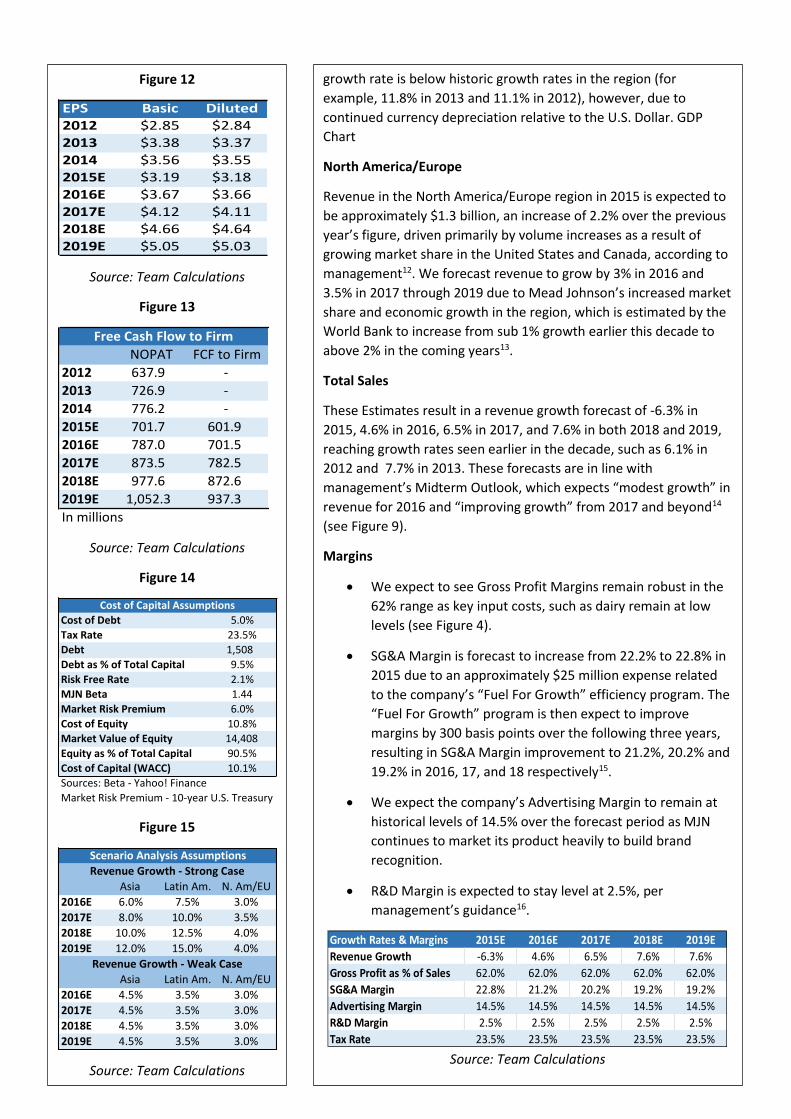
Figure 12
Source: Team Calculations
Figure 13
Source: Team Calculations
Figure 14
Figure 15
Source: Team Calculations
EPS Basic Diluted
2012 $2.85 $2.84
2013 $3.38 $3.37
2014 $3.56 $3.55
2015E $3.19 $3.18
2016E $3.67 $3.66
2017E $4.12 $4.11
2018E $4.66 $4.64
2019E $5.05 $5.03
NOPAT FCFtoFirm
2012 637.9 -
2013 726.9 -
2014 776.2 -
2015E 701.7 601.9
2016E 787.0 701.5
2017E 873.5 782.5
2018E 977.6 872.6
2019E 1,052.3 937.3
Inmillions
FreeCashFlowtoFirm
CostofDebt 5.0%
TaxRate 23.5%
Debt 1,508
Debtas%ofTotalCapital 9.5%
RiskFreeRate 2.1%
MJNBeta 1.44
MarketRiskPremium 6.0%
CostofEquity 10.8%
MarketValueofEquity 14,408
Equityas%ofTotalCapital 90.5%
CostofCapital(WACC) 10.1%
Sources:Beta-Yahoo!Finance
MarketRiskPremium-10-yearU.S.Treasury
CostofCapitalAssumptions
Asia LatinAm. N.Am/EU
2016E 6.0% 7.5% 3.0%
2017E 8.0% 10.0% 3.5%
2018E 10.0% 12.5% 4.0%
2019E 12.0% 15.0% 4.0%
Asia LatinAm. N.Am/EU
2016E 4.5% 3.5% 3.0%
2017E 4.5% 3.5% 3.0%
2018E 4.5% 3.5% 3.0%
2019E 4.5% 3.5% 3.0%
RevenueGrowth-StrongCase
RevenueGrowth-WeakCase
ScenarioAnalysisAssumptions
growth rate is below historic growth rates in the region (for
example, 11.8% in 2013 and 11.1% in 2012), however, due to
continued currency depreciation relative to the U.S. Dollar. GDP
Chart
North America/Europe
Revenue in the North America/Europe region in 2015 is expected to
be approximately $1.3 billion, an increase of 2.2% over the previous
year’s figure, driven primarily by volume increases as a result of
growing market share in the United States and Canada, according to
management12. We forecast revenue to grow by 3% in 2016 and
3.5% in 2017 through 2019 due to Mead Johnson’s increased market
share and economic growth in the region, which is estimated by the
World Bank to increase from sub 1% growth earlier this decade to
above 2% in the coming years13.
Total Sales
These Estimates result in a revenue growth forecast of -6.3% in
2015, 4.6% in 2016, 6.5% in 2017, and 7.6% in both 2018 and 2019,
reaching growth rates seen earlier in the decade, such as 6.1% in
2012 and 7.7% in 2013. These forecasts are in line with
management’s Midterm Outlook, which expects “modest growth” in
revenue for 2016 and “improving growth” from 2017 and beyond14
(see Figure 9).
Margins
We expect to see Gross Profit Margins remain robust in the
62% range as key input costs, such as dairy remain at low
levels (see Figure 4).
SG&A Margin is forecast to increase from 22.2% to 22.8% in
2015 due to an approximately $25 million expense related
to the company’s “Fuel For Growth” efficiency program. The
“Fuel For Growth” program is then expect to improve
margins by 300 basis points over the following three years,
resulting in SG&A Margin improvement to 21.2%, 20.2% and
19.2% in 2016, 17, and 18 respectively15.
We expect the company’s Advertising Margin to remain at
historical levels of 14.5% over the forecast period as MJN
continues to market its product heavily to build brand
recognition.
R&D Margin is expected to stay level at 2.5%, per
management’s guidance16.
Source: Team Calculations
Growth Rates & Margins 2015E 2016E 2017E 2018E 2019E
Revenue Growth -6.3% 4.6% 6.5% 7.6% 7.6%
Gross Profit as % of Sales 62.0% 62.0% 62.0% 62.0% 62.0%
SG&A Margin 22.8% 21.2% 20.2% 19.2% 19.2%
Advertising Margin 14.5% 14.5% 14.5% 14.5% 14.5%
R&D Margin 2.5% 2.5% 2.5% 2.5% 2.5%
Tax Rate 23.5% 23.5% 23.5% 23.5% 23.5%
Dividends and Share Repurchases
Mead Johnson has consistently returned excess capital to shareholders through common dividends and share
repurchase programs. We expect the company to maintain its current Dividend Payout Ratio of 40% over the
forecast period and to repurchase share to offset the dilution of employee stock options (see Figure 10). In fiscal
year 2015, we expect the company to have repurchased a total of $500 million in shares, consistent with a total
reported repurchase amount of $437 million through Q3 201517.
EPS
Our five-year pro forma financial statement forecast resulted in an EPS estimate of $3.19 per share for fiscal year
2015, slightly below management’s guidance towards EPS of $3.33 for the full-year period (see Figure 12)18.
Intrinsic Valuation
Using our five-year pro forma financial statement forecast, we calculated Free Cash Flow to the Firm and
discounted these values at a cost of capital (WACC with Taxes) of 10.1%, based on a cost of debt of 5% and cost
of equity of 10.8% (see Figures 13 & 14). Our terminal value was calculated using a 3.5% growth rate in
perpetuity, resulting in an intrinsic value price target of $66.20. Our Strong case, which assumes larger revenue
growth in Asia and Latin America, resulted in an intrinsic valuation of $73.63, while our weak case, which
assumes slower than expected growth and gross margin pressure due to rising dairy costs, resulted in an intrinsic
valuation of $57.28 (see Figure 15).
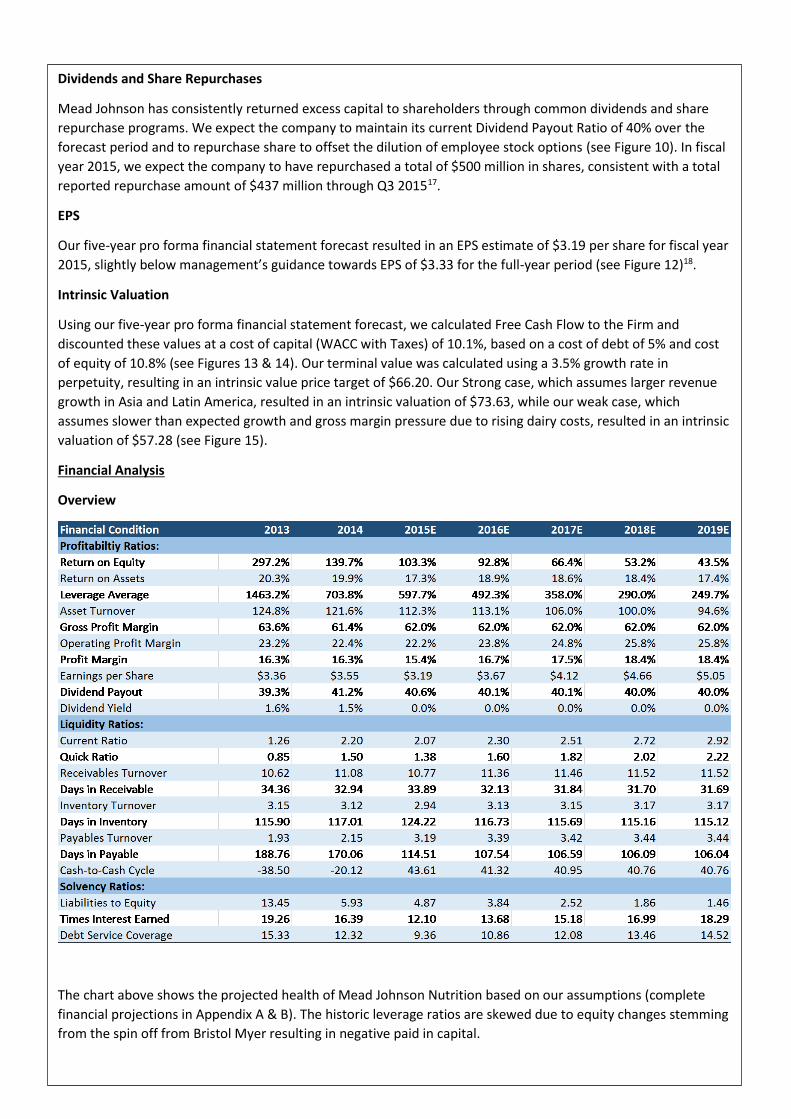
Financial Analysis
Overview
The chart above shows the projected health of Mead Johnson Nutrition based on our assumptions (complete
financial projections in Appendix A & B). The historic leverage ratios are skewed due to equity changes stemming
from the spin off from Bristol Myer resulting in negative paid in capital.
Regulations to Favorably Affect Demographics
The raising of the one-child policy to a two-child policy in China is expected to increase the market in that region
by 1.5-2.0 million babies per year, representing an increase of approximately 10% annually, which translates to
an increase of revenue at current market share and currency exchange rate of 10% for the company. While there
are currency exchange headwinds in this area, the imported products are experiencing growth and are priced at
a premium to the domestically manufactured alternatives.
Debt is Managed Well
The leverage ratios and ROE are off putting when taken on their own, as unusually high. However, the interest
coverage ratio and the ROA are in line with competitors, at the favorable end of the spectrum signaling stronger
financial stability and return on working capital (Appendix G).
Consistent Superior Operational Results
Mead Johnson’s operating market has consistently been in the 22 – 23% range, whereas the competition
(according to comparable company segments) has yet to reach this level with consistency. Continued operating
efficiency supports the competitive advantage held by Mead Johnson Nutrition.
Investment Risks
Regulatory Risk
Mead Johnson Nutrition is required to operate within the law and regulations in every market where it operates,
which results in costly monitoring and implementation of actions to comply with multiple government policies.
These include regulations regarding environmental, health, manufacturing, advertising and marketing unique to
each of the over 50 countries in which Mead Johnson operates. Changes to these regulations can have a
material adverse effect on sales and profit margins. Government pricing actions, sanctions, or international
organizations may impose negative pressure on Mead Johnson’s ability to maintain its market in certain
countries, and materially change the geographic mix of earnings. In 2015 $12 million was paid to settle
investigations into promotional practices in China without admission to guilt. At this time the company does not
believe that there are any pending litigation that may have a material effect.
Market Risk
Foreign Currency Exchange Rates: Mead Johnson Nutrition had 76% of their sales in countries outside of the
United States the year ending December 31, 2014. This exposes the firm to significant currency exchange risk,
especially in China and Latin America. Both of these regions are experiencing devaluation of currency with
respect to the US dollar due to opposite monetary policies with the US tightening, and China, Venezuela, Brazil,
and others loosening. This will likely cause adverse results in the dollar denominated earnings well into 2016 if
not beyond.
Input Prices: Dairy is the dominant input cost for Mead Johnson Nutrition that is controlled by the market. An
increase in the commodity price would have material adverse effects to the operational costs for the company,
and could cause significant downward pressure on their operating margins.
Economic Risks
Emerging Markets: Growth for Mead Johnson Nutrition is dependent upon growth of the middle class in
emerging markets, as well as an increase in the number of mothers returning to the workplace. The most
significant threat is in China due to the slowing of the manufacturing and industrial portions of their economy,
although other significant economic slowdowns are evident in other Asian countries, as well as several in Latin
America. China is expecting to report a 6.9% growth rate, which is the lowest it has been for several years.
Continued slowing in the growth rate would materially affect the consolidated sales of Mead Johnson.
Birth Rates: Mead Johnson Nutrition’s growth is directly affected by the birth rates for obvious reasons. During
economic downturns the birth rate drops significantly. Most recently in the United States the number of births
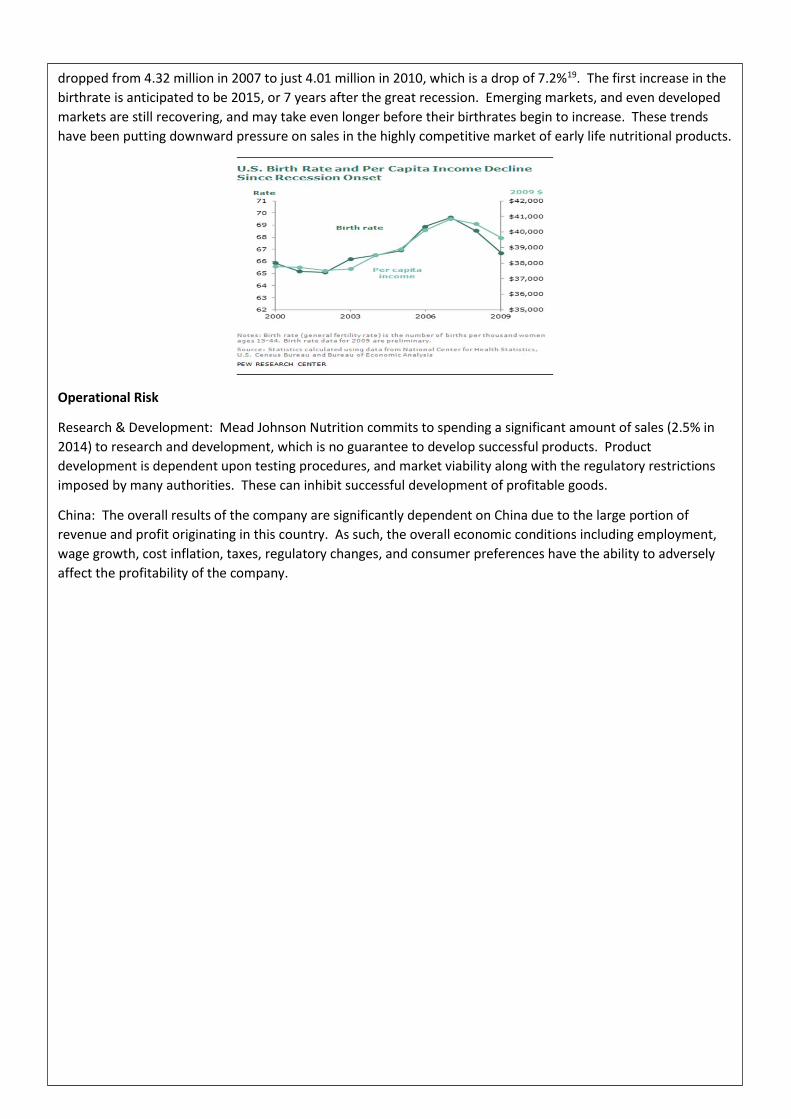
dropped from 4.32 million in 2007 to just 4.01 million in 2010, which is a drop of 7.2%19. The first increase in the
birthrate is anticipated to be 2015, or 7 years after the great recession. Emerging markets, and even developed
markets are still recovering, and may take even longer before their birthrates begin to increase. These trends
have been putting downward pressure on sales in the highly competitive market of early life nutritional products.
Operational Risk
Research & Development: Mead Johnson Nutrition commits to spending a significant amount of sales (2.5% in
2014) to research and development, which is no guarantee to develop successful products. Product
development is dependent upon testing procedures, and market viability along with the regulatory restrictions
imposed by many authorities. These can inhibit successful development of profitable goods.
China: The overall results of the company are significantly dependent on China due to the large portion of
revenue and profit originating in this country. As such, the overall economic conditions including employment,
wage growth, cost inflation, taxes, regulatory changes, and consumer preferences have the ability to adversely
affect the profitability of the company.
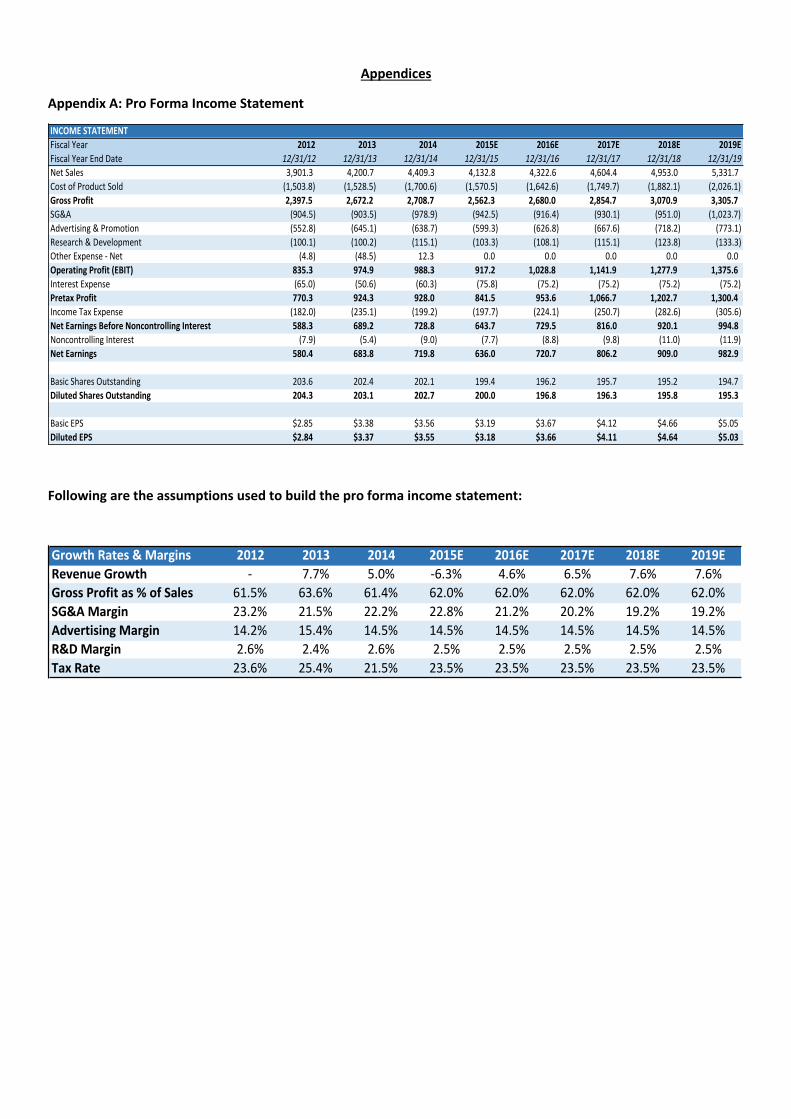
Appendices
Appendix A: Pro Forma Income Statement
Following are the assumptions used to build the pro forma income statement:
INCOMESTATEMENT
FiscalYear 2012 2013 2014 2015E 2016E 2017E 2018E 2019E
FiscalYearEndDate 12/31/12 12/31/13 12/31/14 12/31/15 12/31/16 12/31/17 12/31/18 12/31/19
NetSales 3,901.3 4,200.7 4,409.3 4,132.8 4,322.6 4,604.4 4,953.0 5,331.7
CostofProductSold (1,503.8) (1,528.5) (1,700.6) (1,570.5) (1,642.6) (1,749.7) (1,882.1) (2,026.1)
GrossProfit 2,397.5 2,672.2 2,708.7 2,562.3 2,680.0 2,854.7 3,070.9 3,305.7
SG&A (904.5) (903.5) (978.9) (942.5) (916.4) (930.1) (951.0) (1,023.7)
Advertising&Promotion (552.8) (645.1) (638.7) (599.3) (626.8) (667.6) (718.2) (773.1)
Research&Development (100.1) (100.2) (115.1) (103.3) (108.1) (115.1) (123.8) (133.3)
OtherExpense-Net (4.8) (48.5) 12.3 0.0 0.0 0.0 0.0 0.0
OperatingProfit(EBIT) 835.3 974.9 988.3 917.2 1,028.8 1,141.9 1,277.9 1,375.6
InterestExpense (65.0) (50.6) (60.3) (75.8) (75.2) (75.2) (75.2) (75.2)
PretaxProfit 770.3 924.3 928.0 841.5 953.6 1,066.7 1,202.7 1,300.4
IncomeTaxExpense (182.0) (235.1) (199.2) (197.7) (224.1) (250.7) (282.6) (305.6)
NetEarningsBeforeNoncontrollingInterest 588.3 689.2 728.8 643.7 729.5 816.0 920.1 994.8
NoncontrollingInterest (7.9) (5.4) (9.0) (7.7) (8.8) (9.8) (11.0) (11.9)
NetEarnings 580.4 683.8 719.8 636.0 720.7 806.2 909.0 982.9
BasicSharesOutstanding 203.6 202.4 202.1 199.4 196.2 195.7 195.2 194.7
DilutedSharesOutstanding 204.3 203.1 202.7 200.0 196.8 196.3 195.8 195.3
BasicEPS $2.85 $3.38 $3.56 $3.19 $3.67 $4.12 $4.66 $5.05
DilutedEPS $2.84 $3.37 $3.55 $3.18 $3.66 $4.11 $4.64 $5.03
GrowthRates&Margins 2012 2013 2014 2015E 2016E 2017E 2018E 2019E
RevenueGrowth - 7.7% 5.0% -6.3% 4.6% 6.5% 7.6% 7.6%
GrossProfitas%ofSales 61.5% 63.6% 61.4% 62.0% 62.0% 62.0% 62.0% 62.0%
SG&AMargin 23.2% 21.5% 22.2% 22.8% 21.2% 20.2% 19.2% 19.2%
AdvertisingMargin 14.2% 15.4% 14.5% 14.5% 14.5% 14.5% 14.5% 14.5%
R&DMargin 2.6% 2.4% 2.6% 2.5% 2.5% 2.5% 2.5% 2.5%
TaxRate 23.6% 25.4% 21.5% 23.5% 23.5% 23.5% 23.5% 23.5%

Appendix B: Pro Forma Balance Sheet
Following are the assumptions used to build the pro forma balance sheet:
BALANCESHEET
FiscalYear 2012 2013 2014 2015E 2016E 2017E 2018E 2019E
FiscalYearEndDate 12/31/12 12/31/13 12/31/14 12/31/15 12/31/16 12/31/17 12/31/18 12/31/19
Cash&CashEquivalents 1,042.1 1,050.8 1,297.7 1,075.5 1,372.4 1,715.0 2,105.5 2,530.2
Receivables 364.6 384.4 387.8 363.7 380.4 405.2 435.9 469.2
Inventories 435.9 534.8 555.5 513.5 537.1 572.1 615.5 662.5
DeferredIncomeTaxes 110.9 112.3 151.9 140.5 147.0 156.5 168.4 181.3
IncomeTaxesReceivable 26.0 15.9 7.7 8.3 8.6 9.2 9.9 10.7
PrepaidExpenses/OtherCurrentAssets 60.0 56.9 82.6 78.5 82.1 87.5 94.1 101.3
TotalCurrentAssets 2,039.5 2,155.1 2,483.2 2,180.0 2,527.6 2,945.6 3,429.2 3,955.1
PP&E 689.9 867.5 912.7 1,046.9 1,187.2 1,336.7 1,497.5 1,670.6
Goodwill&OtherIntangibleAssets 400.5 294.3 238.1 221.7 208.1 197.5 194.6 193.8
OtherAssets 128.3 157.2 142.5 132.2 138.3 147.3 158.5 170.6
TotalAssets 3,258.2 3,474.1 3,776.5 3,580.8 4,061.2 4,627.1 5,279.8 5,990.1
Short-TermBorrowings 187.0 2.0 4.1 0.0 0.0 0.0 0.0 0.0
AccountsPayable 508.5 566.8 512.3 473.1 494.8 527.1 567.0 610.3
AccruedExpenses,Rebates&DeferredIncome 571.3 581.5 567.1 533.1 557.6 594.0 638.9 687.8
IncomeTaxes-PayableandDeferred 41.8 56.1 46.4 45.5 47.5 50.6 54.5 58.6
TotalCurrentLiabilities 1,308.6 1,206.4 1,129.9 1,051.7 1,100.0 1,171.7 1,260.4 1,356.8
Long-TermDebt 1,523.2 1,514.7 1,503.9 1,503.9 1,503.9 1,503.9 1,503.9 1,503.9
Revolver 0.0 0.0 0.0 0.0 0.0 0.0 0.0 0.0
DeferredIncomeTaxes-Noncurrent 15.9 15.3 12.4 12.4 13.0 13.8 14.9 16.0
Pension/OPEB 188.8 161.8 211.1 198.4 207.5 221.0 237.7 255.9
OtherLiabilities 95.1 156.4 192.8 181.8 190.2 202.6 217.9 234.6
TotalLiabilities 3,131.6 3,054.6 3,050.1 2,948.2 3,014.5 3,113.0 3,234.8 3,367.2
RedeemableNoncontrollingInterst 36.3 49.7 66.0 62.0 64.8 69.1 74.3 80.0
CommonStock/APIC (674.5) (719.4) (639.2) (610.0) (581.6) (552.7) (523.3) (491.5)
RetainedEarnings 1,186.1 1,501.6 1,851.6 2,233.2 2,665.6 3,149.4 3,694.8 4,284.5
TreasuryStock (244.6) (351.9) (362.6) (862.6) (912.6) (962.6) (1,012.6) (1,062.6)
AOCI (187.0) (69.2) (198.9) (198.9) (198.9) (198.9) (198.9) (198.9)
NoncontrollingInterest 10.3 8.7 9.5 8.9 9.3 9.9 10.7 11.5
TotalEquity 90.3 369.8 660.4 570.6 981.9 1,445.1 1,970.7 2,543.0
BalanceCheck (0.0) 0.0 0.0 0.0 0.0 0.0 0.0 0.0
BALANCESHEETASSUMPTIONS
FiscalYear 2012 2013 2014 2015E 2016E 2017E 2018E 2019E
FiscalYearEndDate 12/31/12 12/31/13 12/31/14 12/31/15 12/31/16 12/31/17 12/31/18 12/31/19
WorkingCapital
DaysSalesOutstanding(DSO) 34.1days 33.4days 32.1days 32.1days 32.1days 32.1days 32.1days 32.1days
InventoryTurnover 3.4x 2.9x 3.1x 3.1x 3.1x 3.1x 3.1x 3.1x
DaysofPayablesOutstanding(DPO) 123.4days 135.3days 110.0days 110.0days 110.0days 110.0days 110.0days 110.0days
AccruedExpenses,Etc.as%ofSales 14.6% 13.8% 12.9% 12.9% 12.9% 12.9% 12.9% 12.9%
GoodwillandOtherIntangibleAssets
PurchasesofIntangibleAssets 0.0 0.0 0.0 0.0 0.0
Amortization (16.4) (13.6) (10.6) (2.9) (0.8)
Property,Plant&Equipment
CapitalExpendituresas%ofSales 3.2% 5.7% 4.2% 4.2% 4.2% 4.2% 4.2% 4.2%
Depreciationas%ofCapitalExpenditures 22.7% 22.7% 22.7% 22.7% 22.7% 22.7%
OtherAssets/Liabilities
PrepaidExpenses/Oth.Cur.Assetsas%ofSales 1.5% 1.4% 1.9% 1.9% 1.9% 1.9% 1.9% 1.9%
DeferredIncomeTaxesas%ofSales 2.8% 2.7% 3.4% 3.4% 3.4% 3.4% 3.4% 3.4%
IncomeTaxesReceivableas%ofSales 0.7% 0.4% 0.2% 0.2% 0.2% 0.2% 0.2% 0.2%
OtherAssetsas%ofSales 3.3% 3.7% 3.2% 3.2% 3.2% 3.2% 3.2% 3.2%
IncomesTaxesPayableas%ofSales 1.1% 1.3% 1.1% 1.1% 1.1% 1.1% 1.1% 1.1%
DeferredIncomeTaxesas%ofSales 0.4% 0.4% 0.3% 0.3% 0.3% 0.3% 0.3% 0.3%
Pension/OPEBas%ofSales 4.8% 3.9% 4.8% 4.8% 4.8% 4.8% 4.8% 4.8%
OtherLiabilitiesas%ofSales 2.4% 3.7% 4.4% 4.4% 4.4% 4.4% 4.4% 4.4%
RedeemableNoncontrollingInterest
NoncontrollingInterestas%ofSales 0.9% 1.2% 1.5% 1.5% 1.5% 1.5% 1.5% 1.5%
Debt
AdditionalShort-TermBorrowing/(DebtAmort.) (185.0) 2.1 (4.1) 0.0 0.0 0.0 0.0
AdditionalLong-TermBorrowing/(DebtAmort.) (8.5) (10.8) 0.0 0.0 0.0 0.0 0.0
WeightedAverageInterestRate 4.4% 5.0% 5.0% 5.0% 5.0% 5.0% 5.0%
Shareholders'Equity
SBCas%ofAllOperatingExpenses 3.6% 3.6% 3.1% 3.1% 3.1% 3.1% 3.1% 3.1%
StockRepurchases (500.0) (50.0) (50.0) (50.0) (50.0)
DividendPayoutRatio 40.8% 39.1% 41.2% 40.0% 40.0% 40.0% 40.0% 40.0%
AdditionalOtherComprehensiveIncome 117.8 (129.7) 0.0 0.0 0.0 0.0 0.0
NoncontrollingInterestas%ofSales 0.3% 0.2% 0.2% 0.2% 0.2% 0.2% 0.2% 0.2%
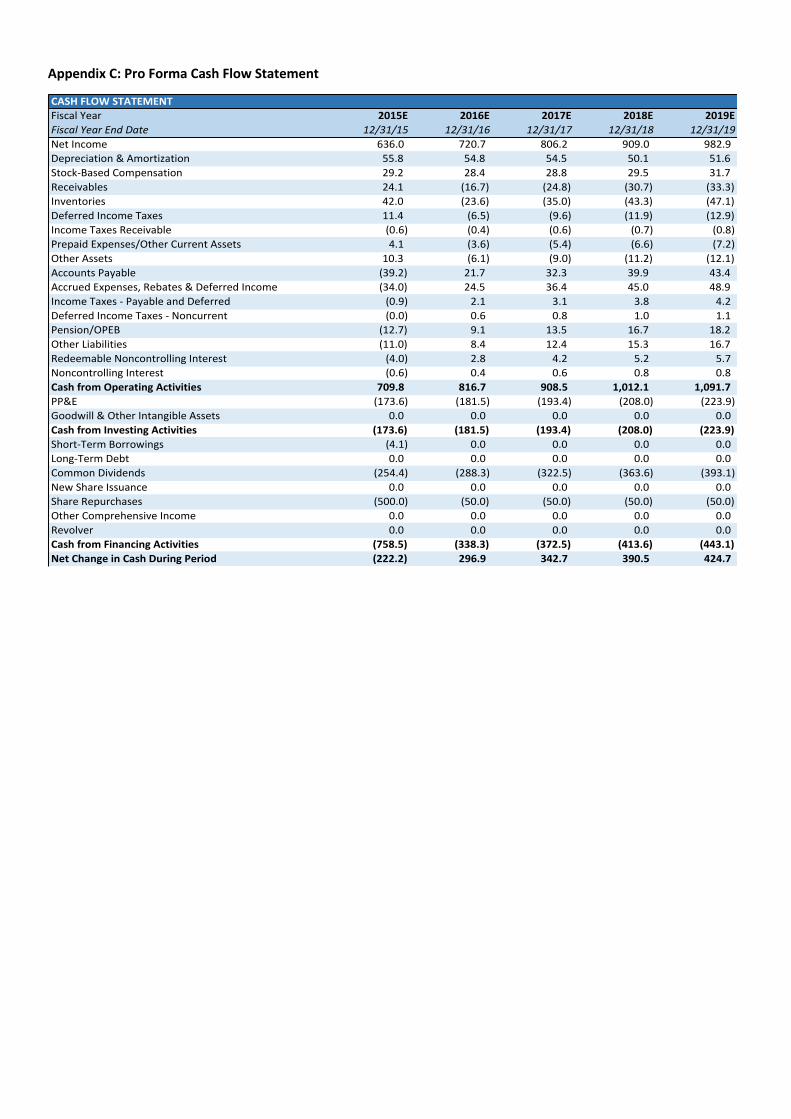
Appendix C: Pro Forma Cash Flow Statement
CASHFLOWSTATEMENT
FiscalYear 2015E 2016E 2017E 2018E 2019E
FiscalYearEndDate 12/31/15 12/31/16 12/31/17 12/31/18 12/31/19
NetIncome 636.0 720.7 806.2 909.0 982.9
Depreciation&Amortization 55.8 54.8 54.5 50.1 51.6
Stock-BasedCompensation 29.2 28.4 28.8 29.5 31.7
Receivables 24.1 (16.7) (24.8) (30.7) (33.3)
Inventories 42.0 (23.6) (35.0) (43.3) (47.1)
DeferredIncomeTaxes 11.4 (6.5) (9.6) (11.9) (12.9)
IncomeTaxesReceivable (0.6) (0.4) (0.6) (0.7) (0.8)
PrepaidExpenses/OtherCurrentAssets 4.1 (3.6) (5.4) (6.6) (7.2)
OtherAssets 10.3 (6.1) (9.0) (11.2) (12.1)
AccountsPayable (39.2) 21.7 32.3 39.9 43.4
AccruedExpenses,Rebates&DeferredIncome (34.0) 24.5 36.4 45.0 48.9
IncomeTaxes-PayableandDeferred (0.9) 2.1 3.1 3.8 4.2
DeferredIncomeTaxes-Noncurrent (0.0) 0.6 0.8 1.0 1.1
Pension/OPEB (12.7) 9.1 13.5 16.7 18.2
OtherLiabilities (11.0) 8.4 12.4 15.3 16.7
RedeemableNoncontrollingInterest (4.0) 2.8 4.2 5.2 5.7
NoncontrollingInterest (0.6) 0.4 0.6 0.8 0.8
CashfromOperatingActivities 709.8 816.7 908.5 1,012.1 1,091.7
PP&E (173.6) (181.5) (193.4) (208.0) (223.9)
Goodwill&OtherIntangibleAssets 0.0 0.0 0.0 0.0 0.0
CashfromInvestingActivities (173.6) (181.5) (193.4) (208.0) (223.9)
Short-TermBorrowings (4.1) 0.0 0.0 0.0 0.0
Long-TermDebt 0.0 0.0 0.0 0.0 0.0
CommonDividends (254.4) (288.3) (322.5) (363.6) (393.1)
NewShareIssuance 0.0 0.0 0.0 0.0 0.0
ShareRepurchases (500.0) (50.0) (50.0) (50.0) (50.0)
OtherComprehensiveIncome 0.0 0.0 0.0 0.0 0.0
Revolver 0.0 0.0 0.0 0.0 0.0
CashfromFinancingActivities (758.5) (338.3) (372.5) (413.6) (443.1)
NetChangeinCashDuringPeriod (222.2) 296.9 342.7 390.5 424.7
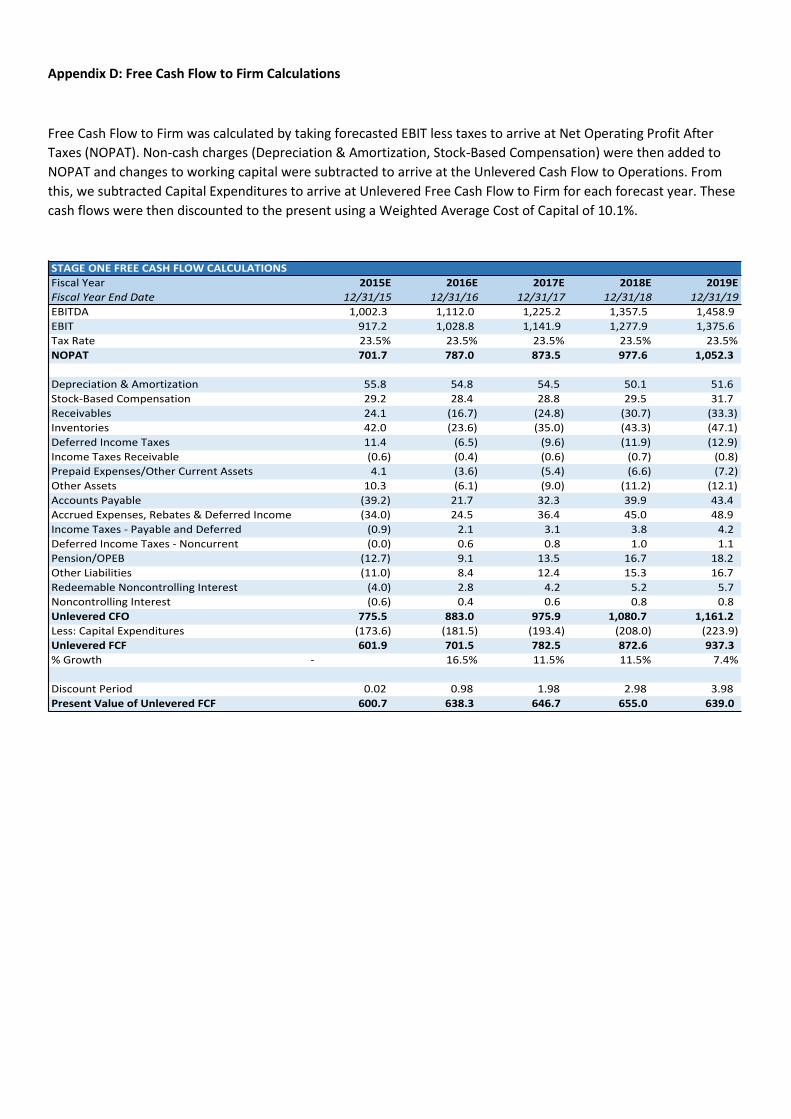
Appendix D: Free Cash Flow to Firm Calculations
Free Cash Flow to Firm was calculated by taking forecasted EBIT less taxes to arrive at Net Operating Profit After
Taxes (NOPAT). Non-cash charges (Depreciation & Amortization, Stock-Based Compensation) were then added to
NOPAT and changes to working capital were subtracted to arrive at the Unlevered Cash Flow to Operations. From
this, we subtracted Capital Expenditures to arrive at Unlevered Free Cash Flow to Firm for each forecast year. These
cash flows were then discounted to the present using a Weighted Average Cost of Capital of 10.1%.
STAGEONEFREECASHFLOWCALCULATIONS
FiscalYear 2015E 2016E 2017E 2018E 2019E
FiscalYearEndDate 12/31/15 12/31/16 12/31/17 12/31/18 12/31/19
EBITDA 1,002.3 1,112.0 1,225.2 1,357.5 1,458.9
EBIT 917.2 1,028.8 1,141.9 1,277.9 1,375.6
TaxRate 23.5% 23.5% 23.5% 23.5% 23.5%
NOPAT 701.7 787.0 873.5 977.6 1,052.3
Depreciation&Amortization 55.8 54.8 54.5 50.1 51.6
Stock-BasedCompensation 29.2 28.4 28.8 29.5 31.7
Receivables 24.1 (16.7) (24.8) (30.7) (33.3)
Inventories 42.0 (23.6) (35.0) (43.3) (47.1)
DeferredIncomeTaxes 11.4 (6.5) (9.6) (11.9) (12.9)
IncomeTaxesReceivable (0.6) (0.4) (0.6) (0.7) (0.8)
PrepaidExpenses/OtherCurrentAssets 4.1 (3.6) (5.4) (6.6) (7.2)
OtherAssets 10.3 (6.1) (9.0) (11.2) (12.1)
AccountsPayable (39.2) 21.7 32.3 39.9 43.4
AccruedExpenses,Rebates&DeferredIncome (34.0) 24.5 36.4 45.0 48.9
IncomeTaxes-PayableandDeferred (0.9) 2.1 3.1 3.8 4.2
DeferredIncomeTaxes-Noncurrent (0.0) 0.6 0.8 1.0 1.1
Pension/OPEB (12.7) 9.1 13.5 16.7 18.2
OtherLiabilities (11.0) 8.4 12.4 15.3 16.7
RedeemableNoncontrollingInterest (4.0) 2.8 4.2 5.2 5.7
NoncontrollingInterest (0.6) 0.4 0.6 0.8 0.8
UnleveredCFO 775.5 883.0 975.9 1,080.7 1,161.2
Less:CapitalExpenditures (173.6) (181.5) (193.4) (208.0) (223.9)
UnleveredFCF 601.9 701.5 782.5 872.6 937.3
%Growth - 16.5% 11.5% 11.5% 7.4%
DiscountPeriod 0.02 0.98 1.98 2.98 3.98
PresentValueofUnleveredFCF 600.7 638.3 646.7 655.0 639.0
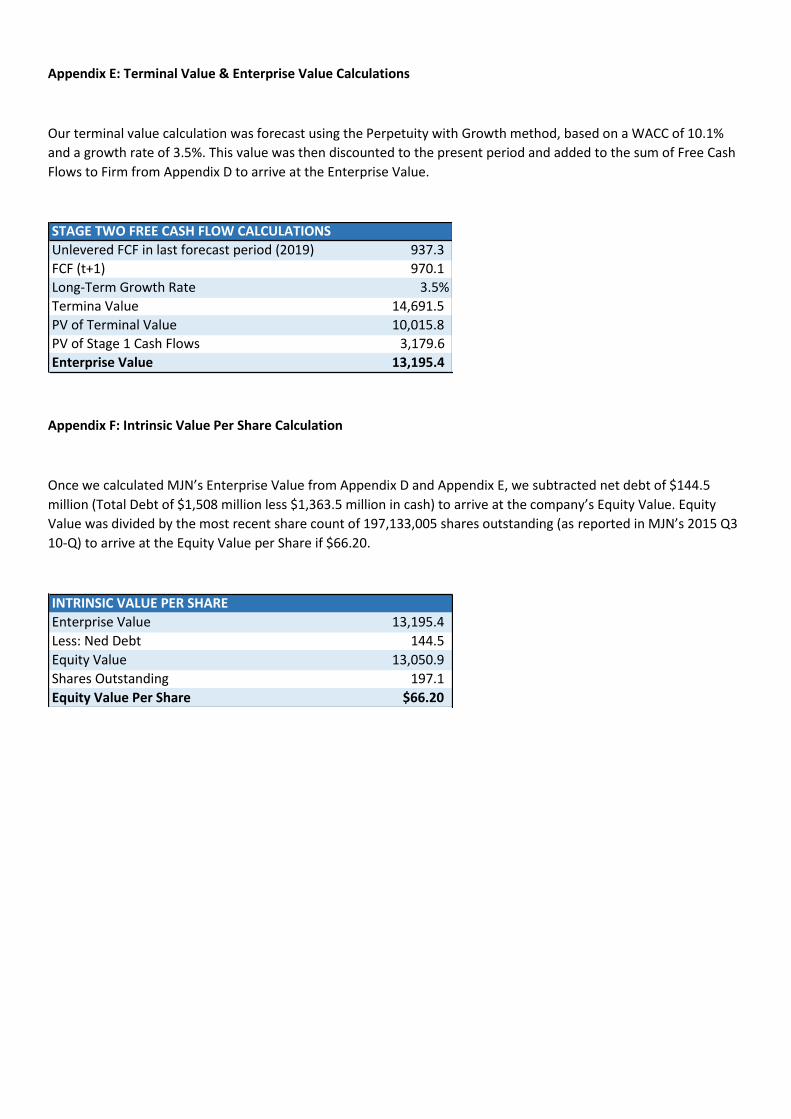
Appendix E: Terminal Value & Enterprise Value Calculations
Our terminal value calculation was forecast using the Perpetuity with Growth method, based on a WACC of 10.1%
and a growth rate of 3.5%. This value was then discounted to the present period and added to the sum of Free Cash
Flows to Firm from Appendix D to arrive at the Enterprise Value.
Appendix F: Intrinsic Value Per Share Calculation
Once we calculated MJN’s Enterprise Value from Appendix D and Appendix E, we subtracted net debt of $144.5
million (Total Debt of $1,508 million less $1,363.5 million in cash) to arrive at the company’s Equity Value. Equity
Value was divided by the most recent share count of 197,133,005 shares outstanding (as reported in MJN’s 2015 Q3
10-Q) to arrive at the Equity Value per Share if $66.20.
STAGETWOFREECASHFLOWCALCULATIONS
UnleveredFCFinlastforecastperiod(2019) 937.3
FCF(t+1) 970.1
Long-TermGrowthRate 3.5%
TerminaValue 14,691.5
PVofTerminalValue 10,015.8
PVofStage1CashFlows 3,179.6
EnterpriseValue 13,195.4
INTRINSICVALUEPERSHARE
EnterpriseValue 13,195.4
Less:NedDebt 144.5
EquityValue 13,050.9
SharesOutstanding 197.1
EquityValuePerShare $66.20
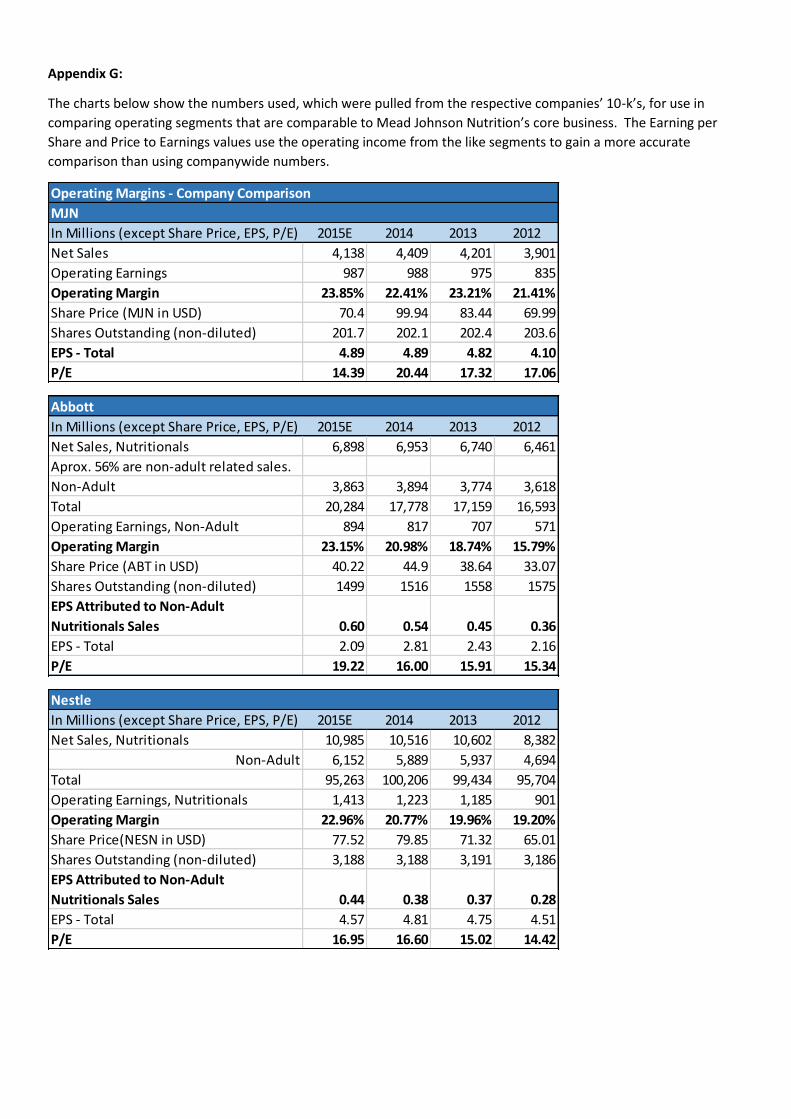
Appendix G:
The charts below show the numbers used, which were pulled from the respective companies’ 10-k’s, for use in
comparing operating segments that are comparable to Mead Johnson Nutrition’s core business. The Earning per
Share and Price to Earnings values use the operating income from the like segments to gain a more accurate
comparison than using companywide numbers.
Operating Margins - Company Comparison
MJN
In Millions (except Share Price, EPS, P/E) 2015E 2014 2013 2012
Net Sales 4,138 4,409 4,201 3,901
Operating Earnings 987 988 975 835
Operating Margin 23.85% 22.41% 23.21% 21.41%
Share Price (MJN in USD) 70.4 99.94 83.44 69.99
Shares Outstanding (non-diluted) 201.7 202.1 202.4 203.6
EPS - Total 4.89 4.89 4.82 4.10
P/E 14.39 20.44 17.32 17.06
Abbott
In Millions (except Share Price, EPS, P/E) 2015E 2014 2013 2012
Net Sales, Nutritionals 6,898 6,953 6,740 6,461
Aprox. 56% are non-adult related sales.
Non-Adult 3,863 3,894 3,774 3,618
Total 20,284 17,778 17,159 16,593
Operating Earnings, Non-Adult 894 817 707 571
Operating Margin 23.15% 20.98% 18.74% 15.79%
Share Price (ABT in USD) 40.22 44.9 38.64 33.07
Shares Outstanding (non-diluted) 1499 1516 1558 1575
EPS Attributed to Non-Adult
Nutritionals Sales 0.60 0.54 0.45 0.36
EPS - Total 2.09 2.81 2.43 2.16
P/E 19.22 16.00 15.91 15.34
Nestle
In Millions (except Share Price, EPS, P/E) 2015E 2014 2013 2012
Net Sales, Nutritionals 10,985 10,516 10,602 8,382
Non-Adult 6,152 5,889 5,937 4,694
Total 95,263 100,206 99,434 95,704
Operating Earnings, Nutritionals 1,413 1,223 1,185 901
Operating Margin 22.96% 20.77% 19.96% 19.20%
Share Price(NESN in USD) 77.52 79.85 71.32 65.01
Shares Outstanding (non-diluted) 3,188 3,188 3,191 3,186
EPS Attributed to Non-Adult
Nutritionals Sales 0.44 0.38 0.37 0.28
EPS - Total 4.57 4.81 4.75 4.51
P/E 16.95 16.60 15.02 14.42
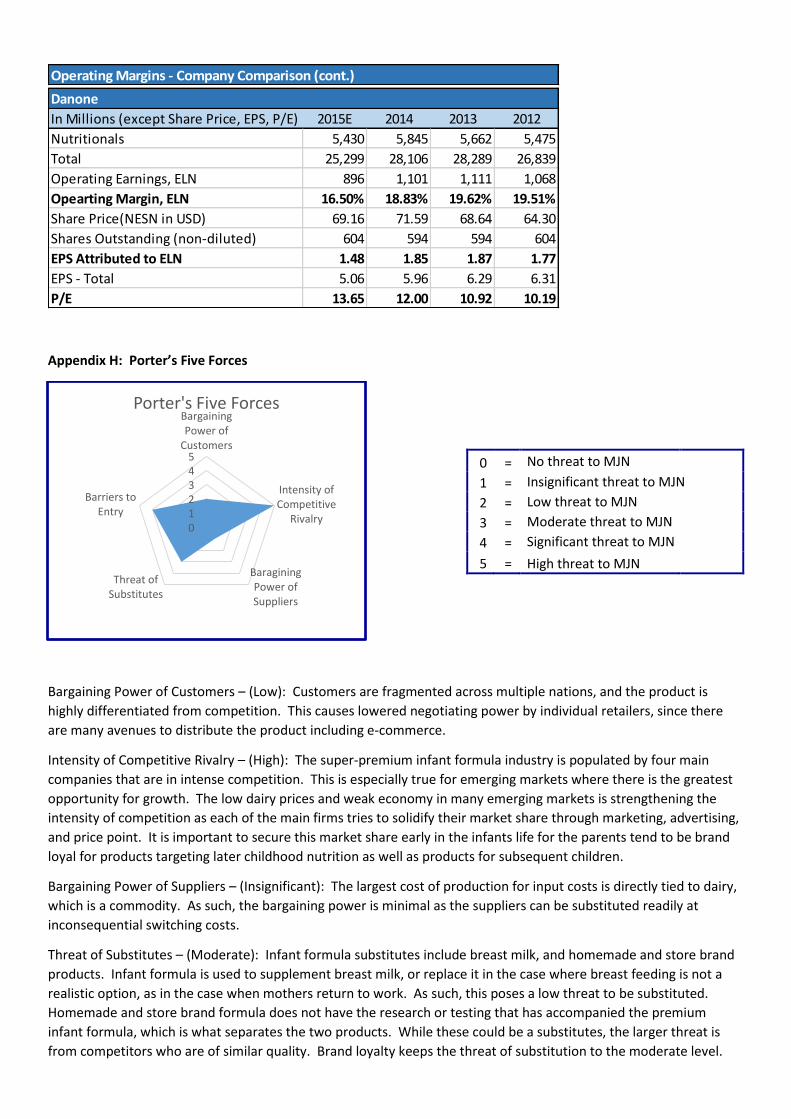
Appendix H: Porter’s Five Forces
Bargaining Power of Customers – (Low): Customers are fragmented across multiple nations, and the product is
highly differentiated from competition. This causes lowered negotiating power by individual retailers, since there
are many avenues to distribute the product including e-commerce.
Intensity of Competitive Rivalry – (High): The super-premium infant formula industry is populated by four main
companies that are in intense competition. This is especially true for emerging markets where there is the greatest
opportunity for growth. The low dairy prices and weak economy in many emerging markets is strengthening the
intensity of competition as each of the main firms tries to solidify their market share through marketing, advertising,
and price point. It is important to secure this market share early in the infants life for the parents tend to be brand
loyal for products targeting later childhood nutrition as well as products for subsequent children.
Bargaining Power of Suppliers – (Insignificant): The largest cost of production for input costs is directly tied to dairy,
which is a commodity. As such, the bargaining power is minimal as the suppliers can be substituted readily at
inconsequential switching costs.
Threat of Substitutes – (Moderate): Infant formula substitutes include breast milk, and homemade and store brand
products. Infant formula is used to supplement breast milk, or replace it in the case where breast feeding is not a
realistic option, as in the case when mothers return to work. As such, this poses a low threat to be substituted.
Homemade and store brand formula does not have the research or testing that has accompanied the premium
infant formula, which is what separates the two products. While these could be a substitutes, the larger threat is
from competitors who are of similar quality. Brand loyalty keeps the threat of substitution to the moderate level.
Operating Margins - Company Comparison (cont.)
Danone
In Millions (except Share Price, EPS, P/E) 2015E 2014 2013 2012
Nutritionals 5,430 5,845 5,662 5,475
Total 25,299 28,106 28,289 26,839
Operating Earnings, ELN 896 1,101 1,111 1,068
Opearting Margin, ELN 16.50% 18.83% 19.62% 19.51%
Share Price(NESN in USD) 69.16 71.59 68.64 64.30
Shares Outstanding (non-diluted) 604 594 594 604
EPS Attributed to ELN 1.48 1.85 1.87 1.77
EPS - Total 5.06 5.96 6.29 6.31
P/E 13.65 12.00 10.92 10.19
012345
BargainingPower of
Customers
Intensity ofCompetitive
Rivalry
BaraginingPower ofSuppliers
Threat ofSubstitutes
Barriers toEntry
Porter's Five Forces
0 = No threat to MJN
1 = Insignificant threat to MJN
2 = Low threat to MJN
3 = Moderate threat to MJN
4 = Significant threat to MJN
5 = High threat to MJN
Barriers to Entry – (Significant): The global infant formula industry requires companies to have multinational
manufacturing, distribution, and compliance systems in place, which requires a very large capital commitment. The
research and testing necessary to bring products to market also requires large capital investment along with a
prolonged timeline to meet regulatory and market acceptance.
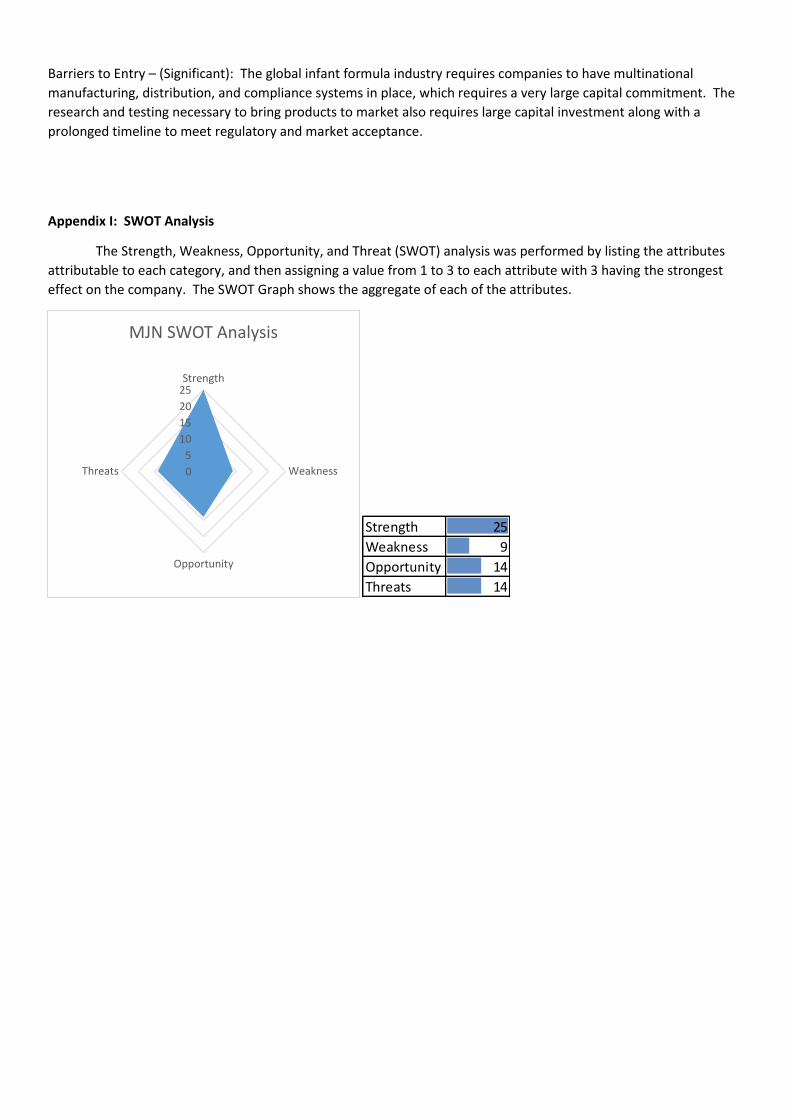
Appendix I: SWOT Analysis
The Strength, Weakness, Opportunity, and Threat (SWOT) analysis was performed by listing the attributes
attributable to each category, and then assigning a value from 1 to 3 to each attribute with 3 having the strongest
effect on the company. The SWOT Graph shows the aggregate of each of the attributes.
0
5
10
15
20
25Strength
Weakness
Opportunity
Threats
MJN SWOT Analysis
Strength 25
Weakness 9
Opportunity 14
Threats 14
00.5
11.5
22.5
3
Research &Development
Innovation
GegraphicDiversity
Economies ofScale
ProductQuality
PromotionalEffectievness
BrandRecognition
Brand Loyalty
DividendIncreases
ShareBuybacks
Profitability
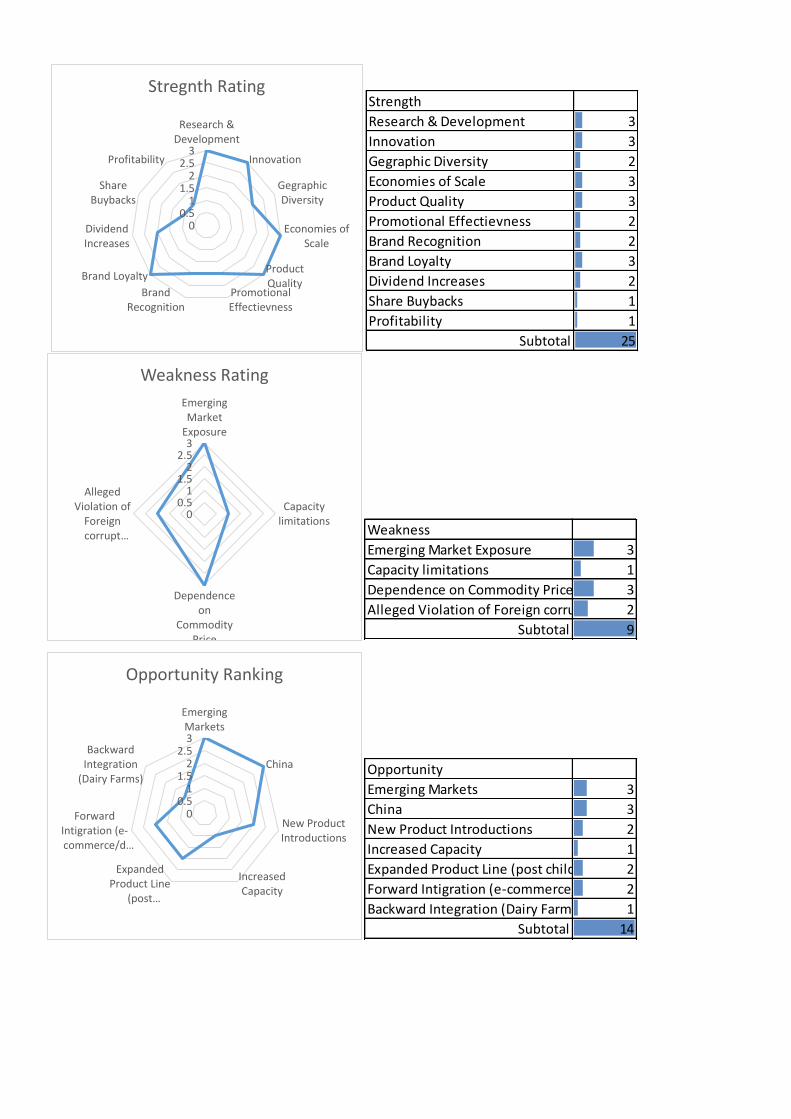
Stregnth RatingStrength
Research & Development 3
Innovation 3
Gegraphic Diversity 2
Economies of Scale 3
Product Quality 3
Promotional Effectievness 2
Brand Recognition 2
Brand Loyalty 3
Dividend Increases 2
Share Buybacks 1
Profitability 1
Subtotal 25
00.5
11.5
22.5
3
EmergingMarket
Exposure
Capacitylimitations
Dependenceon
CommodityPrice
AllegedViolation of
Foreigncorrupt…
Weakness Rating
Weakness
Emerging Market Exposure 3
Capacity limitations 1
Dependence on Commodity Price 3
Alleged Violation of Foreign corrupt Practices Act2
Subtotal 9
00.5
11.5
22.5
3
EmergingMarkets
China
New ProductIntroductions
IncreasedCapacity
ExpandedProduct Line
(post…
ForwardIntigration (e-commerce/d…
BackwardIntegration
(Dairy Farms)
Opportunity Ranking
Opportunity
Emerging Markets 3
China 3
New Product Introductions 2
Increased Capacity 1
Expanded Product Line (post childhood) 2
Forward Intigration (e-commerce/direct sales)2
Backward Integration (Dairy Farms) 1
Subtotal 14
00.5
11.5
22.5
3Substitutes
Competition
GlobalEconomicDownturn
China
CurrencyFluctuations
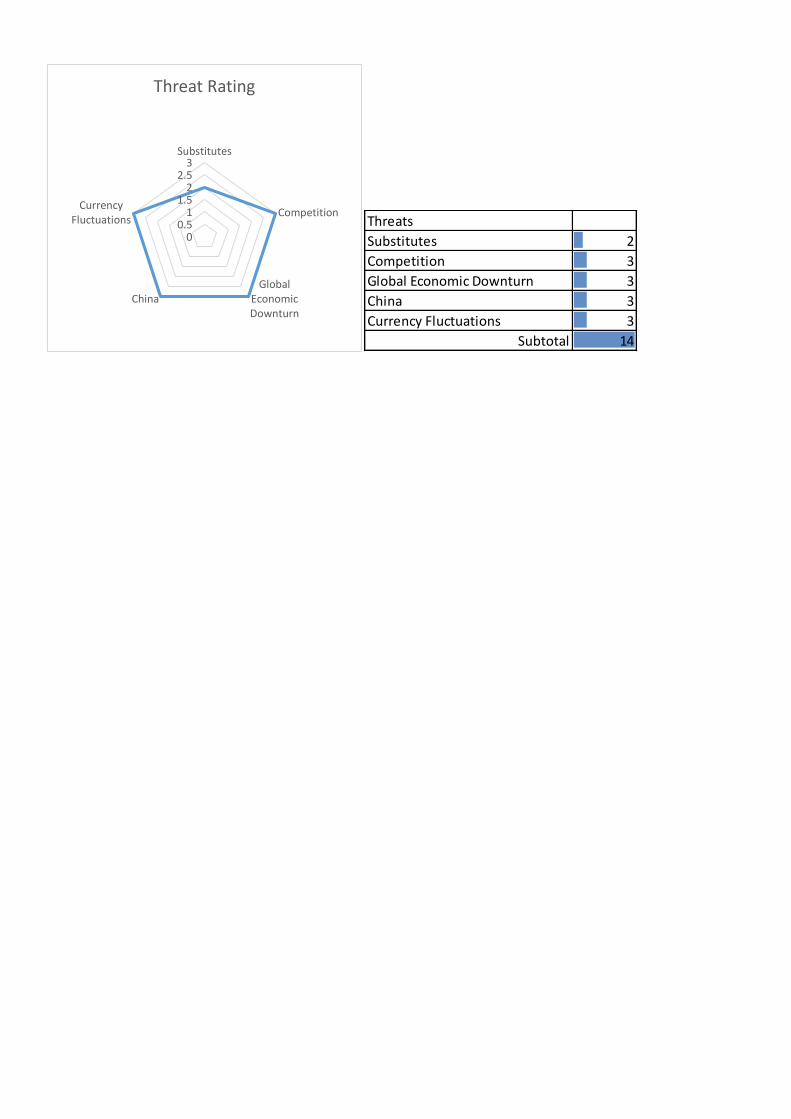
Threat Rating
Threats
Substitutes 2
Competition 3
Global Economic Downturn 3
China 3
Currency Fluctuations 3
Subtotal 14
References
1. DariyReporter.com
Haenlein, Oliver. "Worldwide Infant Formula Sales Set to Rocket as China Ends One-child Policy." DairyReporter.com.
William Reed Business Media, 04 Nov. 2015. Web. 29 Dec. 2015.
<http://www.dairyreporter.com/Markets/Worldwide-infant-formula-sales-set-to-rocket-as-China-ends-one-child-
policy>.
2. eMarketer
"Ecommerce Drives Retail Sales Growth in China - eMarketer." Ecommerce Drives Retail Sales Growth in China -
eMarketer. eMarketer, Inc., 25 Sept. 2015. Web. 29 Dec. 2015. <http://www.emarketer.com/Article/Ecommerce-
Drives-Retail-Sales-Growth-China/1013028>.
CNN
Jiang, Steve, Paul Armstrong, and Sussannah Cullinane. "China Rubberstamps Two-child Policy - CNN.com." CNN.
Cable News Network, 27 Dec. 2015. Web. 29 Dec. 2015. <http://www.cnn.com/2015/12/27/asia/china-two-child-
policy/index.html>.
Danone
"Company Reports." Danone. IBM France CSC, 30 June 2015. Web. 29 Dec. 2015.
<http://finance.danone.com/phoenix.zhtml?c=95168&p=irol-reportsAnnual>.
Abbott
"Financial Reporting." Annual Reports. Abbott, 1 Jan. 2015. Web. 29 Dec. 2015.
<http://www.abbottinvestor.com/phoenix.zhtml?c=94004&p=irol-proxy>.
Nestle
"Investor Relations." Nestle Global. Nestle, n.d. Web. 31 Dec. 2015. <http://www.nestle.com/investors>.
Chinese Government Network
"State Council on the Promotion of Cross-border E-commerce Healthy and Rapid Development of Guidance." Chinese
Government. Chinese Government Network, 16 June 2015. Web. 1 Jan. 2015.
<http%3A%2F%2Fwww.gov.cn%2Fzhengce%2Fcontent%2F2015-06%2F20%2Fcontent_9955.htm>.
3. The Economy Forecast Agency
"Long Term Forecasts." The Economy Forecast Agency. The Economy Forecast Agency, 01 Oct. 2015. Web. 2 Jan.
2016. <http%3A%2F%2Flongforecast.com%2Ffx%2Feuro-exchange-rate-forecast-for-2015-2016-and-2017.html>.
4. USDA Projected Dairy Costs through 2025
USA. United States Department of Agriculture. Office of the Chief Economist. USDA Office of the Chief Economist.
Long Term Agricultural Projections, 01 Dec. 2015. Web. 29 Dec. 2015.
<http://www.usda.gov/oce/commodity/projections/index.htm>.
5. 3Q 2015 10-Q, Pg. 22
6. 2015 Q3 10-Q Pg. 31
7. CFA Research Challenge Company Presentation, 11/23/2015
8. CFA Research Challenge Company Presentation, 11/23/2015
9. Q3 2015 Earnings Release, Pg. 1
10. Q3 2015 10-Q, Pg. 22

11. http://www.worldbank.org/en/publication/global-economic-prospects/summary-table
12. 3Q 2015 10-Q, Pg. 22
13. http://www.worldbank.org/en/publication/global-economic-prospects/summary-table
14. CFA Research Challenge Company Presentation, 11/23/2015
15. 2015 Q3 10-Q Pg. 31
16. CFA Research Challenge Company Presentation, 11/23/2015
17. Q3 2015 Earnings Release Pg. 4
18. Q3 2015 Earnings Release Pg. 1
19. Pew Research Center
Livingston, Gretchen. "In a Down Economy, Fewer Births." Pew Research Centers Social Demographic Trends Project
RSS. Pew Research Center, 12 Oct. 2011. Web. 03 Jan. 2016. <http://www.pewsocialtrends.org/2011/10/12/in-a-
down-economy-fewer-births/>.
Disclosures: Ownership and material conflicts of interest:
The author(s), or a member of their household, of this report does not hold a financial interest in the securities of this company.
The author(s), or a member of their household, of this report does not know of the existence of any conflicts of interest that might bias the
content or publication of this report.
Receipt of compensation:
Compensation of the author(s) of this report is not based on investment banking revenue.
Position as a officer or director:
The author(s), or a member of their household, does not serve as an officer, director or advisory board member of the subject company.
Market making:
The author(s) does not act as a market maker in the subject company’s securities.
Disclaimer:
The information set forth herein has been obtained or derived from sources generally available to the public and believed by the author(s) to
be reliable, but the author(s) does not make any representation or warranty, express or implied, as to its accuracy or completeness. The
information is not intended to be used as the basis of any investment decisions by any person or entity. This information does not constitute
investment advice, nor is it an offer or a solicitation of an offer to buy or sell any security. This report should not be considered to be a
recommendation by any individual affiliated with CFA Society Chicago, CFA Institute or the CFA Institute Research Challenge with regard to this
company’s stock.
CFA Institute Research Challenge