Blue-OX Energy Management TJ Chancellor Paul Cole Sara Habib Mira Kim Claudio Ramos Vicente Rosas.
33
Blue-OX Blue-OX Energy Energy Management Management TJ Chancellor TJ Chancellor Paul Cole Paul Cole Sara Habib Sara Habib Mira Kim Mira Kim Claudio Ramos Claudio Ramos Vicente Rosas Vicente Rosas
-
Upload
cecilia-elliott -
Category
Documents
-
view
217 -
download
3
Transcript of Blue-OX Energy Management TJ Chancellor Paul Cole Sara Habib Mira Kim Claudio Ramos Vicente Rosas.

Blue-OX Blue-OX Energy Energy
ManagementManagementTJ ChancellorTJ Chancellor
Paul ColePaul Cole
Sara HabibSara Habib
Mira KimMira Kim
Claudio RamosClaudio Ramos
Vicente RosasVicente Rosas
Benzene Benzene Hydrogenation Hydrogenation
Process Process

Project 3: Benzene Project 3: Benzene Hydrogenation Process Hydrogenation Process
Purpose - provide an economic analysis for Purpose - provide an economic analysis for the benzene hydrogenation process.the benzene hydrogenation process.
Objectives - Objectives - Estimate the total fixed capital Estimate the total fixed capital
investment investment Estimate the annual product cost. Estimate the annual product cost. Estimate the annual cash flow for the life Estimate the annual cash flow for the life
of the project. of the project. Report profitability based on ROI, Report profitability based on ROI,
discounted cash flow, (NPW), and POT. discounted cash flow, (NPW), and POT. NPW if products were sold at half or NPW if products were sold at half or
three times the price of cyclohexane.three times the price of cyclohexane.

Process Flow Diagram Process Flow Diagram
M1
R1
E1
E3
F1 SP1
C1
E2
234567891011121314151617181920212223242526272829
1
30T1
RECYCLE
BENZENE
HYDROGENS1
S4
S5
S2
S6
S7
FEED
S8
PURGE
S3
TOP
BOTTOM
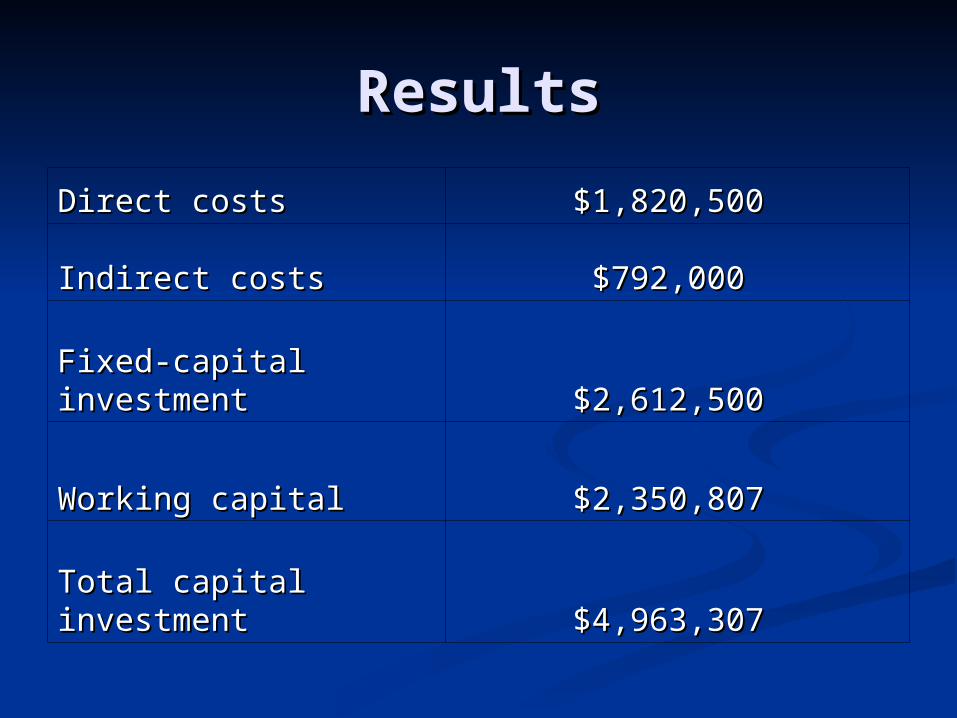
ResultsResults
Direct costsDirect costs $1,820,500 $1,820,500
Indirect costsIndirect costs $792,000 $792,000
Fixed-capital Fixed-capital investmentinvestment $2,612,500 $2,612,500
Working capitalWorking capital $2,350,807 $2,350,807
Total capital Total capital investmentinvestment $4,963,307 $4,963,307
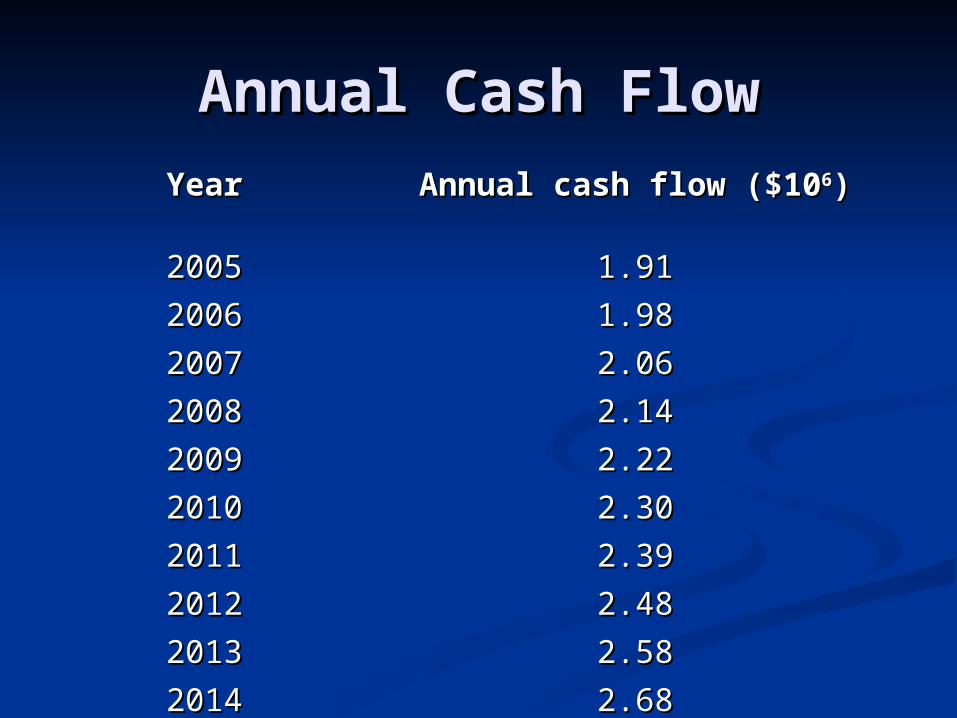
Annual Cash FlowAnnual Cash FlowYearYear Annual cash flow ($10Annual cash flow ($1066))
20052005 1.911.91
20062006 1.981.98
20072007 2.062.06
20082008 2.142.14
20092009 2.222.22
20102010 2.302.30
20112011 2.392.39
20122012 2.482.48
20132013 2.582.58
20142014 2.682.68

Annual Total Product Annual Total Product CostCost
Total variable costTotal variable cost $ 3,369,345$ 3,369,345
Total fixed costTotal fixed cost $ 78,375$ 78,375
Total product costTotal product cost $ 3,447,720$ 3,447,720
Plant overheadPlant overhead $ 344,772$ 344,772
ManufacturingManufacturing $ 3,792,492$ 3,792,492
Total general expensesTotal general expenses $0$0
Total product costTotal product cost $ 3,792,492$ 3,792,492

ProfitabilityProfitability
Price of Price of CyclohexanCyclohexane (per e (per gallon)gallon)
ROIROI
DiscounteDiscounted Cash d Cash
Flow Rate Flow Rate of Returnof Return
NPWNPW POTPOT
$1.91$1.91 -8.2%-8.2% N/A N/A -$5.60 -$5.60 millionmillion N/AN/A
$3.82$3.82 40.6%40.6% 0.600.60 $8.50 $8.50 millionmillion 1.03 years1.03 years
$11.46$11.46 247%247% 3.163.16 $64.90 $64.90 millionmillion 0.19 years0.19 years

RecommendationsRecommendations
If market value of cyclohexane falls If market value of cyclohexane falls below $2.32/gallon the process below $2.32/gallon the process should be discontinued.should be discontinued.

Hydrogenation Hydrogenation Process Fluid Process Fluid
Flow EconomicsFlow Economics
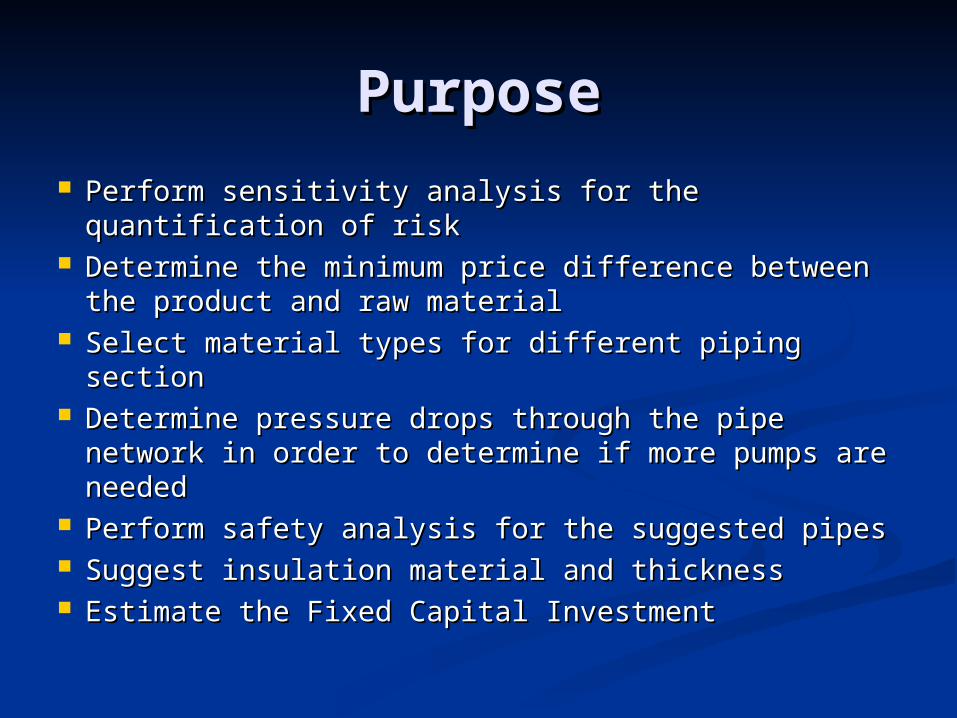
PurposePurpose Perform sensitivity analysis for the quantification Perform sensitivity analysis for the quantification
of riskof risk Determine the minimum price difference between Determine the minimum price difference between
the product and raw materialthe product and raw material Select material types for different piping sectionSelect material types for different piping section Determine pressure drops through the pipe Determine pressure drops through the pipe
network in order to determine if more pumps are network in order to determine if more pumps are neededneeded
Perform safety analysis for the suggested pipesPerform safety analysis for the suggested pipes Suggest insulation material and thicknessSuggest insulation material and thickness Estimate the Fixed Capital Investment Estimate the Fixed Capital Investment
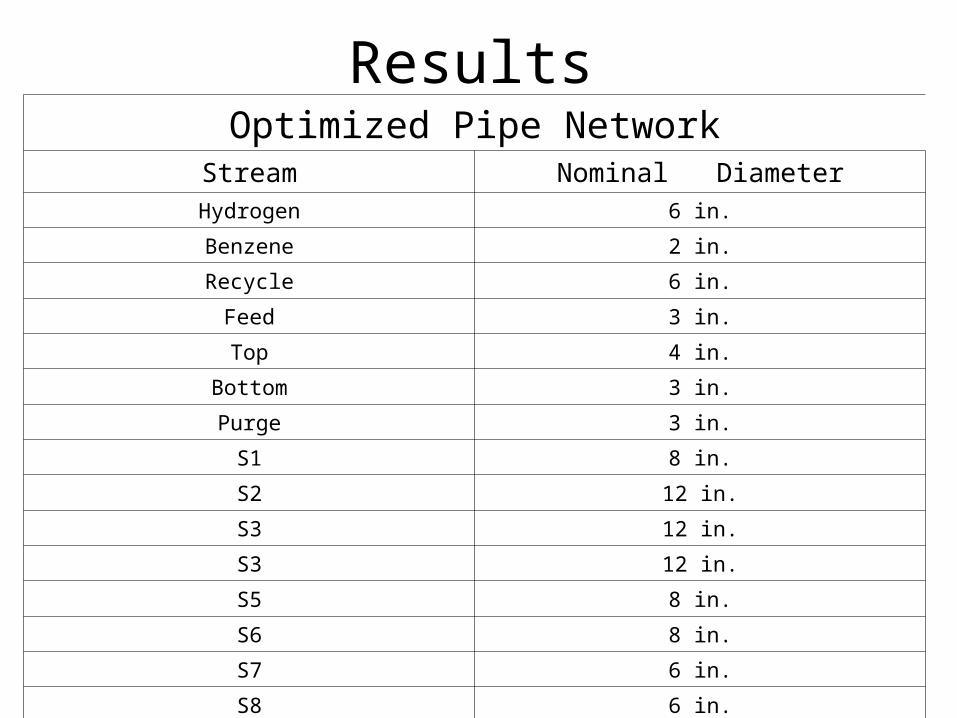
ResultsOptimized Pipe Network
Stream Nominal DiameterHydrogen 6 in.
Benzene 2 in.
Recycle 6 in.
Feed 3 in.
Top 4 in.
Bottom 3 in.
Purge 3 in.
S1 8 in.
S2 12 in.
S3 12 in.
S3 12 in.
S5 8 in.
S6 8 in.
S7 6 in.
S8 6 in.
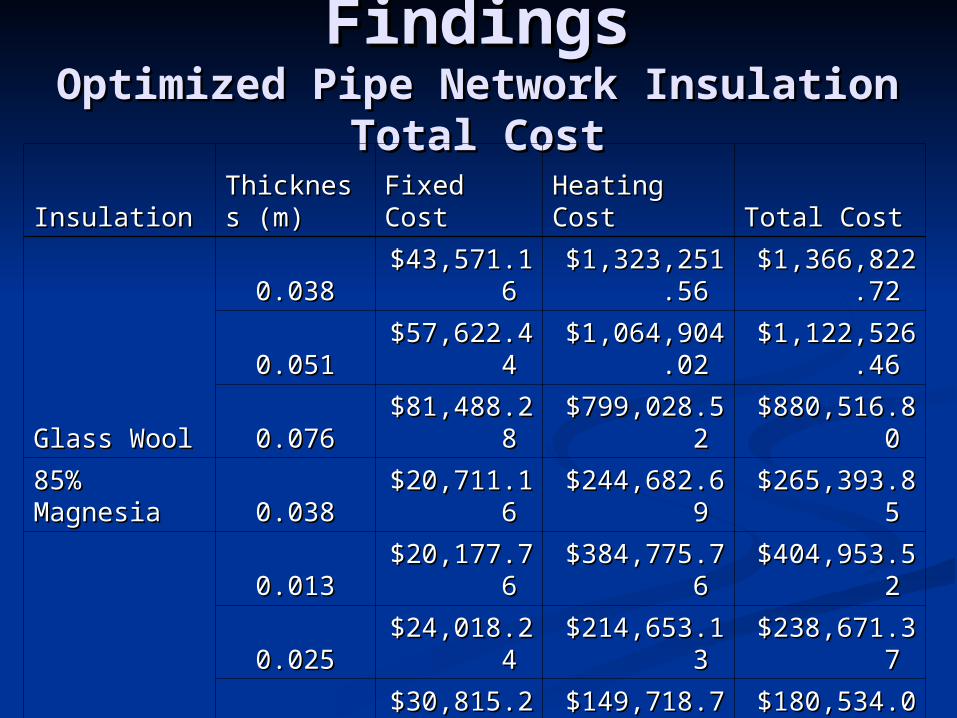
FindingsFindingsOptimized Pipe Network Insulation Optimized Pipe Network Insulation
Total CostTotal CostInsulationInsulation
Thickness Thickness (m)(m) Fixed CostFixed Cost
Heating Heating CostCost Total CostTotal Cost
Glass WoolGlass Wool
0.0380.038$43,571.1$43,571.1
6 6 $1,323,251.$1,323,251.
56 56 $1,366,822.$1,366,822.
72 72
0.0510.051$57,622.4$57,622.4
4 4 $1,064,904.$1,064,904.
02 02 $1,122,526.$1,122,526.
46 46
0.0760.076$81,488.2$81,488.2
8 8 $799,028.52 $799,028.52 $880,516.80 $880,516.80
85% 85% MagnesiaMagnesia 0.0380.038
$20,711.1$20,711.16 6 $244,682.69 $244,682.69 $265,393.85 $265,393.85
Rock WoolRock Wool
0.0130.013$20,177.7$20,177.7
6 6 $384,775.76 $384,775.76 $404,953.52 $404,953.52
0.0250.025$24,018.2$24,018.2
4 4 $214,653.13 $214,653.13 $238,671.37 $238,671.37
0.0380.038$30,815.2$30,815.2
8 8 $149,718.75 $149,718.75 $180,534.03 $180,534.03
0.0510.051$43,571.1$43,571.1
6 6 $117,376.36 $117,376.36 $160,947.52 $160,947.52

FindingsFindingsOptimized Pipe Network Insulation Total Optimized Pipe Network Insulation Total
Cost Percentage less than the Non-Cost Percentage less than the Non-optimizedoptimized
InsulationInsulationThickness Thickness (m)(m)
Fixed Fixed CostCost
Heating Heating CostCost Total CostTotal Cost
Glass WoolGlass Wool
0.0380.038 24%24% 12%12% 13%13%
0.0510.051 25%25% 12%12% 13%13%
0.0760.076 24%24% 11%11% 13%13%
85% Magnesia85% Magnesia 0.0380.038 17%17% 12%12% 13%13%
Rock WoolRock Wool
0.0130.013 26%26% 13%13% 14%14%
0.0250.025 26%26% 13%13% 14%14%
0.0380.038 19%19% 12%12% 14%14%
0.0510.051 24%24% 12%12% 15%15%
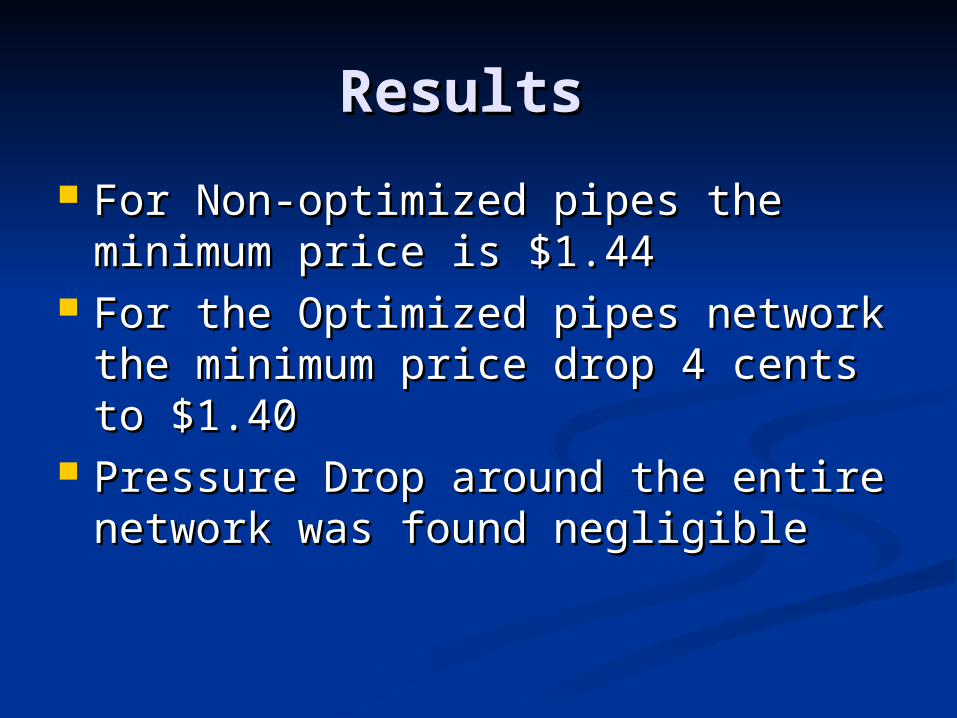
Results Results
For Non-optimized pipes the For Non-optimized pipes the minimum price is $1.44minimum price is $1.44
For the Optimized pipes network the For the Optimized pipes network the minimum price drop 4 cents to $1.40minimum price drop 4 cents to $1.40
Pressure Drop around the entire Pressure Drop around the entire network was found negligiblenetwork was found negligible
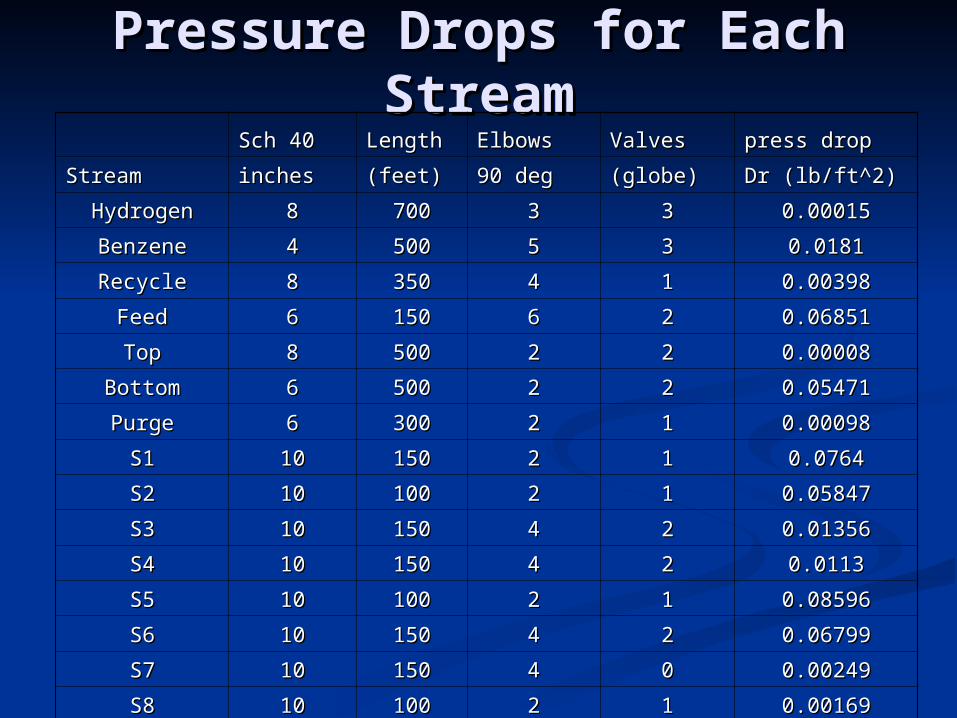
Pressure Drops for Each Pressure Drops for Each StreamStream
Sch 40Sch 40 LengthLength ElbowsElbows ValvesValves press droppress drop
StreamStream inchesinches (feet)(feet) 90 deg90 deg (globe)(globe) Dr (lb/ft^2)Dr (lb/ft^2)
HydrogenHydrogen 88 700700 33 33 0.000150.00015
BenzeneBenzene 44 500500 55 33 0.01810.0181
RecycleRecycle 88 350350 44 11 0.003980.00398
FeedFeed 66 150150 66 22 0.068510.06851
TopTop 88 500500 22 22 0.000080.00008
BottomBottom 66 500500 22 22 0.054710.05471
PurgePurge 66 300300 22 11 0.000980.00098
S1S1 1010 150150 22 11 0.07640.0764
S2S2 1010 100100 22 11 0.058470.05847
S3S3 1010 150150 44 22 0.013560.01356
S4S4 1010 150150 44 22 0.01130.0113
S5S5 1010 100100 22 11 0.085960.08596
S6S6 1010 150150 44 22 0.067990.06799
S7S7 1010 150150 44 00 0.002490.00249
S8S8 1010 100100 22 11 0.001690.00169

RecommendationsRecommendations By using the nominal diameter suggested By using the nominal diameter suggested
the company will save about $200,000 in the company will save about $200,000 in the capital investment for the pipesthe capital investment for the pipes
Blue Ox determine that 2 inches thick Blue Ox determine that 2 inches thick rock wool insulation is the economical rock wool insulation is the economical optimumoptimum
Based on the simulation and calculation Based on the simulation and calculation the pressure drop is negligible the pressure drop is negligible throughout the pipe network thus no new throughout the pipe network thus no new pump or compressor is necessary at this pump or compressor is necessary at this timetime

Heat and Heat and Material Material
Balances and Balances and Pump AnalysisPump Analysis

Heat and Material Heat and Material Balances and Pump Balances and Pump
AnalysisAnalysis Objectives:Objectives:solve heat and material balances for the solve heat and material balances for the process from process from Project 3Project 3select an appropriate material for the select an appropriate material for the reactorreactordetermine the work needed at the pump for determine the work needed at the pump for the the pumping section of the processpumping section of the processsuggest a pump type suggest a pump type create NPSHA vs. flow rate diagramcreate NPSHA vs. flow rate diagramsystem head vs. flow rate diagram system head vs. flow rate diagram estimate the Fixed Capital Investment for estimate the Fixed Capital Investment for the the pumping section.pumping section.
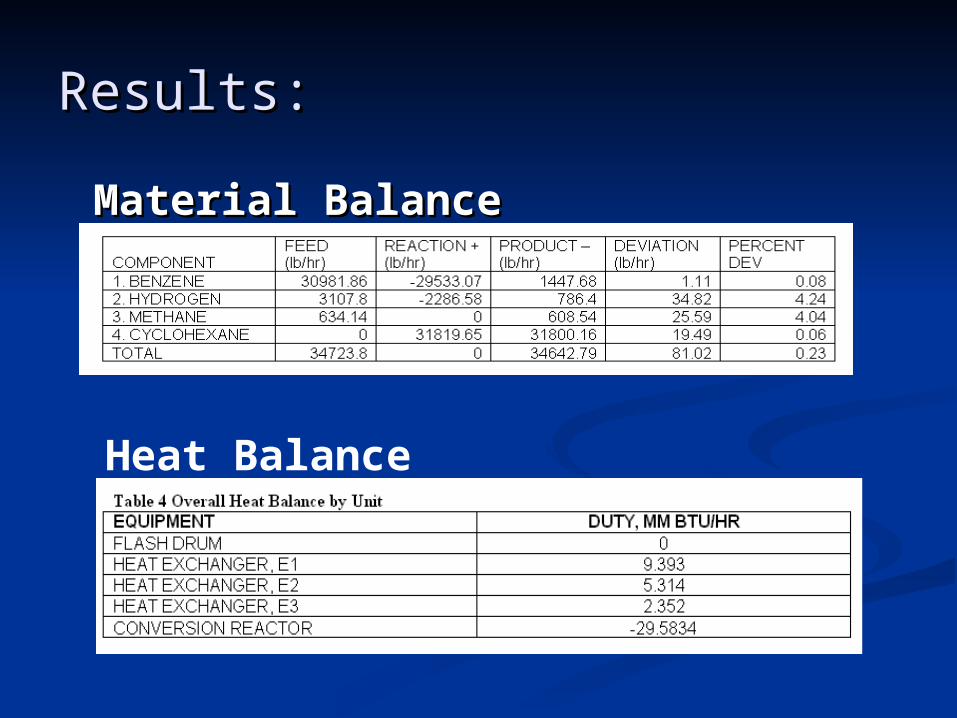
Results:Results:
Material BalanceMaterial Balance
Heat Balance
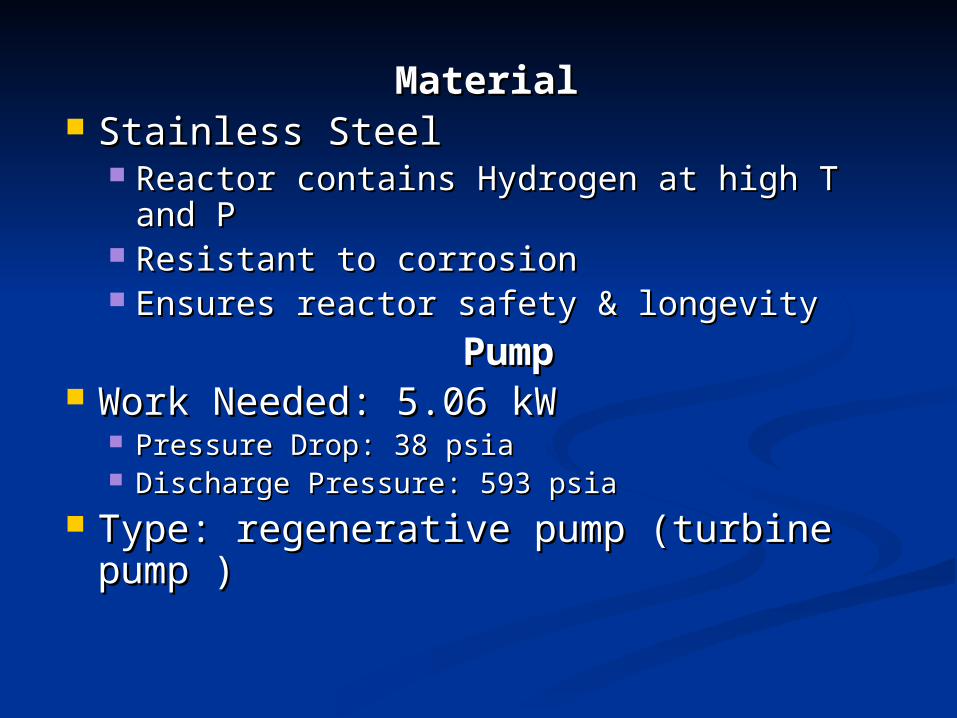
MaterialMaterial Stainless SteelStainless Steel
Reactor contains Hydrogen at high T and P Reactor contains Hydrogen at high T and P Resistant to corrosionResistant to corrosion Ensures reactor safety & longevityEnsures reactor safety & longevity
PumpPump Work Needed: 5.06 kWWork Needed: 5.06 kW
Pressure Drop: 38 psia Pressure Drop: 38 psia Discharge Pressure: 593 psia Discharge Pressure: 593 psia
Type: regenerative pump (turbine pump Type: regenerative pump (turbine pump ))

NPSHA and System Head vs. Flow Rate

Fixed Capital Investment for the Fixed Capital Investment for the
pumping sectionpumping section

Heat Transport Heat Transport EquipmentEquipment
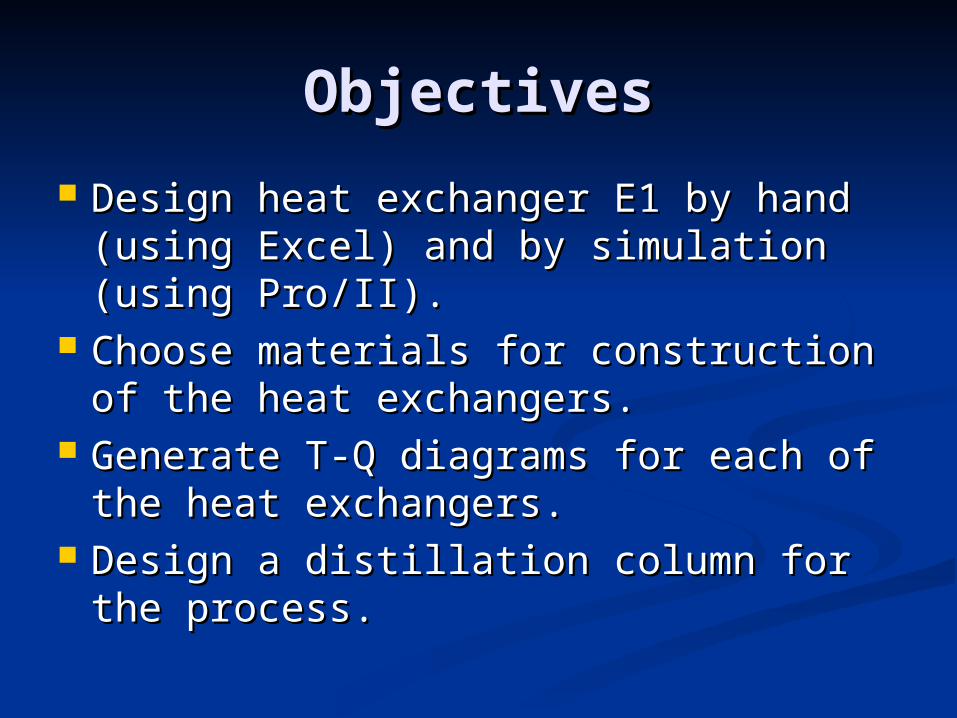
ObjectivesObjectives
Design heat exchanger E1 by hand Design heat exchanger E1 by hand (using Excel) and by simulation (using (using Excel) and by simulation (using Pro/II).Pro/II).
Choose materials for construction of Choose materials for construction of the heat exchangers.the heat exchangers.
Generate T-Q diagrams for each of the Generate T-Q diagrams for each of the heat exchangers.heat exchangers.
Design a distillation column for the Design a distillation column for the process.process.

Hand DesignHand Design
Double pass heat exchanger. Double pass heat exchanger. Nominal Tube Size: ½ inchNominal Tube Size: ½ inch Tube Length: 16 feetTube Length: 16 feet Total Area: 2117 ftTotal Area: 2117 ft22
Fluid Flow Rate: 4.73 mFluid Flow Rate: 4.73 m33/s/s Tube Side Pressure Drop: 1.71 psiTube Side Pressure Drop: 1.71 psi

Simulator DesignSimulator Design
Front End Stationary Head: Channel Front End Stationary Head: Channel and Removable Coverand Removable Cover
Shell Type: Double Pass with Shell Type: Double Pass with Longitudinal BaffleLongitudinal Baffle
Rear End Head: U-Tube BundleRear End Head: U-Tube Bundle Shell Inside Diameter: 8 inchesShell Inside Diameter: 8 inches Tubes per Shell: 24Tubes per Shell: 24 Area: 588ftArea: 588ft22
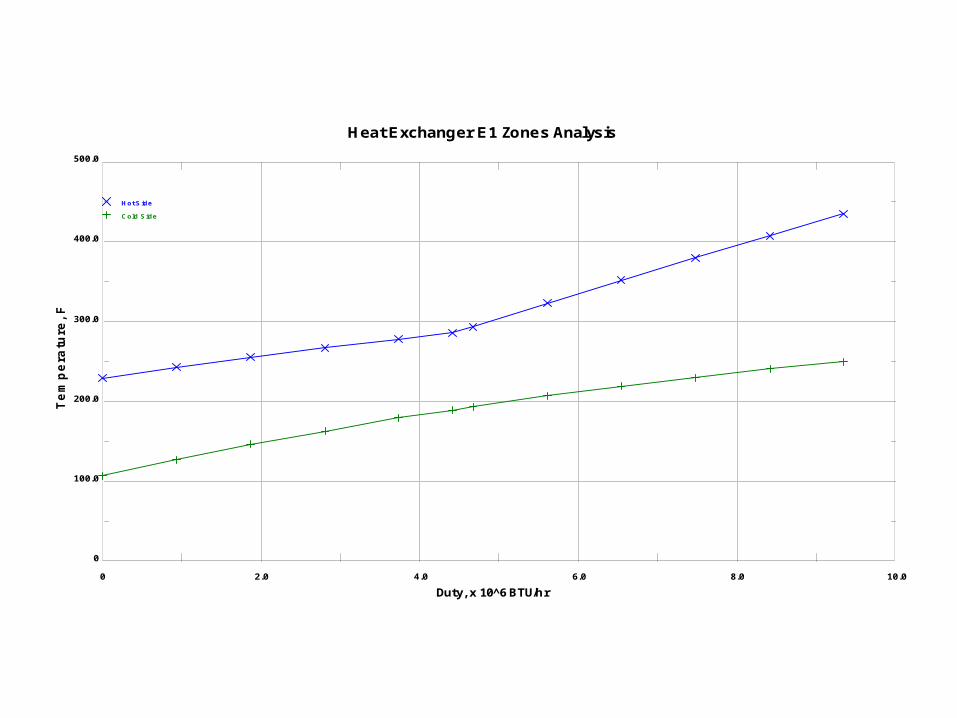
Duty, x 10̂ 6 BTU/hr0 2.0 4.0 6.0 8.0 10.0
Te
mp
era
ture
, F
0
100.0
200.0
300.0
400.0
500.0
Heat Exchanger E1 Zones Analysis
Hot Side
Cold Side

Duty, x 10̂ 6 BTU/hr0 1.2 2.4 3.6 4.8 6.0
Te
mp
era
ture
, F
0
50.0
100.0
150.0
200.0
250.0
Heat Exchanger E2 Zones Analysis
Hot Side
Cold Side

Duty, x 10̂ 6 BTU/hr0 0.50 1.00 1.50 2.00 2.50
Te
mp
era
ture
, F
240.0
280.0
320.0
360.0
400.0
Heat Exchanger E3 Zones Analysis
Hot Side
Cold Side
Heat Exchanger Heat Exchanger MaterialsMaterials
304 Stainless Steel was chosen as 304 Stainless Steel was chosen as the material for construction.the material for construction.
Stainless steel was chosen because Stainless steel was chosen because of the corrosive properties of of the corrosive properties of methane and benzene.methane and benzene.
EconomicsEconomics
Price of a single heat exchanger: Price of a single heat exchanger: $12,155$12,155
Purchased Equipment (3 heat Purchased Equipment (3 heat exchangers): $36,465exchangers): $36,465
Fixed Capital Investment: $190,530Fixed Capital Investment: $190,530

Distillation ColumnDistillation Column
28 Trays. 2 feet between trays. 5 28 Trays. 2 feet between trays. 5 feet for the top and bottom trays.feet for the top and bottom trays.
Column Height: 66 feetColumn Height: 66 feet Tray Diameter: 93 inchesTray Diameter: 93 inches CondenserCondenser ReboilerReboiler Reflux Ratio: 24Reflux Ratio: 24