
blue (h) is mounted with the electrodes facing down (8), leading to the finished device (9). Note:...
8
Quantitative self-powered electrochromic biosensors Miguel Aller Pellitero 1 , Anton Guimerà 1,2 , Maria Kitsara 1 , Rosa Villa 1,2 , Camille Rubio 3 , Boris Lakard 3 , Marie-Laure Doche 3 , Jean-Yves Hihn 3 , and F. Javier del Campo 1* . Affiliations 1 Instituto de Microelectrónica de Barcelona, IMB-CNM (CSIC); Campus de la Universidad Autónoma de Barcelona; Esfera UAB; 08193-Bellaterra; Barcelona, Spain. 2 CIBER-BBN, Networking Centre on Bioengineering, Biomaterials and Nanomedicine, Barcelona, Spain. 3 Institut UTINAM; UMR 6213 CNRS/Université de Franche-Comté; 16 route de Gray; 25030 Besançon, France. * Corresponding author: [email protected] Contents Page S1 Chip fabrication. S2 S2 Electrochemical activation of the Prussian blue coating. S3 S3 Data acquisition. S6 S4 Glucose measurements. S7 S5 Sample pre-treatment. S7 Figures Figure S1. Schematic representation of the self-powered device assembly. S2 Figure S2. Cyclic voltammetry of a Prussian blue film before and after preconditioning. S3 Figure S3. Cyclic voltammetry of three different Prussian blue displays. S4 Figure S4. SEM captures of the ITO glass with the Prussian blue coating. S5 Figure S5. SEM captures of the Prussian blue coating before the preconditioning. S6 Figure S6. Determination of the colour front position using ImageJ from a colour profile. S6 Figure S7. Photograph of the self-powered device during a glucose measurement. S7 References S8 S1 Electronic Supplementary Material (ESI) for Chemical Science. This journal is © The Royal Society of Chemistry 2016
Transcript of blue (h) is mounted with the electrodes facing down (8), leading to the finished device (9). Note:...
Quantitative self-powered electrochromic biosensors
Miguel Aller Pellitero1, Anton Guimerà1,2, Maria Kitsara1, Rosa Villa1,2, Camille Rubio3, Boris Lakard3, Marie-Laure Doche3, Jean-Yves Hihn3, and F. Javier del Campo1*.
Affiliations
1 Instituto de Microelectrónica de Barcelona, IMB-CNM (CSIC); Campus de la Universidad Autónoma de Barcelona; Esfera UAB; 08193-Bellaterra; Barcelona, Spain.
2 CIBER-BBN, Networking Centre on Bioengineering, Biomaterials and Nanomedicine, Barcelona, Spain.
3 Institut UTINAM; UMR 6213 CNRS/Université de Franche-Comté; 16 route de Gray; 25030 Besançon, France.
* Corresponding author: [email protected]
Contents Page
S1 Chip fabrication. S2
S2 Electrochemical activation of the Prussian blue coating. S3
S3 Data acquisition. S6
S4 Glucose measurements. S7
S5 Sample pre-treatment. S7
Figures
Figure S1. Schematic representation of the self-powered device assembly. S2
Figure S2. Cyclic voltammetry of a Prussian blue film before and after preconditioning. S3
Figure S3. Cyclic voltammetry of three different Prussian blue displays. S4
Figure S4. SEM captures of the ITO glass with the Prussian blue coating. S5
Figure S5. SEM captures of the Prussian blue coating before the preconditioning. S6
Figure S6. Determination of the colour front position using ImageJ from a colour profile. S6
Figure S7. Photograph of the self-powered device during a glucose measurement. S7
References S8
S1
Electronic Supplementary Material (ESI) for Chemical Science.This journal is © The Royal Society of Chemistry 2016
S1 Chip fabrication
The chips used in this work have been produced using a combination of pressure sensitive adhesive (PSA) materials, screen-printing pastes and indium tin oxide (ITO) coated glass chips. The pressure sensitive adhesives were sourced from Adhesives Research Ltd, IE. ARcare® 8259 is a single-sided adhesive (160µm total thickness) and ARcare® 8939 is a two-sided adhesive (130µm total thickness). Whatman 1 chromatographic paper (VWR, ES) was used to hold the electrolyte and to flow the various solutions through the system. The following screen printing pastes were sourced from Gwent Electronic Materials, ltd, UK: Ag/AgCl (ref. C61003P7), Ag (C2081126P2), and graphite (C2030519P4). These were used as received. The ITO coated wafers were obtained from Präzisions glas & Optik GmbH. The electrodes were wet etched at room temperature in a diluted mixture of HNO3 and HCl. The electrode was patterned using a low tack vinyl from Metamark, UK. After etcthing for 60 minutes, glass chips were rinsed thoroughly with deionised water, and the vinyl was peeled off, leaving the ITO electrode intact. ARCare tapes and Whatman 1 paper were cut using a 30W Epilog Mini laser engraver (Laser Project, ES). The electrodes were stencilled using a home-made PMMA tool. The copper pad was made using a 50µm Cu tape (Goodfellow, UK) and 3M anisotropic conducting film 5363 (RS-Amidata, ES).
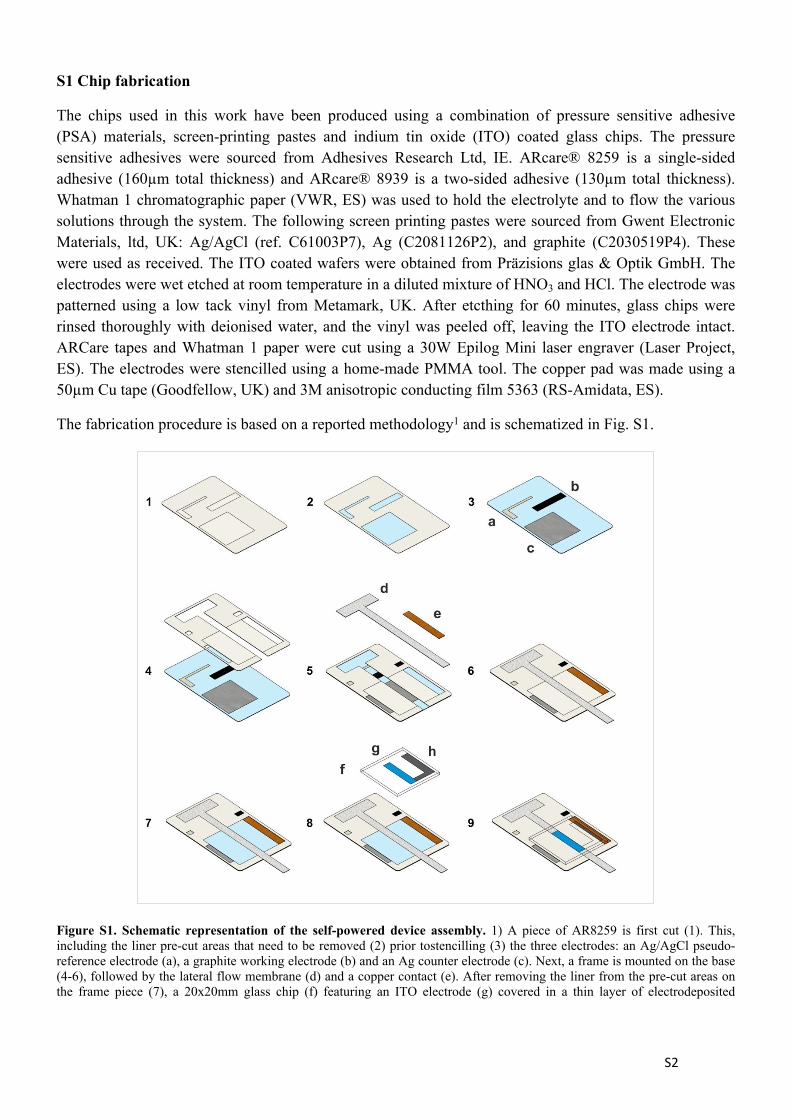
The fabrication procedure is based on a reported methodology1 and is schematized in Fig. S1.
Figure S1. Schematic representation of the self-powered device assembly. 1) A piece of AR8259 is first cut (1). This, including the liner pre-cut areas that need to be removed (2) prior tostencilling (3) the three electrodes: an Ag/AgCl pseudo-reference electrode (a), a graphite working electrode (b) and an Ag counter electrode (c). Next, a frame is mounted on the base (4-6), followed by the lateral flow membrane (d) and a copper contact (e). After removing the liner from the pre-cut areas on the frame piece (7), a 20x20mm glass chip (f) featuring an ITO electrode (g) covered in a thin layer of electrodeposited
S2
Prussian blue (h) is mounted with the electrodes facing down (8), leading to the finished device (9). Note: the clear blue colour represents the adhesive coating on the pressure-sensitive adhesive (PSA) laminates.
S2 Electrochemical activation of the Prussian blue coating
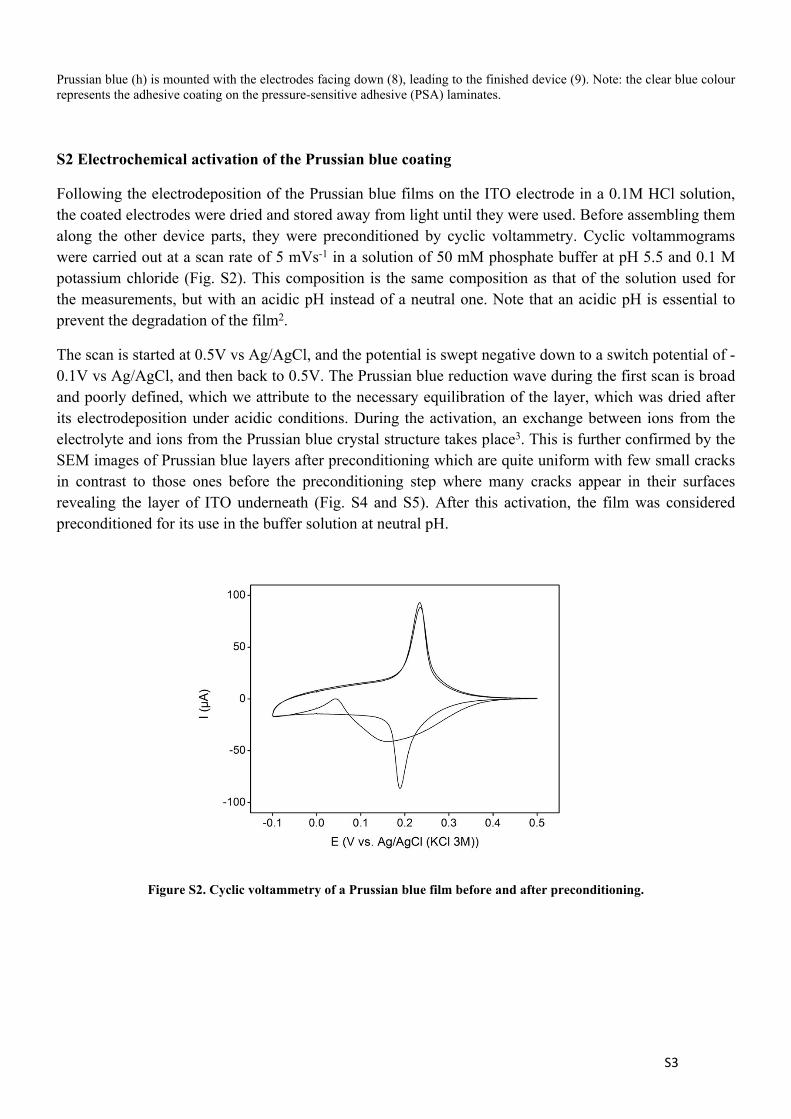
Following the electrodeposition of the Prussian blue films on the ITO electrode in a 0.1M HCl solution, the coated electrodes were dried and stored away from light until they were used. Before assembling them along the other device parts, they were preconditioned by cyclic voltammetry. Cyclic voltammograms were carried out at a scan rate of 5 mVs-1 in a solution of 50 mM phosphate buffer at pH 5.5 and 0.1 M potassium chloride (Fig. S2). This composition is the same composition as that of the solution used for the measurements, but with an acidic pH instead of a neutral one. Note that an acidic pH is essential to prevent the degradation of the film2.
The scan is started at 0.5V vs Ag/AgCl, and the potential is swept negative down to a switch potential of -0.1V vs Ag/AgCl, and then back to 0.5V. The Prussian blue reduction wave during the first scan is broad and poorly defined, which we attribute to the necessary equilibration of the layer, which was dried after its electrodeposition under acidic conditions. During the activation, an exchange between ions from the electrolyte and ions from the Prussian blue crystal structure takes place3. This is further confirmed by the SEM images of Prussian blue layers after preconditioning which are quite uniform with few small cracks in contrast to those ones before the preconditioning step where many cracks appear in their surfaces revealing the layer of ITO underneath (Fig. S4 and S5). After this activation, the film was considered preconditioned for its use in the buffer solution at neutral pH.
Figure S2. Cyclic voltammetry of a Prussian blue film before and after preconditioning.
S3
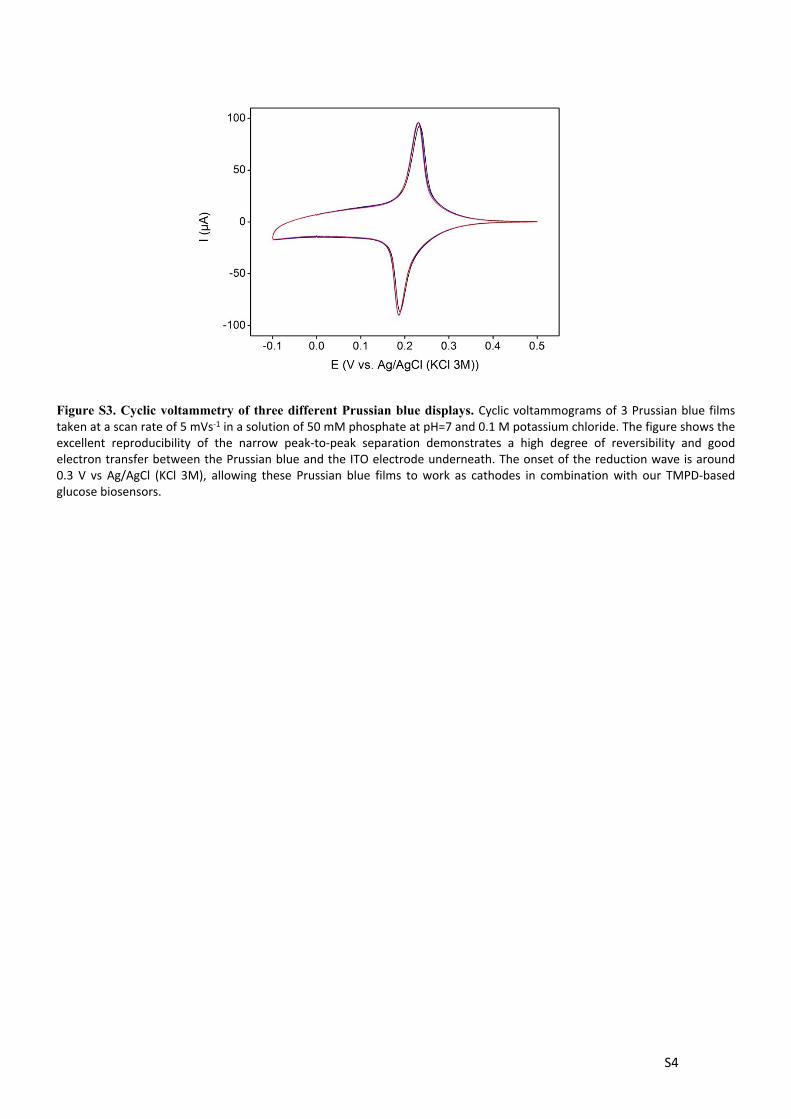
Figure S3. Cyclic voltammetry of three different Prussian blue displays. Cyclic voltammograms of 3 Prussian blue films taken at a scan rate of 5 mVs-1 in a solution of 50 mM phosphate at pH=7 and 0.1 M potassium chloride. The figure shows the excellent reproducibility of the narrow peak-to-peak separation demonstrates a high degree of reversibility and good electron transfer between the Prussian blue and the ITO electrode underneath. The onset of the reduction wave is around 0.3 V vs Ag/AgCl (KCl 3M), allowing these Prussian blue films to work as cathodes in combination with our TMPD-based glucose biosensors.
S4
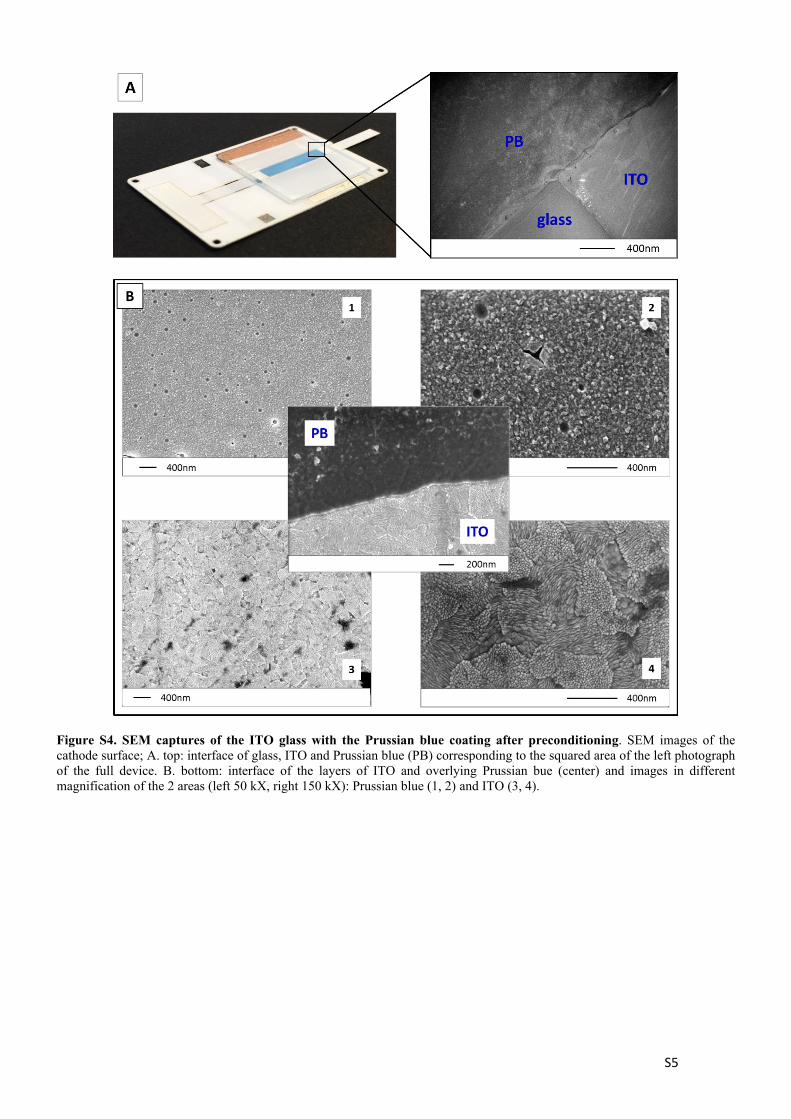
Figure S4. SEM captures of the ITO glass with the Prussian blue coating after preconditioning. SEM images of the cathode surface; A. top: interface of glass, ITO and Prussian blue (PB) corresponding to the squared area of the left photograph of the full device. B. bottom: interface of the layers of ITO and overlying Prussian bue (center) and images in different magnification of the 2 areas (left 50 kX, right 150 kX): Prussian blue (1, 2) and ITO (3, 4).
S5
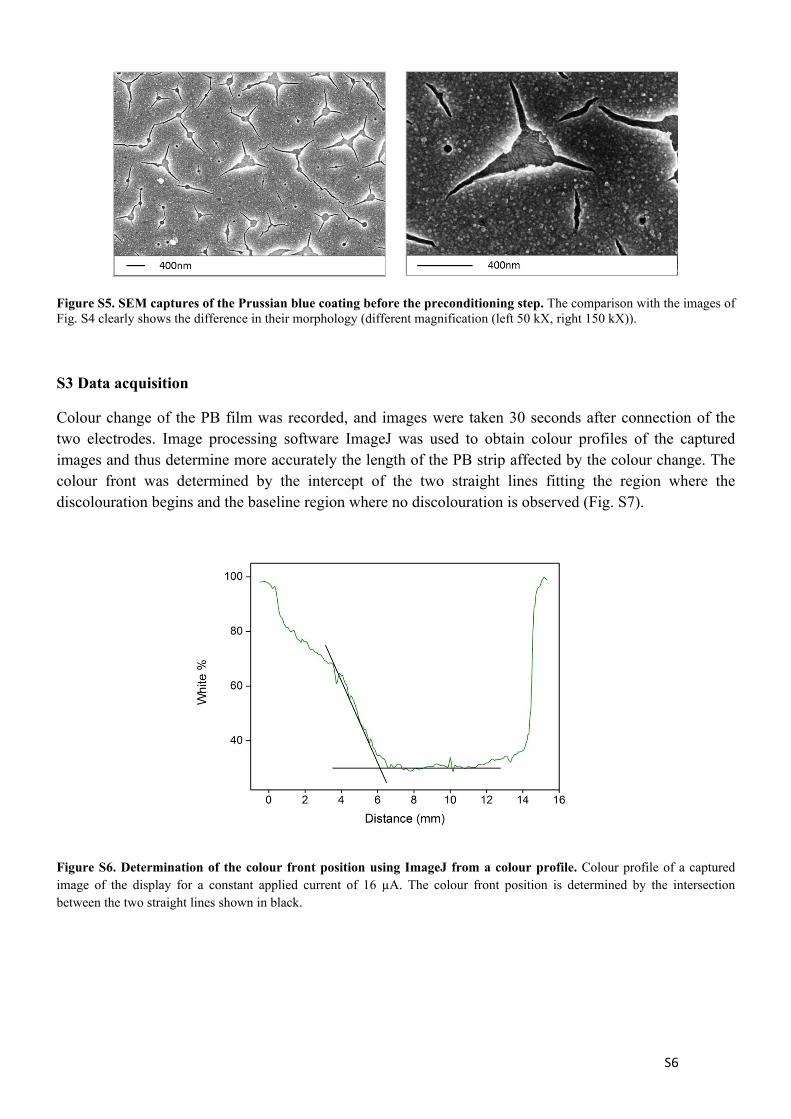
Figure S5. SEM captures of the Prussian blue coating before the preconditioning step. The comparison with the images of Fig. S4 clearly shows the difference in their morphology (different magnification (left 50 kX, right 150 kX)).
S3 Data acquisition
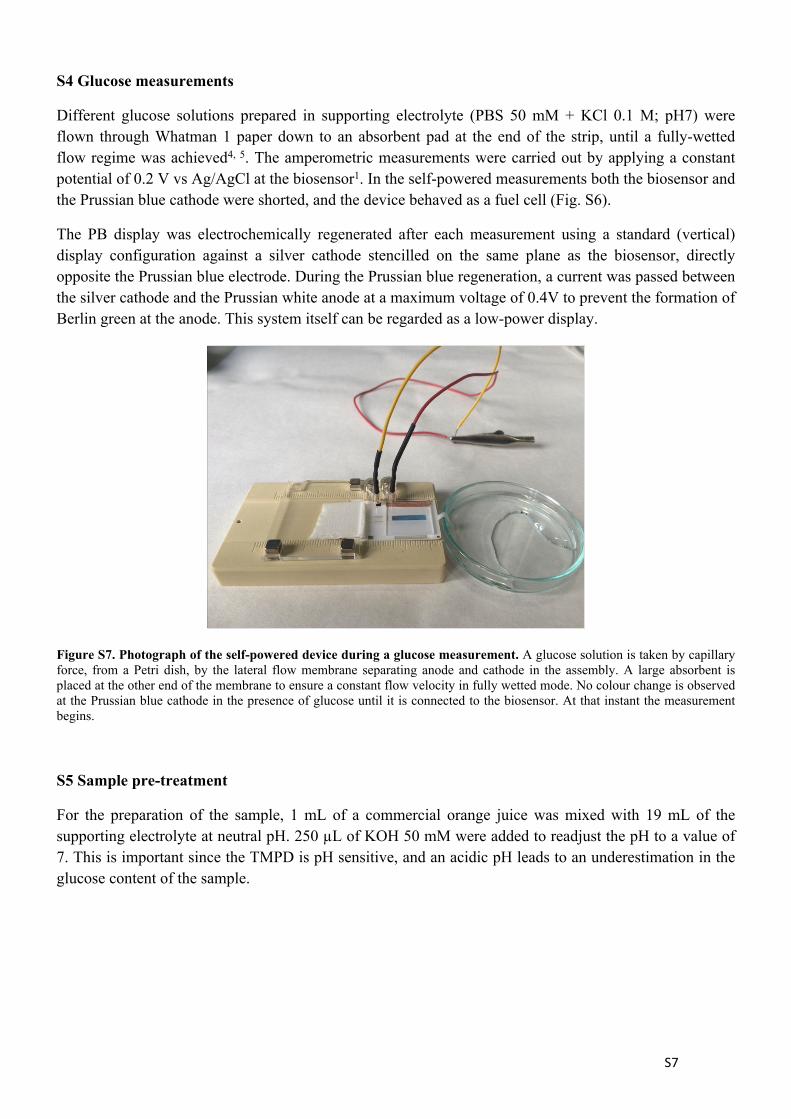
Colour change of the PB film was recorded, and images were taken 30 seconds after connection of the two electrodes. Image processing software ImageJ was used to obtain colour profiles of the captured images and thus determine more accurately the length of the PB strip affected by the colour change. The colour front was determined by the intercept of the two straight lines fitting the region where the discolouration begins and the baseline region where no discolouration is observed (Fig. S7).
Figure S6. Determination of the colour front position using ImageJ from a colour profile. Colour profile of a captured image of the display for a constant applied current of 16 µA. The colour front position is determined by the intersection between the two straight lines shown in black.
S6
S4 Glucose measurements
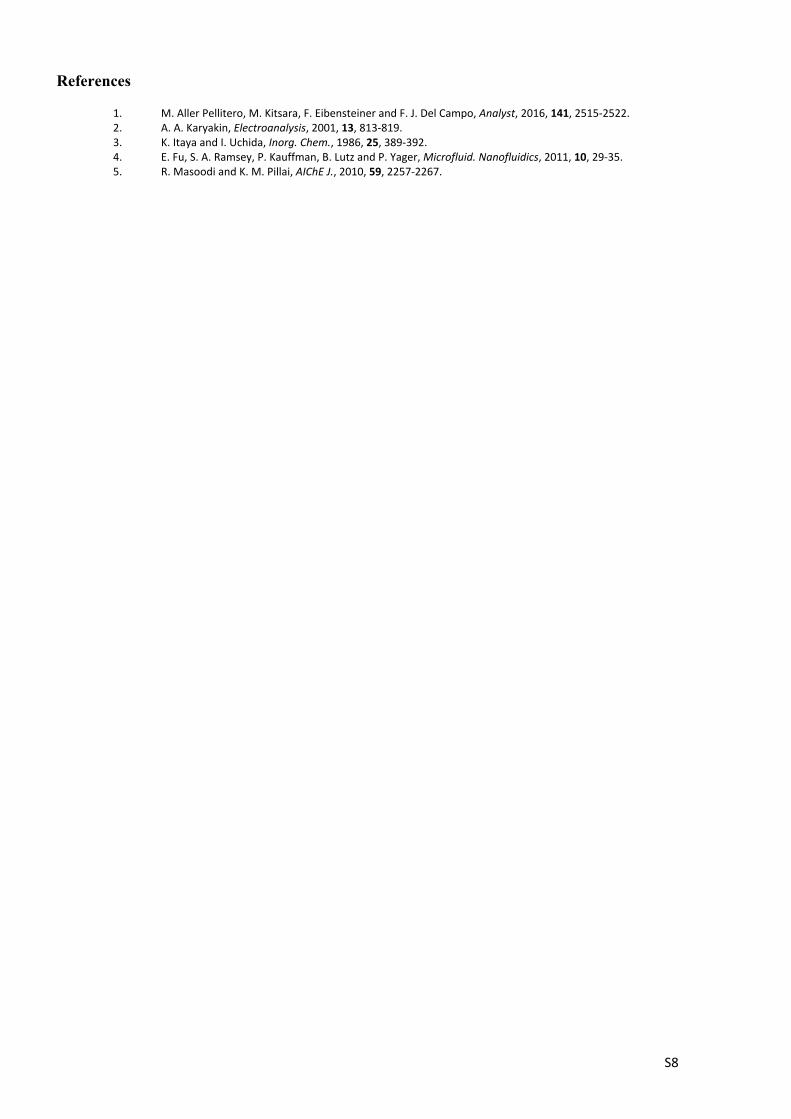
Different glucose solutions prepared in supporting electrolyte (PBS 50 mM + KCl 0.1 M; pH7) were flown through Whatman 1 paper down to an absorbent pad at the end of the strip, until a fully-wetted flow regime was achieved4, 5. The amperometric measurements were carried out by applying a constant potential of 0.2 V vs Ag/AgCl at the biosensor1. In the self-powered measurements both the biosensor and the Prussian blue cathode were shorted, and the device behaved as a fuel cell (Fig. S6).
The PB display was electrochemically regenerated after each measurement using a standard (vertical) display configuration against a silver cathode stencilled on the same plane as the biosensor, directly opposite the Prussian blue electrode. During the Prussian blue regeneration, a current was passed between the silver cathode and the Prussian white anode at a maximum voltage of 0.4V to prevent the formation of Berlin green at the anode. This system itself can be regarded as a low-power display.
Figure S7. Photograph of the self-powered device during a glucose measurement. A glucose solution is taken by capillary force, from a Petri dish, by the lateral flow membrane separating anode and cathode in the assembly. A large absorbent is placed at the other end of the membrane to ensure a constant flow velocity in fully wetted mode. No colour change is observed at the Prussian blue cathode in the presence of glucose until it is connected to the biosensor. At that instant the measurement begins.
S5 Sample pre-treatment
For the preparation of the sample, 1 mL of a commercial orange juice was mixed with 19 mL of the supporting electrolyte at neutral pH. 250 µL of KOH 50 mM were added to readjust the pH to a value of 7. This is important since the TMPD is pH sensitive, and an acidic pH leads to an underestimation in the glucose content of the sample.
S7
References
1. M. Aller Pellitero, M. Kitsara, F. Eibensteiner and F. J. Del Campo, Analyst, 2016, 141, 2515-2522.2. A. A. Karyakin, Electroanalysis, 2001, 13, 813-819.3. K. Itaya and I. Uchida, Inorg. Chem., 1986, 25, 389-392.4. E. Fu, S. A. Ramsey, P. Kauffman, B. Lutz and P. Yager, Microfluid. Nanofluidics, 2011, 10, 29-35.5. R. Masoodi and K. M. Pillai, AIChE J., 2010, 59, 2257-2267.
S8


![NPL REPORTeprintspublications.npl.co.uk/3928/1/DEPC_MPR62.pdfNPL Report DEPC-MPR-062 been used for condition monitoring of adhesive joints [19], using the metal adherends as the electrodes,](https://static.fdocuments.us/doc/165x107/5f67fa81031d581f0b24815e/npl-repor-npl-report-depc-mpr-062-been-used-for-condition-monitoring-of-adhesive.jpg)
