BLUE BOOK MARKET REPORT - PR Newswire · BLUE BOOK MARKET REPORT . April 2009 . An e-newsletter...
13
BLUE BOOK MARKET REPORT April 2009 An e-newsletter from Kelley Blue Book Public Relations MARKET ANALYSIS Focus on More Affordable Vehicles Continues Across Segments - Juan Flores, director of vehicle valuation, Kelley Blue Book General Observations In March 2009, Kelley Blue Book witnessed an overall uptick in the market of 0.5 percent and the continued stabilization of used-vehicle values in the wake of last year’s unprecedented market volatility. This increase was largely a continuation of prior trends, albeit at a more moderate pace, with 14 of Kelley Blue Book’s 20 market segments moving in the same direction as they did in February 2009 (see page 3). Crossovers and SUVs were this month’s winners, with value increases between 3-4 percent. Although the upward pressure on used-vehicle values, caused by falling supply, seems to be fading, any significant growth in consumer demand will renew that upward trend. Cars Overall, car values were relatively flat last month, with a small upward movement in most segments. Notable exceptions were subcompacts and hybrids (-1.8 percent and -0.9 percent, respectively), which face declining demand as fuel efficiency becomes less of a factor in the purchase decision. Additionally, sports cars dropped slightly by -1.3 percent, defying the typical seasonal uplift that normally takes place during the spring selling period. The most significant factor in the decline is the decreasing demand for an impractical third vehicle. Sports Cars The sports car segment is uncharacteristically down 1.3 percent as we enter the spring market. However, there are some exceptions. Traditional sports cars including the Ford Mustang, Dodge Charger, and Mazda Miata are performing well relative to the rest of the segment. Luxury sports cars underperformed the market with BMW and Porsche models dropping sharply (5 percent and 4.7 percent, respectively), demonstrating a lack of demand for high-end, expensive sports cars. Kelley Blue Book expects this shift to more affordable alternatives to continue as buyers re-examine their budgets and the necessity for such vehicles. Luxury In the luxury segment, many Japanese models such as the Infiniti M35 and G35 have outperformed their more expensive European competitors. As economic uncertainty remains, we expect a continued shift toward smaller, more affordable cars. For example, consumers may go from a BMW 5-Series to a 3-Series, or out of the luxury segment altogether to keep costs to a minimum. Continued on Page 2. In this issue : MARKET ANALYSIS - Focus on More Affordable Vehicles Continues Across Segments - Juan Flores, director, vehicle valuation for Kelley Blue Book and kbb.com RESIDUAL REPORT - Industry Reaching Normalcy, Hybrids and Compact Trucks Report Better than Average - Eric Ibara, director, market valuation for Kelley Blue Book and kbb.com MARKET WATCH - New- Car Shopper Activity MARKET INTELLIGENCE - April 2009 Survey Re- sults Kelley Blue Book Public Relations Contacts: ROBYN ECKARD Director, Public Relations 949.268.3049 [email protected] JOANNA MCNALLY Senior Public Relations Manager 949.268.3079 [email protected] BRENNA ROBINSON Public Relations Manager 949.267.4781 1
Transcript of BLUE BOOK MARKET REPORT - PR Newswire · BLUE BOOK MARKET REPORT . April 2009 . An e-newsletter...

BLUE BOOK MARKET REPORT April 2009
An e-newsletter from Kelley Blue Book Public Relations
MARKET ANALYSIS Focus on More Affordable Vehicles Continues Across Segments - Juan Flores, director of vehicle valuation, Kelley Blue Book
General Observations
In March 2009, Kelley Blue Book witnessed an overall uptick in the market of 0.5 percent and the continued stabilization of used-vehicle values in the wake of last year’s unprecedented market volatility. This increase was largely a continuation of prior trends, albeit at a more moderate pace, with 14 of Kelley Blue Book’s 20 market segments moving in the same direction as they did in February 2009 (see page 3). Crossovers and SUVs were this month’s winners, with value increases between 3-4 percent. Although the upward pressure on used-vehicle values, caused by falling supply, seems to be fading, any significant growth in consumer demand will renew that upward trend.
Cars
Overall, car values were relatively flat last month, with a small upward movement in most segments. Notable exceptions were subcompacts and hybrids (-1.8 percent and -0.9 percent, respectively), which face declining demand as fuel efficiency becomes less of a factor in the purchase decision. Additionally, sports cars dropped slightly by -1.3 percent, defying the typical seasonal uplift that normally takes place during the spring selling period. The most significant factor in the decline is the decreasing demand for an impractical third vehicle.
Sports Cars The sports car segment is uncharacteristically down 1.3 percent as we enter the spring market. However, there are some exceptions. Traditional sports cars including the Ford Mustang, Dodge Charger, and Mazda Miata are performing well relative to the rest of the segment. Luxury sports cars underperformed the market with BMW and Porsche models dropping sharply (5 percent and 4.7 percent, respectively), demonstrating a lack of demand for high-end, expensive sports cars. Kelley Blue Book expects this shift to more affordable alternatives to continue as buyers re-examine their budgets and the necessity for such vehicles.
Luxury In the luxury segment, many Japanese models such as the Infiniti M35 and G35 have outperformed their more expensive European competitors. As economic uncertainty remains, we expect a continued shift toward smaller, more affordable cars. For example, consumers may go from a BMW 5-Series to a 3-Series, or out of the luxury segment altogether to keep costs to a minimum. Continued on Page 2.
In this issue :
MARKET ANALYSIS - Focus on More Affordable Vehicles Continues Across Segments - Juan Flores, director, vehicle valuation for Kelley Blue Book and kbb.com
RESIDUAL REPORT - Industry Reaching Normalcy, Hybrids and Compact Trucks Report Better than Average - Eric Ibara, director, market valuation for Kelley Blue Book and kbb.com
MARKET WATCH - New-Car Shopper Activity
MARKET INTELLIGENCE - April 2009 Survey Re-sults
Kelley Blue Book Public Relations Contacts:
ROBYN ECKARD Director, Public Relations 949.268.3049 [email protected]
JOANNA MCNALLY Senior Public Relations Manager 949.268.3079 [email protected]
BRENNA ROBINSON Public Relations Manager 949.267.4781
1

MARKET ANALYSIS CONTINUED
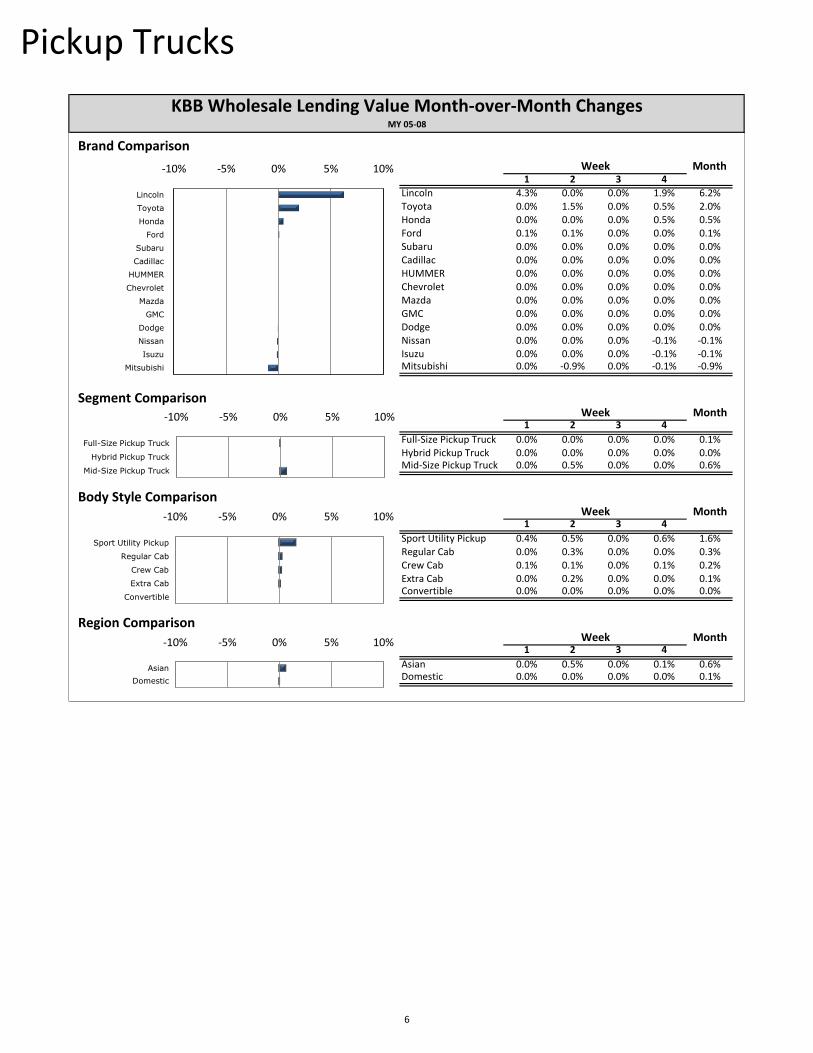
Trucks
Pickups The performance of the pickup truck segments exemplifies the growing stability in the overall market. Full-size trucks were mostly flat, while mid-size trucks saw only incremental gains for the month. One factor helping to stabilize the segment is a lower volume of cars available at auction, which is offsetting the reduction in commercial demand, which stemmed from the decline in housing starts. Reduced demand coupled with an equal reduction in supply will continue to keep values relatively flat in this segment for the foreseeable future.
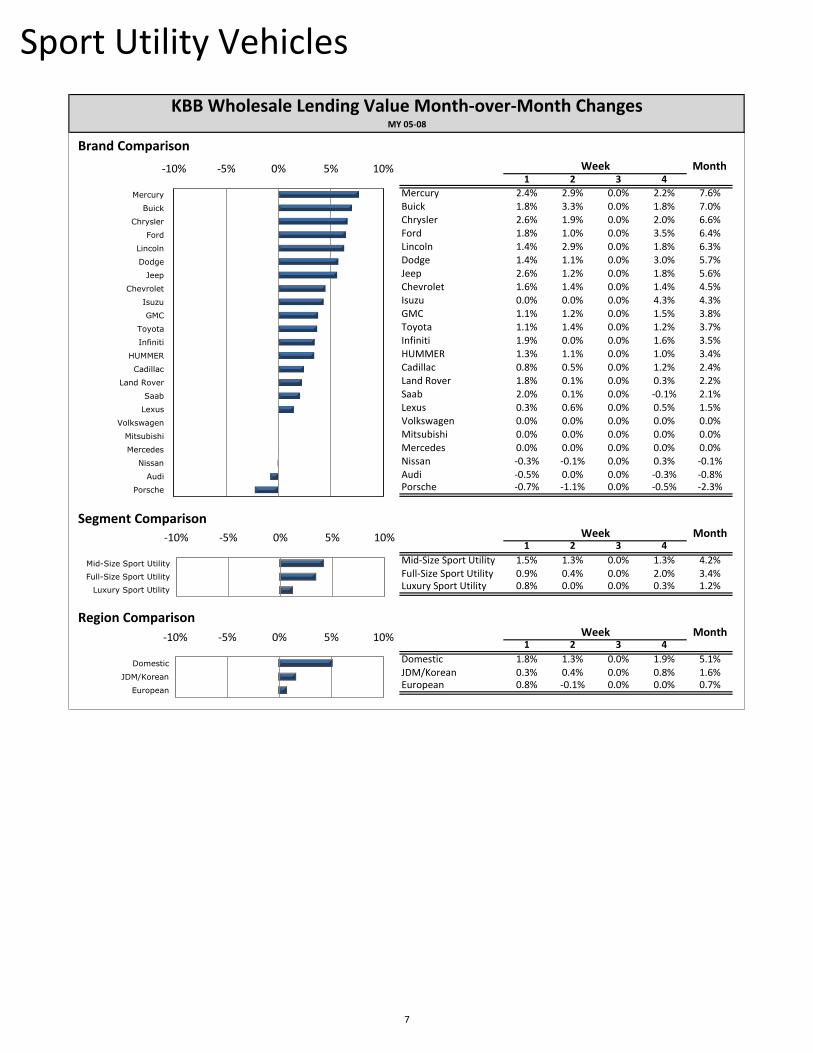
SUVs The positive trend in SUV values continues (3.4 percent), as consumer preference for the vehicles im-proves; partially reversing last year’s massive drops. While still lower than the gains realized in February 2009, these results show that the market for these vehicles has not yet reached equilibrium and may have some room to appreciate. The gains seen in the SUV segment were led by the Chevrolet Trailblazer, which outperformed the competition. The Trailblazer has been appreciating since the beginning of this year, rebounding from the heavy depreciation of 2008. Values in the SUV segment have been strengthened by an increase in demand, attributable to the current affordability of gasoline and reduced supply at auction. We expect values to stabilize in the near future as demand meets supply.
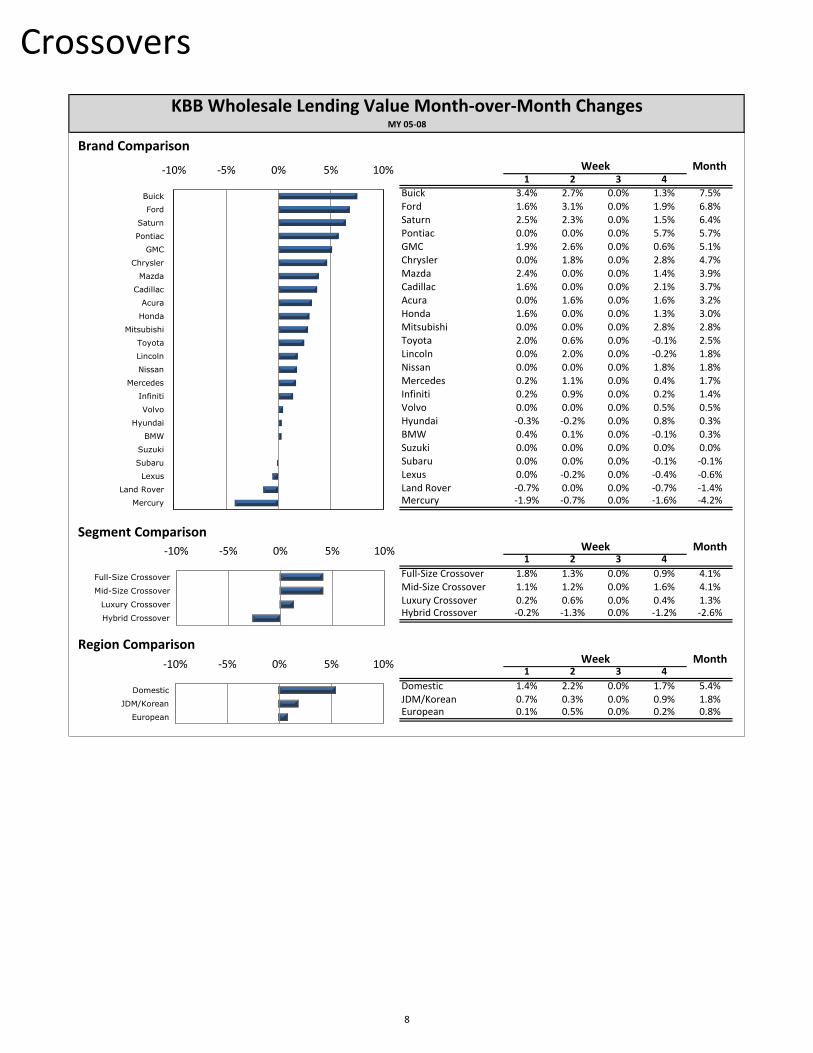
Crossovers Most crossover segments improved last month (1.3 - 4.1 percent), although hybrid crossovers incurred the most depreciation of any segment (2.6 percent). Values in the crossover segment have been strengthened by a number of factors, including vehicle utility, affordability, and a reduced supply at auction. The gains in the crossover segment were led by the Ford Edge and Nissan Rogue. The Edge has appreciated since the beginning of this year, rebounding from heavy depreciation in 2008. The Nissan Rogue, a compact crossover, has gained on segment leaders (Honda CR-V and Toyota RAV4), due to lower transaction prices for a relatively new model. Although values in the crossover segment have been on the rise, the overall equilibrium values are expected to remain near 2008 levels. This commentary focuses on Model Years 2005-2008.
2

Segment Overview
1 2 3 4
Mid-Size Sport Utility 1.5% 1.3% 0.0% 1.3% 4.2%
Full-Size Crossover 1.8% 1.3% 0.0% 0.9% 4.1%
Mid-Size Crossover 1.1% 1.2% 0.0% 1.6% 4.1%
Compact Crossover 1.1% 1.2% 0.0% 1.4% 3.8%
Full-Size Sport Utility 0.9% 0.4% 0.0% 2.0% 3.4%
Van -0.4% 0.0% 0.0% 1.9% 1.5%
Full-Size Car 0.6% 0.9% 0.0% -0.2% 1.3%
Luxury Crossover 0.2% 0.6% 0.0% 0.4% 1.3%
Luxury Sport Utility 0.8% 0.0% 0.0% 0.3% 1.2%
Mid-Size Pickup Truck 0.0% 0.5% 0.0% 0.0% 0.6%
Luxury Car 0.4% 0.2% 0.0% -0.3% 0.3%
Mid-Size Car 0.5% 0.0% 0.0% -0.1% 0.3%
Full-Size Pickup Truck 0.0% 0.0% 0.0% 0.0% 0.1%
Hybrid Pickup Truck 0.0% 0.0% 0.0% 0.0% 0.0%
Minivan -0.1% -0.5% 0.0% 0.0% -0.7%
Compact Car -0.2% -0.5% 0.0% -0.1% -0.8%
Hybrid Car -0.2% -0.6% 0.0% -0.2% -0.9%
Sports Car -0.2% -0.4% 0.0% -0.7% -1.3%
Subcompact Car -0.5% -1.2% 0.0% -0.2% -1.8%
Hybrid Crossover -0.2% -1.3% 0.0% -1.2% -2.6%
KBB Wholesale Lending Value Month-over-Month ChangesMY 05-08
Week March
Change
-3% -2% -1% 0% 1% 2% 3% 4% 5%
Mid-Size Sport Utility
Full-Size Crossover
Mid-Size Crossover
Compact Crossover
Full-Size Sport Utility
Van
Full-Size Car
Luxury Crossover
Luxury Sport Utility
Mid-Size Pickup Truck
Luxury Car
Mid-Size Car
Full-Size Pickup Truck
Hybrid Pickup Truck
Minivan
Compact Car
Hybrid Car
Sports Car
Subcompact Car
Hybrid Crossover
3

Cars Overview
Brand Comparison
1 2 3 4
Infiniti 1.5% 0.5% 0.0% 1.2% 3.3%Buick 1.3% 1.4% 0.0% -0.1% 2.6%Ford 0.9% 0.4% 0.0% 0.8% 2.1%Jaguar 0.6% 0.6% 0.0% 0.8% 2.0%Mercury 1.6% 0.0% 0.0% 0.3% 1.9%Scion 0.7% 0.7% 0.0% 0.3% 1.8%Pontiac 1.4% 0.6% 0.0% -0.3% 1.7%Dodge 0.4% 1.4% 0.0% -0.3% 1.5%Cadillac 0.6% 1.9% 0.0% -1.1% 1.3%Lincoln 0.2% 0.4% 0.0% 0.6% 1.2%Acura 0.0% 0.8% 0.0% 0.2% 1.0%Mazda 0.9% -0.3% 0.0% 0.1% 0.7%Subaru 0.1% 0.1% 0.0% 0.2% 0.5%Toyota 0.4% -0.2% 0.0% 0.1% 0.2%Lexus -0.1% 0.2% 0.0% 0.0% 0.2%Nissan -0.1% -0.2% 0.0% 0.0% -0.3%Audi 0.0% 0.0% 0.0% -0.2% -0.3%Volvo -0.1% -0.1% 0.0% -0.2% -0.3%Saab -0.4% 0.0% 0.0% -0.2% -0.6%Mitsubishi -0.2% -0.2% 0.0% -0.4% -0.7%Honda -0.2% -0.7% 0.0% 0.0% -0.9%Mercedes 0.1% -0.6% 0.0% -0.5% -1.0%Volkswagen -0.3% -0.5% 0.0% -0.2% -1.0%Chrysler -0.3% 0.0% 0.0% -0.7% -1.0%Saturn -0.3% -0.5% 0.0% -0.3% -1.1%Hyundai -0.2% -0.5% 0.0% -0.5% -1.2%Chevrolet -0.6% -0.3% 0.0% -0.6% -1.6%MINI -0.4% -1.8% 0.0% -0.1% -2.3%BMW 0.8% -0.1% 0.0% -3.1% -2.3%Kia -1.0% -0.9% 0.0% -0.6% -2.4%Suzuki -0.4% -2.5% 0.0% 0.1% -2.8%Porsche -2.4% -2.0% 0.0% -0.3% -4.7%
Segment ComparisonMonth
1 2 3 4
Full-Size Car 0.6% 0.9% 0.0% -0.2% 1.3%Luxury Car 0.4% 0.2% 0.0% -0.3% 0.3%Mid-Size Car 0.5% 0.0% 0.0% -0.1% 0.3%Compact Car -0.2% -0.5% 0.0% -0.1% -0.8%Hybrid Car -0.2% -0.6% 0.0% -0.2% -0.9%Sports Car -0.2% -0.4% 0.0% -0.7% -1.3%Subcompact Car -0.5% -1.2% 0.0% -0.2% -1.8%
KBB Wholesale Lending Value Month-over-Month ChangesMY 05-08
Week Month
Week-10% -5% 0% 5% 10%
Full-Size Car
Luxury Car
Mid-Size Car
Compact Car
Hybrid Car
Sports Car
Subcompact Car
-10% -5% 0% 5% 10%
Infiniti
Buick
Ford
Jaguar
Mercury
Scion
Pontiac
Dodge
Cadillac
Lincoln
Acura
Mazda
Subaru
Toyota
Lexus
Nissan
Audi
Volvo
Saab
Mitsubishi
Honda
Mercedes
Volkswagen
Chrysler
Saturn
Hyundai
Chevrolet
MINI
BMW
Kia
Suzuki
Porsche
4

Trucks Overview
Brand Comparison
1 2 3 4
Lincoln 1.9% 2.0% 0.0% 1.5% 5.5%Jeep 2.2% 1.0% 0.0% 1.9% 5.3%Buick 1.5% 1.5% 0.0% 0.7% 3.9%Kia 0.5% 0.7% 0.0% 2.0% 3.2%Acura 0.0% 1.6% 0.0% 1.6% 3.2%Mercury 1.4% 1.0% 0.0% 0.4% 2.9%HUMMER 1.0% 0.9% 0.0% 0.7% 2.6%Pontiac 0.8% 0.9% 0.0% 0.7% 2.5%Toyota 0.7% 1.2% 0.0% 0.5% 2.4%Subaru 0.0% 1.2% 0.0% 1.1% 2.3%Cadillac 0.8% 0.3% 0.0% 1.1% 2.2%Saab 2.0% 0.1% 0.0% -0.1% 2.1%Infiniti 0.7% 0.7% 0.0% 0.6% 2.0%Saturn 1.3% 0.2% 0.0% 0.3% 1.9%Ford 0.5% 0.4% 0.0% 0.9% 1.9%Land Rover 1.5% 0.1% 0.0% 0.2% 1.8%Mazda 1.1% 0.1% 0.0% 0.4% 1.8%Chrysler -0.6% 0.8% 0.0% 1.2% 1.4%Suzuki 0.0% 1.4% 0.0% 0.0% 1.4%Mitsubishi 0.0% -0.3% 0.0% 1.5% 1.3%Mercedes 0.1% 0.8% 0.0% 0.3% 1.2%Isuzu 0.0% 0.0% 0.0% 1.1% 1.1%GMC 0.3% 0.3% 0.0% 0.5% 1.1%Chevrolet 0.3% 0.3% 0.0% 0.4% 1.0%Honda 0.1% 0.1% 0.0% 0.8% 0.9%Dodge 0.1% 0.1% 0.0% 0.3% 0.5%Volvo 0.0% 0.0% 0.0% 0.5% 0.5%Lexus 0.1% 0.2% 0.0% 0.1% 0.5%BMW 0.4% 0.1% 0.0% -0.1% 0.3%Nissan 0.0% 0.0% 0.0% 0.1% 0.1%Hyundai -0.5% -0.5% 0.0% 1.1% 0.0%Volkswagen 0.0% 0.0% 0.0% 0.0% 0.0%Audi -0.5% 0.0% 0.0% -0.3% -0.8%Porsche -0.7% -1.1% 0.0% -0.5% -2.3%
Segment ComparisonMonth
1 2 3 4
Mid-Size Sport Utility 1.5% 1.3% 0.0% 1.3% 4.2%Full-Size Crossover 1.8% 1.3% 0.0% 0.9% 4.1%Mid-Size Crossover 1.1% 1.2% 0.0% 1.6% 4.1%Compact Crossover 1.1% 1.2% 0.0% 1.4% 3.8%Full-Size Sport Utility 0.9% 0.4% 0.0% 2.0% 3.4%Van -0.4% 0.0% 0.0% 1.9% 1.5%Luxury Crossover 0.2% 0.6% 0.0% 0.4% 1.3%Luxury Sport Utility 0.8% 0.0% 0.0% 0.3% 1.2%Mid-Size Pickup Truck 0.0% 0.5% 0.0% 0.0% 0.6%Full-Size Pickup Truck 0.0% 0.0% 0.0% 0.0% 0.1%Hybrid Pickup Truck 0.0% 0.0% 0.0% 0.0% 0.0%Minivan -0.1% -0.5% 0.0% 0.0% -0.7%Hybrid Crossover -0.2% -1.3% 0.0% -1.2% -2.6%
KBB Wholesale Lending Value Month-over-Month ChangesMY 05-08
Week Month
Week-10% -5% 0% 5% 10%
Mid-Size Sport Utility
Full-Size Crossover
Mid-Size Crossover
Compact Crossover
Full-Size Sport Utility
Van
Luxury Crossover
Luxury Sport Utility
Mid-Size Pickup Truck
Full-Size Pickup Truck
Hybrid Pickup Truck
Minivan
Hybrid Crossover
-10% -5% 0% 5% 10%
Lincoln
Jeep
Buick
Kia
Acura
Mercury
HUMMER
Pontiac
Toyota
Subaru
Cadillac
Saab
Infiniti
Saturn
Ford
Land Rover
Mazda
Chrysler
Suzuki
Mitsubishi
Mercedes
Isuzu
GMC
Chevrolet
Honda
Dodge
Volvo
Lexus
BMW
Nissan
Hyundai
Volkswagen
Audi
Porsche
5
Pickup Trucks
Brand Comparison
1 2 3 4
Lincoln 4.3% 0.0% 0.0% 1.9% 6.2%Toyota 0.0% 1.5% 0.0% 0.5% 2.0%Honda 0.0% 0.0% 0.0% 0.5% 0.5%Ford 0.1% 0.1% 0.0% 0.0% 0.1%Subaru 0.0% 0.0% 0.0% 0.0% 0.0%Cadillac 0.0% 0.0% 0.0% 0.0% 0.0%HUMMER 0.0% 0.0% 0.0% 0.0% 0.0%Chevrolet 0.0% 0.0% 0.0% 0.0% 0.0%Mazda 0.0% 0.0% 0.0% 0.0% 0.0%GMC 0.0% 0.0% 0.0% 0.0% 0.0%Dodge 0.0% 0.0% 0.0% 0.0% 0.0%Nissan 0.0% 0.0% 0.0% -0.1% -0.1%Isuzu 0.0% 0.0% 0.0% -0.1% -0.1%Mitsubishi 0.0% -0.9% 0.0% -0.1% -0.9%
Segment ComparisonMonth
1 2 3 4
Full-Size Pickup Truck 0.0% 0.0% 0.0% 0.0% 0.1%Hybrid Pickup Truck 0.0% 0.0% 0.0% 0.0% 0.0%Mid-Size Pickup Truck 0.0% 0.5% 0.0% 0.0% 0.6%
Body Style ComparisonMonth
1 2 3 4
Sport Utility Pickup 0.4% 0.5% 0.0% 0.6% 1.6%Regular Cab 0.0% 0.3% 0.0% 0.0% 0.3%Crew Cab 0.1% 0.1% 0.0% 0.1% 0.2%Extra Cab 0.0% 0.2% 0.0% 0.0% 0.1%Convertible 0.0% 0.0% 0.0% 0.0% 0.0%
Region ComparisonMonth
1 2 3 4
Asian 0.0% 0.5% 0.0% 0.1% 0.6%Domestic 0.0% 0.0% 0.0% 0.0% 0.1%
Week
KBB Wholesale Lending Value Month-over-Month ChangesMY 05-08
Week Month
Week
Week
-10% -5% 0% 5% 10%
Full-Size Pickup Truck
Hybrid Pickup Truck
Mid-Size Pickup Truck
-10% -5% 0% 5% 10%
Lincoln
Toyota
Honda
Ford
Subaru
Cadillac
HUMMER
Chevrolet
Mazda
GMC
Dodge
Nissan
Isuzu
Mitsubishi
-10% -5% 0% 5% 10%
Sport Utility Pickup
Regular Cab
Crew Cab
Extra Cab
Convertible
-10% -5% 0% 5% 10%
Asian
Domestic
6
Sport Utility Vehicles
Brand Comparison
1 2 3 4
Mercury 2.4% 2.9% 0.0% 2.2% 7.6%Buick 1.8% 3.3% 0.0% 1.8% 7.0%Chrysler 2.6% 1.9% 0.0% 2.0% 6.6%Ford 1.8% 1.0% 0.0% 3.5% 6.4%Lincoln 1.4% 2.9% 0.0% 1.8% 6.3%Dodge 1.4% 1.1% 0.0% 3.0% 5.7%Jeep 2.6% 1.2% 0.0% 1.8% 5.6%Chevrolet 1.6% 1.4% 0.0% 1.4% 4.5%Isuzu 0.0% 0.0% 0.0% 4.3% 4.3%GMC 1.1% 1.2% 0.0% 1.5% 3.8%Toyota 1.1% 1.4% 0.0% 1.2% 3.7%Infiniti 1.9% 0.0% 0.0% 1.6% 3.5%HUMMER 1.3% 1.1% 0.0% 1.0% 3.4%Cadillac 0.8% 0.5% 0.0% 1.2% 2.4%Land Rover 1.8% 0.1% 0.0% 0.3% 2.2%Saab 2.0% 0.1% 0.0% -0.1% 2.1%Lexus 0.3% 0.6% 0.0% 0.5% 1.5%Volkswagen 0.0% 0.0% 0.0% 0.0% 0.0%Mitsubishi 0.0% 0.0% 0.0% 0.0% 0.0%Mercedes 0.0% 0.0% 0.0% 0.0% 0.0%Nissan -0.3% -0.1% 0.0% 0.3% -0.1%Audi -0.5% 0.0% 0.0% -0.3% -0.8%Porsche -0.7% -1.1% 0.0% -0.5% -2.3%
Segment ComparisonMonth
1 2 3 4
Mid-Size Sport Utility 1.5% 1.3% 0.0% 1.3% 4.2%Full-Size Sport Utility 0.9% 0.4% 0.0% 2.0% 3.4%Luxury Sport Utility 0.8% 0.0% 0.0% 0.3% 1.2%
Region ComparisonMonth
1 2 3 4
Domestic 1.8% 1.3% 0.0% 1.9% 5.1%JDM/Korean 0.3% 0.4% 0.0% 0.8% 1.6%European 0.8% -0.1% 0.0% 0.0% 0.7%
Week
KBB Wholesale Lending Value Month-over-Month ChangesMY 05-08
Week Month
Week-10% -5% 0% 5% 10%
Mid-Size Sport Utility
Full-Size Sport Utility
Luxury Sport Utility
-10% -5% 0% 5% 10%
Mercury
Buick
Chrysler
Ford
Lincoln
Dodge
Jeep
Chevrolet
Isuzu
GMC
Toyota
Infiniti
HUMMER
Cadillac
Land Rover
Saab
Lexus
Volkswagen
Mitsubishi
Mercedes
Nissan
Audi
Porsche
-10% -5% 0% 5% 10%
Domestic
JDM/Korean
European
7
Crossovers
Brand Comparison
1 2 3 4
Buick 3.4% 2.7% 0.0% 1.3% 7.5%Ford 1.6% 3.1% 0.0% 1.9% 6.8%Saturn 2.5% 2.3% 0.0% 1.5% 6.4%Pontiac 0.0% 0.0% 0.0% 5.7% 5.7%GMC 1.9% 2.6% 0.0% 0.6% 5.1%Chrysler 0.0% 1.8% 0.0% 2.8% 4.7%Mazda 2.4% 0.0% 0.0% 1.4% 3.9%Cadillac 1.6% 0.0% 0.0% 2.1% 3.7%Acura 0.0% 1.6% 0.0% 1.6% 3.2%Honda 1.6% 0.0% 0.0% 1.3% 3.0%Mitsubishi 0.0% 0.0% 0.0% 2.8% 2.8%Toyota 2.0% 0.6% 0.0% -0.1% 2.5%Lincoln 0.0% 2.0% 0.0% -0.2% 1.8%Nissan 0.0% 0.0% 0.0% 1.8% 1.8%Mercedes 0.2% 1.1% 0.0% 0.4% 1.7%Infiniti 0.2% 0.9% 0.0% 0.2% 1.4%Volvo 0.0% 0.0% 0.0% 0.5% 0.5%Hyundai -0.3% -0.2% 0.0% 0.8% 0.3%BMW 0.4% 0.1% 0.0% -0.1% 0.3%Suzuki 0.0% 0.0% 0.0% 0.0% 0.0%Subaru 0.0% 0.0% 0.0% -0.1% -0.1%Lexus 0.0% -0.2% 0.0% -0.4% -0.6%Land Rover -0.7% 0.0% 0.0% -0.7% -1.4%Mercury -1.9% -0.7% 0.0% -1.6% -4.2%
Segment ComparisonMonth
1 2 3 4
Full-Size Crossover 1.8% 1.3% 0.0% 0.9% 4.1%Mid-Size Crossover 1.1% 1.2% 0.0% 1.6% 4.1%Luxury Crossover 0.2% 0.6% 0.0% 0.4% 1.3%Hybrid Crossover -0.2% -1.3% 0.0% -1.2% -2.6%
Region ComparisonMonth
1 2 3 4
Domestic 1.4% 2.2% 0.0% 1.7% 5.4%JDM/Korean 0.7% 0.3% 0.0% 0.9% 1.8%European 0.1% 0.5% 0.0% 0.2% 0.8%
Week
KBB Wholesale Lending Value Month-over-Month ChangesMY 05-08
Week Month
Week-10% -5% 0% 5% 10%
Full-Size Crossover
Mid-Size Crossover
Luxury Crossover
Hybrid Crossover
-10% -5% 0% 5% 10%
Buick
Ford
Saturn
Pontiac
GMC
Chrysler
Mazda
Cadillac
Acura
Honda
Mitsubishi
Toyota
Lincoln
Nissan
Mercedes
Infiniti
Volvo
Hyundai
BMW
Suzuki
Subaru
Lexus
Land Rover
Mercury
-10% -5% 0% 5% 10%
Domestic
JDM/Korean
European
8

All percentages are for the 60-month term and are expressed with the vehicle’s MSRP as the base.
RESIDUAL REPORT Industry Reaching Normalcy, Hybrids and Compact Trucks Report Better than Average - Eric Ibara, director of residual valuation consulting, Kelley Blue Book
Consistent with the trend noted in February 2009, residual value forecasts for the next five years are stabilizing. The market is no longer experiencing the wild swings witnessed in 2008. Instead, Kelley Blue Book is forecasting 60-month residual values that, on average across all models, are down about five percentage points (based on each vehicle’s MSRP) from a year ago, compared with a year-over-year decline of six percentage points recorded in February of this year.
As an example, two segments that were at opposite ends of the gyration last year experienced the same year-over-year change. The average change in 60-month residual values for the compact sedan segment and full-size truck segment declined 4.9 percent, just under the overall industry average change. Most other segments also experienced average declines ranging from 4 to 6 percent.
Segments that continue to exhibit better than average year-over-year depreciation include hybrid cars and compact trucks, which experienced drops of 1.5 and 1.6 percentage points, respectively. While hybrids benefited from extraordinary gains last year due to high gas prices, Kelley Blue Book did not increase their residual values commensurately as it was felt that the high prices were transitory. On the other hand, compact trucks did not fall as precipitously as their full-size counterparts. Continued on Page 10.
9

Market Watch® Below are the results from Kelley Blue Book Market Watch®, measuring new-car shopper activity on kbb.com.
While the automotive industry has reported its sixth straight month of greater than 30 percent decline in sales, new-car shopper activity on kbb.com was up 10 percent (versus February 2009). Among the Big Three auto manufacturers, Chrysler brands remained flat month-over-month and dropped 19 percent year-over-year. Ford brands jumped up 13 percent compared to the previous month and only experienced an 8 percent decrease compared to March 2008. GM brands saw a 5 percent increase this month (versus February 2009) with a 28 percent drop from this time last year.
March '09 10% -26%(M/M) (Y/Y)
An interesting note is that SUVs and crossovers (distinguished by their uni-body construction, from the traditional body-on-frame SUV), on average, are being affected in similar ways. The year-over-year decline for SUVs was 5.9 percent, while crossovers fell an almost identical 6.1 percent. The vehicles that continue to suffer the most in year-over-year change are in the full-size car segment. These vehicles, on average, posted a 9.8 percent drop, led by the Dodge Charger, Chrysler 300C, Volvo S80 and the Pontiac G8.
RESIDUAL REPORT CONTINUED
10
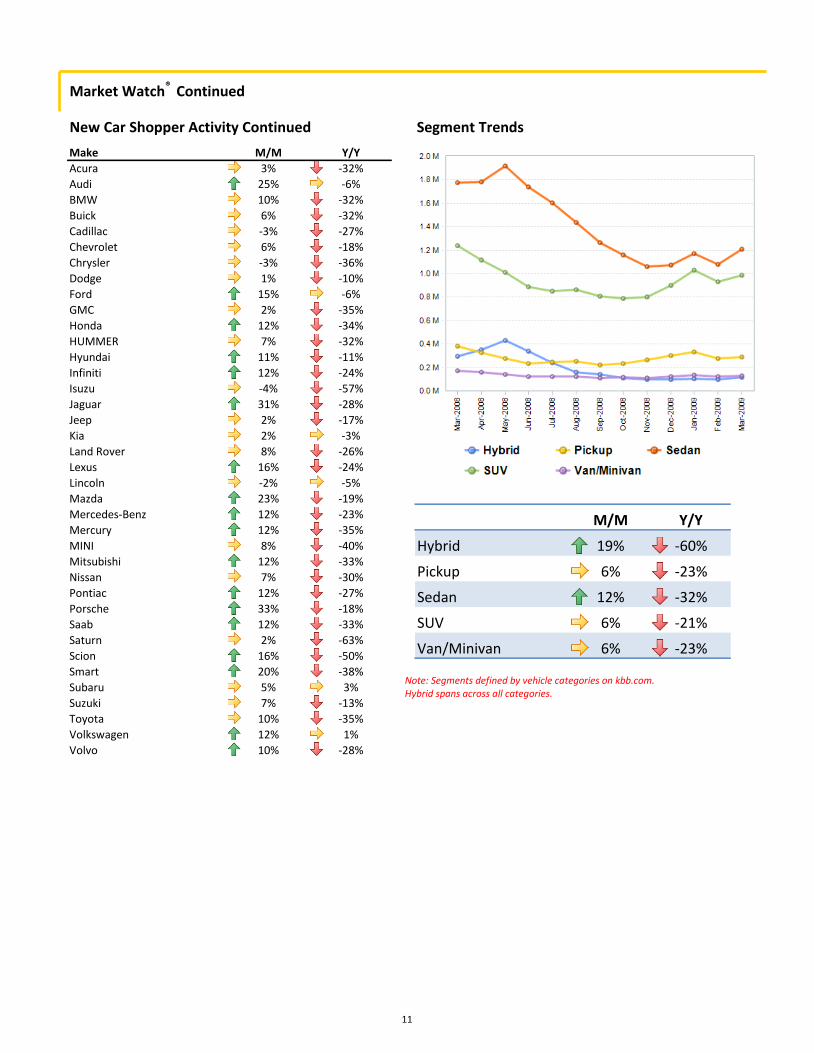
Segment Trends New Car Shopper Activity Continued
Market Watch® Continued
Make M/M Y/Y
Acura 3% -32%
Audi 25% -6%
BMW 10% -32%
Buick 6% -32%
Cadillac -3% -27%
Chevrolet 6% -18%
Chrysler -3% -36%
Dodge 1% -10%
Ford 15% -6%
GMC 2% -35%
Honda 12% -34%
HUMMER 7% -32%
Hyundai 11% -11%
Infiniti 12% -24%
Isuzu -4% -57%
Jaguar 31% -28%
Jeep 2% -17%
Kia 2% -3%
Land Rover 8% -26%
Lexus 16% -24%
Lincoln -2% -5%
Mazda 23% -19%
Mercedes-Benz 12% -23%
Mercury 12% -35%
MINI 8% -40%
Mitsubishi 12% -33%
Nissan 7% -30%
Pontiac 12% -27%
Porsche 33% -18%
Saab 12% -33%
Saturn 2% -63%
Scion 16% -50%
Smart 20% -38%
Subaru 5% 3%
Suzuki 7% -13%
Toyota 10% -35%
Volkswagen 12% 1%
Volvo 10% -28%
M/M Y/Y
Hybrid 19% -60%
Pickup 6% -23%
Sedan 12% -32%
SUV 6% -21%
Van/Minivan 6% -23%
Note: Segments defined by vehicle categories on kbb.com. Hybrid spans across all categories.
11

Manufacturer’s Incentive Plans
Consumers were shown unbranded descriptions of the top manufacturer’s incentive plans (GM Total Confidence plan, Ford Advantage plan, and Hyundai Assurance Plus plan) and were asked to rate their interest. Of the plans described, the new GM Total Confidence program had the highest interest.
Interest in Incentive Plans
Q: How interested are you in each of the plans above? (Please select one answer for each plan). Plans were labeled: Plan A, Plan B, and Plan C.
Market Intelligence - April 2009 Below are the results of a Kelley Blue Book Market Intelligence survey, which looks to obtain a comprehensive understanding of consumer attitudes and opinions of current market trends and current automotive news.
Note: Unbranded plans described to shoppers.
32%
37%
41%
0% 20% 40% 60% 80% 100%
Hyundai Assurance Plus
Ford Advantage Plan
GM Total Confidence
Interested
12
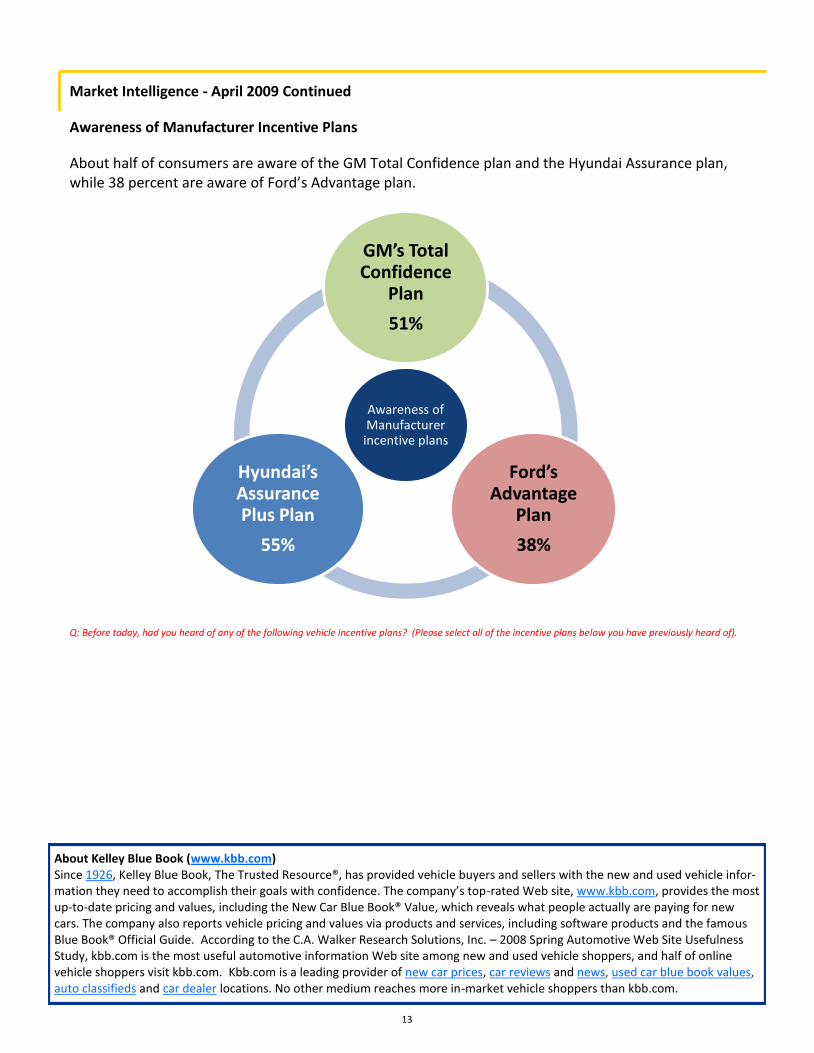
Market Intelligence - April 2009 Continued
Awareness of Manufacturer Incentive Plans
About half of consumers are aware of the GM Total Confidence plan and the Hyundai Assurance plan, while 38 percent are aware of Ford’s Advantage plan.
Awareness of Manufacturer incentive plans
GM’s Total Confidence
Plan
51%
Ford’s Advantage
Plan
38%
Hyundai’s Assurance Plus Plan
55%
Q: Before today, had you heard of any of the following vehicle incentive plans? (Please select all of the incentive plans below you have previously heard of).
About Kelley Blue Book (www.kbb.com) Since 1926, Kelley Blue Book, The Trusted Resource®, has provided vehicle buyers and sellers with the new and used vehicle infor-mation they need to accomplish their goals with confidence. The company’s top-rated Web site, www.kbb.com, provides the most up-to-date pricing and values, including the New Car Blue Book® Value, which reveals what people actually are paying for new cars. The company also reports vehicle pricing and values via products and services, including software products and the famous Blue Book® Official Guide. According to the C.A. Walker Research Solutions, Inc. – 2008 Spring Automotive Web Site Usefulness Study, kbb.com is the most useful automotive information Web site among new and used vehicle shoppers, and half of online vehicle shoppers visit kbb.com. Kbb.com is a leading provider of new car prices, car reviews and news, used car blue book values, auto classifieds and car dealer locations. No other medium reaches more in-market vehicle shoppers than kbb.com.
13