
bls_employnews_197808.pdf
17
News United States Department of Labor Bureau of Labor Statistics Washington, D.C. 20212 Contact: J. Bregger (202) (202) 523-1944 523-1371 (202) 523-1913 USDL 78-753 TRANSMISSION CF MATERIAL IN THIS RELEASE IS EMBARGOED UNTIL 9:00 A.M. (EOT) , FRIDAY, SEPTEMBER 1, 1978 K. Hoyle hone: 523-1208 333-1384 THE EMPLOYMENT SITUATION: AUGUST 1978 Employment rose slightly in August and unerployment declined, the Bureau of Labor Statistics of the U.S. Department of Labor reported today. The Nation's unemployment rate was 5.9 percent, down fran 6.2 percent in July. Total employment— as measured by the monthly survey of households— edged up by 160,000 over the month to 94.6 million, gaining back sane of the decline which had occurred in July. Prior to July, employment growth had been unusually strong. Nonfarm payroll employment— as measured by the monthly survey of establishments— rose by 115,000 in August to 86.1 million. Both measures of employment showed over-the-year growth of more than 3-1/2 million. Unemployment The unemployment rate declined to 5.9 percent fran 6.2 percent in July. There were 6.0 million unemployed persons in August, down 225,000 from the July level. The August rate was more than a percentage point lower than its year-ago level and just below the 6.0-to-6.2 percent plateau which had prevailed throughout most of 1978. The August reduction in unemployment occurred primarily among adult women, whose rate dropped fran 6.5 to 6.1 percent. The jobless rate for adult men (4.1 percent) remained at its July level, and the rate for teenagers (15.6 percent) showed a anall decline over the month. (See table A-2.) The unemployment rate for black workers declined fran 12.5 to 11.7 percent in August, with all of the improvement taking place among teenagers and adult women. The rate for white workers (5.2 percent) was little changed fran July. Both black and white jobless rates were down sub- stantially fran their year-earlier levels. In other worker categories, unemployment declined among persons looking for full-time work, wanen who head families, and persons unemployed less than 5 weeks. (See tables A-2 and A-4.) Digitized for FRASER http://fraser.stlouisfed.org/ Federal Reserve Bank of St. Louis
Transcript of bls_employnews_197808.pdf

News United States Department of Labor
Bureau of Labor Statistics Washington, D.C. 20212
Contact: J. Bregger (202)(202) 523-1944523-1371
(202) 523-1913USDL 78-753TRANSMISSION CF MATERIAL IN THIS RELEASE IS EMBARGOED UNTIL 9:00 A.M. (EOT) , FRIDAY, SEPTEMBER 1, 1978
K. Hoyle
hone:523-1208333-1384
THE EMPLOYMENT SITUATION: AUGUST 1978
Employment rose slightly in August and unerployment declined, the Bureau of Labor Statistics
of the U.S. Department of Labor reported today. The Nation's unemployment rate was 5.9 percent, down fran 6.2 percent in July.
Total employment— as measured by the monthly survey of households— edged up by 160,000 over the month to 94.6 million, gaining back sane of the decline which had occurred in July. Prior to July, employment growth had been unusually strong.
Nonfarm payroll employment— as measured by the monthly survey of establishments— rose by 115,000 in August to 86.1 million. Both measures of employment showed over-the-year growth of more than 3-1/2 million.Unemployment
The unemployment rate declined to 5.9 percent fran 6.2 percent in July. There were 6.0 million unemployed persons in August, down 225,000 from the July level. The August rate was more than a percentage point lower than its year-ago level and just below the 6.0-to-6.2 percent plateau which had prevailed throughout most of 1978.
The August reduction in unemployment occurred primarily among adult women, whose rate dropped fran 6.5 to 6.1 percent. The jobless rate for adult men (4.1 percent) remained at its July level, and the rate for teenagers (15.6 percent) showed a anall decline over the month. (See table A-2.)
The unemployment rate for black workers declined fran 12.5 to 11.7 percent in August, with all of the improvement taking place among teenagers and adult women. The rate for white workers
(5.2 percent) was little changed fran July. Both black and white jobless rates were down substantially fran their year-earlier levels. In other worker categories, unemployment declined
among persons looking for full-time work, wanen who head families, and persons unemployed less than 5 weeks. (See tables A-2 and A-4.)
Digitized for FRASER http://fraser.stlouisfed.org/ Federal Reserve Bank of St. Louis

- 2 -
The average (mean) duration of unemployment fell by about one-half week in August to 11.2 weeks and was 2.5 weeks shorter than the average duration a year ago. Half of the unemployed in August had been looking for work for 6 weeks or less. (See table A-4.)
Total Employment and the labor Force
Following a decline in July, the number of employed persons edged up by 160,000 in August to 94.6 million. The increase was spurred mainly by a rise in the number of teenagers with jobs. Over the past 12 months, employment has grown by nearly 3.6 million (after adjustment for changes in the survey introduced in January— see the box on table A-l). The proportion of the population that is employed remained at its July level of 58.6 percent; this was down from the June peak of
58.9 percent but substantially above the year-ago level. (See table A-l.)
Table A. Major indicators of labor market activity, seasonally adjusted
Selected categories
Quarterly averages Monthly data
1977 1978 1978
I I I I I IV I I I June J u ly Aug.
HOUSEHOLD DATA
Civilian labor force ......................Total employment .................Unemployment ......................
Not in labor force ...................... iDiscouraged workers .............
Thousands of persons
97,15390,264
6,88958,941
1,062
97,55990,823
6,73659,205
1,067
98,62292,069
6,55458,777
969
99,20593,050
6,15558,799
903
100,20694,244
5,96258,399
842
100,57394,819
5 ,75458,257
N.A.
100,61894,425
6,19358,414
N.A.
100,54994,581
5,96858,677
N.A.
Percent of labor force
Unemployment rates:All workers ............................ 7 .1 6 .9 6 .6 6 .2 5 .9 5.7 6.2 5 .9Adult men .............................. 5.2 5 .0 4 .8 4 .6 4.1 3 .9 4.1 4.1Adult w o m e n .............................. 7 .0
18.17 .0
17.66 .8
16.75 .9
16.96.1 6.1 6 .5 6.1
Teenagers ................... ■ 15.9 14.2 16.3 15.6White ....................................... i 6.3 6.1 5 .8 5 .4 5.1 4 .9 5.3 ■5.2Black and other ...................... 12.8 13.6 13.3 12.3 12.0 11.9 12.5 11.7Full-time workers ................. 6 .6 j
_________i6. 5 | 6 .2 5.7 5 .0 5.2
_____ 5j21 5.5
ESTABLISHMENT DATA i----------------
Nonfarm payroll employment . . . 81,871 Goods-producing industries. . . ■ 24,265Service-producing industries . . ■ 57,606
1
i----------------82,548 83,192 2 4 ,3 5 9 j 24,49758,189! 58,695
L___ _____ ,
84,10724,75759,350
85,50325,445
.60,058
85,82025,55460,266
86,003p 25,614p 6 0 ,389p
86, i. 16p 25 ,548p 6 0 ,568p
Hours of work
Average weekly hours: 1Total private nonfarm ............ 36.2 1Manufacturing ...................... 40 .4Manufacturing ove rtim e ........ j 3 .4
!3 6 .0i 36.240.31 40.5
3.3 ! 3 .5 l
3 5 .9 40 .0
3 .7
' 36.1 40 .4
3 .5
36.1. 40.4
3 .5
36. Op 4 0 .4p
3 .5p
3 5 .9p 40. 3p
3. 5p
p -p r« lim in « ry . N .A .-n o t aval labia.
Digitized for FRASER http://fraser.stlouisfed.org/ Federal Reserve Bank of St. Louis

- 3 -
The civilian labor force was 100.5 million in August, virtually unchanged fran the June and July levels but up 2.7 million over the year (after adjustment). The civilian labor force
participation rate was 63.1 percent in August, down slightly fran the all-time high attained in
the prior 2 months.
Industry Payroll EmploymentNonagricultural payroll employment rose slightly (by 115,000) in August to 86.1 million, as
an increase in the service-producing sector more than than offset a decline in the goods sector. Overall, employment increased in 56 percent of the 172 industries that comprise the ELS diffusion index of private nonagricultural payroll employment, the lowest proportion since August
1977. However, due to substantial employment gains throughout most of the intervening period, the number of nonfarm payroll jobs has grown by 3.7 million over the past year. (See tables B-l
and B-6.)
Wholesale and retail trade posted an employment gain of 80,000, the largest over-the-month increase of all the major industry divisions. Consistent with recent trends, the retail component accounted for just over three-fourths of the increase. There was also marked .growth in
services (60,000), transportation and public utilities (35,000), and finance, insurance, and real estate (20,000). By contrast, State and local government posted a small employment reduction for the second straight month.
After showing considerable strength throughout 1978, contract construction registered a modest decline of 20,000. In manufacturing, there was an employment decline of 50,000 in the nondurable goods industries,‘ mostly in food processing, paper products, and rubber and plastics. Durable goods oiplcyment showed little overall change in August, despite continued growth in the machinery industry. Following relatively large gains in the first 3 months of this year, overall employment growth in manufacturing has been rather sluggish.
HoursThe average workweek for production or nonsupervisory workers on private nonagricultural
payrolls decreased slightly to 35.9 hours in August, down by 0.1 hour fran both the previous
month and a year earlier. The manufacturing workweek was also down 0.1 hour, while factory
overtime, at 3.5 hours, was unchanged fran the July level. (See table B-2.)
Digitized for FRASER http://fraser.stlouisfed.org/ Federal Reserve Bank of St. Louis

- 4 -
Because of the slight decline in hours, coupled with only modest employment growth, the
index of aggregate hours of production or nonsupervisory workers on private nonagricultural
payrolls edged down fran 120.9 to 120.8 (1967=100) in August. Nevertheless, the index was 4.5
percent above the year-earlier level. (See table B-5.)Hourly and Weekly Earnings
Average hourly earnings of production or nonsupervisory workers on private nonagricultural
payrolls increased 0.2 percent in August, seasonally adjusted. This increase was too small to counter the small decline in average weekly hours, and average weekly earnings showed a marginal decline. Since last August, average hourly and weekly earnings have risen 8.7 and 8.4 percent, respectively.
Before adjustment for seasonality, average hourly earnings were $5.72 in August, up 1 cent
fran July and 46 cents fran a year earlier. Average weekly earnings fell by 21 cents over the month to $208.21 but have risen $16.22 since last August. (See table B-3.)
Digitized for FRASER http://fraser.stlouisfed.org/ Federal Reserve Bank of St. Louis

Explanatory Note
This release presents and analyzes statistics from two major surveys. Data on labor force, total employment, and unemployment (A tables) are derived from the Current Population Survey—a sample survey of households which is conducted by the Bureau of the Census for the Bureau of Labor Statistics. Beginning in September 1975, the sample was enlarged by 9,000 households in order to provide greater reliability for smaller States and thus permit the publication of annual statistics for all 50 States and the District of Columbia. These supplementary households were added to the 47,000 national household sample in January 1978; thus the sample now consists of about 56,000 households selected to represent the U.S. civilian noninstitutional population 16 years and over.
Statistics on nonagricultural payroll employment, hours, and earnings (B tables) are collected by the Bureau of Labor Statistics, in cooperation with State agencies, from payroll records of a sample of approximately 165,000 establishments. Unless otherwise indicated, data for both statistical series relate to the week containing the 12th day of the specified month.
Comparability of household and payroll employment statistics
Employment data from the household and payroll surveys differ in several basic respects. The household survey provides information on the labor force activity
the entire civilian noninstitutional population, 16 ars of age and over, without duplication. Each person
is classified as either employed, unemployed, or not in the labor force. The household survey counts employed persons in both agriculture and nonagricultural industries and, in addition to wage and salary workers (including private household workers), counts the self- employed, unpaid family workers, and persons "with a job but not at work" and not paid for the period absent.
The payroll survey relates only to paid wage and salary employees (regardless of age) on the payrolls of nonagricultural establishments. Persons who worked at more than one job during the survey week or otherwise appear on more than one payroll are counted more than once in the establishment survey. Such persons are counted only once in the household survey and are classified in the job at which they worked the greatest number of hours.
Unemployment
To be classified in the household survey as unemployed an individual must: (1) Have been without a
job during the survey week; (2) have made specific efforts to find employment sometime during the prior 4 weeks; and (3) be presently available for work. In addition, persons on layoff and those waiting to begin a new job (within 30 days), neither of whom must meet the jobseeking requirements, are also classified as unemployed. The unemployed total ineludes all persons who satisfactorily meet the above criteria, regardless of their eligibility for unemployment insurance benefits or any kind of public assistance. The unemployment rate represents the unemployed as a proportion of the civilian labor force (the employed and unemployed combined).
The Bureau regularly publishes a wide variety of labor market measures. See, for example, the demographic, occupational, and industry detail in tables A-2 and A-3 of this release and the comprehensive data package in Employment and Earnings each month. A special grouping of seven unemployment measures is set forth in table A-7. Identified by the symbols U -l through U-7, these measures represent a range of possible definitions of unemployment and of the labor force—from the most restrictive (U -l) to the most comprehensive (U-7). The official rate of unemployment appears as U-5.
Seasonal adjustment
Nearly all economic phenomena are affected to some degree by seasonal variations. These are recurring, predictable events which are repeated more or less regularly each year—changes in weather, opening and closing of schools, major holidays, industry production schedules, etc. The cumulative effects of these events are often larger For example, on average over the year, they explain about 95 percent of the month- to-month variance in the unemployment figures. Since seasonal variations tend to be large relative to the underlying cyclical trends, it is necessary to use seasonally-adjusted data to interpret short-term economic developments. At the beginning of each year, seasonal adjustment factors for unemployment and other labor force series are calculated for use during the entire year, taking into account the prior year's experience, and revised seasonally-adjusted data are introduced in the release containing January data.
All seasonally-adjusted civilian labor force and unemployment rate statistics, as well as the major employment and unemployment estimates, are computed by aggregating independently adjusted series. The official unemployment rate for all civilian workers is derived by dividing the estimate for total unem-
Digitized for FRASER http://fraser.stlouisfed.org/ Federal Reserve Bank of St. Louis

pioymcnt (the sum of four seasonally-adjusted age-sex ^omporents) by the civilian labor force (the sum of 12 seasonally-adjusted age-sex components).
For establishment data, the seasonally-adjusted series for all employees, production workers, average weekly hours, and average hourly earnings are adjusted by aggregating the seasonally-adjusted data from the respective component series. Theje data are also revised unnuajly. often in conjunction with benchmark (comprehensive counts of employment) adjustments. (The most recent revision of seasonally-adjusted data was based on data throuigh August 1977.)
Samphrs variable*Both I he housoho’d and establishment survey
statistics are subject to sampling error, which should be taken into account in evaluating the levels of a series as well es changes ever time. Because the household survey is based upon a probability sample, the results may differ from the figures that would be obtained if it were possible to take a complete census using the same Questionnaires and procedures. The standard error is the measure of sampling variability, that is, of the variation that occurs by chance because a sample rather than the entire population is surveyed. The chances are about 68 out of 100 that an estimate from the survey differs from a figure that would be obtained through a complete census b'- less than the standard error. Tables A. tbrougli H in the "Explanatory Notes’’ of Employment and Earnings provide approximations of the standard errors'" for unemployment and other labor force categories. To obtain a 90-percent level of confidence, the confidence interval generally used Dy BLS, the errors should be multiplied by 1.6. The following examples provide an indication of the magnitude of sampling error: For a monthly change in totai em
ployment, the standard error is on the order of plus or minus 182,000. Similarly, the standard error on a change in total unemployment is approximately 115,000. The standard error on a change in the national unemployment rate is 0.12 percentage point.
Although the relatively large size of the monthly establishment survey assures a high degree of accuracy, the estimates derived from it also may differ from the figures obtained if a complete census using the same schedules and procedures were possible. However, since the estimating procedures utilize the previous month’s level as the base in computing the current month’s level of employment (link-relative technique), sampling and response errors may accumulate over several months. To remove this accumulated error, the employment estimates are adjusted to new benchmarks (comprehensive counts of employment), usually on an annual basis. In addition to taking account of sampling and response errors, the benchmark revision adjusts the estimates for changes in the industrial classification of individual establishments. Employment estimates are currently projected from March 1974 levels, plus an interim benchmark adjustment based on December 1975 levels.
One measure of the reliability of the employment estimates for individual industries is the root-mean- square error (RMSE). The RMSE is the standard deviation adjusted for the bias in estimates. If the bias is small, the chances are about 68 out of 100 that an estimate from the sample would differ from its benchmark by less than the RMSE. For total nonagricultural employment, the RMSE is on the order of plus or minus 81,000. Measures of reliability (approximations of the RMSE) for establishment-survey data and actual amounts of revision due to benchmark adjustments are provided in tables J through O in the "Explanatory Notes" of Employment and Earnings.
Digitized for FRASER http://fraser.stlouisfed.org/ Federal Reserve Bank of St. Louis

NOTE Household survey data for periods prior to January 1978 shown in tables A 1 through A 7 are no stuctly comparable with current data because of the introduction of an expansion in the sample and re
: visions in the estimation procedures. As a result, the overall civilian labor force and employment totals in 1 January were raised by roughly a quarter of a million; unemployment levels and rates were essentially un I changed. An explanation of the procedural changes and an indication of the differences appear in "Revisions
i (.u .‘in Population Survey m Janua. > iy /e Employment =-'>1 Earnings Februai / 1978 Vol 25 Nc. >*
HO USEHOLD DATA HOUSEHOLD DATA
Table A-1. Employment status of the noninstitutional population
[Numbers in thousands]
Employment status
Not seasonally adjusted Seasonally adjusted
A u g .1 97 7
J u l y1 9 7 8
A u g .1 9 7 8
A u g .1 97 7
A p r .1 9 7 8
May1 9 7 8
J u n e1 9 7 8
J u l y1 9 7 8
A u g . 1 9 7 8
TOTAL
Total noninstitutional population1 ............................................. 1 5 8 , 8 9 9 1 6 1 , 1 4 8 1 6 1 , 3 4 8 1 5 8 , 8 9 9 1 6 0 , 5 0 4 1 6 0 , 7 1 3 1 6 0 , 9 2 8 1 6 1 , 1 4 8 1 6 1 , 3 4 8Armed Forces1 ........................................................................... 2 , 1 3 7 2 , 1 1 6 2 , 1 2 2 2 , 1 3 7 2 , 1 1 8 2 , 1 1 3 2 , 0 9 8 2 , 1 1 6 2 , 1 2 2Civilian noninstitutional population1 ..................................... 1 5 6 , 7 6 1 1 5 9 , 0 3 2 1 5 9 , 2 2 6 1 5 6 , 7 6 1 1 5 8 , 3 8 6 1 5 8 , 6 0 1 1 5 8 , 8 3 0 1 5 9 , 0 3 2 1 5 9 , 2 2 6
Civilian labor force ............................................................. 9 9 , 0 7 3 1 0 2 , 6 3 9 1 0 2 , 0 4 7 9 7 , 6 1 4 9 9 , 7 8 4 1 0 0 , 2 6 1 1 0 0 , 5 7 3 1 0 0 , 6 1 8 1 0 0 , 5 4 9Participation ra te .................................................. 6 3 . 2 6 4 . 5 6 4 . 1 6 2 . 3 6 3 . 0 6 3 . 2 6 3 . 3 6 3 . 3 6 3 . 1
Em ployed........................................................................ 9 2 , 3 1 5 9 6 , 2 0 2 9 6 , 1 1 6 9 0 , 7 9 3 9 3 , 8 0 1 9 4 , 1 1 2 9 4 , 8 1 9 9 4 , 4 2 5 9 4 , 5 8 1Employment-population ratio1........................... 5 8 . 1 5 9 . 7 5 9 . 6 5 7 . 1 5 8 . 4 5 8 . 6 5 8 . 9 5 8 . 6 5 8 . 6
Agriculture.................................................................. 3 , 6 8 2 3 , 9 9 7 3 , 8 5 6 3 , 2 2 4 3 , 2 7 5 3 , 2 3 5 3 , 4 7 3 3 , 3 8 7 3 , 3 6 0Nonagricultural industries ....................................... 8 8 , 6 3 3 9 2 , 2 0 4 9 2 , 2 6 1 8 7 , 5 6 9 9 0 , 5 2 6 9 0 , 8 7 7 9 1 , 3 4 6 9 1 , 0 3 8 9 1 , 2 2 1
Unemployed.................................................................... 6 , 7 5 7 6 , 4 3 8 5 , 9 3 1 6 , 8 2 1 5 , 9 8 3 6 , 1 4 9 5 , 7 5 4 6 , 1 9 3 5 , 9 6 8Unemployment ra te ............................................. 6 . 8 6 . 3 5 . 8 7 . 0 6 .0 6 .1 5 . 7 6 .2 5 . 9
Not in labor force ............................................................... 5 7 , 6 8 9 5 6 , 3 9 3 5 7 , 1 7 9 5 9 , 1 4 7 5 8 , 6 0 2 5 8 , 3 4 0 5 8 , 2 5 7 5 8 , 4 1 4 5 8 , 6 7 7Men, 20 years and over
Total noninstitutional population1 ............................................. 6 7 , 6 4 2 6 8 , 7 2 9 6 8 , 8 2 7 6 7 , 6 4 2 6 8 , 4 1 9 6 8 , 5 1 9 6 8 , 6 2 3 6 8 , 7 2 9 6 8 , 8 2 7Civilian noninstitutional population1 ..................................... 6 5 , 9 4 7 6 7 , 0 3 9 6 7 , 1 2 7 6 5 , 9 4 7 6 6 / 7 4 0 6 6 , 8 4 5 6 6 , 9 4 7 6 7 , 0 3 9 6 7 , 1 2 7
Civilian labor force ............................................................. 5 2 , 9 7 8 5 3 , 9 5 6 5 3 , 9 0 3 5 2 , 4 4 5 5 3 , 2 6 3 5 3 , 4 1 4 5 3 , 5 2 2 5 3 , 3 9 1 5 3 , 3 0 6Participation ra te .................................................. 8 0 . 3 8 0 . 5 8 0 . 3 7 9 . 5 7 9 . 8 7 9 . 9 7 9 . 9 7 9 . 6 7 9 . 4
Em ployed......................................................................... 5 0 , 5 1 3 5 1 , 8 8 0 5 1 , 8 8 7 4 9 , 7 8 7 5 1 , 0 3 8 5 1 , 1 8 2 5 1 , 4 3 3 5 1 , 2 1 3 5 1 , 1 3 5Employment-population ratio1........................... 7 4 . 7 7 5 . 5 7 5 . 4 7 3 . 6 7 4 . 6 7 4 . 7 7 5 . 0 7 4 . 5 7 4 . 3
Agriculture.................................................................. 2 , 4 9 2 2 , 5 9 9 2 , 5 2 5 2 , 3 2 7 2 , 2 9 5 2 , 3 2 8 2 , 4 3 7 2 , 4 2 0 2 , 3 5 8Nonagricultural industries ....................................... 4 8 , 0 2 1 4 9 , 2 8 1 4 9 , 3 6 2 4 7 , 4 6 0 4 8 , 7 4 3 4 8 , 8 5 4 4 8 , 9 9 6 4 8 , 7 9 3 4 8 , 7 7 7
Unemployed .................................................................... 2 , 4 6 6 2 , 0 7 6 2 , 0 1 5 2 , 6 5 8 2 , 2 2 5 2 , 2 3 2 2 , 0 8 9 2 , 1 7 8 2 , 1 7 1Unemployment rate ........................................... 4 . 7 3 . 8 3 . 7 5 . 1 4 . 2 4 . 2 3 . 9 4 . 1 4 . 1
Not in labor force ...................................... * .................... 1 2 , 9 6 9 1 3 , 0 8 3 1 3 , 2 2 5 1 3 , 5 0 2 1 3 , 4 7 7 1 3 , 4 3 1 1 3 , 4 2 5 1 3 , 6 4 8 1 3 , 8 2 1Women, 20 years and over
Total noninstitutional population1 .............................................. 7 4 , 4 2 9 7 5 , 6 4 3 7 5 , 7 5 3 7 4 , 4 2 9 7 5 , 3 0 0 7 5 , 4 1 2 7 5 , 5 2 7 7 5 , 6 4 3 7 5 , 7 5 3Civilian noninstitutional population1 .................................... 7 4 , 3 3 2 7 5 , 5 3 7 7 5 , 6 4 5 7 4 , 3 3 2 7 5 , 1 9 8 7 5 , 3 1 0 7 5 , 4 2 2 7 5 , 5 3 7 7 5 , 6 4 5
Civilian labor force ............................................................. 3 5 , 1 8 8 3 6 , 8 1 8 3 6 , 9 1 9 3 5 , 6 8 6 3 7 , 1 1 7 3 7 , 2 6 4 3 7 , 4 3 9 3 7 , 5 4 2 3 7 , 4 6 1Participation ra te .................................................. 4 7 . 3 4 8 . 7 4 8 . 8 4 8 . 0 4 9 . 4 4 9 . 5 4 9 . 6 4 9 . 7 4 9 . 5
Em ployed........................................................................ 3 2 , 5 5 1 3 4 , 3 8 4 3 4 , 5 4 6 3 3 , 1 6 3 3 4 , 9 4 8 ' 3 4 , 9 3 1 3 5 , 1 3 7 3 5 , 1 1 0 3 5 , 1 9 2Employment-population ratio1 ......................... 4 3 . 7 4 5 . 5 4 5 . 6 4 4 . 6 4 6 . 4 4 6 . 3 4 6 . 5 4 6 . 4 4 6 . 5
Agriculture.................................................................. 6 1 2 7 5 9 6 9 4 51 1 6 2 3 5 2 7 6 2 3 5 8 7 5 7 9Nonagricultural industries......................................... 3 1 , 9 3 9 3 3 , 6 2 5 3 3 , 8 5 2 3 2 , 6 5 2 3 4 , 3 2 5 3 4 , 4 0 4 3 4 , 5 1 4 3 4 , 5 2 3 3 4 , 6 1 3
Unemployed............................. ...................................... 2 , 6 3 8 2 , 4 3 4 2 , 3 7 3 2 , 5 2 3 2 , 1 6 9 2 , 3 3 3 2 , 3 0 2 2 , 4 3 2 2 , 2 6 9Unemployment rate ........................................... 7 . 5 6 . 6 6 . 4 7 . 1 5 . 8 6 . 3 6 .1 6 . 5 6 . 1
Not in labor force ............................................................... 3 9 , 1 4 3 3 8 , 7 1 9 3 8 , 7 2 6 3 8 , 6 4 6 3 8 , 0 8 1 3 8 , 0 4 6 3 7 , 9 8 3 3 7 , 9 9 5 3 8 , 1 8 4Both sexes, 16-19 years
Total noninstitutional population1 ............................................. 1 6 , 8 2 8 1 6 , 7 7 6 1 6 , 7 6 8 1 6 , 8 2 8 1 6 , 7 8 5 1 6 , 7 8 2 1 6 , 7 7 9 1 6 , 7 7 6 1 6 , 7 6 8Civilian noninstitutional population1 .................................... 1 6 , 4 8 3 1 6 , 4 5 5 1 6 , 4 5 5 1 6 , 4 8 3 1 6 , 4 4 9 1 6 , 4 4 6 1 6 , 4 6 1 1 6 , 4 5 5 1 6 , 4 5 5
Civilian labor force............................................................... 1 0 , 9 0 6 1 1 , 8 6 5 1 1 , 2 2 6 9 , 4 8 3 9 , 4 0 4 9 , 5 8 3 9 , 6 1 2 9 , 6 8 5 9 , 7 8 2Participation ra te .................................................. 6 6 . 2 7 2 . 1 6 8 . 2 5 7 5 5 7 . 2 5 8 . 3 5 8 . 4 5 8 . 9 5 9 . 4
Em ployed........................................................................ 9 , 2 5 2 9 , 9 3 7 9 , 6 8 3 7 , 8 4 3 7 , 8 1 5 7 , 9 9 9 8 , 2 4 9 8 , 1 0 2 8 , 2 5 4Employment-population ratio1 ......................... 5 5 . 0 5 9 . 2 5 7 . 7 4 6 . 6 4 6 . 6 4 7 . 7 4 9 . 2 4 8 . 3 4 9 . 2
Agriculture.................................................................. 5 7 9 6 3 9 6 3 7 3 8 6 3 5 7 3 8 0 4 1 3 3 8 0 4 2 3Nonagricultural industries ....................................... 8 , 6 7 3 9 , 2 9 9 9 , 0 4 6 7 , 4 5 7 7 , 4 5 8 7 , 6 1 9 7 , 8 3 6 7 , 7 2 2 7 , 8 3 1
Unem ployed...................................................... ............. 1 , 6 5 4 1 , 9 2 7 1 , 5 4 2 1 , 6 4 0 1 , 5 8 9 1 , 5 8 4 1 , 3 6 3 1 , 5 8 3 1 , 5 2 8Unemployment rate ........................................... 1 5 . 2 1 6 . 2 1 3 . 7 1 7 . 3 1 6 . 9 1 6 . 5 1 4 . 2 1 6 . 3 1 5 . 6
Not in labor force ............................................................... 5 , 5 7 6 4 , 5 9 1 5 , 2 2 9 7 , 0 0 0 7 , 0 4 5 6 , 8 6 3 6 , 8 4 9 6 , 7 7 0 6 , 6 7 3WHITE
Total noninstitutional population1 .............................................. 1 3 9 , 6 2 0 1 4 1 , 3 6 6 1 4 1 , 5 2 0 1 3 9 , 6 2 0 1 4 0 , 8 6 3 1 4 1 , 0 2 6 1 4 1 , 1 9 4 1 4 1 , 3 6 6 1 4 1 , 5 2 0Civilian noninstitutional population1 .................................... 1 3 7 , 8 6 5 1 3 9 , 6 6 0 1 3 9 , 8 1 7 1 3 7 , 8 6 5 1 3 9 , 1 4 9 1 3 9 , 3 1 7 1 3 9 , 5 0 3 1 3 9 , 6 6 0 1 3 9 , 8 1 7
Civilian labor force ............................................................. 8 7 , 4 0 7 9 0 , 1 7 9 8 9 , 7 7 3 8 6 , 2 9 8 8 7 , 9 4 5 8 8 , 2 0 9 8 8 , 6 2 3 8 8 , 5 2 1 8 8 , 6 7 2Participation ra te .................................................. 6 3 . 4 6 4 . 6 6 4 . 2 6 2 . 6 6 3 . 2 6 3 . 3 6 3 . 5 6 3 . 4 6 3 . 4
Em ployed......................................................................... 8 2 , 2 7 8 8 5 , 4 1 0 8 5 , 2 5 6 8 1 , 0 3 2 8 3 , 3 8 6 8 3 , 5 9 0 8 4 , 2 7 0 8 3 , 8 6 2 8 4 , 0 4 2Employment-population ratio1........................... 5 8 . 9 6 0 . 4 6 0 . 2 5 8 . 0 5 9 . 2 5 9 . 3 5 9 . 7 5 9 . 3 5 9 . 4
Unemployed.................................................................... 5 , 1 2 8 4 , 7 6 9 4 , 5 1 7 5 , 2 6 6 4 , 5 5 9 4 , 6 1 9 4 , 3 5 3 4 , 6 5 9 4 , 6 3 0Unemployment ra te .............................................. 5 . 9 ' 5 . 3 5 . 0 6 .1 5 . 2 5 . 2 4 . 9 5 . 3 5 . 2
Not in labor fo rce ......................... ...................................... 5 0 , 4 5 9 4 9 , 4 8 1 5 0 , 0 4 4 5 1 , 5 6 7 5 1 , 2 0 4 5 1 , 1 0 8 5 0 , 8 8 0 5 1 , 1 3 9 5 1 , 1 4 5BLACK AND OTHER
Total noninstitutional population1 .............................................. 1 9 , 2 7 9 1 9 , 7 8 2 1 9 , 8 2 8 1 9 , 2 7 9 1 9 , 6 4 1 1 9 , 6 8 7 1 9 , 7 3 4 1 9 , 7 8 2 1 9 , 8 2 8Civilian noninstitutional population1 .................................... 1 8 , 8 9 6 1 9 , 3 7 1 1 9 , 4 0 9 1 8 , 8 9 6 1 9 , 2 3 7 1 9 , 2 8 4 1 9 , 3 2 7 1 9 , 3 7 1 1 9 , 4 0 9
Civilian labor force ............................................................. 1 1 , 6 6 6 1 2 , 4 6 0 1 2 , 2 7 5 1 1 , 3 7 5 1 1 , 8 1 6 1 1 / 9 3 4 1 1 , 9 8 0 1 1 , 9 9 7 1 1 , 9 7 5Participation ra te .................................................. 6 1 . 7 6 4 . 3 6 3 . 2 6 0 . 2 6 1 . 4 6 1 . 9 6 2 . 0 6 1 . 9 6 1 . 7
Em ployed......................................................................... 1 0 , 0 3 7 1 0 , 7 9 1 1 0 , 8 6 0 9 , 7 5 2 1 0 , 4 1 8 1 0 , 4 6 7 1 0 , 5 5 3 1 0 , 4 9 6 1 0 , 5 7 8Employment-population ratio1 ........................... 5 2 . 1 5 4 . 5 5 4 . 8 5 0 . 6 5 3 . 0 5 3 . 2 5 3 . 5 5 3 . 1 5 3 . 3
Unem ployed.................................................................... 1 , 6 2 9 1 , 6 6 8 1 , 4 1 4 1 , 6 2 3 1 , 3 9 8 1 , 4 6 7 1 , 4 2 7 1 , 5 0 1 1 , 3 9 7Unemployment ra te ............................................. 1 4 . 0 1 3 . 4 1 1 . 5 1 4 . 3 1 1 . 8 1 2 . 3 1 1 . 9 1 2 . 5 1 1 . 7
Not in tabor force ................................................................ 7 , 2 3 0 6 , 9 1 1 7 , 1 3 4 7 , 5 2 1 7 , 4 2 1 7 , 3 5 0 7 , 3 4 7 7 , 3 7 4 7 , 4 3 4
1 The population and Armed Forces figures are not adjusted for seasonal variations; therefore, identical numbers appear in the unadjusted and seasonally adjusted columns.
1 Civilian employment as a percent of the total noninstitutional population (including Armed Forces).
Digitized for FRASER http://fraser.stlouisfed.org/ Federal Reserve Bank of St. Louis

HOUSEHOLD DATA HOUSEHOLD DATA
Table A-2. Major unemployment indicators, seasonally adjusted
Selected categories
Number of unemployed persons
(In thousands)Unemployment rates
Aug.1977
Aug.1978
A ug.1977
A p r .1978
May1978
June1978
J u ly1978
• A ug. 1978
CHARACTERISTICS
Total, 16 years and over ....................................................................................... 6 ,8 2 1 5 ,9 6 8 7 .0 6 .0 6 .1 5 .7 6 .2 5 .9Men, 20 years and over ................................................................................... 2 ,6 5 8 2 ,1 7 1 5 .1 4 .2 4 .2 3 .9 4 .1 4 .1Women, 20 years and over .............................................................................. 2 ,5 2 3 2 ,2 6 9 7 .1 5 .8 6 .3 6 .1 6 .5 6 .1Both sexes, 16-19 years ................................................................................... 1 ,6 4 0 1 ,5 2 8 1 7 .3 1 6 .9 1 6 .5 1 4 .2 1 6 .3 1 5 .6
White, total ....................................................................................................... 5 ,2 6 6 4 ,6 3 0 6 .1 5 .2 5 .2 4 .9 5 .3 5 .2Men, 20 years and over .............................................................................. 2 ,0 7 8 1 ,7 1 7 4 .4 3 .6 3 .6 3 .4 3 .6 3 .6Women, 20 years and over ....................................................................... 1 ,9 4 9 1 ,7 1 9 6 .3 5 .1 5 .4 5 .3 5 .6 5 .3Both sexes, 16-19 years ............................................................................ 1 ,2 3 9 1 ,1 9 4 1 4 .7 1 4 .6 1 3 .8 1 1 .6 1 3 .4 1 3 .6
Black and other, total ..................................................................................... 1 ,6 2 3 1 ,3 9 7 1 4 .3 1 1 .8 1 2 .3 1 1 .9 1 2 .5 1 1 .7Men, 20 years and over .............................................................................. 644 509 1 1 .7 8 .8 8 .8 7 .8 8 .4 9 .0Women, 20 years and over ....................................................................... 571 548 1 1 .8 1 0 .5 1 0 .9 1 1 .3 1 1 .6 1 0 .4Both sexes, 16-19 years ............................................................................ 4 08 340 3 9 .4 3 5 .3 3 8 .4 3 7 .1 3 7 .0 3 2 .4
Married men, spouse present ......................................................................... 1 ,3 9 4 1 ,1 1 8 3 .5 2 .8 2 .9 2 .7 2 .7 2 .8Married women, spouse present ..................................................................... 1 ,4 4 9 1 ,3 2 7 6 .5 5 .0 5 .9 5 .6 5 .6 5 .8Women who head families ......................................................... 445 407 1 0 .0 1 0 .1 9 .3 8 .8 1 0 .1 8 .2
Full-time workers.............................................................................................. 5 ,5 3 5 4 ,7 2 5 6 .6 5 .4 5 .6 5 .2 5 .7 5 .5Part-time workers ............................................................................................ 1 ,3 0 6 1 ,2 5 5 9 .0 9 .6 9 .2 8 .8 8 .8 8 .6Unemployed 15 weeks and over1 ................................................................... 1 ,8 0 0 1 ,2 1 5 1 .8 1 .4 1 .4 1 .2 1 .3 1 .2Labor force time lost2 ..................................... .................... ........................... — — 7 .6 6 .3 6 .6 6 .4 6 .8 6 .6
OCCUPATION3
White-collar workers ....................................................................................... 1 ,9 7 4 1 ,7 0 7 4 .2 3 .5 3 .6 3 .5 3 .8 3 .5Professional and technical .......................................................................... 420 380 3 .0 2 .5 2 .4 2 .4 2 .5 2 .6Managers and administrators, except fa rm .............................................. 246 190 2 .5 2 .0 2 .0 1 .8 2 .2 1 .8Sales workers .............................................................................................. 316 255 5 .2 4 .3 4 .4 4 .4 4 .4 4 .2Clerical workers ................................ ......................................................... 992 882 5 .8 5 .1 5 .3 5 .0 5 .4 5 .0
Blue-collar workers ......................................................................................... 2 ,7 3 9 2 ,3 6 5 8 .3 6 .5 6 .6 6 .5 6 .9 7 .0Craft and kindred workers ....................................................................... 691 584 5 .5 4 .3 4 .3 4 .2 4 .0 4 .4Operatives, except transport . ................................................................... 1 ,1 1 8 1 ,0 6 1 9 .8 7 .6 8 .4 7 .9 8 .5 9 .0Transport equipment operatives .............................................................. 279 212 7 .5 5 .2 5 .9 4 .6 6 .1 5 .9Nonfarm laborers.......................................................................................... 651 508 1 2 .4 1 0 .0 8 .7 9 .9 1 0 .6 9 .5
Service workers ................................................................................................. 1 ,1 3 2 978 8 .3 7 .7 7 .6 7 .2 7 .5 7 .1Farmworkers ................................................................................................... 114 96 4 .0 3 .1 3 .6 3 .0 3 .8 3 .3
INDUSTRY3
Nonagricultural private wage and salary workers4 ..................................... 4 ,9 2 8 4 ,2 9 7 7 .0 5 .9 5 .9 5 .6 6 .0 5 .9Construction . ............................................................................................ 516 449 1 1 .4 9 .5 9 .2 9 .3 9 .5 9 .1Manufacturing ......... .................................................................................. 1 ,4 9 0 1 ,2 5 9 6 .9 5 .3 5 .6 5 .6 5 .6 5 .7
Durable goods ........................................................................................ 808 728 6 .3 4 .4 5 .0 4 .8 5 .1 5 .5Nondurable goods................................ .................................................. 682 531 7 .7 6 .5 6 .4 6 .7 6 .4 5 .9
Transportation and public utilities ....................................................... .. 247 196 4 .8 3 .7 3 .8 3 .7 4 .1 3 .8Wholesale and retail trade .......................................................................... 1 ,4 6 7 1 ,2 1 8 8 .1 7 .2 6 .8 6 .3 6 .8 6 .6Finance and service industries................................................................... 1 ,1 7 4 1 ,1 4 2 5 .7 5 .2 5 .3 4 .7 5 .4 5 .2
Government workers ........................................................................................ 685 577 4 .3 3 .8 4 .1 4 .0 4 .1 3 .6Agricultural wage and salary workers............................................................ 143 129 9 .8 7 .7 7 .7 8 .0 1 0 .1 8 .3
VETERAN STATUS
Male Vietnam-era veterans:520 to 34 years ............................................................................................... 506 389 7 .7 4 .5 4 .0 4 .3 5 .1 6 .3
20 to 24 years..................................................................... .................... 168 93 1 7 .7 1 0 .7 6 .9 9 .4 1 1 .4 1 3 .925 to 29 years ........................................................................................ 188 158 6 .5 4 .5 5 .5 5 .3 6 .4 7 .330 to 34 years ........................................................................................ 150 138 5 .5 3 .1 2 .3 2 .6 2 .9 4 .1
Male nonveterans:20 to 34 yea rs ............................................................................................... 1 ,2 4 4 965 7 .8 6 .5 5 .9 5 .5 5 .9 5 .8
20 to 24*years.......................................................................................... 726 582 1 0 .4 8 .8 7 .7 7 .9 8 .4 8 .125 to 29 years ........................................................................................ 327 280 6 .5 6 .1 4 .8 3 .8 4 .4 4 .830 to 34 years.......................................................................................... 191 103 4 .8 2 .9 3 .9 3 .7 3 .3 2 .7
1 Unemployment rate calculated as a percent of civilian labor force. by industry covers only unemployed wage and salary workers.2 Aggregate hours lost by the unemployed and persons on part time for economic reasons 4 Includes mining, not shown separately.
as a percent of potentially available labor force hours. 5 Vietnam-era veterans are those who served between August 5,1964, and May 7,1975.3 Unemployment by occupation includes all experienced unemployed persons, whereas that
Digitized for FRASER http://fraser.stlouisfed.org/ Federal Reserve Bank of St. Louis

HOUSEHOLD DATA HOUSEHOLD DATA
Table A -3. Selected employment indicators
[In thousands]
Selected categoriesNot seasonally adjusted Seasonally adjusted
Aug.1977
A ug .1978
A ug .1977
A p r .1978
May1978
June1978
J u ly1978
Aug.1978
CHARACTERISTICS
Total employed, 16 years and. o v e r........................................................................ 9 2 ,3 1 5 9 6 ,1 1 6 9 0 ,7 9 3 9 3 ,8 0 1 9 4 ,1 1 2 9 4 ,8 1 9 9 4 ,4 2 5 9 4 ,5 8 1Men.......................................................................................................................... 5 5 ,5 6 5 5 7 ,1 9 1 5 3 ,9 4 2 5 5 ,2 0 8 5 5 ,4 4 6 5 5 ,8 6 9 5 5 ,5 3 4 5 5 ,5 2 9Women................................................ .................................................................. 3 6 ,7 5 1 3 8 ,9 2 5 3 6 ,8 5 1 3 8 ,5 9 3 3 8 ,6 6 6 3 8 ,9 5 0 3 8 ,8 9 1 3 9 ,0 5 2Married men, spouse present.............................................................................. 3 8 ,6 2 3 3 8 ,8 1 3 3 8 ,2 9 2 3 8 ,6 2 8 3 8 ,6 2 6 3 8 ,7 1 1 3 8 ,6 4 2 3 8 ,4 6 7Married women, spouse present ........................................................................ 2 0 ,2 3 1 2 1 ,0 6 0 2 0 ,8 1 0 2 1 ,8 4 7 2 1 ,6 9 4 2 1 ,7 1 8 2 1 ,7 6 6 2 1 ,6 6 7
OCCUPATION
White-collar workers................................................................................................. 4 4 ,8 2 8 4 6 ,8 5 3 4 5 ,1 9 8 4 6 ,7 8 9 4 6 ,8 9 5 4 7 ,2 0 9 4 7 ,1 9 2 4 7 ,2 3 6Professional and technical................................................................................... 1 3 ,2 2 6 1 3 ,7 5 6 1 3 ,7 0 6 1 4 ,1 5 8 1 4 ,3 9 9 1 4 ,3 6 5 1 4 ,2 3 9 1 4 ,2 5 5Managers and administrators, execpt farm........................................................ 9 ,8 0 4 1 0 ,2 8 6 9 ,6 9 9 1 0 ,2 1 2 9 ,9 3 3 1 0 ,1 0 7 1 0 ,1 8 2 1 0 ,1 7 4Sales w orkers.............................. ......................................................................... 5 ,8 1 4 5 ,9 6 0 5 ,7 2 6 5 ,8 6 1 5 ,9 1 1 5 ,9 3 1 6 ,0 1 7 5 ,8 7 2Clerical w orkers................................................................................................... 1 5 ,9 8 4 1 6 ,8 5 0 1 6 ,0 6 7 1 6 ,5 5 8 1 6 ,6 5 2 1 6 ,8 0 6 1 6 ,7 5 4 1 6 ,9 3 5
Blue-collar w orkers................................................................................................... 3 1 ,5 6 6 3 2 ,8 8 3 3 0 ,2 2 9 3 1 ,6 5 5 3 1 ,5 4 4 3 1 ,6 8 3 3 1 ,2 2 5 3 1 ,4 8 2Craft and kindred workers ................................................................................. 1 2 ,3 2 5 1 2 ,9 9 9 1 1 ,9 0 3 1 2 ,3 0 2 1 2 ,2 1 8 1 2 ,4 6 7 1 2 ,2 2 9 1 2 ,5 5 9Operatives, except transport ............................................................ ............ 1 0 ,6 1 1 1 1 ,0 3 4 1 0 ,2 9 5 1 0 ,9 7 4 1 0 ,8 4 6 1 1 ,0 0 6 1 0 ,8 4 1 1 0 ,7 0 2Transport equipment operatives ..................... ............................................... 3 ,4 8 3 3 ,4 3 5 3 ,4 5 3 3 ,5 6 0 3 ,5 3 4 3 ,5 1 2 3 ,4 5 2 3 ,4 0 4Nonfarm laborers....... ....................................................................................... • 5 ,1 4 7 5 ,4 1 4 4 ,5 7 8 4 ,8 1 9 4 ,9 4 6 4 ,6 9 8 4 ,7 0 3 4 ,8 1 7
Service workers.......................................................................................................... 1 2 ,7 7 9 1 3 ,1 5 5 1 2 ,5 2 0 1 2 ,8 3 0 1 2 ,8 8 3 1 2 ,9 9 3 1 2 ,8 3 8 1 2 ,8 8 43 ,1 4 3 3 ,2 2 5 2 ,7 4 1 2 ,6 8 7 2 ,6 9 8 2 ,8 9 5 2 ,8 0 2 2 ,8 0 9
MAJOR INDUSTRY AND CLASSOF WORKER
Agriculture:Wage and salary workers..................................................................................... 1 ,5 9 5 1 ,7 2 8 1 ,3 1 4 1 ,4 0 8 1 ,4 3 4 1 ,4 8 2 1 ,3 6 4 1 ,4 2 3Self-employed workers........................................................................................ 1 ,6 7 5 1 ,7 1 6 1 ,5 7 8 1 ,5 3 9 1 ,5 7 3 1 ,6 6 9 1 ,6 5 2 1 ,6 1 7Unpaid family workers........................................................................................ 413 412 318 283 255 336 348 317
Nonagricultural industries:Wage and salary workers...................................................................................... 8 1 ,9 2 9 8 5 ,5 1 8 8 0 ,9 1 8 8 3 ,6 4 8 8 4 ,0 4 9 8 4 ,5 1 3 8 4 ,0 1 6 8 4 ,4 0 6
Government..................................................................................................... 1 4 ,6 7 1 1 4 ,7 4 7 1 5 ,2 1 0 1 5 ,3 0 5 1 5 ,2 0 3 1 5 ,2 2 4 1 5 ,1 2 9 1 5 ,2 8 2Private industries .......................................................................................... 6 7 ,2 5 8 7 0 ,7 7 1 6 5 ,7 0 8 6 8 ,3 4 3 6 8 ,8 4 6 6 9 ,2 8 9 6 8 ,8 8 7 6 9 ,1 2 4
Private households......... ............................................................................ 1 ,4 2 6 1 ,4 0 6 1 ,3 8 8 1 ,3 8 8 1 ,3 9 3 1 ,3 6 8 1 ,3 9 4 1 ,3 6 9Other industries.......................................................................................... 6 5 ,8 3 2 6 9 ,3 6 5 6 4 ,3 2 0 6 6 ,9 5 5 6 7 ,4 5 3 6 7 ,9 2 1 6 7 ,4 9 3 6 7 ,7 5 5
Self-employed workers......... * .................... . ..................................................... 6 ,2 1 3 6 ,2 9 6 6 ,1 4 0 6 ,4 6 7 6 ,2 8 8 6 ,1 9 8 6 ,2 0 6 6 ,2 2 1Unpaid family workers • - ................................................................................... 490 446 483 506 520 468 496 4 40
PERSONS AT WORK 1
Nonagricultural industries........................................................................................ 7 7 ,7 7 0 8 1 ,3 9 1 8 2 ,6 4 2 8 6 ,0 4 3 8 5 ,5 2 8 8 6 ,0 5 1 8 6 ,2 0 5 8 6 ,4 6 9Full-time schedules............................................................................................... 6 5 ,6 5 5 6 9 ,0 5 5 6 7 ,8 3 9 7 0 ,5 5 0 7 0 ,1 5 7 7 0 ,8 6 1 7 1 ,0 9 5 7 1 ,3 3 8Part time for economic reasons.......................................................................... 3 ,7 4 4 3 ,7 5 4 3 ,2 5 3 3 ,3 2 7 3 ,2 4 3 3 ,4 5 8 3 ,3 3 0 3 ,2 9 4
Usually work full t im e ................................................................................... 1 ,2 2 6 1 ,3 9 8 1 ,2 2 0 1 ,2 2 4 1 ,2 1 1 1 ,4 3 3 1 ,3 8 5 1 ,3 9 1Usually work part time ..................................................... ........................... 2 ,5 1 8 2 ,3 5 6 2 ,0 3 3 2 ,1 0 3 2 ,0 3 2 2 ,0 2 5 1 ,9 4 5 1 ,9 0 3
Part time for noneconomic reasons................................................................... 8 ,3 7 1 8 ,5 8 2 1 1 ,5 5 0 1 2 ,1 6 6 1 2 ,1 2 8 1 1 ,7 3 2 1 1 ,7 8 0 1 1 ,8 3 7
1 Excludes persons "with a job but not at work" during the survey period for such reasons as vacation, illness, or industrial disputes.
Table A-4. Duration, of unemployment
[Numbers in thousands]
Weeks of unemploymentNot seasonally adjusted Seasonally adjusted
Aug.1977
A ug.1978
Aug.1977
A p r .1978
May1978
June1978
J u ly1978
A ug.1978
DURATION
Less than 5 w eeks.................................................................................................... 2 ,7 4 1 2 ,7 0 1 2 ,8 6 5 2 ,7 9 0 2 ,9 3 2 2 ,7 2 7 3 ,0 2 5 2 ,8 2 25 to 14 weeks ............................................................................................................ 2 ,4 2 7 2 ,1 5 7 2 ,2 3 7 1 ,7 8 4 1 ,8 0 3 1 ,9 1 6 1 ,8 5 4 1 ,9 8 815 weeks and over..................................................................................................... 1 ,5 8 9 1 ,0 7 3 1 ,8 0 0 1 ,3 8 4 1 ,3 5 8 1 ,2 3 1 1 ,2 9 2 1 ,2 1 5
15 to 26 weeks..................................................................................................... 706 478 933 716 680 * 651 665 63127 weeks and over .............................................................................................. 883 595 867 668 678 580 627 584
Average (mean) duration, in weeks.............................. ......................................... 1 3 .4 1 1 .0 1 3 .7 1 2 .3 1 2 .1 1 2 .0 1 1 .8 1 1 .2
Median duration, in weeks....................................................................................... 7 .1 6 .0 7 .2 5 .8 5 .2 5 .8 5 .9 * 6 .0
PERCENT DISTRIBUTION
Total unemployed ................................................................................................... 1 0 0 .0 1 0 0 .0 1 0 0 .0 1 0 0 .0 1 0 0 .0 1 0 0 .0 1 0 0 .0 1 0 0 .0Less than 5 weeks......... ....................................................................................... 4 0 .6 4 5 .5 4 1 .5 4 6 .8 4 8 .1 4 6 .4 4 9 .0 4 6 .85 to 14 weeks.............................. ......................................................................... 3 5 .9 3 6 .4 3 2 .4 2 9 .9 2 9 .6 3 2 .6 3 0 .0 3 3 .015 weeks and over .............................................................................................. 2 3 .5 1 8 .1 2 6 .1 2 3 .2 2 2 .3 2 1 .0 2 0 .9 2 0 .2
15 to 26 weeks .............................................................................................. 1 0 .4 8 .1 1 3 .5 1 2 .0 1 1 .2 1 1 .1 1 0 .8 1 0 .527 weeks and o v e r .................................. ...................................................... 1 3 .1 1 0 .0 1 2 .6 1 1 .2 1 1 .1 9 .9 1 0 .2 9 .7
Digitized for FRASER http://fraser.stlouisfed.org/ Federal Reserve Bank of St. Louis

HOUSEHOLD DATA HOUSEHOLD DATA
Table A -5 . Reasons for unem ploym ent
[Numbers in thousands]
ReasonsNot seasonally adjusted Seasonally adjusted
Aug.1977
Aug.1978
Aug.1977
Apr.1978
May1978
June1978
July1978
Aug.1978
NUMBER OF UNEMPLOYED
Lost last job .............................................................................................................. 2 ,8 7 1 2 ,2 9 3 3 ,1 9 7 2 ,4 7 5 2 ,5 7 7 2 ,3 4 0 2 ,5 5 2 2 ,5 5 3On layoff .................................................................... ......................................... 801 641 963 593 683 606 714 770Other job losers ................................................................................................ 2 ,0 7 0 1 ,6 5 2 2 ,2 3 4 1 ,8 8 2 1 ,8 9 4 1 ,7 3 4 1 ,8 3 8 1 ,7 8 3
Left last job ..............................................i ............................................................. 989 933 891 872 819 849 869 841Reentered labor force ................................ ............................................. ............. 1 ,8 5 5 1 ,7 1 7 1 ,8 7 2 1 ,7 3 4 1 ,7 7 2 1 ,7 6 0 1 ,8 8 3 1 ,7 3 3Seeking first job ........................................................................................... ......... 1 ,0 4 2 988 947 925 901 810 880 893
PERCENT DISTRIBUTION
Total unemployed ................ .......... ....................................................................* 1 0 0 .0 1 0 0 .0 1 0 0 .0 1 0 0 .0 1 0 0 .0 1 0 0 .0 1 0 0 .0 1 0 0 .0Job losers.............................................................................................................. 4 2 .5 3 8 .7 4 6 .3 4 1 .2 4 2 .5 4 0 .6 4 1 .3 4 2 .4
On layoff ....................................................................................................... 1 1 .9 1 0 .8 1 3 .9 9 .9 1 1 .3 1 0 .5 1 1 .5 12.8Other job losers.............................................................................................. 3 0 .6 2 7 .9 3 2 .3 3 1 .3 3 1 .2 3 0 .1 2 9 .7 2 9 .6
Job leavers ......................................................................................................... 1 4 .6 1 5 .7 1 2 .9 1 4 .5 1 3 .5 1 4 .7 1 4 .1 1 4 .0Reentrants ......................................................................................................... 2 7 .5 2 8 .9 2 7 .1 2 8 .9 2 9 .2 3 0 .6 3 0 .4 2 8 .8New entrants .....................................................................................•................ 1 5 .4 1 6 .7 1 3 .7 1 5 .4 1 4 .8 1 4 .1 1 4 .2 1 4 .8
UNEMPLOYED AS A PERCENT OF THECIVILIAN LABOR FORCE
Job losers .................................................................................................................. 2 .9 2.2 3 .3 2 .5 2.6 2 .3 2 .5 2 .5Job leavers ................................................................................................................ 1 .0 .9 .9 .9 .8 .8 .9 .8Reentrants ................................................................................................................ 1 .9 1 .7 1 .9 1 .7 1 .8 1 .8 1 .9 1 .7New entrants ....... ................................. .................................................................. 1 .1 1 .0 1 .0 .9 .9 .8 .9 .9
Table A>6. Unemployment by sex and ape, seasonally adjusted
Sex and age
Number of unemployed persons
(In thousands)Unemployment rates
Aug.1977
Aug.1978
A ug.1977
A p r .1978
May1978
June1978
J u ly1978
A ug .1978
Total, 16 years and over .......................................................................................... 6 ,8 2 1 5 ,9 6 8 7 .0 6 .0 6 .1 5 .7 6 *2 5 .916 to 19 years ..................................................................................................... 1 ,6 4 0 1 ,5 2 8 1 7 .3 1 6 .9 1 6 .5 1 4 .2 1 6 .3 1 5 .6
16 to 17 years ................................................................................................. 792 795 2 0 .1 1 9 .9 1 9 .3 1 6 .7 2 0 .1 1 8 .918 to 19 years ................................................................................................ 858 744 1 5 .5 1 4 .4 1 4 .5 1 2 .9 1 3 .6 1 3 .3
20 to 24 years ..................................................................................................... 1 ,6 2 0 1 ,3 3 8 1 1 .2 1 0 .0 9 .0 9 .2 9 .9 9 .025 years and o v e r ................................................................................................. 3 ,6 2 1 3 ,1 5 6 4 .9 3 .9 4 .2 3 .9 4 .2 4 .2
25 to 54 years ....................................................... ......................................... 3 ,0 7 4 2 ,7 2 3 5 .2 4 .1 4 .5 4 .1 4 .4 4 .455 years and over .......................................................................................... 555 441 3 .9 3 .2 3 .2 3 .1 3 .2 3 .0
Men, 16 years and over ..................................................................................... 3 ,5 3 3 2 ,9 2 6 6 .1 5 .2 5 .1 4 .7 5 .1 5 .016 to 19 years ................................................................................................. 875 755 1 7 .4 1 6 .6 1 5 .3 1 2 .6 1 5 .4 1 4 .7
16 to 17 years....................................................... .................................... 453 395 2 0 .8 1 9 .9 1 8 .4 1 6 .1 1 8 .8 1 7 .718 to 19 years............................................................................................ 424 362 1 4 .9 1 3 .4 1 2 .9 1 1 .3 1 3 .0 1 2 .4
20 to 24 years ................................................................................................. 902 705 1 1 .4 9 .1 7 .9 8 .1 8 .9 8 .725 years and over ..................................................................... ................ 1 ,8 2 9 1 ,5 2 9 4 .1 3 .3 3 .5 3 .1 3 .3 3 .4
25 to 54 years .......................................................................................... 1 ,5 1 8 1 ,2 7 8 4 .3 3 .3 3 .6 3 .2 3 .3 3 .555 years and over . . ...................*.......................................................... 312 256 3 .5 3 .3 3 .3 3 .0 3 .4 2 .9
Women, 16 years and over ................................................................................. 3 ,2 8 8 3 ,0 4 2 8 .2 7 .0 7 .5 7 .2 7 .7 7 .216 to 19 y ea rs .......................................................................................... .. 765 773 1 7 .2 1 7 .2 1 7 .9 1 6 .0 1 7 .4 1 6 .7
16 to 17 years............................................................................................ 339 400 1 9 .3 1 9 .9 2 0 .3 1 7 .4 2 1 .6 2 0 .318 to 19 years............................................................................................ 434 382 1 6 .2 1 5 .6 1 6 .1 1 4 .8 1 4 .4 1 4 .4
20 to 24 y ea rs .................................... ........................................................... 718 633 1 1 .0 1 1 .0 1 0 .3 1 0 .4 1 1 .0 9 .225 years and over ........................................................................................ . 1 ,7 9 2 1 ,6 2 7 6 .2 4 .8 5 .3 5 .2 5 .6 5 .3
25 to 54 years .......................................................................................... 1 ,5 5 6 1 ,4 4 5 6 .5 5 .2 5 .8 5 .6 6 .0 5 .855 years and over ...................................................................................... 243 185 4 .5 3 .0 3 .1 3 .1 2 .9 3 .3
Digitized for FRASER http://fraser.stlouisfed.org/ Federal Reserve Bank of St. Louis
HOUSEHOLD DATA HOUSEHOLD DATA
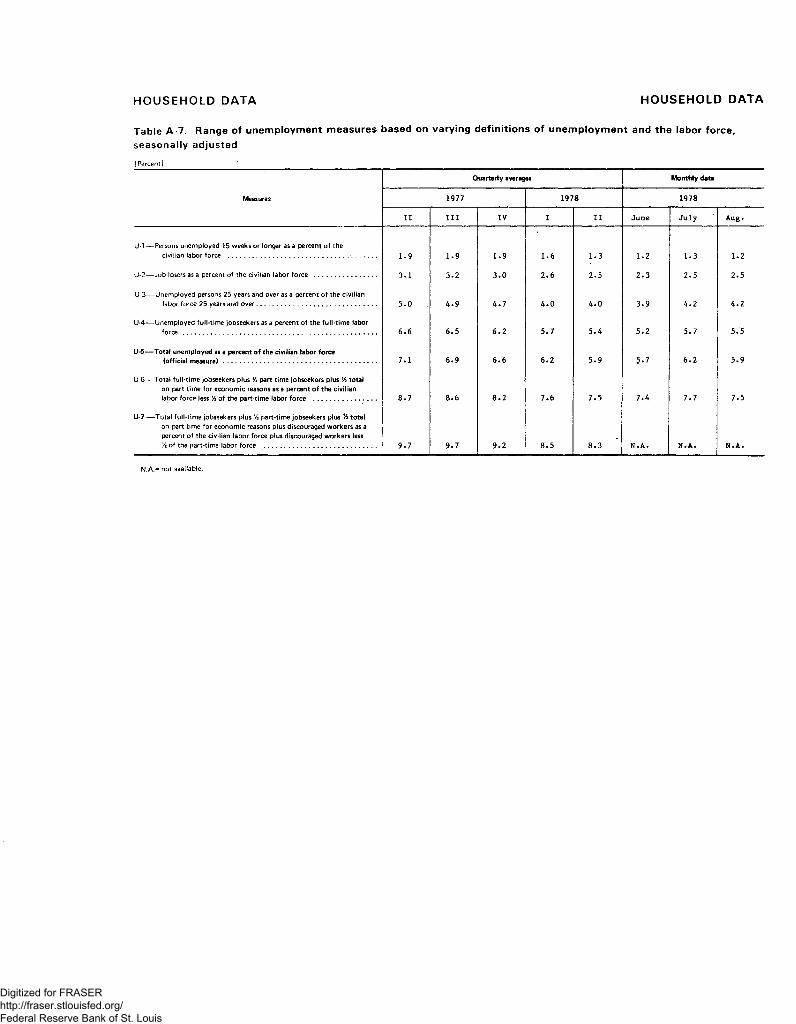
Table A-7. Range of unemployment measures based on varying definitions of unemployment and the labor force, seasonally adjusted
(Percent)
Quarterly averages Monthly data
Measures 1977 1978 1978
II III IV I II June J u ly A ug.
U-1— Persons unemployed 15 weeks or longer as a percent of thecivilian labor force ................................................................................... 1 .9 1 .9 1 .9 1 .6 1 .3 1 .2 1 .3 1 .2
U-2— Job losers as a percent of the civilian labor force ................................... 3 .1 3 .2 3 .0 2 .6 2 .5 2 .3 2 .5 2 .5
U-3— Unemployed persons 25 years and over as a percent of the civilianlabor force 25 years and over................................................................... 5 .0 A .9 A .7 A.O A.O 3 .9 A .2 A .2
U-4— Unemployed full-time jobseekers as a percent of the full-time laborforce ............................................................................................................ 6 .6 6 .5 6 .2 5 .7 5 . A 5 .2 5 .7 5 .5
U-5— Total unemployed as a percent of the civilian labor force(official measure)..................................................................................... 7 .1 6 .9 6 .6 6 .2 5 .9 5 .7 6 .2 5 .9
U-6— Total full-time jobseekers plus Vi part-time jobseekers plus Vi total on part time for economic reasons as a percent of the civilian labor force less Vi of the part-time labor force ................................... 8 .7 8 .6 8 .2 7 .6 7 .5 7 . A 7 .7 7 .5
U-7 — Total full-time jobseekers plus Vi part-time jobseekers plus % total on part time for economic reasons plus discouraged workers as a percent of the civilian labor force plus discouraged workers less Vi of the part-time labor force .............................................................. 9 .7 9 .7 9 .2 8 .5 8 .3 N .A . N .A . N .A .
N.A.= not available.
Digitized for FRASER http://fraser.stlouisfed.org/ Federal Reserve Bank of St. Louis
HOUSEHOLD DATA HOUSEHOLD DATA
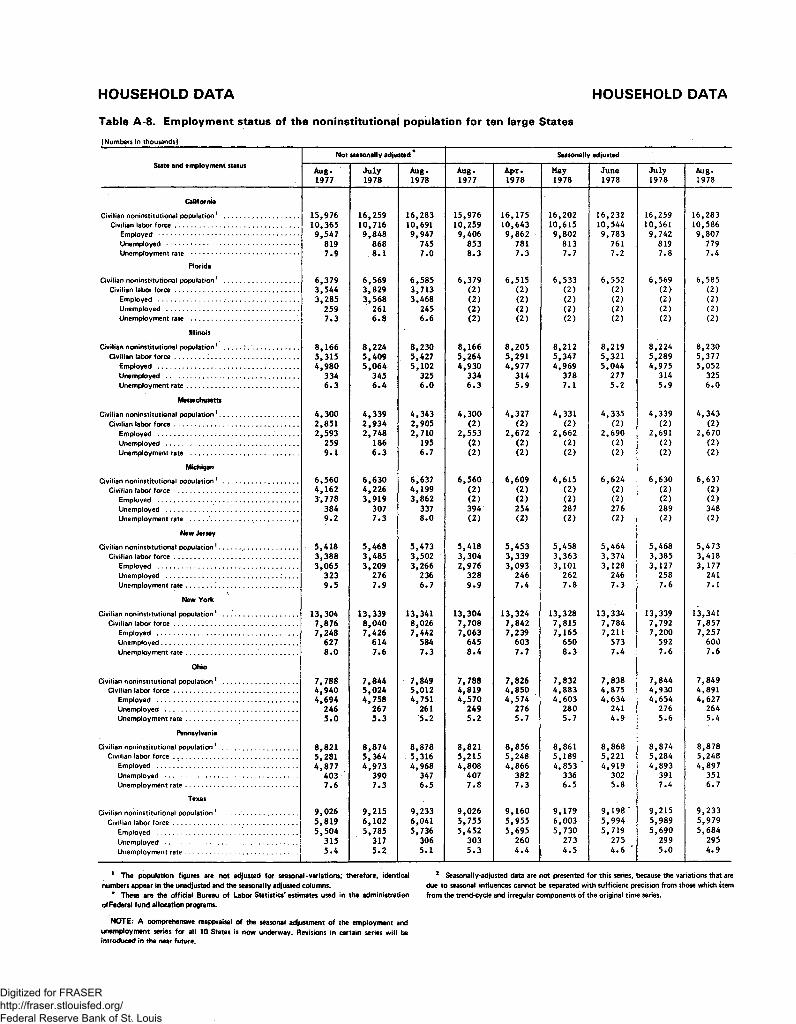
Table A-8. Employment status of the noninstitutional population for ten large States
(Numbers in thousands)
State and employment statusNot seasonally adjusted * Seasonally adjusted
A u g .1977
J u ly1978
A ug.1978
A u g .1977
Ap>r.1 97 8
May197 8
June1978
J u ly1978
Aug.1978
California
Civilian noninstitutional population1 ......................................... 1 5 ,9 7 6 1 6 ,2 5 9 1 6 ,2 8 3 1 5 ,9 7 6 1 6 ,1 7 5 1 6 ,2 0 2 1 6 ,2 3 2 1 6 ,2 5 9 1 6 ,2 8 3Civilian labor fo rce .................................................................... 1 0 ,3 6 5 1 0 ,7 1 6 1 0 ,6 9 1 1 0 ,2 5 9 1 0 ,6 4 3 1 0 ,6 1 5 1 0 ,5 4 4 1 0 ,5 6 1 1 0 ,5 8 6
Employed .............................................................................. 9 ,5 4 7 9 ,8 4 8 9 ,9 4 7 9 ,4 0 6 9 ,8 6 2 9 ,8 0 2 9 ,7 8 3 9 ,7 4 2 9 ,8 0 7Unemployed ......................................................................... 819 868 745 8 53 781 8 13 761 819 779Unemployment rate ............................................................ 7 .9 8 .1 7 .0 8 .3 7 .3 7 .7 7 .2 7 .8 7 .4
Florida
Civilian noninstitutional population1 .......................................... 6 ,3 7 9 6 ,5 6 9 6 ,5 8 5 6 ,3 7 9 6 ,5 1 5 6 ,5 3 3 6 ,5 5 2 6 ,5 6 9 6 ,5 8 5Civilian labor fo rc e ..................................................................... 3 ,5 4 4 3 ,8 2 9 3 ,7 1 3 ( 2 ) ( 2 ) ( 2 ) ( 2 ) (2 > (2 )
Employed .............................................................................. 3 ,2 8 5 3 ,5 6 8 3 ,4 6 8 ( 2 ) (2 ) (2 ) (2 ) (2 ) (2 )Unemployed ......................... ............................................ 259 261 245 ( 2 ) ( 2 ) ( 2 ) (2 ) (2 ) (2 )Unemployment rate ..................... .................................... 7 .3 6 .8 6 .6 ( 2 ) ( 2 ) ( 2 ) ( 2 ) (2 ) (2 )
Illinois
Civilian noninstitutional population1 ......... .......................... 8 ,1 6 6 8 ,2 2 4 8 ,2 3 0 8 ,1 6 6 8 ,2 0 5 8 ,2 1 2 8 ,2 1 9 8 ,2 2 4 8 ,2 3 0Civilian labor fo rc e ................ .................................................... 5 ,3 1 5 5 ,4 0 9 5 ,4 2 7 5 ,2 6 4 5 ,2 9 1 5 ,3 4 7 5 ,3 2 1 5 ,2 8 9 5 ,3 7 7
Employed ..................................................... ........................ 4 ,9 8 0 5 ,0 6 4 5 ,1 0 2 4 ,9 3 0 4 ,9 7 7 4 ,9 6 9 5 ,0 4 4 4 ,9 7 5 5 ,0 5 2Unemployed .......................................................................... 3 3 4 3 45 325 3 34 3 1 4 378 277 314 325Unemployment ra te .............................................................. 6 .3 6 .4 6 .0 6 .3 5 .9 7 .1 5 .2 5 .9 6 .0
Massachusetts
Civilian noninstitutional population1............................................ 4 ,3 0 0 4 ,3 3 9 4 ,3 4 3 4 ,3 0 0 4 ,3 2 7 4 ,3 3 1 4 ,3 3 5 4 ,3 3 9 4 ,3 4 3Civilian labor fo rc e ..................................................................... 2 ,8 5 1 2 ,9 3 4 2 ,9 0 5 ( 2 ) ( 2 ) ( 2 ) (2 ) ( 2 ) (2 )
Employed .............................................................. ................ 2 ,5 9 3 2 ,7 4 8 2 ,7 1 0 2 ,5 5 3 2 ,6 7 2 2 ,6 6 2 2 ,6 9 0 2 ,6 9 1 2 ,6 7 0Unemployed ....................................... .................................. 2 59 186 195 ( 2 ) ( 2 ) ( 2 ) ( 2 ) (2 ) (2 )Unemployment rate ..................................................... 9 .1 6 .3 6 .7 ( 2 ) ( 2 ) ( 2 ) ( 2 ) (2 ) (2 )
Michigan
Civilian noninstitutional population1 ......................................... 6 ,5 6 0 6 ,6 3 0 6 ,6 3 7 6 ,5 6 0 6 ,6 0 9 6 ,6 1 5 6 ,6 2 4 6 ,6 3 0 6 ,6 3 7Civilian labor force ................................................................... 4 ,1 6 2 4 ,2 2 6 4 ,1 9 9 ( 2 ) ( 2 ) ( 2 ) (2 ) ( 2 ) (2 )
Employed .............................................................................. 3 ,7 7 8 3 ,9 1 9 3 ,8 6 2 ( 2 ) ( 2 ) ( 2 ) (2 ) (2 ) ( 2 )Unemployed ......................................................................... 3 8 4 3 07 337 3 94 254 287 276 289 348Unemployment rate ......... .................................................. 9 .2 7 .3 8 .0 ( 2 ) ( 2 ) ( 2 ) (2 ) ( 2 ) (2 )
New Jersey
Civilian noninstitutional population1............................ ............ 5 ,4 1 8 5 ,4 6 8 5 ,4 7 3 5 ,4 1 8 5 ,4 5 3 5 ,4 5 8 5 ,4 6 4 5 ,4 6 8 5 ,4 7 3Civilian labor fo rc e ..................................................................... 3 ,3 8 8 3 ,4 8 5 3 ,5 0 2 3 ,3 0 4 3 ,3 3 9 3 ,3 6 3 3 ,3 7 4 3 ,3 8 5 3 ,4 1 8
Employed ....................................... ; .................................... 3 ,0 6 5 3 ,2 0 9 3 ,2 6 6 2 ,9 7 6 3 ,0 9 3 3 ,1 0 1 3 ,1 2 8 3 ,1 2 7 3 ,1 7 7Unemployed ..............................................................: . . . . 3 2 3 276 236 3 28 2 46 262 246 258 241Unemployment ra te .............. ............................................ 9 .5 7 .9 6 .7 9 .9 7 .4 7 .8 7 .3 7 .6 7 .1
New York
Civilian noninstitutional population1 ......................................... 1 3 ,3 0 4 1 3 ,3 3 9 1 3 ,3 4 1 1 3 ,3 0 4 1 3 ,3 2 4 1 3 ,3 2 8 1 3 ,3 3 4 1 3 ,3 3 9 1 3 ,3 4 1Civilian labor fo rc e ..................................................................... 7 ,8 7 6 8 ,0 4 0 8 ,0 2 6 7 ,7 0 8 7 ,8 4 2 7 ,8 1 5 7 ,7 8 4 7 ,7 9 2 7 ,8 5 7
Employed ....................................................... ....................... 7 ,2 4 8 7 ,4 2 6 7 ,4 4 2 7 ,0 6 3 7 ,2 3 9 7 ,1 6 5 7 ,2 1 1 7 ,2 0 0 7 ,2 5 7Unemployed............................................................................ 6 27 6 1 4 584 6 45 6 03 650 5 73 592 6 0 0Unemployment ra te ....................................... ...................... 8 .0 7 .6 7 .3 8 . 4 7 .7 8 .3 7 .4 7 .6 7 .6
Ohio
Civilian noninstitutional population1 ......................................... 7 ,7 8 8 7 ,8 4 4 7 ,8 4 9 7 ,7 8 8 7 ,8 2 6 7 ,8 3 2 7 ,8 3 8 7 ,8 4 4 7 ,8 4 9Civilian labor fo rc e ..................................................................... 4 ,9 4 0 5 ,0 2 4 5 ,0 1 2 4 ,8 1 9 4 ,8 5 0 4 ,8 8 3 4 ,8 7 5 4 ,9 3 0 4 ,8 9 1
Employed .............................................................................. 4 ,6 9 4 4 ,7 5 8 4 ,7 5 1 4 ,5 7 0 4 ,5 7 4 4 ,6 0 3 4 ,6 3 4 4 ,6 5 4 4 ,6 2 7Unemployed .......................................................................... 2 46 2 67 261 2 49 2 76 2 80 241 276 264Unemployment ra te .............................................................. 5 . 0 5 .3 *5 .2 5 .2 5 .7 5 .7 4 .9 5 .6 5 .4
Pennsylvania
Civilian noninstitutional population1 .......................................... 8 ,8 2 1 8 ,8 7 4 8 ,8 7 8 8 ,8 2 1 8 ,8 5 6 8 ,8 6 1 8 ,8 6 8 8 ,8 7 4 8 ,8 7 8Civilian labor fo rc e ..................................................................... 5 ,2 8 1 5 ,3 6 4 5 ,3 1 6 5 ,2 1 5 5 ,2 4 8 5 ,1 8 9 5 ,2 2 1 5 ,2 8 4 5 ,2 4 8
Employed .............................................................................. 4 ,8 7 7 4 ,9 7 3 4 ,9 6 8 4 ,8 0 8 4 ,8 6 6 4 ,8 5 3 * 4 ,9 1 9 4 ,8 9 3 4 ,8 9 7Unemployed ......................................................................... 4 03 390 347 4 0 7 3 82 336 302 391 351Unemployment ra te .............................................................. 7 .6 7 .3 6 .5 7 .8 7 .3 6 .5 5 .8 7 .4 6 .7
Texas
Civilian noninstitutional population1 ......... ................................ 9 ,0 2 6 9 ,2 1 5 9 ,2 3 3 9 ,0 2 6 9 ,1 6 0 9 ,1 7 9 9 ,1 9 8 * 9 ,2 1 5 9 ,2 3 3
Civilian labor fo rc e ..................................................................... 5 ,8 1 9 6 ,1 0 2 6 ,0 4 1 5 ,7 5 5 5 ,9 5 5 6 ,0 0 3 5 ,9 9 4 5 ,9 8 9 5 ,9 7 9
Employed .............................................................................. 5 ,5 0 4 5 ,7 8 5 5 ,7 3 6 5 ,4 5 2 5 ,6 9 5 5 ,7 3 0 5 ,7 1 9 5 ,6 9 0 5 ,6 8 4
Unemployed .......................................................................... 3 1 5 317 306 3 03 2 60 273 275 299 295
Unemployment ra te .............................................................. 5 .4 5 .2 5 .1 5 . 3 4 .4 l 4 - 5 4 .6 * 5 .0 4 .9
1 The population figures are not adjusted for seasonal*variations; therefore, identical 3 Seasonally-adjusted data are not presented for this series, because the variations that arenumbers appear in the unadjusted and the seasonally adjusted columns. due to seasonal influences cannot be separated with sufficient precision from those which stem
* These are the official Bureau of Labor Statistics'estimates used in the administration from the trend-cycle and irregular components of the original time series, of Federal fund allocation programs.
NOTE: A comprehensive reappraisal of the seasonal adjustment of the employment and unemployment series for all 10 States is now underway. Revisions in certain series will be introduced in the near future.
Digitized for FRASER http://fraser.stlouisfed.org/ Federal Reserve Bank of St. Louis

ESTABLISHMENT DATA ESTABLISHMENT DATA
Table B-1. Employees on nonagricultural payrolls, by industry
tin thousands)
Industry
Not seasonally adjusted Seasonally adjusted
AUG*1977
JUNE1978
JULY p 1978
AOG. p 1978
AUG.1977
APR.1978
HAY1978
JUNE1978
JULY1978
AUG. p 1978
TOTAL ..................................................... 8 2 ,3 9 7 86 ,642 8 5 ,7 9 6 86 ,0 9 5 82 ,474 85,-223 85 ,466 8 5 ,820 86 ,003 86 ,116
GOODS-PRODUCING .............................................. 2 4 ,8 0 0 2 5 ,906 2 5 ,795 2 6 ,1 1 2 24 ,305 25 ,351 25 ,429 25 ,554 25 ,614 25 ,548
MINING ................................................................ 833 928 936 939 818 898 903 912 919 922
CONTRACT CONSTRUCTION............................. 4 ,2 0 4 4 ,5 3 4 4 ,6 42 4 ,7 04 3 ,8 9 3 4 ,2 37 4 ,2 6 8 4 ,3 5 5 4 ,3 /9 4 ,356
MANUFACTURING.............................................. 19 ,763 2 0 ,4 4 4 2 0 ,2 1 7 2 0 ,4 6 9 19 ,594 20 ,216 2 0 ,258 2 0 ,287 20 ,316 20 ,270Production workers ........................................... 1 4 ,2 1 7 14 ,751 14 ,498 1 4 ,734 14 ,078 14 ,588 14 ,614 14 ,616 14,611 14,560
DURABLE GOODS .............................................................. 11 ,522 12 ,168 12 ,056 12 ,139 11,527 11,992 12 ,029 12 ,049 12 ,110 12 ,115Production w orkers............................................. 8 ,2 3 0 8 ,7 58 8 ,6 2 0 8 ,6 96 8 ,2 52 8 ,6 32 8 ,6 5 3 8 ,6 5 4 8 ,6 82 8,682
Ordnance and accessories ................................................ 155*9 15 8 .6 159 .8 161.3 156 157 158 159 160 161Lumber and wood products ............................................ 666*7 6 9 2 .8 6 8 9 .7 6 9 6 .6 642 669 672 670 670 671Furniture and fixtures................................ ...................... 51 3 .2 53 6 .5 52 3 .3 541 .4 508 538 537 535 538 536Stone, clay, and glass products................................ 6 7 3 .5 7 0 4 .2 7 0 3 .2 7 0 1 .4 656 687 689 690 689 683Primary metal industries.................................................. 1 ,2 0 6 *3 1 ,2 3 8 .5 1 ,2 2 9 .8 1 ,2 2 9 .7 1 ,202 1 ,216 1 ,2 24 1 ,2 23 1 ,222 1,225Fabricated metal products ....... ...................................... 1 ,4 6 4 .0 1 ,5 3 6 .3 1 ,5 1 3 .7 1 ,5 2 2 .3 1 ,4 60 1 ,5 20 1 ,5 24 1 ,5 24 1 ,5 29 1,51VMachinery, except electrical ................................ ........... 2 ,1 9 2 .7 2 ,3 4 6 .8 2 ,3 4 0 .6 2 ,3 5 4 .6 2 ,2 1 0 2 ,3 11 2 ,3 1 9 2 ,3 35 2 ,3 62 2 ,3 74Electrical equipment..................................................... .... 1 ,9 4 7 .2 2 ,0 6 4 .0 2 ,0 5 4 .3 2 ,0 8 4 .9 1 ,951 2 ,0 41 2 ,0 4 5 2 ,0 5 6 2 ,0 83 2 ,0 89Transportation equipment................................................ 1 ,7 4 9 .4 1 ,9 0 1 .1 1 ,8 7 4 .8 1 ,8 6 3 .0 1 ,802 1 ,8 76 1 ,8 82 1 ,8 75 1 ,8 83 1 ,887Instruments and related products................................... 5 2 7 .6 55 8 .5 5 5 4 .7 554 .8 526 548 551 555 556 553Miscellaneous, manufacturing.............................. ............. 4 2 5 .8 4 3 0 .4 4 1 1 .8 4 2 8 .2 414 429 428 42 7 418 417
NONDURABLE GOODS ............ ..................................... 8 ,2 41 8 ,2 76 8 ,1 61 8 ,3 30 8 ,0 6 7 8 ,2 2 4 8 ,2 2 9 8 ,2 38 8 ,2 0 6 8,155Production workers ........................................... 5 ,9 8 7 5 ,9 93 5 ,8 78 6 ,0 3 8 5 ,8 2 * 5 ,9 56 5 ,9 61 5 ,9 62 5 ,9 29 5 ,878
Food and kindred products ..................................... 1, 8 3 0 .0 1 ,7 2 4 .8 1 ,7 5 2 .6 1 ,8 2 2 .6 1 ,7 10 1 ,7 40 1 ,731 1 ,733 1 ,7 23 1,703Tobacco manufacturers..................................................... 7 3 .7 6 2 .5 6 2 .7 6 7 .9 68 68 69 70 69 62Textile mill products ....................................................... 9 9 0 .0 1 ,0 0 3 .5 9 7 9 .5 1 ,0 0 0 .4 982 991 995 994 998 992Apparel and other textile products................................ 1 ,2 9 5 .2 1 ,3 1 4 .6 1 ,2 4 0 .6 1 ,2 8 9 .3 1 ,2 86 1 ,3 03 1 ,2 99 1 ,2 9 9 1 ,2 83 1 ,2 80Paper and allied products ................................................ 7 1 1 .0 7 3 0 .0 724.0 7 2 2 .4 704 718 722 723 725 715Printing and publishing..................................................... 1 ,1 1 2 .0 1 ,1 5 0 .1 1 ,1 4 5 .2 1 ,1 5 2 .5 1 ,1 14 1 ,137 1 ,141 1 ,1 5 0 1 ,1 5 0 1 ,155Chemicals and allied products------* ............................... 1 ,0 7 0 .6 1 ,0 8 5 .1 1 ,0 8 4 .4 1 ,0 8 6 .7 1 ,0 61 1 ,0 7 4 1 ,0 8 0 1 ,0 7 9 1 ,0 79 1 ,0 77Petroleum and coal products ......................................... 2 1 5 .0 2 1 9 .2 2 2 0 .0 2 2 0 .4 210 216 215 215 214 215Rubber and plastics products, nec................................... 6 7 8 .3 7 1 4 .4 7 0 2 .2 705.2 671 713 712 710 710 6*98Leather and leather products ......................................... 2 6 5 .6 2 7 2 .0 24 9 .3 26 2 .8 261 264 265 265 255 258
SERVICE-PRODUCING............................................. 5 7 ,5 9 7 6 0 ,7 3 6 6 0 ,0 0 1 5 9 ,983 58 ,169 59 ,872 6 0 ,0 3 7 6 0 ,2 6 6 6 0 ,3 8 9 6 0 ,568
TRANSPORTATION AND PUBLICUTILITIES......................................................... 4 ,6 0 4 4 ,7 7 1 4 ,7 2 9 4 ,7 5 4 4 ,5 8 1 4 ,7 0 9 4 ,7 1 4 4 ,7 2 8 4 ,6 9 6 4 ,7 3 0
WHOLESALE AND RETAIL TRADE ................... 18 ,352 19 ,145 19 ,109 1 9 ,179 18 ,377 18,891 18 ,967 1 9 ,064 19 ,126 19 ,205
WHOLESALE TRADE .............................................. 4 ,4 2 9 4 ,6 0 4 4 ,6 0 2 4 ,6 21 4 ,3 9 8 4 ,5 55 4 ,5 6 8 4 ,5 81 4 ,5 7 5 4 ,5 89RETAIL T R A D E ..................................................................... 1 3 ,923 14 ,541 1 4 ,5 0 7 1 4 ,5 5 8 13 ,979 14 ,336 1 4 ,3 9 9 1 4 ,483 14 ,551 14 ,616
FINANCE, INSURANCE, AND REAL ESTATE .. 4 ,5 7 8 4 ,7 80 4 ,8 1 6 4 ,8 31 4 ,5 2 4 4 ,683 4 ,7 1 2 4 ,7 3 7 4 ,7 5 4 4 ,7 7 4
SERVICES ............................................................ 1 5 ,587 16 ,2 3 9 16 ,331 1 6 ,358 15 ,448 15 ,962 1 5 ,970 16 ,031 16 ,153 16 ,212
GOVERNMENT ............................................. 1 4 ,4 7 6 15 ,801 1 5 ,016 14 ,861 15 ,239 15 ,627 1 5 ,674 15 ,706 15 ,660 15 ,647
FEDERAL ............................................................................ 2 ,7 5 7 2,*802 2 ,8 1 5 2 ,7 9 4 2 ,7 3 2 2 ,7 4 4 2 ,7 5 3 2 ,7 72 2 ,7 6 3 2 ,7 69STATE AND LOCAL ............ 1 1 ,7 1 9 12 ,999 12 ,201 1 2 ,0 6 7 1 2 ,507 12 ,883 12 ,921 1 2 ,9 3 4 12 ,897 12 ,878 '
^preliminary.
Digitized for FRASER http://fraser.stlouisfed.org/ Federal Reserve Bank of St. Louis

ESTABLISHMENT DATA ESTABLISHMENT DATA
Table B-2. Average weekly hours of production or nonsupervisory workers, on private n6nagricultural payrolls, by industry
Not seasonally adjusted Seasonally adjusted
IndustryAUG. JUN2 JULY AUG. AUG. APR. MAY JUNE JULY A U G .1 9 7 7 1 9 7 8 1 9 7 8 p 1 9 7 8 P 1 9 7 7 1 9 7 8 1 9 7 8 1 9 7 8 1 9 7 8 P 1 9 7 8 p
TOTAL PRIVATE.................................... 3 6 . 5 3 6 . 3 3 6 . 5 3 6 . 4 3 6 . 0 3 6 . 3 3 6 . 0 3 6 . 1 3 6 . 0 3 5 . 9
M INING.................................................................. 4 4 . 2 4 4 . i 4 3 . 3 4 3 . 3 4 4 . 2 4 4 . 3 4 3 . 9 4 3 . 6 4 3 . 2 4 3 . 3
CONTRACT CONSTRUCTION............................... 3 7 . 4 3 7 . 9 3 8 . 3 3 7 . 9 3 6 . 5 3 7 . 4 3 6 . 7 3 7 . 3 2 7 . 4 3 6 . 5
MANUFACTURING................................................ 4 0 . 3 4 0 . 7 4 0 . 2 4 0 . 3 4 0 . 3 4 0 . 6 4 0 . 3 4 0 . 4 4 0 . 4 4 0 . 33 . 5 3 . 5 3 . 5 3 . 6 3 . 3 3 . 6 3 . 5 3 . 5 1 . c -> c
DURABLE G O O D S .................................................................. 40 . a 4 1 . 4 4 0 . 8 4 0 . 8 4 0 . 9 4 1 . 2 4 0 . 9 4 1 . 1 4 1 . 1 4 0 . 4
3 . 6 3 . 8 3 . 7 3 . 8 3 . 5 3 . 9 3 . 7 3 . 7 3 . 8 3 . 7
3 9 . 8 4 1 . 1 4 0 . 1 4 0 . 6 4 0 . 2 4 0 . 3 4 0 . 7 4 0 . 9 4 C . 4 4 1 . 0
4 0 . i 4 0 . 8 4 0 . 0 4 0 . 2 3 9 . 6 3 9 . 9 3 9 . 4 4 0 . 0 4 0 . 2 ? 9 . 7
Furniture and fix tures ......................................................... 3 9 . 5 3 9 . 7 3 9 . 0 3 9 . 5 3 9 . 0 3 9 . 8 3 9 . 4 3 9 . 3 3 9 . 4 3 9 . 0
Stone, clay, and glass products .......................................... 4 1 . 8 4 2 . 3 4 2 . 1 4 1 . 9 4 1 . 4 4 2 . 1 4 1 . 6 4 1 . 9 4 1 . 5 4 1 . 5
Primary metal industries ..................................................... 4 0 . 8 4 2 . 0 4 1 . 9 4 1 . 5 4 1 . 0 4 1 . 4 4 1 . 6 4 1 . 7 4 2 . 0 4 1 . 7
Fabricated metal products ................................................ 4 1 . 0 4 1 . 4 4 0 . 5 4 0 . 9 4 0 . 9 4 1 . 4 4 1 . 0 4 1 . 1 4 0 . 5 4 0 . 8
Machinery, except electrical .............................................. 4 1 . 5 4 2 . 2 4 1 . 2 4 1 . 6 4 1 . 8 4 2 . 2 4 2 . 0 4 2 . 3 4 1 . 5 4 1 . 5
Electrical equipm ent............................................................ 4 0 . 2 4 0 . 4 3 9 . 9 4 0 . 0 4 0 . 3 4 0 . 3 4 0 . 1 4 0 . 2 4 0 . 5 4 0 . 1
Transportation equipment ................................................ 4 1 . 4 4 2 . 1 4 1 . 7 4 0 . 9 4 2 . 3 4 1 . 9 4 1 . 4 4 1 . 7 4 1 . 5 4 1 . 8
Instruments and related products ..................................... 4 0 . 1 4 0 . 8 4 0 . 2 4 0 . 1 4 0 . 3 4 1 . 2 4 0 . 7 4 0 . 8 4 0 . 6 4 0 . 3
Miscellaneous manufacturing.............................................. 3 8 . 8 3 9 . 1 3 8 . 4 3 8 . 6 3 6 . 8 3 9 . 3 3 8 . 9 3 9 . 0 3 8 . 8 3 8 . fc
NONDURABLE G O O D S.......................................................... 3 9 . 5 3 9 . 7 3 9 . 5 3 9 . 6 3 9 . 3 3 9 . 8 3 9 . 5 3 5 . 5 3 5 . 4 3 9 . 3
Overtime hours ..................................................................... 3 . 3 3 . 2 3 2 3 . 4 3 . 1 3 . 4 3 . 2 3 . 1 3 . 1 3 . 2
Food and kindred products................................................ 4 0 . 3 3 9 . 7 4 0 . 0 4 0 . 1 3 9 . 7 4 0 . 0 3 9 . 8 3 5 . 6 3 9 . 7 3 9 . 5
Tobacco manufacturers....................................................... 3 8 . 1 4 0 . 7 3 6 . 5 3 7 . 1 3 7 . 8 3 8 . 9 3 9 . 0 4 0 . 5 3 9 . 0 3 fc • 8
Textile mill products ......................................................... 4 0 . 4 4 0 . 7 4 0 . ) 4 0 . 3 4 0 . ' 2 4 0 . 7 4 0 . 3 4 0 . 1 4 0 . 0 4 0 . 1
Apparel and other textile products ................................... 3 5 . 6 3 6 . 1 3 5 . 9 3 5 . 9 3 5 . 5 3 6 . 1 3 5 . 8 3 5 . 9 3 5 . 6 3 5 . 6
Paper and allied products..................................................... 4 2 . 7 4 3 . 2 4 2 . 8 4 3 . 0 4 2 . 4 4 3 . 4 4 2 . 9 4 3 . 0 4 2 . 8 4 2 . 7
Printing and publishing ....................................... ............... 3 7 . 9 3 7 . 5 3 7 . 6 3 8 . 0 3 7 . 7 3 3 . 1 3 7 . 4 2 7 . 5 3 7 . 7 3 7 . 8
Chemicals and allied products ............................................ 4 1 . 6 4 2 . 0 4 1 . 6 4 1 . 5 4 1 . 8 4 1 . 9 4 1 . 8 4 1 . 9 4 1 . 7 4 1 . 7
Petroleum and coal products.............................. .. 4 2 . 7 4 3 . 9 4 4 . 4 4 3 . 4 4 3 . 0 4 3 . 8 4 3 . 5 4 3 . 8 4 3 . 9 4 3 . 7
Rubber and plastics products, n e c ..................................... 4 0 . 7 4 1 . 0 4 0 . 4 4 0 . 8 4 0 . 8 4 1 . 0 4 0 . 8 4 0 . 9 4 0 . 6 4 0 . 9
Leather and leather products . ............................................ 3 7 . 4 3 8 . 4 3 7 . 6 3 7 . 6 3 7 . 3 3 8 . 3 3 7 . 7 3 7 . 6 3 7 . 2 3 7 . * '
TRANSPORTATION AND PUBLIC4 0 . C - 4 0 . 0UTILITIES....................................................... 4 0 . 4 4 0 . 3 4 0 . 4 4 0 . 4 4 0 . 0 4 0 . 1 4 0 . 3 4 0 . 1
WHOLESALE AND RETAIL TRADE................. 3 4 . 0 3 3 . 4 3 3 . 8 3 3 . 6 3 3 . 2 3 3 . 1 3 3 . 0 3 3 . 0 3 3 . 0 3 2 . 4
WHOLESALE TRADE ....................................................... 3 8 . 9 3 9 . 1 3 9 . 2 3 9 . 1 3 8 . 8 . 3 9 . 0 3 8 . 9 3 9 . 0 3 9 . 0 3 9 . 0
RETAIL TRADE ................................................................. 3 2 . 6 3 1 . 7 3 2 . 3 3 2 . 1 3 1 . 6 3 1 . 4 3 1 . 3 3 1 . 3 3 1 . 3 3 1 . 1
FINANCE, INSURANCE, AND3 6 . 7 3 6 . 6REAL ESTATE ............................................... 3 6 . 8 3 6 . 5 3 6 . 8 3 6 . 7 3 6 . 7 3 6 . 8 3 6 . 5 3 6 . 5
SERVICES .............. .................................... 3 3 . 7 3 3 . 5 3 3 . 8 3 3 . 8 3 3 . 2 3 3 . 4 3 3 . 2 3 3 . 3 3 3 . 2 3 3 . 3
1 Data relate to production workers in mining and manufacturing: to construction workers in contract construction: and to nonsupervisory workers in transportation and public utilities; wholesale and retail trade; finance, insurance, and real estate; and services. These groups account for approximately four-fifths of the total employment on private nonagricultural payrolls.
p= preliminary.
Digitized for FRASER http://fraser.stlouisfed.org/ Federal Reserve Bank of St. Louis
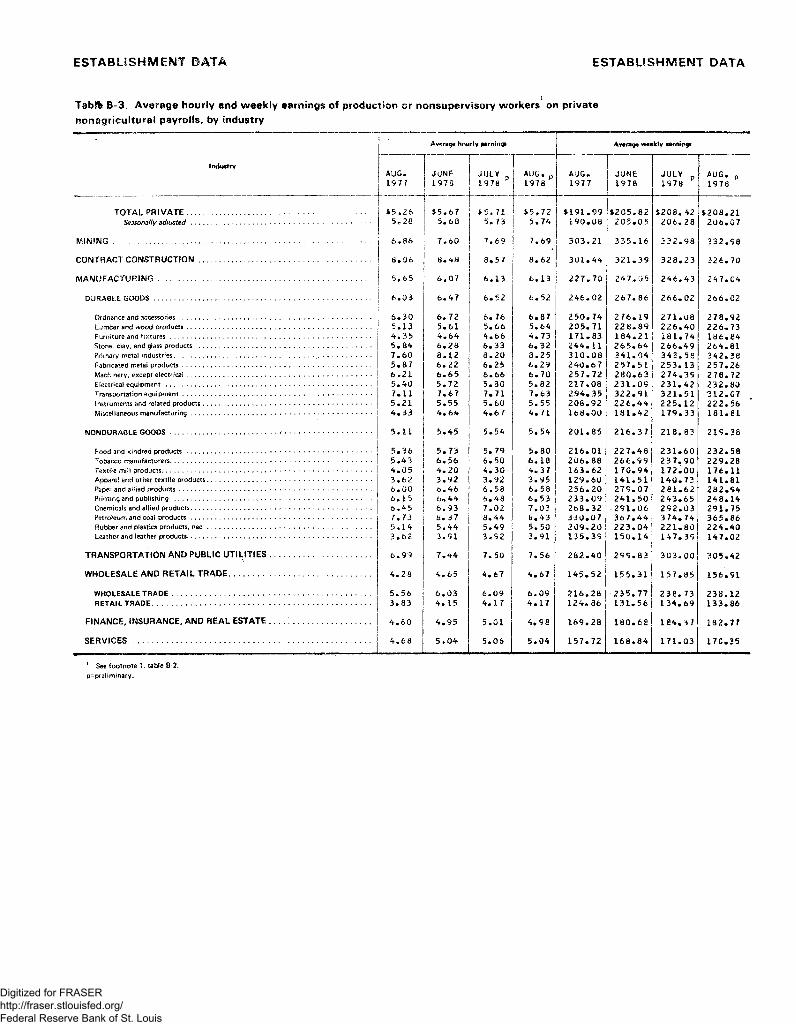
ESTABLISHMENT BATA ESTABLISHMENT DATA
Tabfc B -3 A ve rag e hourly and w e ek ly ea rn ing s of production or no n supe rv iso ry w orke rs on private
nonagricu itu ra l payrolls, by industry
Industry
Average hourly earnings Avenge weekly earnings
AUG -1 9 7 7
JUNE1 9 7 8
J U L V1 9 7 8
A U G . p 1 9 7 8
A U G .1 9 7 7
JU N E1 9 7 8
J U L Y1 9 7 8
A U G . p 1 9 7 8
T O T A L P R IV A T E ......................................... ............................... 4 5 - 2 6 $ 5 . 6 7 $ 5 . 7 1 $ 5 , 7 2 $ 1 9 1 . 9 9 $ 2 0 5 , 8 2 $ 2 0 8 . 4 2 $ 2 0 8 . 2 1Seasonally adjusted ................................ ................................................................ 5 * 2 8 5 . 6 8 5 , 73 5 . 7 4 1 9 0 . 0 8 2 0 5 . 0 5 2 0 6 . 2 8 2 0 6 . 0 7
M I N I N G .......................................................................................................... . .............................. 6 , 8 6 7 . 6 0 7 . 6 9 7 . 6 9 3 0 3 . 2 1 3 3 5 . 1 6 3 3 2 . 9 8 3 3 2 . 9 8
C O N T R A C T C O N S T R U C T IO N ............................................................................................... 8 . 0 6 8 . 4 8 8 , 5 7 8 . 6 2 3 0 1 . 4 4 3 2 1 . 3 9 3 2 8 . 2 3 3 2 6 . 7 0
M A N U F A C T U R IN G ....................................... .............................................................................. 5 . 6 5 6 . 0 7 6 . 1 3 6 . 1 3 2 2 7 . 7 0 2 4 7 , 0 5 2 4 6 . 4 3 2 4 7 . 0 4
DURA81 E GOODS .................................................................................................................... 6 , 0 3 6 . 4 7 6 * 5 2 6 . 5 2 2 4 6 . 0 2 2 6 7 . 8 6 2 6 6 . 0 2 2 6 6 . 0 2
Ordnance and accessories........................................................................................................... 6 . 3 0 6 . 7 2 6 . 7 6 6 . 8 7 2 5 0 . 7 4 2 7 6 . 1 9 2 7 1 . 0 8 2 7 8 . 9 2Lumber and wood products....................................................................................................... 5 . 1 3 5 . 6 1 5 . 6 6 5 . 6 4 2 0 5 . 7 1 2 2 8 . 8 9 2 2 6 . 4 0 2 2 6 . 7 3Furniture and fix tures ................................................................................................................ 4 . 3 5 4 . 6 4 4 . 6 6 4 . 7 3 1 7 1 . 8 3 1 8 4 . 2 1 1 8 1 . 7 4 1 8 6 . 8 4Stone., clay, and glass products ................................................................................................ 5 . 8 4 6 . 2 8 6 . 3 3 6 . 3 2 2 4 4 . 1 1 2 6 5 . 6 4 2 6 6 . 4 9 2 6 4 . 8 1Primary metal industries......... ................................................................... ............................... 7 . 6 0 8 . 1 2 8 . 2 0 8 . 2 5 3 1 0 . 0 8 3 4 1 . 0 4 3 4 2 . 5 8 3 4 2 . 2 8Fabricated metai products......... .................................................. , .......................................... 5 . 8 7 6 . 2 2 6 . 2 5 6 . 2 9 2 4 0 . 6 7 2 5 7 . 5 1 2 5 3 . 1 3 2 5 7 . 2 6Machinery, except electrical...................................................................................................... 6 . 2 1 6 . 6 5 6 . 6 6 6 . 7 0 2 5 7 . 7 2 2 8 0 . 6 3 2 7 4 . 3 9 2 7 8 . 7 2Electrical equipment ....................................... ........................................................................... 5 . 4 0 5 . 7 2 5 . 3 0 5 . 8 2 2 1 7 . 0 8 2 3 1 . 0 9 2 3 1 . 4 2 2 3 2 . 8 0Transportation equipment ......................................................................................................... 7 . 1 1 7 . 6 7 7 . 7 1 7 . 6 3 2 9 4 . 3 5 3 2 2 . 9 1 3 2 1 . 5 1 3 1 2 . 0 7Instruments and related products.............................................................................................. 5 . 2 1 5 . 5 5 5 . 6 0 5 . 5 5 2 0 8 . 9 2 2 2 6 . 4 4 2 2 5 . 1 2 2 2 2 . 5 6Miscellaneous manufacturing................................................................................................... l 4 . 3 3 4 . 6 4 4 . 6 7 4 . 7 1 1 6 8 . 0 0 1 8 1 . 4 2 1 7 9 . 3 3 1 8 1 . 8 1
NONDURABLE G O O D S .................................................................................... ......................... 5 . 1 1 5 . 4 5 5 . 5 4 5 . 5 4 2 0 1 . 8 5 2 1 6 . 3 7 2 1 8 . 8 3 2 1 9 . 3 8
Food and kindred products.................................................................... .................................. 5 . 3 6 5 . 7 3 5 . 7 9 5 . 8 0 2 1 6 . 0 1 2 2 7 . 4 8 2 3 1 . 6 0 2 3 2 . 5 8Tobacco manufacturers......... ..................................................................................................... 5 . 4 3 6 . 5 6 6 . 5 0 6 . 1 8 2 0 6 . 8 8 2 6 6 . 9 9 2 3 7 . 9 0 2 2 9 . 2 8Textile mill products.................................................................................................................... 4 . 0 5 4 . 2 0 4 . 3 0 4 . 3 7 1 6 3 . 6 2 1 7 0 . 9 4 1 7 2 . 0 0 1 7 6 . 1 1Apparel and other textile products................................ .......................................................... 3 . 6 2 3 . 9 2 3 . 9 2 3 . 9 5 1 2 9 . 6 0 1 4 1 . 5 1 1 4 0 . 7 3 1 4 1 . 8 1Paper and allied products........................................................................................................... 6 . 0 0 6 . 4 6 6 . 5 8 6 . 5 8 2 5 6 . 2 0 2 7 9 . 0 7 2 8 1 . 6 2 2 8 2 . 9 4Printing and publishing ............................................................................................................. 6 . 1 5 6 . 4 4 6 . 4 8 6 . 5 3 2 3 3 . G9 2 4 1 . 5 0 2 4 3 . 6 5 2 4 8 . 1 4Chemicals and allied products.................................................................................................... 6 . 4 5 6 . 9 3 7 . 0 2 7 . 0 3 2 6 8 . 3 2 2 9 1 . 0 6 2 9 2 . 0 3 2 9 1 . 7 5Petroleum and coal products....................................................... ............................................ 7 . 73 6 . 3 7 8 . 4 4 8 . 4 3 3 3 0 . 0 7 3 6 7 . 4 4 3 7 4 . 7 4 3 6 5 . 8 6Rubber and plastics products, n e c ........................................................................................... 5 , 1 4 5 . 4 4 5 . 4 9 5 . 5 0 2 0 9 . 2 0 2 2 3 . 0 4 2 2 1 . 8 0 2 2 4 . 4 0Leather and leather products..................................................................................................... 3 , 6 2 3 . 9 1 3 . 9 2 3 . 9 1 1 3 5 . 3 9 1 5 0 . 1 4 1 4 7 . 3 9 1 4 7 . 0 2
T R A N S P O R T A T IO N A N D P U B L IC U T IL IT IE S ........................................................ 6 . 9 9 7 . 4 4 7 . 5 0 7 . 5 6 2 8 2 . 4 0 2 9 9 . 8 3 3 0 3 . 0 0 3 0 5 . 4 2
W H O L E S A L E A N D R E T A IL T R A D E ............................................................................... 4 . 2 8 4 . 6 5 4 . 6 7 4 . 6 7 1 4 5 . 5 2 1 5 5 . 3 1 1 5 7 . 8 5 1 5 6 . 9 1
WHOLESALE T R A D E ............. ........................................................................... .................... 5 . 5 6 6 . 0 3 6 . 0 9 6 . 0 9 2 1 6 . 2 8 2 3 5 . 7 7 2 3 8 . 7 3 2 3 8 . 1 2RETAIL TR A D E ......................................................................................................................... 3 . 8 3 4 . 1 5 4 . 1 7 4 . 1 7 1 2 4 . 8 6 1 3 1 . 5 6 1 3 4 . 6 9 1 3 3 . 8 6
F IN A N C E , IN S U R A N C E , A N D R E A L ESTATE...... ................................ 4 . 6 0 4 . 9 5 5 . 0 1 4 . 9 8 1 6 9 . 2 8 1 8 0 . 6 8 1 8 4 . 3 7 1 8 2 . 7 7
S E R V IC E S .................................................................................................................................... 4 . 6 8 5 . 0 4 5 . 0 6 5 . 0 4 1 5 7 . 7 2 1 6 8 . 8 4 1 7 1 . 0 3 1 7 C . 3 5
1 See footnote 1. table 8-2. p~ preliminary.
Digitized for FRASER http://fraser.stlouisfed.org/ Federal Reserve Bank of St. Louis

ESTABLISHMENT DATA ESTABLISHMENT DATA
Table B-4. Hourly earnings index for production or nonsupervisory workers1 on private nonagricultural payrolls, by industry division, seasonally adjusted[1967* 100]
Industry AUG.1 9 7 7
MAR.1 9 7 8
AP R .1 9 7 8
MAY1 9 7 8
JUNE1 9 7 8
JULY P 1 9 7 8
AUG . P 1 9 7 8
Percent change from
AUG . 1 9 7 7 - AUG. 1 9 7 8
JULY 1 9 7 8 - AUG . 1 9 7 8
TO TAL PR IVA TE NON FARM:
Current dollars............... ............................................. 1 9 9 .9 2 1 0 . 2 2 1 2 . 1 2 1 2 . 8 2 1 3 . 9 2 1 5 . 8 2 1 6 .1 8 . 1 0 . 1Constant (1967) dollars........... .................................. 1 0 9 .2 1 1 0 . 5 1 1 0 . 6 1 0 9 . 9 1 0 9 .5 1 1 0 . 0 N .A . ( 2 ) ( 3 )
MINING ............................................................................ 2 1 7 . 4 2 2 5 . 3 2 3 5 . 6 2 3 6 . 5 2 3 9 . 2 2 4 2 . 8 2 4 3 . 9 1 2 . 2 . 5CONTRACT CONSTRUCTION........................................ 1 9 5 .8 2 0 3 . 8 2 0 4 . 2 2 0 6 . 2 2 C 7 .7 2 0 9 . 2 2 0 9 . 6 7 . 0 . 2MANUFACTURING ............................................. ......... 2 0 1 .2 2 1 0 . 9 2 1 2 .1 2 1 3 . 3 2 1 4 . 8 2 1 6 . 6 2 1 7 . 3 8 . 0 . 3TRANSPORTATION AND PUBLIC U TILITIES ............. 2 1 2 .3 2 2 5 . 0 2 2 8 . 2 2 2 8 . 3 2 2 9 . 0 2 3 0 . 1 2 2 9 . 2 7 . 9 - . 4WHOLESALE AND RETAIL TRADE.............................. 1 9 3 .3 2 0 4 . 8 2 0 7 . 1 2 0 7 . 2 2 C 8 .4 2 1 0 . 6 2 1 0 .9 9 . 1 . 1FINANCE, INSURANCE, AND REAL ESTATE ........... 1 8 0 .6 I 8 ! i . 5 1 9 1 .5 1 9 1 .6 1 9 3 .7 1 9 6 .3 1 9 5 .5 8 . 2 • - . 4SERVICES ........................................................................ 2 0 4 .8 2 1 5 . 7 2 1 7 . 4 2 1 7 . 5 2 1 7 . 5 219.7? 2 2 0 . 2 7 . 5 • 2
* See footnote 1, table B-2.? PERCENT CHANGE WAS . 6 FROM JULY 1 9 7 7 TO JULY 1 9 7 8 , THE LATEST MONTH A V A IL A B L E .* PERCENT CHANGE WAS . 4 FROM JUNE 1 9 7 8 TO JULY 1 9 7 8 , THE LATEST MONTH A V A IL A B L E .
N.A. = not available: p=preliminary.
NOTE: All series are in current dollars except where indicated. The index excludes effects of two types of changes that are unrelated to underlying wage-rate developments: Fluctuations in overtime premiums in manufacturing (the only sector for which overtime data are available) and the effects of changes in the proportion of workers in high-wage and low-wage industries.
Table B-5. Indexes of aggregate weekly hours of production or nonsupervisory workers,1 on private nonagricultural payrolls, by industry, seasonally adjusted[1967* 100]
1977 1978
Industry ctivision and group
AUG. S E P T . O C T . NQ V. D E C . J A N . F E B . MAR. A P R . MAY JUNE JULY P AUG.
TOTAL PRIVATE............................. 1 1 5 .6 1 1 5 .9 1 1 6 .8 1 1 7 .2 1 1 7 . 5 1 1 6 .1 1 11. 7 . O 1 1 9 .2 1 2 0 . 3 1 2 0 . 0 1 2 0 . 7 1 2 0 . 9 1 2 0 . 8
GOODS-PRODUCING ...................................... 1 0 0 . 6 1 0 0 .9 1 0 1 .7 1 0 2 .3 1 0 2 . 1 9 9 . 5 1 0 1 .4 1 0 4 .3 1 0 6 . 8 1 0 6 .1 1 0 7 . 1 1 0 7 . 1 1 0 6 . 2
MINING....................................................... 1 3 4 . 7 1 4 2 .5 1 4 3 .9 1 4 4 . 8 1 1 3 . 3 1 1 0 . 7 1 1 2 . 6 1 1 8 . 7 1 5 0 . 5 1 5 0 .5 1 5 0 . 3 1 5 0 .4 1 5 1 . 0
CONTRACT CONSTRUCTION...................... 1 1 0 .8 1 1 0 .4 1 1 2 .3 1 1 4 . 0 1 1 3 . 5 1 0 4 .7 1 0 8 .9 1 1 6 . 5 1 2 5 . 0 1 2 3 . 6 1 2 8 . 8 1 3 0 . 0 1 2 7 . 0
MANUFACTURING .......................... 9 7 . 6 9 7 . 8 9 8 . 4 9 8 . 8 9 9 . 7 9 8 . 2 9 9 . 7 1 0 1 . 7 1 0 2 .1 1 0 1 . 5 1 0 1 . 8 1 0 1 . 6 1 0 1 . 0
DURABLE GOODS ..................................................... 9 8 . 1 9 8 . 4 9 9 . 3 9 9 . 5 1 0 0 . 8 9 9 . 3 1 0 0 . 9 1 0 3 . 0 1 0 3 . 3 1 0 2 . 8 1 0 3 . 3 1 0 3 . 4 1 0 3 . 2Ordnance and accessories ...................................... 3 9 . 3 3 9 . 1 3 8 . 2 3 8 . 2 4 0 . 2 3 9 . 8 3 8 . 1 4 1 . 3 4 0 . 5 4 0 . 9 4 1 . 7 4 1 . 2 4 2 . 3Lumber and wood products.................................... 1 0 4 . 0 1 0 6 . 0 1 0 6 . 8 1 0 9 . 5 1 0 9 . 8 1 0 7 . 6 1 0 6 . 8 1 0 9 . 3 1 0 9 . 0 1 0 7 . 8 1 0 9 . 4 1 0 9 . 8 1 0 8 . 4Furniture and fixtures ........................................... 1 0 7 . 2 1 0 8 .3 1 1 0 . 6 1 1 1 . 7 1 1 3 . 8 1 0 9 . 3 1 1 6 .5 1 1 7 . 6 1 1 7 . 0 1 1 5 .3 U 4 . 5 1 1 5 .0 1 1 3 . 6Stone, clay, and glass products.............................. 1 0 4 .1 1 0 3 .3 1 0 3 .2 1 0 6 . 7 1 0 7 . 0 1 0 4 .3 1 0 5 . 4 1 0 8 . 0 1 1 0 . 7 1 0 9 . 8 1 1 0 . 6 1 1 0 . 4 1 0 8 . 0Primary metal industries........... .......................... 8 8 . 2 8 9 . 0 8 9 . 7 8 9 . 5 8 9 . 7 8 9 . 5 9 1 . 2 9 0 . 5 9 0 . 8 9 2 . 0 9 2 . 0 9 2 . 9 9 2 . 2Fabricated metal products .................................... 1 0 3 . 3 1 0 3 * 1 1 0 5 . 0 1 0 5 . 7 1 0 7 . 7 1 0 5 . 3 1 0 7 . 6 1 0 9 .1 1 0 9 . 7 1 0 8 . 9 1 0 9 . 1 1 0 8 .6 1 0 7 . 2Machinery, except electrical .................................. 1 0 3 . 5 1 0 3 .6 1 0 5 .5 1 0 4 . 9 1 0 6 . 0 1 0 4 . 0 1 0 7 . 0 1 0 9 . 1 1 1 0 . 0 1 0 9 . 7 1 1 1 . 3 1 1 1 . 9 1 1 2 . 4Electrical equipment and supplies ........................ 9 8 . 3 9 7 . 8 9 8 . 8 9 9 . 4 1 0 0 . 4 9 8 . 9 1 0 0 . 3 i 0 3 . 4 1 0 3 . 1 1 0 2 . 8 1 0 3 . 3 1 0 5 . 0 1 0 4 . 7Transportation equipment...................................... 9 5 . 4 9 6 . 5 9 6 . 2 9 4 . 5 9 6 . 7 9 6 . 5 9 6 . 3 9 9 . 0 9 9 . 1 9 8 . 2 9 7 . 9 9 6 . 6 9 8 . 8Instruments and related products............................ 1 1 1 . 3 1 1 2 . 4 1 1 3 . 2 1 1 3 . 4 1 1 4 . 4 1 1 3 . 4 1 1 4 . 8 1 1 7 . 8 1 1 9 . 2 1 1 8 .1 1 1 9 . 8 1 1 8 . 8 1 1 6 . 6Miscellaneous manufacturing industry................. 9 1 . 3 9 0 . 3 9 1 . 1 9 1 . 5 9 3 . 9 9 2 . 3 9 3 . 9 9 6 * 4 9 6 . 9 9 5 . 3 9 5 . 6 9 2 . 5 9 1 . 4
NONDURABLE GOODS............................................. 9 6 . 9 9 6 . 9 9 7 . 1 9 7 . 8 9 8 . 1 9 6 . 5 9 7 . 8 9 9 . 9 1 0 0 . 3 9 9 . 6 9 9 . 6 9 8 . 9 9 7 . 9Food and kindred products.................................... 9 4 . 5 9 4 . 1 9 2 . 8 9 4 . 2 9 4 . 6 9 4 . 4 9 6 . 0 9 7 . 6 9 7 . 5 9 6 . 3 9 5 . 8 9 5 . 3 9 3 . 4Tobacco manufacturers........................................... 7 1 . 7 7 3 .2 7 2 . 4 7 2 . 2 7 4 . 0 7 2 . 4 7 4 . 4 7 6 . 7 7 3 . 8 7 5 . 3 7 8 . 2 7 3 . 9 6 2 . 0Textile mill products................. ......................... .... 9 8 . 9 9 9 . 4 1 0 0 . 2 1 0 1 . 4 1 0 0 . 8 9 9 . 3 1 0 0 . 4 1 0 1 . 3 1 0 1 . 2 1 0 0 . 5 9 9 . 9 1 0 0 . 1 9 9 . 7Apparel and other textile products........................ 8 7 . 8 8 7 .2 8 7 .8 8 8 . 6 8 9 . 0 8 4 . 2 8 7 . 2 8 9 . 4 9 0 . 8 8 9 . 8 9 0 . 0 8 8 . 4 8 7 . 8Paper and-allied products........................................ 9 9 . 4 9 9 . 7 1 0 0 .2 9 9 . 6 1 0 0 . 8 9 9 . 3 1 0 0 . 2 1 0 3 .1 1 0 3 . 7 1 0 3 . 5 1 0 4 . 1 1 0 4 .0 1 0 2 . 0Printing arid publishing........................................... 9 5 .1 9 5 . 7 9 5 .7 9 5 . 9 9 5 . 9 9 4 . 6 9 5 . 3 9 7 . 4 9 7 . 6 9 6 . 1 9 6 . 8 9 7 . 4 9 8 . 0Chemicals and allied products ................................ 1 0 3 . 4 1 0 3 .0 1 0 2 .6 1 0 3 . 0 1 0 3 . 5 1 0 3 . 8 1 0 4 .5 1 0 5 . 5 1 0 5 . 2 1 0 6 .1 1 0 6 . 4 1 0 5 . 9 1 0 5 . 0Petroleum and coal products.................................. 1 2 0 . 4 1 2 0 .8 1 2 2 .8 1 2 4 . 8 1 2 5 . 7 1 2 6 . 6 1 2 7 . 8 1 2 8 . 6 1 2 7 . 2 1 2 4 . 5 1 2 5 . 4 1 2 4 . 8 1 2 5 . 1Rubber and plastics products, nec.......................... 1 2 9 . 7 1 2 9 . 3 1 3 0 .5 1 3 2 .5 1 3 3 . 8 1 3 1 . 3 1 3 1 .9 1 3 7 . 4 1 3 9 . 8 1 3 9 .1 1 3 8 . 9 1 3 8 .1 1 3 5 . 2Leather and leather products ................................ 7 1 . 8 7 2 . 7 7 3 . 8 7 3 . 7 7 1 . 9 7 0 . 7 7 0 . 7 7 2 . 6 7 4 . 7 7 3 . 5 7 3 . 3 6 9 . 6 7 1 . 2
SERVICE-PRODUCING..................................... 1 2 6 .1 1 2 6 .4 1 2 7 .2 1 2 7 .5 1 2 8 . 2 1 2 7 . 6 1 2 7 . 8 1 2 9 . 4 1 2 9 . 7 1 2 9 . 6 1 3 0 . 1 1 3 0 . 5 1 3 0 . 9
TRANSPORTATION AND PUBLICUTILITIES................................................ 1 0 3 .5 1 0 3 .9 1 0 2 .9 1 0 5 . 1 1 0 5 . 6 1 0 3 . 5 1 0 5 .4 ' - 1 0 6 .3 1 0 5 . 6 1 0 6 . 2 1 0 5 . 9 1 0 4 . 6 1 0 5 . 4
WHOLESALE AND RETAILTRADE .................................................... 1 2 1 . 6 1 2 1 .8 1 2 2 .7 1 2 2 .^ 1 2 3 . 2 1 2 2 . 3 1 2 2 .3 1 2 4 .1 1 2 4 .2 1 2 4 . 5 1 2 5 . 1 1 2 5 . 5 1 2 5 . 4
WHOLESALE TRADE ............. .............................. 1 1 7 . 5 1 1 7 .8 1 1 8 .7 1 1 8 . 8 1 1 8 . 9 1 1 8 . 9 1 2 0 . 3 1 2 1 . 7 1 2 2 . 0 1 2 2 .1 1 2 2 . 6 1 2 2 .4 1 2 2 . 8RETAIL TRADE .......................................................
FINANCE, INSURANCE, AND
1 2 3 .1 1 2 3 .3 1 2 4 .2 1 2 3 . 7 1 2 4 . 8 1 2 3 .5 1 2 3 . 1 1 2 4 . 9 1 2 5 . 0 1 2 5 . 4 1 2 6 . 0 1 2 6 . 6 1 2 6 . 3
REAL ESTATE......................................... 1 3 2 . 7 1 3 3 .2 1 3 4 .2 1 3 4 .9 1 3 4 . 9 1 3 5 . 4 1 3 5 . 9 1 3 6 . 7 1 3 8 . 0 1 3 7 . 5 1 3 8 . 4 1 3 9 . 7 1 3 9 . 8
SERVICES ................................................... 1 4 0 . 6 1 4 0 .9 1 4 2 .7 1 4 2 . 6 1 4 3 . 4 1 4 3 . 8 1 4 3 . 4 1 4 5 . 3 1 4 5 . 7 1 4 5 . 0 1 4 5 . 7 1 4 6 . 6 1 4 7 .6
1 See footnote 1, table B-2. p=pre*minary.
Digitized for FRASER http://fraser.stlouisfed.org/ Federal Reserve Bank of St. Louis

ESTABLISHMENT DATA ESTABLISHMENT DATA
Table B -6. Indexes of diffusion: Percent of industries in which em ploym ent1 increased
Year and month Over 1-month span Over 3-month span Over 6-month span Over 12-month span
1 9 7 5
J a n u a r y ....................................................................... 1 5 . 1 1 2 . 8 1 2 . 8 1 6 . 6F e b r u a r y ........................... 1 5 . 7 1 2 . 8 1 1 . 9 1 7 . 4M a r c h ................................. 2 5 . 6 1 8 . 6 1 7 . 7 1 7 . 7
A p r i l .............. . .............. • 3 9 . 0 3 2 . 3 2 8 . 2 2 0 . 6
M a y .................................. 5 1 . 2 4 3 . 9 4 1 . 6 2 7 . 0J u n e ................................. 4 0 . 7 5 2 . 3 5 6 . 7 4 0 . 7
J u l y ................................. 5 8 . 1 5 7 . 0 6 7 . 2 5 0 . 6A u g u s t .............................. 7 3 . 0 7 6 . 2 7 0 . 1 6 3 . 1S e p t e m b e r ....... ............................................... 8 0 . 8 8 1 . 7 7 5 . 3 7 2 . 4
O c t o b e r ....................................................................... 6 6 . 9 7 4 . 1 8 2 . 3 7 7 . 3N o v e m b e r ........................... 6 2 . 2 7 2 . 4 8 3 . 4 8 0 . 2D e c e m b e r . . . .......................................................... 7 4 . 1 7 4 . 7 8 1 . 7 8 2 . 6
1 9 7 6
J a n u a r y .......................................... ............................ 7 8 . 5 8 2 . 0 8 3 . 1 8 6 . 0F e b r u a r y ........................... 7 7 . 9 8 4 . 3 8 1 . 7 8 4 . 6M a r c h ............................................................................. 7 4 . 1 8 5 . 2 7 9 . 9 8 1 . 1
A p r i l ........................... . . . 7 9 . 4 7 7 . 9 7 9 . 4 7 4 . 4M a y .................................. 6 6 . 6 7 1 . 5 7 0 . 9 7 9 . 7J u n e ................................. 5 4 . 1 6 1 . 0 6 8 . 6 7 9 . 1
J u l y ................................. 5 7 . 3 5 2 . 9 5 7 . 0 7 4 . 1Au g u s t . . ........................... 4 7 . 1 6 2 . 5 5 7 . 3 7 4 . 7S e p t e m b e r .......................... 6 9 . 8 5 6 . 7 6 3 . 7 7 8 . 5
O c t o b e r ............................. 4 2 . 4 6 2 . 8 6 9 . '8 7 6 . 5
N o v e m b e r ........................... 6 9 . 5 5 8 . 7 7 3 . 5 7 5 . 0D e c e m b e r ........................... 7 3 . 0 7 9 . 9 7 8 . 5 7 4 . 7
1 9 7 7
J a n u a r y ................ .............. 7 5 . 0 7 9 . 7 8 9 . 0 7 5 . 9F e b r u a r y ................. ........... 7 3 . 5 8 6 . 0 8 6 . 6 7 5 . 6M a r c h .............................................................................. 8 2 . 3 8 5 . 8 8 3 . 1 7 8 . 2
A p r i l ................................................................. 7 7 . 6 8 4 . 0 8 0 . 5 7 8 . 2M a y ................................................................... 6 8 . 6 7 3 . 3 7 1 . 5 7 9 . 1J u n e ................................................................................. 6 3 . 7 7 0 . 1 6 8 . 0 7 7 . 6
J u l y ................................................................................. 6 5 . 7 5 6 . 1 6 8 . 3 7 8 . 8Augu s t « ....................................... ............................... 5 0 . 0 6 2 . 5 6 8 . 3 7 8 . 8S e p t e m b e r .......................................................... ... 6 1 . 3 5 7 . 0 7 2 . 1 7 5 . 6
O c t o b e r ....................................................................... 5 9 . 9 7 3 . 3 7 5 . 0 7 7 . 9N o v e m b e r .................................................................... 7 5 . 9 7 6 . 2 8 0 . 5 7 5 . 6D e c e m b e r ........................... 7 3 . 8 7 7 . 9 8 3 . 7 7 7 . 3
1 9 7 8
J a n u a r y ............................. 6 6 . 9 8 0 . 5 8 5 . 2 8 0 . 5pF e b r u a r y ......................... 7 0 . 1 8 1 . 7 8 4 . 0 7 9 . 4 pM a r c h ............................... 7 4 . 4 7 7 . 6 7 7 . 6
A p r i l ............................... 6 8 . 9 7 4 . 4 7 4 . I pM a y ..... ..................................................................... 6 2 . 8 6 3 . 1 6 6 . 3pJ u n e ................. ............................................................... 6 3 . 1 6 5 . 7p
J u l y ................................. 5 9 . 6 p 5 9 . 9pA u g u s t .......................................................................... 5 6 . 4pS e p t e m b e r ...........................
O c t o b e r .............................N o v e m b e r ...........................D e c e m b e r ................. ..........
1 Number of employees, seasonally adjusted, on payrolls of 172 private nonagricultural industries, p = preliminary.
Digitized for FRASER http://fraser.stlouisfed.org/ Federal Reserve Bank of St. Louis


