
bls_2026_1979.pdf
63
A? Industry Wage Survey: Grain Mill Products, September 1977 U.S. Department of Labor Bureau of Labor StatiffkjQpO' 1 1979 Bulletin 2026 00. Digitized for FRASER http://fraser.stlouisfed.org/ Federal Reserve Bank of St. Louis
Transcript of bls_2026_1979.pdf

A?
Industry Wage Survey:Grain Mill Products, September 1977U.S. Department of Labor Bureau of Labor StatiffkjQpO' 1 1979
Bulletin 202600.
Digitized for FRASER http://fraser.stlouisfed.org/ Federal Reserve Bank of St. Louis

Digitized for FRASER http://fraser.stlouisfed.org/ Federal Reserve Bank of St. Louis

Industry Wage Survey:Grain Mill Products, September 1977U.S. Department of Labor Ray Marshall, SecretaryBureau of Labor Statistics Janet L. Norwood, CommissionerJune 1979
Bulletin 2026
For sale by the Superintendent of Documents, U.S. Government Printing Office, Washington, D.C. 20402, GPO Bookstores, orBLS Regional Offices listed on inside back cover. Price $2.30
Make checks payable to Superintendent of Documents
Stock number 029—001—02317—1Digitized for FRASER http://fraser.stlouisfed.org/ Federal Reserve Bank of St. Louis

Digitized for FRASER http://fraser.stlouisfed.org/ Federal Reserve Bank of St. Louis

Preface
This four-part bulletin summarizes the results of a Bureau of Labor Statistics survey of wages and supplementary benefits in four grain mill industries in September 1977. Information is provided separately for: Flour and other grain mill products (part I); rice milling (part II); blended and prepared flour (part III); and wet corn milling (part IV).
The study was conducted in the Bureau’s Office of Wages and Industrial Relations. The analysis was prepared in the Division of Occupational Wage Structures. Fieldwork for the survey was directed by the Bureau’s
Assistant Regional Commissioners for Operations.Other reports available from the Bureau’s program
of industry wage studies, as well as the addresses of the Bureau’s regional offices, are listed at the end of this bulletin.
Material in this publication is in the public domain and may be reproduced without the permission of the Federal Government. Please credit the Bureau of Labor Statistics and cite Industry Wage Survey: Grain Mill Products, September 1977, Bulletin 2026.
Digitized for FRASER http://fraser.stlouisfed.org/ Federal Reserve Bank of St. Louis
Contents
PageIntroduction. The grain mill products industries 1
Earnings and benefits............................................................................................................................................................. 1Industry characteristics.......................................................................................................................................................... 2
Products and processes...................................................................................................................................................... 2Productivity........................................................................................................................................................................ 2Employment and mill size................................................................................................................................................. 3Location.............................................................................................................................................................................. 3Union contract status......................................................................................................................................................... 3Method of wage paym ent................................................................................................................................................. 3
Text tables:1. Average hourly earnings in grain milling industries by
selected characteristics, September 1977 ................................................................................................................. 12. Changes in productivity and related measures in all manufacturing
and grain mill products industries, 1967-76 ........................................................................................................... 2
Part I. Flour and other grain mill products................................................................................................................................ 4Average hourly earnings......................................................................................................................................................... 4Occupational earnings............................................................................................................................................................ 4Establishment practices and supplementary wage provisions............................................................................................ 5
Scheduled weekly hours.................................................................................................................................................... 5Shift provisions and practices............................................................................................................................................. 5Paid holidays................. 5Paid vacations...................................................................................................................................................................... 5Health, insurance, and retirement plans........................................................................................................................... 5Other selected benefits....................................................................................................................................................... 5
Reference tables:1. Average hourly earnings by selected characteristics.................................................................................................... 62. Earnings distribution....................................................................................................................................................... 7
Occupational averages:3. All establishments............................................................................................................................................................ 84. By size of com m unity.................................................................................................................................................... 105. By size of establishment.................................................................................................................................................. 116. By union contract status.................................................................................................................................................. 12
Establishment practices and supplementary wage provisions:7. Method of wage paym ent.................... 138. Scheduled weekly hours................................................................................. 139. Shift differential provisions............................................................................................................................................. 14
10. Shift differential practices............................................................................................................................................... 1511. Paid holidays . . ' ............................................................................................................................................................... 1612. Paid vacations.................................................................................................................................................................... 1713. Health, insurance, and retirement plans........................................................................................................................ 1914. Other selected benefits.................................................................................................................................................... 20
Part II. Rice m illing.................................................................................................................................................................... 21Earnings................................................................................................................................................................................... 21
IVDigitized for FRASER http://fraser.stlouisfed.org/ Federal Reserve Bank of St. Louis

PagePart II. Rice milling—Continued
Establishment practices and supplementary wage provisions............................................................................................ 21Scheduled weekly hours.................................................................................................................................................... 21Shift provisions and practices............................................................................................................................................ 21Paid holidays...................................................................................................................................................................... 21Paid vacations............................................................. . ..................................................................................................... 21Health, insurance, and retirement plans.......................................................................................................................... 21Other selected benefits...................................................................................................................................................... 22
Reference tables:15. Average hourly earnings by selected characteristics.............................................................................................. 2316. Earnings distribution................................................................................................................................................. 23
Occupational averages:17. All establishments...................................................................................................................................................... 2418. By selected characteristics.......................................................................................................................................... 24
Establishment practices and supplementary wage provisions:19. Shift differential provisions and practices................................................................................................................ 2520. Paid holidays.............................................................................................................................................................. 2521. Paid vacations.............................................................................................................................................................. 2622. Health, insurance, and retirement plans................................................................................................................... 2723. Other selected benefits............................................................................................................................................... 27
Part III. Blended and prepared flo u r.......................................................................................................................................... 28Earnings................................................................................................................................................................................... 28Establishment practices and supplementary wage provisions............................................................................................ 28
Scheduled weekly hours.................................................................................................................................................... 28Shift differential provisions and practices......................................................................................... 28Paid holidays...................................................................................................................................................................... 28Paid vacations...................................................................................................................................................................... 28Health, insurance, and retirement plans........................................................................................................................... 28Other selected benefits....................................................................................................................................................... 29
Reference tables:24. Average hourly earnings by selected characteristics ............................................................................................ 30
Occupational averages:25. All establishments...................................................................................................................................................... 3126. By size of com m unity............................................................................................................................................... 3227. By size of establishment............................................................................................................................................ 3228. By union contract status............................................................................................................................................ 33
Establishment practices and supplementary wage provisions:29. Method of wage paym ent.......................................................................................................................................... 3430. Scheduled weekly hours............................................................................................................................................ 3431. Shift differential provisions....................................................................................................................................... 3532. Shift differential practices......................................................................................................................................... 3633. Paid holidays.............................................................................................................................................................. 3634. Paid vacations.............................................................................................................................................................. 3735. Health, insurance, and retirement plans................................................................................................................... 3836. Other selected benefits............................................................................................................................................... 38
Part IV. Wet corn m illing ........................................................................................................................................................... 39Earnings................................................................................................................................................................................... 39Establishment practices and supplementary wage provisions............................................................................................ 39
Scheduled weekly hours and shift work.......................................................................................................................... 39Paid holidays and vacations............................................................................................................................................... 39
Contents—Continued
vDigitized for FRASER http://fraser.stlouisfed.org/ Federal Reserve Bank of St. Louis

PagePart III. Wet corn milling—Continued
Health, insurance, and retirement plans.......................................................................................................................... 39Other selected benefits...................................................................................................................................................... 39
Reference tables:37. Average hourly earnings by selected characteristics.............................................................................................. 4038. Earnings distribution................................................................................................................................................. 40
Occupational averages:39. All establishments...................................................................................................................................................... 41
Establishment practices and supplementary wage provisions:40. Method of wage paym ent.......................................................................................................................................... 4241. Shift differential provisions....................................................................................................................................... 4242. Shift differential practices.......................................................................................................................................... 4343. Paid holidays.............................................................................................................................................................. 4344. Paid vacations.............................................................................................................................................................. 4445. Health, insurance, and retirement plans................................................................................................................... 4546. Other selected benefits............................................................................................................................................... 45
Appendixes:A. Scope and method of survey............................................................................................................................................ 46B. Occupational descriptions................................................................................................................................................. 50
Contents—Continued
V IDigitized for FRASER http://fraser.stlouisfed.org/ Federal Reserve Bank of St. Louis

Introduction. The Grain Mill Products Industries
As part of its regular Industry Wage Survey program, the Bureau of Labor Statistics conducted occupational wage studies in the grain mill products industries during late 1977. In order to represent this sector better, the Bureau expanded its industrial coverage, which previously included only flour milling, to include rice milling, blended and prepared flours, and wet com milling.' This doubled the production workers covered by the 1977 survey (25,000) compared to earlier flour milling surveys.2 The entire grain mill products industry,3 ^however, employed about 100,000 production
Text table 1. Average hourly earnings1 in grain milling industries by selected characteristics, September 1977
Characteristic Flourmilling
Ricemilling
Blendedflour
milling
Wetcorn
milling
All production workers. . . . $5.52 $3.85 $6.14 $6.87
Size of community
Metropolitan areas2................ 5.65 4.61 6.41 6.87Nonmetropolitan areas. . . . 4.99 2.98 3.53 6.85
''Size of establishment
Fewer than 100 workers3 . . 5.14 3.78 4.85 4.61100 workers or more . 5.90 3.89 6.38 6.97
. Labor-management contract status
Majority o f‘workers covered. 5.90 4.48 6.65 —
N one or m in o rity o f w orkerscovered................................ 4.04 3.54 3.72 —
Selected occupations
Forklift operators................... 5.87 3.94 5.86 6.50Janitors...................................... 5.47 4.07 6.02 6.10Laborers, material handling . 5.15 3.56 5.39 6.16Mechanics, general mainte-
nance................................... 6.23 5.11 7.42 6.97Millwrights................................ 6.95 — — 7.80Packers...................................... 5.16 3.49 5.12 6.56Processors4 ............................. 5.84 3.85 5.89 6.76Receivers5 ................ ............... 5.52 2.89 6.96
1 Excludes premium pay for overtime and for work on weekends, holidays, and late shifts.
2Standard Metropolitan Statistical Areas as defined by the U.S. Office of Management and Budget through Feb. 1974.
3 Includes data for establishments employing 20 workers or more.
4 Includes a variety of jobs relating to the operation of processing equipment.
5 1 of 3 separate elevator operator jobs surveyed.NOTE: Dashes Indicate that no data were reported or that data
did not meet publication criteria.
workers in 1977-nearly 1 in every 10 workers in food products manufacturing.4
Earnings and benefitsWet com milling registered the highest pay levels
among the four industries. (See text table 1.) At $6.87 per hour, earnings in wet com mills were 12 percent higher than in blended flour mills, 24 percent higher than in flour mills, and 78 percent higher than in rice mills. Wet com milling establishments have several characteristics traditionally associated with high pay levels-a location in the North Central States and a large, mostly unionized work force. Rice mill workers, in contrast, were concentrated in the Southwest, one of the lowest paying regions, and only one-third of them were unionized.
Paid holidays and vacations were granted to nearly all grain milling workers. Outside of rice milling, 10 or 11 holidays a year were typical; in rice mills, 8 days or less were the rule. Most grain milling workers (except in rice mills) were eligible to receive at least 4 weeks’ vacation pay after qualifying periods of service (usually 15 years). Although limited to under 4 weeks’ vacation, rice mill workers were usually eligible for at least 2 or 3 weeks’ vacation sooner than their grain mill counterparts; e.g., 2 weeks or more after 1 year rather than 2 years. A large majority of workers in all four industries studied were covered by health, insurance, and pension plans financed at least in part by their employers.
’See appendix A for scope and method o f survey and for definitions o f terms and regions used in this report. For ease of reading, establishments in the industry “flour and other grain mill products” will be called flour mills and those in the industry “blended and prepared flours,” blended flour mills.
2 Three previous BLS summaries o f this industry are mentioned in this report. See Industry Wage Survey: Flour and Other Grain M ill Products: May 1972, Bulletin 1803 (1973); February 1967, Bulletin 1576 (1967); and November 1961, Bulletin 1337 (1962).
3 Grain mill industries excluded from the 1977 wage survey were “cereal breakfast foods,” “dog, cat, and other pet food,” and “prepared feeds and feed ingredients for animals and fowls, not elsewhere classified.”
4 Employment estimates for grain milling as a whole are available monthly from the Bureau’s Employment and Earnings series.
1Digitized for FRASER http://fraser.stlouisfed.org/ Federal Reserve Bank of St. Louis

Industry characteristics
Products and processes. The production of grain mill prdducts involves highly mechanized operations. Machines are used to clean raw materials, move them through the mill, process grain (grind, sift, cook, dry, hull, polish, etc.), combine the milled products, and package the final products.
Flour mills are primarily engaged in milling flour or meal from grain, except rice. The products of flour mills may be sold plain or in the form of prepared mixes or doughs.
Wheat flour is produced by a continuous grinding and sifting process that separates and breaks down the major portion of the kernel-the endosperm-from the bran and inner wheat germ. Typically, the milling process is completed within 30 minutes. The milled grains may be “enriched” or “blended” for specific quality flours.
Mills producing wheat flour as their primary products accounted for three-fourths of the production workers covered by the survey. One-eighth were employed in mills chiefly making prepared flour and less than one-tenth, in cornmeal mills.
Rice mills chiefly clean and polish rice and make rice flour and meal. Other important products of this industry include brown and milled rice, rice polish, and rice bran. Polished or white rice is the final product of mills employing four-fifths of the workers.
After cleaning, and sometimes steam cooking, the rice kernel is shelled to remove the husk. The shelled kernels are then pearled or scoured to remove the bran layer. Rice for domestic consumption is polished further to a measured degree of whiteness.
The bran is useful in animal feeds, but the husk has virtually no recoverable food value. Rice is generally enriched to replace the nutrients lost in scouring the bran.
Flour mixes and doughs made from purchased flour are the primary products of mills in the blended and prepared flour industry. Mills producing blended flour employed three-fifths of the workers and those producing mixes or doughs, the remainder. A major process of these mills is the mixing and blending of flour
with other ingredients, such as shortening, buttermilk solids, phosphates, salts, soda, and sugar, to produce self-rising or other premixed flour.
Wet corn mills primarily mill corn or sorghum grain (milo) by the wet process and produce starch, syrup, oil, sugar, and byproducts such as gluten feed and meal. (Establishments chiefly manufacturing starch from other vegetable sources-e.g., potatoes or wheat-are also within the scope of the survey.)
Corn kernels are transformed by multistep processes into basic feeds, starches, oils, and other products. Cleaned corn is sent to steep tanks for soaking in warm water. (The steepwater is drawn off and processed for feed and medicinal purposes.) The softened kernels go to degerminating mills where separators remove oilladen germs and extract the oil. The remaining slurry of starch, gluten, and hulls is ground finely, passed through reels, and shaken to remove the hulls. Starch and gluten are then separated in centrifuges. The starch is washed, dried, and prepared for shipment as starch and dextrin, or converted into syrup, dextrose, and maltodextrins. Hulls, fibre, and gluten are used as elements of feed products.
Mills whose principal product is wet and dry syrups accounted for nearly three-fourths of the industry’s production workers; those chiefly making dry starch employed the remainder.
Productivity. For the grain mill products industry as a whole, productivity gains were well above the average productivity rise in manufacturing industries between the midsixties and midseventies.5 The strong output advance, spurred by growth in population and per capita food consumption and rising real income, was a major factor. High rates of capital expenditure and the already high ratio of capital per employee in grain milling were also significant in the productivity advance.
Text table 2 compares productivity gains for all manufacturing, all grain mill products, and selected grain
5 The Bureau’s Office o f Productivity and Technology has recently expanded its coverage o f grain mill products and now publishes productivity measures for the four industries covered by this occupational wage survey. See Productivity Indexes for Selected Industries, 1978 Edition, Bulletin 2002 (Bureau o f Labor Statistics, 1978).
Text table 2. Changes in productivity and related measures in all manufacturing and grain mill products industries, 1967-76
[In percent]
MeasureAll
manufacturing1
All grain mill
products2Flour Rice Blended
flourWetcorn
Output per production worker h o u r................... 23 32 23 6 14 63O utput......................................................................... 19 35 -1 12 23 32Production worker hours......................................... -3 2 -19 6 8 -19
1 Productivity measures for "all manufacturing" are for all persons *AII grain mill products Includes industries in addition to thoserather than production workers. shown separately.
2Digitized for FRASER http://fraser.stlouisfed.org/ Federal Reserve Bank of St. Louis

milling industries, for the period 1967-76. It shows that gains for wet corn milling were much larger than for the other three industries studied.
Employment and mill size. Flour mills employed the largest proportion of the industries’ production work force-just over two-fifths; wet corn employed one- fourth of the work force; blended flour, one-fifth; and rice, one-tenth. Wet corn mills had, on average, the largest work force among the four-5 times that of the average flour mill. Large mills (those with at least 100 workers) employed a majority of each industry’s production workers, although only a minority of the mills in all but the wet corn industry were of this size. The tabulation that follows highlights employment differences among the industries.
F lour R iceB lended
flo u rWet
corn
N um ber o f p ro d u c tio nw o rk e rs ........................ 10,550 2,642 5,107 6 ,337
N um ber o f m i l l s ............ 193 40 45 22Average m ill s iz e ............ 55 66 115 288P ercen t o f large mills
(a t least 100 w orkers) 23 25 42 73Percent o f p ro d u c tio n
w orkers in large mills 51 64 85 96
Location. Employment in flour, blended flour, and wet corn mills was concentrated in metropolitan areas of the Great Lakes and Middle West regions. The rice milling work force was overwhelmingly concentrated
(nine-tenths) in the Southwest-split about evenly between large and small communities. Milling activity is often near the source of raw materials; e.g., the Corn Belt of the Midwest and the rice growing areas of certain southwestern States.
Union contract status. Mills having labor-management agreements covering at least a majority of their production workers employed virtually all workers in wet corn mills, four-fifths in flour and blended flour mills, and one-third in rice mills. Virtually all unionized workers in rice and blended flour mills and slightly over seven-tenths in flour and wet corn mills were in metropolitan areas. The major union in flour and blended flour milling is the American Federation of Grain Millers (AFL-CIO). No union predominated in the other two types of mills.
Method o f wage payment. Virtually all workers in grain mills were paid time rates, typically under formal pay systems providing a single rate for specific occupations (tables 7, 29, and 40). Range-of-rate systems covered three-tenths of the workers in rice and wet corn mills and one-tenth or less in flour and blended flour mills.
Some regional deviations from the national pattern of single-rate systems were noted in flour and wet corn mills. In the former industry, significant proportions of workers in the largely nonunion Border States and Southeast region were paid on the basis of their individual qualifications. In the latter industry, seven-tenths of the workers in the Middle West were on rate-range systems.
3Digitized for FRASER http://fraser.stlouisfed.org/ Federal Reserve Bank of St. Louis

Part I. Flour and Other Grain Mill Products
Average hourly earningsHourly pay levels for the 10,550 production and re
lated workers in flour mills averaged $5.52 an hour in September 1977 (table l),6 up 57 percent since a similar survey in May 1972. During that period, the Hourly Earnings Index for all manufacturing workers increased by 51 percent.
Regionally, September 1977 hourly averages ranged from $3.95 in the Border States to $6.80 in the Pacific. In the Middle Atlantic, Great Lakes, Middle West, and Mountain regions, averages were between $5.68 and $5.95, whereas in the Southeast and Southwest, they fell within the $4.17 to $4.20 range.
Nationwide, workers in mills with 100 workers or more averaged $5.90 an hour, 15 percent more than those in smaller mills. Pay differences between such mills in the three regions permitting comparisons were less than 10 percent in the Great Lakes and Middle West, and 32 percent in the Southeast.
Workers employed in metropolitan areas averaged $5.65 an hour compared with $4.99 for those in plants located in smaller communities. In the two regions permitting comparisons, the difference in favor of larger communities was $1.07 in the Southeast and 26 cents in the Great Lakes.
Average earnings by union contract status for workers in flour mills could be compared only nationwide and in the Southeast region. The national average for workers in unionized mills was $5.90 an hour compared with $4.04 for nonunion workers; in the Southeast, unionized workers earned $5.01 an hour compared with $3.60 for nonunion workers.
Survey results do not indicate the exact influence of any one characteristic on wage levels. The interrelationship of charateristics such as unionization, size of establishment, and size of community is evident from the discussion of industry characteristics.
Individual earnings of 90 percent of the production workers fell between $3.20 and $7.40 an hour; excluding the upper and lower fourths of the scale, the middle 50 percent of workers in the earnings array were between $4.78 and $6.38 an hour (table 2). In only three regions was a concentration of workers below $3 an hour-11 percent in the Border States, 15 percent in the Southwest, and 19 percent in the Southeast. At the upper end of the array, a number of workers earned $7
or more in four regions: Pacific (32 percent), Middle Atlantic (24 percent), Great Lakes (9 percent), and Mountain States (7 percent).
Occupational earningsWorkers in the occupations selected to represent the
wage structure, skills, and manufacturing operations in the industry constituted just over half of the production workers studied (table 3). Among those occupations, average hourly earnings were highest for millwrights ($6.95) and lowest for feed packers ($5.01).
As a group, the almost 1,400 workers in the numerically important processing occupations averaged $5.84 hourly in September 1977. Averages for the four processing classifications studied separately fell within a narrow range-from $5.76 for blenders to $6.04 for bolters. Packers, also numerically important, averaged $5.16. Flour packers outnumbered feed packers by more than 3 to 1; the former also had a 4-percent earnings advantage over feed packers. Laborers, the second largest group, were reported at the same pay level as the overall average for packers.
Occupational earnings data are presented (table 3) separately for five regions-the Middle Atlantic, Southeast, Great Lakes, Middle West, and Pacific. With few exceptions, pay averages in the Southeast were below comparable national levels, while those in the four other regions were above. The Pacific region had the
6 The straight-time average hourly earnings in this section differ in concept from the gross average hourly earnings published in the Bureau’s monthly EmploymentandEarnings series ($6.25 in Sept. 1977). Unlike the latter, the estimates presented here exclude premium pay for overtime and for work on weekends, holidays, and late shifts. Average earnings were calculated by summing individual hourly earnings and dividing by the number of individuals; in the monthly series, the sum of the employee-hour totals reported by establishments in the industry was divided into the reported payroll totals.
The estimate of the number of flour mill production workers is intended only as a general guide to the size and composition o f the labor force included in the survey. It differs from that published in the Bureau’s monthly series (19,700 in Sept. 1977) in part because of the exclusion of establishments employing fewer than 20 workers. Also, the advance planning necessary to make the survey requires the use of lists of establishments assembled considerably in advance o f data collection. Thus, establishments new to the industry are omitted, as are establishments originally classified in the flour milling industry, but found to be in other industries at the time of the survey.
4Digitized for FRASER http://fraser.stlouisfed.org/ Federal Reserve Bank of St. Louis

highest averages with pay levels commonly at least 15 percent above the next highest region.
Occupational averages were usually higher in flour mills with 100 workers or more than in smaller mills, higher in metropolitan areas than in smaller communities, and higher in union mills than in nonunion mills (tables 4-6).
Establishment practices and supplementary wage provisions
Data also were obtained on work schedules, shift work, and selected supplementary benefits, such as paid holidays, vacations, and health, insurance, and retirement plans.
Scheduled weekly hours. Work schedules of 40 hours a week were in effect in mills employing approximately one-half of the workers in September 1977 (table 8). One-fourth of the workers were scheduled to work 48 hours or more per week, while most of the remainder had weekly schedules between 40 to 48 hours. Among regions, the proportion of the work force with 40-hour schedules ranged from two-fifths in the Great Lakes to nearly four-fifths in the Southwest. Only in the Great Lakes and Middle Atlantic regions were schedules of less than 40 hours found.
Shift provisions and practices. Flour mills employing over nine-tenths of the workers had formal provisions for late shifts; usually, a cents- per-hour premium over day-shift rates was provided (table 9). At the time of the survey, one-sixth of the production workers staffed second shifts and slightly over one-tenth, third or other late shifts (table 10). The most common hourly differential was 12 cents for the second shift and 20 cents for the third shift.
Paid holidays. Almost all mills within the survey provided paid holidays (table 11). Flour mills granting 10 or 11 days accounted for nearly two-thirds of the production workers nationwide, and for a large majority of workers in the regions outside the South. In the Border States and Southeast, 6 days or less were provided, while in the Southwest, 8 to 10 days were common. Paid vacations. Paid vacations, after qualifying periods of service, were provided to all workers in the indus
try (table 12). Typical provisions were 1 week of vacation pay after 1 year of service, at least 2 weeks after 2 years, 3 weeks or more after 10 years, at least 4 weeks after 15 years, and 5 or more weeks after 20 years of service. Vacation provisions were usually most liberal in the Great Lakes, Middle West, and Pacific and least liberal in the Border States and Southeast.
Health, insurance, and retirement plans. Life, hospitalization, basic medical, major medical, and surgical insurance, for which the employer paid at least part of the cost, were available to nearly all production workers (table 13). Four-fifths of the workers were provided sickness and accident insurance, and seven-tenths were covered by accidental death and dismemberment policies. The incidence of health and insurance plans varied little by region, with few exceptions. The method of financing health and insurance plans, on the other hand, did vary by region. For example, the proportion of employees covered by hospitalization, surgical, and medical insurance plans paid for entirely by the employer ranged from all workers in the Middle West region to just under two-thirds in the Southwest.
Retirement pension plans (other than Federal social security), providing regular payments for the remainder of the retiree’s life, were available to seven-eighths of the work force. These plans, usually financed wholly by the employer, applied to about two-fifths in the Border States, to nearly three-fifths in the Southeast and Southwest, and to nine-tenths or more in the other five regions studied separately. Retirement severance pay plans were rarely found.
Other selected benefits. Pay for jury duty and for attendance at funerals of specified relatives was available to almost nine-tenths of the production workers (table 14). A large majority of the workers in all regions studied, except the Border States and Southeast, were covered by both these benefits. Severance pay for workers who lose their jobs due to technological change or mill closings was available to slightly more than two-fifths of the workers nationwide. Regionally, severance pay coverage varied from none in mills in the Border States and Southeast to nearly 90 percent in the Mountain States.
5Digitized for FRASER http://fraser.stlouisfed.org/ Federal Reserve Bank of St. Louis

Table 1. Four and other grain mill products: Average hourly earnings by selected characteristics( N u m b e r a n d a v e r a g e s t r a i g h t - t i m e e a r n i n g s 1 o f p r o d u c t i o n w o r k e r s b y s e l e c t e d c h a r a c t e r i s t i c s , U n i t e d S t a t e s a n d s e l e c t e d r e g i o n s , S e p t e m b e r 1977)
C h a r a c t e r i s t i c sU n i t e d S t a t e s M i d d l e A t l a n t i c B o r d e r S t a t e s S o u t h e a s t S o u t h w e s t
W o r k e r s E a r n i n g s W o r k e r s E a r n i n g s W o r k e r s E a r n i n g s W o r k e r s E a r n i n g s W o r k e r s E a r n i n g s
ALL PRODUCTION WORKERS^.................................. 1 0 , 5 5 0 * 5 . 5 2 1 , 2 38 $ 5 . 9 8 3 3 8 $ 3 . 9 5 1 , 2 2 5 $ U . 17 7 5o S U . 2 0
S I Z E OF ESTA BLISHMENT:2 0 - 9 9 WORKERS....................................................... 5 , 2 1 0 5 . 1 4 5 34 4 . 8 1 _ _ 7 2 1 3 . 6 8 2 7 0 4 . 3 91 0 0 WORKERS OR MORE..................................... 5 , 3 4 0 5 . 9 0 * - - 5 0 4 ! 4 . 8 6 *
S I Z E OF COMMUNITY:3METROPOLITAN AREAS........................................ t , 2 6 9 5 . 6 5 _ _ _ _ 5 6 9 4 . 7 4 - -NONMETROPOLITAN AREAS............................... 3 . 3 U 9 4 . 9 9 - - - - 6 5 6 3 . 6 7 - •
LABOR-MANAGEMENT CONTRACTS:ESTABLISHMENTS WITH-
MAJORITY OF WORKERS C O V E R E D . . . 8 , 4 0 2 5 . 9 0 1 , 0 0 8 6 . 5 1 - _ 4 9 4 5 . 0 1 5 6 0 W.5 9NONE OR MINORITY OF WO RK E RS . . . 2 , 1 4 8 4 . 0 a “ ~ “ 7 31 3 . 6 0
G r e a t L a k e s M i d d l e W e s t M o u n t a i n P a c i f i c
ALL PRODUCTION WORKERS!.................................. 3 , 1 7 6 $ 5 . 8 3 2 , 4 7 6 $ 5 . 6 8 4 7 6 $ 5 . 9 5 8 2 5 $ 6 . 8 0
S I Z E OF ESTA BLISHMENT:2 0 - 9 9 WORKERS....................................................... 1 , 5 9 1 5 . 5 9 1 , 0 9 0 5 . 4 8 _ _1 0 0 WORKERS OR MORE..................................... 1 , 5 8 5 6 . 0 7 1 , 3 8 6 5 . 8 3 - - -
S I Z E OF COMMUNITY:3METROPOLITAN ARE AS ........................................ 1 , 9 2 4 5 . 9 3 1 , 5 9 6 5 . 9 0 _ _ _NONHEIROPOLITAN AREAS............................... 1 . 2 5 2 5 . o7 - - -
LABOR-MANAGEMENT CONTRACTS:ESTABLISHMENTS WITH-
MAJORITY OF WORKERS CO V E RE D . . . 6 . 80NONE OR MINORITY OF W O R K E R S. . .
- - - -
1 E x c l u d e s p r e m i u m p a y f o r o v e r t i m e a n d f o r w o r k o n w e e k e n d s , h o l i d a y s , a n d l a t e s h i f t s .
V i r t u a l l y a l l w o r k e r s w e r e m e n .3 S t a n d a r d M e t r o p o l i t a n S t a t i s t i c a l A r e a s a s d e f i n e d b y t h e U . S .
O f f i c e o f M a n a g e m e n t a n d B u d g e t t h r o u g h F e b r u a r y 19 7 4 .
N O T E : D a s h e s i n d i c a t e t h a t n o d a t a w e r e r e p o r t e d o r t h a t d a t a d i d n o t m e e t p u b l i c a t i o n c r i t e r i a .
6Digitized for FRASER http://fraser.stlouisfed.org/ Federal Reserve Bank of St. Louis

Table 2. Flour and other grain mill products: Earnings distribution( P e r c e n t d i s t r i b u t i o n o f p r o d u c t i o n w o r k e r s b y s t r a i g h t - t i m e h o u r l y e a r n i n g s 1, U n i t e d S t a t e s a n d s e l e c t e d r e g i o n s , S e p t e m b e r 1977)
A v e r a g e h o u r l y e a r n i n g s 1 U n i t e dS t a t e s
M i d d l e B o r d e r S o u t h e a s t S o u t h w e s t G r e a t M i d d l e ___ W e s t ____
M o u n t a i n P a c i f i c
NUNBEP OF i i O E K i j S . ' ........................................ 1 3 , 5 5 0 1 , 2 7 b 3 3 o 1 , 2 2 5 7 56 3 , 1 7 6 2 , 4 7 6 4 7 6 8 2 5A VER ftOx, HOUr-.LY c E E N i b u S ......................... £ 5 . 5 2 $ 5 . 9 6 £ 3 . S 5 $ 4 . 17 $ 4 . 2 0 £ 5 . 8 3 $ 5 . c b $ 5 . 9 5 $ 6 . 8 0
TOTAL................................................................ 1 0 0 . 0 1 0 0 . 0 1 0 0 . 0 1 0 b . C 1 3 J . 0 1 3 0 . 0 1 0 0 . 0 1 0 0 . 0 1 0 0 . 0
£ 2 . 3 0 AND UNDER £ 2 . 4 0 ............................... 0 . 6 - 0 . 9 2 . 0 1 . 2 0 . 6 - 1 . 3 -$ 2 . 4 0 AND U Nbr.R i Z . b d ............................... . 3 * • 2 . 4 • J ~ " ”
$ 2 . 5 0 AND UNDER $ 2 . 6 0 . . . .................. . 4 - 2 . 4 2 . 1 . 3 - - . 2 -$ 2 . 6 0 AND UNbr.ii $ ^ . 7 o . . . . . . . . . . . . 0 - 1 . 8 3 . 2 2 . 2 - - -1 2 . 7 0 AND UNDER . 2 . 8 0 ............................... . 7 - 1 . 8 3 . 6 3 . 0 - - . 8£ 2 . 8 0 AND UNDER £ 2 . 9 0 . . . ...................... . 8 - 3 . 3 2 . 4 5 . 6 . 1 - -£ 2 . 9 0 AND UNDER £ 8 . 0 0 ............................... . 6 " 1 . 2 3 . 1 2 . 2 • * "
£ 3 . 0 0 AND UNDER £ 3 . 1 0 ............................... 1 . 8 4 . 3 1 1 . 2 4 . 1 5 . 2 . 4 - . 2 -£ 3 . 1 0 AND 0 NDER $ 3 . 2 0 ............................... . 7 - £ . 9 1 . 7 1 . 5 - - 2 . 5£ 3 . 2 0 AND UNDER £ 3 . 3 0 ............................... . 7 - 4 . 4 1 . 3 4 . 8 - b . 2$ 3 . 3 0 AND UNDER $ 3 . 4 0 ............................... . 5 - 4 . 1 2 . 0 1 . 2 - - . 4 -£ 3 . 9 0 AND UNDER £ 3 . 5 0 ............................... 1 . 3 . 5 . 6 8 . 9 1 . 6 - 6
£ 3 . 5 0 AND UNDER $ 3 . 6 0 ............................... 1 . 1 3 . 4 4 . 4 3 . 9 1 . 1 - - - -£ 3 . 6 0 AND UNDr.5 £ 3 . 7 0 ............................... . 6 . 7 - 2 . 8 . 8 . 2 . 3 - -£ 3 . 7 0 AND UNDER $ 3 . 8 0 ............................... . 5 . 6 1 . 5 2 . 5 . 5 -$ 3 . 8 0 AND UNDER £ 3 . 9 0 ............................... . 3 . 5 2 . 7 . 3 . 7 ~ 2 . 1$ 3 . 9 0 AND UNDER $ 4 . 0 0 ............................... . 2 . 2 3 . 0 . 6 . 8 ~
$ 4 . 0 0 AND UNiyEfi $ 4 . 1 0 ............................... 1 . 0 2 . 3 1 . 2 2 . 0 . 1 I . 1 . 3 -$ 4 . 1 0 AND UNDER £ 4 . 2 0 ............................... 1 . 3 . 5 . 9 1 . 5 . 3 4 . 2 ~ ~$ 4 . 2 0 AND UNDER $ 4 . 3 0 ............................... . 7 . 5 2 . 4 . 7 3 . 4 . 4 - 2 . 7£ 4 . 3 0 AND UNDER $ 4 . 4 0 ............................... 2 . 2 - 3 . 6 . 7 1 1 . 4 1 . 5 3 . 3 . 2£ 4 . 4 0 AND UNDER $ 4 . 5 0 ............................... 1 . 3 . 2 8 . 9 1 . 0 . 7 1 . 0 2 . 4 “ ~
£ 4 . 5 0 AND UNDER £ 4 . 6 0 .................... 2 . 0 1 . 6 £ . 9 2 . 0 1 6 . 5 . 4 . i - -£ 4 . 6 0 AND UNDER £ 4 . 7 0 ............................... 2 . 1 1. 3 - 3 . 8 4 . 1 3 . 3 . 8 -$ 4 . 7 0 AND UNDER $ 4 . 6 0 ............................... 3 . 4 6 . 1 4 . 4 3 . 7 9 . 5 4 . 1 . 4 1 . 1$ 4 . 8 0 AND UNDER $ 4 . 9 0 ............................... 2 . 0 3 . 3 . 3 1 . 7 1 . 9 . 6 4 . 5 . 2$ 4 . 9 0 AND u n d e r $ 5 . 0 0 ............................... 3 . 0 1 . 3 3 . 0 7 . 5 7 . 5 3 . 1 1 . 8 ~
$ 5 . 0 0 AND UNDER $ 5 . 1 0 ............................... 1 . 6 1 . 3 - . 9 2 . 2 2 . 0 2 . 5 - -$ 5 . 1 0 AND UNDER $ 5 . 2 0 ............................... 1 . 4 . 3 5 . 3 i . i . 4 . 5 3 . 8$ 5 . 2 0 AND UNDER $ 5 . 3 0 ............................... 2 . 2 . 6 - 5 . 1 . 5 2 . 6 3 . 1$ 5 . 3 0 AND UNDER $ 5 . 4 0 ............................... 3 . 6 . 4 - 5 . 1 1 . 3 £• 3 1 . 8 “$ 5 . 4 0 AND UNDER $ 5 . 5 0 ............................... 2 . 7 . 2 6 . 2 4 . 1 . 7 2 . 6 4 . 1 4 . 2
$ 5 . 5 0 AND UNDER $ 5 . 6 0 ............................... 2 . 6 2 . 1 _ 2 . 9 . 7 2 . 0 5 . 9 - -$ 5 . 6 0 AND UNDER $ 5 . 7 0 ............................... 3 . 4 1. 8 - 2 . 7 1 . 5 5 . 1 2 . 7 3 . 6 2 . 5$ 5 . 7 0 AND UNDER $ 5 . d 0 ............................... 4 . 1 - . 6 3 . 3 1 . 7 7 . 9 4 . 8 1 . 3$ 5 . 8 0 AND UNDER $ 5 . 9 0 ............................... 4 . 9 - - . 6 . 8 2 . 5 1 5 . 1 5 . 5 3 . 5$ 5 . 9 0 AND UNDER $ 6 . 0 0 ............................... 2 . 7 . 4 . 9 . 4 . 1 4 . 8 2 . 8 8 . 0 . 6
$ 6 . 0 0 AND UNDER $ 6 . 2 0 ............................... 7 . 9 1 0 . 1 . 6 1 . 1 1 . 3 8 . 0 1 3 . 2 1 7 . 6 1 . 3$ 6 . 2 0 AND UND&R $ 6 . 4 0 ............................... 7 . 6 4 . 4 - 1 . 4 - 1 0 . 8 £ . 0 2 0 . 6 1 0 . 4$ 6 . 4 0 AND UNDER $ 6 . 6 0 ............................... 7 . 0 1 1 . 3 - . 1 - 9 . 8 3 . 5 £ . 0 1 9 . 4$ 6 . 6 0 AND UND*R $ 6 . 6 0 ............................... 5 . 6 1 1 . 7 - - - 4 . 4 4 . 0 9 . 7 1 8 . 4$ 6 . 8 0 AND UNDER $ 7 . 0 0 ............................... 2 . 8 3 . 8 * * 3 . 0 1 . 9 1 . 9 1 1 . 4
$ 7 . 0 0 AND UNDER $ 7 . 2 0 ............................... 4 . 0 1 1 . 0 . . 1 - 4 . 8 . 7 3 . 4 1 1 . 6$ 7 . 2 0 AND UNDX.B $ 7 . 4 0 ............................... 1 . 8 2 . 7 - - - 2 . 3 . 7 . 8 6 . 5$ 7 . 4 0 AND UNDER $ 7 . 6 0 ............................... 2 . 0 7 . 3 . 9 - - 1 . 1 ~ 2 . 7 7 . 6$ 7 . 6 0 AND UNDER $ 7 . 8 0 ............................... . 6 1. 0 - - . 5 . 6 . 2 . 2 2 . 2$ 7 . 8 0 AND OVER.................................................... 1 . 0 2 . 3 . 1 1 . 7 . 2 4 . 0
1 E x c l u d e s p r e m i u m p a y f o r o v e r t i m e a n d f o r w o r k o n w e e k e n d s , h o l i d a y s , a n d l a t e s h i f t s .
N O T E : D a s h e s i n d i c a t e t h a t n o d a t a w e r e r e p o r t e d .
7Digitized for FRASER http://fraser.stlouisfed.org/ Federal Reserve Bank of St. Louis

Table 3. Flour and other grain mill products: Occupational averages—all establishments( N u m b e r a n d a v e r a g e s t r a i g h t - t i m e e a r n i n g s 1 o f p r o d u c t i o n w o r k e r s in s e l e c t e d o c c u p a t i o n s , U n i t e d S t a t e s a n d s e l e c t e d r e g i o n s , S e p t e m b e r 1977)____________________________________ ^ _____________________________________________
D e p a r t m e n t a n d o c c u p a t i o n
U n i t e d S t a t e M i d d l e A t l a n t i c
N u m b e ro f
w o r k e r s
H o u r l y e a r n i n g s 1 N u m b e r H o u r l y e a r n i n g s 1
M e a n M e d i a n M i d d l e r a n g e w o r k e r s M e a n M e d i a n M i d d l e r a n g e
ELEVATOR OPERATORS
CLEANERS, BULK............................................................. 1 65 $ 5 . 8 6 $ 6 . 1 3 * 5 . 8 2 - * 6 . 5 3 9 * 6 . 9 9 - - -R E C E IV E R S ............................................................................ 3 3 6 5 . 5 2 5 . 4 1 8 . 9 3 - 6 . 4 5 47 5 . 6 3 * 6 . 8 5 * 8 . 9 3 - $ 6 . 4 8WEIGHERS................................................................................ 10U 5 . 6 9 5 . 9 1 4 . 8 9 - 6 . 5 1 14 6 . 2 0 “
PROCESSING
PROCESSORS.3................................ .. ................................... 1 . 3 9 3 5 . 8 8 6 . 0 8 5 . 0 2 - 6 . 6 8 1 78 6 . 3 4 6 . 8 1 5 . 6 1 - 7 . 1 4BLENDERS......................................................................... 2 7 5 5 . 7 6 5 . 68 4 . 9 1 - 6 . 7 3 41 6 . 3 3 6 . 9 4 4 . 7 2 - 7 . 0 2BOLTERS............................................................................ 2 0 0 6 . 0 4 6 . 1 5 5 . 5 0 - 6 . 7 4 12 6 . 9 5 - -M I L L E R S , FLOUR (SECOND HILLER) . . . 5 5 0 5 . 9 2 6 • C1 5 . 0 2 - 6 . 8 3 8 8 5 . 9 8 6 . 1 5 5 . 6 1 - 7 . 0 6ROLL TENDERS............................................................. 1 2 8 5 . 8 7 5 . 8 7 5 . 0 9 - 6 . 7 1 * “ *
PACKING
PACKERS.................................................................................. 1 , 1 6 9 5 . 16 5 . 3 6 4 . 4 0 - 6 . 1 5 1 5 9 5 . 8 6 5 . 3 1 8 . 0 0 - 6 . 7 8FE ED ..................................................................................... 2 8 0 5 . 0 1 8 . 6 2 4 . 4 9 - 6 . 0 1 - - - -FLOUR.................................................................................. 8 8 9 5 . 2 1 5 . 8 1 4 . 4 0 - 6 . 2 5 10 2 5 . 8 1 6 . 4 6 4 . 7 5 - 6 . 7 4
MATERIAL MOVEMENT
LABORERS, MATERIAL HANDLING...................... 1 , 1 9 8 5 . 15 5 . 8 8 8 . 3 3 - 6 . 0 1 - - - -TRUCKERS, POWER.......................................................... 3 9 2 5 . 8 8 6 . Cl 5 . 3 1 - 6 . 6 7 5 5 6 . 5 9 6 . 7 7 6 . 5 8 - 7 . 1 3
F 0 R K L I F 1 ......................................................................... 3 5 7 5 . 8 6 6 . C 1 5 . 0 5 - 6 . 6 9 52 6 . 6 0 6 . 7 7 6 . 5 8 - 7 . 1 3OTHER THAN F O R K L I F T ........................................ 3 5 6 . 1 0 6 . 1 6 5 . 8 9 - 6 . 6 7 -
MAINTENANCE
E L E C T R I C I A N S .................................................................... 1 0 3 6 . 6 2 6 . 5 2 6 . 2 6 - 7 . 2 3 1 1 7 . 5 7 - - -MECHANICS, GENERAL U I I L I I I ......................... 4 4 0 6 . 2 3 6 . 1 6 5 . 5 6 - 6 . 9 9 - - - ~MILLWRIGHTS....................................................................... 2 5 8 6 . 9 5 7 . 0 5 6 . 2 7 - 7 . 5 3 72 7 . 2 3 7 . 5 3 7 . 0 1 - 7 . 5 3O I L E R S ...................................................................................... 3 0 6 5 . 6 8 5 . 8 7 5 . 1 5 - 6 . 3 8 2 8 6 . 2 9 6 . 8 3 6 . 3 8 - 6 . 7 9SHEET-METAL WORKERS.............................................. 77 6 . 5 2 6 . 6 0 5 . 9 6 - 7 . 0 5 - ~
SE RV ICE AND CUSTODIAL
JA N I T O R S , POR TERS,AND CLEANERS............. 8 0 1 5 . 8 7 5 . 7 1 5 . 2 2 - 6 . 0 4 9 6 5 . 9 4 6 . 0 8 6 . 0 4 - 6 . 6 2
S o u t h e a s t G r e a t L a k e s
ELEVATOR OPERATORS
CLEANERS, BULK............................................................. 91 $ 5 . 9 8 * 6 . 0 1 * 5 . 7 9 - * 6 . 5 3RE C E I V E R S............................................................................ 41 $ 4 . 4 9 $ 5 . 18 % 3 . 5 8 - $ 5 . 3 3 1 0 5 5 . 6 7 5 . 3 7 8 . 9 3 - 6 . 6 0WEIGHERS............................................................................... 6 4 . 0 2 32 5 . 8 0 6 . 1 6 8 . 7 5 - 6 . 3 5
PROCESSING
PROCESSOES.3. . . ............. ................................................ 132 4 . 6 6 4 . 8 6 3 . 9 3 - 5 . 2 9 3 6 2 6 . 1 1 6 . 4 7 5 . 3 8 - 6 . 7 3ELEN LE RS......................................................................... 3 . 9 3 _ 6 0 6 . 4 0 6 . 7 3 6 . 4 4 - 6 . 7 3BOLTERS............................................................................ 4 . 9 6 5 . 29 44 6 . 0 8 6 . 2 7 5 . 8 0 - 6 . 5 8H I L L E R S , FLOUR (SECOND M I L L E R ) . . . 4 . 7 2 8 . 9 7 5 . 5 8 1 6 3 6 . 1 7 6 . 4 7 5 . 1 3 - 7 . 0 2ROLL TENDERS............................................................. 8 4 . 6 8 4 2 5 . 9 6 6 . 7 0 4 . 9 1 - 6 . 7 1
PACKING
PACKERS.................................................................................. 171 3 . 8 6 3 . 8 0 3 . 0 0 - 4 . 9 1 2 5 1 5 . 5 5 5 . 4 4 4 . 7 7 - 6 . 2 5FEED ..................................................................................... 40 3 . 8 2 3 . 8 5 2 . 7 5 - 4 . 9 1 61 5 . 1 5 4 . 7 7 4 . 7 7 - 5 . 4 1FLOUR.................................................................................. 131 3 . 8 7 3 . 4 0 3 . 0 0 - 4 . 9 1 1 90 5 . 6 7 5 . 9 8 8 . 7 7 - 6 . 3 2
MATERIAL MOVEMENT
LABORERS, MATERIAL BANDLIN3...................... 3 . 3 8 2 7 7 5 . 5 7 5 . 7 3 8 . 7 0 - 6 . 14TPUCKERS, POWER.......................................................... 4 . 4 4 4 . 6 0 73 6 . 1 4 6 . 1 7 5 . 3 1 - 7 . 5 7
F O R K L I F T ......................................................................... 25 4 . 4 2 4 . 6 0 3 . 5 0 - 5 . 4 5 6 2 6 . 1 5 6 . 17 5 . 0 5 - 7 . 5 7OTHER THAN F O R K L I F T ........................................ - - 11 6 . 0 9 - “
MAINTENANCE
E L E C T R I C I A N S ................................................................... 5 . 3 9 5 2 6 . 8 3 6 . S 7 6 . 5 2 - 7 . 2 3MECHANICS, GENERAL U T I L I T Y ......................... 5 . 1 2 5 . 7 3 6 . 0 3 1 6 0 6 . 2 9 6 . 3 0 5 . 9 8 - 6 . 9 0MILLWRIGHTS...................................................................... 5 . 9 5 68 6 . 6 5 6 . 6 4 6 . 2 5 - 7 . 0 5O I L E R S ..................................................................................... 4 . 3 7 1 0 2 5 . 9 2 6 . 0 4 5 . 7 6 - 6 . 3 8SHEET-METAL WORKERS............................................. - - - 3 2 6 . 8 1 6 . 5 0 6 . 5 8 - 7 . 0 5
SERVICE AND CUSTODIAL
JA N I T O R S , PORTERS,AND CLEANERS............. 57 4 . 1 8 4 . 4 9 3 . 2 0 - 8 . 7 5 2 8 7 5 . 6 8 5 . 7 1 5 . 2 4 - 6 . 2 4
S e e f o o t n o t e s a t e n d o f t a b l e .
8Digitized for FRASER http://fraser.stlouisfed.org/ Federal Reserve Bank of St. Louis

Table 3. Continued —Flour and other grain mill products: Occupational averages —all establishments( N u m b e r a n d a v e r a g e s t r a i g h t - t i m e e a r n i n g S e p t e m b e r 1977) ________________________
D e p a r t m e n t a n d o c c u p a t i o n
ELEVATOR OPERATORS
CLEANERS, BULK.................................. ..R E C E I V E R S ................................................. .W E I G H E R S. . .................................................
PROCESSING
PROCESSORS.3.......................................................................BLENDERS..........................................................................BOLT ERS ............................................................................H I L L E R S , FLOUR (SECOND M I L L E R ) . . . POLL TENDERS.............................................................
PACKING
PACKERS,F E E D . .FLOUR.
MATERIAL MOVEMENT
LABORERS, MATERIAL HANDLING,TRUCKERS, POWER.................................. .
F O R K L I F T ................................................. ..OTHER THAN F O R K L I F T ..................
MAINTENANCE
E L E C T R I C I A N S ......................................................MECHANICS, GENERAL U T I L I T Y . . . . .MILLWRIGHTS.........................................................O I L E R S ...................................................................... .SHEET-METAL WORKERS................................
SE RV IC E AND CUSTODIAL
JA N I T O R S , PORTERS,AND CLEANERS.
s 1 o f p r o d u c t i o n w o r k e r s i n s e l e c t e d o c c u p a t i o n s , U n i t e d S t a t e s a n d s e l e c t e d r e g i o n s ,
M i d d l e W e s t P a c i f i c
N u m b e ro f
w o r k e r s
H o u r l y e a r n i n g s 1 N u m b e ro f
w o r k e r s
H o u r l y e a r n i n g s 1
M e a n M e d i a n M i d d l e r a n g e M e a n M e d i a n M i d d l e r a n g e
16 $ 6 . 8 0 $ 6 . 7 3 $ 6 . 6 6 - $ 6 . 8 87 7 $ 5 . 7 3 $5 . 5 4 $ 4 . 9 9 - $ 5 . 8 0 2 5 6 . 7 4 6 . 8 8 6 . 6 6 - 6 . 9 523 5 . 5 8 5 . 5 8 5 . 1 5 - 5 . 8 7
3 5 7 6 . 0 1 6 0 4 5 . 7 2 - 6 . 3 3 1 0 0 7 . 1 3 7 . 18 6 . 8 3 - 7 . 4 88 3 5 . 9 1 5 . 8 4 5 . 7 2 - 6 . 1 9 16 6 . 8 4 6 . 8 2 6 . 5 5 - 7 . 1401 6 . 3 9 6 10 6 . 0 8 - 7 . 2 8 28 6 . 9 8 6 . 8 8 6 . 7 4 - 7 . 15
135 6 . 0 6 6 13 5 . 6 3 - 6 . 4 3 88 7 . 3 9 7 . 4 8 7 . 2 2 - 7 . 5 838 5 . 8 9 5 86 5 . 3 7 - 6 . 5 6
26 9 5 . 5 8 5 7 0 5 . 0 6 - 6 . 0 8 108 6 . 5 9 6 . 6 5 6 . 5 4 - 6 . 6 98 0 5.<44 5 77 4 . 8 2 - 6 . 0 1 15 6 . 6 3 6 . 5 5 6 . 4 1 - 6 . 8 9
18 S 5 . 6 4 5 70 5 . 1 5 - 6 . 0 8 93 6 . 5 8 6 . 6 5 6 . 5 4 - 6 . 8 9
3 9 2 5 . 2 3 5 5 0 4 . 3 0 - 5 . 8 7 100 6 . 8 3 6 . 5 2 6 . 2 9 - 6 . 5 31 0 2 5 . 9 5 6 . 01 6 . 0 0 - 6 . 1 6 67 6 . 7 8 6 . 6 9 6 . 6 5 - 7 . 16
86 5 . 8 6 6 01 6 . 0 0 - 6 . 0 1 67 6 . 7 8 6 . 6 9 6 . 6 5 - 7 . 16
2 0 6 . 1 3 6 . 19 5 . 7 8 - 6 . 8 11 05 5 . 9 2 5 . 96 5 . 6 0 - 6 . 2 7 47 7 . 5 2 7 . 5 3 7 . 2 2 - 8 . 0 0
8 8 6 . 9 4 6 . 6 8 6 . 2 6 - 7 . 8 0 15 7 . 4 4 7 . 54 7 . 2 2 - 7 . 6 39 3 5 . 5 U 5 . 6 9 5 . 1 5 - 5 . 8 7 27 6 . 6 3 6 . 7 0 6 . 5 2 - 6 . 7 03 2 6 . 3 0 6 . 2 6 5 . 3 6 - 6 . 6 8
2 3 7 5 . 3 8 5 . 50 8 . 8 7 - 5 . 8 7 52 6 . 3 6 6 . 8 5
_____6 . 3 6 - 6 . 5 3
1 E x c l u d e s p r e m i u m p a y f o r o v e r t i m e a n d f o r w o r k o n w e e k e n d s , h o l i d a y s , a n d l a t e s h i f t s . S e e a p p e n d i x A f o r d e f i n i t i o n s o f m e a n s , m e d i a n s , a n d m i d d l e r a n g e s . M e d i a n s a n d m i d d l e r a n g e s w e r e n o t c o m p u t e d f o r o c c u p a t i o n s w i t h f e w e r t h a n 15 w o r k e r s .
2 I n c l u d e s d a t a f o r r e g i o n s in a d d i t i o n t o t h o s e s h o w n s e p a r a t e l y .
3 I n c l u d e s d a t a f o r w o r k e r s i n c l a s s i f i c a t i o n s i n a d d i t i o n t o t h o s e s h o w n s e p a r a t e l y .
N O T E : D a s h e s i n d i c a t e t h a t n o d a t a w e r e r e p o r t e d o r t h a t d a t a d i d n o t m e e t p u b l i c a t i o n c r i t e r i a .
9Digitized for FRASER http://fraser.stlouisfed.org/ Federal Reserve Bank of St. Louis

Table 4. Flour and other grain products: Occupational averages by size of community( N u m b e r a n d a v e r a g e s t r a i g h t - t i m e e a r n i n g s 1 o f p r o d u c t i o n w o r k e r s in s e l e c t e d o c c u p a t i o n s , U n i t e d S t a t e s a n d s e l e c t e d r e g i o n s , S e p t e m b e r 1977)
D e p a r t m e n t a n d o c c u p a t i o n
U n i t e d S t a t e s 2 S o u t h e a s t
M e t r o p o l i t a na r e a s
N o n m e t r o p o l i t a n a r e a s
M e t r o p o l i t a na r e a s
N o n m e t r o p o l i t a n a r e a s
W o r k e r s E a r n i n g s W o r k e r s E a r n i n g s W o r k e r s E a r n i n g s W o r k e r s E a r n i n g s
E1EVAT0B OPERATORS
CLEANERS, BULK............................................................. 1 04 $ 6 . 0 5 52 $ 5 . 2 9 - - - -R E C E I f B B S ............................................................................. 2 1 2 5 . 5 7 S3 5 . 12 22 $ 9 . 9 6 19 $ 3 . 9 2WEIGHERS................................................................................ 7 0 5 . 7 8 20 5 . 0 1 * 6 4 . 0 2
PROC ESS ING
PROCESSORS,1 2 3.............................................. ... 8 4 9 5 . 9 8 4 0 5 5 . 2 2 5 6 5 . 0 5 7 6 9 . 3 7BLENDERS.......................................................................... 1 5 9 5 . 8 7 83 5 . 1 5 - - 12 3 . 8 1
1 5 5 6 . 0 6 33 5 . 6 6 17 5 . 0 4 - —
H I L L E R S , FLOOR (SECOND H I L L E R ) . . . 3 5 0 6 . 0 7 171 5 . 9 9 3 3 5 . 1 2 2 9 4 . 2 6
ROLL TENDERS............................................................. 9 3 5 . 8 3 18 9 . 7 6 * *
PACKING
PACKERS.................................................................................. 7 0 3 5 . 2 7 3 6 6 9 . 6 6 7 6 9 . 5 5 9 5 3 . 3 11 6 2 5 . 1 0 97 4 . 6 6 13 9 . 5 1 27 3 . 4 9
FLOOR................................................................................... 5 9 1 5 . 3 2 2 6 9 4 . 6 6 6 3 9 . 5 5 68 3 . 2 9
MATERIAL HOVEHENT
LABORERS, HATERIAL HANDLING...................... 6 6 5 5 . 9 1 9 2 9 4 . 4 9 3 7 9 . 3 6 9 9 3 . 0 2TROCKERS, POWER........................................................... 2 6 5 6 . 1 0 74 4 . 5 6 11 4 . 8 5 16 4 . 1 6
F O R K L I F T ......................................................................... 2 4 0 6 . 0 8 67 4 . 4 8 11 4 . 8 5 14 9 . 0 9OTHER THAN F O R K L I F T ........................................ 2 5 6 . 2 6 7 5 . 3 9 “
MAINTENANCE
E L E C T R I C I A N S .................................................................... 9 2 6 . 9 0 50 6 . 18 - - - -MECHANICS, GENERAL U T I L I T Y .......................... 2 9 5 6 . 3 7 130 5 . 6 9 26 5 . 6 1 19 4 . 2 2MILLWRIGHTS........................................... ........................... 1 0 5 7 . 0 5 €5 6 . 5 3 T - - •O I L E R S ...................................................................................... 2 0 7 5 . 7 9 75 5 . 3 3 9 5 . 1 1 - •SHEET-METAL WORKERS.............................................. 39 6 . 3 5 33 6 . 5 6 - “
SE RV IC E AND COSTODIAL
J A N I T O R S , POR TERS,AND CLEANERS............. 5 0 2 5 . 5 3 2 1 5 5 . 0 7 3 4 9 . 7 9 2 3 3 . 2 8
G r e a t L a k e s M i d d l e W e s t
M e t r o p o l i t a n N o n m e t r o p l i t a n M e t r o p l i t a na r e a s a r e a s a r e a s
W o r k e r s E a r n i n g s W o r k e r s E a r n i n g s W o r k e r s E a r n i n g s
ELEVATOR OPERATORS
CLEANERS, BOLK.............................................................. 5 4 $ 6 . 1 6 3 7 $ 5 . 7 2 _R E C E I V E R S ............................................................................ 85 5 . 6 3 2 0 5 . 8 6 91 $ 5 . 9 9WEIGHERS................................................................................ 29 5 . 8 9 - 21 5 . 5 5
PROCESSING
PROCESSORS.?...................................................................... 2 7 3 6 . 1 4 8 9 6 . 0 2 2 9 5 6 . 1 8BLENDERS......................................................................... - - - - 37 6 . 1 6BOLT ERS ............................................................................ 38 6 . 0 2 - - 3 8 6 . 4 1H I L L E R S , PLOOB (SECOND M I L L E R ) . . . 12 1 6 . 1 1 4 2 6 . 3 3 83 6 . 3 2ROLL TENDE RS ............................................................. 3 9 5 . 9 9 * * 3 5 5 . 8 9
PACKING
PACKERS.................................................................................. 1 6 9 5 . 6 4 8 2 5 . 3 5 151 5 . 8 8FE E D ..................................................................................... 92 5 . 2 2 - - 41 5 . 7 7FLOOR.................................................................................. 1 2 7 5 . 7 8 6 3 5 . 9 5 11 0 5 . 9 2
MATERIAL MOVEMENT
LABOBEBS. MATERIAL BA ND UN G...................... 1 7 3 5 . 6 9 1 0 9 5 . 3 8 2 3 6 5 . 9 5TRUCKERS, POWER.......................................................... 9 5 6 . 7 3 28 5 . 2 1 91 6 . 1 1
FO R K L I F T ......................................................................... 39 6 . 7 7 2 3 5 . 11 75 6 . 0 9OTHER THAN F O B K L I E T ........................................ - - * * - -
MAINTENANCE
E L E C T R I C I A N S .................................................................... 2 0 7 . 4 0 3 2 6 . 4 7 10 6 . 1 1MECHANICS, GENERAL O T I L I T I .......................... 1 2 3 6 . 3 3 - - 50 6 . 0 3MILLWRIGHTS....................................................................... - - - - _ -O I L E R S ..................................................................................... 6 5 5 . 9 7 3 7 5 . 8 2 61 5 . 7 6SHEET-METAL WORKERS.............................................. * - 26 6 . 3 0
SERV ICE AND CUSTODIAL
J A N I T O R S , PORTERS,AND CLEANERS............. 184 5 . 6 3 1 0 3 5 . 6 4 1 75 5 . 9 2
1 E x c l u d e s p r e m i u m p a y f o r o v e r t i m e a n d f o r w o r k o n w e e k e n d s , h o l i d a y s , a n d l a t e s h i f t s .
2 I n c l u d e s d a t a f o r r e g i o n s in a d d i t i o n t o t h o s e s h o w n s e p a r a t e l y .3 I n c l u d e s d a t a f o r w o r k e r s i n c l a s s i f i c a t i o n s in a d d i t i o n t o
t h o s e s h o w n s e p a r a t e l y .
N O T E : D a s h e s i n d i c a t e t h a t n o d a t a w e r e r e p o r t e d o r t h a t d a t a d o e s n o t m e e t p u b l i c a t i o n c r i t e r i a .
10Digitized for FRASER http://fraser.stlouisfed.org/ Federal Reserve Bank of St. Louis

Table 5. Flour and other grain mill products: Occupational averages by size of establishment( N u m b e r a n d a v e r a g e s t r a i g h t - t i m e e a r n i n g s 1 o f p r o d u c t i o n w o r k e r s in s e l e c t e d o c c u p a t i o n s , U n i t e d S t a t e s a n d s e l e c t e d r e g i o n s , S e p t e m b e r 1977)
D e p a r t m e n t a n d o c c u p a t i o n
U n i t e d S t a t e s 2 M id d le A l t a n t i c S o u t h e a s t G r e a t L a k e s M i d d l e W e s t
L e s s t h a n 100 w o r k e r s
100 w o r k e r s o r m o r e
L e s s t h a n 100 w o r k e r s
100 w o r k e r s o r m o r e
L e s s t h a n 100 w o r k e r s
TOO w o r k e r s o r m o r e
L e s s t h a n 100 w o r k e r s
W o r k e r s
E a r n i n g s
W o r k e r s
E a r n i n g s
W o r k e r s
E a r n - W o r k -e r s
E a r n i n g s
W o r k -e r s
E a r n i n g s
W o r k - E a r n i n g s
W o r k -e r s
E a r n i n g sm g s
ELEVATOR OPERATORS
CLEANERS, BULK............................................................. 1 1 0 $ 5 . 8 0 5 5 $ 5 . 9 8 1 10 $ 5 . 8 0 - _ 6 9 $ 5 . 9 7 2 2 $ 6 . 0 3 6 $ 5 . 7 3RE CE IV E RS ............................................................................ 1 7 7 5 . 2 3 159 5 . 8 4 177 5 . 2 3 2 2 $ 4 . 1 9 6 6 5 . 9 7 39 6 . 0 2 50 5 . 8 9WEIGHERS............................... ................................................ 49 5 . 4 4 55 5 . 9 1 49 5 . 4 4 * - 22 5 . 5 3 10 6 . 4 1 14 5 . 8 5
PROCESSING
PBOCE SSOBS. 3. ................................................................... 8 2 5 5 . 5 9 5 6 8 6 . 1 9 8 2 5 5 . 5 9 67 4 . 3 1 2 9 2 6 . 0 4 1 2 0 6 . 2 7 1 6 7 6 . 1 9BLENDERS.......................................................................... 1 7 7 5 . 9 7 98 6 . 2 8 177 5 . 9 7 8 3 . 2 6 - - ~ - 43 5 . 9 9BOLTERS............................................................................ 97 5 . 8 6 1 0 3 6 . 2 2 9 7 5 . 8 6 9 9 . 2 9 2 0 5 . 6 5 2 4 6 . 4 4 29 6 . 5 9H I L L E R S , FLOUR (SECOND H I L L E R ) . . . 3 9 0 5 . 7 9 1 6 0 6 . 2 5 3 9 0 5 . 7 9 4 8 9 . 5 3 1 3 2 6 . 1 6 3 1 6 . 18 55 6 . 2 6ROLL TENDERS............................................................. 38 9 . 9 0 50 6 . 2 8 38 9 . 9 0 ~ - * * 2 7 6 . 3 1 29 6 . 1 2
PACKING
PACKERS................................................................ .................. 6 1 9 4 . 7 8 5 5 5 5 . 5 7 6 1 9 9 . 7 8 109 3 . 2 0 15 1 5 . 3 1 1 0 0 5 . 9 0 1 5 5 5 . 7 0FEED...................................................................................... 1 7 9 4 . 7 4 106 5 . 9 5 1 79 9 . 7 9 21 2 . 9 6 42 4 . 9 3 1 9 5 . 6 5 34 5 . 3 5FLOUR.................................................................................. 9 9 0 4 . 8 0 4 4 9 5 . 6 0 4 4 0 9 . 8 0 83 3 . 2 7 1 0 9 5 . 4 6 81 5 . 9 6 121 5 . 7 9
MATERIAL HOVEHENT
LABORERS, MATERIAL HANDLING...................... 5 7 7 4 . 8 2 6 1 7 5 . 4 7 5 7 7 4 . 8 2 9 8 3 . 18 1 1 9 5 . 2 1 1 6 3 5 . 8 3 19 5 5 . 2 9TRUCKERS, POWER.......................................................... 1 5 2 5 . 9 3 2 9 0 6 . 1 7 152 5 . 9 3 6 3 . 5 9 - - 5 9 6 . 5 9 51 6 . 1 7
F O R K L I F T ......................................................................... 1 9 7 5 . 9 1 2 1 0 6 . 1 8 197 5 . 9 1 6 3 . 5 9 - - 4 7 6 . 6 2 3 5 6 . 0 5OTHER THAN F O R K L I F T ........................................ - - 30 6 . 0 8 * * ~ - 7 5 . 9 7 * *
HAINTENANCE
E L E C T R I C I A N S .................................................................... 4 2 6 . 5 2 61 6 . 6 9 92 6 . 5 2 _ 3 2 6 . 6 9 2 0 7 . 0 5 20 6 . 1 3MECHANICS, GENERAL U T I L I T Y ......................... 2 2 2 5 . 8 9 2 1 8 6 . 5 7 2 2 2 5 . 8 9 2 2 5 . 0 9 9 3 5 . 8 9 6 7 6 . 8 5 51 6 . 0 1MILLWRIGHTS...................................................................... 4 4 6 . 8 9 2 1 9 6 . 9 7 44 6 . 8 4 - - - - 6 8 6 . 6 5 75 6 . 9 7O I L E R S ..................................................................................... 1 6 3 5 . 7 3 193 5 . 6 2 1 63 5 . 7 3 9 3 . 8 6 6 3 5 . 9 9 3 9 5 . 8 7 46 5 . 6 2SHEET-METAL WORKERS.............................................. 6 6 . 7 0 71 6 . 5 1 6 6 . 7 0 - - - 2 6 6 . 8 2 32 6 . 3 0
SERV ICE AND CUSTODIAL
JA N I T O R S , PORTERS,AND CLEANERS............. 3 4 6 5 . 2 1 9 5 5 5 . 6 7
__________
3 4 6 5 . 2 1 29 3 . 9 0 1 0 7 5 . 4 7 1 8 0 5 . 7 3 116 5 . 3 5
1 E x c l u d e s p r e m i u m p a y f o r o v e r t i m e a n d f o r w o r k o n w e e k e n d s , h o l i d a y s , a n d l a t e s h i f t s .
2 I n c l u d e s d a t a f o r r e g i o n s i n a d d i t i o n t o t h o s e s h o w n .3 I n c l u d e s d a t a f o r w o r k e r s i n c l a s s i f i c a t i o n s i n a d d i t i o n t o t h o s e
s h o w n s e p a r a t e l y .
N O T E : D a s h e s i n d i c a t e t h a t n o d a t a w e r e r e p o r t e d o r t h a t d a t a d i d n o t m e e t p u b l i c a t i o n c r i t e r i a .
11Digitized for FRASER http://fraser.stlouisfed.org/ Federal Reserve Bank of St. Louis

Table 6. Flour and other grain mill products: Occupational averages by union contract status( N u m b e r a n d a v e r a g e s t r a i g h t - t i m e e a r n i n g s 1 o f p r o d u c t i o n w o r k e r s in s e l e c t e d o c c u p a t i o n s , U n i t e d S t a t e s a n d s e l e c t e d r e g i o n s , S e p t e m b e r 1977)_______________________________ (____________________________________________ ______________________ ___________________
D e p a r t m e n t a n d o c c u p a t i o n
U n i t e d S t a t e s 2 M i d d l e A t l a n t i c S o u t h e a s t G r e a t L a k e 8
M a j o r i t y c o v e r e d N o n e o r m i n o r i t y c o v e r e d M a j o r i t y c o v e r e d N o n e o r m i n o r i t y
c o v e r e dM a j o r i t y c o v e r e d ^ o n e o r m i n o r i t y
c o v e r e d
W o r k e r s E a r n i n g s W o r k e r s W a r n in g s W o r k e r s E a r n i n g s W o r k e r s E a r n i n g s W o r k e r s E a r n i n g s W o r k e r s E a r n i n g s
ELEVATOR OPERATORS
CLEA NERS, BULK.............................................................. 1 4 9 $ 6 . 0 8 16 $ 3 . 8 0 149 $ 6 . 0 8 _ - 8 7 $ 6 . 0 5F E C E I V E R S ............................................................................. 2 9 3 5 . 7 6 43 3 . 8 7 2 9 3 5 . 7 6 21 $ 5 . 0 1 2 0 $ 3 . 9 5 1 0 5 5 . 6 7WEIGHERS............................................................................... 91 5 . 8 9 13 4 . 2 6 91 5 . 8 5 * * 26 5 . 9 6
PROCESSING
PR OCE SSO RS? ....................................................................... 1 . 1 7 3 6 . 1 3 2 2 0 4 . 2 5 1 , 1 7 3 6 . 1 3 _ 5 8 4 . 2 4 3 4 2 6 . 1 7BLENDERS.......................................................................... 2 3 3 6 . 1 4 42 3 . 6 4 2 3 3 6 . 1 4 - - 8 3 . 2 6 59 6 . 4 0BO LT ERS ............................................................................ 1 86 6 . 16 14 4 . 5 4 186 6 . 16 17 4 . 9 8 - - 4 4 6 . 0 8H I L L E R S , FLOUR (SECOND H I L L E R ) . . . 4 4 1 6 . 2 6 1C9 4 . 56 441 6 . 2 6 2 0 5 . 2 9 4 2 4 . 4 4 1 6 2 6 . 1 7POLL TENDERS.............................................................. 1 1 9 6 . 0 2 9 3 . 8 6 1 19 6 . 0 2 8 4 . 6 8 4 1 5 . 9 6
PACKING
PACKERS................................................................................... 8 6 0 5 . 6 5 3C9 3 . 7 8 8 6 0 5 . 6 5 59 4 . 8 5 1 1 2 3 . 3 4 2 1 5 5 . 7 0F E E D ...................................................................................... 1 8 2 5 . 5 7 s e 3 . 9 7 182 5 . 5 7 16 4 . 5 8 24 3 . 3 1 49 5 . 2 9FLOUR................................................................................... 6 7 8 5 . 6 8 211 3 . 6 9 6 7 8 5 . 6 8 - * 8 8 3 . 3 5 1 6 6 5 . 8 3
MATERIAL MOVEMENT
LABORERS, MATERIAL HANDLING...................... 8 9 9 5 . 6 0 2 9 5 3 . 7 8 8 9 9 5 . 6 0 10 5 . 0 8 1 26 3 . 2 5 2 1 9 5 . 7 3TRUCKERS, FOWER.......................................................... 3 4 4 6 . 14 46 4 . 04 3 4 4 6 . 1 4 14 4 . 8 7 - - 61 6 . 4 2
F O R K L IF T ......................................................................... 3 1 1 6 . 1 4 46 4 . 0 1 3 1 1 6 . 1 4 14 4 . 8 7 11 3 . 8 6 5 0 6 . 4 9OTHER THAN F O R K L I F T ....................................... 33 6 . 16 - 3 3 6 . 1 8 - * - “ 11 6 . 0 9
MAINTENANCE
E L E C T R I C I A N S ................................................................... 9 5 6 . 7 7 8 4 . 8 2 9 5 6 . 7 7 _ - _ 4 8 6 . 9 6MECHANICS, GENERAL U T I L I T Y ......................... 3 9 2 6 . 3 7 48 5 . 0 3 3 9 2 6 . 3 7 18 5 . 5 1 22 4 . 8 0 1 5 5 6 . 3 0MILLWRIGHTS...................................................................... 2 5 2 6 . 9 6 6 6 . 4 2 2 5 2 6 . 9 6 6 6 . 2 5 - - 6 8 6 . 6 5O I L E R S ..................................................................................... 2 8 6 5 . 8 1 20 3 . 8 3 2 8 6 5 . 8 1 6 5 . 2 9 8 3 . 6 8 1 0 2 5 . 9 2SHEET-METAL WORKERS.............................................. 76 6 . 5 4 - 76 6 . 5 4 - - - * 3 2 6 . 8 1
SE RV ICE AND CUSTODIAL
J A N I T O R S , PORTERS,AND CLEANERS............. 7 3 9 5 . 6 2 62 3 . 7 6 7 3 9 5 . 6 2 29 4 . 8 1 2 8 3 . 5 2 2 8 7 5 . 6 4
1 E x c l u d e s p r e m i u m p a y f o r o v e r t i m e a n d f o r w o r k o n w e e k e n d s , h o l i d a y s a n d l a t e s h i f t s .
2 I n c l u d e s d a t a f o r r e g i o n s i n a d d i t i o n t o t h o s e s h o w n s e p a r a t e l y .
3 I n c l u d e s d a t a f o r w o r k e r s in c l a s s i f i c a t i o n s in a d d i t i o n t o t h o s e
s h o w n s e p a r a t e l y .
N O T E : D a s h e s i n d i c a t e t h a t n o d a t a w a s r e p o r t e d o r t h a t d a t a d i d n o t m e e t p u b l i c a t i o n c r i t e r i a .
12Digitized for FRASER http://fraser.stlouisfed.org/ Federal Reserve Bank of St. Louis

(Percent of production workers by method of wage payment,1 United Statfes and selected regions, September 1977)
Table 7. Flour and other grain mill products: Method of wage payment
Method of wage payment
UnitedStates2
MiddleAtlantic Border States Southeast Southwest Great Lakes Middle West Mountain Pacific
All workers............................................ 100 100 100 100 100 100 100 100 100
Time-rated workers.................................. 99 100 100 100 100 99 100 100 100Formal plans.......................................... 91 92 49 56 93 99 100 98 100
Single ra te ........................................... 85 84 12 47 74 92 100 98 100Range of rates.................................... 7 7 37 9 19 8 - - _
Individual ra tes ...................................... 8 8 51 44 7 ~ “ 2 -
1 For definition of method of wage payment, see appendix A. NOTE: Because of rounding, sums of individual items may not equal totals.2 Includes data for regions in addition to those shown separately.
Table 8. Flour and other grain mill products: Scheduled weekly hours
(Percent of production workers by scheduled weekly hours,1 United States and selected regions, September 1977)
Is
Weekly hours UnitedStates2
MiddleAtlantic Border States Southeast Southwest Great Lakes Middle West Mountain Pacific
All workers............................................ 100 100 100 100 100 100 100 100 100
Under 40 hours........................................ 5 8 _ _ _ 12 _40 hours................................................... 52 54 51 42 78 39 62 55 6141 to 43 hours ......................................... 2 - - 13 - - - _44 hours................................................... 7 - - 8 - 16 - _ 1945 to less than 48 hours ........................ 9 8 23 20 - 14 _ 2748 hours.................................................... 17 29 26 12 7 12 22 16 2048 hours or m ore..................................... 7
'” 4 15 6 16 2 -
1 Data relate to the predominant schedule for full-time day-shift workers in each NOTE: Because of rounding, sums of individual items may not equal 100. establishment.
2 Includes data for regions in addition to those shown separately.
Digitized for FRASER http://fraser.stlouisfed.org/ Federal Reserve Bank of St. Louis

(Percent of production workers by shift differential provisions,’ United States and selected regions, September 1977)
Table 9. Flour and other grain mill products: Shift differential provisions
Shift differential UnitedStates1 2
MiddleAtlantic Border States Southeast Southwest Great Lakes Middle West Mountain Pacific
Second shift
Workers in establishments withsecond-shift provisions........................... 96.5 92.3 76.6 84.7 100.0 100.0 100.0 100.0 100.0With shift differential.............................. 88.4 92.3 37.9 52.2 92.3 91.4 100.0 100.0 100.0
Uniform cents per hour ...................... 88.0 92.3 37.9 52.2 92.3 91.4 100.0 89.9 100.0Under 12 cents................................ 10.7 8.5 12.1 6.5 47.0 10.5 8.2 2.1 -12 cents............................................ 56.3 71.4 25.7 12.0 25.4 63.3 71.1 75.2 57.913 cents............................................ 1.2 - - - 17.3 - - - -14 cents............................................ 1.7 - - 8.8 - 2.3 - - -15 cents............................................ 10.5 2.7 - 24.9 - 2.6 20.7 12.6 14.216 cents............................................ .6 4.8 - - - - - - -18 cents............................................ 1.2 - - - - - - - 15.519 cents............................................ 1.0 - - - - - - - 12.420 cents............................................ 4.1 - - - 2.6 12.8 - - -25 cents............................................ .6 5.0 - - - - - - -
Other formal paid differential............. .5 - - 10.1 -
Third or other late shift
Workers in establishments with third-or other late-shift provisions.................. 94.3 87.3 65.4 79.0 92.3 100.0 100.0 97.9 100.0With shift differential............................. 87.7 87.3 37.9 52.2 92.3 91.4 100.0 97.9 100.0
Uniform cents per hour ...................... 87.3 87.3 37.9 52.2 92.3 91.4 100.0 87.8 100.0Under 12 cents................................ 6.8 8.5 - 6.5 18.5 5.8 8.2 - -12 cents............................................ 1.6 - - - - 5.3 - - -14 cents............................................ 1.4 - - - - 4.7 - - - -15 cents............................................ 13.0 11.0 12.1 3.6 42.3 12.8 13.8 - 9.616 cents............................................ 2.7 4.8 25.7 - - 4.4 - - -
17 cents............................................ 3.0 - - - 17.3 - 7.4 - -18 cents............................................ 2.4 - - 20.8 - - - - -20 cents............................................ 42.3 46.2 - 7.0 7.0 40.8 60.5 87.8 62.5Over 20 and under 25 cents .......... 1.0 2.7 - - - 2.3 - - -25 cents............................................ 6.5 - - 14.3 - 8.2 10.1 - -30 cents............................................ 1.9 - - - 2.6 2.6 - - 12.4Over 30 and under 35 cents .......... 2.6 - - - - 4.6 - - 15.5Over 35 cents.................................. 2.0 14.2 - ■,yr - 4.5 : w , . - - -
Other formal paid differential............. .5 ” ” “ “ “ 10.1
1 Refers to policies of establishments currently operating late shifts or having NOTE: Because of rounding, sums of individual items may not equal totals, provisions covering late shifts.
2 Includes data for regions in addition to those shown separately.** it ir j’i Sk w Kicjsk ot-aisKte ■
Digitized for FRASER http://fraser.stlouisfed.org/ Federal Reserve Bank of St. Louis

(Percent of production workers employed on late shifts by amount of pay differential, United States and selected regions, September 1977)
Table 10. Flour and other grain mill products: Shift differential practices
Shift differential UnitedStates1
MiddleAtlantic Border States Southeast Southwest Great Lakes Middle West Mountain Pacific
Second shift
Workers employed on second shift ....... 17.1 16.0 11.5 12.0 18.1 18.3 19.5 ' 17.2 15.9Receiving differential ............................ 16.3 16.0 5.9 7.8 17.6 18.1 19.5 17.2 15.9
Uniform cents per hour ...................... 16.3 16.0 5.9 7.8 17.6 18.1 19.5 15.8 15.9Under 12 cents................................ 2.0 .9 2.4 - 8.6 2.5 2.0 .6 _12 cents............................................ 11.1 13.6 3.6 1.7 6.1 13.5 14.6 12.2 8.213 cents............................................ .2 - - - 2.6 - - _ _14 cents............................................ .2 - - 1.2 - .2 - - _15 cents............................................ 1.8 .3 - 4.8 - .3 2.9 2.9 3.016 cents............................................ .1 1.1 - - - - - _ _18 cents............................................ .1 - - - - - - _ 1.319 cents............................................ .3 - - - - - - - 3.320 cents............................................ .5 - - - .3 1.6 - _ _25 cents............................................ - - - - - - - _ _
Other formal paid differential............. .1 - - - - - - 1.5 -
Third or other late shift
Workers employed on thirdor other late sh ift.................................... n 11.5 14.6 7.1 6.0 9.5 12.8 12.3 12.2 10.4Receiving differential ............................ 11.1 14.6 3.6 4.5 9.5 12.5 12.3 12.2 10.4
Uniform cents per hour...................... 11.1 14.6 3.6 4.5 9.5 12.5 12.3 11.8 10.4Under 12 cents................................ .9 1.4 - - 3.2 1.7 - - -12 cents............................................ .1 - - - - .4 - _ _14 cents............................................ .2 - - - - .6 - _ _15 cents........................................... 1.6 .9 - .3 2.2 1.5 3.0 _ .816 cents............................................ .3 1.1 3.6 - - .2 - _ _17 cents............................................ .2 - - - 1.3 - .6 _ _18 cents............................................ .2 - - 1.9 - - - _ _20 cents........................................... 6.2 8.1 - 1.8 2.1 6.4 7.6 11.8 7.3Over 20 and under 25 cents .......... .1 .2 - - - .2 - _25 cents........................................... .5 - - .5 - .6 1.1 _ _30 cents........................................... .2 - - - .3 .3 - - 1.5Over 30 and under 35 cents .......... .2 - - - - .5 - _ .8Over 35 cen ts.................................. .4 2.7 - - .4 - - _
Other formal paid differential............. I2) “ ” ” “ “ .4 -
1 Includes data for regions in addition to those shown separately. NOTE: Because of rounding, sums of individual items may not equal totals.2 Less than 0.05 percent.
Digitized for FRASER http://fraser.stlouisfed.org/ Federal Reserve Bank of St. Louis

(Percent of production workers with formal provisions for paid holidays, United States and selected regions, September 1977)
Table 11. Flour and other grain mill products: Paid holidays
Number of paid holidays
UnitedStates'
MiddleAtlantic Border States Southeast Southwest Great Lakes Middle West Mountain Pacific
All workers............................................ 100 100 100 100 100 100 100 100 100
Workers in establishmentsproviding paid holidays........................... 99 100 89 98 100 100 100 100 1003 days ..................................................... 1 - “ 6 - - - 2 -5 days ..................................................... 4 21 19 - - - -
6 days ..................................................... 9 16 51 25 7 - 8 - -7 days..................................................... 1 - - 6 - - - 10 -7 days plus 1 half days......................... (1 2) - - 4 - - - - -8 days..................................................... 6 - 12 - 10 9 9 - -9 days ..................................................... 12 - 26 22 39 13 8 - -10 days ................................................... 22 11 - 14 11 34 27 - 2310 days plus 2 half days....................... {*) 3 - - - - - - -
11 days................................................... 43 65 - - 14 44 47 88 7712 days plus 1 half day......................... 1 5 “
" '— “ “ “
1 Includes data for regions in addition to those shown separately. NOTE: Because of rounding, sums of individual items may not equal totals.2 Less than 0.5 percent.
Digitized for FRASER http://fraser.stlouisfed.org/ Federal Reserve Bank of St. Louis

(Percent of production workers with formal provisions for paid vacations after selected periods of service, United States and selected regions, September 1977)
Table 12. Flour and other grain mill products: Paid vacations
Vacation policy UnitedStates1
MiddleAtlantic Border States Southeast Southwest Great Lakes Middle West Mountain
/Pacific
All workers............................................ 100 100 100 100 100 100 100 100 100
Method of payment
Workers in establishmentsproviding paid vacations........................ 100 100 100 100 100 100 100 100 100Length-of-time payment....................... 92 89 88 100 100 92 82 100 100Percentage payment............................. 8 11 12 - - 8 18 - -
Amount of vacation pay2
After 1 year of service:Under 1 week........................................ 2 11 - 4 - - - _ _1 week................................................... 60 89 100 71 96 31 58 26 80Over 1 and under 2 weeks................... 34 - - 12 4 65 33 72 152 weeks................................................. 2 - - 14 - - _ 2 5Over 2 and under 3 weeks................... 3 - - - - 3 9 _
After 2 years of service:1 week................................................... 23 24 100 51 39 21 10 _ _Over 1 and under 2 weeks................... 5 - - 16 11 8 _ _ _2 weeks ................................................. 37 68 - 33 45 10 48 28 77Over 2 and under 3 weeks................... 34 8 - - 4 60 42 72 23
After 3 years of service:1 week................................................... 8 24 61 31 - - _ _ - _Over 1 and under 2 weeks................... 1 - - 4 11 - _ _ _2 weeks ................................................. 50 68 39 53 84 23 58 28 77Over 2 and under 3 weeks................... 41 8 - 12 4 77 42 72 23
After 5 years of service:1 week................................................... 6 11 44 24 - _ _ _ _Over 1 and under 2 weeks................... 1 - - 4 11 _ _ _ _2 weeks ................................................. 49 81 42 60 84 23 51 28 62Over 2 and under 3 weeks................... 41 8 - 12 4 77 42 72 233 weeks ................................................. 3 - 14 - - - 7 _ 16
After 10 years of service:1 week................................................... 4 - 44 24 - - _ _ _Over 1 and under 2 weeks................... 2 11 - - 11 - - _ _
2 weeks ................................................. 8 13 16 20 25 - 8 2 _
Over 2 and under 3 weeks................... 1 8 - 4 - - - _ _3 weeks ................................................. 44 68 39 40 59 23 50 26 77Over 3 and under 4 weeks................... 40 - - 12 4 77 42 72 23
After 15 years of service:1 week................................................... 4 - 44 24 - - _ _ _2 weeks ................................................. 7 19 4 17 15 - 8 2 _Over 2 and under 3 weeks................... 1 8 - 4 - - - _ _3 weeks ................................................. 15 5 51 29 60 8 10 10 _
Over 3 and under 4 weeks.............. .... 9 - - 12 - 21 4 _ _4 weeks ................................................. 32 68 - 14 21 15 40 16 77Over 4 and under 5 weeks................... 31 “ “ 4 56 38 72 23
See footnotes at end of table.
Digitized for FRASER http://fraser.stlouisfed.org/ Federal Reserve Bank of St. Louis

(Percent of production workers with formal provisions for paid vacations after selected periods of service, United States and selected regions, September 1977)
Table 12. Flour and other grain mill products: Paid vacations—Continued
Vacation policy UnitedStates'
MiddleAtlantic Border States Southeast Southwest Great Lakes Middle West Mountain Pacific
Amount of vacation pay2—Continued
After 20 years of service:1 w eek............................. ...................... 4 - 44 24 - - - _ _2 weeks .................................................. 6 8 4 17 15 - 8 2 _Over 2 and under 3 weeks................... 2 19 - - - - _ _ _3 weeks .................................................. 6 5 26 13 43 - - - _Over 3 and under 4 weeks................... 2 - - 4 - 4 _ - _4 weeks .................................................. 18 - 26 30 20 17 23 10 12Over 4 and under 5 weeks................... 8 - - 12 - 19 4 - _5 weeks .................................................. 23 68 - - 18 6 27 16 65Over 5 and under 6 weeks................... 29 - - - 4 54 32 72 236 weeks .................................................. 2 - - - - - 7 _ _
After 25 years of service:31 week.................................................... 4 - 44 24 - - - _ _2 weeks .................................................. 6 8 4 17 15 - 8 2 _Over 2 and under 3 weeks................... 2 19 - - - - _ _3 weeks .................................................. 4 5 14 13 24 - - _ _Over 3 and under 4 weeks................... 0 - - 4 - - _ _ _4 weeks...................... ........................... 15 - 38 25 38 12 18 10Over 4 and under 5 weeks................... 9 - - 12 - 21 4 _ _5 weeks .................................................. 28 68 - 5 18 11 32 16 77Over 5 and under 6 weeks................... 28 - - - 4 52 32 72 236 weeks .................................................. 2 - - 4 - - - 7 _Over 6 and under 7 weeks................... 1 ” “ " - 4 - - -
1 Includes data for regions in addition to those shown separately.2 Vacation payments, such as percent of annual earnings, were converted to an
equivalent time basis. Periods of service were chosen arbitrarily and do not necessarily reflect individual establishment provisions for progression. For example, changes indicated at 10 years may include changes that occurred between 5 and 10
years.3 Vacation provisions were virtually the same after longer periods of service.4 Less than 0.5 percent.
NOTE: Because of rounding, sums of individual items may not equal totals.
Digitized for FRASER http://fraser.stlouisfed.org/ Federal Reserve Bank of St. Louis

(Percent of production workers with specified health, insurance, and retirement plans,' United States and selected regions, September 1977)
Table 13. Flour and other grain mill products: Health, insurance, and retirement benefits
Type of plan UnitedStates2
MiddleAtlantic Border States Southeast Southwest Great Lakes Middle West Mountain Pacific
All workers............................................ 100 100 100 100 100 100 100 100 100
Workers in establishments providing:
Life insurance........................................ 97 92 71 90 100 100 100 100 100Noncontributory plans......................... 88 92 31 77 66 91 100 98 88
Accidental death anddismemberment insurance .................. 70 81 71 49 67 66 74 63 95Noncontributory plans......................... 62 81 31 45 32 57 74 61 83
Sickness and accident insuranceor sick leave or both3 .......................... 87 92 71 63 79 100 83 98 81Sickness and accident insurance ...... 80 87 43 57 69 100 83 61 57
Noncontributory plans...................... 74 87 31 49 51 91 83 61 44Sick leave (full pay,no waiting period) ............................. 8 13 40 6 10 9 2 - 5
Sick leave (partial payor waiting period).............................. 6 - - - - - - 37 61
Long-term disability insurance.............. 15 25 - 25 16 11 8 27 20Noncontributory plans........................ 14 25 - 25 16 11 8 27 8
Hospitalization insurance...................... 100 100 100 99 100 f -s; 100 -j 100 ,oi 100 100Noncontributory plans........................ 90 92 88 83 64 91 100 98 88
Surgical insurance................................. 100 100 100 96 100 100 ~ 100 100 100Noncontributory plans......................... 90 92 88 80 64 91 100 98 88
Medical insurance................................. 99 100 94 90 100 100 100 100 100Noncontributory plans........................ 89 92 82 77 64 91 100 98 88
Major medical insurance....................... 96 100 94 90 90 92 100 100 100Noncontributory plans........................ 86 92 82 74 54 83 100 98 88
Retirement plans4.................................. 87 92 38 58 57 92 100 98 100Pensions............................................. 87 92 38 58 57 92 100 98 100
Noncontributory plans...................... 83 87 38 46 57 92 98 98 77Severance pay.................................... 2 14 - - - - - - _
No plans................................................ (5) “ 1 ” “ “ - -
' Includes those plans for which the employer pays at least part of the cost and excludes legally required plans such as workers’ compensation and social security: however, plans required by State temporary disability laws are included if the employer contributes more than is legally required or the employees receive benefits in excess of legal requirements. “ Noncontributory plans” include only those plans financed entirely by the employer.
2 Includes data for regions in addition to those shown separately.
3 Unduplicated total of workers receiving sickness and accident insurance and sick leave shown separately.
4 Unduplicated total of workers covered by pension plans and severance pay shown separately.
5 Less than 0.5 percent.
NOTE: Because of rounding, sums of individual items may not equal totals.
Digitized for FRASER http://fraser.stlouisfed.org/ Federal Reserve Bank of St. Louis

(Percent of production workers in establishments providing funeral leave pay, jury-duty leave, and technological severance pay,1 United States and selected regions, September 1977)
Table 14. Flour and other grain mill products: Other selected benefits
Type of benefit UnitedStates2
MiddleAtlantic Border States Southeast Southwest Great Lakes Middle West Mountain Pacific
Workers in establishments with provisions for:
Funeral leave............................................. 88 92 56 53 82 91 100 88 100Jury-duty leave ........................................... 87 92 56 49 82 91 100 88 100Technological severance pay................... 44 65 " " 23 48 48 88 64
1 For definition of items, see appendix A. Includes data for regions in addition to those shown separately.
Digitized for FRASER http://fraser.stlouisfed.org/ Federal Reserve Bank of St. Louis

Part II. Rice Milling
EarningsStraight-time earnings of about 2,600 production and
related workers ip rice mills averaged $3.85 an hour in September 1977 (table 15). Individual earnings in the industry were widely dispersed-the middle 50 percent of the workers had earnings between $2.75 and $3.86 (table 16). The index of dispersion-34-was the highest of the four industries studied and one of the highest among the industries in the Industry Wage Survey program .7 The primary explanation for the broad range of earnings appears to be wide differences in pay levels among establishments; hourly mill averages, for example, ranged from $2.54 to $7.68. Within establishments, in contrast, the 25 rice mills visited had an average index of dispersion of only 12.
Location in metropolitan areas and unionization seem to be associated with higher pay levels in the industry- a pattern usually found in BLS wage surveys. The hourly differential for mills in metropolitan areas over those in smaller communities was $1.63 and for union mills over nonunion mills, 94 cents. But for mills in metropolitan areas, an anomaly occurs-workers in nonunion mills enjoyed a 38-cent advantage over their union counterparts. For nonunion mills, the wage advantage of metropolitan areas over smaller communities widened to $2.17. Survey averages do not isolate the independent influence of wage-determining characteristics, which are often found in combination.
The occupations studied accounted for three-fifths of the rice milling work force. Job averages ranged from $2.89 for receivers to $6.41 for maintenance electricians (table 17). Except for electricians and general utility mechanics ($5.11), job averages did not exceed $4.40 an hour.
Workers in processing occupations, the largest group, averaged $3.85 an hour; within this category, cookers and driers averaged $4.40; polishers and separators, $3.49; and hullers and pearlers, $3.46. Averages for two other populous classifications were $3.54 an hour for rice packers and $3.56 for material-handling laborers.
Rates of pay were widely dispersed for some jobs, and concentrated in narrow bands for others. For example, the dispersion index was 99 for janitors and 74 for cookers and driers, contrasted with 7 for polishers and separators and 10 for bulk cleaners. The substantial difference in pay levels among establishments explains to a large extent the dispersed earnings.
Men in rice mills averaged $3.91 an hour compared to $3.43 for women, who made up one-eighth of the work force. Part of the difference is attributable to the way workers were distributed among occupations with disparate pay levels. Nearly half the women, for example, were rice packers, with a $3.07 average, while nearly all of the higher paid maintenance workers and cookers and driers were men.
Establishment practices and supplementary wage provisions
Scheduled weekly hours. Nearly four-fifths of the industry’s production workers were in mills scheduling a 40-hour workweek. Most of the remaining workers were on longer work schedules.
Shift provisions and practices. Most rice mill workers were employed in establishments that had provisions for late shifts but usually not for premium pay for such work (table 19). Where premiums for shift work were stipulated, typical differentials over day-shift rates were 12.5 cents for the second shift and 22.5 cents for the third shift. At the time of the survey, slightly over one- fifth of the production workers were employed on second shifts and one-tenth on third or other late shifts. One-fourth of the second-shift workers and one-half of the third-shift workers received premium pay.
Paid holidays. Paid holidays were provided to 95 percent of the rice mill work force (table 20). Provisions varied widely among establishments-the majority of the workers were granted anywhere from 4 to 10 days a year.
Paid vacations. Approximately four-fifths of the workers were provided paid vacations after qualifying periods of service (table 21). Typical vacations were 2 weeks’ pay after 1 year of service and at least 3 weeks after 12 years. After longer periods of service, 4 weeks or more were available to about one-fifth of the workers.
Health, insurance, and retirement plans. At least seven-eighths of the production workers were provided
7 The index of dispersion was computed by dividing the difference between the first and third quartiles (middle range) by the median. Indexes o f dispersion in the other grain milling branches in this report were 28 in flour mills, 30 in blended flour mills, and 13 in wet corn mills.
21Digitized for FRASER http://fraser.stlouisfed.org/ Federal Reserve Bank of St. Louis

life, hospitalization, surgical, basic medical, and major medical insurance (table 22). For a majority of workers with these benefits, the employer and employee shared the cost. Two-thirds of the workers had accidental death and dismemberment policies, and about half were under pay-continuation plans covering shortterm illness or disability.
Slightly over seven-tenths of the workers were covered by retirement pension plans, usually financed en
tirely by the employer. One-eighth of the workers were also covered by retirement severance pay plans.
Other selected benefits. Time off with pay to attend funerals of specified relatives was provided by rice mills employing three-tenths of the workers. Similar arrangements for jury-duty service applied to six-tenths of the work force (table 23). Technological severance pay was not provided by the mills visited.
2 2Digitized for FRASER http://fraser.stlouisfed.org/ Federal Reserve Bank of St. Louis

Table 15. Rice milling: Average hourly earnings by selected characteristics( N u m b e r a n d a v e r a g e s t r a i g h t - t i m e e a r n i n g s 1 of p r o d u c t i o n w o r k e r s b y s e l e c t e d c h a r a c t e r i s t i c s , U n i t e d S t a t e s , S e p t e m b e r 1 97 7)
C h a r a c t e r i s t i cU n i t e d S t a t e s
C h a r a c t e r i s t i cU n i t e d S t a t e s
W o r k e r s E a r n i n g s W o r k e r s E a r n i n g s
S I Z E OF COMMUNITY: 31 , 4 0 8 $ 9 . 6 11 , 2 3 9 2 . 9 8
3 5 1
9 6 01 , 6 8 2
3 . 9 3
3 . 7 83 . 8 9 ;‘i
S I Z E OF E STA BLI SH SEN T?LABOR-MANAGEMENT CONTRACTS:
ESTABLISHMENTS WITH-MJJO BI TY OF NORKERS C O V E R E D . . . 8 7 8 4 . 4 8NONE OB t l l l i G B I T I OF HOBKEBS. . . 1 , 7 6 4 3 . 5 9
1 E x c l u d e s p r e m i u m p a y f o r o v e r t i m e f o r w o r k o n w e e k e n d s , h o l i - 3 S t a n d a r d M e t r o p o l i t a n S t a t i s t i c a l A r e a a s d e f i n e d b y t h e U. S . O f -d a y s , a n d l a t e s h i f t s . f i c e o f M a n a g e m e n t a n d B u d g e t t h r o u g h F e b r u a r y 1 9 74 .
2 V i r t u a l l y a l l w o r k e r s w e r e l o c a t e d i n t h e S o u t h w e s t r e g i o n . N O T E : D a s h e s i n d i c a t e t h a t n o d a t a w e r e r e p o r t e d o r t h a t d a t a d i d n o tm e e t p u b l i c a t i o n c r i t e r i a .
Table 16. Rice milling: Earnings distribution
d a y s ,1 E x c l u d e s p r e m i u m p a y f o r o v e r t i m e a n d f o r w o r k o n w e e k e n d s , a n d l a t e s h i f t s .2 V i r t u a l l y a l l w o r k e r s w e r e l o c a t e d i n th e S o u t h w e s t r e g i o n .
h o l i - N O T E : D a s h e s i n d i c a t e t h a t n o d a t a w e r e r e p o r t e d .
2 3Digitized for FRASER http://fraser.stlouisfed.org/ Federal Reserve Bank of St. Louis

Table 17. Rice milling: Occupational averages—all establishments( N u m b e r a n d a v e r a g e s t r a i g h t - t i m e e a r n i n g s 1 of p r o d u c t i o n w o r k e r s in s e l e c t e d o c c u p a t i o n s , U n i t e d S t a t e s , S e p t e m b e r 197 7)
D e p a r t m e n t a n d o c c u p a t i o n
N u m b e r
of
w o r k e r s
U n i t e d S t a t e s 2
D e p a r t m e n t a n d o c c u p a t i o n
N u m b e r
o f
w o r k e r s
U n i t e d S t a t e s 2
H o u r l y e a r n i n g s 1 H o u r l y e a r n i n g s 1
M e a n M e d i a n M i d r a n g e M e a n M e d i a n M i d r a n g e
ELEVATOR OPERATORS PACKING-Continued
. 3 3 3 S 3 . 5 9 S 3 . 0 0 $ 2 . 5 0 - * 3 . 5 21 7 6 3 . 9 6 3 . 3 3 2 . 7 5 - 4 . 2 51 57 3 . 0 7 2 . 6 0 2 . 5 0 - 3 . 3 5
HEN...................................................................... 1 1 5 2 . 8 9 2 . 6 0 2 . 5 0 - 3 . 1 6WEIGHERS................................................................ 9 0 3 . 4 2 3 . 0 1 2 . 7 5 - 3 . 6 9 HATERIAL H0VEHEN1
HEN...................................................................... 3 7 3 . 4 5 2 . 7 5 2 . 7 5 - 4 . 2 5LABORERS, HATERIAL HANDLING................ 3 3 7 3 . 5 6 3 . 2 5 2 . 9 5 - 3 . 5 C
PROCESSING HEN............................................................................... 2 7 8 3 . 9 8 3 . 2 5 2 . 7 5 - 3 . 5 CTRUCKERS, POWER.................................................... 83 3 . 9 4 3 . 3 5 2 . 9 3 - 3 . 8 5
82 3 . 9 4 3 . 3 5 2 . 8 9 - 3 . 8 5
3 . 3 5 81 3 . 9 9 3 . 3 5 2 . 8 5 - 3 . 8 58 0 3 . 9 9 3 . 3 3 2 . 8 5 - 3 . 8 5
COOKERS AND D R I E R S ............................ 7<t 9 . 9 0 3 . 7 7 3 . 2 0 - 6 . 0 0HEN...................................................................... 71 9 . 3 9 3 . 7 3 3 . 2 2 - 6 . 0 0 MAINTENANCE
HULLERS AND PEA RL E RS ...................... 1 97 3 . 4 6 3 . 2 0 2 . 7 5 - 3 . 8 927 6 . 9 1 6 . 5 0 5 . 5 0 - 7 . 6 1
P O L IS H E R S AND SEPARATORS-------- 85 3 . 9 9 3 . 4 5 3 . 2 5 - 3 . 5 0 HEN............................................................................... 2 7 6 . 4 1 6 . 5 0 5 . 5 0 - 7 . 6 881 3 . 98 3 . 0 0 - 3 . 5 0 69 5 . 1 1 5 . CO 4 . 0 0 - 5 . 7 5
HEN............................................................................... 6 9 5 . 1 1 5 . 0 0 9 . 0 0 - 5 . 7 5PACKING
SE RV IC E AND CUSTODIALPACKERS................................................................... 3 6 7 3 . 4 9 3 . 0 0 2 . 5 0 - 3 . 5 2
HEN....................................................................... 2 1 0 3 . 8 0 3 . 2 5 2 . 7 5 - 3 . 8 5 JA N I T O R S , P O RI RE S ANC C L E A N E R S . . . . 6 0 9 . 0 7 3 . 5 0 2 . 3 0 - 5 . 7 73 7 9 . 9 6 5 . 2 0 2 . 5 0 - 5 . 7 :2 3 3 . 9 6 2 . 3 0 2 . 3 0 - 5 . 3 1
HEN....................................................................... 39 2 . 9 6 2 . 5 0 2 . 5 0 - 3 . 1 9
1 E x c l u d e s p r e m i u m p a y f o r o v e r t i m e a n d f o r w o r k o n w e e k e n d s , h o l i d a y s , a n d l a t e s h i f t s . S e e a p p e n d i x A f o r d e f i n i t i o n of m e a n s , m e d i a n , a n d m i d d l e r a n g e s . M e d i a n s a n d m i d d l e r a n g e s w e r e n o t c o m p u t e d f o r o c c u p a t i o n s w i t h f e w e r t h a n 15 w o r k e r s .
2 V i r t u a l l y a l l w o r k e r s w e r e l o c a t e d i n t h e S o u t h w e s t r e g i o n .3 I n c l u d e s d a t a f o r w o r k e r s i n c l a s s i f i c a t i o n s i n a d d i t i o n t o t h o s e
s h o w n s e p a r a t e l y .
Table 18. Rice milling: Occupational averages by selected characteritics( N u m b e r a n d a v e r a g e s t r a i g h t - t i m e e a r n i n g s 1 of p r o d u c t i o n w o r k e r s i n s e l e c t e d o c c u p a t i o n s , U n i t e d S t a t e s , S e p t e m b e r 1 9 77)
U n i t e d S t a t e s 2
D e p a r t m e n t a n d o c c u p a t i o n M e t r o p o l i t a na r e a s
N o n m e t r o p o l i t a na r e a s
L e s s t h a n 1UU w o r k e r s
100 w o r k e r s o r m o r e U n i o n N o n u n i o n
W o r k e r s
E a r n i n g s
W o r k e r s
E a r n i n g s
W o r k e r s
E a r n i n g s
W o r k e r s
E a r n i n g s
W o r k -e r s
E a r n i n g s
W o r k -e r s
E a r n i n g s
ELEVATOR OPERATORS
CLEANERS, BULK.......................................................... .. ........................... 29 $ 3 . 9 2 - - _ - 22 $ 9 . 0 7 18 $ 3 . 4 7 c $ 4 . 6 5RE C E I V E R S ....................................................................................................... .. 31 3 . 3 7 66 $ 2 . 7 1 99 $ 2 . 8 1 7 3 2 . 9 4 - - 9 9 2 . 7 5WEIGHERS........................................................................................................... 16 4 . 2 2 29 2 . 8 8 2 2 2 . 8 6 18 9 . 10 - 2 8 3 . 1 7
PROCESSING
PROCESSORS.1 2 3.......................................................................... .. 2 1 0 9 . 6 1 2 0 2 3 . 0 7 2 0 8 3 . 7 2 2 0 4 3 . 9 9 1 2 7 9 . 8 6 2 8 5 3 . 4 0COOKERS AND D R I E R S ...................................................................... 4 5 4 . 9 7 29 3 . 5 1 26 3 . 4 9 98 4 . 8 9 - - 9 9 9 . 5 6HULLERS AND PEARLERS........................................ ...................... 58 9 . 1 1 69 3 . 0 9 9 6 2 . 9 3 51 4 . 4 7 2 7 4 . 2 8 1 2 0 3 . 2 8PO L I S H E R S AND SEPARATORS...................... ... , . | 99 3 . 6 9 36 3 . 2 1 30 3 . 0 2 55 3 . 7 9 3 3 3 . 6 5 5 2 3 . 3 8
PACKING
PACKERS.............................................................................................................. 1 42 9 . 7 0 2 2 5 2 . 7 2 169 3 . 4 7 2 0 3 3 . 5 1 1 0 2 4 . 5 0 2 6 5 3 . 1 0BRAN................................................................................................................ - - 2 9 2 . 6 6 22 2 . 9 9 - - • 2 5 2 . 6 6R I C E ................................................................................................................ 1 3 7 9 . 7 0 1S6 2 . 7 3 1 42 3 . 5 5 191 3 . 5 9 97 9 . 9 9 2 3 6 3 . 16
HATERIAL HOVEHENT
LABORERS, HATERIAL HANDLING..........................• • • • • • • • 2 3 8 3 . 8 8 99 2 . 8 1 6 2 2 . 8 9 2 7 5 3 . 7 3 1 3 9 3 . 3 5 2 0 3 3 . 7 1TRUCKERS, POWER...................................................................................... 99 9 . 6 0 34 2 . 9 8 27 9 . 1 3 56 3 . 8 9 39 4 . 3 5 9 9 3 . 6 5
F O R K L IF T .................................................................................................... 97 4 . 6 3 39 2 . 9 8 27 4 . 1 3 59 3 . 8 4 3 2 9 . 3 8 9 9 3 . 6 5
HAINTENANCE
E L E C T R I C I A N S ............................................................................................... 25 6 . 6 1 _ _ _ _ 2 2 6 . 3 7 19 6 . 3 3HE CHANICS. GENERAL O T I I I T T ............................... .................... 45 5 . 6 9 24 4 . 0 3 24 9 . 6 6 45 5 . 3 6 31 5 . 8 4 3 8 4 . 5 2
SE RVI CE AND CUSTODIAL
JA N I T O R S , PORTERS,AND CLEANERS............. ... 51 4 . 3 7 9 2 . 4 1 19 2 . 3 1 - - - 5 2 4 . 1 6
1 E x c lu d e s p re m iu m p ay fo r o v e r tim e an d f o r w o rk on w e e k e n d s , h o l i d a y s , an d la te s h if ts .
2 V i r t u a l l y a l l w o r k e r s w e r e l o c a t e d i n t h e S o u t h w e s t r e g i o n .3 I n c l u d e s d a t a f o r w o r k e r s i n c l a s s i f i c a t i o n s i n a d d i t i o n to t h o s e
s h o w n s e p a r a t e l y .
N O T E : D a s h e s i n d i c a t e t h a t n o d a t a w e r e r e p o r t e d o r t h a t d a t a d i d n o t m e e t p u b l i c a t i o n c r i t e r i a .
2 4Digitized for FRASER http://fraser.stlouisfed.org/ Federal Reserve Bank of St. Louis

(Percent of production workers by shift differential provisions,1 and percent employed on late shifts by amount of differential, United States, September 1977)
Table 19. Rice milling: Shift differential provisions and practices
Item United States Item United States
Shift provisions Shift practices
Workers in establishments withsecond-shift provisions............................With shift differential ..............................
90.720.1
Workers employed on second sh ift.........Receiving differential..............................
22.24.7
Uniform cents per hour........................ 20.1 Uniform cents per hour........................ 4.75 cents ............................................... 2.1 5 cents ...............................................12.5 cents .......................................... 11.7 12.5 cents.......................................... 3.917 cents ............................................. 6.4 17 cents ............................................. .8
Workers in establishments with third- or other late-shift provisions.................... 62.5
Workers employed on third or other late sh ift..................................... 9.8
With shift differential .............................. 20.1 Receiving differential.............................. 4.6Uniform cents per hour........................ 20.1 Uniform cents per hour........................ 4.6
22 cents ............................................. 6.4 22 cents .......................................... 822.5 cents.......................................... 11.7 22.5 cents .......................................... 3.9
1 Refers to policies of establishments currently NOTE: Because of rounding, sums of individualoperating late shifts or having provisions covering late items may not equal totals, shifts.
Table 20. Rice milling: Paid holidays
(Percent of production workers with formal provisions for paid holidays, United States, September 1977)
Number of paid holidays United States
100
Workers in establishments95
4 days ...................................................... 71311
7 days ...................................................... 13151918
NOTE: Because of rounding, sums of individual items may not equal totals.
25Digitized for FRASER http://fraser.stlouisfed.org/ Federal Reserve Bank of St. Louis

(Percent of production workers in establishments with formal provisions for paid vacations after selected periods of service, United States, September 1977)
Table 21. Rice milling: Paid vacations
Vacation policy United States Vacation policy United States
All workers ............................................ 100
Method of paymentWorkers in establishments
Amount of vacation pay1—Continued After 12 years of service:
1 week .................................................... 5providing paid vacations.......................... 82 2 weeks .................................................. 23Length-of-time payment......................... 82 3 weeks .................................................. 42
4 weeks .................................................. 12Amount of vacation pay1
After 1 year of service:1 week ....................................................
After 15 years of service:1 week .................................................... 5
29 2 weeks .................................................. 182 weeks .................................................. 53 3 weeks ....................................... 40
After 2 years of service:1 week ....................................................
4 weeks .................................................. 1812 After 20 years of service:
1 week ....................................................2 weeks .................................................. 69 5After 3 years of service:
1 week ....................................................2 weeks .................................................. 18
5 3 weeks ..................................... 382 weeks .................................................. 77 4 weeks .................................................. 8
After 5 years of service:1 week ....................................................
5 weeks .................................................. 125 After 30 years of service:2
1 week .........................................2 weeks .................................................. 43 53 weeks .................................................. 34 2 weeks .............................................. 18
After 10 years of service:1 week ....................................................
3 weeks .................................................. 385 4 weeks ........................... 2
2 weeks .................................................. 30 5 weeks ............................. 73 weeks .................................................. 35 6 weeks ............................................. 124 weeks .................................................. 12
1 Vacation payments, such as percent of annual earnings, were converted to an equivalent time basis. Periods of service were chosen arbitrarily and do not necessarily reflect individual establishment provisions for progression. For example, changes indicated at 10 years may include changes that occurred between 5
and 10 years.2 Vacation provisions were virtually the same after
longer periods of service.
NOTE: Because of rounding, sums of individual items may not equal totals.
26Digitized for FRASER http://fraser.stlouisfed.org/ Federal Reserve Bank of St. Louis

(Percent of production workers in establishments with specified health, insurance, and retirement plans,' United States, September 1977)
Table 22. Rice milling: Health, insurance and retirement plans
Type of plan
All workers ....................................
Workers in establishments providing:
Life insurance.................................Noncontributory plans.................
Accidental death anddismemberment insurance...........Noncontributory plans..................
Sickness and accident insuranceor sick leave or both2 ...................Sickness and accident insurance
Noncontributory plans ..............Sick leave (full pay,no waiting period).......................
Long-term disability insurance.......Noncontributory plans.................
United States Type of plan
100Workers in establishments providing:
Hospitalization insurance........................88 Noncontributory plans..........................43 Surgical insurance..................................
Noncontributory plans..........................66 Medical insurance...................................21 Noncontributory plans..........................
Major medical insurance.........................49 Noncontributory plans..........................16 Retirement plans3 ...................................16 Pensions ...............................................
Noncontributory p lans.......................42 Severance p a y .....................................14 No plans ..................................................12
United States
9744944194419340727259123
' Includes those plans for which the employer pays at least part of the cost and excludes legally required plans such as workers' compensation and social security; however, plans required by State temporary disability laws are included if the employer contributes more than is legally required or the employees receive benefits in excess of legal requirements. “ Noncontributory plans” include only those plans financed entirely by the employer.
2 Unduplicated total of workers receiving sickness and accident insurance and sick leave shown separately.
3 Unduplicated total of workers covered by pension plans and severance pay shown separately.
NOTE: Because of rounding, sums of individual items may not equal totals.
Table 23. Rice milling: Other selected benefits
(Percent of production workers in establishments providing funeral leave pay and jury-duty leave,’ United States, September 1977)
Type of benefit United States
Workers in establishmentswith provisions for:
Funeral leave ............................................. 29Jury-duty leave .......................................... 60
1 For definition of items, see appendix A.
27
Digitized for FRASER http://fraser.stlouisfed.org/ Federal Reserve Bank of St. Louis

Part III. Blended and Prepared Flour
EarningsThe almost 5,200 production and related workers in
blended flour mills averaged $6.14 an hour in September 1977 (table 24). Among the major regions, average earnings ranged from $4.57 in the Middle West to $6.93 in the Great Lakes, which accounted for nearly three- fifths of the industry’s work force. Most Great Lakes workers were in mills with characteristics typically associated with higher pay levels-large unionized work forces and metropolitan area locations.
Earnings in the industry were widely dispersed - the middle 50 percent of the workers in the earnings array earned between $5.30 and $7.26 an hour. The relatively high index of dispersion8 for blended flour mills-30- resulted primarily from differences in pay levels among establishments; mean earnings of individual mills, for example, ranged from approximately $3 an hour to about $7.50.
As in the other grain mills, there were substantial differences in nationwide average earnings in favor of workers in large establishments over those in mills with 20 to 9J) employees, union mills over nonunion mills, and metropolitan areas over workers in smaller communities. Occupational averages by these characteristics are presented, where possible, in tables 26-28. Due to the interrelationships of these characteristics and the relatively small industry under study, the exact influence of any one characteristic was not measured.
Among the occupations selected for separate study, hourly pay levels typically ranged between $5 and $6 outside the maintenance area and nearly $7.50 in that department (table 25). The highest industry averages were reported for maintenance electricians ($7.45) and general utility mechanics ($7.42) and the lowest average, for power truckers (other than forklift)-$4.33. As a group, workers in processing jobs averaged $5.89; 4 in every 5 were machine tenders who mixed and blended flour ($6.07 per hour).
Men in blended flour mills averaged $6.27 an hour compared with $5.80 for women; women were one- fourth of the production work force. Part of the pay spread between the sexes reflects differences in occupational staffing. For packers and janitors, though, pay levels for women exceeded those for men, both nationwide and in most of the regions.
Establishment practices and supplementary wage provisions
Scheduled weekly hours. Blended flour mills employing slightly over nine-tenths of the workers had weekly work schedules of 40 hours at the time of the survey (table 30). The remaining workers were on longer work schedules.
Shift differential provisions and practices. Provisions for second shifts covered almost all workers, and provisions for third or late shifts covered nine-tenths of the production work force (table 31). At the time of the survey, one-fourth of the workers actually were working on second shifts; they typically received 12 cents per hour in addition to day-shift rates (table 32). Third or other late-shift workers, about one-eighth of the production workers, were usually provided a 20-cent premium.
Paid holidays. All workers were in mills that provided paid holidays (table 33). Two-thirds of the workers were granted 11 days a year and one-tenth, 9 days. Most of the remaining workers were provided from 5 to 8 days. Provisions were most liberal in the Great Lakes region.
Paid vacations. All workers were eligible for paid vacations, after qualifying periods of service (table 34). Three-fifths were in mills that provided at least 1 week of vacation pay after 1 year of service, 2 weeks or more after 2 years, at least 3 weeks after 10 years, 4 weeks or more after 15 years, and at least 5 weeks after 20 years. Great Lakes workers usually were eligible for a few days more vacation than workers in other regions.
Health, insurance, and retirement plans. Hospitalization, surgical, basic medical, and major medical insurance plans covered all workers in the industry (table 35). Employers typically paid the entire cost of financing these benefits. Approximately three-tenths of the workers also were covered under long-term disability plans and by accidental death and dismemberment insurance.
Retirement pension plans, usually financed entirely by employers, were found in mills employing slightly
28Digitized for FRASER http://fraser.stlouisfed.org/ Federal Reserve Bank of St. Louis

over nine-tenths of the workers. One-eighth of the workers were also covered by retirement severance pay plans.
Where there were regional differences, worker coverage was usually highest in the Great Lakes region.
Other selected benefits. Pay for time off to attend funerals applied to approximately nine-tenths of the work
force; jury-duty pay applied to about eight-tenths (table 36). About seven-tenths of the workers were in mills that provided severance pay for workers permanently laid off due to technological change or economic factors. The Great Lakes region had the highest proportion of workers covered by these benefits.
29Digitized for FRASER http://fraser.stlouisfed.org/ Federal Reserve Bank of St. Louis

Table 24. Blended and prepared flour: Average hourly earnings by selected characteristics'■> irjo* . vhc
( N u m b e r a n d a v e r a g e s t r a i g h t - t i m e e a r n i n g s 1 o f p r o d u c t i o n w o r k e r s b y s e l e c t e d c h a r a c t e r i s t i c s , U n i te d S t a t e s a n d s e l e c t e d r e g i o n s , S e p t e m b e r 1977)____________________________________ ________________________________________________________________ __________________________________________________
C h a r a c t e r i s t i c s
U n i te d S t a t e s 2 S o u th w e s t
N u m b e ro f
w o r k e r s
H o u r l y e a r n i n g s 1 N u m b e ro f
w o r k e r s
H o u r l y e a r n i n g s 1
M e a n M e d ia n M id d le r a n g e M e a n M e d ia n M id d le r a n g e
ALL PRODUCTION W ORKERS.. . . . . . . . . . . . 5 , 187 $ 6 . 14 $ 6 . 4 9 $ 5 . 3 0 - $ 7 . 26 9 9 5 $ 5 . 1 2 $ 9 . 9 2 $ 9 . 3 9 - $ 6 . 1 8MEN...................................................................................... 3 , 8 4 2 6 . 27 6 . 5 6 5 . 9 5 - 7 . 4 5 3 9 7 5 . 2 0 5 . 9 5 4 . 4 9 - 6 . 2 8W om en. . . . . . . . . . . . . . . . . . . . . . . . . . . 1 , 3 4 5 5 . dO 6 . 2 3 5 . 0 6 - 7 . 0 1 1 9 8 9 . 9 2 9 . 5 2 4 . 3 9 - 6 . 0 4
S IZ E OF ESTABLISHM ENT:2 0 - 9 9 SOfiKERS........................................................ 7 8 9 9 . 85 4 . 5 0 3 . 5 0 - 6 . 1 0 _ - - _10 0 U 0B K ES5............................ ................................. 9 , 3 9 8 6 . 38 6 . 5 0 5 . 6 8 - 7 . 2 7 - - - -
S IZ E OF COMMUNITY:METBOPOLOTAN AREAS......................................... 9 , 6 5 9 6 . 41 6 . 5 7 5 . 6 8 - 7 . 2 7 - - - -
NONMEXROPOLITAN ARaA S................................ 4 6 6 3 . 53 3 . 4 0 3 . 0 0 - 3 . 79 - - - -
LABOR-MAN ASEHENT CONTRACTS:ESTABLISHM ENTS W ITH-
MAJORITY OF WORKERS COVERED___ 4 , 2 9 5 6 . 65 6 . 7 0 6 . 0 4 - 7 . 2 8 _ _ _ _
NONE O a M INORITY OF W O R K E R S ... 8 9 2 3 . 72 3 . 4 6 3 . 0 0 - 3 . 9 7 'G r e a t L a k e s M id d le W e s t
ALL PRODUCTION WORKERS..................................... 3 , 0 1 5 $ 6 . 93 $ 7 . 0 6 $ 6 . 4 9 - $ 7 . 6 0 6 3 2 $ 9 . 5 7 $ 9 . 5 0 $ 3 . 1 9 - $ 5 . 7 0Mc.N...................................................................................... 2 , 2 4 9 7 . 03 7 . 2 0 6 . 4 9 - 7 . 7 4 - - -WOMEN................................................................................ 7 6 6 6 . 6 1 7 . 0 1 6 . 3 7 - 7 . 20 2 0 5 3 . 9 0 3 . 2 5 2 . 6 5 - 5 . 9 5
S IZ E OF ESTA BLISH M EN T:2 0 - 9 9 mOu KERS............................ ........................... - - - - - - - -
1 0 0 WORKERS OR MORE.................................. .. 2 , 8 7 7 6 . 97 7 . 0 6 6 . 4 9 - 7 . 6 3 - - - -
S IZ E o f COMMUNITY:METROPOLITAN AREAS........................................ 3 , 0 1 5 6 . 9 3 7 . 06 6 . 4 9 - 7 . 6 0 - - - -
NONMETROPOLITAN AREAS............................... - - “ ~ - - -
RABOR-tlANAOiiaRNX CONTRACTS:ESTABLISHM ENTS W ITH-
MAJORITY OF WORKERS C O V ER ED .. . 2 , 8 2 8 7 . 12 7 . 12 6 . 5 3 - 7 . 65 - - - -
NONE ON MINORITY OP SORKERS. . .
I L L PRODUCTION WORKERS.S e n . . . WOMEN
P a c i f i c
2 8 4 $ 5 . 4 52 4 5 5 - 4 9
$ 5 - 6 95 . 6 9
$ 3 . 5 0 - $ 6 . 7 3 3 . 5 0 - 6 . 8 3
S IZ E OF ESTA BLISH M EN T:2 0 - 9 9 W ORKERS.....................................................1 0 0 WORKERS OB HQ he........... ..........................
S IZ E OF COMMUNITY:METROPOLITAN AREAS........................................NONMETROPOLITAN AREAS...............................
LABOR-MANAJfiMx.NT CONTRACTS: ESTABLISHM ENTS W IT ti-
M A JO R III OF WORKERS COVERED. . . NONE OR M INORITY OF WORKERS. . .
1 E x c l u d e s p r e m i u m p a y f o r o v e r t i m e a n d f o r w o r k o n w e e k e n d s , h o l i d a y s , a n d l a t e s h i f t s . S e e a p p e n d ix A f o r d e f i n i t i o n s o f m e a n s , m e d i a n s , a n d m i d d l e r a n g e s . M e d ia n s a n d m id d le r a n g e s w e r e n o t c o m p u te d f o r o c c u p a t i o n s w i th f e w e r t h a n 15 w o r k e r s .
I n c l u d e s d a t a f o r r e g i o n s in a d d i t i o n to t h o s e s h o w n s e p a r a t e l y .
3 S t a n d a r d M e t r o p o l i t a n S t a t i s t i c a l A r e a s a s d e f in e d b y t h e U .S . O f f ic e o f M a n a g e m e n t a n d B u d g e t t h r o u g h F e b r u a r y 1 9 7 4 .
. N O T E : D a s h e s i n d i c a t e t h a t n o d a t a w e r e r e p o r t e d o r t h a t d a t a d id n o t m e e t p u b l i c a t i o n c r i t e r i a .
3 0Digitized for FRASER http://fraser.stlouisfed.org/ Federal Reserve Bank of St. Louis

Table 25. Blended and prepared flour: Occupational averages— all establishments( N u m b e r a n d a v e r a g e s t r a i g h t - t i m e h o u r l y e a r n i n g s 1 o f p r o d u c t i o n w o r k e r s i n s e l e c t e d o c c u p a t i o n s , U n i t e d S t a t e s a n d r e g i o n s , S e p t e m b e r 1977) ______________________________________
D e p a r t m e n t a n d o c c u p a t io n
U n i t e d S t a t e s 2 S o u th w e s t
N u m b e ro f
w o r k e r s
H o u r l y e a r n i n g s 1 N u m b e r H o u r l y e a r n i n g s 1
M e a n M e d ia n M id d le r a n g e w o r k e r s M e a n M e d ia n M id d le r a n g e
PRO CESSIN G
PROCESSORS......................................................................... 5 7 7 * 5 . 8 9 * 6 . 1 6 * 4 . 9 2 - * 6 . 7 3 7 4 * 5 . 3 1 * 4 . 9 2 * 4 . 6 1 - $ 6 . 3 7HEN..................................................................................... 5 0 6 6 . 0 2 6 . 3 7 5 . 4 2 - 6 . 8 7 6 0 5 . 4 6 4 . 9 2 4 . 7 7 - 6 . 4 3WOHEN............................................................................... 71 5 . 0 1 5 . 2 8 4 . 3 6 - 5 . 4 5 - - - -
MACHINE TEN D ERS, FIX IN G ANDBLENDING....................................................................... 4 57 6 . 0 7 6 . 4 3 5 . 4 5 - 6 . 8 9 _ - - - _HEN..................................................................................... 4 20 6 . 0 9 6 . 5 3 5 . 4 5 - 6 . 9 1 _ - - - _BOMEN................................................................................ 3 7 5 . 7 9 5 . 4 5 5 . 4 5 - 6 . 5 8 _ - - - -
PANELBOARD O PERATORS, MIXING ANDBLENDING...................................................................... 21 5 . 8 8 6 . 3 5 5 . 5 7 - 6 . 4 5 _ - - - _HEN...................................................................................... 21 5 . 8 8 6 . 5 5 5 . 5 7 - 6 . 4 5 - - * - -
PACKING
PACKERS.................................................................................. 4 7 5 5 . 1 2 5 . 6 8 4 . 3 6 - 6 . 0 4 9 9 4 . 5 3 4 . 3 9 3 . 6 7 - 6 . 0 4HEN..................................................................................... 1 94 4 . 8 3 5 . 0 0 3 . 6 5 - 5 . 8 0 - - -WOMEN................................................................................ 2 8 1 5 . 3 2 5 . 6 8 4 . 3 9 - 6 . 2 1 7 7 4 . 7 7 4 . 3 9 3 . 9 2 - 6 . 0 4
DOUGHS............................................................................... 2 8 2 5 . 3 0 5 . 6 8 4 . 3 6 - 6 . 2 1 9 S 4 . 5 3 4 . 3 9 3 . 6 7 - 6 . 0 4HEN...................................................................................... 57 5 . 1 5 5 . 5 7 3 . 6 7 - 6 . 7 0 - - - -WOMEN............................................................................... 2 2 5 5 . 3 4 5 . 6 8 4 . 3 9 - 6 . 2 1 7 7 4 . 7 7 4 . 3 9 3 . 9 2 - 6 . 0 4
PLOUR M IX ES................................................................ 1 9 3 4 . 8 6 5 . 0 5 3 . 6 5 - 5 . 7 0 - - - _HEN..................................................................................... 1 3 7 4 . 7 0 4 . 6 5 3 . 6 5 - 5 . 7 0 _ - - _ _WOMEN............................................................................... 56 5 . 2 6 5 . 7 0 4 . 9 1 - 5 . 7 0 - - - - -
MATERIAL HOVEHENT
LABORERS, MATERIAL HANDLING....................... 2 5 0 5 . 3 9 5 . 6 8 3 . 5 2 - 7 . 0 1HEN..................................................................................... 2 ^ a 5 . 3 6 5 . 6 8 3 . 5 2 - 7 . 0 1 _ - - _ _
TRUCKERS, POWER.......................................................... 2 1 8 5 . 7 0 5 . 3 6 4 . 7 7 - 7 . 2 6 2 9 4 . 9 7 4 . 8 2 4 . 7 7 - 4 . 8 2HEN..................................................................................... 2 1 1 5 . 7 2 5 . 6 0 4 . 7 7 - 7 . 2 6 2 9 4 . 9 7 4 . 8 2 4 . 7 7 - 4 . 8 2WOMEN............................................................................... 7 5 . 17 - - - . - - - -
FO R K L IFT ......................................................................... 1 9 5 5 . 8 6 5 . 9 3 4 . 8 0 - 7 . 2 6 29 4 . 9 7 4 . 8 2 4 . 7 7 - 4 . 8 2HEN..................................................................................... 188 5 . 8 9 5 . S4 4 . 8 1 - 7 . 2 6 2 9 4 . 9 7 4 . 8 2 4 . 7 7 - 4 . 8 2WOMEN............................................................................... 7 5 . 1 7 — - _ - - — -
OTHER THAN P O R K L IF T ........................................ 23 4 . 3 3 5 . 5 2 2 . 8 0 - 5 . 5 2 _ - - - -HEN..................................................................................... 2 3 4 . 3 3 5 . 5 2 2 . 8 0 - 5 . 5 2 - - - - -
MAINTENANCE
E L E C T R IC IA N S .................................................................... 18 7 . 4 5 7 . 4 7 7 . 0 0 - 7 . 9 5 _ _HEN..................................................................................... 18 7 . 4 5 7 . 4 7 7 . 0 0 - 7 . 9 5 _ - - - -
M ECHANICS, GENERAL U T IL IT Y ......................... 3 1 6 7 . 4 2 7 . 4 0 6 . 7 0 - 8 . 7 0 3 6 6 . 0 9 6 . 7 0 5 . 4 5 - 6 . 7 0HEN..................................................................................... 3 1 6 7 . 4 2 7 . 4 0 6 . 7 0 - 8 . 7 0 3 6 6 . 0 9 6 . 7 0 5 . 4 5 - 6 . 7 0
SER V IC E AND CUSTODIAL
JA N IT O R S , PO R T E R S, AND C L E A N E R S . .. . 2 7 8 6 . 0 2 6 . 7 8 5 . 2 0 - 6 . 9 2 _ _ _HEN..................................................................................... 2 4 4 5 . 9 9 6 . 4 6 5 . 2 0 - 6 . 9 2 _ - - - -WOMEN............................................................................... 34 6 . 2 4 6 . 9 2 5 . 9 1 - 6 . 9 2 - - - * *
G r e a t L a k e s M id d le W e s t
PRO CESSIN G
PRO CESSO RS......................................................................... 2 2 7 * 6 . 8 9 1 6 . 6 8 * 6 . 5 3 - * 7 . 5 3 1 6 5 * 4 . 9 3 * 5 . 4 5 S 4 . 3 6 - * 5 . 6 3HEN..................................................................................... 2 2 0 6 . 8 9 6 . 6 9 6 . 5 3 - 7 . 5 3 1 25 5 . 0 2 5 . 4 5 4 . 3 6 - 6 . 0 6WOHEN............................................................................... - - - “
HACHINE TEN D ER S, M IXING ANDBLENDING....................................................................... 192 6 . 9 9 6 . 7 3 6 . 5 7 - 7 . 5 3 121 5 . 0 4 5 . 4 5 4 . 5 0 - 5 . 6 3HEN..................................................................................... 185 7 . 0 0 6 . 7 3 6 . 5 7 - 7 . 6 0 101 4 . 96 5 . 4 5 3 . 6 5 - 5 . 6 3WOHEN............................................................................... - - - * - -
PANELBOARD O PERA TO RS, MIXING ANDBLENDING....................................................................... - “ ~HE N..................................................................................... * ~
PACKING
PACKERS.................................................................................. 1 13 5 . 8 2 6 . 2 1 5 . 2 7 - 6 . 2 8 101 4 . 5 1 4 . 3 6 3 . 5 0 - 5 . 7 0HEN..................................................................................... 40 5 . 2 7 5 . 2 5 4 . 8 0 - 5 . 7 5 34 4 . 02 3 . 4 3 3 . 0 0 - 4 . 5 0WOMEN............................................................................... - - - - - 6 7 4 . 76 4 . 3 6 4 . 3 6 - 5 . 7 0
DOUGHS............................................................................... - - - - - “MEN..................................................................................... - - - - - - - * *WOHEN............................................................................... - - - - - - - -
FLOUR H U E S ................................................................ _ - - - - 6 8 4 . 6 0 5 . 7 0 3 . 2 0 - 5 . 7 0HEN..................................................................................... - - - - - 3 2 3 . 9 9 3 . 3 0 2 . 9 9 - 4 . 8 0WOHEN............................................................................... - ~ ~ ~ * ■ "
MATERIAL HOVEHENT
LABORERS, MATERIAL HANDLING...................... _ - - - - 34 5 . 8 7 6 . 1 3 5 . 8 8 - 6 . 1 3MEN..................................................................................... - - - - - 34 5 . 8 7 6 . 1 3 5 . 8 8 - 6 . 13
TRUCKERS, POWER.......................................................... 86 6 . 8 4 7 . 2 6 6 . 0 4 - 7 . 4 5 5 2 4 . 38 4 . 5 0 3 . 2 9 - 5 . 3 0MEN..................................................................................... 84 6 . 8 3 7 . 2 6 5 . 9 7 - 7 . 4 5 52 4 . 3 8 4 . 5 0 3 . 2 9 - 5 . 3 0WOHEN............................................................................... - - - - - - - - *
F O R K L IF T ......................................................................... 74 7 . 0 4 7 . 2 6 7 . 2 6 - 7 . 4 5 4 2 4 . 7 5 5 . 3 0 3 . 5 5 - 5 . 3 0HEN..................................................................................... 7 2 7 . 0 3 7 . 2 6 7 . 2 6 - 7 . 4 5 4 2 4 . 7 5 5 . 3 0 3 . 5 5 - 5 . 3 0WOHEN............................................................................... - - . “ - - - - •
OTHER THAN F O R K L IF T ........................................ - - * * - - - - ~HEN..................................................................................... * ~ “ "
MAINTENANCE
E L E C T R IC IA N S ................................................................... 9 7 . 7 8 - - - - - - - -HEN..................................................................................... 9 7 . 7 8 — — - - - — - ~
H EC H A H IC S, 56K EEA L O T I I IT X .......................... 1 8 8 8 . 1 2 8 . 6 3 6 . 9 1 - 8 . 7 9 4 6 6 . 18 6 . 7 6 6 . 0 0 - 6 . 8 2HEN..................................................................................... 1 88 8 . 1 2 8 . 6 3 6 . 9 1 - 8 . 7 9 4 6 6 . 18 6 . 7 6 6 . 0 0 - 6 . 8 2
SE B V IC E AND CUSTODIAL
JA N IT O B S , PO R TER S, AND C L E A N E R S .. . . 168 6 . 6 4 6 . 9 2 6 . 9 2 - 7 . 0 6 6 0 4 . 9 4 4 . 5 0 4 . 3 6 - 5 . 8 6HEN..................................................................................... 144 6 . 6 0 6 . 9 2 6 . 9 2 - 7 . 0 6 5 6 4 . 9 9 4 . 5 0 4 . 3 6 - 5 . 9 5WOHEN............................................................................... 24 6 . 8 8 6 . 9 2 6 . 9 2 - 7 . 0 5 '
1 E x c l u d e s p r e m i u m p a y f o r o v e r t i m e a n d f o r w o r k o n w e e k e n d s , h o l i d a y s , a n d l a t e s h i f t s . S e e a p p e n d ix A f o r d e f i n i t i o n s o f m e a n s , m e d i a n s , a n d m i d d l e r a n g e s . M e d ia n s a n d m i d d l e r a n g e s w e r e n o t c o m p u te d f o r o c c u p a t i o n s w i t h f e w e r t h a n 15 w o r k e r s .
2 I n c l u d e s d a t a f o r r e g i o n s in a d d i t i o n to t h o s e s h o w n s e p a r a t e l y .
3 I n c l d u e s d a t a f o r w o r k e r s i n c l a s s i f i c a t i o n s i n a d d i t i o n to t h o s e s h o w n s e p a r a t e l y .
N O T E : D a s h e s i n d i c a t e t h a t n o d a t a w e r e r e p o r t e d o r t h a t d a t a d id n o t m e e t p u b l i c a t i o n c r i t e r i a .
31Digitized for FRASER http://fraser.stlouisfed.org/ Federal Reserve Bank of St. Louis

Table 26. Blended and prepared flour*.Occupational averages by size of community( N u m b e r a n d a v e r a g e s t r a i g h t - t i m e h o u r l y e a r n i n g s 1 o f p r o d u c t i o n w o r k e r s in s e l e c t e d o c c u p a t i o n s , U n i t e d S t a t e s a n d G r e a t L a k e s , S e p t e m b e r 1977)__________
U n i t e d S t a t e s 1 2 3 G r e a t L a k e s
D e p a r t m e n t a n d o c c u p a t i o nM e t r o p o l i t a n a r e a s M e t r o p o l i t a n a r e a s
N u m b e ro f
w o r k e r sE a r n i n g s
N u m b e ro f
w o r k e r sE a r n i n g s
PRO CESSIN G
P R O C E S S O R S ... ................................................................ 5 0 8 $ 6 . 14 2 2 7 $ 6 . 8 9MACHINE TENDERS, S IZ IN G AND
B L E N D IN G .................................................................... 4 0 1 6 . 3 6 1S2 6 . 9 9PANELBOARD OPERATORS, S IZ IN G AND
BLEN D IN G ...................................................................... 2 0 5 . 8 2 - -
PACKING
PACKERS.................................................................................. 3 9 5 5 . 3 1 1 1 3 5 . 8 2DOUGHS................................................................................ 2 8 1 5 . 3 1 — -
FLOOR S IZ E S ................................................................ 1 1 4 5 . 3 2 -
MATERIAL MOVEMENTC
LABORERS, MATERIAL HANDLING...................... 1 9 3 5 . 8 9 _ _
TRUCKERS, POWER.......................................................... 1 77 6 . 0 9 £6 6 . 8 4F O R K L IF T ................... ...................................................... 1 6 5 6 . 1 3 74 7 . 0 4
MAINTENANCE
E L E C T R IC IA N S ................................................................... 17 7 . 6 2 9 7 . 7 8M ECHANICS, GENERAL U T I 1 I 1 I ......................... 3 0 3 7 . 5 3 1 6 8 8 . 1 2
SER V IC E AND CUSTODIAL
JA N IT O R S , PO R TER S, AND C L E A N E R S . . . . 2 6 0 6 . 1 1 1 68 6 . 6 4
1 E x c l u d e s p r e m i u m p a y f o r o v e r t i m e a n d f o r w o r k o n w e e k e n d s , h o l i d a y s , a n d l a t e s h i f t s .
2 I n c lu d e s d a t a f o r r e g i o n s i n a d d i t i o n to G r e a t L a k e s .
N O T E : D a s h e s i n d i c a t e t h a t n o d a t a w e r e r e p o r t e d o r t h a t d a t a d id n o t m e e t p u b l i c a t i o n c r i t e r i a .
Table 27. Blended and prepared flour: Occupational averages by size of establishment( N u m b e r a n d a v e r a g e s t r a i g h t - t i m e h o u r l y e a r n i n g s 1 o f p r o d u c t i o n w o r k e r s in s e l e c t e d o c c u p a t i o n s , U n i t e d S t a t e s a n d G r e a t L a k e s , S e p t e m b e r 1977) _____________
U n i te d S t a t e s 2 G r e a t L a k e s
D e p a r t m e n t a n d o c c u p a t io n L e s s t h a n 100 w o r k e r s 100 w o r k e r s o r m o r e L e s s t h a n 100 w o r k e r s
W o r k e r s E a r n i n g s W o r k e r s E a r n i n g s W o r k e r s E a r n i n g s
PRO C ESSIN G
PRO CESSO RS......................................................................... 91 * 5 . 17 4 6 6 $ 6 . 0 3 2 0 2 $ 6 . 9 6MACHINE TEN D ERS, R U IN G AND
BLENDING...................................................................... 57 5 . 0 2 4 GO 6 . 2 2 1 86 7 . 0 1
PACKING
PACKERS.................................................................................. 1 5 4 4 . 6 6 3 2 1 5 . 3 4 _DOUGHS................................................................................ - - 2 41 5 . 6 0 - -FLOUR M IZ E S ................................................................ 1 1 3 5 . 0 7 £0 4 . 5 7 - -
MATERIAL MOVEMENT
LABORERS, MATERIAL BANDUNG............. ... 75 4 . 4 3 175 5 . 8 0 _ _TRUCKERS, P O W E R ..* * .............................................. 36 £ . 4 4 162 5 . 7 5 83 6 . 8 7
F O R K L IF T ......................................................................... 36 5 . 4 4 1 5 9 5 . 9 6 71 7 . 0 7OTHER THAN F O R K L IF T ....................................... * - 23 4 . 3 3 - *
MAINTENANCE
E L E C T R IC IA N S .................................................................... - - 15 7 . 2 4 _M ECHANICS, GENERAL U 1 I L I T I .......................... 23 5 . 9 3 2S 3 7 . 5 3 182 8 . 1 6
SE R V IC E AND CUSTODIAL
JA N IT O R S , PO R T E R S, AND C L E A N E R S .. . . 39 4 . 8 3 2 3 9 6 . 2 1 1 60 6 . 7 3
1 E x c l u d e s p r e m i u m p a y f o r o v e r t i m e a n d f o r w o r k o n w e e k e n d s , h o l i d a y s , a n d l a t e s h i f t s .
2 I n c l u d e s d a t a f o r o t h e r r e g i o n s in a d d i t i o n to G r e a t L a k e s .
3 I n c l u d e s d a t a f o r w o r k e r s in c l a s s i f i c a t i o n s in
a d d i t i o n to t h o s e s h o w n s e p a r a t e l y .
N O T E : D a s h e s i n d i c a t e t h a t n o d a t a w e r e r e p o r t e d o r t h a t d a t a d id n o t m e e t p u b l i c a t i o n c r i t e r i a .
3 2Digitized for FRASER http://fraser.stlouisfed.org/ Federal Reserve Bank of St. Louis
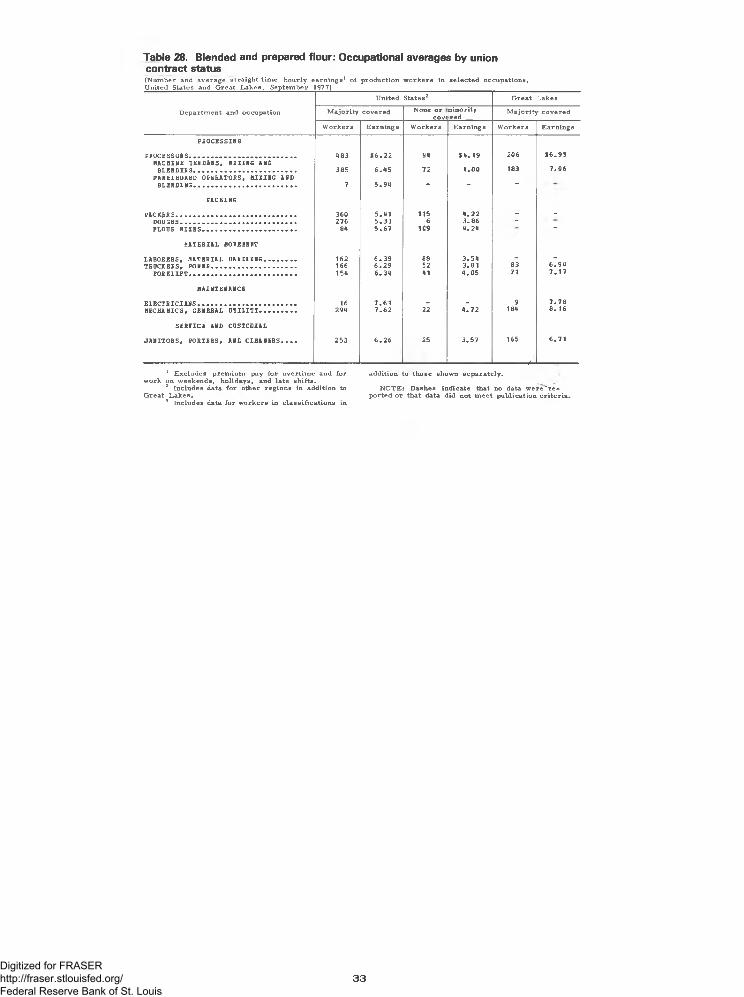
Table 28. Blended and prepared flour: Occupational averages by union contract status( N u m b e r a n d a v e r a g e s t r a i g h t - t i m e h o u r l y e a r n i n g s 1 o f p r o d u c t i o n w o r k e r s i n s e l e c t e d o c c u p a t i o n s , U n i t e d S t a t e s a n d G r e a t L a k e s , S e p t e m b e r 1977)
D e p a r t m e n t a n d o c c u p a t io n
U n i t e d S t a t e s 2 G r e a t L a k e s
M a j o r i t y c o v e r e d N o n e o r co v e
n i n o r i t yr e d
M a j o r i t y c o v e r e d
W o r k e r s E a r n i n g s W o r k e r s E a r n i n g s W o r k e r s E a r n i n g s
PRO CESSIN G
PROCESSORS......................................................................... 4 8 3 $ 6 . 2 2 94 $ 4 . 1 9 2 0 6 $ 6 . 9 9MACHINE TENDERS, MIXING AND
BLENDING...................................................................... 3 8 5 6 . 4 5 7 2 4 . 0 0 183 7 . 0 6PANELEOABD O EEEA TCBS, B IX IN G ANE
BLENDING...................................................................... 7 5 . 9 4 * ~ “
PACKING
PACKERS.................................................................................. 3 6 0 5 . 4 1 1 15 4 . 2 2 - -DOUGHS............................................................................... 2 7 6 5 . 3 3 6 3 . 8 6 -FLOUR M IX ES................................................................ 8 4 5 . 6 7 1 0 9 4 . 2 4 —
MATERIAL MOVEMENT
LABORERS, MATERIAL HANDLING...................... 1 6 2 6 . 3 9 88 3 . 5 4 - -TRUCKERS, POWER.......................................................... 1 6 6 6 . 2 9 5 2 3 . 8 1 8 3 6 . 9 4
F O R K L IF T ......................................................................... 1 5 4 6 . 3 4 41 4 . 0 5 7 1 7 . 1 7
MAINTENANCE
E L E C T R IC IA N S ................................................................... 16 7 . 6 1 - - 9 7 . 7 8M ECHANICS, GENERAL U T IL IT Y ......................... 2 9 4 7 . 6 2 22 4 . 7 2 184 8 . 16
SER V IC E AND CUSTODIAL
JA N IT O R S , PO R T E R S, AND C L E A N E R S .. . . 2 5 3 6 . 2 6 25 3 . 5 7 1 6 5
------------------ 4 -
6 . 7 1
1 E x c l u d e s p r e m i u m p a y f o r o v e r t i m e a n d f o r w o r k o n w e e k e n d s , h o l i d a y s , a n d l a t e s h i f t s .
2 I n c l u d e s d a t a f o r o t h e r r e g i o n s in a d d i t i o n to G r e a t L a k e s .
3 I n c l u d e s d a t a f o r w o r k e r s in c l a s s i f i c a t i o n s in
a d d i t i o n to t h o s e s h o w n s e p a r a t e l y .
N O T E : D a s h e s i n d i c a t e t h a t n o d a t a w e r e * r e p o r t e d o r t h a t d a t a d id n o t m e e t p u b l i c a t i o n c r i t e r i a .
3 3Digitized for FRASER http://fraser.stlouisfed.org/ Federal Reserve Bank of St. Louis

(Percent of production workers by method of wage payment,1 United States and selected regions, September 1977)
Table 29. Blended and prepared flour: Method of wage payment
Method of wage payment
UnitedStates1 2 Southwest Great Lakes Middle West Pacific
All workers............................................ 100 100 100 100 100
Time-rated workers.................................. 99 100 99 100 100Formal plans.......................................... 94 100 97 71 100
Single ra te ........................................... 84 85 93 59 86Range of rates.................................... 10 15 3 12 14
Individual ra tes...................................... 6 “ 3 29
1 For definition of method of wage payment, see NOTE: Because of rounding, sums of individualappendix A. items may not equal totals.
2 Includes data for regions in addition to those shown separately.
u >-t*.
Table 30. Blended and prepared flour: Scheduled weekly hours
(Percent of production workers by scheduled weekly hours,1 United States and selected regions, September 1977)
Weekly hours UnitedStates2 Southwest Great Lakes Middle West Pacific
All workers............................................ 100 100 100 100 100
40 hours................................................... 92 96 97 66 100Over 40 hours.......................................... 8 4 3 34 -
1 Data relate to the predominant schedule for full- NOTE: Because of rounding, sums of individualtime day-shift workers in each establishment. items may not equal 100.
2 Includes data for regions in addition to those shown separately.
Digitized for FRASER http://fraser.stlouisfed.org/ Federal Reserve Bank of St. Louis

(Percent of production workers by shift differential provisions,' United States and selected regions, September 1977)
Table 31. Blended and prepared flour: Shift differential provisions
COCJ1
Shift differential UnitedStates2 Southwest Great Lakes Middle West Pacific
Second shift
Workers in establishments withsecond-shift provisions........................... 96.9 89.1 100.0 100.0 100.0With shift differential.............................. 90.1 78.6 97.2 66.3 100.0
Uniform cents per hou r...................... 84.9 78.6 93.8 62.8 47.910 cents............................................ 8.5 31.7 3.3 7.0 _12 cents............................................ 60.9 46.9 85.8 8.7 -12.5 cents......................................... 3.4 - - 28.2 -
13 cents............................................ 2.3 - - 19.0 _15 cents............................................ 6.1 - 3.0 - _17 cents............................................ .5 - - - 9.520 cents............................................ 2.4 - 1.8 - 23.925 cents............................................ .8 - - - 14.4
Uniform percentage ............................ 2.0 - 3.4 - -Other formal paid differential............. 3.3 - - 3.5 52.1
Third or other late shift
Workers in establishments with third-or other late-shift provisions.................. 89.5 74.5 97.2 96.5 76.1With shift differential.............................. 85.3 74.5 97.2 62.8 76.1
Uniform cents per hou r...................... 80.5 74.5 93.8 62.8 23.910 cents............................................ 4.5 27.7 3.3 - -
12.5 cents......................................... 3.4 - - 28.2 -
15 cents............................................ 7.0 - 3.0 7.0 _
17 cents............................................ 2.3 - - 19.0 -
20 cents............................................ 60.9 46.9 85.8 8.7 -
22 cents............................................ .5 - - - 9.525 cents............................................ 1.8 - 1.8 - 14.4
Uniform percentage ............................ 2.0 - 3.4 - -
Other formal paid differential............. 2.9 * 52.1
’ Refers to policies of establishments currently operating late shifts or having provisions covering late shifts.
2 Includes data for regions in addition to those
shown separately.
NOTE: Because of rounding, sums of individual items may not equal totals.
Digitized for FRASER http://fraser.stlouisfed.org/ Federal Reserve Bank of St. Louis

Table 32. Blended and prepared flour: Shift differential practices
(Percent of production workers employed on late shifts by amount of pay differential, United States and selected regions, September 1977)
Shift differential UnitedStates' Southwest Great Lakes Middle West Pacific
Second shift
Workers employed on second shift ........ 26.5 32.1 28.0 27.7 18.0Receiving differential ............................ 24.3 27.5 27.3 17.2 18.0
Uniform cents per hour ...................... 23.3 27.5 27.2 16.8 1.810 cents............................................ 2.0 11.3 .9 - -12 cents............................................ 18.0 16.2 25.0 .9 -12.5 cents......................................... 1.3 - - 11.1 -
13 cents............................................ .6 - - 4.7 -
15 cents............................................ 1.0 - .8 - -
17 cents............................................ .1 - - - 1.820 cents............................................ .3 - .4 - -25 cents............................................ - - - - -
Uniform percentage ........................... .1 - .1 - -Other formal paid differential............. .9 - - .5 16.2
Third or other late shift
Workers employed on thirdor other late sh ift.................................... 14.0 8.7 18.3 17.4 .4Receiving differential ............................ 12.8 8.7 18.3 7.3 .4
Uniform cents per hou r...................... 12.7 8.7 18.2 7.3 .410 cents............................................ .6 4.2 .3 - -
12.5 cents......................................... .3 - - 2.5 -
15 cents............................................ - - - - -17 cents............................................ .6 - - 4.7 -
20 cents............................................ 11.3 4.4 17.9 - -
22 cents............................................ 0 - - - .425 cents............................................ - - - - -
Uniform percentage ........................... .1 - .1 - -Other formal paid differential............. — ” ” ” ”
1 Includes data for regions in addition to those NOTE: Because of rounding, sums of individualshown separately. items may not equal totals.
2 Less than 0.05 percent.
Table 33. Blended and prepared flour: Paid holidays
(Percent of production workers with formal provisions for paid holidays, United States and selected regions, September 1977) 1 2
Number of paid holidays
UnitedStates' Southwest Great Lakes Middle West Pacific
All workers............................................ 100 100 100 100 100
Workers in establishmentsproviding paid holidays........................... 100 100 100 100 1005 days .................................................... 2 - - - 386 days .................................................... 5 - - 37 -6 days plus 2 half days......................... 2 - 3 - -7 days.................................................... 3 11 - - -7 days plus 2 half days......................... 1 9 - - -8 days .................................................... 7 2 - 7 149 days .................................................... 10 28 3 28 3810 days .................................................. 2 - - 9 -11 days .................................................. 67 47 94 19 1012 days .................................................. O 4 “ “
1 Includes data for regions in addition to those NOTE: Because of rounding, sums of individualshown separately. items may not equal totals.
2 Less than 0.5 percent.
36Digitized for FRASER http://fraser.stlouisfed.org/ Federal Reserve Bank of St. Louis

(Percent of production workers in establishments with formal provisions for paid vacations after selected periods of service, United States and selected regions, September 1977)
Table 34. Blended and prepared flour: Paid vacations
Vacation policy United States1 Southwest Great Lakes Middle West Pacific
All workers ............................................. 100 100 100 100 100
Method of paymentWorkers in establishmentsproviding paid vacations .......................... 100 100 100 100 100Length-of-time payment.......................... 100 100 100 100 100
Amount of vacation pay2 After 1 year of service:
1 week .................................................... 34 49 5 97 100Over 1 and under 2 weeks.................... 61 47 89 - -2 weeks ................................................... 4 4 6 - -
After 2 years of service:1 week .................................................... 10 21 - 44 -
2 weeks ................................................... 29 32 11 56 100Over 2 and under 3 weeks .................... 61 47 89 - -
After 5 years of service:1 week .................................................... (1 2 3) 2 - - -2 weeks .................................................. 33 51 8 100 52Over 2 and under 3 weeks.................... 62 47 89 - -3 weeks .................................................. 5 - 3 - 48
After 10 years of service:1 week .................................................... (3) 2 - - -2 weeks .................................................. 3 - - 3 -3 weeks .................................................. 36 51 11 97 100Over 3 and under 4 weeks .................... 61 47 89 - -
After 15 years of service:1 week .................................................... (3) 2 - - -
2 weeks .................................................. 3 - - 3 -3 weeks .................................................. 18 24 6 62 384 weeks .................................................. 18 28 5 35 62Over 4 and under 5 weeks.................... 61 47 89 - _
After 20 years of service:1 week .................................................... (3) 2 - - _2 weeks .................................................. 3 - - 3 _3 weeks .................................................. 18 20 6 62 384 weeks .................................................. 14 32 3 16 625 weeks .................................................. 4 - 2 19 _Over 5 and under 6 weeks .................... 61 47 89 _ _
After 25 years of service:41 week .................................................... 0 2 - - _2 weeks .................................................. 3 - - 3 _3 weeks .................................................. 18 20 6 62 384 weeks .................................................. 11 4 3 16 525 weeks .................................................. 7 28 2 19 10Over 5 and under 6 weeks.................... 61 47 89 - -
1 Includes data for regions in addition to those shown separately.
2 Vacation payments, such as percent of annual earnings,were converted to an equivalent time basis. Periods of servicewere chosen arbitrarily and do not necessarily reflect individual establishment provisions for progression. For example, changes indicated at 10 years may include changes that
occurred between 5 and 10 years.3 Less than 0.5 percent.4 Vacation provisions were virtually the same after longer
periods of service.
NOTE: Because of rounding, sums of individual items may not equal totals.
37Digitized for FRASER http://fraser.stlouisfed.org/ Federal Reserve Bank of St. Louis

(Percent of production workers with specified health, insurance, and retirement plans,1 United States and selected regions, September 1977)
Table 35. Blended and prepared flour: Health, insurance, and retirement benefits
Type of plan UnitedStates1 2 Southwest Great Lakes Middle West Pacific
All workers............................................ 100 100 100 100 100
Workers in establishments providing:
Life insurance........................................ 94 100 100 97 76Noncontributory plans......................... 89 87 93 97 76
Accidental death anddismemberment insurance.................. 29 24 14 97 76Noncontributory plans......................... 26 11 11 97 76
Sickness and accident insuranceor sick leave or both3 ........................... 91 71 100 97 62Sickness and accident insurance ...... 86 71 100 90 _
Noncontributory plans...................... 83 57 97 90 -
Sick leave (full pay,no waiting period) ............................. 6 - 6 7 24
Sick leave (partial payor waiting period).............................. 15 - 21 - 38
Long-term disability insurance.............. 32 13 49 - -Noncontributory plans......................... 30 - 49 - -
Hospitalization insurance...................... 100 100 100 100 100Noncontributory plans......................... 93 87 97 97 100
Surgical insurance................................. 100 100 100 100 100Noncontributory plans......................... 93 87 97 97 100
Medical insurance................................. 100 100 100 100 100Noncontributory plans......................... 93 87 97 97 100
Major medical insurance....................... 100 100 100 100 100Noncontributory plans......................... 93 87 97 97 100
Retirement plans4.................................. 93 89 97 90 62Pensions.............................................. 93 89 97 90 62
Noncontributory plans...................... 92 76 97 90 62Severance pay.................................... 12 “ 20 ”
1 Includes those plans for which the employer pays at least part of the cost and excludes legally required plans such as workers’ compensation and social security; however, plans required by State temporary disability laws are included if the employer contributes more than is legally required or the employees receive benefits in excess of legal requirements. “ Noncontributory plans” include only those plans financed entirely by the employer.
2 Includes data for regions in addition to those
shown separately.3 Unduplicated total of workers receiving sickness
and accident insurance and sick leave shown separately.
4 Unduplicated total of workers covered by pension plans and severance pay shown separately.
NOTE: Because of rounding, sums of individual items may not equal totals.
Table 36. Blended and prepared flour: Other selected benefits
(Percent of production workers in establishments providing funeral leave pay, jury-duty leave, and technological severance pay,1 United States and selected regions, September 1977)
Type of benefit UnitedStates2 Southwest Great Lakes Middle West Pacific
Workers in establishments with provisions for:
Funeral leave............................................. 92 94 100 97 38Jury-duty leave .......................................... 82 84 100 35 24Technological severance pay................... 68 47 94 28 ”
1 For definition of items, see appendix A.2 Includes data for regions in addition to those shown separately.
38Digitized for FRASER http://fraser.stlouisfed.org/ Federal Reserve Bank of St. Louis

Part IV. Wet Corn Milling
EarningsStraight-time earnings of the over 6,300 production
and related workers in wet corn mills averaged $6.87 in September 1977 (table 37). The averages in the two principal regions, accounting for seven-eighths of the work force, were $7.10 in the Middle West and $6.88 in the Great Lakes.
Earnings of individual workers fell within comparatively narrow limits-the middle 50 percent earned between $6.49 and $7.40 an hour (table 38). The index of dispersion- 13-was lowest by far of the four industries studied. Few other industries studied in the Bureau’s occupational wage survey program have so little earnings dispersion. 9
Average earnings for workers in metropolitan and nonmetropolitan areas, for workers in mills with under 100 employees, and for those in larger mills are also presented in table 37. Based on a limited number of comparisons, workers in the larger-size mills averaged substantially more than those in the 20 to 99 size group, whereas little pay differences existed between metropolitan areas and smaller communities.
Hourly averages among occupations selected for separate study ranged from $7.80 for millwrights to just over $6 for janitors and dry starch panelboard operators (table 39). As a group, workers in processing occupations averaged $6.76; among the seven job classifications shown separately in this category, averages were between $6.86 and $7.22 for five jobs, $6 for dry starch panelboard operators, and $6.55 for dry starch machine tenders.
Establishment practices and supplementary wage provisions
Scheduled weekly hours and shift work. Work schedules of 40 hours a week were found in virtually all wet corn mills visited in September 1977.
Nearly all production workers were in mills with formal provisions for late shifts (table 41). About one- fourth of the workers were actually employed on second shifts in September 1977, and one-fifth were em
ployed on third or other late shifts (table 42). Shift differentials, almost always uniform cents-per-hour payments above day-shift rates, were typically 12, 15, or 18 cents for second-shift work and 18 or 30 cents for third shifts.
Paid holidays and vacations. All workers were granted paid holidays; two-thirds received 10 days annually, one-fourth, 9 days, and the remainder, 8 days (table 43).
Paid vacations, after qualifying periods of service, were provided to all workers (table 44). For most workers, the vacation policy was 1 week’s pay after 1 year of service, 2 weeks after 2 years, 3 weeks after 10 years, 4 weeks after 15 years, 5 weeks after 20 years, and 6 weeks after 25 years.
Health, insurance, and retirement plans. All workers in wet corn mills had hospitalization, surgical, basic medical, and major medical insurance which was usually financed jointly by employers and employees (table 45). At least nine-tenths of the workers also had life and sickness and accident policies, usually paid entirely by the employer. Seven-tenths of the workers were covered by accidental death and dismemberment insurance and four-tenths by long-term disability insurance.
Retirement pension plans, in addition to social security, applied to all workers. A large majority in the Great Lakes had plans entirely financed by their employers; the majority in the Middle West, in contrast, contributed to the funding of their plans.
Other selected benefits. Approximately nine-tenths of the workers had funeral leave and jury-duty pay plans in their mills (table 46). Severance pay for permanently laid-off workers was available in mills employing two-fifths of the work force; these plans were mostly found in the Great Lakes region.
8 See footnote 7.9 Industries with low dispersion factors include motor vehicles, cig
arettes, coal mining, and petroleum refining; all are highly unionized and have predominantly single-rate pay systems.
39Digitized for FRASER http://fraser.stlouisfed.org/ Federal Reserve Bank of St. Louis

Table 37. Wet corn milling: Average hourly earnings by selected characteristics( N u m b e r a n d a v e r a g e s t r a i g h t - t i m e e a r n i n g s 1 o f p r o d u c t i o n w o r k e r s b y s e l e c t e d c h a r a c t e r i s t i c s , U n i t e d S t a t e s a n d s e l e c t e d r e g i o n s , S e p t e m b e r 1977)___________________ _____________________________ ________
C h a r a c t e r i s t i c s
U n i t e d S t a t e s 2 G r e a t L a k e s M id d le W e s t
W o r k e r s E a r n i n g s W o r k e r s E a r n i n g s W o r k e r s E a r n i n g s
ALL PRODUCTION WORKERS..................................... 6 . 3 3 7 S 6 . 8 7 3 , 2 2 9
go 2 , 3 6 2 $ 7 . 1 0
S IZ E OF L S IA 3L IS H M L N T :2 0 - 9 9 WORKERS........................................................ 2 6 7 4 . 6 1 - - - -1 0 0 HOHK.XS OR MORr................. ..................... 6 , 0 7 0 6 . 97 3 , 2 0 0 6 . 8 9 2 , 3 1 6 7 . 1 4
S IZ E OP C O H dU N IX Y :4flETROPOLITAN AULAS........................................ 4 , 3 7 1 6 . 87 - - - -N D N dLIR O PLITA N AULAS................................... 1 , 9 6 6 6 . 85 ~ ~ '
1 E x c l u d e s p r e m i u m p a y f o r o v e r t i m e a n d f o r 4 S t a n d a r d M e t r o p o l i t a n S t a t i s t i c a l A r e a s a s d e -w o r k o n w e e k e n d s , h o l i d a y s , a n d l a t e s h i f t s . f i n e d b y t h e U . S . O f f ic e o f M a n a g e m e n t a n d B u d g e t
2 I n c l u d e s d a t a f o r r e g i o n s i n a d d i t i o n to t h o s e t h r o u g h F e b r u a r y 1 9 7 4 .s h o w n s e p a r a t e l y . ^ ?* N O T E : D a s h e s i n d i c a t e t h a t n o d a t a w e r e r e p o r t e d
3 V i r t u a l l y a l l w o r k e r s w e r e m e n . o r t h a t d a t a d id n o t m e e t p u b l i c a t i o n c r i t e r i a .
Table 38. W et corn milling: Earnings distribution( P e r c e n t d i s t r i b u t i o n o f p r o d u c t i o n w o r k e r s b y s t r a i g h t - t i m e h o u r l y e a r n i n g s 1, U n i t e d S t a t e s a n d s e l e c t e d r e g i o n s , S e p t e m b e r 1977)---------------------------------------------------------------------------- ----------— T T -ii- 'j------ ----- _____ i ------— r r r r a r r —
H o u r l y e a r n i n g s 1 U n i te d S t a t e s 2
G r e a tL a k e s
M id d leW e s t
NUHBEB O f WORKERS............................................ 6 , 3 3 7 3 , 2 2 9 2 . 3 6 2AVERAGE HOURLY EARNINGS ...................... $ 6 . 8 7 $ 6 . 8 8 $ 7 . 10
T O T A L ..---------- ------------------ ---------------- 1 0 0 . 0 1 0 0 . 0 1 0 0 . 0
UNDER $ 5 . 0 0 ................... .......................................... 3 . 3 - 0 . 7
3 5 . 0 0 AliO UNDl.fi $ 5 . 1 0 ................................ . 1 _ .$ 5 . 1 0 ANO UNDER $ 5 . 2 0 ................................ . 1 - i* )$ 5 . 2 0 A lio UNDoR $ 5 . 3 0 ...................... ... . 1 0 . 1 -$ 5 . 3 0 AND UM0t.il $ 5 . 4 0 . ............................ .1 - 2 -$ 5 . 4 0 AMD UNooR $ 5 . 5 0 ............. ................. - 9 . 2
$ 5 . 5 0 AMD UNDi.fi $ 5 . 6 0 . . .......................... . 1 _ -$ 5 . oO AMD UNDER $ 5 . 7 0 ................................ . 7 . 6 1 - 0$ 5 . 7 0 «MO UNDER $ 5 . 8 0 ................................ . 4 . 2 -$ 5 . 8 0 AMD UMOOR $ 5 . 9 0 ............................... 2 . 0 3 . 8 (* )$ 5 . 5 0 AMO UNDiR $ 6 . 0 0 ................................ 2 . 9 5 . 6 <*)
$ 6 . 0 0 AMO 0 MOOR $ 6 . 2 0 ................................ 2 . 0 2 . 8 .$ 0 . 2 0 AMO UNDER $ 6 . 4 0 ....... ........................ 8 . 2 1 5 . 5 -$ 6 . 4 0 AND UNDER $ 6 . 6 0 ................................ 1 4 . 2 1 2 . 5 1 7 . 7$ 6 . o 0 AND JN D i.ii i b . b u ................................ 9 . 4 6 - 2 1 2 . 8$ 6 . 3 0 AND UNDER $ 7 . 0 0 ............................... 1 1 . 1 1 2 . 4 1 0 . 7
$ 7 . 0 0 AMO UNDER $ 7 . 2 0 ................................ 1 2 . 1 8 . 2 1 9 . 4$ 7 . 2 0 AMO UNDER $ 7 . 4 0 ................................ 9 . 0 1 1 . 0 9 . 0$ 7 . 4 0 AND UMOfeR $ 7 . 6 0 ............................. 9 . 6 8 . 0 1 2 . 4$ 7 . 6 0 AMD UNDUE $ 7 . 8 0 ................................ 1 . 3 1 . 2 1 .1$ 7 . 8 0 AND UNDt.fi $ 6 . 0 0 ................................ 1 . 5 1 . 3 1 . 6
$ 8 . 0 0 ANO UNDER $ 8 . 2 0 . . ....................... 7 . 1 3 . 8 1 1 . 73 8 . 2 0 AND U H otfi 3 8 . 4 0 ....... ........................ 3 . 3 6 . 1 . 5$ 8 . 4 0 AMD UNDER $ 8 . 6 0 ................................ . 5 . 1 1 . 2$ 8 . o 0 AND UNDe e $ 8 . 6 0 . . . ....................... . 1 . 1$ 8 . 8 0 AND UNDtR $ 9 . 0 0 ............................... * -
3 9 . 0 0 AND UNDER $ 9 . 2 0 ................................ - - -
1 E x c l u d e s p r e m i u m p a y f o r o v e r t i m e a n d f o r w o r k o n w e e k e n d s , h o l i d a y s a n d l a t e s h i f t s .
i I n c lu d e s d a t a f o r r e g i o n s in
a d d i t i o n to t h o s e s h o w n s e p a r a t e l y .
N O T E : D a s h e s i n d i c a t e n o d a t a r e p o r t e d .
4 0Digitized for FRASER http://fraser.stlouisfed.org/ Federal Reserve Bank of St. Louis

Table 39. W et corn milling: Occupational averages—all establishments( N u m b e r a n d a v e r a g e s t r a i g n t - t i m e h o u r l y e a r n in g s * o f p r o d u c t i o n w o r k e r s in s e l e c t e d o c c u p a t i o n s , U n i t e d S t a t e s a n d s e l e c t e d r e g i o n s ,
D e p a r t m e n t a n d o c c u p a t i o n
U n i t e d S t a t e s 2 G r e a t L a k e s
N u m b e ro f
w o r k e r s
H o u r l y e a r n i n g s 1 N u m b e ro f
w o r k e r s
H o u r l y e a r n i n g s 1
M e a n M e d ia n M id d le r a n g e M e a n M e d ia n M id d le r a n g e
ELEVATOfi OPERATIONS
a EC EX VERS............. ............................................................... 4 3 S 6 . 9 6 * 7 . 1 1 * 6 . 5 9 - 5 7 . 3 2 26 $ 6 . 9 3 5 6 . 8 5 $ 6 . 4 5 - $ 7 . 2 0M BIGHER3 ............................... „ ............................................ 2 4 6 . 9 3 7 . 0 2 6 . 7 0 - 7 . 12 - - - _
PRO CESSIN G
PRO CESSO RS.................. ...................................................... 1 , 4 6 0 6 . 7 6 6 . 8 4 6 . 4 9 - 7 . 2 7 _ _ _ _ -CONVERTER OPERATORS......................................... 2 2 6 6 . 8 6 6 . 8 3 6 . 4 9 - 7 . 3 2 - - - - -SACHINE TENDERS* DRY STARCH................ 27 4 6 . 5 5 6 . 96 6 . 3 5 - 7 . 4 4 1 5 0 7 . 0 3 7 . 3 1 0 . 5 9 - 7 . 4 8MACHINE TEN D ERS, H IL L IN G ......................... 1 8 5 7 . 0 2 7 . 1 3 6 . 7 8 - 7 . 3 2 54 6 . 9 8 7 . 2 0 6 . 5 0 - 7 . 4 4MACHINE TENDERS, SYRUP R E F IN IN G .. 1 8 8 6 . 9 6 7 . 0 1 6 . 6 9 - 7 . 2 2 7 8 6 . 8 6 6 . 9 7 6 . 4 9 - 7 . 1 1PANELBOARD OPERATORS, DRY STARCH. 5 3 6 . 0 5 6 . 5 4 4 . 6 8 - 6 . 5 4 10 7 . 3 7 - - -PANELBOARD OPERATORS, H I L L I N G . . . . 4 0 7 . 2 2 7 . 0 0 6 . 5 5 - 7 . 6 9 2 5 7 . 2 4 7 . 6 9 6 . 5 5 - 7 . 7 0PANELBOARD O PERATORS, SYRUP
R E F IN IN G ...................................................................... 7 3 6 . 9 8 7 . 0 1 6 . 0 3 - 7 . 2 2 16 7 . 7 0 8 - 0 1 7 . 6 1 - 8 . 2 1
PACKING
PACKERS.................................................................................. 2 4 5 6 . 5 6 6 . 7 7 6 . 5 3 - 7 . 0 1 57 6 . 5 8 6 . 6 0 6 . 2 3 - 6 . 8 4DRY SYRUP....................................................................... 3 9 6 . 8 4 6 . 8 4 6 . 7 2 - 6 . 9 6 _ - - - -FEED ......................... .. .................... .................................... 3 4 6 . 6 6 6 . 7 0 6 . 2 3 - 7 . 0 1 - ~ - - -STARCH............................................................................... 1 2 8 6 . 3 2 6 . 5 4 6 . 2 3 - 6 . 8 6 30 0 . 6 5 6 . 6 0 6 . 2 3 - 7 . 2 7SYRUP.................................................................................. 3 4 6 . 9 4 7 . 0 7 6 . 7 9 - 7 . 0 7 - - -
MATERIAL MOVEMENT
LABORERS, MATERIAL HANDLING...................... 1 8 7 6 . 1 6 6 . 5 9 5 . 9 7 - 6 . 8 0 93 6 . 2 0 5 . 9 7 5 . 9 7 - 6 . 3 2TRUCKERS, POWER............. ............................................. 1 9 9 6 . 5 1 6 . 5 4 6 . 3 7 - 6 . 8 9 7 2 6 . 6 7 6 . 7 0 6 . 2 3 - 7 . 2 0
FO R K L IF T ......................................................................... 1 9 4 6 . 5 0 6 . 5 4 6 . 3 7 - 6 . 8 9 7 0 6 . 6 6 6 . 7 0 6 . 2 3 - 7 . 2 0
MAINTENANCE
E L E C T R IC IA N S .................................................................... 1 3 5 7 . 7 6 8 . 0 5 7 . 4 9 - 8 . 0 8 57 7 . 7 8 7 . 8 4 7 . 4 0 - 8 . 0 8M ECHANICS, GENERAL U T IL IT Y ......................... 1 8 2 6 . 9 7 7 . 2 6 6 . 6 7 - 7 . 6 7 - - - - -M ILLW RIGHTS...................................................................... 1 3 1 7 . 8 0 8 . 0 5 7 . 4 9 - 8 . 0 5 56 7 . 6 2 7 . 4 0 7 . 4 0 - 7 . 8 4O IL E R S ............................... .......................... - ....................... 6 2 6 . 9 0 7 . 13 6 . 7 9 - 7 . 17 2 5 6 . do 6 . 7 9 6 . 7 0 - 7 . 1 6SH EET-M ETAL WORKERS............................................... 7 0 7 . 7 6 7 . 5 1 7 . 4 0 - 8 . 1 3 - " - -
SE R V IC E AND CUSTODIAL
G U A R D S . . . . . . . . . . . . . . . . . ................................... 8 9 6 . 2 3 6 . 5 5 6 . 0 5 - 6 . 8 8 _ _ _ _ -JA N IT O R S , PO R T E R S, AND C L E A N E R S . .. . 2 9 7 6 . 10 6 . 4 3 5 . 8 1 - 6 . 4 3
M id d le W e s t
ELEVATOR O PERATIONS
R E C E I V E R S . . . . .................. ............................................. 15 S 6 . 9 5 * 7 . 11 * 6 . 7 8 - * 7 . 3 2W E IG H E R S .. . ............................................................. ........ ” ~ - - -
PRO CESSIN G
P R O C E S S O R S ..................................................................... 4 9 3 7 . 1 4 7 . 1 3 7 . 0 1 - 7 . 3 2CONVERTER OPERATORS........................................ 94 7 . 3 2 7 . 4 2 7 . 2 5 - 7 . 4 2MACHINE TEN D ER S, DRY STA RCH ................ 7 3 7 . 0 0 7 . 0 1 6 . 9 6 - 7 . 1 3MACHINE TEN D ERS, M IL L IN G ......................... 1 15 7 . 17 7 . 13 7 . 0 5 - 7 . 3 2MACHINE TEN D ERS, SYRUP R E F I N I N G . . ' 84 7 . 0 9 7 . 1 3 6 . 9 0 - 7 . 3 2PANELBOARD OPERATORS, DRY STARCH. - - - - -PANELBOARD O PERATORS, H I L L I N G . . . . ~ - - -PANELBOARD O PERA TO RS, SY RU P.............
R E F IN IN G ...................................................................... * - -
PACKING
PACKERS................................................................................... 1 60 6 . 7 8 6 . 8 6 6 . 6 4 - 7 . 0 2DRY SYRUP...................................................................... ... 27 6 . 8 2 6 . 7 7 6 . 6 8 - 6 . 9 6
F E E D . . ............. .................................................................. 19 6 . 9 7 7 . 0 1 7 . 0 1 - 7 . 0 2STARCH............................................................................... 78 6 . 57 6 . 6 2 6 . 5 4 - 6 . 8 6SYRUP................................................................................... 28 7 . 1 1 7 . 0 7 7 . 0 2 - 7 . 0 7
MATERIAL MOVEMENT
LABORERS, MATERIAL H A N D L IN G .. . . . . . . 67 6 . 70 6 . 7 7 6. 6 6 - 6 . 7 8TRUCKERS, P O W E R . . . . ............................................... 1 0 8 6 . 6 2 6 . 5 4 6 . 5 4 - 6 . 7 8
FO R K L IF T ..................................... .................. 10 5 6 . 6 2 6 . 5 4 6 . 5 4 - 6 . 7 8
MAINTENANCE
E L E C T R IC !A N S ................................................................. - _ _ _M ECHANICS, GENERAL U T IL IT Y ......................... - - - -M ILLW RIGHTS...................................................................... - - - -O IL E R S ...................................................................................... - - - - - -SHEET-METAL WORKERS............................................... 21 7 . 9 1 8 . 0 5 7 . 5 1 - 8 . 13
SER V IC E AND CUSTODIAL
GUARDS...................................................................................... - _ _ _JA N IT O R S , P O R T E R S, AND C L E A N E R S . . . . "
1 E x c l u d e s p r e m i u m p a y f o r o v e r t i m e a n d f o r w o r k o n w e e k e n d s , h o l i d a y s , a n d l a t e s h i f t s . S e e a p p e n d ix A f o r d e f i n i t i o n s o f m e a n s , m e d i a n s , a n d m i d d l e r a n g e s . M e d ia n s a n d m i d d l e r a n g e s w e r e n o t c o m p u te d f o r o c c u p a t i o n s w i th f e w e r t h a n 15 w o r k e r s .
2 I n c l u d e s d a t a f o r r e g i o n s in a d d i t i o n to t h o s e s h o w n s e p a r a t e l y .
N O T E : D a s h e s i n d i c a t e t h a t n o d a t a w e r e r e p o r t e d o r t h a t d a t a d id n o t m e e t p u b l i c a t i o n c r i t e r i a .
41Digitized for FRASER http://fraser.stlouisfed.org/ Federal Reserve Bank of St. Louis

(Percent of production workers by method of wage payment,1 United States and selected regions, September 1977)
Table 40. Wet corn milling: Method of wage payment
Method of wage payment
UnitedStates2 Great Lakes Middle West
All workers ............................................. 100 100 100
Time-rated workers ................................... 100 100 100Formal p lans........................................... 99 99 100
Single rate ............................................ 70 99 28Range of rates..................................... 30 1 72
1 For definition of method of wage payment, see appendix A.2 Includes data for regions in addition to those separately.
NOTE: Because of rounding, sums of individual items may not equal totals.
Table 41. Wet corn milling: Shift differential provisions
(Percent of production workers by shift differential provisions,1 United States and selected regions, September 1977)
Shift differential UnitedStates2 Great Lakes Middle West
Second shift
Workers in establishments withsecond-shift provisions........................... 99.3 100.0 98.1With shift differential.............................. 97.9 100.0 98.1
Uniform cents per hou r...................... 97.9 100.0 98.1Under 12 cents................................ 3.0 .9 -
12 cents............................................ 25.2 49.4 -
14 cents............................................ 2.7 - -
15 cents............................................ 32.1 29.0 42.218 cents............................................ 27.5 20.7 45.620 cents............................................ 7.3 - 10.3
Third or other late shift
Workers in establishments with third-or other late-shift provisions.................. 99.3 100.0 98.1With shift differential.............................. 97.9 100.0 98.1
Uniform cents per hour...................... 97.9 100.0 98.115 cents............................................ 2.5 - -16 cents............................................ .5 .9 -18 cents............................................ 26.8 49.4 -20 cents............................................ 5.3 - 14.2Over 20 and under 25 cents ........... 2.7 - -25 cents............................................ 7.7 15.2 -Over 25 and under 30 cents .......... 2.1 4.0 -30 cents............................................ 21.3 13.9 38.335 cents............................................ 12.0 16.7 -
Over 35 cents.................................. 17.0 “ 45.6
1 Refers to policies of establishments currently operating late shifts or having provisions covering late shifts.
2 Includes data for regions in addition to those shown separately.
NOTE: Because of rounding, sums of individual items may not equal totals.
42Digitized for FRASER http://fraser.stlouisfed.org/ Federal Reserve Bank of St. Louis

Table 42. Wet corn milling: Shift differential practices
(Percent of production workers employed on late shifts by amount of pay differential, United States and selected regions, September 1977)
Shift differential UnitedStates1 Great Lakes Middle West
Second shift
Workers employed on second shift ........ 23.1 23.4 24.1Receiving differential ............................. 22.8 23.4 24.1
Uniform cents per hour ...................... 22.8 23.4 24.1Under 12 cents................................ .6 .2 _12 cents............................................ 7.1 13.9 _14 cents............................................ .5 - _15 cents............................................ 7.0 5.8 9.318 cents............................................ 6.5 3.4 12.720 cents............................................ 1.1 - 2.2
Third or other late shift
Workers employed on thirdor other late shift.................................... 20.3 19.0 23.5Receiving differential ............................. 20.1 19.0 23.5
Uniform cents per hour...................... 20.1 19.0 23.515 cents............................................ .5 - _16 cents............................................ 0 .1 _18 cents............................................ 5.8 10.8 _20 cents............................................ 1.3 - 3.6Over 20 and under 25 cents .......... .5 _ _25 cents............................................ 1.2 2.3 _Over 25 and under 30 cents ........... .3 .5 _30 cents............................................ 4.1 2.8 7.235 cents............................................ 1.6 2.5 _
Over 35 cents.................................. 4.7 - 12.7
' Includes data for regions in addition to those shown separately. 2 Less than 0.05 percent.
NOTE: Because of rounding, sums of individual items may not equal totals.
Table 43. Wet corn milling: Paid holidays
(Percent of production workers with formal provisions for paid holidays, United States and selected regions, September 1977)
Number of paid holidays
UnitedStates’ Great Lakes Middle West
All workers............................................ 100 100 100
Workers in establishmentsproviding paid holidays........................... 100 100 1008 days ..................................................... 7 14 -9 days ..................................................... 25 17 2910 days ................................................... 68 69 71
1 Includes data for regions in addition to those shown separately.
NOTE: Because of rounding, sums of individual items may not equal totals.
43Digitized for FRASER http://fraser.stlouisfed.org/ Federal Reserve Bank of St. Louis

(Percent of production workers with formal provisions for paid vacations after selected periods of service, United States and selected regions, September 1977)
Table 44. Wet corn milling: Paid vacations
-tk
Vacation policy UnitedStates' Great Lakes Middle West Vacation policy United
States’ Great Lakes Middle West
All workers............................................. 100 100 100
Method of payment Amount of vacation pay2
Workers in establishments After 10 years of service:100 100 100 3 weeks .................................................. 90 82 9898 96 100 Over 3 and under 4 weeks................... 7 142 4 5 weeks .................................................. 2 4
6 weeks .................................................. 1 - 2Amount of vacation pay2 After 15 years of service:
3 weeks .................................................. 7 - 14After 1 year of service: 4 weeks .................................................. 83 82 84
88 100 74 Over 4 and under 5 weeks................... 7 148 14 5 weeks .................................................. 2 41 2 Over 7 weeks ........................................ 1 2
After 2 years of service: After 20 years of service:92 86 98 3 weeks .................................................. 7 14
7 14 5 weeks .................................................. 85 86 841 2 Over 5 and under 6 weeks................... 7 14
After 5 years of service: Over 7 weeks ........................................ 1 22 weeks .................................................. 72 67 84 After 25 years of service:3
7 14 _ 3 weeks .................................................. 7 1418 15 14 5 weeks .................................................. 35 543 4 2 6 weeks .................................................. 51 32 84
Over 6 and under 7 weeks................... 7 14Over 7 weeks ........................................ 1 - 2
1 Includes data for regions in addition to those shown separately.2 Vacation payments, such as percent of annual earnings, were converted to
an equivalent time basis. Periods of service were chosen arbitrarily and do not necessarily reflect individual establishment provisions for progression. For example, changes indicated at 10 years may include changes that occurred
between 5 and 10 years.3 Vacation provisions were virtually the same after longer periods of service.
NOTE: Because of rounding, sums of individual items may not equal totals.
Digitized for FRASER http://fraser.stlouisfed.org/ Federal Reserve Bank of St. Louis

Table 45. Wet corn milling: Health, insurance, and retirement benefits
(Percent of production workers with specified health, insurance, and retirement plans,’ United States and selected regions, September 1977)
Type of plan UnitedStates2 Great Lakes Middle West
All workers............................................ 100 100 100
Workers in establishments providing:
Life insurance........................................ 92 83 100Noncontributory plans......................... 64 83 36
Accidental death anddismemberment insurance .................. 69 68 67Noncontributory plans......................... 46 68 22
Sickness and accident insuranceor sick leave or both3........................... 96 100 91Sickness and accident insurance ...... 92 100 89
Noncontributory plans...................... 71 100 33Sick leave (full pay,no waiting period) .............................. 9 - 14
Sick leave (partial payor waiting period) ............................... 4 - 2
Long-term disability insurance.............. 40 64 21Noncontributory plans......................... 26 50 2
Hospitalization insurance...................... 100 100 100Noncontributory plans......................... 41 54 16
Surgical insurance................................. 100 100 100Noncontributory plans......................... 41 54 16
Medical insurance................................. 100 100 100Noncontributory plans......................... 41 54 16
Major medical insurance....................... 100 100 100Noncontributory plans......................... 41 54 16
Retirement plans4.................................. 100 100 100Pensions.............................................. 100 100 100
Noncontributory plans...................... 72 86 45
1 Includes those plans for which the employer pays at least part of the cost and excludes legally required plans such as workers’ compensation and social security; however, plans required by State temporary disability laws are included if the employer contributes more than is legally required or the employees receive benefits in excess of legal requirements. “ Noncontributory plans” include only those plans financed entirely by the employer.
2 Includes data for regions in addition to those shown separately.3 Unduplicated total of workers receiving sickness and accident insurance and
sick leave shown separately.4 Unduplicated total of workers covered by pension plans and severance pay
shown separately.
NOTE: Because of rounding, sums of individual items may not equal totals.
Table 46. Wet corn milling: Other selected benefits
(Percent of production workers with provisions for funeral leave , jury duty , and technological severance pay, ' United States and selected regions, September 1977)
Type of benefitUnitedStates2 Great Lakes Middle West
Workers in establishmentswith provisions for:
Funeral leave............................................ 92 83 100Jury-duty leave......................................... 90 83 100Technological severance pay ................. 40 65 19
’ For definition of items, see appendix A.2 Includes data for regions in addition to those shown separately.
45Digitized for FRASER http://fraser.stlouisfed.org/ Federal Reserve Bank of St. Louis

Appendix A. Scope and Method of Survey
Scope of surveyThe survey included establishments engaged primari
ly in the following manufacturing activities as defined in the 1972 edition of the Standard Industrial Classification Manual (SIC) prepared by the U.S. Office of Management and Budget:
1. Milling flour or meal from grain, except rice (SIC 2041). The products of the flour and other grain mill products industry may be sold plain or in the form of prepared mixes or doughs for specific purposes.
2. Cleaning and polishing rice, and in manufacturing rice flour or meal (SIC 2044). Other important products of the rice milling industry include brown rice, milled rice (including polished rice), rice polish, and rice bran.
3. Preparing blended flours and flour mixes or doughs from purchased flour (SIC 2045).
4. Milling corn or sorgum grain (milo) by the wet process method, and producing starch, syrup, oil, sugar, and byproducts, such as gluten feed and meal (SIC 2046). Also included in the wet corn milling industry are establishments primarily manufacturing starch from other vegetable sources (potatoes, wheat, etc.).
Separate auxiliary units such as central offices were excluded.
Establishments studied were selected from those employing 20 workers or more at the time of reference of the data used in compiling the universe lists. Table A-l shows the number of establishments and workers estimated to be within the scope of the survey, as well as the number actually studied.
Method of studyData were obtained by personal visits of the Bureau’s
field staff to a representative sample of establishments within the scope of the survey. To obtain appropriate accuracy at minimum cost, a greater proportion of large than of small establishments was studied. All estimates are presented, therefore, as relating to all establishments in the industry, excluding only those below the minimum size at the time of reference of the universe data.
Establishment definitionAn establishment is defined for this study as a single
physical location where manufacturing operations are
performed. An establishment is not necessarily identical with a company, which may consist of one establishment or more.
EmploymentEstimates of the number of workers within the scope
of the study are intended as a general guide to the size and composition of the industry’s labor force, rather than as precise measures of employment.
Production workersThe terms “production workers” and “production
and related workers,” used interchangeably in this bulletin, include working supervisors and all nonsuper- visory workers engaged in nonoffice activities. Administrative, executive, professional, and technical personnel, and force-account construction employees, who are used as a separate work force on the firm’s own properties, are excluded.
Occupational classificationOccupational classification was based on a uniform
set of job descriptions designed to take account of interestablishment and interarea variations in duties within the same job. (See appendix B for these descriptions.) The criteria for selection of the occupations were: The number of workers in the occupation; the usefulness of the data in collective bargaining; and appropriate representation of the entire job scale in the industry. Working supervisors, apprentices, learners, beginners, trainees, and handicapped, part-time, temporary, and probationary workers were not reported in the data for selected occupations but were included in the data for all production workers.
Wage dataInformation on wages relates to straight-time hourly
earnings, excluding premium pay for overtime and for work on weekends, holidays, and late shifts. Incentive payments, such as those resulting from piecework or production bonus systems, and cost-of-living bonuses were included as part of the workers’ regular pay. Nonproduction bonus payments, such as Christmas or yearend bonuses, were excluded.
Average (mean) hourly rates or earnings for each occupation or category of workers, such as production workers, were calculated by weighting each rate (or hourly earnings) by the number of workers receiving
46Digitized for FRASER http://fraser.stlouisfed.org/ Federal Reserve Bank of St. Louis

Table A-1. Estimated number of establishments and employees within scope of survey and number studied, grain mill products, September 1977
Region’
Number of establishments2 Workers in establishments
Within scope of study Actually studied
Within scope of study
Actually studiedTotal3 Production
workers
Flour and other grain mill products:United States4................................................................. 193 102 14,539 10,550 9,683
Middle Atlantic............................................................. 25 11 1,612 1,278 1,088Border States............................................................... 14 7 450 338 226Southeast.................................................................... 30 20 1,723 1,225 1,422Southwest ................................................................... 15 12 1,120 756 1,002Great Lakes................................................................. 48 20 4,602 3,176 2,758Middle W est................................................................. 37 14 3,147 2,476 1,565Mountain...................................................................... 11 9 633 476 570Pacific .......................................................................... 13 9 1,252 825 1,052
Rice milling:United States.................................................................. 40 25 3,590 2,642 2,742
Blended and prepared flour:United States4................................................................. 45 36 6,851 5,187 6,432
Southwest ................................................................... 8 6 671 495 651Great Lakes................................................................. 12 10 3,846 3,015 3,742Middle W est................................................................. 7 6 898 632 788Pacific.......................................................................... 7 5 419 284 293
Wet corn milling:United States4................................................................. 22 17 10,089 6,337 8,417
Great Lakes ................................................................ 6 6 4,875 3,229 4,875Middle W est................................................................. 9 6 4,220 2,362 2,671
The regions used in this study include Middle A tlan tic- New Jersey, New York, and Pennsylvania; Border States— Delaware, District of Columbia, Kentucky, Maryland, Virginia, and West Virginia; Southeast—Alabama, Florida, Georgia, Mississippi, North Carolina, South Carolina, and Tennessee; Southwest—Arkansas, Louisiana, Oklahoma, and Texas; Great Lakes—Illinois, Indiana, Michigan, Minnesota, Ohio, and Wisconsin; Middle West—Iowa, Kansas, Missouri, North Dakota, and South Dakota; Mountain—Arizona, Colorado, Idaho,
the rate, totaling, and dividing by the number of individuals. The hourly earnings of salaried workers were obtained by dividing straight-time salaries by the normal (or standard) hours to which the salaries correspond.
The median designates position; that is, one-half of the employees surveyed received more than this rate and one-half received less. The middle range is defined by two rates of pay such that one-fourth of the employees earned less than the lower of these rates and one-fourth earned more than the higher rate.
Size of communityTabulations by size of community pertain to metro
politan and nonmetropolitan areas. The term “metropolitan areas,” as used in this bulletin, refers to the Standard Metropolitan Statistical Areas as defined by the U.S. Office of Management and Budget through February 1974. Except in New England, a Standard Metropolitan Statistical Area is defined as a county or group of contiguous counties which contains at least one city of 50,000 inhabitants or more. Counties contiguous to the one containing such a city are included in a Standard Metropolitan Statistical Area if,
Montana, New Mexico, Utah, and Wyoming; and Pacific— California, Nevada, Oregon, and Washington.
2 Includes only those establishments with 20 workers or more at the time of reference of the universe data.
3 Includes executive, professional, office, and other workers in addition to the production worker category shown separately.
4 Includes data for regions in addition to those shown separately. Alaska and Hawaii were not Included In the study.
according to certain criteria, they are essentially metropolitan in character and are socially and economically integrated with the central city. In New England, where the city and town are administratively more important than the county, they are the units used in defining Standard Metropolitan Statistical Areas.
Labor-management agreementsSeparate wage data are presented, where possible,
for establishments that had (1) a majority of the production workers covered by labor-management contracts, and (2) none or a minority of the production workers covered by labor-management contracts.
Method of wage paymentTabulations by method of wage payment relate to
the number of workers paid under the various time and incentive wage systems. Formal rate structures for time-rated workers provide single rates or a range of rates for individual job categories. In the absence of a formal rate structure, pay rates are determined primarily by the qualifications of the individual worker. A single rate structure is one in which the same rate is paid to all experienced workers in the same job
47Digitized for FRASER http://fraser.stlouisfed.org/ Federal Reserve Bank of St. Louis

classification. Learners, apprentices, or probationary workers may be paid according to rate schedules which start below the single rate and permit the workers to achieve the full job rate over a period of time. An experienced worker occasionally may be paid above or below the single rate for special reasons, but such payments are exceptions. Range-of-rate plans are those in which the minimum, maximum, or both of these rates paid experienced workers for the same job are specified. Specific rates of individual workers within the range may be determined by merit, length of service, or a combination of these. Incentive workers are classified under piecework or bonus plans. Piecework is work for which a predetermined rate is paid for each unit of output. Production bonuses are for production in excess of a quota or for completion of a task in less than standard time.
Scheduled weekly hoursData on weekly hours refer to the predominant work
schedule for full-time production workers employed on the day shift.
Shift provisions and practicesShift provisions relate to the policies of establish
ments either currently operating late shifts or having formal provisions covering late-shift work. Practices relate to workers employed on late shifts at the time of the survey.
Establishment practices and supplementary wage provisions
Supplementary benefits in an establishment were considered applicable to all production workers if they applied to half or more of such workers in the establishment. Similarly, if fewer than half of the workers were covered, the benefit was considered nonexistent in the establishment. Because of length-of- service and other eligibility requirements, the proportion of workers receiving the benefits may be smaller than estimated.
Paid holidays. Paid holiday provisions relate to full-day and half-day holidays provided annually.
Paid vacations. The summaries of vacation plans are limited to formal arrangements and exclude informal plans whereby time off with pay is granted at the discretion of the employer or supervisor. Payments not on a time basis were converted; for example, a payment of 2 percent of annual earnings was considered the equivalent of 1 week’s pay. The periods of service for which data are presented represent the most common practices, but they do not necessarily reflect individual establishment provisions for progression. For example, changes in proportions indicated at 10 years of service may include changes which occurred between 5 and 10 years.
Health, insurance, and retirement plans. Data are presented for health, insurance, pension, and retirement severance plans for which the employer pays all or a part of the cost, excluding programs required by law such as workers’ compensation and social security. Among plans included are those underwritten by a commercial insurance company and those paid directly by the employer from his current operating funds or from a fund set aside for this purpose.
Death benefits are included as a form of life insurance. Sickness and accident insurance is limited to that type of insurance under which predetermined cash payments are made directly to the insured on a weekly or monthly basis during illness or accident disability. Information is presented for all such plans to which the employer contributes at least a part of the cost. However, in New York and New Jersey, where temporary disability insurance laws require employer contributions,1 plans are included only if the employer (1) contributes more than is legally required, or (2) provides the employees with benefits which exceed the requirements of the law.
Tabulations of paid sick leave plans are limited to formal plans which provide full pay or a proportion of the worker’s pay during absence from work because of illness; informal arrangements have been omitted. Separate tabulations are provided for (1) plans which provide full pay and no waiting period, and (2) plans providing either partial pay or a waiting period.
Long-term disability insurance plans provide payments to totally disabled employees upon the expiration of sick leave, sickness and accident insurance, or both, or after a specified period of disability (typically 6 months). Payments are made until the end of disability, a maximum age, or eligibility for retirement benefits. Payments may be full or partial, but are almost always reduced by social security, workers’ compensation, and private pension benefits payable to the disabled employee.
Medical insurance refers to plans providing for complete or partial payment of doctors’ fees. Such plans may be underwritten by a commercial insurance company or a nonprofit organization, or they may be a form of self-insurance.
Major medical insurance, sometimes referred to as extended medical or catastrophe insurance, includes plans designed to cover employees for sickness or injury involving an expense which exceeds the normal coverage of hospitalization, medical, and surgical plans.
Tabulations of retirement pensions are limited to plans which provide regular payments for the remainder of the retiree’s life. Data are presented separately for retirement severance pay (one payment or several over a specified period of time) made to employees on
‘The temporary disability laws in California and Rhode Island do not require employer contributions.
48Digitized for FRASER http://fraser.stlouisfed.org/ Federal Reserve Bank of St. Louis

retirement. Establishments providing both retirement severance payments and retirement pensions to employees were considered as having both retirement pensions and retirement severance plans; however, establishments having optional plans providing employees a choice of either retirement severance payments or pensions were considered as having only retirement pension benefits.
Paid funeral and jury-duty leave. Data for paid funeral
and jury-duty leave relate to formal plans which provide at least partial payment for time lost as a result of attending funerals of specified family members or serving as a juror.
Technological severance pay. Data relate to formal plans providing for payments to employees permanently separated from the company because of a technological change or plant closing.
49Digitized for FRASER http://fraser.stlouisfed.org/ Federal Reserve Bank of St. Louis

Appendix B. Occupational Descriptions
The primary purpose of preparing job descriptions for the Bureau’s wage survey is to assist its field representatives in classifying into appropriate occupations workers who are employed under a variety of payroll titles and different work arrangements from establishment to establishment and from area to area. This permits the grouping of occupational wage rates representing comparable job content. Because of this emphasis on interestablishment and interarea comparability of occupational content, the Bureau’s job description may differ significantly from those used in individual establishments or those prepared for other purposes. In applying these job descriptions, the Bureau’s field representatives are instructed to exclude working supervisors, apprentices, learners, beginners, trainees, and handicapped, part-time, temporary, and probationary workers.
Elevator operations
Cleaner, bulkTends one or more separating, aspirating, scouring, wash
ing, or tempering machines to remove foreign materials, such as dirt, stones, sticks, or metal fragments from bulk inputs prior to processing. May also repair such machinery.
Receiver(Elevator operator)Controls conveyor or elevator systems which transfer
bulk inputs from vehicles to stockpiles or to cleaning or weighing processes. May also repair, clean, or adjust such machinery. May initiate cleaning process or weigh or tally deliveries.
WeigherWeighs deliveries received through conveyor system,
usually using beam scale. Records weights, descriptions, and source of bulk deliveries. May assist or be assisted by receiver in duties.
Processing—flour and other grain mill products
BlenderBlends milled grains into prescribed proportions for spe
cific quality flours. May tend enriching machines to produce patent or other flours.
Bolter(Sifter; purifier operator)Sifts ground grain in the sifting and aspirating machines
to remove the broken kernels and lumps to be returned to
grinding mills for further processing; adjusts feed slides so machine can take in only as much grain as it will sift.
Miller, flour(Second miller)Performs any or all necessary cleaning, grinding, bolting
(sifting), and packing jobs in a grain mill. Starts machinery and examines grain at various stages of manufacture to determine degree of fineness. Inspects various mills for proper operation and makes any necessary adjustments
Roll tenderRegulates flow of grain between various grinding rollers
of a rolling mill. Work includes: Moving rollers together so that grain passing between them will be crushed; starts feeder roll which moves grain out of supply hopper of mill and causes it to fall between rotating grinding rolls.
Processing—rice milling
Cooker and drierTends steam pressure cooker for parboiling or cooking
rice prior to removal of hulls and/or tends heating or drying machines to prepare moist or parboiled rice for hulling. (Also includes freezedry operators in instant or quick- cook operations.) May also repair such machinery.
Huller and pearlerTends any of various machines which separate the hull
from the rice and/or any of the various machines for the removal of the cuticle and bran layers from the separate rice kernels. May also repair such machinery.
50Digitized for FRASER http://fraser.stlouisfed.org/ Federal Reserve Bank of St. Louis

Polisher and separatorTends any of various machines for the buffing or polish
ing of white rice and/or any of various sorting machines for the removal and collection of resulting byproducts, such as brokens, bran, and rice polish. May also repair such machinery.
Processing—blended and prepared flour
Machine tender, mixing and blendingTends one or more areas, conveyors, or mixing vats.
Adjusts or sets up machines, independently or under the direction of panelboard operator, to facilitate continuous process flow.
Panelboard operator, mixing and blendingOperates a panelboard to monitor and control some or
all of the mixing, blending, and conveying operations involved in the manufacture of flour mixes or doughs. Observes dials, meters, lights, and gauges for indications of overloads, malfunctions, or system blockages. Notifies specific area or machine tenders involved of observed deficiencies or maladjustments. Notifies maintenance personnel of equipment malfunctions or failures.
Processing—wet corn milling
Converter operatorOperates converter that changes starch into glucose or
corn syrup and tests product to verify purity. Turns valves to admit steam, water, and starch into converter. Monitors cooking of starch, treating with acid or enzymes; makes titration tests and routes syrup to refining or storage areas when conversion is complete.
Machine tender, dry starchTends one or more of the following machines or areas:
Blending tank, filter, dewatering press, and drier. Observes, adjusts, or sets up machines, independently or under the direction of panelboard operator, to facilitate continuous flow of starch through treating, purifying, and drying operations.
Machine tender, millingTends one or more of the following machines or areas:
Steep tanks, degerminators, grinders, fiber washers, or cen- trifrigers. Observes, digests, or sets up machines, independently or under the direction of panelboard operator, to facilitate continuous flow of corn kernels through the initial milling operations.
Machine tender, syrup refiningTends one or more of the following machines or areas:
Filters (charcoal or other), coolers, driers, or evaporators. Observes, adjusts, or sets up machines, independently or under the direction of panelboard operator, to facilitate
the continuous flow of syrups through purification and concentration operations.
Panelboard operator, dry starchOperates a panelboard to monitor and control some or
all of the blending, filtering, dewatering, or drying operations in the production of dry starch at a corn processing plant. Observes dials, meters, lights, and gauges for indications of overloads, malfunctions, or system blockages. Notifies specific area or machine tenders involved of observed deficiencies or maladjustments. Notifies maintenance personnel of equipment malfunctions or failures.
Panelboard operator, millingOperates a panelboard to monitor and control some or
all of the steeping, degerminating, grinding, separating, and fiber washing operations of a corn processing plant. Observes dials, meters, lights, and gauges for indications of overloads, malfunctions, or system blockages. Notifies specific area or machine tenders involved of observed deficiencies or maladjustments. Notifies maintenance personnel of equipment malfunctions or failures.
Panelboard operator, syrup refiningOperates a panelboard to monitor and control some or
all of the filtering, purifying, cooling, or concentrating operations in the production of corn syrup and syrup solids. Observes dials, meters, lights, and gauges for indications of overloads, malfunctions, or system blockages. Notifies specific area or machine tenders involved of observed deficiencies or maladjustments. Notifies maintenance personnel of equipment malfunctions or failures.
Packing
PackerTends a machine that packs and weighs finished pro
ducts or materials; places empty sack, bag, or other container over discharge nozzle or spout of packing machine; starts flow of product or material into container; and shuts off or stops flow of product or material when specified weight or amount has entered the container (machine may do this automatically). May seal or close containers by hand or machine. May make adjustments and minor repairs.
For wage study purposes, packers in flour and other grain mill products are classified as follows:
Packer, feed Packer, flour
For wage study purposes, packers in rice milling are classified as follows:
Packer, bran Packer, rice
For wage study purposes, packers in blended and prepared flour are classified as follows:
Packer, doughs Packer, flour mixes
51Digitized for FRASER http://fraser.stlouisfed.org/ Federal Reserve Bank of St. Louis

For wage study purposes, packers are classified as follows:
Packer, dry syrup Packer, feed Packer, germ Packer, starch Packer, syrup
Material movement
Laborer, material handling(Loader and unloader; handler and stacker; shelver;
trucker; stockman or stock helper; warehouseman or warehouse helper)
A worker employed in a warehouse, manufacturing plant, or other establishment whose duties involve one or more o f the following: Loading and unloading various materials and merchandise on or from freight cars, trucks, or other transporting devices; unpacking, shelving, or placing materials or merchandise in proper storage location; or transporting materials or merchandise by hand truck, car, or wheelbarrow. Longshoremen, who load and unload ships, are excluded.
Trucker, powerOperates a manually controlled gasoline- or electric-
powered truck or tractor to transport goods and materials in a warehouse, manufacturing plant, or other establishment.
For wage study purposes, workers are classified by type of truck, as follows:
Trucker, power (forklift)Trucker, power (other than forklift)
Maintenance
ElectricianPerforms a variety of electrical trade functions, such as
the installation, maintenance, or repair of equipment for the generation, distribution, or utilization of electric energy in an establishment. Work involves most o f the following: Installing or repairing any of a variety of electrical equipment, such as generators, transformers, switchboards, controllers, circuit breakers, motors, heating units, conduit systems, or other transmission equipment; working from blueprints, drawings, layout, or other specifications; locating and diagnosing trouble in the electrical system or equipment; working standard computations relating to load requirements of wiring or electrical equipment; and using a variety of electrician’s handtools and measuring and testing instruments. In general, the work of the maintenance electrician requires rounded training and experience usually acquired through a formal apprenticeship or equivalent training and experience.
Mechanic, general utilityPerforms the work of two or more maintenance trades
rather than specializing in only one trade or one type of maintenance work. Typically, the work of a general mechanic requires rounded training and experience usually acquired through a formal apprenticeship or equivalent training and experience.
The classification includes workers who regularly perform two or more types of skilled maintenance work within a section or department of a large establishment, such as pipefitting, millwrighting, welding, machining, machine and equipment repairing, and carpentry, among others. It also includes workers that maintain and repair machines, mechanical and electrical equipment, and/or the structure of a small establishment where specialization in maintenance work is impractical. It does not, however, include workers who only make minor repairs or adjustments.
MillwrightInstalls new machines or heavy equipment and disman
tles and installs machines or heavy equipment when changes in the plant layout are required. Work involves most o f the following: Planning and laying out of the work; interpreting blueprints or other specifications; using a variety of hand- tools and rigging; making standard shop computations relating to stresses, strength of materials, and centers of gravity; aligning and balancing of equipment; 'selecting standard tools, equipment, and parts to be used; and installing and maintaining in good order power transmission equipment, such as drives and speed reducers. In general, a millwright normally must have rounded training and experience in the trade acquired through a formal apprenticeship or equivalent training and experience.
OilerLubricates, with oil or grease, the moving parts or wear
ing surfaces of mechanical equipment of an establishment. May also clean surface of, or around, machines.
Sheet-metal workerFabricates, installs, and maintains in good repair the
sheet-metal equipment and fixtures (such as machine guards, grease pans, shelves, lockers, tanks, ventilators, chutes, ducts, metal roofing) of an establishment. Work involves most o f the following-. Planning and laying out all types of sheet-metal maintenance work from blueprints, models, or other specifications; setting up and operating all available types of sheet-metal working machines; using a variety of handtools in cutting, bending, forming, shaping, fitting, and assembling; and installing sheet-metal articles as required. In general, the work of the maintenance sheet-metal worker requires rounded training and experience usually acquired through a formal apprenticeship or equivalent training and experience.
52Digitized for FRASER http://fraser.stlouisfed.org/ Federal Reserve Bank of St. Louis

Service and custodial
GuardPerforms routine police duties, either at fixed post or on
tour, maintaining order, using arms or force where necessary. Includes gate tenders who are stationed at gate and check on identity of employees and other persons entering.
Janitor, porter, and cleaner(Sweeper; charwoman; janitress)
Cleans and keeps in an orderly condition factory working areas and washrooms, or premises of an office or other establishment. Duties involve a combination o f the following: Sweeping, mopping, or scrubbing, and polishing floors; removing chips, trash, and other refuse; dusting equipment, furniture, or fixtures; polishing metal fixtures or trimmings; providing supplies and minor maintenance services; and cleaning lavatories, showers, and restrooms. Workers who specialize in window washing are excluded.
53Digitized for FRASER http://fraser.stlouisfed.org/ Federal Reserve Bank of St. Louis

Industry Wage Studies
The most recent reports providing occupational wage data for industries included in the Bureau’s program of industry wage surveys since 1960 are listed below. Copies are for sale from the Superintendent of Documents, U.S. Government Printing Office, Washington, D.C. 20402, or from any of its
ManufacturingBasic Iron and Steel, 1972. BLS Bulletin 1839 Candy and Other Confectionery Products, 1975. Bulletin
1939Cigar Manufacturing, 1972. BLS Bulletin 1976 Cigarette Manufacturing, 1976. BLS Bulletin 1944 Corrugated and Solid Fiber Boxes, 1976. BLS Bulletin
1921Fabricated Structural Steel, 1974. BLS Bulletin 1935 Fertilizer Manufacturing, 1971. BLS Bulletin 1763 Fluid Milk Industry, 1973. BLS Bulletin 1871 Footwear, 1975. BLS Bulletin 1946 Grain Mill Products, 1977. BLS Bulletin 2026 Hosiery, 1976. BLS Bulletin 1987 Industrial Chemicals, 1976. BLS Bulletin 1978 Iron and Steel Foundries, 1973. BLS Bulletin 1894 Leather Tanning and Finishing, 1973. BLS Bulletin 1835 Machinery Manufacturing, 1978. BLS Bulletin 2022 Meat Products, 1974. BLS Bulletin 1896 Men’s and Boys’ Separate Trousers, 1974. BLS Bulletin
1906Men’s and Boys’ Shirts (Except Work Shirts) and Night
wear, 1974. BLS Bulletin 1901 Men’s and Boys’ Suits and Coats, 1976. BLS Bulletin 1962 Miscellaneous Plastics Products, 1974. BLS Bulletin 1914 Motor Vehicles and Parts, 1973-74. BLS Bulletin 1912 Nonferrous Foundries, 1975. BLS Bulletin 1952 "Paints and Varnishes, 1976. BLS Bulletin 1973 Paperboard Containers and Boxes, 1970. BLS Bulletin 1719 Petroleum Refining, 1976. BLS Bulletin 1948 Pressed or Blown Glass and Glassware, 1975. BLS Bulletin
1923Pulp, Paper, and Paperboard Mills, 1977. BLS Bulletin 2008 Semiconductors, 1977. BLS Bulletin 2021 Shipbuilding and Repairing, 1976. BLS Bulletin 1968 Southern Sawmills and Planing Mills, 1969. BLS Bulletin
1694Structural Clay Products, 1975. BLS Bulletin 1942
regional sales offices, and from the regional offices of the Bureau of Labor Statistics shown on the inside back cover. Copies that are out of stock are available for reference purposes at leading public, college, or university libraries, or at the Bureau’s Washington or regional offices.
Manufacturing-Continued Synthetic Fibers, 1976. BLS Bulletin 1975 Textile Dyeing and Finishing, 1976. BLS Bulletin 1967 Textiles, 1975. BLS Bulletin 1945Wages and Demographic Characteristics in Work Clothing
Manufacturing, 1972. BLS Bulletin 1858 West Coast Sawmilling, 1969. BLS Bulletin 1704 Women’s and Misses’ Coats and Suits, 1970. BLS Bulletin
1728Women’s and Misses’ Dresses, 1977. BLS Bulletin 2007 Wood Household Furniture, Except Upholstered, 1974.
BLS Bulletin 1930
NonmanufacturingAppliance Repair Shops, 1975. BLS Bulletin 1936 Auto Dealer Repair Shops, 1973. BLS Bulletin 1876 Banking and Life Insurance, 1976. BLS Bulletin 1988 Bituminous Coal Mining, 1976-81. BLS Bulletin 1999 Communications, 1976. BLS Bulletin 1991 Computer and Data Processing services, March 1978. BLS
Bulletin 2028Contract Cleaning Services, 1977. BLS Bulletin 2009 Contract Construction, 1973. BLS Bulletin 1911 Department Stores, 1977. BLS Bulletin 2006 Educational Institutions: Nonteaching Employees, 1968-69.
BLS Bulletin 1671Electric and Gas Utilities, 1972. BLS Bulletin 1834 Hospitals, 1975-76. BLS Bulletin 1949 Hotels and Motels, 1973. BLS Bulletin 1883 Laundry and Cleaning Services, 1968. BLS Bulletin 16451 Metal Mining, 1977. BLS Bulletin 2017 Motion Picture Theaters, 1966. BLS Bulletin 15421 Nursing Homes and Related Facilities, 1976. BLS Bulletin
1964Oil and Gas Extraction, 1977. BLS Bulletin 2014 Scheduled Airlines, 1975. BLS Bulletin 1951 Wages and Tips in Restaurants and Hotels, 1970. BLS
Bulletin 17121 Bulletin out o f stock
54☆ U.S. GOVERNMENT PRINTING OFFICE : 1979 0 - 2 8 1 - 4 1 2 (104)Digitized for FRASER
http://fraser.stlouisfed.org/ Federal Reserve Bank of St. Louis

Bureau of Labor Statistics Regional Offices
Region I1603 JFK Federal Building Government Center Boston. Mass 02203 Phone (617) 223-6761
Region IISuite 3400 1515 Broadway New York. N Y 10036 Phone (212)399-5405
Region III3535 Market Street P O Box 13309 Philadelphia. Pa 19101 Phone: (215) 596-1154
Region IV1371 Peachtree Street. NE Atlanta. Ga 30309 Phone: (404) 881-4418
Region V9th FloorFederal Office Building 230 S Dearborn Street Chicago, III 60604 Phone: (312) 353-1880
Region VISecond Floor555 Griffin Square Building Dallas, Tex 75202 Phone: (214) 749-3516
Regions VII and V III*911 Walnut Street Kansas City, Mo. 64106 Phone: (816)374-2481
Regions IX and X**450 Golden Gate Avenue Box 36017San Francisco, Calif 94102 Phone: (415) 556-4678
* Regions VII and VIII are serviced by Kansas City
"Regions IX and X are serviced by San Francisco
Digitized for FRASER http://fraser.stlouisfed.org/ Federal Reserve Bank of St. Louis


