Bloomberg Commodity Outlook – March 2018 Edition … · Bloomberg Commodity Outlook – March...
34
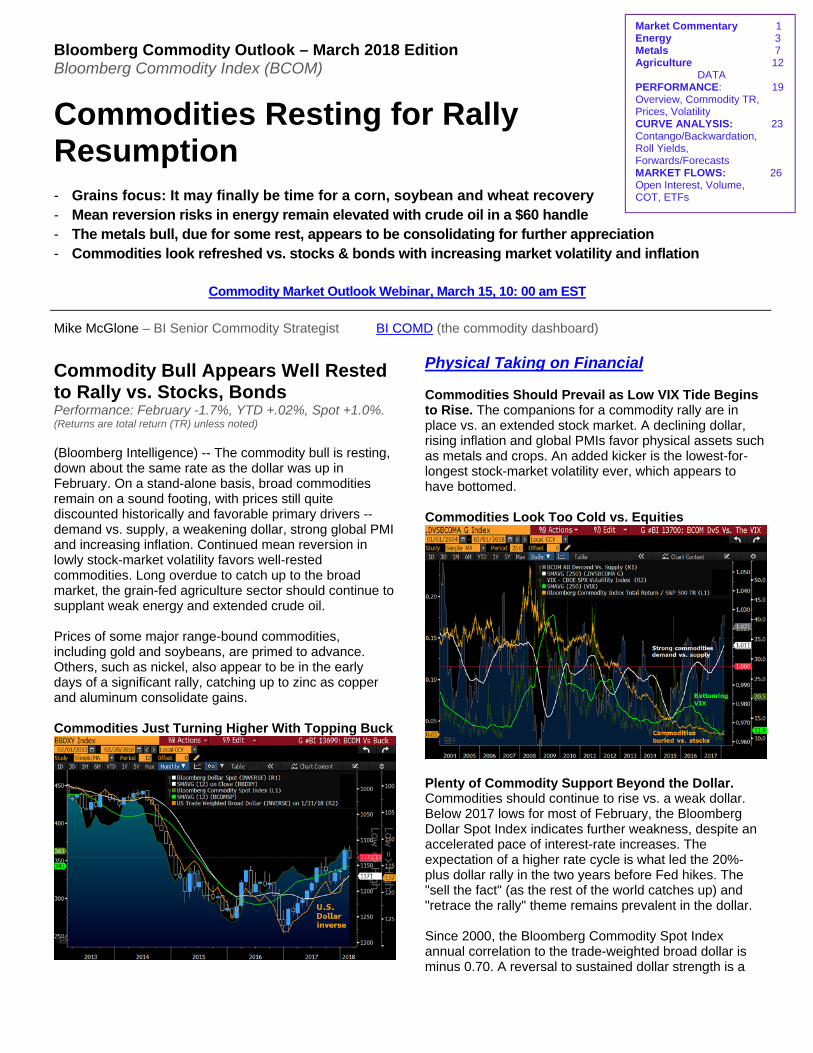
Bloomberg Commodity Outlook – March 2018 Edition Bloomberg Commodity Index (BCOM) Commodities Resting for Rally Resumption - Grains focus: It may finally be time for a corn, soybean and wheat recovery - Mean reversion risks in energy remain elevated with crude oil in a $60 handle - The metals bull, due for some rest, appears to be consolidating for further appreciation - Commodities look refreshed vs. stocks & bonds with increasing market volatility and inflation Commodity Market Outlook Webinar, March 15, 10: 00 am EST Mike McGlone – BI Senior Commodity Strategist BI COMD (the commodity dashboard) Commodity Bull Appears Well Rested to Rally vs. Stocks, Bonds Performance: February -1.7%, YTD +.02%, Spot +1.0%. (Returns are total return (TR) unless noted) (Bloomberg Intelligence) -- The commodity bull is resting, down about the same rate as the dollar was up in February. On a stand-alone basis, broad commodities remain on a sound footing, with prices still quite discounted historically and favorable primary drivers -- demand vs. supply, a weakening dollar, strong global PMI and increasing inflation. Continued mean reversion in lowly stock-market volatility favors well-rested commodities. Long overdue to catch up to the broad market, the grain-fed agriculture sector should continue to supplant weak energy and extended crude oil. Prices of some major range-bound commodities, including gold and soybeans, are primed to advance. Others, such as nickel, also appear to be in the early days of a significant rally, catching up to zinc as copper and aluminum consolidate gains. Commodities Just Turning Higher With Topping Buck Physical Taking on Financial Commodities Should Prevail as Low VIX Tide Begins to Rise. The companions for a commodity rally are in place vs. an extended stock market. A declining dollar, rising inflation and global PMIs favor physical assets such as metals and crops. An added kicker is the lowest-for- longest stock-market volatility ever, which appears to have bottomed. Commodities Look Too Cold vs. Equities Plenty of Commodity Support Beyond the Dollar. Commodities should continue to rise vs. a weak dollar. Below 2017 lows for most of February, the Bloomberg Dollar Spot Index indicates further weakness, despite an accelerated pace of interest-rate increases. The expectation of a higher rate cycle is what led the 20%- plus dollar rally in the two years before Fed hikes. The "sell the fact" (as the rest of the world catches up) and "retrace the rally" theme remains prevalent in the dollar. Since 2000, the Bloomberg Commodity Spot Index annual correlation to the trade-weighted broad dollar is minus 0.70. A reversal to sustained dollar strength is a Market Commentary 1 Energy 3 Metals 7 Agriculture 12 DATA PERFORMANCE: 19 Overview, Commodity TR, Prices, Volatility CURVE ANALYSIS: 23 Contango/Backwardation, Roll Yields, Forwards/Forecasts MARKET FLOWS: 26 Open Interest, Volume, COT, ETFs
Transcript of Bloomberg Commodity Outlook – March 2018 Edition … · Bloomberg Commodity Outlook – March...
Bloomberg Commodity Outlook – March 2018 Edition Bloomberg Commodity Index (BCOM)
Commodities Resting for Rally Resumption - Grains focus: It may finally be time for a corn, soybean and wheat recovery - Mean reversion risks in energy remain elevated with crude oil in a $60 handle - The metals bull, due for some rest, appears to be consolidating for further appreciation - Commodities look refreshed vs. stocks & bonds with increasing market volatility and inflation
Commodity Market Outlook Webinar, March 15, 10: 00 am EST
Mike McGlone – BI Senior Commodity Strategist BI COMD (the commodity dashboard)
Commodity Bull Appears Well Rested to Rally vs. Stocks, Bonds Performance: February -1.7%, YTD +.02%, Spot +1.0%. (Returns are total return (TR) unless noted) (Bloomberg Intelligence) -- The commodity bull is resting, down about the same rate as the dollar was up in February. On a stand-alone basis, broad commodities remain on a sound footing, with prices still quite discounted historically and favorable primary drivers -- demand vs. supply, a weakening dollar, strong global PMI and increasing inflation. Continued mean reversion in lowly stock-market volatility favors well-rested commodities. Long overdue to catch up to the broad market, the grain-fed agriculture sector should continue to supplant weak energy and extended crude oil. Prices of some major range-bound commodities, including gold and soybeans, are primed to advance. Others, such as nickel, also appear to be in the early days of a significant rally, catching up to zinc as copper and aluminum consolidate gains. Commodities Just Turning Higher With Topping Buck
Physical Taking on Financial Commodities Should Prevail as Low VIX Tide Begins to Rise. The companions for a commodity rally are in place vs. an extended stock market. A declining dollar, rising inflation and global PMIs favor physical assets such as metals and crops. An added kicker is the lowest-for-longest stock-market volatility ever, which appears to have bottomed. Commodities Look Too Cold vs. Equities
Plenty of Commodity Support Beyond the Dollar. Commodities should continue to rise vs. a weak dollar. Below 2017 lows for most of February, the Bloomberg Dollar Spot Index indicates further weakness, despite an accelerated pace of interest-rate increases. The expectation of a higher rate cycle is what led the 20%-plus dollar rally in the two years before Fed hikes. The "sell the fact" (as the rest of the world catches up) and "retrace the rally" theme remains prevalent in the dollar. Since 2000, the Bloomberg Commodity Spot Index annual correlation to the trade-weighted broad dollar is minus 0.70. A reversal to sustained dollar strength is a
Market Commentary 1 Energy 3 Metals 7 Agriculture 12 DATA PERFORMANCE: 19 Overview, Commodity TR, Prices, Volatility CURVE ANALYSIS: 23 Contango/Backwardation, Roll Yields, Forwards/Forecasts MARKET FLOWS: 26 Open Interest, Volume, COT, ETFs
Bloomberg Commodity Outlook – March 2018 Edition Bloomberg Commodity Index (BCOM)
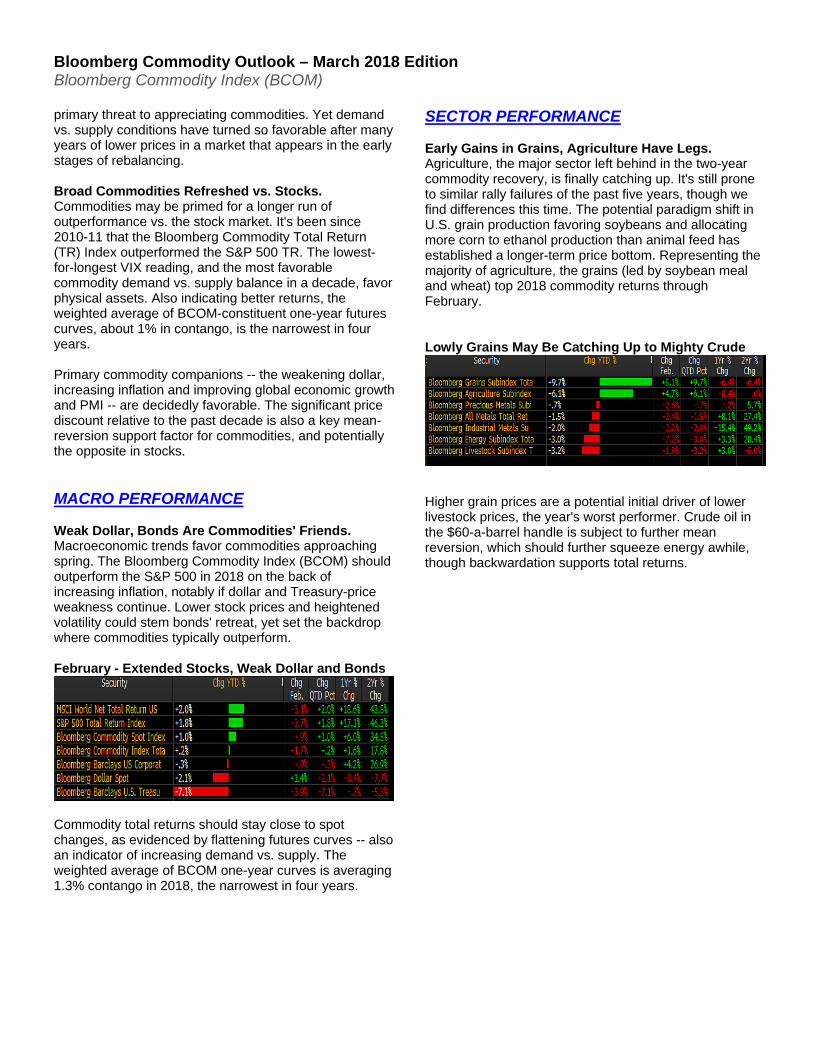
primary threat to appreciating commodities. Yet demand vs. supply conditions have turned so favorable after many years of lower prices in a market that appears in the early stages of rebalancing. Broad Commodities Refreshed vs. Stocks. Commodities may be primed for a longer run of outperformance vs. the stock market. It's been since 2010-11 that the Bloomberg Commodity Total Return (TR) Index outperformed the S&P 500 TR. The lowest-for-longest VIX reading, and the most favorable commodity demand vs. supply balance in a decade, favor physical assets. Also indicating better returns, the weighted average of BCOM-constituent one-year futures curves, about 1% in contango, is the narrowest in four years. Primary commodity companions -- the weakening dollar, increasing inflation and improving global economic growth and PMI -- are decidedly favorable. The significant price discount relative to the past decade is also a key mean-reversion support factor for commodities, and potentially the opposite in stocks. MACRO PERFORMANCE Weak Dollar, Bonds Are Commodities' Friends. Macroeconomic trends favor commodities approaching spring. The Bloomberg Commodity Index (BCOM) should outperform the S&P 500 in 2018 on the back of increasing inflation, notably if dollar and Treasury-price weakness continue. Lower stock prices and heightened volatility could stem bonds' retreat, yet set the backdrop where commodities typically outperform. February - Extended Stocks, Weak Dollar and Bonds
Commodity total returns should stay close to spot changes, as evidenced by flattening futures curves -- also an indicator of increasing demand vs. supply. The weighted average of BCOM one-year curves is averaging 1.3% contango in 2018, the narrowest in four years.
SECTOR PERFORMANCE Early Gains in Grains, Agriculture Have Legs. Agriculture, the major sector left behind in the two-year commodity recovery, is finally catching up. It's still prone to similar rally failures of the past five years, though we find differences this time. The potential paradigm shift in U.S. grain production favoring soybeans and allocating more corn to ethanol production than animal feed has established a longer-term price bottom. Representing the majority of agriculture, the grains (led by soybean meal and wheat) top 2018 commodity returns through February. Lowly Grains May Be Catching Up to Mighty Crude
Higher grain prices are a potential initial driver of lower livestock prices, the year's worst performer. Crude oil in the $60-a-barrel handle is subject to further mean reversion, which should further squeeze energy awhile, though backwardation supports total returns.
Bloomberg Commodity Outlook – March 2018 Edition Bloomberg Commodity Index (BCOM)
Energy (Index weight: 29% of BCOM) Performance: Feb. -7.2%, YTD -3.0, Spot -2.0% *Note index weights are the YTD average.
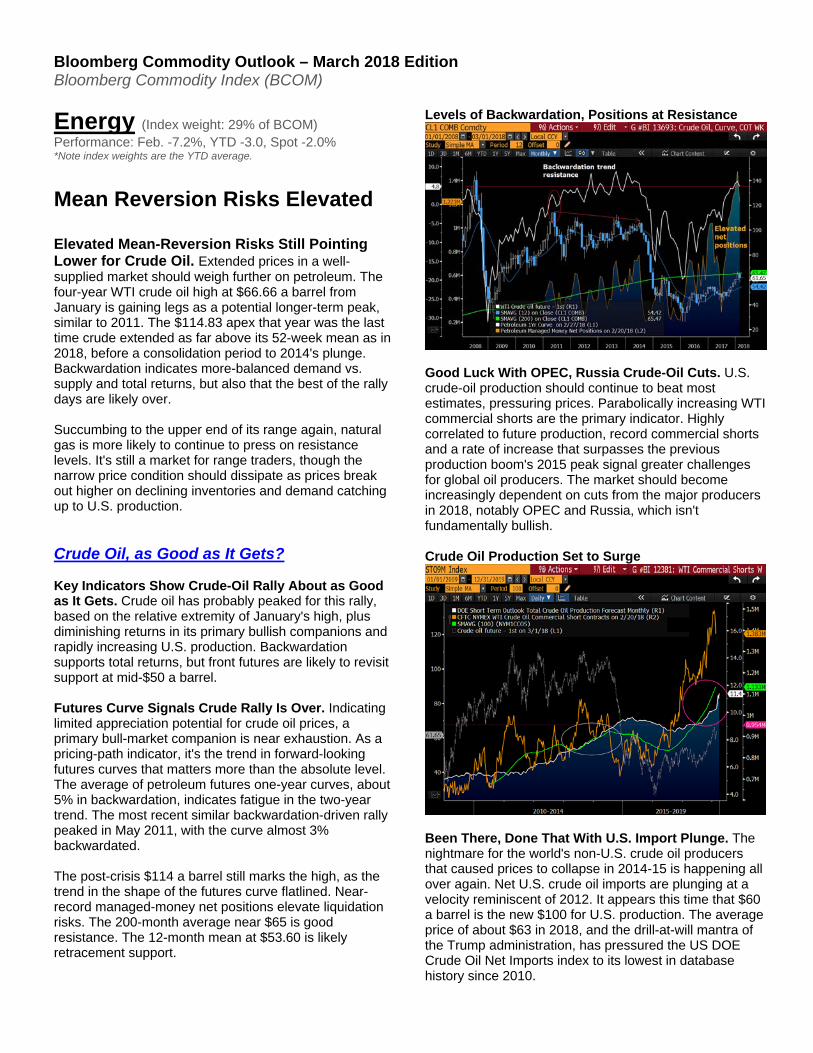
Mean Reversion Risks Elevated Elevated Mean-Reversion Risks Still Pointing Lower for Crude Oil. Extended prices in a well-supplied market should weigh further on petroleum. The four-year WTI crude oil high at $66.66 a barrel from January is gaining legs as a potential longer-term peak, similar to 2011. The $114.83 apex that year was the last time crude extended as far above its 52-week mean as in 2018, before a consolidation period to 2014's plunge. Backwardation indicates more-balanced demand vs. supply and total returns, but also that the best of the rally days are likely over. Succumbing to the upper end of its range again, natural gas is more likely to continue to press on resistance levels. It's still a market for range traders, though the narrow price condition should dissipate as prices break out higher on declining inventories and demand catching up to U.S. production. Crude Oil, as Good as It Gets? Key Indicators Show Crude-Oil Rally About as Good as It Gets. Crude oil has probably peaked for this rally, based on the relative extremity of January's high, plus diminishing returns in its primary bullish companions and rapidly increasing U.S. production. Backwardation supports total returns, but front futures are likely to revisit support at mid-$50 a barrel. Futures Curve Signals Crude Rally Is Over. Indicating limited appreciation potential for crude oil prices, a primary bull-market companion is near exhaustion. As a pricing-path indicator, it's the trend in forward-looking futures curves that matters more than the absolute level. The average of petroleum futures one-year curves, about 5% in backwardation, indicates fatigue in the two-year trend. The most recent similar backwardation-driven rally peaked in May 2011, with the curve almost 3% backwardated. The post-crisis $114 a barrel still marks the high, as the trend in the shape of the futures curve flatlined. Near-record managed-money net positions elevate liquidation risks. The 200-month average near $65 is good resistance. The 12-month mean at $53.60 is likely retracement support.
Levels of Backwardation, Positions at Resistance
Good Luck With OPEC, Russia Crude-Oil Cuts. U.S. crude-oil production should continue to beat most estimates, pressuring prices. Parabolically increasing WTI commercial shorts are the primary indicator. Highly correlated to future production, record commercial shorts and a rate of increase that surpasses the previous production boom's 2015 peak signal greater challenges for global oil producers. The market should become increasingly dependent on cuts from the major producers in 2018, notably OPEC and Russia, which isn't fundamentally bullish. Crude Oil Production Set to Surge
Been There, Done That With U.S. Import Plunge. The nightmare for the world's non-U.S. crude oil producers that caused prices to collapse in 2014-15 is happening all over again. Net U.S. crude oil imports are plunging at a velocity reminiscent of 2012. It appears this time that $60 a barrel is the new $100 for U.S. production. The average price of about $63 in 2018, and the drill-at-will mantra of the Trump administration, has pressured the US DOE Crude Oil Net Imports index to its lowest in database history since 2010.
Bloomberg Commodity Outlook – March 2018 Edition Bloomberg Commodity Index (BCOM)
Oil Vulnerable With Plunging Net U.S. Imports
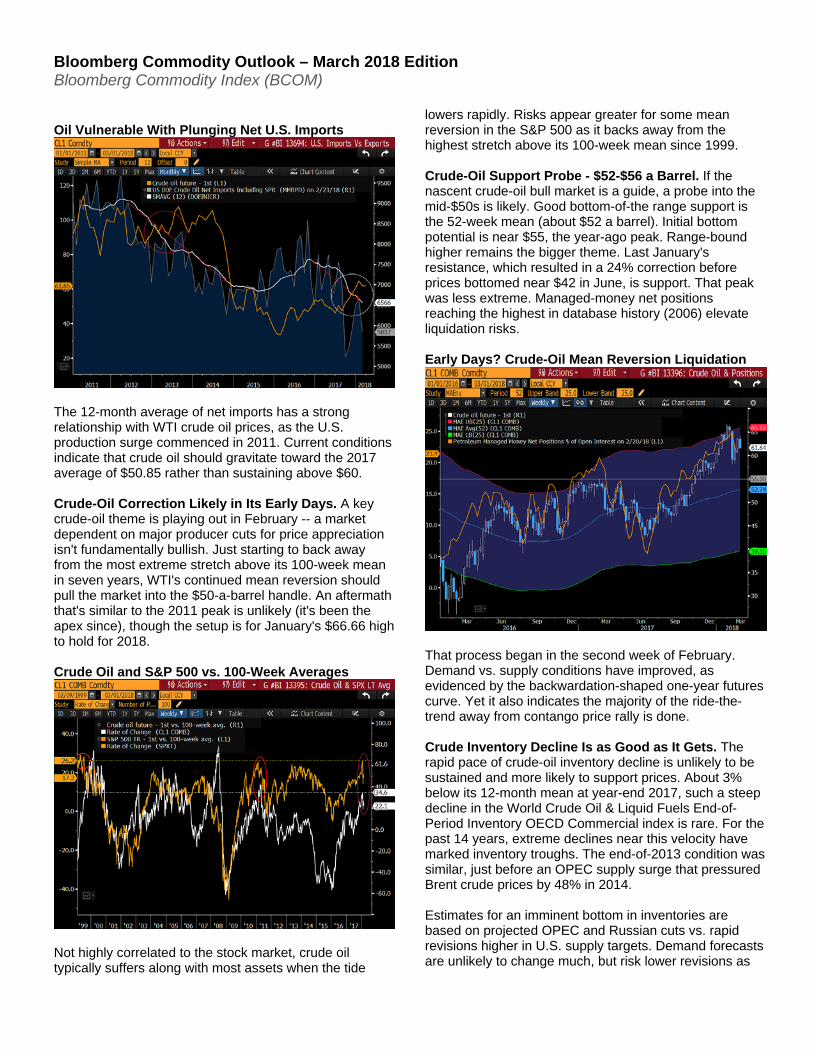
The 12-month average of net imports has a strong relationship with WTI crude oil prices, as the U.S. production surge commenced in 2011. Current conditions indicate that crude oil should gravitate toward the 2017 average of $50.85 rather than sustaining above $60. Crude-Oil Correction Likely in Its Early Days. A key crude-oil theme is playing out in February -- a market dependent on major producer cuts for price appreciation isn't fundamentally bullish. Just starting to back away from the most extreme stretch above its 100-week mean in seven years, WTI's continued mean reversion should pull the market into the $50-a-barrel handle. An aftermath that's similar to the 2011 peak is unlikely (it's been the apex since), though the setup is for January's $66.66 high to hold for 2018. Crude Oil and S&P 500 vs. 100-Week Averages
Not highly correlated to the stock market, crude oil typically suffers along with most assets when the tide
lowers rapidly. Risks appear greater for some mean reversion in the S&P 500 as it backs away from the highest stretch above its 100-week mean since 1999. Crude-Oil Support Probe - $52-$56 a Barrel. If the nascent crude-oil bull market is a guide, a probe into the mid-$50s is likely. Good bottom-of-the range support is the 52-week mean (about $52 a barrel). Initial bottom potential is near $55, the year-ago peak. Range-bound higher remains the bigger theme. Last January's resistance, which resulted in a 24% correction before prices bottomed near $42 in June, is support. That peak was less extreme. Managed-money net positions reaching the highest in database history (2006) elevate liquidation risks. Early Days? Crude-Oil Mean Reversion Liquidation
That process began in the second week of February. Demand vs. supply conditions have improved, as evidenced by the backwardation-shaped one-year futures curve. Yet it also indicates the majority of the ride-the-trend away from contango price rally is done. Crude Inventory Decline Is as Good as It Gets. The rapid pace of crude-oil inventory decline is unlikely to be sustained and more likely to support prices. About 3% below its 12-month mean at year-end 2017, such a steep decline in the World Crude Oil & Liquid Fuels End-of-Period Inventory OECD Commercial index is rare. For the past 14 years, extreme declines near this velocity have marked inventory troughs. The end-of-2013 condition was similar, just before an OPEC supply surge that pressured Brent crude prices by 48% in 2014. Estimates for an imminent bottom in inventories are based on projected OPEC and Russian cuts vs. rapid revisions higher in U.S. supply targets. Demand forecasts are unlikely to change much, but risk lower revisions as
Bloomberg Commodity Outlook – March 2018 Edition Bloomberg Commodity Index (BCOM)
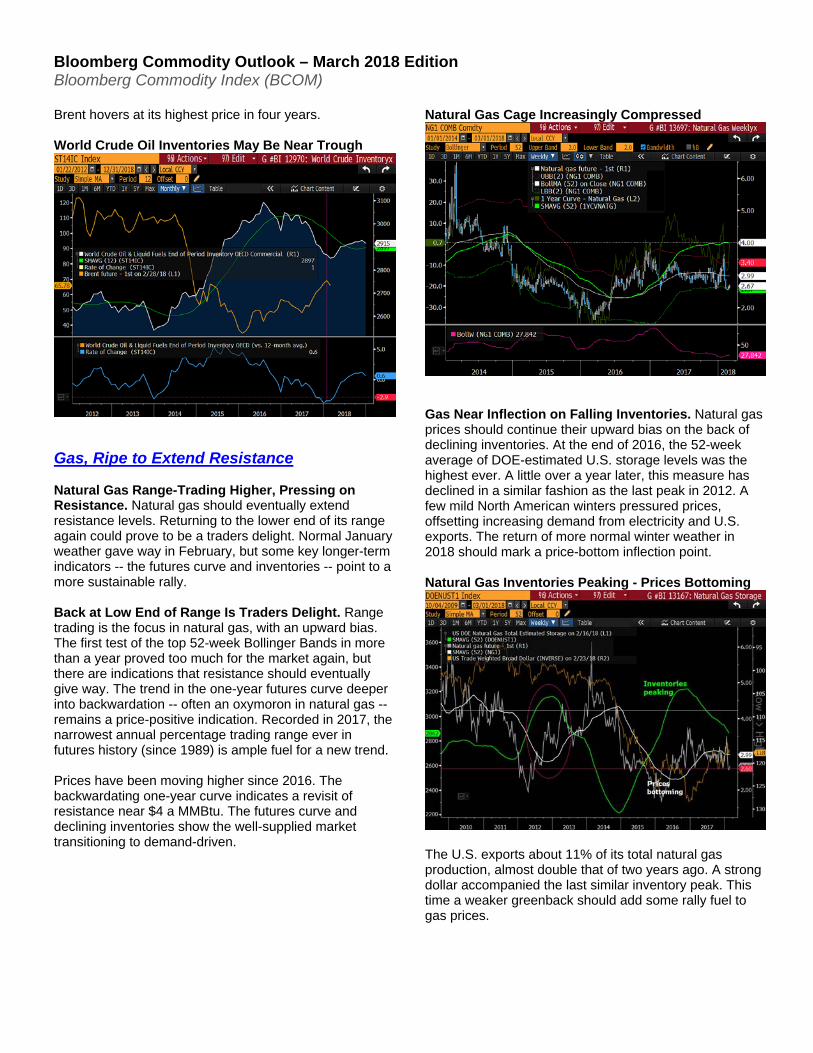
Brent hovers at its highest price in four years. World Crude Oil Inventories May Be Near Trough
Gas, Ripe to Extend Resistance Natural Gas Range-Trading Higher, Pressing on Resistance. Natural gas should eventually extend resistance levels. Returning to the lower end of its range again could prove to be a traders delight. Normal January weather gave way in February, but some key longer-term indicators -- the futures curve and inventories -- point to a more sustainable rally. Back at Low End of Range Is Traders Delight. Range trading is the focus in natural gas, with an upward bias. The first test of the top 52-week Bollinger Bands in more than a year proved too much for the market again, but there are indications that resistance should eventually give way. The trend in the one-year futures curve deeper into backwardation -- often an oxymoron in natural gas -- remains a price-positive indication. Recorded in 2017, the narrowest annual percentage trading range ever in futures history (since 1989) is ample fuel for a new trend. Prices have been moving higher since 2016. The backwardating one-year curve indicates a revisit of resistance near $4 a MMBtu. The futures curve and declining inventories show the well-supplied market transitioning to demand-driven.
Natural Gas Cage Increasingly Compressed
Gas Near Inflection on Falling Inventories. Natural gas prices should continue their upward bias on the back of declining inventories. At the end of 2016, the 52-week average of DOE-estimated U.S. storage levels was the highest ever. A little over a year later, this measure has declined in a similar fashion as the last peak in 2012. A few mild North American winters pressured prices, offsetting increasing demand from electricity and U.S. exports. The return of more normal winter weather in 2018 should mark a price-bottom inflection point. Natural Gas Inventories Peaking - Prices Bottoming
The U.S. exports about 11% of its total natural gas production, almost double that of two years ago. A strong dollar accompanied the last similar inventory peak. This time a weaker greenback should add some rally fuel to gas prices.
Bloomberg Commodity Outlook – March 2018 Edition Bloomberg Commodity Index (BCOM)
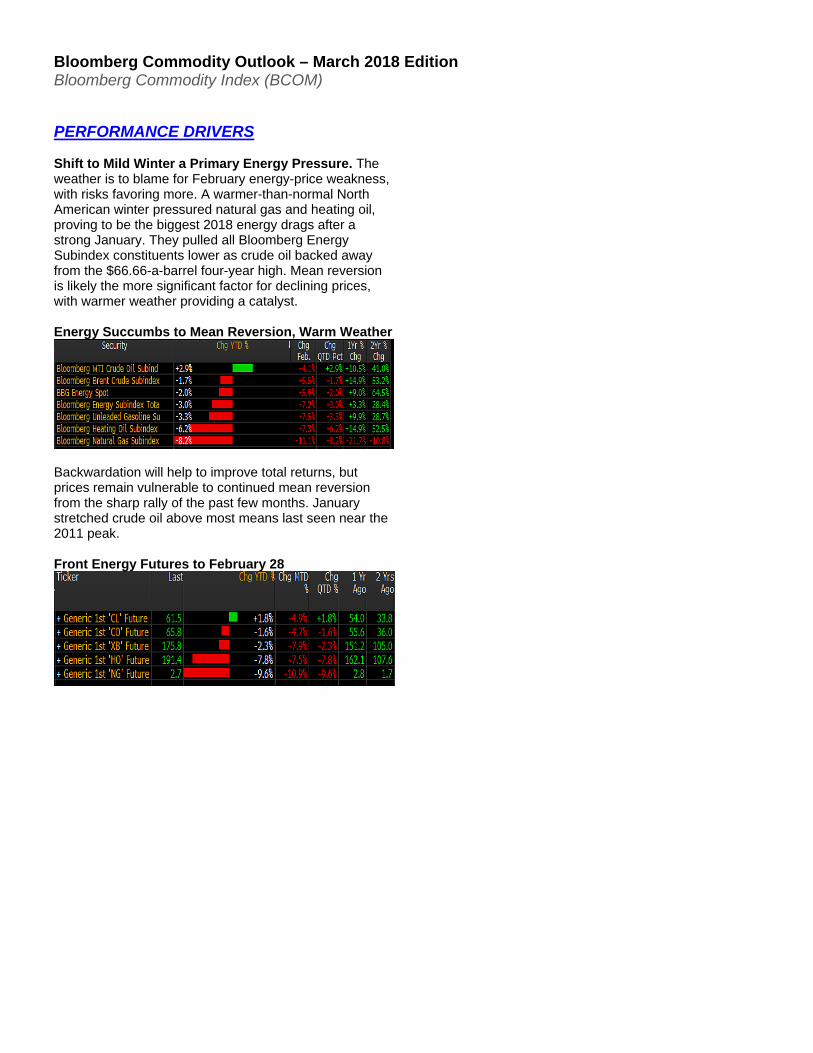
PERFORMANCE DRIVERS Shift to Mild Winter a Primary Energy Pressure. The weather is to blame for February energy-price weakness, with risks favoring more. A warmer-than-normal North American winter pressured natural gas and heating oil, proving to be the biggest 2018 energy drags after a strong January. They pulled all Bloomberg Energy Subindex constituents lower as crude oil backed away from the $66.66-a-barrel four-year high. Mean reversion is likely the more significant factor for declining prices, with warmer weather providing a catalyst. Energy Succumbs to Mean Reversion, Warm Weather
Backwardation will help to improve total returns, but prices remain vulnerable to continued mean reversion from the sharp rally of the past few months. January stretched crude oil above most means last seen near the 2011 peak. Front Energy Futures to February 28
Bloomberg Commodity Outlook – March 2018 Edition Bloomberg Commodity Index (BCOM)
Metals All (Index weight: 35% of BCOM) Performance: Feb. -2.4%, YTD -1.5%
Industrial (Index weight: 19.0% of BCOM. Performance: Feb. -2.2%, YTD -2.0 Spot -1.9%) Precious (Index weight: 16.1% of BCOM. Performance: Feb. -2.6%, YTD -.7, Spot -0.5%)
The Resting Bull From Copper to Gold, Metals Gaining Upper Hand vs. Stock Market. Steady metal prices to start 2018 should translate to further gains by year-end. They needed to pause after gaining 21% last year, as measured by the Bloomberg All Metals Total Return. With a strong history of backing up into Federal Reserve rate hikes and recovering thereafter, the inevitability of a 25-bp hike in March is a primary suppressant. Yet it will be past tense by the end of the month, and favorable fundamental and technical drivers should prevail. Neck-and-neck with the stock market in this rate-hike cycle, metals have a firmer foundation than equities. Some back-and-fill in the primary industrial metals -- copper and aluminum -- should eventually resume the bull trend, following nickel and zinc. Gold is about as trend-ready as it gets, with limited directional options other than higher.
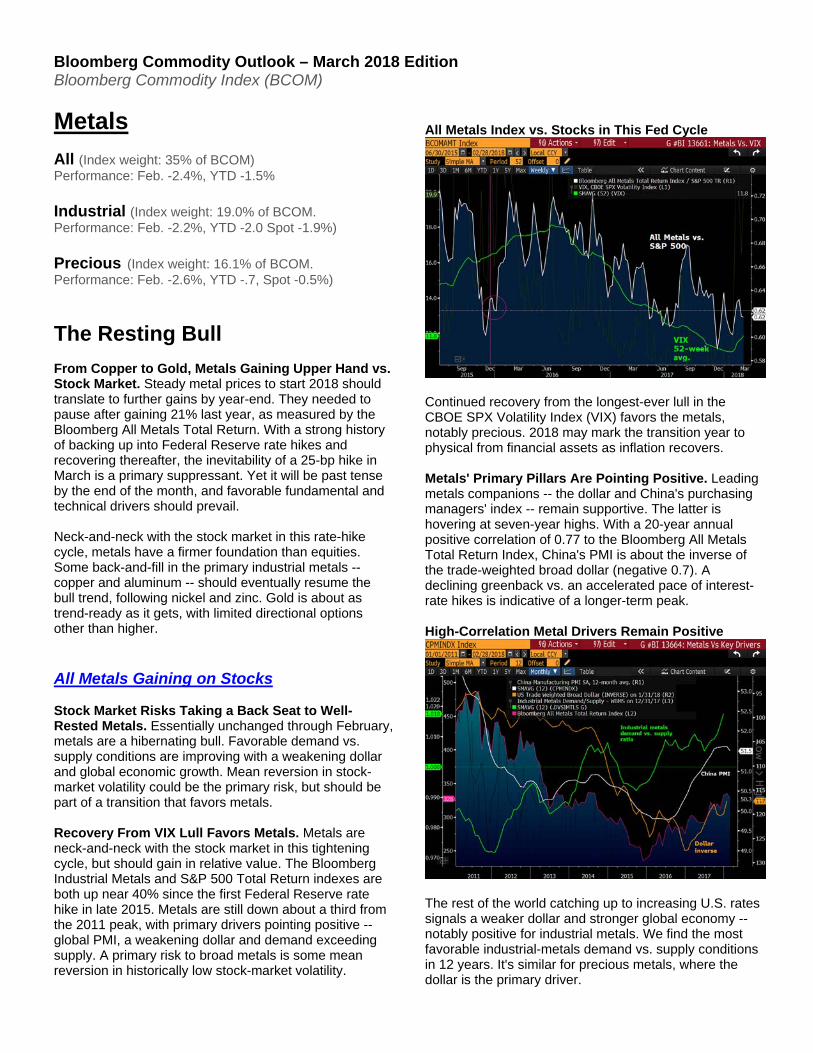
All Metals Gaining on Stocks Stock Market Risks Taking a Back Seat to Well-Rested Metals. Essentially unchanged through February, metals are a hibernating bull. Favorable demand vs. supply conditions are improving with a weakening dollar and global economic growth. Mean reversion in stock-market volatility could be the primary risk, but should be part of a transition that favors metals. Recovery From VIX Lull Favors Metals. Metals are neck-and-neck with the stock market in this tightening cycle, but should gain in relative value. The Bloomberg Industrial Metals and S&P 500 Total Return indexes are both up near 40% since the first Federal Reserve rate hike in late 2015. Metals are still down about a third from the 2011 peak, with primary drivers pointing positive -- global PMI, a weakening dollar and demand exceeding supply. A primary risk to broad metals is some mean reversion in historically low stock-market volatility.
All Metals Index vs. Stocks in This Fed Cycle
Continued recovery from the longest-ever lull in the CBOE SPX Volatility Index (VIX) favors the metals, notably precious. 2018 may mark the transition year to physical from financial assets as inflation recovers. Metals' Primary Pillars Are Pointing Positive. Leading metals companions -- the dollar and China's purchasing managers' index -- remain supportive. The latter is hovering at seven-year highs. With a 20-year annual positive correlation of 0.77 to the Bloomberg All Metals Total Return Index, China's PMI is about the inverse of the trade-weighted broad dollar (negative 0.7). A declining greenback vs. an accelerated pace of interest-rate hikes is indicative of a longer-term peak. High-Correlation Metal Drivers Remain Positive
The rest of the world catching up to increasing U.S. rates signals a weaker dollar and stronger global economy -- notably positive for industrial metals. We find the most favorable industrial-metals demand vs. supply conditions in 12 years. It's similar for precious metals, where the dollar is the primary driver.

Bloomberg Commodity Outlook – March 2018 Edition Bloomberg Commodity Index (BCOM)
Metals May Need March Rate Hike to Recover. If history is a guide, metals should remain under pressure until the next Fed rate hike, then recover. The end of the month is likely to outperform the start, as the market anticipates another 25-bp increase at the March 21 open-market committee meeting. Rising together on the back of increasing inflation, economic growth and bond yields, metal prices and the federal funds rate are good companions. What it takes to stop the rate-hike pace may be the greater risk. A sharp increase in stock-market volatility could be a primary driver. Metals On Pace With Increasing Interest Rates
The Bloomberg All Metals Total Return Index reached bottom three business days before the last hike on Dec. 13. It subsequently rallied 12% to the 2018 peak in January. Continued consolidation is likely until after the March FOMC meeting. Resting Industrials Copper, Aluminum, Nickel and Zinc: What Might Reverse the Rally? The quandary in industrial metals is what it'll take to reverse the bull trend. A sustained shift to a stronger dollar and reversal of favorable demand vs. supply are prime candidates, but unlikely. Down about 1% in 2018, industrial metals appear to be rotating for the next leg of the rally. Shades of 2004 for Industrial Metals Foundation. Industrial metals' situation is similar to 2004, just before a substantial rally and with technical and fundamental indicators almost a mirror image. Our analysis of World Bureau of Metal Statistics (WBMS) demand vs. supply data shows that the ratio is its highest in 12 years. The trade-weighted broad dollar's peak last year almost matched the high of 15 years ago. Similar to the end of 2003, the Bloomberg Industrial Metals Spot Subindex in
2H17 broke above its 100-month moving average, followed by the 12-month mean this February. Metals Indicators Lining Up Positive
Consolidating at the 2H12 price peak, 2011's highs (more than 20% above the end-of-February levels) appear in play. What it might take to reverse these bullish trends is the greater quandary. The 12-month average, about 10% lower, is initial support. Nickel Heats Up to Revisit $20,000 Resistance. Favorable demand vs. supply conditions and the weaker dollar signal the potential for a nickel rally about 40% above February prices. Our analysis of WBMS data indicates the most favorable conditions in about two decades. The recent 1.06 ratio surpassed the 2017 peak, matching levels last seen in 1996. A revisit of resistance from 2014-15 highs near $20,000 a ton should be in play. Trading about $14,000 at the end of February, nickel is a bit stretched above its annualized mean, but demand vs. supply conditions indicate that it should be. Nickel Just Catching Up to Demand vs. Supply
On a 25-year annual basis, nickel's 0.61 negative correlation vs. the trade-weighted broad dollar is about

Bloomberg Commodity Outlook – March 2018 Edition Bloomberg Commodity Index (BCOM)
the same positive vs. copper. Strong demand for stainless, anticipation of greater consumption in electric vehicles, declining stockpiles and supply hiccups are supportive. Precious Waiting on the Fed Deja Vu All Over Again as Gold Recovery Awaits Another Rate Hike. Increasingly coiled gold is prepping for the next Fed rate hike with primary drivers pointing positive. Resistance at the upper end of its tighter range is poised to give way on primary drivers -- inflation, a weak dollar and increasing volatility. What it might take for gold to sustain lower is the greater quandary. Gold Primed for Upside, Breakout Spark. The primary positive drivers ripen gold for a breakout higher since the metal bottomed with the December 2015 start of the rate-hike cycle. The dollar then peaked at the end of 2016, and the VIX appears to have scraped bottom. At the same price vs. June 2013, gold's 52-week Bollinger Bands have compressed to the narrowest range in 13 years, giving it fuel for an extended increase. September 2005 was the last time the market was as tightly coiled. Gold Rally in Early Days, Companions Favorable
That consolidation period preceded the previous VIX trough (2007), culminating in a 340% gold rally to the historical peak of $1,900 an ounce in 2011. The VIX's (started in 1990) historical correlation to gold isn't very strong, but there is no precedent for recovering from the lowest-for-longest ever. Continued Role Reversal Favors Gold vs. Bitcoin. Gold is about as ripe to break above its 52-week mean as Bitcoin is to rejoin its own. Fed interest-rate hikes have been consistent catalysts for gold bottoms and Bitcoin peaks. The most recent in December has resulted in the most extreme post-hike decline for Bitcoin, 59% to the
Feb. 5 low. It likely marked a longer-term peak with the launch of futures and frenzied activity. On the other hand, gold has been locked on its 52-week mean for the longest run and narrowest range in over a decade. Early Mean-Reversion Bitcoin Days vs. Coiled Gold
Tightening, the opposite of quantitative easing, which is a mantra of cryptocurrencies, is a legitimate reason for their decline. Inflation is a primary reason for tightening and a valid cause for gold to rally. The breakneck crypto supply should continue to favor gold. Declining Dollar Tops Gold Companions. Heavily weighted to the Chinese yuan (22% in 2018), the Fed-calculated trade-weighted broad dollar has the equivalent negative annual correlation to gold as silver does positive, about 0.70 since 1991. Soybeans are just behind silver in terms of a positive relationship. The gold-to-soybean connection shares the dollar driver. More than half of U.S. soybean production is exported, mostly to China, supporting its connection to gold. Top Gold Companions: Dollar, Silver and Soybeans
Minimizing the significance of real vs. actual bond yields, gold's connection to the former isn't as negative. Forward-looking yields vs. backward-measuring CPI are the link,

Bloomberg Commodity Outlook – March 2018 Edition Bloomberg Commodity Index (BCOM)
with inflation a positive correlation. Inflation matters most and is trending higher. Gold Follows Copper to 2011-16 Midpoint. A weakening dollar, combined with increasing inflation and volatility, favors gold. The precious metal's industrial rival, copper, has returned to the halfway point of the 2011-16 bear market, and gold should do the same. That level is near $1,475 an ounce. The weakening dollar and increasing consumer prices are usually sufficient to sustain gold's upward trajectory. The recovery in stock-market volatility that's underway is another source of support. Trends Indicate Gold Revisiting $1,475 Resistance
Gold has rallied despite rising stocks, declining volatility and Fed tightening. The substantial price discount from its 2011 peak and weakening dollar have been supportive. Rate hikes are coincident with increasing inflation -- a primary gold companion. Add some volatility and gold should shine, notably vs. other assets. Gold vs. Silver Indicates VIX Bottom. If the VIX has bottomed, gold is favored vs. most assets, notably copper and silver. The potential for mean reversion in the world's benchmark for stock-market volatility, likely recovering from its lowest-for-longest level in almost three decades, should be a primary determinant of gold's performance relative to most other assets. Still below the previous trough from 2007, a bottom in the VIX 52-week mean would validate similar from June for the gold-to-silver ratio.
Gold vs. Copper Shows the Opposite
Gold has more potential to gain vs. copper on a bottoming VIX. Since 1990, the annual VIX correlation is 0.62 for the gold-to-copper ratio vs. 0.50 for gold-to-silver. With copper halting at the halfway mark of the 2011-16 bear market, gold is poised to take the rally baton. A bottoming VIX would be a primary catalyst. Gold Favored vs. Stocks With Increasing CPI. Trends in gold and stocks relative to CPI harken back to 2002 -- the start of a favorable period for the precious metal. Considering the steadily increasing CPI, gold appears low vs. the elevated S&P 500. The gold-to-stocks disparity isn't as extreme relative to 2000-02, but in a declining-dollar environment, gold is favored. If the buck has peaked similarly to 16 years ago, gold's recovery should be in its early days. Since 1990, gold tops the list of negatively correlated markets to the dollar at 0.68. Gold Looking Low Relative to Broad CPI Trend
The S&P 500's annual correlation to the trade-weighted broad dollar is only minus 0.19. A negative relationship over 3x greater for gold also favors the metal in a weak-dollar environment.
Bloomberg Commodity Outlook – March 2018 Edition Bloomberg Commodity Index (BCOM)
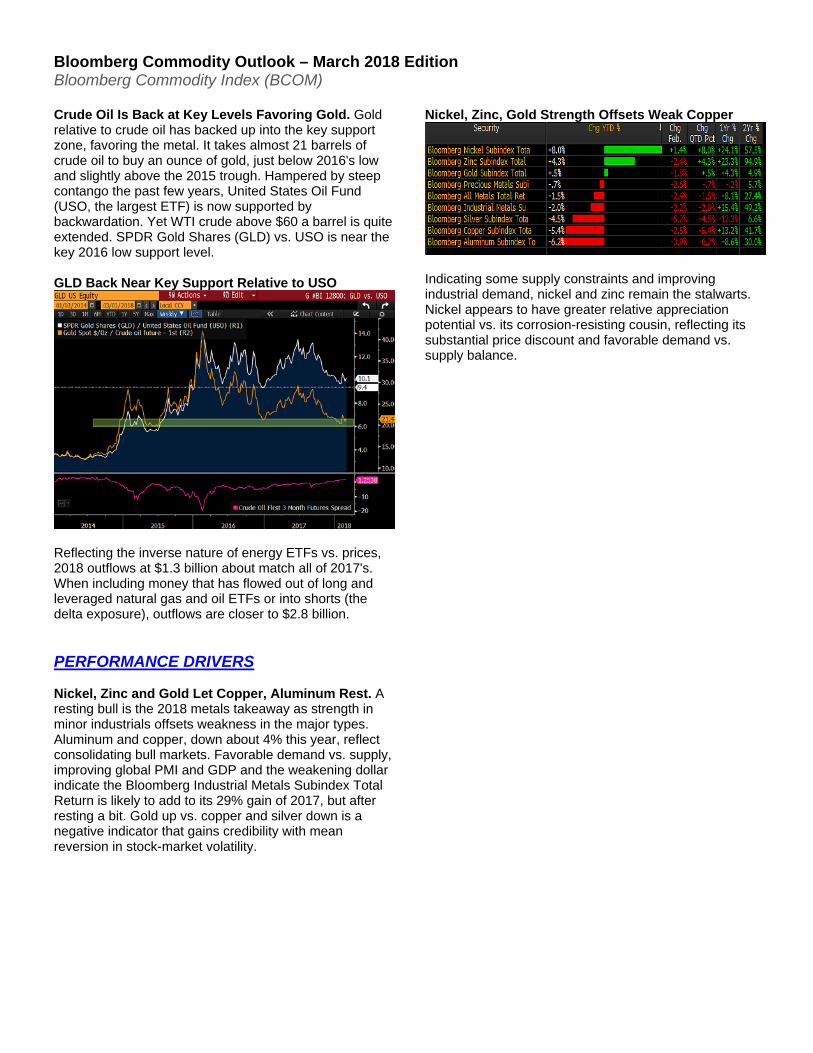
Crude Oil Is Back at Key Levels Favoring Gold. Gold relative to crude oil has backed up into the key support zone, favoring the metal. It takes almost 21 barrels of crude oil to buy an ounce of gold, just below 2016's low and slightly above the 2015 trough. Hampered by steep contango the past few years, United States Oil Fund (USO, the largest ETF) is now supported by backwardation. Yet WTI crude above $60 a barrel is quite extended. SPDR Gold Shares (GLD) vs. USO is near the key 2016 low support level. GLD Back Near Key Support Relative to USO
Reflecting the inverse nature of energy ETFs vs. prices, 2018 outflows at $1.3 billion about match all of 2017's. When including money that has flowed out of long and leveraged natural gas and oil ETFs or into shorts (the delta exposure), outflows are closer to $2.8 billion. PERFORMANCE DRIVERS Nickel, Zinc and Gold Let Copper, Aluminum Rest. A resting bull is the 2018 metals takeaway as strength in minor industrials offsets weakness in the major types. Aluminum and copper, down about 4% this year, reflect consolidating bull markets. Favorable demand vs. supply, improving global PMI and GDP and the weakening dollar indicate the Bloomberg Industrial Metals Subindex Total Return is likely to add to its 29% gain of 2017, but after resting a bit. Gold up vs. copper and silver down is a negative indicator that gains credibility with mean reversion in stock-market volatility.
Nickel, Zinc, Gold Strength Offsets Weak Copper
Indicating some supply constraints and improving industrial demand, nickel and zinc remain the stalwarts. Nickel appears to have greater relative appreciation potential vs. its corrosion-resisting cousin, reflecting its substantial price discount and favorable demand vs. supply balance.
Bloomberg Commodity Outlook – March 2018 Edition Bloomberg Commodity Index (BCOM)
Agriculture (Index weight: 30% of BCOM) Performance: Feb. +4.7%, YTD +6.1%, Spot +7.2%) Grains (Index Weight: 24% of BCOM) Performance: Feb. +5.1%, YTD +9.7%, Spot +11.5%) Softs (Weight: 6% of BCOM) Performance: February +1.5%, YTD -5.7, Spot -5.6%)
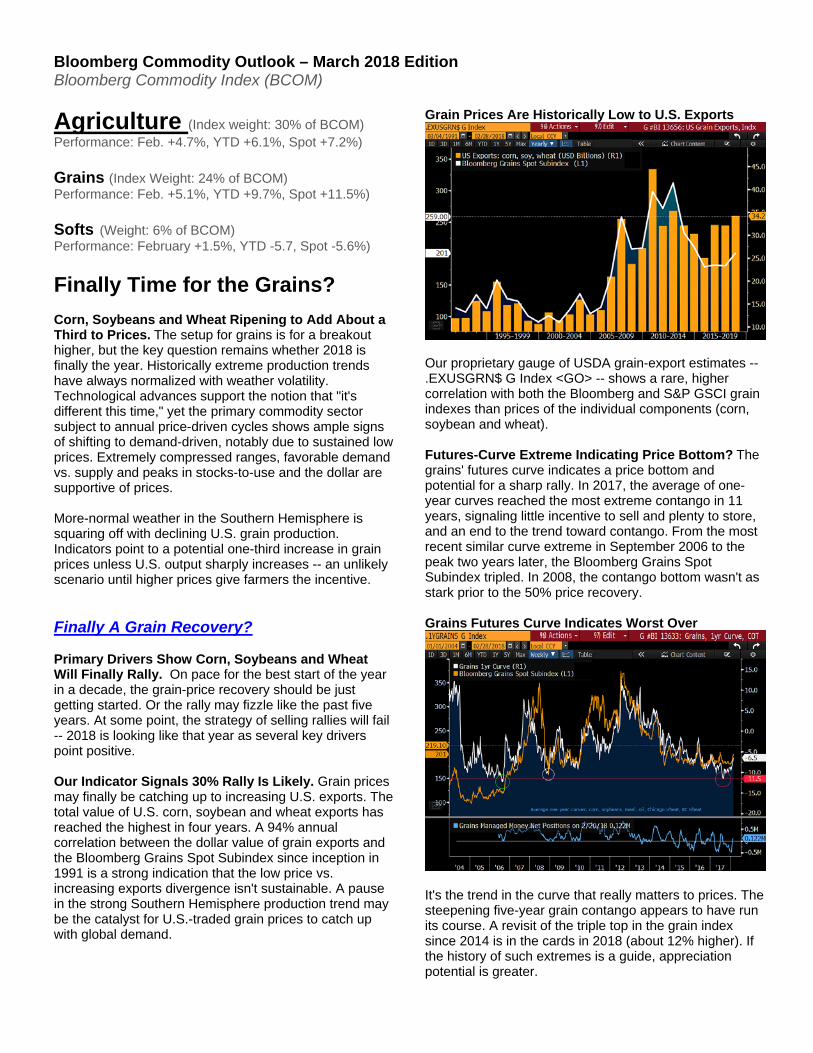
Finally Time for the Grains? Corn, Soybeans and Wheat Ripening to Add About a Third to Prices. The setup for grains is for a breakout higher, but the key question remains whether 2018 is finally the year. Historically extreme production trends have always normalized with weather volatility. Technological advances support the notion that "it's different this time," yet the primary commodity sector subject to annual price-driven cycles shows ample signs of shifting to demand-driven, notably due to sustained low prices. Extremely compressed ranges, favorable demand vs. supply and peaks in stocks-to-use and the dollar are supportive of prices. More-normal weather in the Southern Hemisphere is squaring off with declining U.S. grain production. Indicators point to a potential one-third increase in grain prices unless U.S. output sharply increases -- an unlikely scenario until higher prices give farmers the incentive. Finally A Grain Recovery? Primary Drivers Show Corn, Soybeans and Wheat Will Finally Rally. On pace for the best start of the year in a decade, the grain-price recovery should be just getting started. Or the rally may fizzle like the past five years. At some point, the strategy of selling rallies will fail -- 2018 is looking like that year as several key drivers point positive. Our Indicator Signals 30% Rally Is Likely. Grain prices may finally be catching up to increasing U.S. exports. The total value of U.S. corn, soybean and wheat exports has reached the highest in four years. A 94% annual correlation between the dollar value of grain exports and the Bloomberg Grains Spot Subindex since inception in 1991 is a strong indication that the low price vs. increasing exports divergence isn't sustainable. A pause in the strong Southern Hemisphere production trend may be the catalyst for U.S.-traded grain prices to catch up with global demand.
Grain Prices Are Historically Low to U.S. Exports
Our proprietary gauge of USDA grain-export estimates -- .EXUSGRN$ G Index <GO> -- shows a rare, higher correlation with both the Bloomberg and S&P GSCI grain indexes than prices of the individual components (corn, soybean and wheat). Futures-Curve Extreme Indicating Price Bottom? The grains' futures curve indicates a price bottom and potential for a sharp rally. In 2017, the average of one-year curves reached the most extreme contango in 11 years, signaling little incentive to sell and plenty to store, and an end to the trend toward contango. From the most recent similar curve extreme in September 2006 to the peak two years later, the Bloomberg Grains Spot Subindex tripled. In 2008, the contango bottom wasn't as stark prior to the 50% price recovery. Grains Futures Curve Indicates Worst Over
It's the trend in the curve that really matters to prices. The steepening five-year grain contango appears to have run its course. A revisit of the triple top in the grain index since 2014 is in the cards in 2018 (about 12% higher). If the history of such extremes is a guide, appreciation potential is greater.
Bloomberg Commodity Outlook – March 2018 Edition Bloomberg Commodity Index (BCOM)
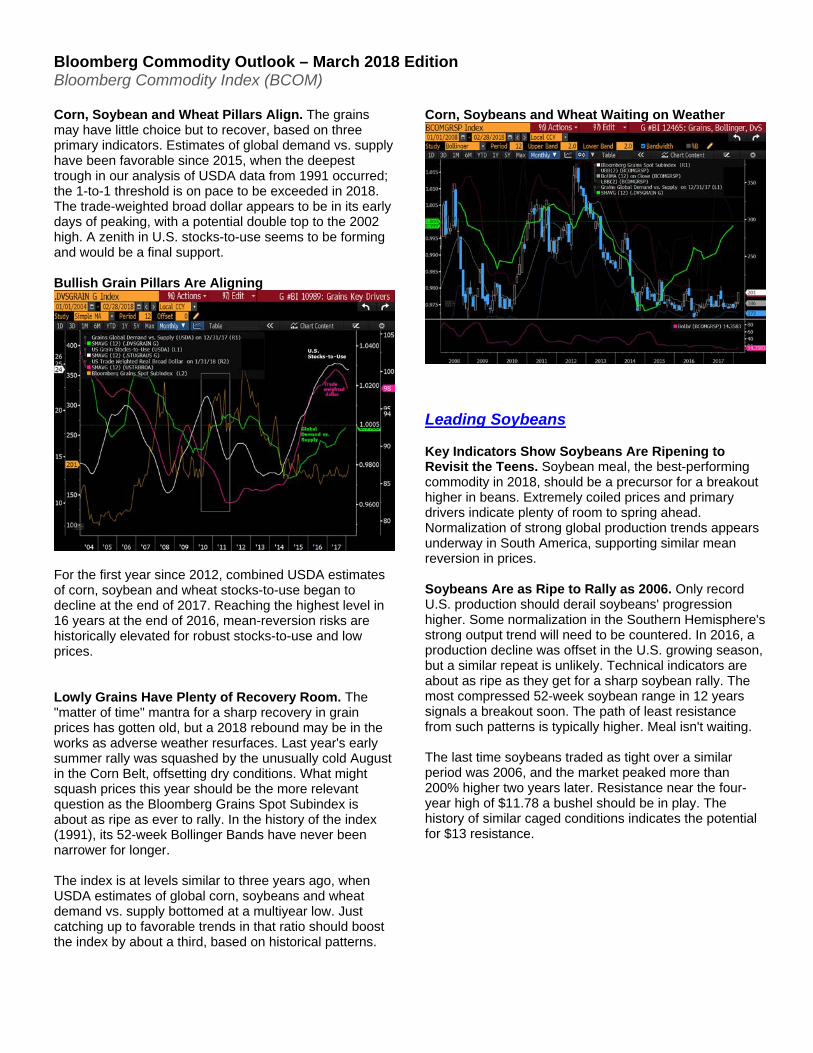
Corn, Soybean and Wheat Pillars Align. The grains may have little choice but to recover, based on three primary indicators. Estimates of global demand vs. supply have been favorable since 2015, when the deepest trough in our analysis of USDA data from 1991 occurred; the 1-to-1 threshold is on pace to be exceeded in 2018. The trade-weighted broad dollar appears to be in its early days of peaking, with a potential double top to the 2002 high. A zenith in U.S. stocks-to-use seems to be forming and would be a final support. Bullish Grain Pillars Are Aligning
For the first year since 2012, combined USDA estimates of corn, soybean and wheat stocks-to-use began to decline at the end of 2017. Reaching the highest level in 16 years at the end of 2016, mean-reversion risks are historically elevated for robust stocks-to-use and low prices. Lowly Grains Have Plenty of Recovery Room. The "matter of time" mantra for a sharp recovery in grain prices has gotten old, but a 2018 rebound may be in the works as adverse weather resurfaces. Last year's early summer rally was squashed by the unusually cold August in the Corn Belt, offsetting dry conditions. What might squash prices this year should be the more relevant question as the Bloomberg Grains Spot Subindex is about as ripe as ever to rally. In the history of the index (1991), its 52-week Bollinger Bands have never been narrower for longer. The index is at levels similar to three years ago, when USDA estimates of global corn, soybeans and wheat demand vs. supply bottomed at a multiyear low. Just catching up to favorable trends in that ratio should boost the index by about a third, based on historical patterns.
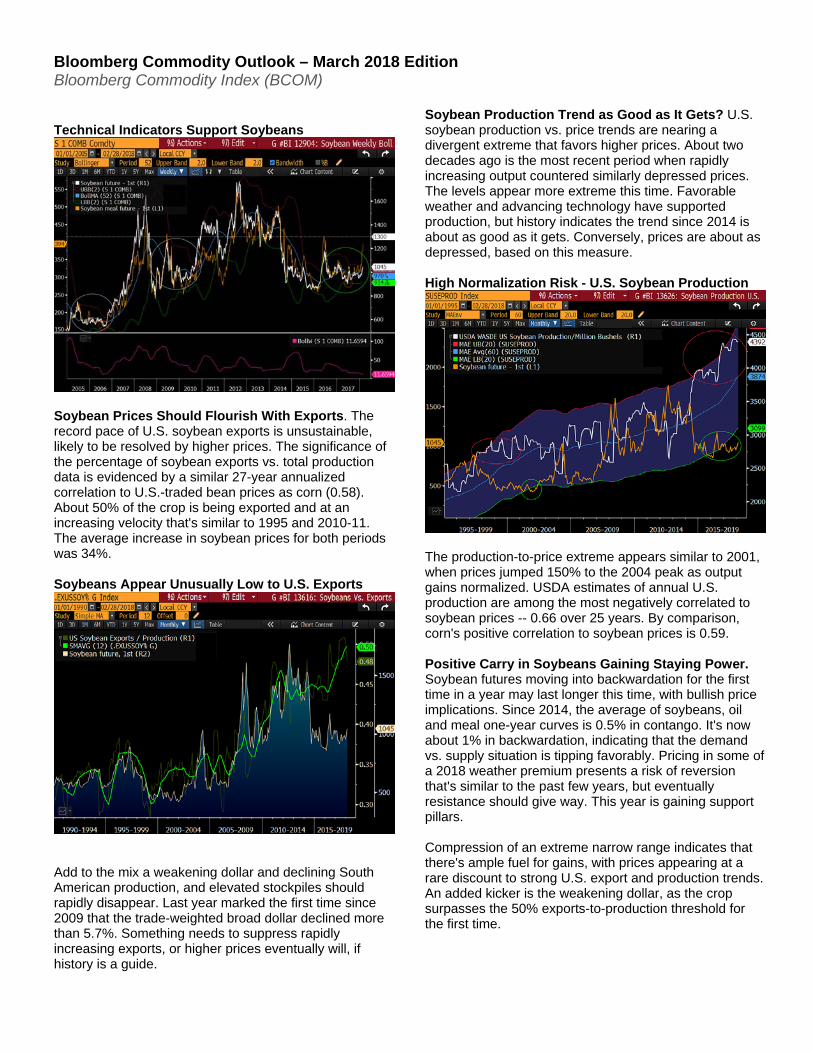
Corn, Soybeans and Wheat Waiting on Weather
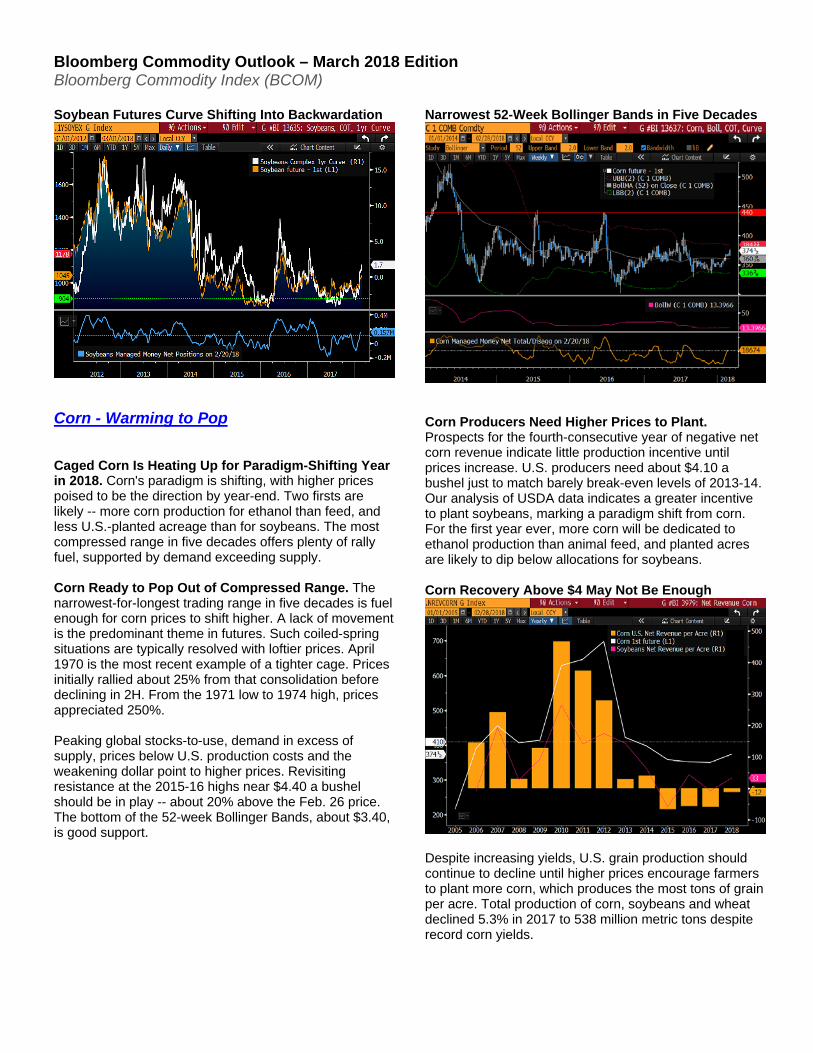
Leading Soybeans Key Indicators Show Soybeans Are Ripening to Revisit the Teens. Soybean meal, the best-performing commodity in 2018, should be a precursor for a breakout higher in beans. Extremely coiled prices and primary drivers indicate plenty of room to spring ahead. Normalization of strong global production trends appears underway in South America, supporting similar mean reversion in prices. Soybeans Are as Ripe to Rally as 2006. Only record U.S. production should derail soybeans' progression higher. Some normalization in the Southern Hemisphere's strong output trend will need to be countered. In 2016, a production decline was offset in the U.S. growing season, but a similar repeat is unlikely. Technical indicators are about as ripe as they get for a sharp soybean rally. The most compressed 52-week soybean range in 12 years signals a breakout soon. The path of least resistance from such patterns is typically higher. Meal isn't waiting. The last time soybeans traded as tight over a similar period was 2006, and the market peaked more than 200% higher two years later. Resistance near the four-year high of $11.78 a bushel should be in play. The history of similar caged conditions indicates the potential for $13 resistance.
Bloomberg Commodity Outlook – March 2018 Edition Bloomberg Commodity Index (BCOM)
Technical Indicators Support Soybeans
Soybean Prices Should Flourish With Exports. The record pace of U.S. soybean exports is unsustainable, likely to be resolved by higher prices. The significance of the percentage of soybean exports vs. total production data is evidenced by a similar 27-year annualized correlation to U.S.-traded bean prices as corn (0.58). About 50% of the crop is being exported and at an increasing velocity that's similar to 1995 and 2010-11. The average increase in soybean prices for both periods was 34%. Soybeans Appear Unusually Low to U.S. Exports
Add to the mix a weakening dollar and declining South American production, and elevated stockpiles should rapidly disappear. Last year marked the first time since 2009 that the trade-weighted broad dollar declined more than 5.7%. Something needs to suppress rapidly increasing exports, or higher prices eventually will, if history is a guide.
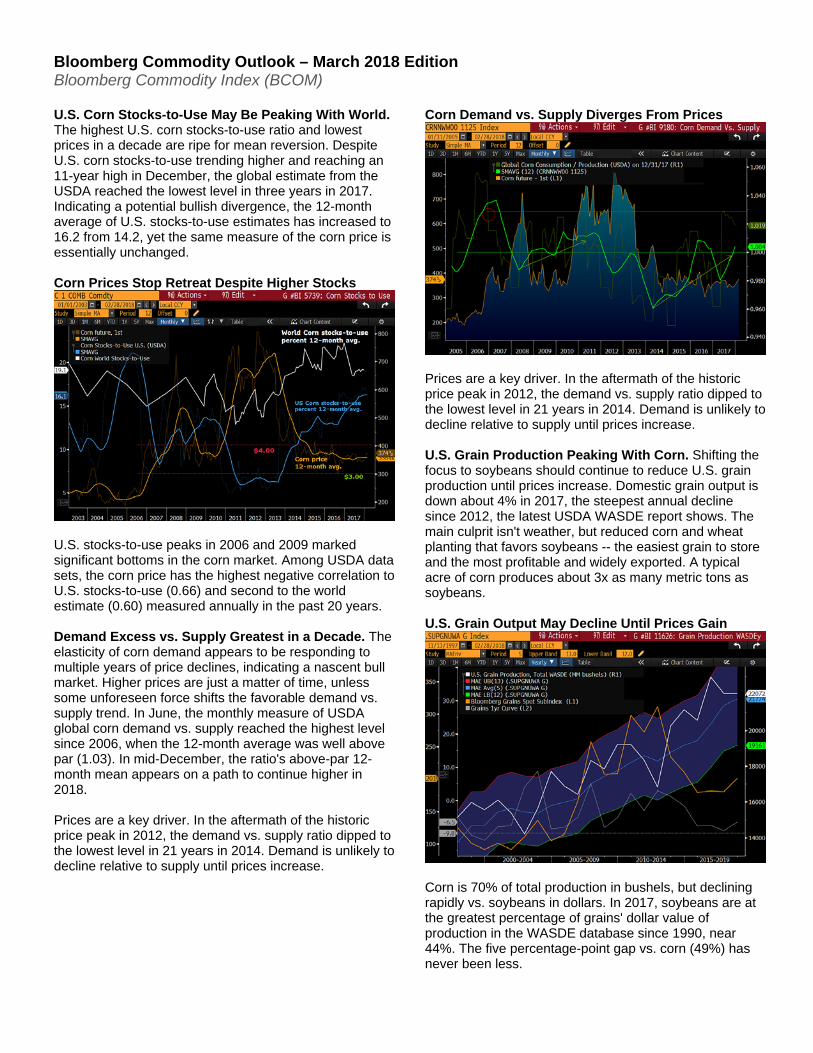
Soybean Production Trend as Good as It Gets? U.S. soybean production vs. price trends are nearing a divergent extreme that favors higher prices. About two decades ago is the most recent period when rapidly increasing output countered similarly depressed prices. The levels appear more extreme this time. Favorable weather and advancing technology have supported production, but history indicates the trend since 2014 is about as good as it gets. Conversely, prices are about as depressed, based on this measure. High Normalization Risk - U.S. Soybean Production
The production-to-price extreme appears similar to 2001, when prices jumped 150% to the 2004 peak as output gains normalized. USDA estimates of annual U.S. production are among the most negatively correlated to soybean prices -- 0.66 over 25 years. By comparison, corn's positive correlation to soybean prices is 0.59. Positive Carry in Soybeans Gaining Staying Power. Soybean futures moving into backwardation for the first time in a year may last longer this time, with bullish price implications. Since 2014, the average of soybeans, oil and meal one-year curves is 0.5% in contango. It's now about 1% in backwardation, indicating that the demand vs. supply situation is tipping favorably. Pricing in some of a 2018 weather premium presents a risk of reversion that's similar to the past few years, but eventually resistance should give way. This year is gaining support pillars. Compression of an extreme narrow range indicates that there's ample fuel for gains, with prices appearing at a rare discount to strong U.S. export and production trends. An added kicker is the weakening dollar, as the crop surpasses the 50% exports-to-production threshold for the first time.
Bloomberg Commodity Outlook – March 2018 Edition Bloomberg Commodity Index (BCOM)
Soybean Futures Curve Shifting Into Backwardation
Corn - Warming to Pop Caged Corn Is Heating Up for Paradigm-Shifting Year in 2018. Corn's paradigm is shifting, with higher prices poised to be the direction by year-end. Two firsts are likely -- more corn production for ethanol than feed, and less U.S.-planted acreage than for soybeans. The most compressed range in five decades offers plenty of rally fuel, supported by demand exceeding supply. Corn Ready to Pop Out of Compressed Range. The narrowest-for-longest trading range in five decades is fuel enough for corn prices to shift higher. A lack of movement is the predominant theme in futures. Such coiled-spring situations are typically resolved with loftier prices. April 1970 is the most recent example of a tighter cage. Prices initially rallied about 25% from that consolidation before declining in 2H. From the 1971 low to 1974 high, prices appreciated 250%. Peaking global stocks-to-use, demand in excess of supply, prices below U.S. production costs and the weakening dollar point to higher prices. Revisiting resistance at the 2015-16 highs near $4.40 a bushel should be in play -- about 20% above the Feb. 26 price. The bottom of the 52-week Bollinger Bands, about $3.40, is good support.
Narrowest 52-Week Bollinger Bands in Five Decades
Corn Producers Need Higher Prices to Plant. Prospects for the fourth-consecutive year of negative net corn revenue indicate little production incentive until prices increase. U.S. producers need about $4.10 a bushel just to match barely break-even levels of 2013-14. Our analysis of USDA data indicates a greater incentive to plant soybeans, marking a paradigm shift from corn. For the first year ever, more corn will be dedicated to ethanol production than animal feed, and planted acres are likely to dip below allocations for soybeans. Corn Recovery Above $4 May Not Be Enough
Despite increasing yields, U.S. grain production should continue to decline until higher prices encourage farmers to plant more corn, which produces the most tons of grain per acre. Total production of corn, soybeans and wheat declined 5.3% in 2017 to 538 million metric tons despite record corn yields.
Bloomberg Commodity Outlook – March 2018 Edition Bloomberg Commodity Index (BCOM)
U.S. Corn Stocks-to-Use May Be Peaking With World. The highest U.S. corn stocks-to-use ratio and lowest prices in a decade are ripe for mean reversion. Despite U.S. corn stocks-to-use trending higher and reaching an 11-year high in December, the global estimate from the USDA reached the lowest level in three years in 2017. Indicating a potential bullish divergence, the 12-month average of U.S. stocks-to-use estimates has increased to 16.2 from 14.2, yet the same measure of the corn price is essentially unchanged. Corn Prices Stop Retreat Despite Higher Stocks
U.S. stocks-to-use peaks in 2006 and 2009 marked significant bottoms in the corn market. Among USDA data sets, the corn price has the highest negative correlation to U.S. stocks-to-use (0.66) and second to the world estimate (0.60) measured annually in the past 20 years. Demand Excess vs. Supply Greatest in a Decade. The elasticity of corn demand appears to be responding to multiple years of price declines, indicating a nascent bull market. Higher prices are just a matter of time, unless some unforeseen force shifts the favorable demand vs. supply trend. In June, the monthly measure of USDA global corn demand vs. supply reached the highest level since 2006, when the 12-month average was well above par (1.03). In mid-December, the ratio's above-par 12-month mean appears on a path to continue higher in 2018. Prices are a key driver. In the aftermath of the historic price peak in 2012, the demand vs. supply ratio dipped to the lowest level in 21 years in 2014. Demand is unlikely to decline relative to supply until prices increase.
Corn Demand vs. Supply Diverges From Prices
Prices are a key driver. In the aftermath of the historic price peak in 2012, the demand vs. supply ratio dipped to the lowest level in 21 years in 2014. Demand is unlikely to decline relative to supply until prices increase. U.S. Grain Production Peaking With Corn. Shifting the focus to soybeans should continue to reduce U.S. grain production until prices increase. Domestic grain output is down about 4% in 2017, the steepest annual decline since 2012, the latest USDA WASDE report shows. The main culprit isn't weather, but reduced corn and wheat planting that favors soybeans -- the easiest grain to store and the most profitable and widely exported. A typical acre of corn produces about 3x as many metric tons as soybeans. U.S. Grain Output May Decline Until Prices Gain
Corn is 70% of total production in bushels, but declining rapidly vs. soybeans in dollars. In 2017, soybeans are at the greatest percentage of grains' dollar value of production in the WASDE database since 1990, near 44%. The five percentage-point gap vs. corn (49%) has never been less.
Bloomberg Commodity Outlook – March 2018 Edition Bloomberg Commodity Index (BCOM)
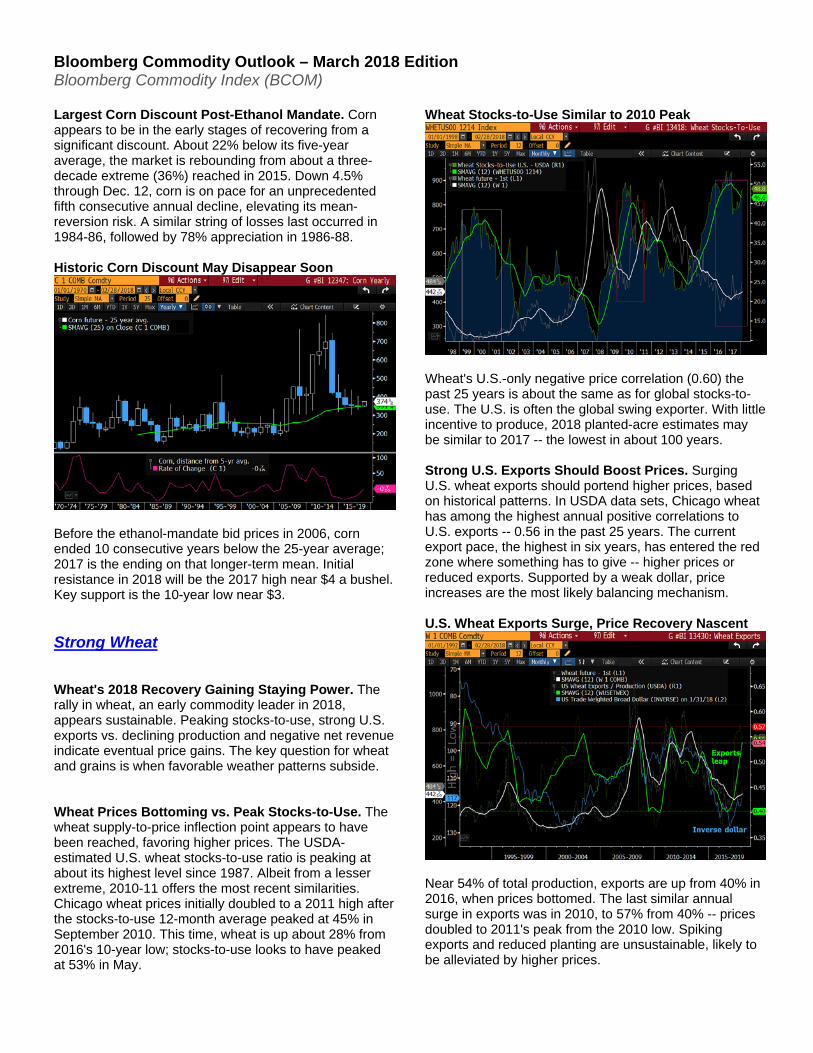
Largest Corn Discount Post-Ethanol Mandate. Corn appears to be in the early stages of recovering from a significant discount. About 22% below its five-year average, the market is rebounding from about a three-decade extreme (36%) reached in 2015. Down 4.5% through Dec. 12, corn is on pace for an unprecedented fifth consecutive annual decline, elevating its mean-reversion risk. A similar string of losses last occurred in 1984-86, followed by 78% appreciation in 1986-88. Historic Corn Discount May Disappear Soon
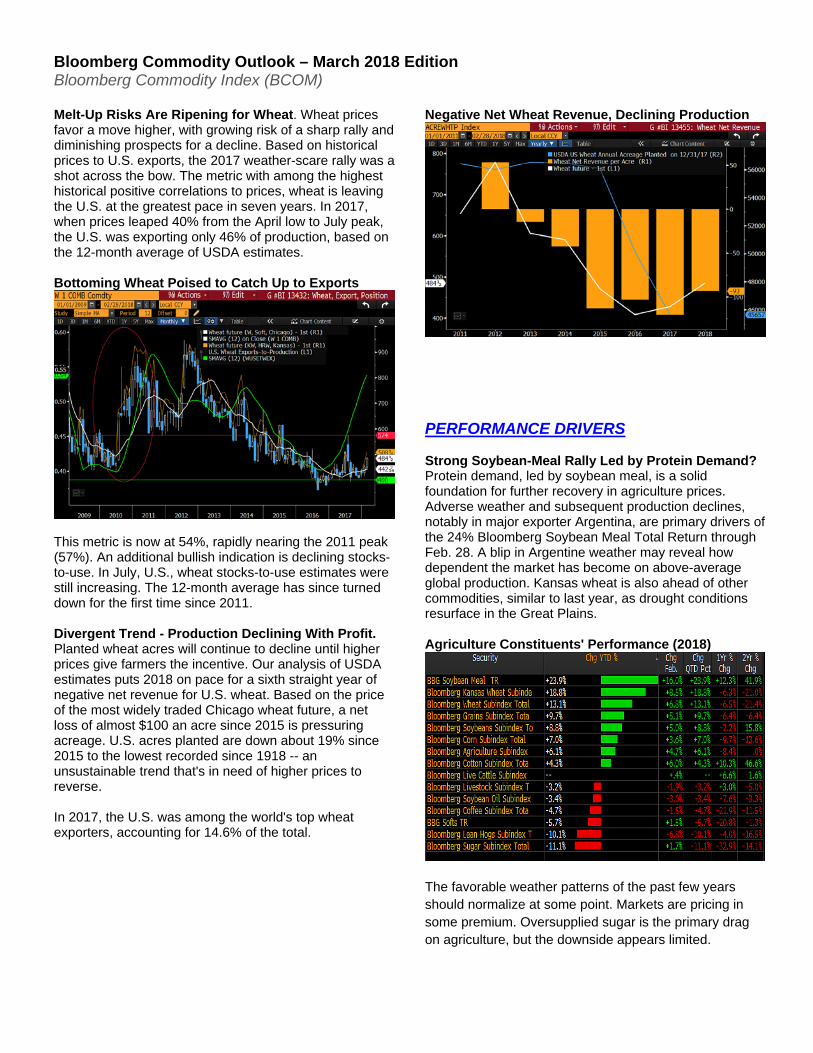
Before the ethanol-mandate bid prices in 2006, corn ended 10 consecutive years below the 25-year average; 2017 is the ending on that longer-term mean. Initial resistance in 2018 will be the 2017 high near $4 a bushel. Key support is the 10-year low near $3. Strong Wheat Wheat's 2018 Recovery Gaining Staying Power. The rally in wheat, an early commodity leader in 2018, appears sustainable. Peaking stocks-to-use, strong U.S. exports vs. declining production and negative net revenue indicate eventual price gains. The key question for wheat and grains is when favorable weather patterns subside. Wheat Prices Bottoming vs. Peak Stocks-to-Use. The wheat supply-to-price inflection point appears to have been reached, favoring higher prices. The USDA-estimated U.S. wheat stocks-to-use ratio is peaking at about its highest level since 1987. Albeit from a lesser extreme, 2010-11 offers the most recent similarities. Chicago wheat prices initially doubled to a 2011 high after the stocks-to-use 12-month average peaked at 45% in September 2010. This time, wheat is up about 28% from 2016's 10-year low; stocks-to-use looks to have peaked at 53% in May.
Wheat Stocks-to-Use Similar to 2010 Peak
Wheat's U.S.-only negative price correlation (0.60) the past 25 years is about the same as for global stocks-to-use. The U.S. is often the global swing exporter. With little incentive to produce, 2018 planted-acre estimates may be similar to 2017 -- the lowest in about 100 years. Strong U.S. Exports Should Boost Prices. Surging U.S. wheat exports should portend higher prices, based on historical patterns. In USDA data sets, Chicago wheat has among the highest annual positive correlations to U.S. exports -- 0.56 in the past 25 years. The current export pace, the highest in six years, has entered the red zone where something has to give -- higher prices or reduced exports. Supported by a weak dollar, price increases are the most likely balancing mechanism. U.S. Wheat Exports Surge, Price Recovery Nascent
Near 54% of total production, exports are up from 40% in 2016, when prices bottomed. The last similar annual surge in exports was in 2010, to 57% from 40% -- prices doubled to 2011's peak from the 2010 low. Spiking exports and reduced planting are unsustainable, likely to be alleviated by higher prices.
Bloomberg Commodity Outlook – March 2018 Edition Bloomberg Commodity Index (BCOM)
Melt-Up Risks Are Ripening for Wheat. Wheat prices favor a move higher, with growing risk of a sharp rally and diminishing prospects for a decline. Based on historical prices to U.S. exports, the 2017 weather-scare rally was a shot across the bow. The metric with among the highest historical positive correlations to prices, wheat is leaving the U.S. at the greatest pace in seven years. In 2017, when prices leaped 40% from the April low to July peak, the U.S. was exporting only 46% of production, based on the 12-month average of USDA estimates. Bottoming Wheat Poised to Catch Up to Exports
This metric is now at 54%, rapidly nearing the 2011 peak (57%). An additional bullish indication is declining stocks-to-use. In July, U.S., wheat stocks-to-use estimates were still increasing. The 12-month average has since turned down for the first time since 2011. Divergent Trend - Production Declining With Profit. Planted wheat acres will continue to decline until higher prices give farmers the incentive. Our analysis of USDA estimates puts 2018 on pace for a sixth straight year of negative net revenue for U.S. wheat. Based on the price of the most widely traded Chicago wheat future, a net loss of almost $100 an acre since 2015 is pressuring acreage. U.S. acres planted are down about 19% since 2015 to the lowest recorded since 1918 -- an unsustainable trend that's in need of higher prices to reverse. In 2017, the U.S. was among the world's top wheat exporters, accounting for 14.6% of the total.
Negative Net Wheat Revenue, Declining Production
PERFORMANCE DRIVERS Strong Soybean-Meal Rally Led by Protein Demand? Protein demand, led by soybean meal, is a solid foundation for further recovery in agriculture prices. Adverse weather and subsequent production declines, notably in major exporter Argentina, are primary drivers of the 24% Bloomberg Soybean Meal Total Return through Feb. 28. A blip in Argentine weather may reveal how dependent the market has become on above-average global production. Kansas wheat is also ahead of other commodities, similar to last year, as drought conditions resurface in the Great Plains. Agriculture Constituents' Performance (2018)
The favorable weather patterns of the past few years should normalize at some point. Markets are pricing in some premium. Oversupplied sugar is the primary drag on agriculture, but the downside appears limited.
Bloomberg Commodity Outlook – March 2018 Edition Bloomberg Commodity Index (BCOM)
DATA on BI COMD Performance - Overview Key Metrics
Historical

Bloomberg Commodity Outlook – March 2018 Edition Bloomberg Commodity Index (BCOM)
Performance – Commodity Total Returns Key Metrics
Historical
Bloomberg Commodity Outlook – March 2018 Edition Bloomberg Commodity Index (BCOM)
Performance – Prices Key Metrics
Historical
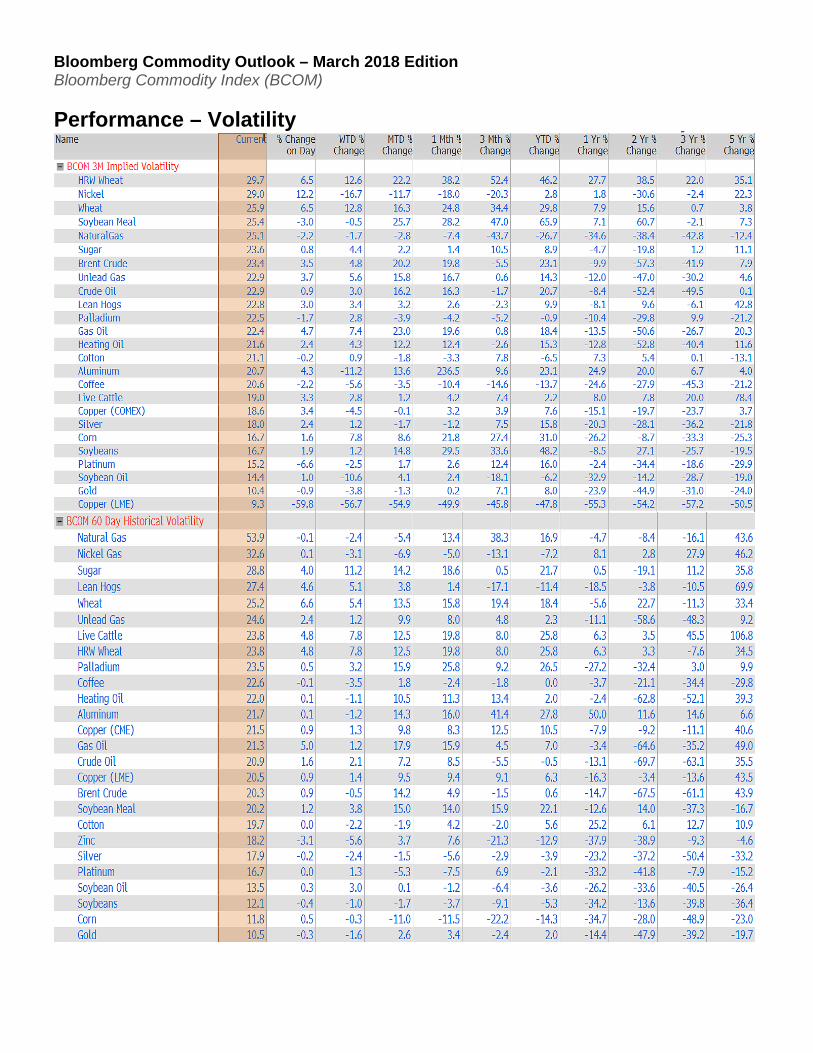
Bloomberg Commodity Outlook – March 2018 Edition Bloomberg Commodity Index (BCOM)
Performance – Volatility
Bloomberg Commodity Outlook – March 2018 Edition Bloomberg Commodity Index (BCOM)
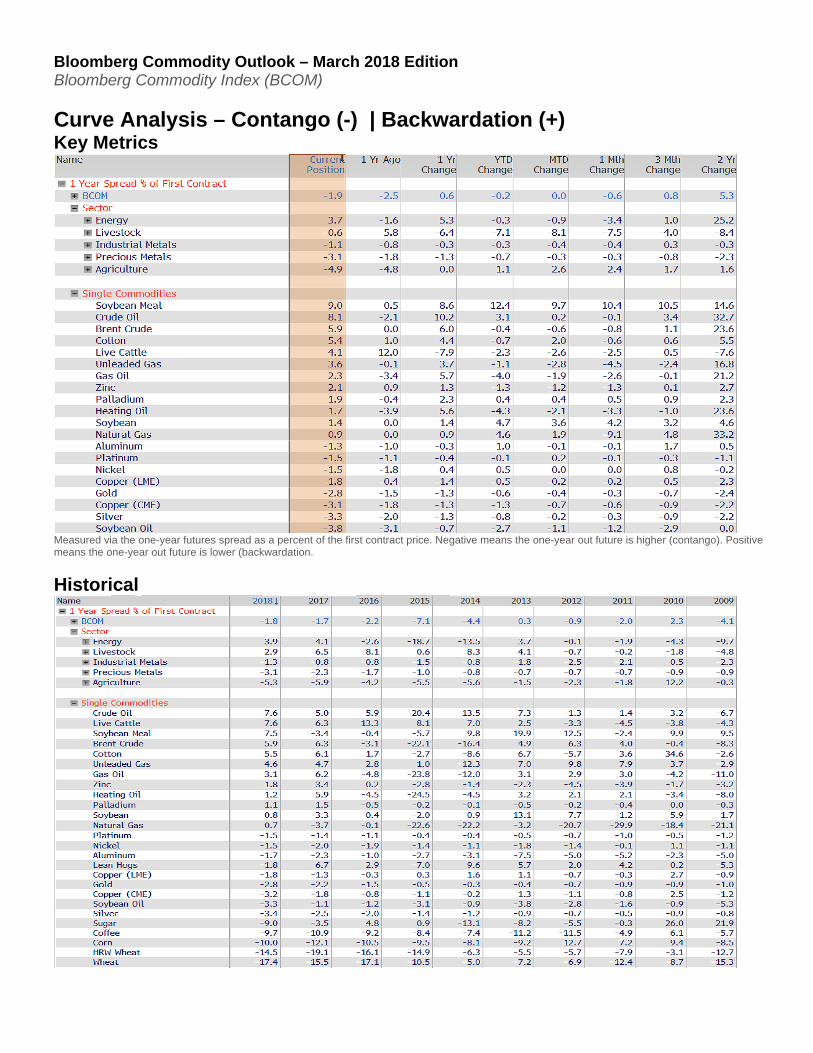
Curve Analysis – Contango (-) | Backwardation (+) Key Metrics
Measured via the one-year futures spread as a percent of the first contract price. Negative means the one-year out future is higher (contango). Positive means the one-year out future is lower (backwardation.
Historical
Bloomberg Commodity Outlook – March 2018 Edition Bloomberg Commodity Index (BCOM)
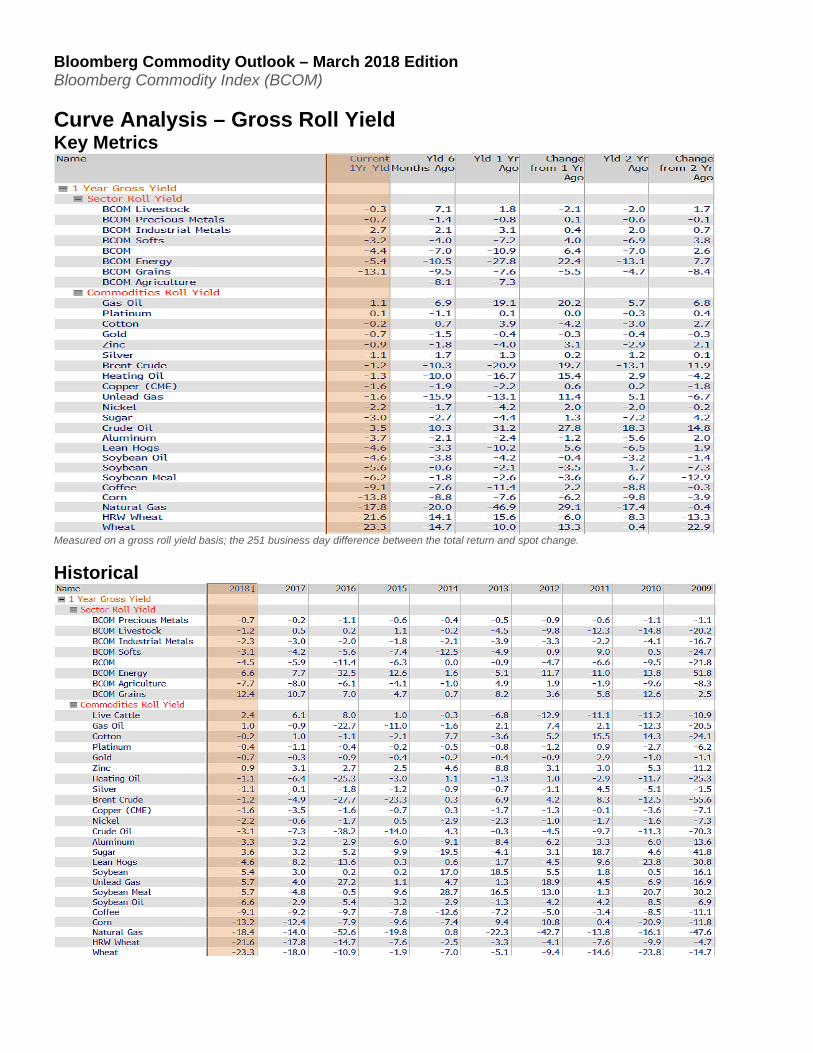
Curve Analysis – Gross Roll Yield Key Metrics
Measured on a gross roll yield basis; the 251 business day difference between the total return and spot change.
Historical

Bloomberg Commodity Outlook – March 2018 Edition Bloomberg Commodity Index (BCOM)
Curve Analysis – Forwards / Forecasts Spread %
Data Set
Bloomberg Commodity Outlook – March 2018 Edition Bloomberg Commodity Index (BCOM)
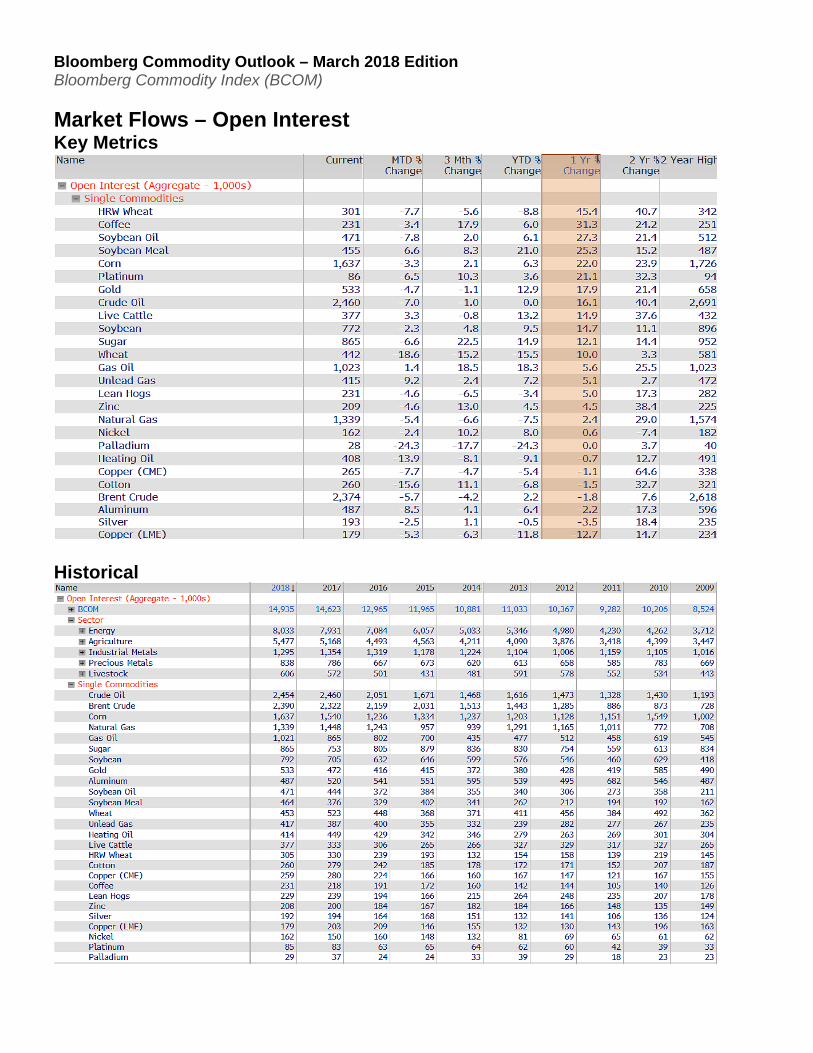
Market Flows – Open Interest Key Metrics
Historical
Bloomberg Commodity Outlook – March 2018 Edition Bloomberg Commodity Index (BCOM)
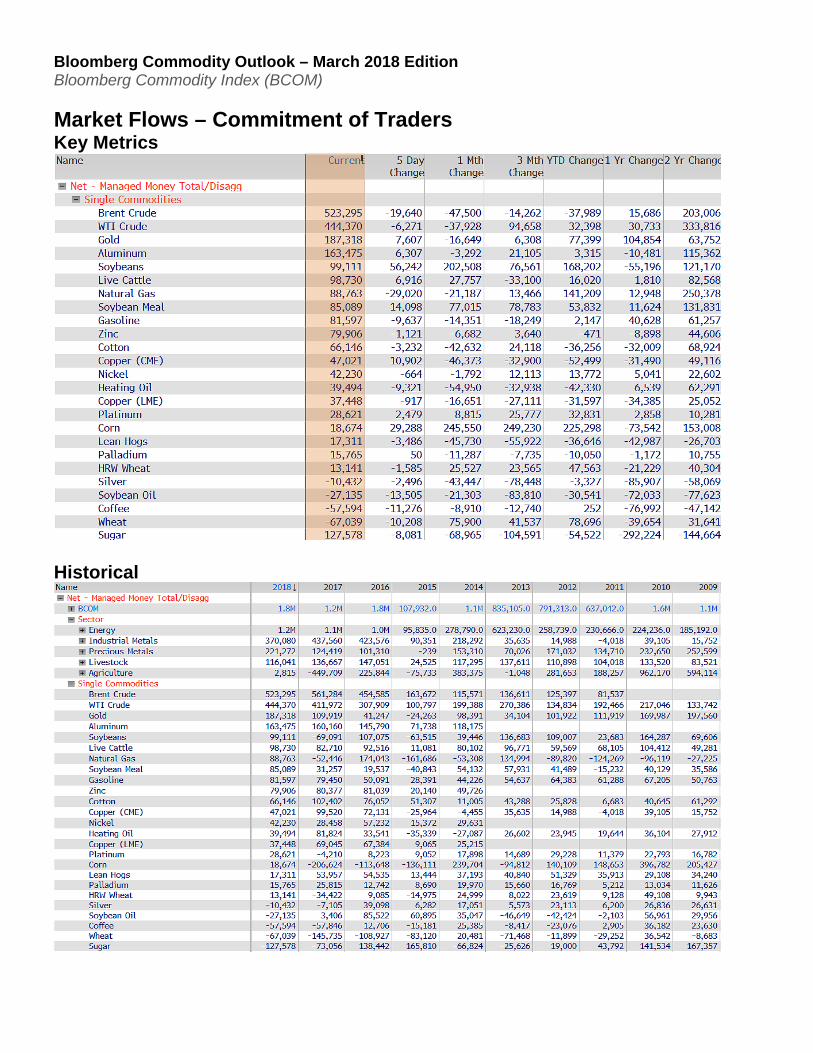
Market Flows – Commitment of Traders Key Metrics
Historical
Bloomberg Commodity Outlook – March 2018 Edition Bloomberg Commodity Index (BCOM)
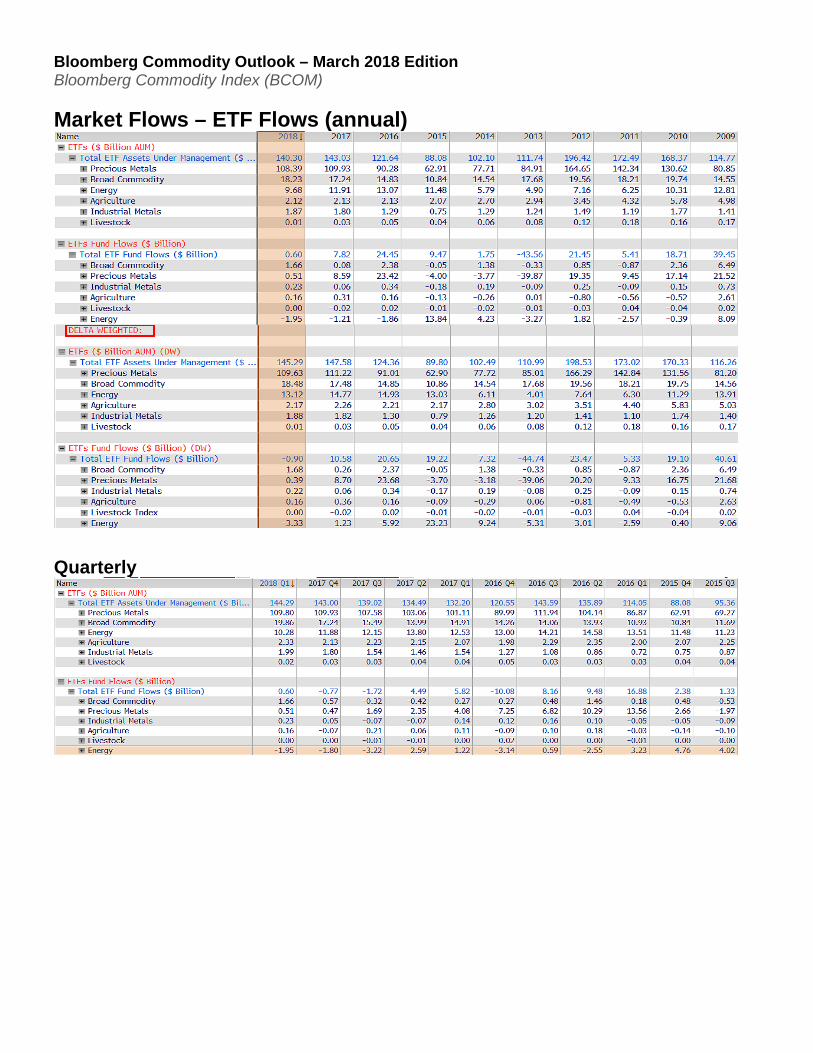
Market Flows – ETF Flows (annual)
Quarterly
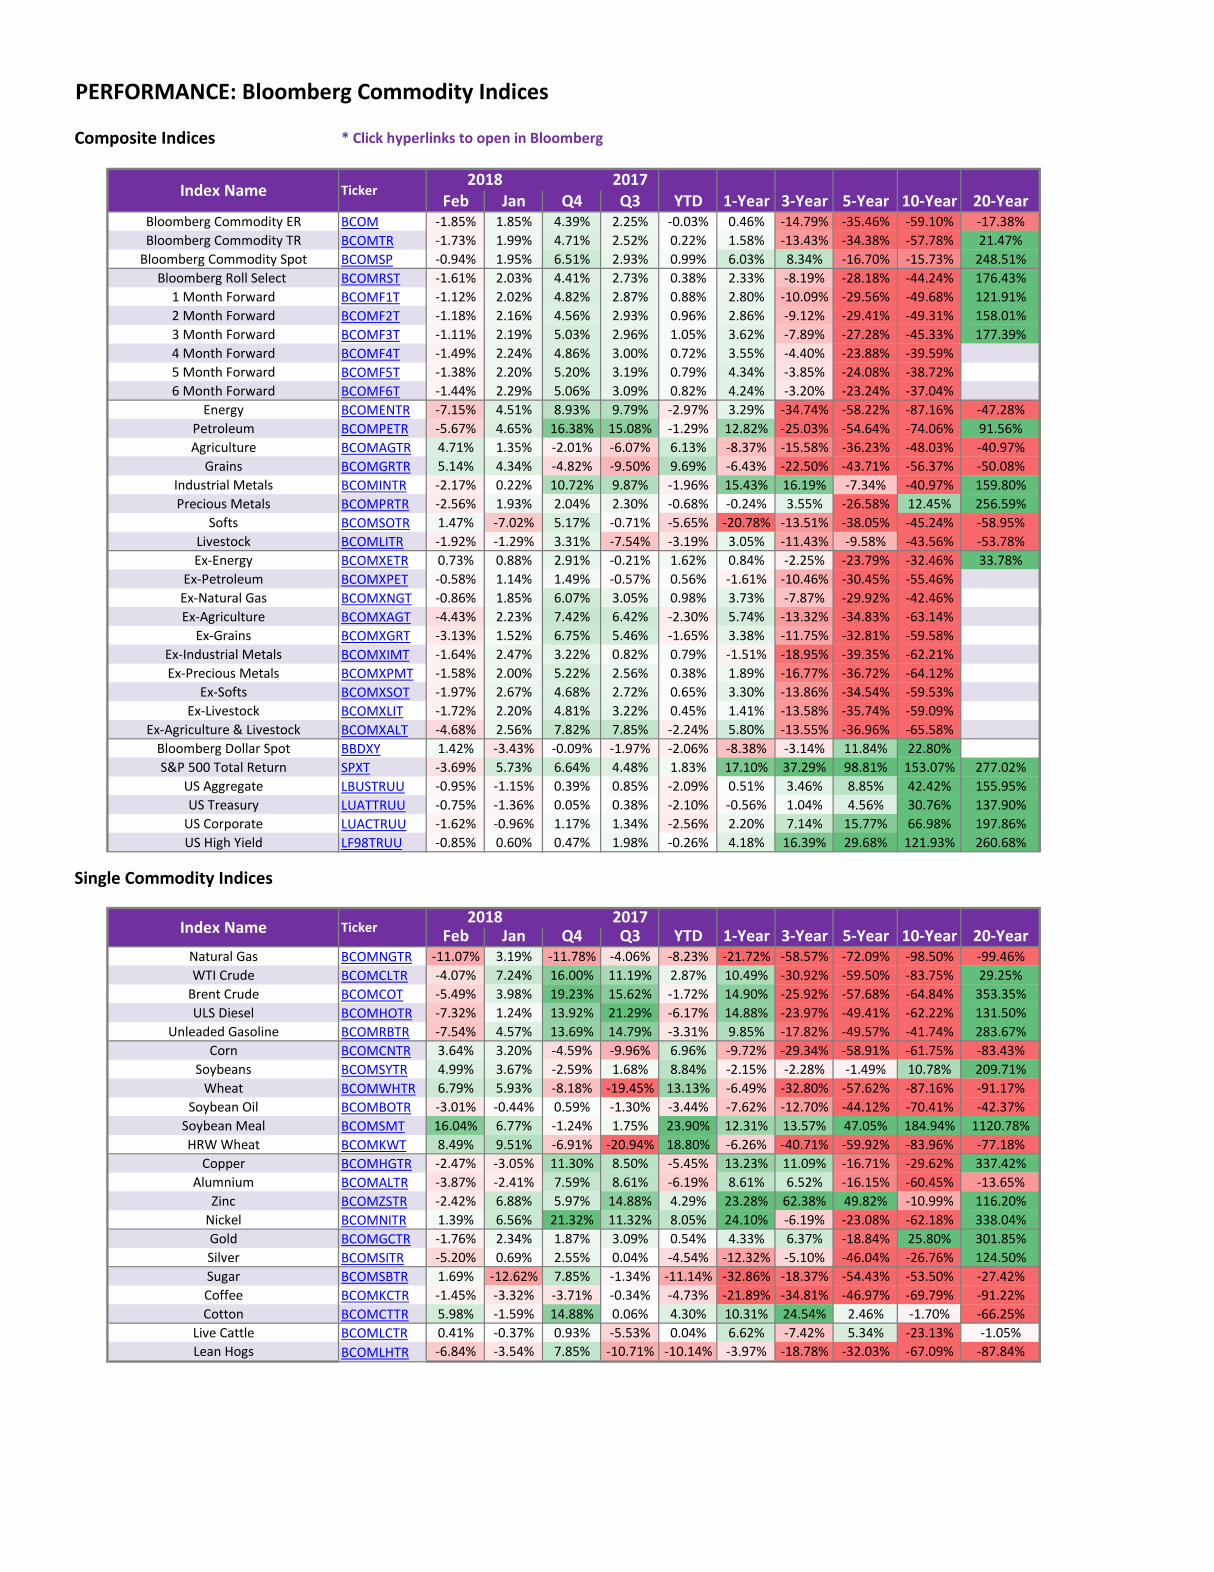
Composite Indices * Click hyperlinks to open in Bloomberg
2017Feb Jan Q4 Q3 YTD 1-Year 3-Year 5-Year 10-Year 20-Year
Bloomberg Commodity ER BCOM -1.85% 1.85% 4.39% 2.25% -0.03% 0.46% -14.79% -35.46% -59.10% -17.38%Bloomberg Commodity TR BCOMTR -1.73% 1.99% 4.71% 2.52% 0.22% 1.58% -13.43% -34.38% -57.78% 21.47%
Bloomberg Commodity Spot BCOMSP -0.94% 1.95% 6.51% 2.93% 0.99% 6.03% 8.34% -16.70% -15.73% 248.51%Bloomberg Roll Select BCOMRST -1.61% 2.03% 4.41% 2.73% 0.38% 2.33% -8.19% -28.18% -44.24% 176.43%
1 Month Forward BCOMF1T -1.12% 2.02% 4.82% 2.87% 0.88% 2.80% -10.09% -29.56% -49.68% 121.91% 2 Month Forward BCOMF2T -1.18% 2.16% 4.56% 2.93% 0.96% 2.86% -9.12% -29.41% -49.31% 158.01% 3 Month Forward BCOMF3T -1.11% 2.19% 5.03% 2.96% 1.05% 3.62% -7.89% -27.28% -45.33% 177.39% 4 Month Forward BCOMF4T -1.49% 2.24% 4.86% 3.00% 0.72% 3.55% -4.40% -23.88% -39.59% 5 Month Forward BCOMF5T -1.38% 2.20% 5.20% 3.19% 0.79% 4.34% -3.85% -24.08% -38.72% 6 Month Forward BCOMF6T -1.44% 2.29% 5.06% 3.09% 0.82% 4.24% -3.20% -23.24% -37.04%
Energy BCOMENTR -7.15% 4.51% 8.93% 9.79% -2.97% 3.29% -34.74% -58.22% -87.16% -47.28%Petroleum BCOMPETR -5.67% 4.65% 16.38% 15.08% -1.29% 12.82% -25.03% -54.64% -74.06% 91.56%Agriculture BCOMAGTR 4.71% 1.35% -2.01% -6.07% 6.13% -8.37% -15.58% -36.23% -48.03% -40.97%
Grains BCOMGRTR 5.14% 4.34% -4.82% -9.50% 9.69% -6.43% -22.50% -43.71% -56.37% -50.08%Industrial Metals BCOMINTR -2.17% 0.22% 10.72% 9.87% -1.96% 15.43% 16.19% -7.34% -40.97% 159.80%Precious Metals BCOMPRTR -2.56% 1.93% 2.04% 2.30% -0.68% -0.24% 3.55% -26.58% 12.45% 256.59%
Softs BCOMSOTR 1.47% -7.02% 5.17% -0.71% -5.65% -20.78% -13.51% -38.05% -45.24% -58.95%Livestock BCOMLITR -1.92% -1.29% 3.31% -7.54% -3.19% 3.05% -11.43% -9.58% -43.56% -53.78%Ex-Energy BCOMXETR 0.73% 0.88% 2.91% -0.21% 1.62% 0.84% -2.25% -23.79% -32.46% 33.78%
Ex-Petroleum BCOMXPET -0.58% 1.14% 1.49% -0.57% 0.56% -1.61% -10.46% -30.45% -55.46%Ex-Natural Gas BCOMXNGT -0.86% 1.85% 6.07% 3.05% 0.98% 3.73% -7.87% -29.92% -42.46%Ex-Agriculture BCOMXAGT -4.43% 2.23% 7.42% 6.42% -2.30% 5.74% -13.32% -34.83% -63.14%
Ex-Grains BCOMXGRT -3.13% 1.52% 6.75% 5.46% -1.65% 3.38% -11.75% -32.81% -59.58%Ex-Industrial Metals BCOMXIMT -1.64% 2.47% 3.22% 0.82% 0.79% -1.51% -18.95% -39.35% -62.21%Ex-Precious Metals BCOMXPMT -1.58% 2.00% 5.22% 2.56% 0.38% 1.89% -16.77% -36.72% -64.12%
Ex-Softs BCOMXSOT -1.97% 2.67% 4.68% 2.72% 0.65% 3.30% -13.86% -34.54% -59.53%Ex-Livestock BCOMXLIT -1.72% 2.20% 4.81% 3.22% 0.45% 1.41% -13.58% -35.74% -59.09%
Ex-Agriculture & Livestock BCOMXALT -4.68% 2.56% 7.82% 7.85% -2.24% 5.80% -13.55% -36.96% -65.58%Bloomberg Dollar Spot BBDXY 1.42% -3.43% -0.09% -1.97% -2.06% -8.38% -3.14% 11.84% 22.80%S&P 500 Total Return SPXT -3.69% 5.73% 6.64% 4.48% 1.83% 17.10% 37.29% 98.81% 153.07% 277.02%
US Aggregate LBUSTRUU -0.95% -1.15% 0.39% 0.85% -2.09% 0.51% 3.46% 8.85% 42.42% 155.95%US Treasury LUATTRUU -0.75% -1.36% 0.05% 0.38% -2.10% -0.56% 1.04% 4.56% 30.76% 137.90%
US Corporate LUACTRUU -1.62% -0.96% 1.17% 1.34% -2.56% 2.20% 7.14% 15.77% 66.98% 197.86%US High Yield LF98TRUU -0.85% 0.60% 0.47% 1.98% -0.26% 4.18% 16.39% 29.68% 121.93% 260.68%
Single Commodity Indices
2017Feb Jan Q4 Q3 YTD 1-Year 3-Year 5-Year 10-Year 20-Year
Natural Gas BCOMNGTR -11.07% 3.19% -11.78% -4.06% -8.23% -21.72% -58.57% -72.09% -98.50% -99.46%WTI Crude BCOMCLTR -4.07% 7.24% 16.00% 11.19% 2.87% 10.49% -30.92% -59.50% -83.75% 29.25%
Brent Crude BCOMCOT -5.49% 3.98% 19.23% 15.62% -1.72% 14.90% -25.92% -57.68% -64.84% 353.35%ULS Diesel BCOMHOTR -7.32% 1.24% 13.92% 21.29% -6.17% 14.88% -23.97% -49.41% -62.22% 131.50%
Unleaded Gasoline BCOMRBTR -7.54% 4.57% 13.69% 14.79% -3.31% 9.85% -17.82% -49.57% -41.74% 283.67%Corn BCOMCNTR 3.64% 3.20% -4.59% -9.96% 6.96% -9.72% -29.34% -58.91% -61.75% -83.43%
Soybeans BCOMSYTR 4.99% 3.67% -2.59% 1.68% 8.84% -2.15% -2.28% -1.49% 10.78% 209.71%Wheat BCOMWHTR 6.79% 5.93% -8.18% -19.45% 13.13% -6.49% -32.80% -57.62% -87.16% -91.17%
Soybean Oil BCOMBOTR -3.01% -0.44% 0.59% -1.30% -3.44% -7.62% -12.70% -44.12% -70.41% -42.37%Soybean Meal BCOMSMT 16.04% 6.77% -1.24% 1.75% 23.90% 12.31% 13.57% 47.05% 184.94% 1120.78%HRW Wheat BCOMKWT 8.49% 9.51% -6.91% -20.94% 18.80% -6.26% -40.71% -59.92% -83.96% -77.18%
Copper BCOMHGTR -2.47% -3.05% 11.30% 8.50% -5.45% 13.23% 11.09% -16.71% -29.62% 337.42%Alumnium BCOMALTR -3.87% -2.41% 7.59% 8.61% -6.19% 8.61% 6.52% -16.15% -60.45% -13.65%
Zinc BCOMZSTR -2.42% 6.88% 5.97% 14.88% 4.29% 23.28% 62.38% 49.82% -10.99% 116.20%Nickel BCOMNITR 1.39% 6.56% 21.32% 11.32% 8.05% 24.10% -6.19% -23.08% -62.18% 338.04%Gold BCOMGCTR -1.76% 2.34% 1.87% 3.09% 0.54% 4.33% 6.37% -18.84% 25.80% 301.85%Silver BCOMSITR -5.20% 0.69% 2.55% 0.04% -4.54% -12.32% -5.10% -46.04% -26.76% 124.50%Sugar BCOMSBTR 1.69% -12.62% 7.85% -1.34% -11.14% -32.86% -18.37% -54.43% -53.50% -27.42%Coffee BCOMKCTR -1.45% -3.32% -3.71% -0.34% -4.73% -21.89% -34.81% -46.97% -69.79% -91.22%Cotton BCOMCTTR 5.98% -1.59% 14.88% 0.06% 4.30% 10.31% 24.54% 2.46% -1.70% -66.25%
Live Cattle BCOMLCTR 0.41% -0.37% 0.93% -5.53% 0.04% 6.62% -7.42% 5.34% -23.13% -1.05%Lean Hogs BCOMLHTR -6.84% -3.54% 7.85% -10.71% -10.14% -3.97% -18.78% -32.03% -67.09% -87.84%
Index Name Ticker
Index Name Ticker
PERFORMANCE: Bloomberg Commodity Indices
2018
2018
Composite Roll Select Indices * Click hyperlinks to open in Bloomberg
2017Feb Jan Q4 Q3 YTD 1-Year 3-Year 5-Year 10-Year 20-Year
BCOM Roll Select BCOMRST -1.61% 2.03% 4.41% 2.73% 0.38% 2.33% -8.19% -28.18% -44.24% 176.43%Roll Select Agriculture BCOMRAGT 4.08% 1.44% -1.89% -5.08% 5.58% -7.03% -13.45% -34.20% -37.85% 8.85%
Roll Select Ex-Ags & Livestock BBURXALT -4.48% 2.40% 7.46% 7.81% -2.18% 6.45% -5.74% -28.62% -52.19%Roll Select Grains BCOMRGRT 4.67% 4.05% -4.34% -7.84% 8.91% -3.99% -19.37% -42.70% -49.32% -3.71%Roll Select Softs BCOMRSOT 0.47% -5.97% 4.22% -1.90% -5.52% -22.52% -14.27% -33.87% -28.68% -24.81%
Roll Select Livestock BCOMRLIT -0.01% 0.68% 2.45% -7.93% 0.66% 4.06% -18.54% -8.97% -27.57% 51.70%Roll Select Energy BCOMRENT -6.80% 4.10% 8.15% 9.42% -2.98% 3.99% -21.54% -45.87% -75.19% 160.22%
Roll Select Ex-Energy BCOMRXET 0.67% 1.14% 2.83% 0.21% 1.82% 1.60% -1.34% -22.07% -23.02% 131.13%Roll Select Petroleum BCOMRPET -5.15% 4.10% 14.70% 13.37% -1.27% 12.43% -14.29% -44.36% -54.03% 515.96%
Roll Select Industrial Metals BCOMRINT -2.11% 0.34% 10.66% 10.22% -1.78% 16.34% 18.18% -4.25% -34.66% 295.53%Roll Select Precious Metals BCOMRPRT -2.57% 1.97% 2.09% 2.29% -0.65% -0.16% 3.97% -26.21% 13.53% 275.10%
Single Commodity Roll Select Indices
2017Feb Jan Q4 Q3 YTD 1-Year 3-Year 5-Year 10-Year 20-Year
Natural Gas RS BCOMRNGT -11.03% 3.20% -10.28% -0.32% -8.18% -18.07% -42.54% -56.60% -95.40% -86.43%WTI Crude RS BCOMRCLT -4.34% 5.93% 14.86% 10.68% 1.33% 10.57% -12.04% -44.86% -59.78% 542.43%
Brent Crude RS BCOMRCOT -5.29% 3.72% 17.87% 14.24% -1.77% 16.53% -18.79% -48.09% -50.69% 618.23%ULS Diesel RS BCOMRHOT -6.53% 2.52% 13.86% 15.07% -4.18% 10.38% -21.10% -47.37% -57.53% 344.59%
Unleaded Gasoline RS BCOMRRBT -5.21% 3.11% 8.93% 14.94% -2.26% 9.65% -5.00% -35.36% -29.84% 586.07%Corn RS BCOMRCNT 2.85% 2.58% -4.12% -8.10% 5.51% -7.96% -26.79% -56.83% -55.22% -68.21%
Soybeans RS BCOMRSYT 4.84% 3.56% -1.78% 2.81% 8.58% 2.27% 5.10% 1.46% 24.96% 322.36%Wheat RS BCOMRWHT 6.46% 5.87% -8.10% -17.16% 12.72% -5.53% -33.27% -59.31% -83.25% -66.51%
Soybean Oil RS BCOMRBOT -3.01% -0.47% 0.12% -0.68% -3.47% -7.69% -11.31% -42.18% -65.67% -10.09%Soybean Meal RS BCOMRSMT 14.68% 6.60% -0.36% 2.88% 22.25% 15.59% 13.59% 44.51% 224.29% 1335.36%HRW Wheat RS BCOMRKWT 7.83% 9.56% -6.89% -18.91% 18.13% -4.87% -37.71% -58.93% -80.79% -42.36%
Copper RS BCOMRHGT -2.22% -2.75% 11.40% 8.73% -4.91% 14.34% 12.34% -16.21% -24.71% 539.51%Alumnium RS BCOMRALT -4.12% -2.40% 7.36% 9.65% -6.43% 9.75% 10.27% -9.62% -54.59% 33.37%
Zinc RS BCOMRZST -2.25% 7.18% 6.02% 14.55% 4.77% 24.55% 64.18% 55.54% 1.14% 243.54%Nickel RS BCOMRNIT 1.36% 6.33% 20.99% 11.52% 7.78% 23.90% -5.47% -21.32% -58.67% 607.12%Gold RS BCOMRGCT -1.78% 2.39% 1.92% 3.07% 0.57% 4.38% 6.86% -18.50% 26.34% 309.94%Silver RS BCOMRSIT -5.21% 0.73% 2.58% 0.09% -4.52% -12.08% -4.76% -45.53% -24.74% 158.48%Sugar RS BCOMRSBT 0.20% -10.87% 4.88% -3.87% -10.69% -35.84% -20.36% -49.06% -32.72% 55.41%Coffee RS BCOMRKCT -1.88% -3.19% -3.74% -0.60% -5.01% -22.20% -34.76% -45.85% -64.85% -84.18%Cotton RS BCOMRCTT 5.08% -0.59% 16.36% -0.53% 4.47% 9.17% 25.90% 7.00% 20.20% -47.32%
Live Cattle RS BCOMRLCT 0.58% 1.39% 0.41% -6.31% 1.97% 7.69% -7.76% 2.84% -11.02% 85.63%Lean Hogs RS BCOMRLHT -0.87% -0.83% 5.57% -10.59% -1.69% -2.69% -33.69% -27.28% -51.08% -16.34%
PERFORMANCE: Bloomberg Commodity Roll Select Indices
Index Name Ticker
Index Name Ticker
2018
2018
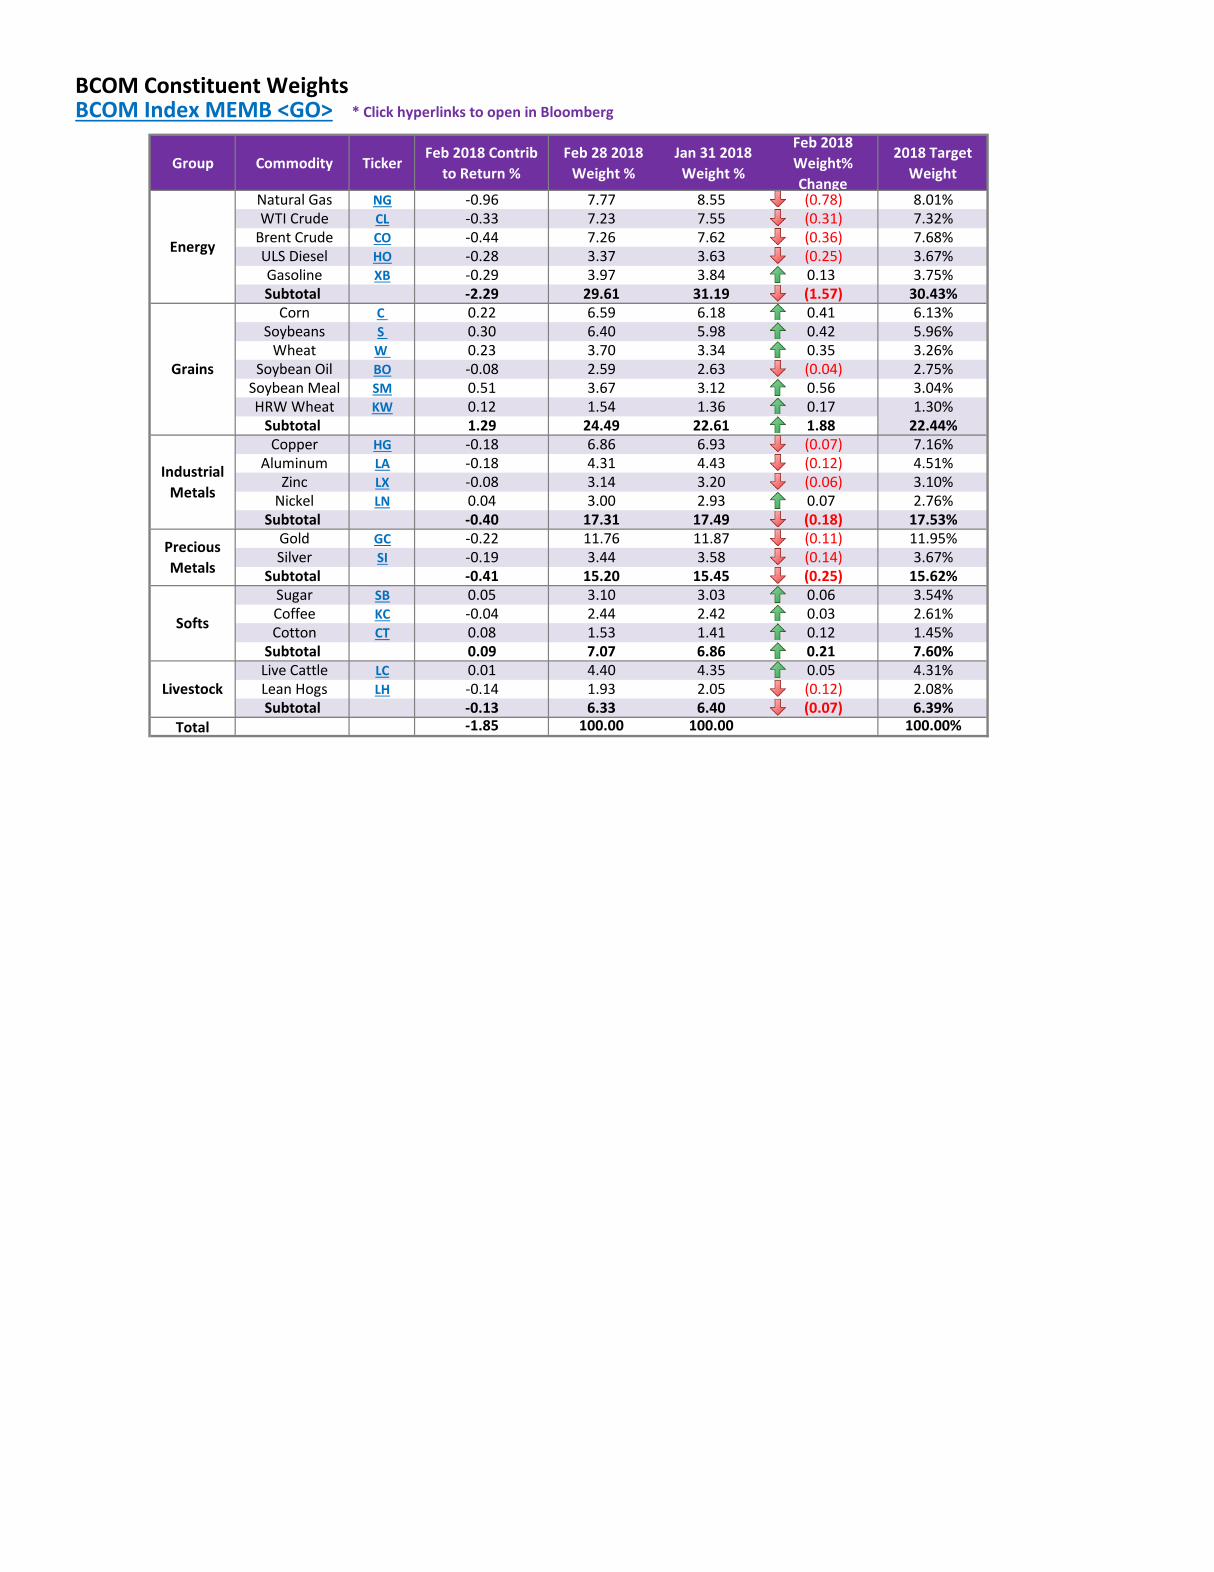
BCOM Constituent Weights BCOM Index MEMB <GO> * Click hyperlinks to open in Bloomberg
Group Commodity TickerFeb 2018 Contrib
to Return %Feb 28 2018
Weight %Jan 31 2018 Weight %
Feb 2018 Weight% Change
2018 Target Weight
Natural Gas NG -0.96 7.77 8.55 (0.78) 8.01% WTI Crude CL -0.33 7.23 7.55 (0.31) 7.32%
Brent Crude CO -0.44 7.26 7.62 (0.36) 7.68% ULS Diesel HO -0.28 3.37 3.63 (0.25) 3.67% Gasoline XB -0.29 3.97 3.84 0.13 3.75%Subtotal -2.29 29.61 31.19 (1.57) 30.43%
Corn C 0.22 6.59 6.18 0.41 6.13% Soybeans S 0.30 6.40 5.98 0.42 5.96%
Wheat W 0.23 3.70 3.34 0.35 3.26% Soybean Oil BO -0.08 2.59 2.63 (0.04) 2.75%
Soybean Meal SM 0.51 3.67 3.12 0.56 3.04% HRW Wheat KW 0.12 1.54 1.36 0.17 1.30%
Subtotal 1.29 24.49 22.61 1.88 22.44% Copper HG -0.18 6.86 6.93 (0.07) 7.16%
Aluminum LA -0.18 4.31 4.43 (0.12) 4.51% Zinc LX -0.08 3.14 3.20 (0.06) 3.10%
Nickel LN 0.04 3.00 2.93 0.07 2.76%Subtotal -0.40 17.31 17.49 (0.18) 17.53%
Gold GC -0.22 11.76 11.87 (0.11) 11.95% Silver SI -0.19 3.44 3.58 (0.14) 3.67%
Subtotal -0.41 15.20 15.45 (0.25) 15.62% Sugar SB 0.05 3.10 3.03 0.06 3.54% Coffee KC -0.04 2.44 2.42 0.03 2.61% Cotton CT 0.08 1.53 1.41 0.12 1.45%
Subtotal 0.09 7.07 6.86 0.21 7.60% Live Cattle LC 0.01 4.40 4.35 0.05 4.31% Lean Hogs LH -0.14 1.93 2.05 (0.12) 2.08%Subtotal -0.13 6.33 6.40 (0.07) 6.39%
Total -1.85 100.00 100.00 100.00%
Energy
Livestock
Softs
Precious Metals
Industrial Metals
Grains
BLOOMBERG INTELLIGENCE: COMMODITY DASHBOARDS BI <GO> * Click hyperlinks to open in Bloomberg
Crude Oil Production: BI OILS <GO> Natural Gas Production: BI NGAS <GO>
Precious Metal Mining: BI PMET <GO> Agricultural Chemicals: BI AGCH <GO>
Copper: BI COPP <GO> Aluminum: BI ALUM <GO>
BI provides analysis on several key drivers of BCOM performance; industrial and precious metals mining, oil and natural gas production, and agricultural chemicals. The dashboards include key macro data libraries and interactive charting and commentary from analysts with an average of seventeen years of experience.
30
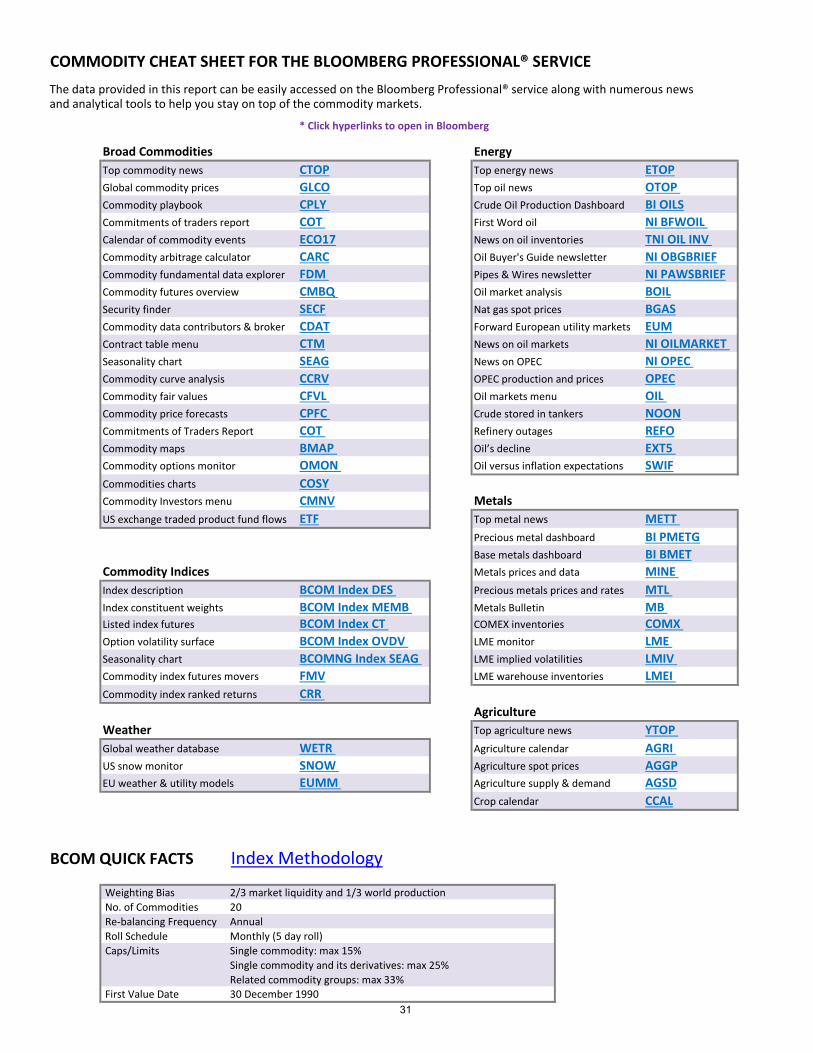
COMMODITY CHEAT SHEET FOR THE BLOOMBERG PROFESSIONAL® SERVICE
* Click hyperlinks to open in Bloomberg
Broad Commodities EnergyTop commodity news CTOP Top energy news ETOPGlobal commodity prices GLCO Top oil news OTOP Commodity playbook CPLY Crude Oil Production Dashboard BI OILSCommitments of traders report COT First Word oil NI BFWOIL Calendar of commodity events ECO17 News on oil inventories TNI OIL INV Commodity arbitrage calculator CARC Oil Buyer's Guide newsletter NI OBGBRIEFCommodity fundamental data explorer FDM Pipes & Wires newsletter NI PAWSBRIEFCommodity futures overview CMBQ Oil market analysis BOILSecurity finder SECF Nat gas spot prices BGASCommodity data contributors & broker CDAT Forward European utility markets EUMContract table menu CTM News on oil markets NI OILMARKET Seasonality chart SEAG News on OPEC NI OPEC Commodity curve analysis CCRV OPEC production and prices OPECCommodity fair values CFVL Oil markets menu OIL Commodity price forecasts CPFC Crude stored in tankers NOONCommitments of Traders Report COT Refinery outages REFOCommodity maps BMAP Oil’s decline EXT5 Commodity options monitor OMON Oil versus inflation expectations SWIFCommodities charts COSYCommodity Investors menu CMNV MetalsUS exchange traded product fund flows ETF Top metal news METT
Precious metal dashboard BI PMETGBase metals dashboard BI BMET
Commodity Indices Metals prices and data MINE Index description BCOM Index DES Precious metals prices and rates MTL Index constituent weights BCOM Index MEMB Metals Bulletin MB Listed index futures BCOM Index CT COMEX inventories COMX Option volatility surface BCOM Index OVDV LME monitor LME Seasonality chart BCOMNG Index SEAG LME implied volatilities LMIV Commodity index futures movers FMV LME warehouse inventories LMEI Commodity index ranked returns CRR
AgricultureWeather Top agriculture news YTOP Global weather database WETR Agriculture calendar AGRI US snow monitor SNOW Agriculture spot prices AGGPEU weather & utility models EUMM Agriculture supply & demand AGSD
Crop calendar CCAL
BCOM QUICK FACTS Index Methodology
Weighting Bias 2/3 market liquidity and 1/3 world production No. of Commodities 20 Re-balancing Frequency Annual Roll Schedule Monthly (5 day roll) Caps/Limits Single commodity: max 15%
Single commodity and its derivatives: max 25%Related commodity groups: max 33%
First Value Date 30 December 1990
The data provided in this report can be easily accessed on the Bloomberg Professional® service along with numerous news and analytical tools to help you stay on top of the commodity markets.
31
BLOOMBERG, BLOOMBERG INDICES and BCOM are trademarks or service marks of Bloomberg Finance L.P.
Bloomberg Finance L.P. and its affiliates ("collectively, "Bloomberg") or Bloomberg's licensors own all proprietary
right in the BLOOMBERG INDICES or BCOM. Bloomberg does not guarantee the timeliness, accuracy or
completeness of any data or information relating to BLOOMBERG INDICES or BCOM. Bloomberg makes no
warranty, express or implied, as to the BLOOMBERG INDICES or BCOM or any data or values relating thereto or
results to be obtained therefrom, and expressly disclaims all warranties of merchantability and fitness for a particular
purpose with respect thereto. It is not possible to invest directly in an index. Back-tested performance is not actual
performance. Past performance is not an indication of future results. To the maximum extent allowed by law,
Bloomberg, its licensors, and its and their respective employees, contractors, agents, suppliers and vendors shall
have no liability or responsibility whatsoever for any injury or damages - whether direct, indirect, consequential,
incidental, punitive or otherwise - arising in connection with BLOOMBERG INDICES or BCOM or any data or
values relating thereto - whether arising from their negligence or otherwise. This document constitutes the provision
of factual information, rather than financial product advice. Nothing in the BLOOMBERG INDICES or BCOM
shall constitute or be construed as an offering of financial instruments or as investment advice or investment
recommendations (i.e., recommendations as to whether or not to “buy”, “sell”, “hold”, or to enter or not to enter into
any other transaction involving any specific interest or interests) by Bloomberg or its affiliates or a recommendation
as to an investment or other strategy by Bloomberg or its affiliates. Data and other information available via the
BLOOMBERG INDICES or BCOM should not be considered as information sufficient upon which to base an
investment decision. All information provided by the BLOOMBERG INDICES or BCOM is impersonal and not
tailored to the needs of any person, entity or group of persons. Bloomberg and its affiliates do not express an opinion
on the future or expected value of any security or other interest and do not explicitly or implicitly recommend or
suggest an investment strategy of any kind. Customers should consider obtaining independent advice before making
any financial decisions. © 2016 Bloomberg Finance L.P. All rights reserved. This document and its contents may
not be forwarded or redistributed without the prior consent of Bloomberg.
The BLOOMBERG PROFESSIONAL® service and BLOOMBERG Data (the “Services”) are owned and
distributed by Bloomberg Finance L.P. (“BFLP”) in all jurisdictions other than Argentina, Bermuda, China, India,
Japan, and Korea (the “BLP Countries”). BFLP is a wholly owned subsidiary of Bloomberg L.P. (“BLP”). BLP
provides BFLP with global marketing and operational support and service for the Services and distributes the
Services either directly or through a non-BFLP subsidiary in the BLP Countries. Certain functionalities distributed
via the Services are available only to sophisticated institutional investors and only where the necessary legal
clearance has been obtained. BFLP, BLP and their affiliates do not guarantee the accuracy of prices or information
in the Services. Nothing in the Services shall constitute or be construed as an offering of financial instruments by
BFLP, BLP or their affiliates, or as investment advice or recommendations by BFLP, BLP or their affiliates of an
investment strategy or whether or not to “buy”, “sell” or “hold” an investment. Information available via the
Services should not be considered as information sufficient upon which to base an investment decision.
BLOOMBERG, BLOOMBERG PROFESSIONAL, BLOOMBERG MARKETS, BLOOMBERG NEWS,
BLOOMBERG ANYWHERE, BLOOMBERG TRADEBOOK, BLOOMBERG TELEVISION, BLOOMBERG
RADIO, BLOOMBERG PRESS and BLOOMBERG.COM are trademarks and service marks of BFLP, a Delaware
limited partnership, or its subsidiaries. © 2016 Bloomberg Finance L.P. All rights reserved. This document and its
contents may not be forwarded or redistributed without the prior consent of Bloomberg.
Bloomberg Intelligence is a service provided by Bloomberg Finance L.P. and its affiliates. Bloomberg Intelligence
shall not constitute, nor be construed as, investment advice or investment recommendations (i.e., recommendations
as to whether or not to “buy”, “sell”, “hold”, or to enter or not to enter into any other transaction involving any
specific interest) or a recommendation as to an investment or other strategy. No aspect of the Bloomberg
Intelligence function is based on the consideration of a customer's individual circumstances. Bloomberg Intelligence
should not be considered as information sufficient upon which to base an investment decision. You should
determine on your own whether you agree with Bloomberg Intelligence.
Bloomberg Intelligence is offered where the necessary legal clearances have been obtained. Bloomberg Intelligence
should not be construed as tax or accounting advice or as a service designed to facilitate any Bloomberg Intelligence
subscriber's compliance with its tax, accounting, or other legal obligations. Employees involved in Bloomberg
Intelligence may hold positions in the securities analyzed or discussed on Bloomberg Intelligence.
32