
Blodgett Forest Research Station - UC Berkeley College of ... · Blodgett Forest Symposium,...
61
Blodgett Forest Symposium, February 26, 27, 28, 1999 - page 1 Blodgett Forest Blodgett Forest Research Station Research Station CENTER FOR FORESTRY CENTER FOR FORESTRY College of Natural Resources College of Natural Resources 1999 RESEARCH SYMPOSIUM 1999 RESEARCH SYMPOSIUM February 26, 27, 28
Transcript of Blodgett Forest Research Station - UC Berkeley College of ... · Blodgett Forest Symposium,...
Blodgett Forest Symposium, February 26, 27, 28, 1999 - page 1
Blodgett ForestBlodgett Forest
Research StationResearch Station
CENTER FOR FORESTRYCENTER FOR FORESTRY
College of Natural ResourcesCollege of Natural Resources
1999 RESEARCH SYMPOSIUM1999 RESEARCH SYMPOSIUM
February 26, 27, 28

Blodgett Forest Symposium, February 26, 27, 28, 1999 - page 2
The Center for Forestry provides leadership in the development of basic scientific understanding ofecosystem process, human interactions and value systems, and management and silvicultural practices
that ensure the sustainability of forest land.
The Center pulls together interdisciplinary teams of campus faculty, Cooperative Extension specialistsand advisors, and staff from various agencies and organizations to develop research projects, outreach
and public education activities, and policy analysis on issues affecting California’s forest lands..
The Center for Forestry manages five research forest properties: Blodgett Forest (El Dorado County);Forestry Summer Camp/Baker Forest (Plumas County); Whitaker’s Forest (Tulare County); Howard
Forest (Mendocino County); and Russell Tree Farm (Contra Costa County). These offer field locationsand facilities (lodging, meeting rooms) for research and workshops on forestry issues.
145 Mulford Hall, #163Berkeley, CA 94720-3114
(510) 642-0095e-mail: forestry@nature. berkeley.edu ---- http://nature. berkeley.edu/forestry
Blodgett Forest is a 4,400 acre field research station located in the American River watershed on thewestern slope of the central Sierra Nevada.
Blodgett’s primary objective is to provide a location for research in forestry and related wildlandresources by students and faculty. The secondary objective is to utilize forest research activities andfacilities to demonstrate forest management practices and to transfer knowledge via graduate and
undergraduate instruction and public and professional natural resource education programs.
Blodgett facilities include housing for 48 people, office and meeting rooms for up to 100, a wood andmachine shop, and laboratory space. The forest is accessible throughout the year via 37 miles of roads.
Ongoing research aims to provide knowledge to improve management of young growth mixedconifer/oak forests, in such a manner that basic air, water, soil and biological resources are conserved.
Management practices are designed to maintain and improve wood production, beneficial uses of water,wildlife habitat, visual quality, forage for livestock and recreation potential.
4501 Blodgett Forest RoadGeorgetown, CA 95634
(530) 333-4475e-mail: [email protected]
University of University of californiacalifornia, , berkeleyberkeley
college of natural resourcescollege of natural resources
center for forestrycenter for forestry
blodgett blodgett forest research stationforest research station
Blodgett Forest Symposium, February 26, 27, 28, 1999 - page 3
CO-ORDINATORS JOHN J. BATTLES ALLEN H. GOLDSTEIN
Assistant Professor Assistant Professor Forest Community Ecology Biogeochemistry
ABSTRACT PRESENTATIONS

Blodgett Forest Symposium, February 26, 27, 28, 1999 - page 4
ABSTRACT PRESENTATIONS 1999 Blodgett Forest Research Symposium
Table of Contents
BAKER, Bradly, Alex Guenther, James Greenberg, Allen Goldstein, Ray Fall “Canopy fluxes of 2-methyl-3-buten-2-ol over a ponderosa pine forest: field data and model comparison.”...........................Pg. 7 BARRETT, Reginald H. “Long-term monitoring of wildlife at Blodgett Forest.”
................................................Pg. 9 BATTLES, John J. “The ecological relevance of light signaling among neighboring trees—a field test.”
................................................Pg. 10 BAUER, M.R., A. H. Goldstein, J. Panek. N.E. Hultman “A comparison of ozone deposition to a ponderosa pine plantation in 1997 and 1998.”
................................................Pg. 12 BONELLO, Pierluigi, Thomas R. Gordon, Werner Heller, Andrew J. Storer, David L. Wood, and Heinrich Sandermann, Jr. “Chemical Aspects of Root Rot-Ponderosa Pine-Bark Beetle Interactions.”
................................................Pg. 14 CADE-MENUN, B. J., J. G. McColl, R.L. Edmonds and E. Grienke “Soil P in Douglas-fir and cedar stands of California and Washington.”
................................................Pg. 15 DAHLSTEN, D. L., W.A. Copper, and D.L. Rowney “The Use of Nest Boxes to Study Chestnut-backed and Mountain Chickadee Interactions at Blodgett Forest.” ............................Pg. 16 DAY, Douglas A., and Ronald C. Cohen “NOy detection by thermal decomposition with Laser Induced Fluorescence.”
................................................Pg. 17 DEL ROSARIO, Rosalie, and Vincent Resh “Effects of Cow Manure Inputs on Aquatic Invertebrate Communities in Forested Sierra Nevada Streams.”..............................Pg. 18

Blodgett Forest Symposium, February 26, 27, 28, 1999 - page 5
DILLON, Michael B., Joel A. Thornton, Paul J. Wooldridge, and Ronald C. Cohen “The Climatology of NOx and NOy at Blodgett Forest in the Summer of 1998.”
................................................Pg. 19 GOLDSTEIN, A. H., M.R. Bauer, J.M. Fracheboud, N. Hultman, M.S. Lamanna “Biosphere-Atmosphere exchange of trace gases above a ponderosa pine plantation in the Sierra Nevada: Effects of seasonal drought stress on the carbon dioxide, water, and sensible heat fluxes.” .........................Pg. 20 GOMEZ G., A. “Effects of Soil Compaction and Forest Floor Removal on the Initial Growth of Ponderosa pine.”................................Pg. 22 GONG, Peng, Ruiliang Pu and Bing Xu “Hyperspectral Data Analysis for Conifer Species Recognition.”
................................................Pg. 24 GREINKE, Emily E. Y., J.G. McColl, R.L. Edmonds, and B.J. Cade-Menun “An assessment of ecological site factors relevant to nutrient cycling in mixed conifer forest in California and Washington.” Pg. 27 HART, Stephen C. “Long-term decomposition of forest detritus in a Mediterranean-type climate.”
................................................Pg. 28
HEALD, Robert C., Tara M. Barrett “Effects of planting density on early growth of giant sequoia (Sequoidendron giganteum).”
................................................Pg. 29
HULTMAN, N.E., A.H. Goldstein, M.R. Bauer, J-M Fracheboud, J.A. Panek “Influences of climate and hydrology on inter-annual variations in carbon uptake by a ponderosa pine ecosystem.”..............Pg. 31 LAMANNA, Mark S., and Allen H. Goldstein “In-situ measurements of C2-C10 VOCs and OVOCs above a Sierra-Nevada ponderosa pine plantation.”..................................Pg. 33 LEVIN, Anna, and John Battles “Spatial trends in mycorrhizal recolonization on roots of ponderosa pine and Douglas-fir seedlings in cleared forest patches.”
................................................Pg. 34 LIBBY, W. J. “White Fir Genetic-Architecture Plantations.”
................................................Pg. 35 LIBBY, W. J., and Richard A. Broad “Evidence for Lasting Nursery Effects in Giant Sequoia.”
................................................Pg. 36 LIBBY, W. J., and Richard A. Broad

Blodgett Forest Symposium, February 26, 27, 28, 1999 - page 6
“Lack of Evidence for the Interaction of Giant Sequoia with Brush Cover.” ................................................Pg. 37
LIBBY, W. J., and Richard A. Broad “Relative Growth of Giant Sequoia and 5 Native Conifers in 3 Blodgett Plantations.”
................................................Pg. 38
MCNEE, William R., David L. Wood, Pierluigi Bonello, Andrew J. Storer, and Thomas R. Gordon “Detection of Diseased Hosts by Pine Bark Beetles (Coleoptera: Scolytidae): Gustatory Stimuli.” ..............................................Pg. 39 PANEK, J. A., and A.H. Goldstein “A controlled field experiment on the relation between drought stress, photosynthesis and stomatal conductance: Implications for carbon storage and ozone deposition.”
................................................Pg. 40
PAZ, Lucas “Soil-Water Characteristics Following Forest Removal and Mechanized Soil Disturbance: The Relative Influence of Organic Residue and Soil Compaction on Permeability and Moisture Capacity.”
................................................Pg. 42 POWERS, Robert F. “North American LTSP Research, Blodgett Installation.”
................................................Pg. 43 POWERS, Robert F. “Giant Sequoia Spacing X Nutrition Study.”
................................................Pg. 45 PU, Ruiliang, Peng Gong, and Bob Heald “In Situ Hyperspectral Data Analysis for Nutrient Estimation of Giant Sequoia.”
................................................Pg. 47 SCHADE, Gunnar W., Allen H. Goldstein, Mark S. Lamanna, and Nathan Hultman “Monoterpene concentrations and emissions above a ponderosa pine plantation: Substantial increases following rain events.” Pg. 52 SHLISKY, Ayn, John Battles, Reginald Barrett, Robert Heald, and Barbara Allen-Diaz “The effects of forest management on plant species diversity in the mixed conifer forests of the Sierra Nevada.”........................Pg. 54 STORER, Andrew J., David L. Wood, Pierluigi Bonello, William R. McNee, and Thomas R. Gordon “Detection of Diseased Hosts by Pine Bark Beetles (Coleoptera: Scolytidae): Olfactory Stimuli.” ..............................................Pg. 56 THORNTON, Joel A., Paul J. Wooldridge, Michael B. Dillon, and Ronald C. Cohen “Ozone Production over a Ponderosa Pine Plantation at Blodgett Forest, CA.”
................................................pg. 57

Blodgett Forest Symposium, February 26, 27, 28, 1999 - page 7
WALKER, Cameron, John Battles, and Robert Heald “Crown architecture and light-use efficiency of planted giant sequoia (Sequoiadendron giganteum).” .......................................Pg. 58 WOOLDRIDGE, Paul, Joel Thornton and Ron Cohen “Nitrogen dioxide measurement by Laser Induced Fluorescence: Implementation in 1998 and potential for eddy-correlation flux measurements in 1999.”
................................................Pg. 59
XU, Ming “How much CO2 was emitted from the stems in a young ponderosa pine plantation?”
................................................Pg. 60

Blodgett Forest Symposium, February 26, 27, 28, 1999 - page 8
TITLE: Canopy fluxes of 2-methyl-3-buten-2-ol over a ponderosa pine forest: Field data and model comparison AUTHORS: Bradly Baker, Alex Guenther, James Greenberg, Allen Goldstein, and Ray Fall ADDRESS OF LEAD AUTHOR: National Center for Atmospheric Research 1850 Table Mesa Dr. Boulder, CO 80303. [email protected]
Abstract. The compound 2-methyl-3-buten-2-ol (MBO) has been identified as the predominant biogenically produced volatile organic hydrocarbon (VOC) in some areas of the western U.S. [Goldan et al., 1993, Harley et al., 1998, Lamanna and Goldstein, in prep]. In this study, canopy level flux measurement of MBO were made over an 8 year old ponderosa pine plantation in the Sierra Nevada range of California using the relaxed eddy accumulation method [Businger and Oncley, 1990]. Fluxes peaked in late afternoon (1600), at an average rate of 1.06 mg C/m2 hr. This corresponds to the time of peak temperatures. MBO fluxes were strongly correlated with both temperature and photosynthetically active radiation (PAR) (Fig. 1). Model calculations of MBO flux from this site using a model developed for isoprene [Guenther et al., 1995, Guenther, 1997] provide an accurate simulation of the diurnal emissions pattern, but overestimate the measured flux by a factor of two (Fig. 2). Discrepancies between the measurements and the model predictions are likely due to the uncertainties in choosing model inputs. These results indicate a significant flux of reactive carbon in the western U.S. where MBO-emitting pines are the dominant forest vegetation.

Blodgett Forest Symposium, February 26, 27, 28, 1999 - page 9
-0.200
0.000
0.200
0.400
0.600
0.800
1.000
1.200
1.400
1.600
100
200
300
400
500
600
700
800
900
1000
1100
1200
1300
1400
1500
1600
1700
1800
1900
2000
2100
2200
2300
2400
measured MBO flux
14.0
16.0
18.0
20.0
22.0
24.0
26.0
28.0
30.0
-500
0
500
1000
1500
2000temperature PAR
Time of day
Mea
sure
d M
BO
flux
(mg
C/m
2 h)
PAR
(µm
ol/m
2 h)
Tem
pera
ture
(o C
)
A
B
Figure 1. (A) Hourly averaged MBO fluxes measured by REA. Vertical bars representone standard deviation of the measurements, or the day to day variation of the flux. (B)Temperature and PAR measurements corresponding to the same times as when MBO fluxmeasurements were taken.
-0.500
0.000
0.500
1.000
1.500
2.000
100
200
300
400
500
600
700
800
900
1000
1100
1200
1300
1400
1500
1600
1700
1800
1900
2000
2100
2200
2300
2400
measured model
Time of day
MB
O fl
ux (m
g C
/m2 h
)
Figure 2. Comparison of model results and measured data for fluxes of MBO at the BlodgettForest site. Model results overestimate the measurements by nearly a factor of two.
Blodgett Forest Symposium, February 26, 27, 28, 1999 - page 10
TITLE: Long Term Monitoring of wildlife at Blodgett Forest AUTHOR: Reginald H. Barrett ADDRESS OF LEAD AUTHOR: Professor of Wildlife Ecology and Management Department of Environmental Science, Policy and Management University of California, Berkeley 151 Hilgard Hall, Berkeley, CA 94720-3114 (510) 642-7261 [email protected]
Abstract.
I began developing a wildlife monitoring program for use in any terrestrial habitat in 1977 with Dan Airola, an M.S. student (Airola 1979, Airola and Barrett 1981, Airola and Barrett 1985). Another M.S. student, Mark Dedon helped complete the sampling protocol (Dedon 1982, Dedon and Barrett 1982, Dedon, Laymon and Barrett 1986). For most of the 21 years between 1977 and 1998, funds have been available to field a two-person crew at Blodgett. This effort allows 40 continuous forest inventory (CFI) plots to be sampled each summer. More recent students include Cohen (1982) and Bise (1998). A total of over 800 samples has been amassed at Blodgett through 1998. All results are available in a Microsoft Access data base developed by Irene Timossi.
Monitoring of wildlife will continue as long as funding is available. The data resulting from this work is interesting for at least two reasons. First, as the property is opened up by periodic timber harvest we can confirm changes in the overall wildlife community using the area. For example, California ground squirrels and brown-headed cowbirds have increased as more land is cleared. Second, the data can be used to test the California Wildlife Habitat Relationships (CWHR) System maintained by the California Department of Fish and Game (Laymon and Barrett 1986). There is also great opportunity for more autecological studies of the 128 species of terrestrial vertebrates known to inhabit Blodgett, similar to the work by Roger Harris (1979) on pileated woodpeckers and Steve Laymon (1988) on spotted owls (Laymon, Salwasser and Barrett 1985).

Blodgett Forest Symposium, February 26, 27, 28, 1999 - page 11
TITLE: The ecological relevance of light signaling among neighboring trees – a field test. AUTHOR: John J. Battles ADDRESS OF LEAD AUTHOR: Asst Prof. of Forest Community Ecology University of California, Berkeley Department of Environmental Science, Policy and Management 151 Hilgard Hall Berkeley, CA 94720-3110 (510) 643-0684 lab: (510) 643-2450 [email protected]
Abstract.
Recently, plant physiologists have described a mechanism whereby plants can perceive an early-warning of impending competition. Cued by a reduction in the ratio of red to far-red wavelengths (R:FR) in light reflected from the leaves of neighbors, many plants exhibit characteristic morphological responses to shading such as stem elongation, increased apical dominance and greater carbon allocation to shoots.
Since the information is received before the plant is actually shaded, this information-driven plasticity could confer a competitive advantage. The ability to respond to neighbors could be especially important for long-lived perennials, like forest trees, that depend on gaining unobstructed access to light to complete their life cycle.
In 1997, I started a field test of this hypothesis in a mature mixed conifer stand at Blodgett Forest. An initial question was: Are reliable signals present in the mixed conifer forest? Towards this end, I established a 1 ha plot in Compartment 220. The plot was gridded with 36 evenly spaced (20 m apart) points. To estimate incident light, hemispherical photographs of the canopy were taken at 1-m height at each grid point. I used a portable spectroradiometer (LI 1800, Li-Cor, Inc.) to characterize the spectral distribution of light at the 16 points of an interior subplot. I measured the R:FR of vertically propagated light arriving from above the point and compared it to the R:FR of horizontally propagated light originating north of the point. The R:FR of the clear sky on these sampling days was 1.1. R:FR values < 0.8 are considered signals of shadelight.
While the parameters of the light climate vary in terms of both light quantity (Fig. 1) and quality (Fig.2), there are points that meet the signal criteria to generate a shade avoidance response. Specifically there are points that receive sufficient photosynthetically active radiation with a corresponding vertical light quality typical of no overhead shade (R:FR > 0.8) but with reflected horizontal light quality indicative of impending shade (R:FR < 0.8).
Douglas-fir (Pseudotsuga mesziesii) seedlings. Tree Physiology 17: 161-168.

Blodgett Forest Symposium, February 26, 27, 28, 1999 - page 12

Blodgett Forest Symposium, February 26, 27, 28, 1999 - page 13
TITLE: A Comparison of Ozone Deposition to a Ponderosa Pine Plantation in 1997 and 1998 AUTHORS: M.R. Bauer, A.H. Goldstein, J. Panek, N.E. Hultman ADDRESS OF LEAD AUTHOR: Meredith Bauer 151 Hilgard Hall ESPM University of California Berkeley, CA 94720-3110 [email protected] ABSTRACT: The Sierra Nevada Mountains receive pollutant-laden air from the Central Valley in California. At concentrations often measured in the Sierra Nevada Mountains, ozone is known to be toxic to plants; specifically, within the Sierra Nevada Ecosystem, ponderosa pine is known to be one of the most sensitive species to ozone stress. To assess the factors controlling ozone deposition to the forest and to study the forest response, we established a research site in a ponderosa pine plantation approximately 45 miles northeast of Sacramento. The site is affected by a strong diurnal ozone pattern with high concentrations in upslope flow during the day and lower concentrations during downslope flow at night. Ponderosa pine is among the dominant tree species in the Sierra Nevada, thus the measurements at this site should be relevant for the larger regional ecosystem. From June to September 1997 and May to November 1998 we continuously measured O3, CO2, and H2O concentrations and O3, CO2, and H2O fluxes by eddy correlation. Environmental parameters such as wind direction and speed, air temperature and moisture, net and photosynthetically-active radiation, soil temperature and moisture, and pine needle temperature were also monitored. We calculated ozone deposition velocity by dividing ozone flux by ozone concentration and found that ozone deposition velocity is strongly controlled by canopy conductance, which is in turn controlled by soil moisture, vapor pressure deficit, air temperature, and photosynthetically-active radiation. In the 1998 El Niño year, air temperature was lower than in 1997, lagging temperatures observed in 1997 by about 4 weeks. Corresponding to this 4 week temperature offset, needle growth in 1998 lagged needle growth in 1997 by 4 weeks. The delay in needle growth in 1998 caused canopy conductance and thus ozone deposition velocity to be lower early in the season than it had been in 1997. Once the needles elongated, factors such as soil moisture, vapor pressure deficit, and air temperature became important controls on plant activity and ozone deposition velocity. In 1998 soil moisture started at a much higher level – 28% on day 177 – and decreased to 12% by day 250. In contrast, soil moisture in 1997 started at 13% on day 177 and decreased to 10% by day 250. The soil was much drier in 1997 than in 1998. The effect of drier soil in 1997 was two-fold: (1) to cause the trees to decrease activity earlier in the season, and (2) to allow vapor pressure deficit to play a more prominent role in ozone deposition. It was not until very late in the season in 1998 that vapor pressure influenced ozone deposition. Thus El Niño caused low temperatures early in the season that delayed needle elongation and thereby caused decreased ozone deposition to the ecosystem early in the season as well as the peak ozone deposition to occur 4 weeks later in 1998 than in 1997. In addition, the increased amount of precipitation and prolonged rainy season caused higher soil moisture. The plants remained active later in

Blodgett Forest Symposium, February 26, 27, 28, 1999 - page 14
the season, allowing high ozone deposition in later summer, and did not show a strong response to vapor pressure deficit. Overall, ozone deposition to the forest in 1997 for days 155 to 250 was 73.1 mmol/m2. In 1998 the cumulative ozone deposition for this period was 74.6 mmol/m2; therefore ozone deposition for both years was similar even though the pattern of ozone deposition differed. Figure 1: Ozone Deposition Velocity for 1997 and 1998
Day of Year
O3
Vd
(cm
/s)
150 200 250
0.0
0.2
0.4
0.6
0.8
1.0
1.2
Blodgett Forest - Daytime Mean Values (9-15 hours)
19971998
Day of Year
O3
Vd
(cm
/s)
150 200 250
0.0
0.2
0.4
0.6
0.8
1.0
1.2
Blodgett Forest - Daytime Mean Values (9-15 hours)
19971998

Blodgett Forest Symposium, February 26, 27, 28, 1999 - page 15
Title: Chemical Aspects of Root Rot-Ponderosa Pine-Bark Beetle Interactions Authors: Pierluigi Bonello, Thomas R. Gordon, Werner Heller, Andrew J. Storer, David L. Wood and Heinrich Sandermann, Jr. Address of Lead Author: Dept. of Plant Pathology University of California, Davis 1 Shields Ave. Davis, CA 95616-8680 (530) 754-7634 US Fax: (530) 752-5674 [email protected] Abstract: In a search for putative chemical cues used by phytophagous insects to locate suitable feeding and breeding substrate, attention must be paid to the physiological status of the host plant. With forest coniferous trees it has long been assumed, and repeatedly observed, that bark beetles preferentially infest stressed trees, particularly when they are affected by pathogens. However, little is known with regard to the underlying chemical relations between these different taxa that might explain this phenomenon. Here we describe some systemic chemical changes observed in ponderosa pine in response to infection by the root rot pathogen Heterobasidion annosum that might influence bark beetle behavior. In particular, we report an increase in the concentration of the soluble phenolic derivative ferulic acid glucoside in the phloem of infected trees, as well as an apparent increase in the rate of ethylene evolution from the foliage of the same trees. These changes are discussed with respect to possible effects on bark beetle behavior.

Blodgett Forest Symposium, February 26, 27, 28, 1999 - page 16
Title: Soil P in Douglas-fir and cedar stands of California and Washington Authors: B.J. Cade-Menun, J. G. McColl, R.L. Edmonds and E. Greinke Address of lead author: Barbara Cade-Menun ESPM Dept., ES Div. 151 Hilgard Hall #3110 Berkeley, CA 94720-3110 (510) 643-6088 [email protected] Abstract:
Forest soils in regions with high rainfall and cooler temperatures, such as the Pacific Northwest, often have more complex P forms than drier, warmer regions. This suggests that climate may control soil P. Therefore the purpose of this study was to determine the influence of climate on soil P, using forests from two climatic regions. The California sites were located at Blodgett Research Forest and near Challenge, CA; the Washington sites were on the Olympic Peninsula near Forks, WA. At each location, two forest types with different growth requirements and mycorrhizae were sampled: ectomycorrhizal Douglas-fir, which grows in both California and Washington, and arbuscular mycorrhizal cedar (incense cedar in California and western red cedar in Washington.). Samples were collected in July and October 1997 and January and April 1998, and were analyzed for moisture content, pH, available P, total P, organic P, total C, and total N. Some Douglas-fir samples were also analyzed using 31P-NMR spectroscopy. Results show that the California sites had wider temperature fluctuations, higher soil pH, and lower moisture. Significant differences in soil P under Douglas-fir and cedar were observed in Washington but not in California, probably because of the mixed species stands in California. Preliminary 31P-NMR spectra for Douglas-fir indicate that spectra from California and Washington look similar, with P in relatively simple forms. These results suggest that climate may not be the most important factor controlling soil P; tree species and mycorrhizae may also influence soil P forms.

Blodgett Forest Symposium, February 26, 27, 28, 1999 - page 17
Title: The Use of Nest Boxes to Study Chestnut-backed and Mountain Chickadee Interactions at Blodgett Forest AUTHORS: D.L. Dahlsten, W.A. Copper, and D.L. Rowney ADDRESS OF LEAD AUTHOR: Center for Biological Control 201 Wellman Hall University of California-Berkeley Berkeley, California 94720-3112 [email protected] Abstract: The chestnut-backed chickadee has expanded its range into the central Sierra Nevada in the last 50 years and now interacts with a closely related species at Blodgett Forest, the mountain chickadee. With the use of nest boxes in different compartments we have studied these two species to look at differences in their diet and nesting requirements. During the breeding season the chestnut-backed chickadee used nest boxes in stands with greater canopy closure and higher densities of incense cedar than the mountain chickadee. Foraging analysis showed the showed the chestnut-backed to make relatively greater use of Douglas-fir, black oak and incense than the mountain chickadee. Differences in foraging behavior were also recorded between the two species. Clutch size, date of first egg, egg and nestling mortality, and other biological attributes are compared for the two species at Blodgett over a 20 year period and these data are also compared with a coastal population of chestnut-backs. Nest construction differences between the two species are discussed. Measurements of the tail, tarsus, nare, and wing showed significant differences between Sierra and coastal populations of chestnut-backed chickadees.

Blodgett Forest Symposium, February 26, 27, 28, 1999 - page 18
Title: NOy detection by thermal decomposition with Laser Induced Fluorescence AUTHORS: Douglas A. Day and Ronald C. Cohen ADDRESS OF LEAD AUTHOR: University of California, Berkeley Department of Chemistry, Berkeley, CA 94720 [email protected] Abstract:
Nitrogen oxide radicals (NOx = NO + NO2) are important in regulating tropospheric ozone. Outside of urban source regions, NOx is stored in reservoirs (known as NOy ) that include N2O5, HNO3, peroxynitrates (RO2NO2), and alkylnitrates (RNO3). Formation of these species terminates the catalytic cycles that produce ozone via oxidation of NO to NO2. The reservoirs are then deposited to the Earth’s surface or transported out of the formation region to the remote atmosphere, where NOx can be released photochemically to restart the catalytic production of ozone. Increases in export of NOx to the remote atmosphere is thought to be responsible for the three-fold increase in tropospheric ozone that has occurred since pre-industrial times. A detailed knowledge of the concentration of these reservoirs is necessary in order to test the accuracy of our understanding of NOx photochemistry and to predict the effects of regional scale processes, such as those occurring at Blodgett Forest, on local and on global ozone concentrations. However, there are currently no techniques capable of rapid, precise and accurate observation of all of the NOy species.
We have developed a prototype instrument that uses a new approach to obtain in situ observations of the concentrations of the four major NOy reservoirs with high accuracy, precision and sensitivity (15ppt/10 seconds). In our instrument, ambient air passes through a heated quartz tube where the NOy species are thermally dissociated to produce NO2 which is then detected by laser induced fluorescence. Each of the four categories of NOy reservoirs decompose at different temperature. We propose to measure the abundance of the sum of compounds corresponding to each category by varying the temperature in the dissociation region. This technique will be employed at Blodgett Forest in the summer of 1999 to demonstrate its capabilities for autonomous, continuous observation of an array of NOy species. We expect results from these measurements to enhance our understanding of the speciation of NOy at this site and to improve our understanding of the role of various NOy species on ozone formation at the regional and global scales.

Blodgett Forest Symposium, February 26, 27, 28, 1999 - page 19
TITLE: Effects of Cow Manure Inputs on Aquatic Invertebrate Communities in Forested Sierra Nevada Streams AUTHORS: Rosalie del Rosario and Vincent Resh ADDRESS OF LEAD AUTHOR: University of California, Berkeley Department of Environmental Science, Policy and Management Division of Insect Biology 201 Wellman Hall Berkeley, CA 94720-3112 (510) 642-5913 [email protected]
Abstract.
We are examining reach-scale responses of a detritivore-dominated aquatic invertebrate community to organic matter and nutrient enrichment from cow manure (pats) directly deposited in forested streams. Our research poses two general questions: 1) What are the reach-scale effects of different densities of pats directly deposited in nutrient-limited headwater streams on the composition and function of the aquatic invertebrate community? and 2) How extensive are these effects in terms of both temporal and spatial boundaries? We introduced isotopically-labelled pats to streams in order to separate the effects of in-stream pat deposition from other disturbance effects caused by cattle grazing, such as stream bank erosion, reduced riparian vegetation, urination, and physical disturbance to the stream bed. The first year of the study is examining the responses of the aquatic invertebrate community to a single in-stream input of cow manure that simulates light grazing intensity. The second year of the study will examine responses to a continuous presence of manure from weekly inputs for 8 weeks that simulates heavy grazing intensity. We are testing our hypotheses using a randomized complete block design in four first-order streams. Data (invertebrate abundance and biomass, nutrient concentrations, periphyton and algal biomass, and carbon isotope rations) from each sampling time (48 hrs, 2 wk., 4 wk., 8 wk.) will be analyzed using analysis of variance models for complete block designs and distance effects will be analyzed with linear regression.
Other ongoing projects at Blodgett include: examining annual variability in invertebrate community composition for which we have collected four years of annual data for the six streams in Blodgett, and comparing multivariate and multimetric approaches to biological monitoring of streams using benthic macroinvertebrates.

Blodgett Forest Symposium, February 26, 27, 28, 1999 - page 20
Title: The Climatology of NOx and NOy at Blodgett Forest in the Summer of 1998 Authors: Michael B. Dillon, Joel A. Thorton, Paul J. Woolridge, and Ronald C. Cohen Address of Lead Author: University of California, Berkeley Department of Chemistry Berkeley, CA 94720 Abstract: In-situ measurements of NO, NO2, NOy , and O3 were made at Blodgett Forest during the summer and fall of 1998. The NOx (NOx ≡ NO + NO2) and NOy (all reactive nitrogen species) measurements exhibit a relatively regular minimum in the morning and a maximum in the early evening. NOy typically peaks at 3 ppb around sunset (coincident with the peak in ozone measured by the Goldstein group) after which there was a smooth decay until 10 am (NOy = 1 ppb) when the concentration rose again. NOx also peaked later in the day (NOx = 0.8 ppb) , right at sunset, and declined to NOx = 0.1 ppb before increasing again, also at 10 AM . We speculate that this pattern in NOy and O3 is caused by two factors. The first is the transport of polluted air originating from the Sacramento area via upslope winds during the day. This air has its maximum influence at Blodgett Forest in the late afternoon/early evening before the nightly cooling of the mountains causes the wind direction at Blodgett Forest to reverse and introduce relatively clean free tropospheric air to our site. The second factor is the photochemical interaction of the NOx in this air with locally emitted biogenic hydrocarbons. Ozone correlates with NOx and NOy since ozone is a long lived species produced by radical catalytic cycles utilizing NOx and fueled by hydrocarbons and solar radiation. The high local hydrocarbon levels cause ozone levels at Blodgett Forest (typically 50 - 80 ppb from July to September 1998 [Goldstein]) to be higher than Sacramento (typically 20 - 50 ppb from June to October in 1994, 1995, and 1996 [California Air Resource Board]).

Blodgett Forest Symposium, February 26, 27, 28, 1999 - page 21
Title: Biosphere-Atmosphere exchange of trace gases above a ponderosa pine plantation in the Sierra Nevada: Effects of seasonal drought stress on the carbon dioxide, water, and sensible heat fluxes. Authors: A.H. Goldstein, M.R. Bauer, J.M. Fracheboud, N. Hultman, M.S. Lamanna, J.A. Panek, and G.W. Schade. Address of lead author: University of California at Berkeley Department of Environmental Science, Policy, & Management Ecosystem Sciences Division 151 Hilgard Hall Berkeley, CA 94720-3110 [email protected] Abstract:
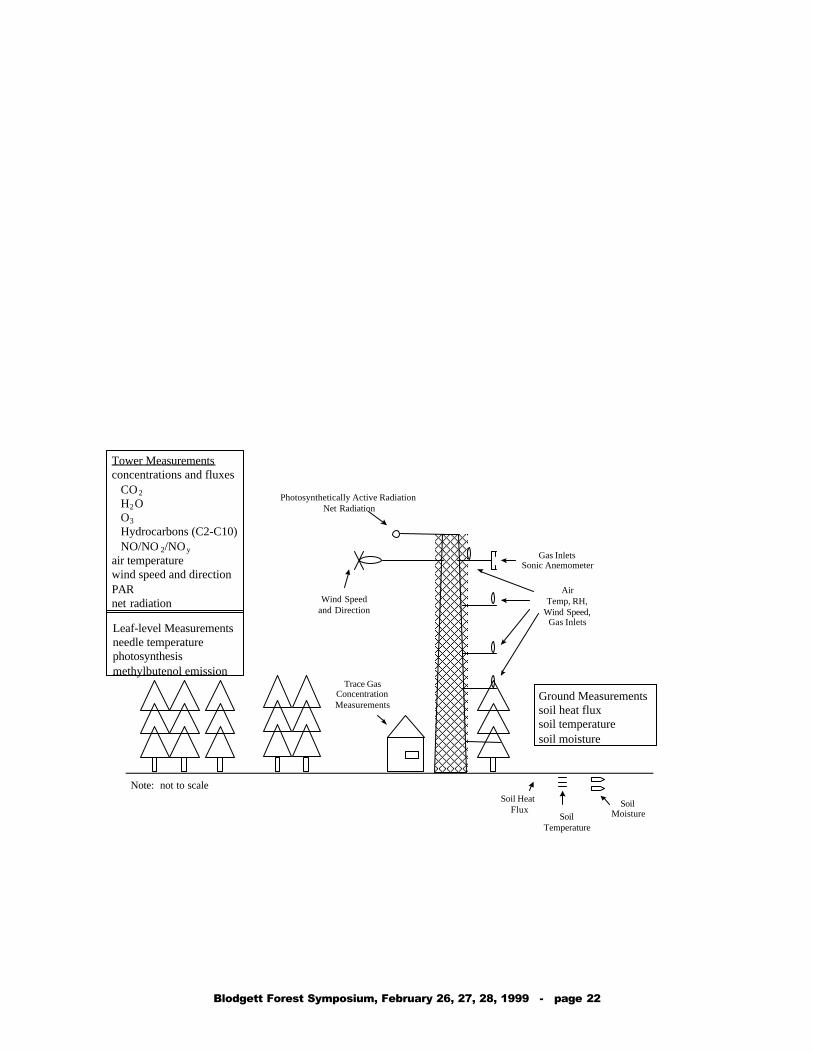
We have established a measurement site in a ponderosa pine plantation to study the exchange of radiatively and chemically active trace gases between the forest and the atmosphere. The site is located next to Blodgett Forest, on land owned by Sierra Pacific Industries, with infrastructure including a tower, temperature controlled instrument building, and an electrical generation system (Figure 1). This talk will broadly introduce the overall goals of the project including quantifying and understanding the processes controlling fluxes of CO2, H2O, O3, sensible heat, and biogenic hydrocarbons, quantifying the effects of climate variability and management practices on these processes, and understanding the influence of biogenic hydrocarbon emissions on regional atmospheric chemistry. The remainder of the talk will focus on effects of seasonal drought stress on canopy scale stomatal conductance, CO2 flux and energy fluxes observed from June 2 through September 10, 1997 (days 153-252). Fluxes of CO2, H2O and sensible heat were measured continuously through this period by eddy covariance, along with a suite of meteorological and environmental variables. During the measurement period, continuously increasing drought stress occurred. Since the net radiation input was fairly constant over the measurement period, the major parameters influencing changes in forest physiological function were changes in soil water content and vapor pressure deficit (VPD). In general, the magnitude of canopy conductance, CO2 and H2O fluxes decreased with decreasing soil moisture content, while sensible heat flux increased. As weather fronts with different air temperature and humidity passed through the site, the rate of CO2 uptake was inversely proportional to VPD and directly proportional to conductance. An extremely high heat and VPD event which occurred over three days (218-221) dramatically altered the physiological function of the ecosystem, creating a step change in the relationship between conductance and VPD and in turn decreasing rates of carbon uptake and evapotranspiration. We conclude that VPD and soil moisture are the strongest controllers of canopy conductance in this system, which then regulates water loss and CO2 uptake. Furthermore, the net carbon balance of Mediterranean type pine ecosystems is very sensitive to extreme heat events and could be dramatically altered by changing the climate or hydrologic regime.
Figure 1 - Goldstein et al.
Blodgett Forest Symposium, February 26, 27, 28, 1999 - page 22
Note: not to scale
Tower Measurementsconcentrations and fluxes CO2 H2O O3
Hydrocarbons (C2-C10)NO/NO 2/NOy
air temperaturewind speed and directionPARnet radiation
Ground Measurementssoil heat fluxsoil temperaturesoil moisture
Soil HeatFlux
SoilTemperature
SoilMoisture
Gas InletsSonic Anemometer
Trace GasConcentrationMeasurements
Wind Speedand Direction
Photosynthetically Active RadiationNet Radiation
Leaf-level Measurementsneedle temperaturephotosynthesismethylbutenol emission
AirTemp, RH,
Wind Speed,Gas Inlets

Blodgett Forest Symposium, February 26, 27, 28, 1999 - page 23
Title: Effects of Soil Compaction and Forest Floor Removal on the Initial Growth of Ponderosa pine. Authors: A. Gomez G., M. J. Singer, R. F. Powers and W. R. Horwath Address of Lead Author: University of California, Davis CP-CONACYT Mex. (530) 752-6081 [email protected] Abstract:
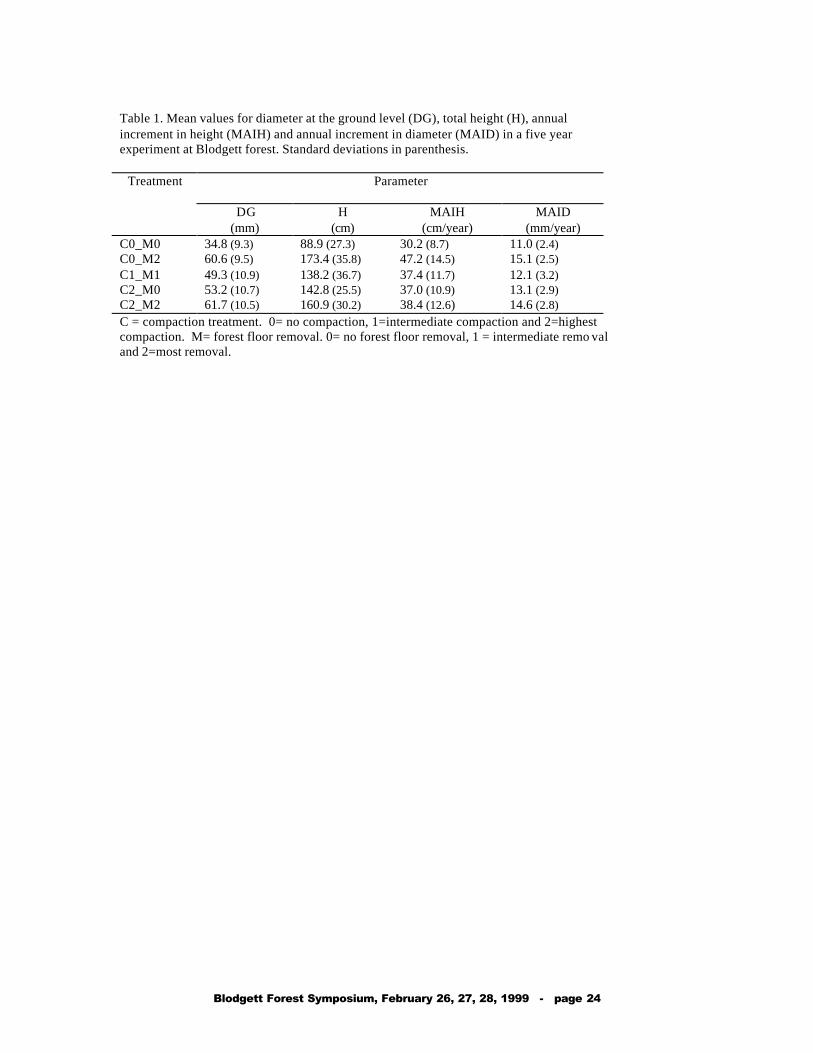
Since 1989, the US Forest Service has established a series of long-term experiments across the United States to determine the impact of compaction and forest floor removal on tree growth and health (Powers, 1991). In California, sites were established at the Challenge, Blodgett and Rogers forests. The treatments include no soil compaction, intermediate and high levels of soil compaction and three levels of forest floor removal including removal of boles only; boles and crown; and, boles, crown, and forest floor. Since 1996, we have been making tree and soil-based measurements at Blodgett on the four extreme and one intermediate treatments. Annual measurements of diameter at the ground level (BD) and total height (H) on individual trees were used as measures of treatment affect. Mean annual increment in height (MAIH) was greatest (47.2 cm/year) in the uncompacted and high forest floor removal treatment (Table 1). Mean annual increment in diameter (MAID) was higher in the no compaction and high forest floor removal treatment (15.1 mm/year) and in the highest compaction and forest floor removal treatment (14.6 mm/year) (Table 1). Under minimal disturbance (no soil compaction and lowest forest floor removal), MAIH and MAID were 30.2 cm/year and 11.0 mm/year, respectively. These data imply that for Blodgett, removal of the forest floor had more impact on these variables than the imposed levels of soil compaction. References: Powers R. F. 1991. P 70-81. In: Proceedings Management and productivity of western-montane forest soils. USDA For. Serv. Gen. Tech. Rep. INT-280.
Blodgett Forest Symposium, February 26, 27, 28, 1999 - page 24
Table 1. Mean values for diameter at the ground level (DG), total height (H), annual increment in height (MAIH) and annual increment in diameter (MAID) in a five year experiment at Blodgett forest. Standard deviations in parenthesis.
Treatment
Parameter
DG (mm)
H (cm)
MAIH (cm/year)
MAID (mm/year)
C0_M0 34.8 (9.3) 88.9 (27.3) 30.2 (8.7) 11.0 (2.4) C0_M2 60.6 (9.5) 173.4 (35.8) 47.2 (14.5) 15.1 (2.5) C1_M1 49.3 (10.9) 138.2 (36.7) 37.4 (11.7) 12.1 (3.2) C2_M0 53.2 (10.7) 142.8 (25.5) 37.0 (10.9) 13.1 (2.9) C2_M2 61.7 (10.5) 160.9 (30.2) 38.4 (12.6) 14.6 (2.8) C = compaction treatment. 0= no compaction, 1=intermediate compaction and 2=highest compaction. M= forest floor removal. 0= no forest floor removal, 1 = intermediate remo val and 2=most removal.

Blodgett Forest Symposium, February 26, 27, 28, 1999 - page 25
Title: Hyperspectral Data Analysis for Conifer Species Recognition Authors: Peng Gong, Ruiliang Pu and Bing Xu Address of Lead Author: Department of Environmental Science, Policy, and Management 151 Hilgard Hall University of California Berkeley, CA 94720-3110 USA Tel: (510) 642-5170 Fax: (510) 643-3490 [email protected]. edu Abstract:
Both biophysical and biochemical parameters, such as LAI, species, nitrogen content, are important variables for quantifying the energy and mass exchange characteristics of a terrestrial ecosystem. Use of traditional multispectral data (such as MSS, TM) is limited by the amount of spectral details for extracting these parameters. Hyperspectral data are very useful for estimating these parameters. Such data have dozens to hundreds of consecutive narrow spectral bands. Hyperspectral data characterize spectral signatures with sufficient spectral sampling to allow the unambiguous identification of certain ground targets and the quantitative analysis of subtle spectral change.
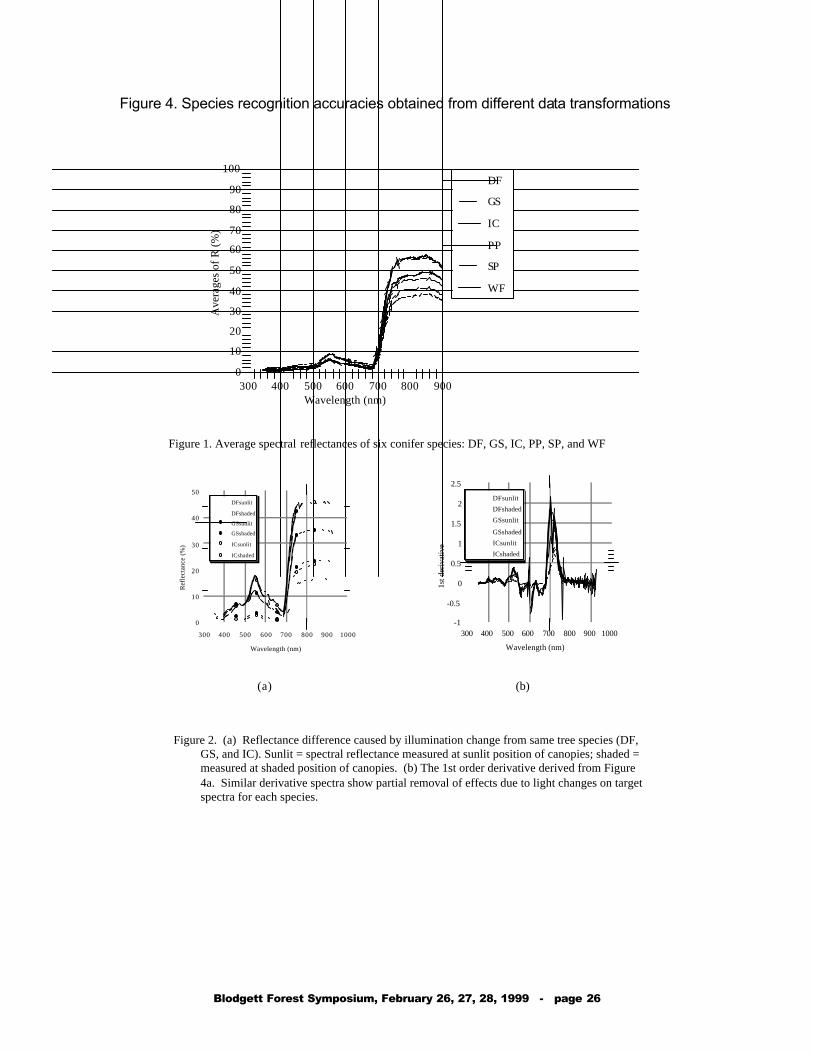
We used a spectrometer PSD1000 for taking hyperspectral measurements in the field, Blodgett Forest Research Station, the University of California, Berkeley, in 1996-1997. The spectral resolution is approximately 2.6 nm. It is controlled by a portable computer. In situ hyperspectral data were collected from six conifer species: Douglas fir (DF), Giant sequoia (GS), Incense cedar (IC), Ponderosa pine (PP), Sugar pine (SP), and White fir (WF). Different data transformation methods: derivative of original spectra(R), D(R), logarithm of R, LOG(R), normalized R, N(R), derivative of LOG(R), D(LOG(R)), logarithm of N(R), LOG(N(R)), and derivative of N(R), D(N(R)), and band aggregation were tested. An artificial neural network algorithm was employed to identify conifer species with the hyperspectral data. Results show that the hyperspectral data can be used to recognize conifer species that have similar spectral signatures, that derivative is an effective technique of transforming hyperspectral data, that neural network algorithm is a robust tool to identify conifer species with hyperspectral data, and that a band width of 20 nm or narrower is recommended for the recognition of the six conifer species. Figure 1. Present average spectral reflectances of six conifer species: DF, GS, IC, PP, SP, and WF. Figure 2a. Reflectance difference caused by illumination change from same tree species (DF, GS, and IC). Sunlit = spectral reflectance measured at sunlit position of canopies; shaded = measured at shaded position of canopies. Figure 2b. The 1st order derivative derived from Figure 2a. Similar derivative spectra show partial removal of effects due to light changes on target spectra for each species. Figure 3a. Species recognition accuracies obtained from the hyperspectral data as a function of band width (47-54 nm). Figure 3b. Obtained from derivative hyperspectral data as a function of band width (about 20 nm).
Blodgett Forest Symposium, February 26, 27, 28, 1999 - page 26
Figure 4. Species recognition accuracies obtained from different data transformations
0
10
20
30
40
50
60
70
80
90
100
300 400 500 600 700 800 900
Ave
rage
s of
R (%
)
Wavelength (nm)
DF
GS
IC
PP
SP
WF
Figure 1. Average spectral reflectances of six conifer species: DF, GS, IC, PP, SP, and WF
0
10
20
30
40
50
Ref
lect
ance
(%
)
300 400 500 600 700 800 900 1000
Wavelength (nm)
DFsunlit
DFshaded
GSsunlit
GSshaded
ICsunlit
ICshaded
-1
-0.5
0
0.5
1
1.5
2
2.5
1st d
eriv
ativ
e
300 400 500 600 700 800 900 1000
Wavelength (nm)
DFsunlit
DFshaded
GSsunlit
GSshaded
ICsunlit
ICshaded
(a) (b)
Figure 2. (a) Reflectance difference caused by illumination change from same tree species (DF,GS, and IC). Sunlit = spectral reflectance measured at sunlit position of canopies; shaded =measured at shaded position of canopies. (b) The 1st order derivative derived from Figure4a. Similar derivative spectra show partial removal of effects due to light changes on targetspectra for each species.

Blodgett Forest Symposium, February 26, 27, 28, 1999 - page 27
0
10
20
30
40
50
60
70
80
90
100
R
D(R
)
LO
G(R
)
N(R
)
D(L
OG
(R))
LO
G(N
(R))
D(N
(R))
Transformation
SunlitShadedOverall
Figure 4. Species recognition accuracies obtained from different data transformations
Acc
urac
y (%
)
3.4
6.8
10.2
13.6
17.0
20.5
23.9
27.3
30.7
34.1
40.9
47.7
54.6
68.2
95.5
136.
4
20.0
30.0
40.0
50.0
60.0
70.0
80.0
90.0
100.0
Acc
urac
y (%
)
Band Width (nm)
G-oct95
F-oct95
G-jun96
F-jun96
G-nov96
F-nov96
3.4
6.8
10.2
13.6
17.0
20.5
23.9
27.3
30.7
34.1
40.9
47.7
54.6
68.2
95.5
136.
420.0
30.0
40.0
50.0
60.0
70.0
80.0
90.0
100.0
Acc
urac
y (%
)
Band Width (nm)
G-oct95
F-oct95
G-jun96
F-jun96
G-nov96
F-nov96
(a)
(b)
Figure 3. (a) Species recognition accuracies obtained from the hyperspectral data as a function of band width (47-54 nm). (b) Obtained from derivative hyperspectral data as afunction of band width (about 20 nm).

Blodgett Forest Symposium, February 26, 27, 28, 1999 - page 28
Title: An assessment of ecological site factors relevant to nutrient cycling in mixed conifer forests in California and Washington Authors: Emily E.Y. Greinke, J.G. McColl, R.L. Edmonds, and B.J. Cade-Menun Address of lead author: Department of Environmental Science, Policy and Management 151 Hilgard Hall #3110 University of California, Berkeley, Berkeley, CA 94720 [email protected] Abstract: Ecosystem processes including plant development, decomposition and nutrient cycling may be influenced by ecological site factors such as climate and soil characteristics. This project will closely examine broad ecological factors that may affect phosphorus (P) forms in forest soils. Sites were established in dissimilar climatic environments: 6 are located in cedar and Douglas-fir dominated temperate rainforests of the Olympic Peninsula, Washington; and 6 in the drier mixed conifer forests of Northern Sierra Nevada. Characterization of each site will include comparative analysis of climate, vegetation, forest floor, decomposition, soils, and geology. Site indices will be developed based on these components, singly or in combination. Integration and interpretation of these separate analyses, coupled with P data from a concurrent study at these sites, will provide insight into the ecological processes and site factors that influence P forms in these forest types.

Blodgett Forest Symposium, February 26, 27, 28, 1999 - page 29
Title: Long-term decomposition of forest detritus in a Mediterranean-type climate Author: Stephen C. Hart Address of Lead Author: School of Forestry College of Ecosystem Science and Management Northern Arizona University Flagstaff, AZ 86011-5018 [email protected] Abstract:
Although numerous measurements of the short-term (two years or less) decay rates and nutrient dynamics of forest leaf-litter have been made throughout the world, few long-term measurements exist. Furthermore, a paucity of short- and long-term information is available on the decay of fine-roots and coarse woody debris (CWD) in forests. As part of a 10-year, intersite study of the decomposition of detritus in terrestrial ecosystems (LIDET 1995), I measured the decomposition rates of leaf/needle, fine-root, and CWD debris in four mature forest stands within the Blodgett Research Forest, near Georgetown, CA. Because my study was part of a much larger study across a wide-range of terrestrial ecosystems, it was necessary to use non-native litter analogues for the various litter-types found within the Sierran mixed-conifer forest type. These analogues were: slash pine (Pinus ellottii) for ponderosa and sugar pines (Pinus lambertiana); chestnut oak (Quercus prinus) for California black oak (Quercus kelloggiii); western red cedar (Thuja plicata) for incense cedar (Calocedrus decurrens); and 1-cm diameter dowels of ramin (Gonystylus bancanus), a non-decay-resistant tropical tree species, for CWD. After 4 years of decomposition in the field, Quercus leaves exhibited the fastest rate of decomposition (39% mass-loss), followed by cedar leaves (30%), buried ramin (25%), buried pine roots (21%), pine needles (16%), and aboveground ramin (4%). These decomposition rates were among the lowest found within the 18 contrasting, forested sites utilized in the LIDET study (which included boreal forests). These data, along with previous short-term studies using native litter-types (e.g., Hart et al. 1992), suggest that the asynchrony of favorable conditions of temperature and moisture inMediterranean-type climates result in extremely slow rates of nutrientmineralization from plant litter. The introduction of low-intensity, prescribed fire into these forests would hasten decomposition and nutrientrelease from these materials, perhaps enhancing the nutrition of theseforests.
Blodgett Forest Symposium, February 26, 27, 28, 1999 - page 30
Title: Effects of planting density on early growth of giant sequoia (Sequoidendron giganteum) Authors: Robert C. Heald, Tara M. Barrett Address of Lead Author: Director, Center for Forestry Blodgett Forest Research Station, University of California, Berkeley 4501 Blodgett Forest Road Georgetown, CA 95634 (530) 333-4475 [email protected] Abstract Almost no information exists for stocking and growth of young giant sequoia plantations. This study measured 2,086 giant sequoia seedlings, planted at true spacings of 7 to 20 ft, over a period of seven years. Compared to other species that have been studied, giant sequoia shows remarkably early and extensive effects of intertree competition. Unlike results for other species, spacing substantially affects early height growth of sequoia. A general least squares model showed that crown width, stem diameter, and height increased linearly with the natural log of spacing distance at 4, 5 and 7 yrs after planting (all p-values < .0001). By 7 yrs, trees at wide spacing (14-20 ft) were showing 45%-78% wider annual diameter growth and 29%-67% higher annual height growth than trees at one half each respective spacing. Results indicate that for close initial planting densities (7 to 12’ spacings), early precommercial thinning (before 7 yrs after planting) may be required to avoid significant intertree competition. During the ninth growing season (April-October 1997) height and breast height diameter were monitored on one “average” tree in each replication (3) for every spacing (9). The “average” trees were randomly selected from the subset of trees in each replication whose height and diameter after 7 yrs.’ growth was +/- 10% of the mean for that replication. Each tree was carefully measured (ht=/- 1.0 inch, DBH +/- 0.05 inch) every two weeks from April through October. Total season height and diameter growth generally increased with increasing spacing. Trees at wide spacings (14’, 16’, 18’, 20’) generally added at least twice the seasonal diameter growth as trees at half (7’, 8’, 9’, 10’) their respective spacings. Widely spaced trees increased about 1 inch in diameter. Trees at wide spacings generally added 30% to 40% more height than trees at half their respective spacings. Widely spaced trees added 2.3’ to 2.8’ in height during 1997. One possible explanation for the unusual (for commercial conifers) height-density response is that both height and diameter growth are limited by late growing season soil moisture depletion, rather than other environmental factors (day length, temperature) or simply species genetic differences. Sequoias at all spacings had observable diameter growth by mid May. New leaf development, branch and height growth was not visible until mid June. Both height and diameter growth slowed considerably in early August and essentially ceased by early September for all spacings. This stands in contrast to the typical conifer early spring start and short duration of primary growth from apical meristem followed by more gradual and longer duration secondary growth of the cambium.

Blodgett Forest Symposium, February 26, 27, 28, 1999 - page 31
Sequoia Height
13.4
15.215.9
17.2
19.6 19.7
21.1
22.221.6
0.0
5.0
10.0
15.0
20.0
25.0
7 8 9 10 12 14 16 18 20
Tree Spacing in Feet
Hei
ght i
n Fe
et 10 Year7 Year5 Year
4 Year
Sequoia DBH
3.4
3.94.1
5.0
5.5
5.9
6.6
7.47.1
0.0
1.0
2.0
3.0
4.0
5.0
6.0
7.0
8.0
7 8 9 10 12 14 16 18 20
Tree Spacing
Dia
met
er @
Bre
ast
Hei
gh
t in
Inch
es
10 Year7 Year5 Year4 Year
Blodgett Forest Symposium, February 26, 27, 28, 1999 - page 32
Title: Influences of climate and hydrology on inter-annual variations in carbon uptake by a ponderosa pine ecosystem Authors: N. E. Hultman, A. H. Goldstein, M. R. Bauer, J.-M. Fracheboud, J. A. Panek Address of Lead Author: Energy and Resources Group and Division of Ecosystem Sciences Department. of Environmental Science, Policy, and Management University of California, Berkeley 151 Hilgard Hall Berkeley, CA 94720-3112 Abstract Years 1997 and 1998 brought widely different climatic conditions to the Western Sierra Nevada (California), with dry conditions in 1997 and increased moisture availability due to El Niño in 1998. In addition, a cooler and wetter spring in 1998 delayed leaf development by about twenty days compared to 1997. These differences significantly affected the uptake of carbon in a managed ponderosa pine ecosystem. From June to September 1997 and May to November 1998 we continuously measured CO2 and related fluxes by eddy correlation; environmental parameters such as radiation, temperature, moisture, and wind were also monitored. While the ecosystem exhibited an extreme drought-induced reduction in carbon uptake in 1997 (reported by Goldstein et. al., Blodgett Forest Symposium 1999), it did not show the same limitations in 1998: Between 1 July and 15 August 1997, daily CO2 fluxes into the ecosystem decreased steadily by 35 to 50%; for the same period in 1998, the daily CO2 fluxes did not show an overall decreasing trend. These data correlate with the observed increase in water availability in 1998, when soil moisture was at least 2.5 times higher at all times and the vapor pressure deficit was usually 5 to 10 mmol/mol lower than in 1997. Because of this increase in moisture availability—characterized by higher soil moisture content, lower average vapor pressure deficit, and fewer extreme vapor pressure deficit events—canopy stomatal conductance was consistently higher between June and September in 1998. As a consequence, the ecosystem absorbed roughly 25% more carbon, despite the 20-day lag in the start of the growing season. These results show that Mediterranean-type drought-stressed ecosystems can experience wide interannual differences in carbon uptake associated with climate variability.

Blodgett Forest Symposium, February 26, 27, 28, 1999 - page 33
Day of year
Cum
ulat
ive
C u
ptak
e (g
(C)/
m^2
)
150 200 250
010
020
030
040
0
1998 (wetter)
1997 (drier)
Fig. 1. Cumulative ecosystem carbon uptake for summers 1997 and 1998, Blodgett Forest Site, Georgetown, California. Gaps indicate missing data.
Blodgett Forest Symposium, February 26, 27, 28, 1999 - page 34
Title: In-situ measurements of C2-C10 VOCs and OVOCs above a Sierra-Nevada ponderosa pine plantation
Authors: Mark S. Lamanna and Allen H. Goldstein Address of Lead Author: Department of Environmental Science, Policy, and Management Ecosystems Sciences Division University of California, Berkeley [email protected] Abstract: A fully automated GC-FID system measuring ambient concentrations of C2-C10 hydrocarbons including many oxygenated compounds without liquid cryogen was designed and built. It was deployed at Blodgett Forest Research Station in Georgetown, CA USA, 38° 53’ 42.9” N, 120° 37’ 57.9” W, 1315 m elevation. More than 900 in-situ measurements were made above a ponderosa pine canopy at 40-min intervals, continuously from July 2 through August 1, 1997. Diurnal patterns and correlation with butane, acetylene, α-pinene and methylbutenol were used to categorize sources for measured compounds as biogenic or anthropogenic. Clearly biogenic compounds included methylbutenol, isoprene and its oxidation products (methacrolein and methyl vinyl ketone), and terpenes (α-pinene, 3-carene, d-limonene). Other compounds were partially biogenic including acetone, acetaldehyde and methanol. Hydroxyl radical (OH) loss rates were dominated by the clearly biogenic compounds, accounting for 70% of the loss under mean midday conditions. The most important single compounds were isoprene (33%) and methylbutenol (21%). These two compounds were dominant under all conditions including the coldest and most polluted days. Under the most polluted conditions, acetaldehyde became very important, accounting for 13% of the total. Total OH loss rates were highly correlated with temperature because emissions of biogenic compounds, which dominate OH loss, are strongly temperature dependent. Much of the research on biogenic hydrocarbons has focused on isoprene and terpenes. Our results suggest that quantifying and understanding factors controlling biogenic emissions of other compounds such as methylbutenol, acetone, methanol, and acetaldehyde is critical for improving our understanding of regional ozone production.

Blodgett Forest Symposium, February 26, 27, 28, 1999 - page 35
Title: Spatial trends in mycorrhizal recolonization on roots of ponderosa Douglas-fir seedlings in cleared forest patches Authors: Anna Levin and John Battles Address of Lead Author: University of California, Berkeley Department of Environmental Science, Policy, and Management 151 Hilgard Hall Berkeley, CA 94720-3110 [email protected] Abstract: Following a disturbance, the mycorrhizal fungi inhabiting a site may affect the performance of establishing plants and ultimately influence the composition of the plant community. Distance away from the intact community edge may influence the type of fungi that colonize regenerating seedlings as well as the extent of that colonization. We examined mycorrhizal colonization dynamics following disturbance in two group selection cuts (1 ha in size) in a mixed conifer forest on Blodgett Research Station. We planted radial transects from within the forest to the center of the clearing with two year old seedlings of Pinus ponderosa and Pseudotsuga menziesii and are monitoring these seedlings for growth ,root and shoot biomass, leaf area index, percent mycorrhizal colonization and mycorrhizal diversity. Preliminary data, after two growing seasons, suggests that these two species are very different both in terms of growth and mycorrhizal colonization. While the growth of P. menziesii does not correlate with distance away from the forest, the percentage of the roots of this species colonized by mycorrhizae declines with distance away from the intact forest. On the other hand, the growth of P. ponderosa is positively associated with distance away from the forest, yet mycorrhizal colonization of this species shows no relationship with proximity to the intact community. These results suggest that the ecological importance of mycorrhizal colonization to regenerating trees may vary by species and resource supply.
Blodgett Forest Symposium, February 26, 27, 28, 1999 - page 36
Title: WHITE FIR GENETIC-ARCHITECTURE PLANTATIONS Author: W. J. Libby Lead Author’s Address (NZ before April, Orinda after 15 April, en route 1-15 April) 9A Eruini St. 28 Valencia Rd Ohope, Bay of Plenty Orinda, Ca. 3085 New Zealand 94563 USA Phone 64 (0)7 312 5761 1 510 376 5896 FAX 64 (0)7 312 5798 1 510 376 7928 e-mail) - both places: [email protected] Abstract: At a 1962 Joint UC -USFS Blodgett Forest Research Symposium, white fir (Abies concolor) was identified as becoming of increasing importance in western forests, numerically, biologically and economically. It was a very good seed year and, cooperatively with R. Callaham of the Institute of Forest Genetics and J. Wright of Michigan State University, a seed collection was quickly organized. Bulked samples were obtained from over 40 populations throughout the species range, and family collections were made by IFG technicians from low-, middle- and high-elevation west-side stands and one east-side stand near highway 50 from Placerville to Lake Tahoe (the Eldorado transect). In 1965, two plantations of the range-wide collections and two of the Eldorado-transect collections were established at Blodgett. One each quickly failed, but the other two have provided useful information during the 34 years since planting. Since having non-native germplasm on Blodgett is now against Blodgett policy, these two will soon be removed, as they are beginning to shed pollen into the surrounding native stands. We plan one final data-taking before their removal. We have learned that white fir is unusual in that it contains about twice the theoretical expectation of genetic variation within open-pollinated families. This is likely due to some combination of long-distance pollination, some inbreeding, and a high degree of non-additive genetic variation. It implies that natural regeneration of white fir includes a great range of genetic variation, some adapted to previous conditions, some adapted to current and immediate-future conditions, and many that are not well-adapted and are likely to die. This has worrisome implications for white fir from open-pollinated seeds raised in a good nursery and then planted on well-prepared sites at wide spacing with good aftercare. We have also learned that populations from southern California, Arizona and New Mexico initially grew much faster than the locals. However, after 3 decades the locals are by far the best in both mid-term survival and sustained growth. The locals are the latest to flush in the spring, and they recovered from the drought of the 1980s much better than did non-local trees.

Blodgett Forest Symposium, February 26, 27, 28, 1999 - page 37
TITLE: Evidence for Lasting Nursery Effects in Giant Sequoia Authors: W.J Libby and Richard A. Broad Address of Lead Author: 28 Valencia Rd, Orinda, Ca 94563 [email protected] Abstract: In most plantation plantings, the effect of different nursery techniques or environments on individual tree performance decreases with time and is often disappeared after the first three to four years of growth. However, this has not held consistent in the data analyzed from both the Blodgett and Foresthill experiments. The Blodgett and Foresthill experiments contained seedlings of a common origin (Whitakers forest, Redwood Mountain Grove) grown in Leach supercells at three different nurseries, namely Berkeley, Chico and Simpson. Now in their fifteenth year, both the Blodgett 370 and 560 experiments exhibit statistically significant (<.05) differences in height, DBH and Volume index, indicating that previously non significant differences in the same growth variables during the early stages of establishments have perhaps intensified with increased competition, instead of disappearing as shown in most similar experiments. The most likely explanation for the observed differences in nursery performance is that, the roots of giant sequoia benefit from periods of winter chilling before planting. The seedlings being raised in the more continental Chico nursery could have received closer to optimum winter chilling than did the sequoias in the Berkeley and Simpson nurseries.

Blodgett Forest Symposium, February 26, 27, 28, 1999 - page 38
Title: Lack of Evidence for the Interaction of Giant Sequoia with Brush Cover Authors: W.J Libby and Richard A. Broad Address of Lead Author: 28 Valencia Rd, Orinda, Ca 94563 [email protected] Abstract: In the 1970’s it was observed that there was a possible relationship between the growth of Giant sequoia and the presence of Ceanothus. Ceanothus, together with Giant sequoia and incense-cedar support endomycorrhyzae associations, while other brush species (Manzanita) and other Sierra conifers support ectomycorrhyzae. Furthermore, Ceanothus is a known nitrogen fixer, and thus might be influencing sequoia growth via the transfer of nitrogen directly into the soil or through the sequoia / mycorrhyzae association. To test this, 3 experiments of sequoia / mixed conifers were established at Blodgett and one at Foresthill. On each site, plants and seeds of local manzanita and Ceanothus species were planted or scattered onto 1/3 of the plots. All brush of the wrong or other species was removed, as was the brush from the 1/3 of the plots maintained as bare ground (control). It was expected that the sequoias and incense-cedars would outperform the pines and firs on the Ceanothus plots and reverse would be true for the manzanita plots. It was also suggested that the trees on the bare ground plots would perform better than any of the brush covers due to a lack of competition. After repeated observations and measurements of the 4 experiments, there is no consistency as to which tree species are doing better in which plots.

Blodgett Forest Symposium, February 26, 27, 28, 1999 - page 39
Title: Relative Growth of Giant Sequoia and 5 Native Conifers in 3 Blodgett Plantations. Authors: W.J Libby and Richard A. Broad Address of Lead Author: 28 Valencia Rd. Orinda, Ca 94563 [email protected] Abstract:
One of the primary objectives of the Blodgett and Foresthill experiments was to see if any populations, families or clones of sequoia outperformed the five mixed-conifer species that they were established with.
Due to confounding nursery effects on sequoia stecklings, relative growth rates have been determined using data from two sequoia seedling populations (Garefield, Redwood Mountain) together with local provenance seedlings of ponderosa pine, sugar pine, Douglas fir and white fir, and six provenances of incense-cedar.
Based on previous observations the sequoia seedlings were expected to outperform the other species. This held true for the initial years of growth with the sequoia seedlings having significantly greater height, DBH and volume than the other species. However, the extended drought of the mid 80’s favored ponderosa pine growth, which then surpassed sequoia as the dominant species and has remained so through 1997.
Of the species planted, ponderosa pine are on average the largest trees followed closely by giant sequoia. sugar pine and Douglas-fir lie somewhere in the middle, with white fir and incense-cedar being the poorest performers. There is some indication that sequoia prefers the company of other species, rather than other sequoias. This is probably due to intraspecific root competition for micronutrients or other nutrients in short supply.

Blodgett Forest Symposium, February 26, 27, 28, 1999 - page 40
Title: Detection of Diseased Hosts by Pine Bark Beetles (Coleoptera: Scolytidae): Gustatory Stimuli Authors: William R. McNee, David L. Wood, Pierluigi Bonello, Andrew J. Storer and Thomas R. Gordon Address of Lead Author: University of California, Berkeley Department of Environmental Science, Policy, and Management Division of Insect Biology 201 Wellman Hall Berkeley, CA 94720 [email protected] Abstract: We have been investigating the mechanisms by which bark beetles recognize trees as suitable substrate in which to reproduce. In an initial extraction of potential feeding stimulants for Ips paraconfusus, freeze-dried ponderosa pine phloem was sequentially extracted in hexane, methanol, and water. Following filtration, extracts were added to powdered cellulose (Alphacel) mixed with inert orange powdered dye (5% by weight) and the solvent evaporated. The Alphacel was mixed with distilled water to the same water content and pH as phloem, and loosely packed into 4 cm sections of drinking straw. Thirty male I. paraconfusus were individually inserted into the straws, and hours, beetles were dissected to measure the length of Alphacel in the digestive tract. Ingestion of Alphacel containing methanol and water extracts was found to be significantly greater than in controls lacking extractives, while the hexane extract showed no activity. Assay of two stilbenes produced in response to Heterobasidion annosum infection found no evidence of additional feeding stimulation or deterrence when the stilbenes were added to Alphacel containing active methanol extractives. It is believed that in intact phloem, the feeding stimulants overwhelm any potential effect that the stilbenes may have if assayed alone. Examination of feeding stimulation in intact diseased and non-diseased ponderosa pine phloem will be conducted in 1999.

Blodgett Forest Symposium, February 26, 27, 28, 1999 - page 41
Title: A controlled field experiment on the relation between drought stress, photosynthesis and stomatal conductance: Implications for carbon storage and ozone deposition. Authors: J.A. Panek and A.H. Goldstein. Address of Lead Author: University of California, Berkeley Dept. Environmental Science, Policy and Management Ecosystem Sciences Division Berkeley, CA 94720 [email protected] Abstract: To gain further insights into the physiological effect of drought on the ponderosa pine ecosystem and the degree to which climate limits uptake of carbon and ozone, we established 2 sitesone control, one wateredin a ponderosa pine plantation at Blodgett Forest. We measured diurnal trends in leaf-level physiological variables on 6 trees at each site throughout the 1998 growing season, once before the watering treatment and 3 times afterwards. We also measured photosynthetic response curves to resolve where, functionally, limitation due to drought may have been occurring. We found that the treatment maintained the watered site at a pre-drought hydrologic status, whereas soil moisture at the control site dropped from 21% to 17% and predawn water potential dropped from –0.24 to –0.52 MPa over the measurement period. Photosynthesis, conductance and transpiration at the control site responded to changes in soil moisture, atmospheric humidity and temperature over the season, whereas physiology at the watered site was relatively insensitive to meteorological conditions. Response curves showed that while the photosynthetic capacity at the sites was identical at the beginning of the season, by the end photosynthesis at the control site was limited in its ability to utilize PAR and to fix CO2, and photorespiration rates had increased. Water use efficiency doubled at the control site over the measurement period, whereas it increased by only one third at the watered site. Despite the fact that the 1998 growing season was abnormally wet, we saw a pronounced drought effect at the control site. Carbon uptake in 1-year old foliage was roughly 45%, 32% and 15% less per unit area on the 3 measurement days after the treatment started and ozone uptake, estimated from stomatal conductance and ambient ozone concentrations, was 53%, 86% and 71% reduced.

Blodgett Forest Symposium, February 26, 27, 28, 1999 - page 37
Time of Day
Pho
tosy
nthe
sis
(um
ol/m
2/s)
5 10 15 20
02
46
810
12Begin Growing Season
Control SiteWatered Site
5 10 15 20
02
46
810
12
Time of Day
Pho
tosy
nthe
sis
(um
ol/m
2/s)
5 10 15 20
02
46
810
12
End Growing Season
5 10 15 20
02
46
810
12
Time of Day
Con
duct
ance
(mol
/m2/
s)
5 10 15 20
0.0
0.05
0.10
0.15
0.20
Begin Growing Season
5 10 15 20
0.0
0.05
0.10
0.15
0.20
Time of Day
Con
duct
ance
(mol
/m2/
s)
5 10 15 20
0.0
0.05
0.10
0.15
0.20
End Growing Season
5 10 15 20
0.0
0.05
0.10
0.15
0.20

Blodgett Forest Symposium, February 26, 27, 28, 1999 - page 42
Title: Soil-Water Characteristics Following Forest Removal and Mechanized Soil Disturbance: The Relative Influence of Organic Residue and soil Compaction on Permeability and Moisture Capacity.
Author: Lucas Paz Address of Lead Author: 1945 Hopkins Street Berkeley, CA 94707 (510) 525-3502 [email protected]
ABSTRACT A pilot study monitored soil-water characteristics following forest removal and mechanized soil disturbance. Field measurements were taken in July, 1997 at Blodgett Forest Research Station within the Sierra Nevada Mixed Conifer Forest Type. Existing treatment plots (varying compaction and organic matter levels) established in 1993 by the USFS Long Term Soil Productivity Research Program (LTSP) were examined. The study measured soil hydrologic characteristics over ten soil disturbance treatments (nine deforested, one forested). Physically based measurements of soil hydrologic condition (field-saturated hydraulic conductivity, matric potentials/sorptivity, available water holding capacity, bulk density, % total organic carbon, pore size distribution, and aggregate structure/stability) were determined from both in-situ and laboratory measurements. Overall initial results reveal significantly greater variation between treatments than within treatments (p>0.05), although the relative influence of organic residue level and compaction level on measured soil hydrologic characteristics varied depending on the particular parameter of interest. Soil moisture status in the upper 30 cm of the soil profile is well correlated with organic residue level. In most cases, treatments with the highest level of organic residue maintained water potentials at or near field capacity (-10 - -33Kpa) during the July ’97 period of measurement (07/10/97 – 07/25/97).
While treatments lacking organic residue maintained soil water potentials below –70 Kpa during the same period. Bore-hole permeameter (Guelph) measurements of field-saturated hydraulic conductivity (Kfs) ranged from 0.06 cm/s to 0.00003 cm/s; this variation is most notably correlated with soil compaction level but is also influenced by organic residue to a lesser degree. Comparing two classes (0-moderate, moderate-severe) of overall soil disturbance showed a significant difference in Kfs (p=0.07) between the five plots in each category. The potential decrease in site biological productivity following forest removal and mechanized soil disturbance can be predicted indirectly by monitoring basic changes in soil physical and organic characteristics. The influence of soil disturbance on site productivity can be ascertained by asking first, how does compaction x organic matter influence soil hydrology with regards to water, nutrient, and oxygen transport to roots; and secondly, how do these changes affect the soil and site’s overall hydrologic condition. Continued site monitoring of the following parameters: field-saturated hydraulic conductivity, matric potential/sorptivity/moisture content, available water holding capacity, bulk density (soil strength), % total organic carbon, pore size distribution, and aggregate structure/stability, will be used to establish direct relationships between soil disturbance level, soil hydrologic condition, soil fertility and/or overall site productivity.

Blodgett Forest Symposium, February 26, 27, 28, 1999 - page 43
Title: NORTH AMERICAN LTSP RESEARCH BLODGETT INSTALLATION
Author: Robert F. Powers Address of Lead Author: Supervisory Research Forester USDA-Forest Service PACIFIC SOUTHWEST RESEARCH STATION 2400 Washington Avenue Redding, CA 96001 (530) 246-5267 [email protected]
ABSTRACT The Blodgett installation, established in 1994, is one of 12 Long-Term Soil Productivity (LTSP) sites in California's Sierra Nevada mixed-conifer forest type and is the only one not on federal land. This installation is part of the North American network of approximately 100 installations constituting the world's largest effort to test the long-term consequences of forest management on fundamental site productivity (Powers et al., in press). Biomass and nutrient content of the forest and soil were documented before treatment. Standing tree biomass averaged about 345 Mg ha-1, of which half was in Abies concolor. Standing nitrogen mass averaged 640 kg ha-1; calcium, 800 kg ha-1, and other nutrients were contained in lesser amounts (Fig. 1). The forest floor contained as much nitrogen as all standing vegetation. The three levels of organic matter removal therefore removed 425, 668, and 1,380 kg N ha-1. Soil organic carbon and nitrogen measured 4 years after treatment followed typical J-shaped trends with depth. The highest levels were found in "bole-only removal, no compaction" treatments (Fig. 2). Soil strength measurements showed growth-limiting levels were reached early in the growing season on compacted plots. However, this was reversed by soil tillage. The Blodgett LTSP site has been the focus of several graduate student studies and provides a great opportunity for further collaborative research.

Blodgett Forest Symposium, February 26, 27, 28, 1999 - page 44
STANDING NUTRIENT CONTENTBlodgett Research Forest
W F IC PP SP DF
SPECIES
0
100
200
300
400
500
600
CO
NT
EN
T (k
g/ha
)
N
W F IC PP SP DFSPECIES
0
100
200
300
400
500
600
CO
NT
EN
T (k
g/ha
)
Ca
W F IC PP SP DF
SPECIES
0
100
200
300
400
500
600
CO
NT
EN
T (k
g/ha
)
K
W F IC PP SP DFSPECIES
0
100
200
300
400
500
600
CO
NT
EN
T (k
g/ha
)
Mg
W F IC PP SP DF
SPECIES
0
100
200
300
400
500
600
CO
NT
EN
T (k
g/ha
)
P
W F IC PP SP DFSPECIES
0
100
200
300
400
500
600C
ON
TE
NT
(kg/
ha)
S
LTSP_Fig. 1
SOIL ANALYSISBlodgett Research Forest
'
'
'
'
'
'
,
,
,
,
,
,
$
$
$
$
$
$
0
20
40
60
80
100
120
0.1 0.2 0.3 0.4 0.5
N CONCENTRATION (%)
DE
PT
H (c
m)
CARBON CONCENTRATION (%)
DE
PT
H (c
m)
'
'
'
'
'
'
,
,
,
,
,
,
$
$
$
$
$
$
0
20
40
60
80
100
120
2 4 6 8 10
OM 2C 2
OM 0C 0
Natural Stand
LTSP_Fig. 2
Blodgett Forest Symposium, February 26, 27, 28, 1999 - page 45
Title: Giant Sequoia Spacing X Nutrition Study
Author: Robert F. Powers Address of Lead Author: Supervisory Research Forester USDA-Forest Service PACIFIC SOUTHWEST RESEARCH STATION 2400 Washington Avenue Redding, CA 96001 (530) 246-5267 [email protected]
ABSTRACT From April through October 1997, nutrient concentrations were measured monthly in giant sequoia planted at four spacing (2.1, 3.0, 4.3, 5.5 m) at Blodgett Forest Research Station. Early results appear in Fig. 1. The wider the spacing, the greater the foliar nutrient concentration. Comparisons between well-lighted, current-year foliage near the top of the trees, and older, inner-crown foliage in the lower crowns showed strong differences. Phloem-soluble nutrients such and N and P show that nutrients are translocated efficiently from senescing foliage to more active growing points. Results also suggest that nitrogen (and to some degree, phospohorus) stress is developing at the narrowest (most densely stocked) spacings. This generates several hypotheses that can be tested through further research.
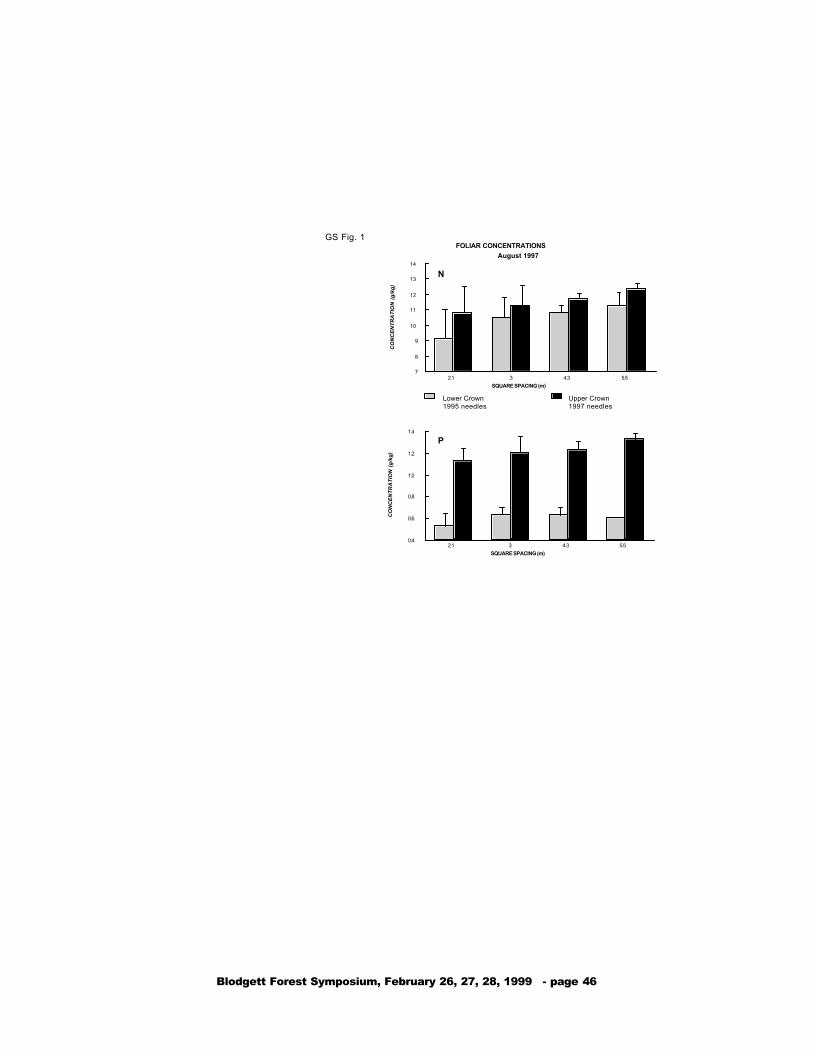
Blodgett Forest Symposium, February 26, 27, 28, 1999 - page 46
2.1 3 4.3 5.5SQUARE SPACING (m)
7
8
9
10
11
12
13
14
CO
NC
EN
TR
AT
ION
(g
/kg
)Lower Crown1995 needles
Upper Crown1997 needles
2.1 3 4.3 5.5SQUARE SPACING (m)
0.4
0.6
0.8
1
1.2
1.4
CO
NC
EN
TR
AT
ION
(g
/kg
)
FOLIAR CONCENTRATIONSAugust 1997
N
P
1.0
GS Fig. 1
Blodgett Forest Symposium, February 26, 27, 28, 1999 - page 47
Title: In Situ Hyperspectral Data Analysis for Nutrient Estimation of Giant Sequoia Authors: Ruiliang Pu, Peng Gong and Bob Heald Address of Lead Author: Dept of ESPM 151 Hilgard Hall University of California Berkeley, CA 94720-3110 USA Tel: (510) 642-1351 Fax: (510) 643-3490 [email protected] ABSTRACT The remote sensing of forest biochemical characteristics at the foliar or canopy level from different platforms has been the subject of much research for better understanding of terrestrial ecosystem functioning. The advent of high-spectral resolution remote sensing has made it possible to measure both biophysical and biochemical parameters at local and global scales. These include biomass, LAI, chlorophyll content, and foliar nutrient status. There are many fields to be investigated to extract these parameters from a variety of hyperspectral data. Fewer studies have been made to estimate foliage nutrient status such as nitrogen, phosphorus and potassium, using hyperspectral data. In this study, correlation between in situ hyperspectral data obtained within the spectral range of approximately 350 nm - 900 nm and three foliage nutrient constituents was studied. 240 hyperspectral measurements were taken using a PSD1000 spectrometer at a Giant sequoia plantation site in Bblodgett Forest Station, UC Berkeley, in April, May, and July through October of 1997. Foliage nutrient constituents (expressed in concentration, percentage of dry weight): total nitrogen (TN), total phosphorus (TP), and total potassium (TK), were measured from the same plantation. The potential of hyperspectral data for estimating foliage nutrient status was evaluated using univariate correlation and multivariate regression analysis methods with different types of predictors: original and the first-order derivative spectra, vegetation index (VI)-based, spectral position-based, area-based, and PCA-based predictors. Eight VIs in the form of simple ratio and normalized difference were derived from blue, green, red and NIR spectral ranges. Spectral position-based predictors consist of parameters extracted from blue, yellow, and red edges and the green-peak and red-well. Area-based variables were calculated as the sum of the first derivative amplitudes of the three edges; and PCA-based predictors were obtained from applying principal component analysis to the first derivative spectra of the three edges. Results show that the best foliage nutrient prediction results were obtained with the PCA-based predictors in a 4-term prediction models for all three nutrient constitutes (R2=0.57, 0.56, 0.56, and overall average accuracy=88.7%, 74.5%, and 77.0% for TN, TP, and TK, respectively). In univariate correlation analysis, it seems that only VIs RB(R760-850R350-400) and NRB ((R760-850-R350-400)/(R760-850+R350-400))(with higher R2 values) may be employed to predict all three nutrient constituents (P=0.01), and better R2 values were related to the maximum first derivative spectra of blue edge and yellow edge and the spectral difference between green-peak and red-well reflectances for TN, TP, and TK. The results obtained from the univariate analysis,

Blodgett Forest Symposium, February 26, 27, 28, 1999 - page 48
however, indicate that the level of correlation between foliage nutrient concentrations and hyperspectral data is low. In fact, for TN, the correlation with different types of variables was rather low. In general, for either univariate correlation or multiple regression prediction, the best results were related to TK, then TP, and the worst to TN except for the multiple regression prediction with PCA-based predictors. Figures 1, 2, and 3 are comparisons of measured concentration of TN, TP, and TK with the concentration predicted by multiple regression models with (a) VI-based variables; (b-c) spectral position-based variables; (d) area-based predictors; and (e) PCA-based predictors.

Blodgett Forest Symposium, February 26, 27, 28, 1999 - page 49
Figure 1. Comparisons of measured concentration of TN with the concentration predicted by multi regression models with (a) VI-based variables; (b-c) spectral position-based variables; (d) area-based predictors; and (e) PCA-based predictors
0.50
1.00
1.50
2.00
0.50 1.00 1.50 2.00Measured TN (%)
Pre
dic
ted
TN
(%
)
cali.
vali.
R2=0.3077P=86.78%SDR=0.1486Var.=NRB,NRT,NRR,RG
(a)
0.50
1.00
1.50
2.00
0.50 1.00 1.50 2.00Measured TN (%)
Pre
dic
ted
TN
(%
)
cali.
vali.
R2=0.4137P=85.36%SDR=0.1645Var.=λy,λr,λb,Db
(b)
0.50
1.00
1.50
2.00
0.50 1.00 1.50 2.00Measured TN (%)
Pre
dic
ted
TN
(%
)
cali.
vali.
R2=0.1476P=85.08%SDR=0.1676Var.=λg,R0,Rg/R0,λ0
(c)
0.50
1.00
1.50
2.00
0.50 1.00 1.50 2.00Measured TN (%)
Pre
dic
ted
TN
(%
)
cali.
vali.
R2=0.5709P=88.73%SDR=0.1266Var.=PCR2,PCB2,PCB3,PCR1
(e)
0.50
1.00
1.50
2.00
0.50 1.00 1.50 2.00
Measured TN (%)
Pre
dic
ted
TN
(%
)
cali.
vali.
R2=0.4356P=86.83%SDR=0.1480Var.=SDb,SDy,SDr
(d)

Blodgett Forest Symposium, February 26, 27, 28, 1999 - page 50
Figure 2. Comparisons of measured concentration of TP with the concentration predicted by multi regression models with (a)VI-based variables; (b-c) spectral position-based variables; (d) area-based predictors; and (e) PCA-based predictors
0.00
0.05
0.10
0.15
0.20
0.25
0.00 0.05 0.10 0.15 0.20 0.25
Measured TP (%)
Pre
dic
ted
TP
(%)
cali.
vali.
R2=0.4714P=72.21%SDR=0.0241Var.=Db,λr,λb,Dr
(b)
0.00
0.05
0.10
0.15
0.20
0.25
0.00 0.05 0.10 0.15 0.20 0.25
Measured TP (%)
Pre
dic
ted
TP
(%
)
cali.
vali.
R2=0.4371P=70.97%SDR=0.0252Var.=NRB,NRR,RT,RR
(a)
0.00
0.05
0.10
0.15
0.20
0.25
0.00 0.05 0.10 0.15 0.20 0.25
Measured TP (%)
Pre
dic
ted
TP
(%
)
cali.
vali.
R2=0.4575P=73.96%SDR=0.0226Var.=Rg-R0,Rg,Rg/R0,λg
(c)
0.00
0.05
0.10
0.15
0.20
0.25
0.00 0.05 0.10 0.15 0.20 0.25Measured TP (%)
Pre
dic
ted
TP
(%)
cali.
vali.
R2=0.4174P=71.82%SDR=0.0244Var.=SDb,SDy,SDr
(d)
0.00
0.05
0.10
0.15
0.20
0.25
0.00 0.05 0.10 0.15 0.20 0.25
Measured TP (%)
Pre
dic
ted
TP
(%)
cali.
vali.
R2=0.5550P=74.47%SDR=0.0221Var.=PCB2,PCB3,PCR1,PCR3
(e)

Blodgett Forest Symposium, February 26, 27, 28, 1999 - page 51
Figure 3. Comparisons of measured concentration of TK with the concentration predicted by multi regression models with (a)VI-based variables; (b-c) spectral position-based variables; (d) area-based predictors; and (e) PCA-based predictors
0.00
0.50
1.00
1.50
0.00 0.50 1.00 1.50Measured TK (%)
Pre
dic
ted
TK
(%
)
cali.
vali
R2=0.5477P=76.32%SDR=0.1509Var.=NRB,NRR,NRG,RR
(a)
0.00
0.50
1.00
1.50
0.00 0.50 1.00 1.50Measured TK (%)
Pre
dic
ted
TK
(%)
cali.
vali
R2=0.5133P=76.96%SDR=0.1468Var.=Dy,λr,Db,Dr
(b)
0.00
0.50
1.00
1.50
0.00 0.50 1.00 1.50
Measured TK (%)
Pre
dic
ted
TK
(%
)
cali.
vali
R2=0.5289P=75.33%SDR=0.1572Var.=SDb,SDy,SDr
(d)
0.00
0.50
1.00
1.50
0.00 0.50 1.00 1.50Measured TK (%)
Pre
dic
ted
TK
(%
)
cali.
vali
R2=0.4841P=77.08%SDR=0.1461Var.=Rg-R0,Rg,Rg/R0,λg
(c)
0.00
0.50
1.00
1.50
0.00 0.50 1.00 1.50Measured TK (%)
Pre
dic
ted
TK
(%
)
cali.
vali
R2=0.5635P=76.99%SDR=0.1466Var.=PCY1,PCR2,PCB2,PCR3
(e)

Blodgett Forest Symposium, February 26, 27, 28, 1999 - page 52
Title: Monoterpene concentrations and emissions above a ponderosa pine plantation: Substantial increases following rain events
Authors: Gunnar W. Schade, Allen H. Goldstein, Mark S. Lamanna, and Nathan Hultman
Address of Lead Author: Department of Environmental Science, Policy, and Management University of California, Berkeley 151 Hilgard Hall, Berkeley, CA 94720-3110 phone: 510 643 6449 [email protected] Funding: U.S. EPA, UC Agricultural Experiment Station Abstract We developed an automated dual channel GC-FID system for in-situ measurements of atmospheric hydrocarbons. It was deployed at Blodgett Forest from July, 2 to August, 1 1997, and July, 12 to October, 30 1998 to measure volatile organic compounds (VOC), focusing on biogenic hydrocarbons, above a ponderosa pine plantation. In 1997 we learned that biogenically emitted hydrocarbons were significantly more important for local photochemistry than anthropogenic compounds. In 1998 hydrocarbon concentrations were measured at different heights above the forest, along with ecosystem-level biosphere-atmosphere trace gas fluxes of CO2, H2O, O3, and sensible heat (by eddy correlation), and relevant meteorological and ecological variables in order to determine biogenic hydrocarbon emission ratios. Three major and two minor monoterpenes (known to be temperature-driven emission compounds of ponderosa pines) were identified in the atmosphere above the plantation. Their mixing ratios were all highly correlated (Fig. 1), and generally did not exceed a maximum total of 2 ppb (20 ppbC) in August 1998. In contrast, 2-methyl-3-buten-2-ol (MBO), the major hydrocarbon emitted from ponderosa pines (in response to temperature and light) exceeded 6 ppb at times during such hot summer days. Monoterpene emissions at the ecosystem level were low and often within the noise of our measurements. However, after a rain event in the beginning of September, ambient monoterpene mixing ratios and fluxes were substantially elevated and no longer showed the expected response to temperature (Fig. 2). This unique situation, repeated after a rain event in October, lasted for 2-3 days during which the monoterpene to NOx ratio was high enough to favor a significant secondary aerosol formation from monoterpene oxidation.

Blodgett Forest Symposium, February 26, 27, 28, 1999 - page 53
alpha-pinene mixing ratio (ppb)
beta
-pin
ene
mix
ing
ratio
(pp
b)
0.1 0.2 0.3 0.4 0.5
0.0
0.2
0.4
0.6
0.8
Figure 1: Correlation between monoterpene mixings ratios
air temperature (deg C)
3-ca
rene
mix
ing
ratio
(pp
b)
5 10 15 20
0.0
0.5
1.0
1.5
2.0
Figure 2: Dependence of nighttime terpene mixing ratio on temperature
'normal' after rain event

Blodgett Forest Symposium, February 26, 27, 28, 1999 - page 54
Title: The effects of forest management on plant species diversity in the mixed conifer forests of the Sierra Nevada Authors: Ayn Shlisky, John Battles, Reginald Barrett, Robert Heald, and Barbara Allen-Diaz Address of Lead Author: University of California, Berkeley Department of Environmental Science, Policy and Management 151 Hilgard Hall Berkeley, CA 94720-3110 (510) 643-0684 lab: (510) 643-2450 Abstract: We used a large data set collected as part of a wildlife habitat study at the Blodgett Forest Research Station (BFRS) in Georgetown, CA to assess the relationship between understory plant species diversity in the mixed conifer forest and management practices. In addition to the wildlife habitat data, we completed botanical inventories in a total of 32 plots (0.28 ha in size( from four different silvicultural regimes in 1997 at the BFRS. For the 1997 inventories, understory species richness normalized to a total area sampled of 1.96 ha was greater in plots under even-aged (95 species) and shelterwood (86 species) management and least in plots in reserve sites (i.e., approximately 80 years with no active management, 59 species). This pattern in species richness was consistent in the larger data set (Table 1). Based on 301 plots sampled between 1977 and 1996, even-aged and shelterwood plots routinely had the highest species richness and the reserve plots routinely were the least rich. Stands under group selection and single-tree selection had species richness values more similar to those of the reserve stands. Species richness in stands thinned from above varied greatly from year to year. Even-aged management had the most species unique to that management class (21 species), while group selection and single tree selection had the fewest unique species (0 and 4 species, respectively). Plots under a group selection, single tree selection or reserve management regime had a greater proportion of late seral versus early seral species, and a lower proportion of introduced exotic species compared to even-aged or shelterwood regimes (Figure 1).

Blodgett Forest Symposium, February 26, 27, 28, 1999 - page 55
Comparison of Richness by Species Seral Status and Treatment
0
10
20
30
40
50
60
70
80
90
cc sw gs sts res
management treatment
% o
f to
tal n
um
ber
of
sp
ecie
s late seral
early seral
introduced
Table 1. Species richness by management class for each year sampled at the Blodgett Research
Forest Station. Richness normalized to a common minimum area sampled. The number in
parentheses following the year indicates the minimum number of 30-m radius plots inventoried.
Means based on 999 random resamplings of the minimum number of plots. Year even-aged group
selection reserve single-tree shelterwood
from above1977 (4) -- -- 31.0 31.7 --
1978 (8) 41.0 -- 26.4 28.4 --
1979 (10) 35.0 -- 21.0 19.8 --
1980 (20) -- -- 46.0 61.1 --
1981 (20) -- -- 48.0 58.0 --
1982 (5) 35.7 -- -- -- --
1984 (10) 40.0 -- 27.3 -- --
1993 (5) -- 34.9 30.8 -- --
1994 (6) 72.9 74.0 49.5 -- --
1996 (4) 61.8 63.0 48.1 -- 66.2
1997 (7) 95.0 -- 59.4 73.5 86.0
Blodgett Forest Symposium, February 26, 27, 28, 1999 - page 56
Title: Detection of Diseased Hosts by Pine Bark Beetles (Coleoptera: Scolytidae): Olfactory Stimuli Authors: Andrew J. Storer, David L. Wood, Pierluigi Bonello, William R. McNee and Thomas R. Gordon Address of Lead Author: University of California, Berkeley Department of Environmental Science, Policy, and Management Division of Insect Biology 201 Wellman Hall Berkeley, CA 94720 [email protected] Abstract: Root pathogens are among the most important biotic factors predisposing forest trees to insect attack. Bark beetles (Coleoptera: Scolytidae) are known to preferentially kill ponderosa pines, Pinus ponderosa, infected with root disease. To explore the mechanisms that underlie this phenomenon, an experiment was established in May 1997 to compare landing rates of bark beetles on ponderosa pines with and without root disease. In each of two plots, 30 trees were inoculated with four Heterobasidion annosum-colonized wooden dowels. Thirty trees in each block were mock inoculated with autoclaved dowels and thirty were left undamaged. Each of the 180 trees was fitted with four sticky traps made of 3 mm hardware cloth (2'x1') coated with Tanglefoot and sprayed to runoff with carbaryl. Two of the four traps were tied to the trunk 4-5 m above ground, while the other two were tied at the base. Most of the insects caught on the traps were Ips latidens and western pine beetle, Dendroctonus brevicomis . Analysis of trap catches from July and November 1997 and 1998 indicate no significant differences between trap catches on diseased trees and on trees without disease. If this trend continues, it would appear that detection of a suitable host occurs after landing. Alternatively, trees with root disease will become more attractive as the disease develops.

Blodgett Forest Symposium, February 26, 27, 28, 1999 - page 57
Title: Ozone Production over a Ponderosa Pine Plantation at Blodgett Forest, CA Authors: Joel A. Thornton, Paul J. Wooldridge, Michael B. Dillon, and Ronald C. Cohen Address of Lead Author: University of California, Berkeley Department of Chemistry Berkeley, CA 94720 [email protected] Abstract. In-situ measurements of NO, NO2, NOy , and O3 were made at Blodgett Forest during the summer and fall of 1998. Data from these measurements is used to evaluate local instantaneous ozone production rates and regional ozone production efficiencies. The instantaneous production rate for O3 is given by P(O3) = k[NO][RO2], where the peroxy radical concentration, [RO2], is inferred from a photochemical steady state analysis of NO, NO2, and O3 concentrations. Preliminary analyses yield average daytime [RO2] of 250 ppt during September, leading to O3 production rates as high as 15 ppb/hr from 10am-12pm local time. A P(O3) of 9 ppb/hr using [RO2] (150 ppt on average) inferred from a PSSD analysis of measurements taken in the southeastern United States (Frost, et al., 1998). Ozone production efficiencies are defined as the number of O3 molecules produced per molecule of NOx converted to NOy and they represent the average chain length of the catalytic oxidation cycle. Ozone production efficiencies are obtained from the slope ∆O3/∆(NOy - NOx) of the linear regression between O3 and NOy – NOx
concentrations. Limiting the analysis to data during daylight hours (10am-4pm local time) yields a mean ozone production efficiency for Blodgett Forrest of 13.0 O3 mol/(NOy - NOx) mol and a background O3 concentration of 29.5 ppb for the period of September 21 - October 8, 1998. The ozone production efficiency for Blodgett Forest is approximately twice the typical value for urban areas. The local production rate and ozone production efficiency are enhanced relative to those values determined for many rural areas (e.g. Cantrell, et al., 1997) and urban areas (e.g. Trainer, et al., 1995), respectively. Their enhancement is thought to be driven by the presence of large amounts of highly reactive biogenic hydrocarbons such as isoprene.

Blodgett Forest Symposium, February 26, 27, 28, 1999 - page 58
Title: Crown architecture and light-use efficiency of planted giant sequoia (Sequoiadendron giganteum) Authors: Cameron Walker, John Battles, and Robert Heald Address of Lead Author: University of California, Berkeley Department of Environmental Science, Policy and Management 151 Hilgard Hall Berkeley, CA 94720-3110 Abstract: As a shade-intolerant, long-lived and extraordinary massive tree species, giant sequoia must meet a daunting ecological challenge --maintaining a positive carbon balance with only a small fraction of its biomass allocated to leaf tissue. To gain some insight into how giant sequoia meets this challenge, we examined the relationship between growth, crown architecture, and leaf area for young sequoia trees planted a different densities at the Blodgett Forest Research Station. Absolute annual stem volume increment (AVI) for the 1998 growing season significantly increased as a function of planting density. Trees planted at lower density grew more. However there was no significant relationship between relative growth rate and planting density. For widely-spaced individuals (14' and greater), the average canopy volume increased during the 1998 growing season but canopy volume decreased in 1998 for more closely-spaced trees. After a decade of growth, light measurements indicated that trees planted at spacings of 14' and wider did not encounter any competition for light while trees at 7' and 10' spacings received only 20% of available light due to neighbor shading. This basic difference in the light environment may explain the changes in canopy volume. To avoid confusing neighborhood competition with the allocation responses of individual trees, we separated our analyses of light use efficiency. For trees not competing with neighbors for light (14', 18' and 20' spacings), there were no differences in foliage density (canopy volume/leaf area) or light use efficiency (AVI/total leaf area). In contrast, the trees at 10' spacing had more densely packed foliage and greater light use efficiencies than trees at 7' spacing. These results suggest that in crowded stands, below ground resources may be more limiting to giant sequoia growth than light.

Blodgett Forest Symposium, February 26, 27, 28, 1999 - page 59
Title: Nitrogen dioxide measurement by Laser Induced Fluorescence: Implementation in 1998 and potential for eddy-correlation flux measurements in 1999. Authors: Paul Wooldridge, Joel Thornton, and Ron Cohen Address of Lead Author: University of California Department of Chemistry / Cohen Group Berkeley, CA 94720 [email protected] Abstract: Outside of urban areas, NO2 concentrations are typically too small (1-1000ppt) to accurately measure with conventional instrumentation. Conventional instrumentation is also inadequate for measuring the rate of NO2 deposition using eddy-covariance methods because it lacks the ability for rapid, sensitive and specific detection. We describe the development of a laser induced fluorescence instrument capable of autonomous, continuous measurements of NO2. NO2 is measured directly by collecting fluorescent photons following laser excitation of a feature in the NO2 spectrum near 585 nm. The laser is tuned on and off this line to discriminate against other sources of signal, thereby avoiding chemical interferences associated with other approaches to NO2 measurement. The instrument was deployed at Blodgett Forest in the summer/fall of 1998. A detection limit of 50 pptv for 20 seconds averaging (S/N=2) was achieved in the field. We have demonstrated a factor of 5 better sensitivity in the lab, and implementing these and other improvements to the field instrument should increase the sensitivity by an order of magnitude prior to deployment in the summer of 1999. Details of the instrument and prospects for measuring NO2 fluxes at Blodgett using the eddy-covariance technique will be discussed.

Blodgett Forest Symposium, February 26, 27, 28, 1999 - page 60
Title: How much CO2 was emitted from the stems in a young ponderosa pine plantation? Authors: Ming Xu Address of Lead Author: University of California at Berkeley Ecosystem Dynamics and Management Department of Environmental Science, Policy & Management 207 Giannini Hall #3310 Berkeley, CA 94720-3310 phone: 510.643.3263 (o) Fax: 510.643.5438 Abstract: This paper characterized the bole respiration in a young ponderosa pine plantation in Blodgett Forest. We used LI-6400 system to measure bole respiration from June to December 1998. We found that bole respiration, both by area and by volume, was significantly different between individual trees (P<0.05). No significant difference was detected between north and south side of the trunk (P>0.05). However, we found a significant vertical gradient along the trunk for bole respiration. In general, the higher the position on the trunk the lower the respiration rate based on per unit surface area of the trunk. But the respiration rate by volume was in an inverse order. The diurnal pattern of bole respiration was similar among individual trees though the respiration rates for some trees were consistently higher than for some others. Bole respiration began to increase in early morning from 7:00 to 8:00 h (local standard time), reached its peak value in late afternoon from 16:00 to 17:00 h, and then gradually declined to nigh-time level. Bole respiration, measured around 16:00 h, decreased from about 10 µmolm-2s-1 during the growing season to about 1.3 µmolm-2s-1 in dormant season. In growing season the CO2 efflux was about 15.1 kgha-1day-1.